Article

Fermented Brewers’ Spent Grain Containing Dextran and Oligosaccharides as Ingredient for Composite Wheat Bread and Its Impact on Gut Metabolome In Vitro

1
Department of Food and Nutrition, University of Helsinki, P.O. Box 66 (Agnes Sjöbergin Katu 2), 00014 Helsinki, Finland
2
Faculty of Science and Technology, Libera Universitá di Bolzano, 39100 Bolzano, Italy
3
Department of Environmental Biology, “Sapienza” University of Rome, 00185 Rome, Italy
4
Department of Soil, Plant and Food Science, University of Bari “Aldo Moro”, 70126 Bari, Italy
5
Faculty of Agriculture and Forestry, Helsinki Institute of Sustainability Science (HELSUS), University of Helsinki, 00014 Helsinki, Finland
*
Author to whom correspondence should be addressed.
Fermentation 2022, 8(10), 487; https://doi.org/10.3390/fermentation8100487
Submission received: 30 August 2022 / Revised: 20 September 2022 / Accepted: 21 September 2022 / Published: 27 September 2022
(This article belongs to the Special Issue Food Fermentation for Better Nutrition, Health and Sustainability)

Abstract

:
Brewers’ spent grain or BSG is a fiber and protein rich food-grade side stream that has remained underutilized due to its poor technological and sensory characteristics. In this study, BSG was fermented with Weissella confusa A16 in presence of sucrose to induce the synthesis of dextran and maltosyl-isomaltooligosaccharides. Fermented BSG with or without the above polysaccharides was used as ingredient in wheat bread. Digestion of BSG breads was simulated in vitro with Simulator of Human Intestinal Microbial Ecosystem, and levels of fecal metabolites were analyzed. Enrichment of BSG breads with in situ dextran and maltosyl-isomaltooligosaccharides improved the baking quality compared to native BSG. Metabolism of free amino acids and synthesis of short chain fatty acids varied at different stages and parts of colon. The increase in butyric acid was similar in both the proximal and distal colon. In situ dextran and maltosyl-isomaltooligosaccharides, and higher content of proteins and fiber in BSG breads had a positive influence towards gut microbiota functionality. Along with several essential amino acids, an increase in amount of γ-aminobutyric acid was also observed after simulated digestion. BSG breads had a significant effect on the gut metabolome during in vitro digestion, showing increased production of microbial metabolites with potential health benefits.

Graphical Abstract

1. Introduction

Underutilized fiber-rich by-products originating from plant sources are becoming increasingly studied as food ingredients due to their important contribution to the circular economy and sustainable development goals. These by-products usually contain a high amount of nutrients and are typically generated as consequence of good manufacturing practices. Brewers’ spent grain (BSG) is a by-product originating from beer production and it is an example of the underutilized food side-streams available in tons globally (ca. 39 million tons). BSG is a lignocellulosic material rich in dietary fibers [1] and protein that has been largely neglected by the food industry due to the multiple challenges that it poses as food ingredient. However, in the recent past, BSG reintegration into the food chain has been increasingly studied and BSG has been converted into flakes, flour, pasta and cookies [2,3,4]. BSG has been treated following different technological approaches, including bioprocessing and fermentation technology [3]. Fermentation with lactic acid bacteria (LAB) has improved the textural and nutritional properties of BSG, enhancing its performance in food applications [3,5,6]. When used as ingredient in bread, fermented BSG enhanced the antioxidant capacity (in vitro), sensory attributes and technological properties [5].
Previously, we showed that Weissella confusa A16 can synthesize significant amount of dextran in several grains, including BSG, along with maltosyl-isomaltooligosaccharides (MIMO) up to degree of polymerization (DP) 6 [7,8,9]. Prebiotic polysaccharides can resist human gastric enzymes and low pH during enzymatic digestion in the stomach and small intestine, finally reaching the colon to be metabolized by microbial fermentation [10]. Among these, dextran and oligosaccharides produced commercially have been successfully used as food ingredients [11,12].
The human gut microbiota plays a vital role in the breakdown and digestion of indigestible carbohydrates, synthesizing short-chain fatty acids (SCFA), methane or different gases (esp. carbon dioxide) as the final product. Metabolites produced during microbial fermentation and SCFA such as acetate, propionate and butyrate can regulate overall metabolism and affect the whole human body by acting as signaling molecules [13,14]. Production of SCFAs directly stimulates the growth of beneficial gut bacteria and maintains low production of toxic compounds such as ammonia. Specifically, increase in the production of butyrate is considered very beneficial for cellular metabolism and proliferation, improvement in barrier functions, immune regulation and endocrine functionality [15,16]. In vitro digestion of soluble fiber (or arabinoxylan) extracted from BSG has been shown to increase short chain fatty acids, especially acetate and propionate [17], thus making BSG a possible ingredient for fiber rich food applications.
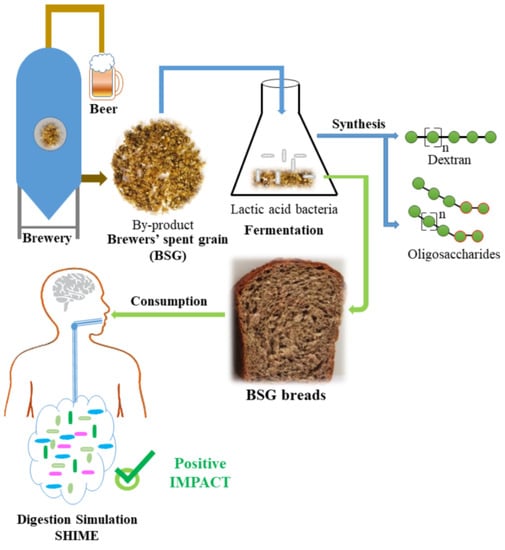
In this study we investigated the impact of composite bread containing fermented BSG with in situ produced dextran and oligosaccharides on the gut metabolome through the Simulator of Human Intestinal Microbial Ecosystem (SHIME) in vitro. Previously, bread enriched with galactooligosaccharides (DP2 to DP5) stimulated the growth of lactobacilli and bifodobacteria in vitro, and increased butyrate production [18]. The role of dextran in bread baking has been explained before, but its impact as bread ingredient on gut microbiota has not been elucidated yet. Due to its hydrocolloid behavior, dextran improves the water absorption capacity and gas retention, leading to higher volume, moister crumb and reduced staling rate; furthermore, it has shown the ability to mask bitter tasting compounds present in whole grains [8]. Fermentation with dextran producing LAB has proven a successful way to incorporate fiber-rich raw material in wheat bread baking, to obtain composite wheat bread with improved technological and sensory properties [9,19].
The effect of wheat sourdough breads on gut microbiota functionality was recently assessed with the Twin Mucosal-SHIME [20]. Feeding with sourdough bread did not significantly alter the genus core microbiota but it enhanced its metabolic activity, leading to an increase of SCFA, isovaleric and 2-methylbutyric acid as well as some free amino acids (FAA) content at the colon level compared to common wheat bread [20].
In this research, we compared wheat bread containing BSG fermented by W. confusa A16 as such or enriched with dextran and oligosaccharides synthetized in situ during the fermentation process. This comparison is possible due to the activation of the dextransucrase via the addition of sucrose to the BSG. Dextran, mono- and oligo-saccharides composition of the fermented BSG was analyzed and bread properties have been assessed. Finally, the potential of the two types of bread on the metabolic end products (SCFA and FAA) was investigated through the SHIME.

2. Materials and Methods

2.1. Microorganism and Growth Conditions

Weissella confusa A16 previously isolated from yellow pearl millet [9] was available at the Department of Food and Nutrition at the University of Helsinki, Finland. The strain was stored at −80 °C in 20% glycerol and routinely cultivated in MRS broth (NEOGEN, Ayr, UK) at 30 °C for 24 h when used for fermentations.

2.2. Raw Materials

Brewers’ spent grain (BSG) used for this study was provided by Dugges Bryggeri (Dugges Bryggeri AB, Landvetter, Sweden). BSG was collected immediately after its generation and stored at −20 °C before use. Prior to fermentation and baking, BSG was thawed at room temperature and subjected to wet milling (Microcut MC15, K04 blade, Stephan Machinery GmbH, Hameln, Germany). Milling was performed twice for a finer BSG paste. Milled BSG had 80.5% moisture and 19.5% dry matter (AACC method 44−15.02). Dried BSG had composition of 9.9% fat, 23.4% protein and 47.9% total dietary fiber. Granulated sugar (Suomen sokeri Oy, Kantvik, Finland) was used to induce the synthesis of dextran during fermentations and for baking. Wheat flour (moisture 10.2%, Halvgrovt Vetemjol, Helsinki Mylly Oy, Vaasa, Finland), fat (Juokseva rypsiölyivalmiste, Bunge Finland Oy, Raisio, Finland), fresh yeast (Lahti, Finland) and salt were used for bread making.

2.3. Brewers’ Spent Grain Fermentation

Before fermentation, the LAB strain was cultivated in MRS broth for 24 h. Bacterial cells were harvested, cells were centrifuged (10,000 rpm for 10 min at room temperature) and washed once with 1× PBS (pH 7.4). Cell pellets were re-suspended in 250–500 µL Milli-Q water and used for the inoculation of BSG, targeting an initial cell density of 6.0 Log cfu/g. Since BSG was used as wet material, no extra water was added for the fermentation, and only the water contained initially in BSG was accounted for. To enable dextran synthesis, 10% w/w of BSG was substituted with sucrose (EPS+BSG) or BSG was used without any addition (EPS-BSG). Controls without microbial inoculum were prepared in the same way. Fermentations were performed at 25 °C for 24 h in batches of 500 g.

2.4. Bacterial Enumeration, pH and Total Titratable Acidity (TTA)

For microbial enumeration, 10 g of BSG was homogenized with 90 mL of sterile 0.9% (w/v) sodium chloride solution using a stomacher (Colworth, UK), and serially diluted suspensions were plated accordingly. Microbial growth was monitored on the native BSG, and on BSG before and after 24 h of fermentation. Presumptive LAB, total mesophilic bacteria (TMB), Enterobacteriaceae, Bacillus cereus, and yeasts and molds were cultivated as explained previously [7].
The pH of fermented BSG was measured using an online pH meter (Knick, Berlin, Germany). TTA was determined using the manual titrator (Mettler Toledo DL53, Uster, Switzerland) and with a modified AACC method 02–31.01, as explained previously [7]. TTA was expressed as the amount (mL) of 0.1 N NaOH used during titration up to pH 8.5.

2.5. Quantification of Dextran and Oligosaccharides from Fermented BSG

The amount of dextran synthesized after BSG fermentation was analyzed by an enzyme-assisted method as previously described by [21] using a mixture of two enzymes, dextranase (Sigma-Aldrich, Søborg, Denmark) and α-glucosidase (Megazyme, Ireland). Samples were analyzed in high-performance anion exchange chromatography with pulsed amperometric detection (HPAEC-PAD) system fitted with a CarboPac PA-1 (4 × 250 mm) column (Dionex Corporation, Sunnyvale, CA, USA) and Waters 2465 pulsed amperometric detector (Waters, Milford, MA, USA). The gradient elution method was used with flow rate of 1 mL/min for 60 min with two solvents, water (S-A) and 200 mM NaOH (S-B). The gradient run was 60 min, starting with 99% S-B and 1% S-A for 4 min, 70% S-B and 30% S-A until 30 min, 100% S-A until 38 min, remain stable at 100% S-A until 48 min, 99% S-B and 1% S-A until 50 min and remain stable at 99% S-B and 1% S-A until 60 min. D-glucose (Merck, Darmstadt, Germany) was used to prepare the standard series for quantification, 2-Deoxy-D-galactose was used as the internal standard and the amount of dextran was calculated as the sum of anhydro-glucose using a corrector factor of 0.90. Samples for dextran quantification were prepared using 100 mg of freeze-dried and powdered fermented BSG in 4 tubes, one tube for glucose background correction and the others for quantification of glucose after hydrolysis. Samples were washed with 50% (v/v) ethanol by boiling and centrifuging. Washed samples were resuspended in sodium citrate buffer (pH 5.5). Samples were than hydrolyzed with transglucosidase for background correction and transglucosidase and dextranase for quantification of released glucose. Hydrolysis was performed at 30 °C for 48 h with shaking, and enzymes were deactivated by boiling in a water bath for 10 min. Supernatants were collected and filtered through Amicon® Ultra Centrifugal Filters 0.5 mL 10 K (Merck Millipore Ltd., Dublin, Ireland) before injection.
The total amount of malto-oligosaccharides (MO) and malto-oligosaccharides equivalent (MOE) maltosyl-isomaltooligosaccharides (MIMO) were determined from fermented BSG using HPAEC-PAD method. HPAEC-PAD system was fitted with a CarboPac PA-100 (4 × 250 mm) column (Dionex Corporation, Sunnyvale, CA, USA) and a Waters 2465 pulsed amperometric detector (Waters, Milford, MA, USA). Gradient elution was applied with solvents 100 mM NaOH with 1M NaOAc (S-A) and 100 mM NaOH (S-B) with a flow rate of 1 mL/min. The applied gradient run was 50 min, starting with 100% S-B for 15 min, 12% S-A and 88% S-B until 35 min, remain stable at 12% S-A and 88% S-B until 40 min, 100% S-B until 45 min and remain stable at 100% S-B until 50 min. For quantification, several oligosaccharide standards ranging from DP3 to DP7 were used as a reference according to their different HPAEC-PAD detector responses. The oligosaccharide standard was composed of panose, maltotriose (DP3), maltotetraose (DP4), maltopentaose (DP5), maltohexaose (DP6) and maltoheptaose (DP7) (Megazyme, Wicklow, Ireland). Xylotriose was used as an internal standard. As our main objective was to quantify total oligosaccharides, for MIMO quantification, peaks closest to the peaks of reference MO standards were used. MIMO peaks with retention time between 27.5 and 29.5, 29.5 and 32, 32 and 35.5, 35.5 and 38, 38 and 41 and 41 and 44 min were quantified using peaks of panose, maltotriose, maltotetraose, maltopentaose, maltohexaose and maltoheptaose, respectively (Figure 1).
For sample preparation, 500 mg of freeze-dried fermented and unfermented BSG were homogenized in 20 mL of ice-cold milli-Q water and kept in a shaker at +4 °C for 30 min. The homogenized BSG was then centrifuged at full speed (at +4 °C) for 10 min and the supernatant was kept in the cold throughout the process. Then, 500 µL of the supernatants were filtered through Amicon® Ultra Centrifugal Filters 0.5 mL 10 K (Merck Millipore Ltd., Dublin, Ireland) to remove molecules larger than 10 kDa. Finally, the filtrate was transferred into the HPAEC-PAD vial, internal standard was added and used for the quantification.

2.6. Organic Acids and Sugars Analysis of Fermented BSG

Amount of lactic and acetic acid was determined from fermented BSG using a high-performance liquid chromatography (HPLC) system as previously explained by [22]. A Waters high performance liquid chromatography system was fitted with an Aminex HPX-87H column (300 × 7.8 mm; Bio-Rad, Hercules, CA, USA) and Waters 2487 Dual λ Absorbance Detector 35 (operating at 210 nm). The isocratic run was performed with sulfuric acid (10 mM) as the eluent at a flow rate of 0.6 mL/min for 25 min. The organic acid standard was composed of lactic acid (Sigma-Aldrich) and acetic acid (Merck) at various concentrations. For sample preparation, 1 g of fermented BSG was homogenized in Milli-Q water in a falcon tube using a vortex shaker for 5 min. The homogenized sample was centrifuged at full speed (at +4 °C) for 10 min. The supernatant was filtered through Acrodisc® Syringe Filters with PTFE Membrane 0.45 µm.
Glucose, fructose, sucrose and maltose were quantified from fermented BSG using an Ultra Performance Liquid Chromatography (UPLC) system as explained by [7]. Waters™ Acquity Ultra-High Performance Liquid Chromatography system was fitted with an ACQUITY BEH Amide 1.7 μm (2.1 × 100 mm) column and Acquity evaporative light scattering detector. The gradient elution method was applied to separate different carbohydrates using mobile phase A (0.2% triethylamine in Acetonitrile) and mobile phase B (0.2% triethylamine in MQ water) at flow rate 0.15 mL/min and at 35 °C column temperature. The applied gradient run was of 25 min starting with 85% of mobile phase A and 15% of B for 1 min, 75% A and 25% B until 10 min, 55% A and 45% B until 16 min, and 85% A and 15% B until 25 min. Glucose, sucrose, fructose and maltose (MERCK, Darmstadt, Germany) were used as standards and 2-Deoxy-D-galactose was used as the internal standard. For sample preparation, 500 mg of freeze-dried fermented and unfermented BSG was homogenized in 5 mL milli-Q water in a 15 mL falcon tube. The tube was then kept in a boiling water bath for 5 min, then centrifuged at full speed (at +4 °C) for 10 min. The supernatant was filtered through Amicon® Ultra Centrifugal Filters 0.5 mL 10 K (Merck Millipore Ltd., Dublin, Ireland). Finally, the filtrate was transferred into the UHPLC vials, internal standard was added and used for the quantification.

2.7. BSG Bread Baking Procedure, Volume and Texture Analysis of Breads

Bread recipes for wheat control bread (WB), native BSG bread (BB), EPS negative BSG bread (EPS-BB) and EPS positive BSG bread (EPS+BB) are reported in Table 1. Initial moisture content of native BSG was taken into account to reach the same amount of water in each dough. For bread preparation, all ingredients were mixed in a DIOSNA mixer bowl (Dierks & Söhne GmbH, Osnabrück, Germany) for 3 min at low speed and 4 min at fast speed, adjusting water temperature in order to reach a final dough temperature of 26 ± 1 °C. Dough was rested for 15 min in fermentation cabinet (Lillnord, Odder, Denmark) at 35 °C and 75% relative humidity, then it was divided into 250 g pieces, molded manually and proofed in pans for 45 min (at 35 °C and 75% relative humidity). Baking was performed in a rotating convection oven (Sveba Dahlen, Fristad, Sweden) at 200 °C for 15 min with 15 s steaming at the beginning; afterwards breads were depanned and cooled at room temperature for 1 h before storage in plastic bags.
Specific volume was determined after 1 day of storage at room temperature using a VolScan Profiler (Stable Micro Systems, Godalming, UK). Specific volume was calculated by dividing the loaf volume (mL) by the weight (g). Texture profile analysis (TPA) was performed on days 1 and 4, and bread parameters (hardness, springiness, cohesiveness, chewiness, resilience; see Supplementary Table S1) were determined as previously described [23]. For SHIME®, independent baking trials were performed in two different days and six loaves were prepared for each type of bread.

2.8. Determination of pH, TTA, Sugars and Free Amino Acids of Breads

To determine the acidity of breadcrumbs, crust was removed from bread slices and 10 g of crumb was homogenized with 95 mL Milli-Q water for 1 min using a Bamix blender, then 5 mL of acetone was added before starting the titration. Measurements were performed using an automatic titrator (Easy PlusTM, Mettler Toledo, Columbus, OH, USA): TTA was expressed as the volume of 0.1 N NaOH used (mL) during titration up to pH 8.5.
Water/salt-soluble extracts (WSE) of freeze-dried BB, EPS-BB and EPS+BB breads were obtained according to [24] and used to analyze sugars and FAA. The amount of fructose and glucose was measured using the D-Fructose-D-Glucose Assay Kit K-FRUGL (Megazyme International Ireland Limited, Bray, Ireland), whereas maltose and sucrose were measured using the Maltose-Sucrose-D-Glucose Assay Kit K-MASUG (Megazyme International Ireland Limited, Bray, Ireland), following the manufacturer’s instructions. Quantification of sugars was performed using a spectrophotometer set at 340 nM following the instructions given by manufacturer. The concentration of FAA was determined by a Biochrom 30+ series Amino Acid Analyzer (Biochrom Ltd., Cambridge Science Park, Cambridge, UK), equipped with a Li-cation-exchange column (4.6 × 200 mm internal diameter). Amino acids were post-column derivatized with ninhydrin reagent and detected by absorbance at 440 (proline and hydroxyproline) or 570 nm (all the other amino acids), as described by [25].

2.9. In Vitro Bread Digestion

EPS+BB and EPS-BB were pre-digested separately according to the consensus protocol developed within a large European framework (COST Action InfoGest) [26] with some improvements [27]. In summary, the steps for the pre-digestion comprised oral, gastric and small intestinal phases. Breads were ground and diluted 1:2 (dry, w/w) with a simulated salivary fluid (SSF, pH 7) solution (KCl, 15.10 mM; KH2PO4, 3.70 mM; NaHCO3, 13.60 mM; MgCl2(H2O)2, 0.15 mM; (NH4)2CO3, 0.06 mM). To the mixture, 0.75 mL of amylase solution was added (1500 U/mL of SSF) and CaCl2 0.30 M solution (41.98 μL). The final product was mixed for 2 min at 37 °C. Then, the oral bolus was diluted with a mixture mimicking the gastric content. The stomach phase incubation started by adding 82.02 mL of gastric juice (0.04 M KCl and 0.24 M NaCl). To the mixture, 6.07 mL of 2% pepsin solution (≥400 U/mg) and 0.68 mL of lecithin solution (0.17 mM) were then added. The incubation lasted for 2 h at 37 °C, with a pH gradient from 5.5 to 2.0 using the SHIME software (TwinShime v2, version 4.0.43, Prodigest, Gent, Belgium). Finally, the gastric chyme (140.00 mL) was added with 50.00 mL of simulated pancreatic juice containing NaHCO3 (0.19 M) and 8.00 g/L of Oxgall (Difco™ Oxgall, BD, Franklin Lakes, NJ, USA), 4.50 mL of trypsin solution (50.00 mg of trypsin 5000 USP-U/mg in 5.00 mL of 1.00 mM HCl), 5.60 mL of chymotrypsin (100.00 mg chymotrypsin ≥ 1000 USP-U/mg in 10.00 mL of 1.00 mM HCl), 180.00 mg of lipase (type II, 100–500 U/mg) and 300.00 mg of hog α-amylase (50 U/mg) and 350.00 mL of 0.30 M CaCl2. The entire mixture (200.00 mL) was incubated for a further 3 h at 37 °C under static dialysis, with a membrane of 14 kDa in 400 mL of dialysis solution (0.04 M NaHCO3, pH 7). The pre-digested suspension was used as treatment for the SHIME.

2.10. Simulator of Human Intestinal Microbial Ecosystem (SHIME®) Set up and Experiment

The experimental setup consisted of two SHIME units in parallel, each one including three double-jacketed vessels maintained at 37 °C under anaerobic conditions, simulating the stomach and small intestine (ST/SI), proximal colon (PC) and distal colon (DC), respectively [28,29]. PC and DC vessels were inoculated with the same fecal sample from a representative fecal donor that was selected from a cohort of volunteers adhering to the Mediterranean Diet as described by [20]. An initial cohort of 61 healthy volunteers (age between 19 and 50 years) were recruited. Preliminary nutritional questionnaires were administrated to assess the Mediterranean Diet Score (MDS). Main food component and typical habits (8 indicators) of MS contributed to the MDS which ranged from 0 (low adherence) to 8 (high adherence). The cut off 4 was used to assess a satisfactory MDS. Forty recruited volunteers presented a high adherence to MD with an average of MDS of ±5. Fecal samples (10 g to 50 g per person) from these subjects were collected and analyzed for their microbiota composition and SCFAs content. The selection of the donor was based on the clustering of fecal microbiota abundances of the 40 recruited individuals, aggregated at family level, together with SCFA data. Clustering was performed with the Manhattan distance matrix and ward.D2 method. Partial least-squares discriminant analysis (PLS-DA) was performed considering the adherence to MD as an independent variable and OTU abundances as feature for the model. Contribution of each feature was further explored and annotated with the explanatory independent variable level. All statistical analyses were performed in R programming version 4.04 (R Foundation, Vienna, Austria).
The colonic microbiota was allowed time for stabilization (2 weeks) and further steady state (2 weeks). During these 4 weeks, each colon bioreactor was supplied, three times per day (every 8 h), with 200 mL of pre-digested adult SHIME® feed PDNM001B (ProDigest, Ghent, Belgium). Pre-digestion consisted of a 45 min incubation in the ST/SI vessels with the addition of 60 mL of pancreatic juice (12.5 g NaHCO3, 6 g dehydrated bile extract and 0.9 g pancreatin per liter). Then, a treatment phase (1 week) followed, in which the feeding of colon bioreactors was supplemented with 100 g/day (33.3 g, three times per day) of digested EPS+BB or EPS-BB. After the treatment phase, 1 week of wash out was carried out, with the same feeding conditions adopted in the first four weeks of run. Before and after bread feeding period and after washing out period, lumen samples (20 mL) were collected from each colon bioreactor of both SHIME® units. Lumen samples were stored at −80 °C until the analyses. Figure 2 describes the experimental design.

2.11. Metabolic Activity Analysis

Metabolic profile of SCFA (acetate, propionate and butyrate) and total FAA were evaluated on lumen samples. Samples were extracted and injected into an Agilent 7890A gas chromatograph coupled to an Agilent 5975 quadrupole mass detector (Agilent Technologies Italia SpA, Cernusco sul Naviglio, Milano, Italy). A fused silica Stabilwax-DA column (30 m × 0.25 mm i.d. 0.25 mm) (Restek Corporation, Bellefonte, PA, USA) was used for the chromatographic separation. The MS detection operated on full-scan mode (EI at 70 eV, ion source temperature at 250 °C, m/z values ranged from 40 to 300 Da and acquisition scan time was 0.2 s) [30]. The identification of the acetic, propionic and butyric acids was achieved by comparing their mass spectra with those stored in the National Institute of Standards and Technology (NIST) US Government library. All amino acids were analyzed by a Biochrom 30+ series Amino Acid Analyzer as in 2.8. All analyses were performed in triplicate.

2.12. Statistical Analysis

All statistical analyses were performed using R software (version 4.0.3, R Foundation, Vienna, Austria). Comparisons between paired groups were performed using the Student’s t-test when the data followed the normal distribution. One-way ANOVA and individual post hoc comparisons with the Tukey–Kramer were adopted to highlight statistically significant differences between different SHIME® sampling points when the data followed the normal distribution. The level of significance adopted for all hypothesis tests was 5%. Pearson’s rank correlation matrix and p values corrected by False Discovery Rate Correction (FDR) were generated by cor.test and visualized by corrplot package [31].
The linear relationship was used to determine significantly (p < 0.05) correlation between breads variables and microbial metabolites. Pearson correlation among initial content of carbohydrates (fiber, dextran, MO, MIMO (MOE), glucose, fructose, sucrose, maltose, total carbohydrates), protein, fat, lactic and acetic acids, pH and TTA values, SCFA and individual FAAs profile was performed.

3. Results

3.1. Microbial Growth, pH, TTA and Organic Acids of Fermented BSG

Before inoculum, LAB were not found at the dilutions considered (hence < 2 Log cfu/g). After starter inoculum, the growth pattern of presumptive LAB was the same in both BSG fermented by W. confusa A16 with (EPS+) and without sucrose (EPS-). The growth was observed from ca. 6.4, corresponding to the initial targeted inoculum, to 9.4–9.8 Log cfu/g after 24 h of fermentation in EPS+ and EPS- fermented BSG, respectively. TMB followed a similar growth pattern from ca. 6.6 to 10.0 Log cfu/g after 24 h fermentation. Enterobacteriaceae, Bacillus cereus, yeasts and molds were not detected at the dilutions considered (<3 Log cfu/g) in any unfermented and fermented BSG sample. The initial pH of EPS- and EPS+BSG was 5.9. pH dropped similarly in 24 h fermented EPS+BSG (4.3) and EPS-BSG (4.6) (Table 2). TTA values were similar for both EPS- and EPS+ before and after fermentation, starting from ca. 2.0 mL NaOH and reaching ca. 7.1 mL NaOH after 24 h fermentation. Lactic and acetic acid were not detected before the fermentation. The amount of lactic acid was significantly higher in 24 h fermented EPS+BSG (398.9 mg/100 g) than in EPS-BSG (246.2 mg/100 g) while no significant difference was observed in the amount of acetic acid in EPS+BSG (91.8 ± 1.9 mg/100 g) and EPS-BSG (106.4 ± 6.9 mg/100 g) (Table 2).

3.2. Sugar, Oligosaccharides and Dextran Analysis of Fermented BSG

Fructose (0.5% d.w.), glucose (0.4%) and maltose (2.3%) were quantified from native BSG. After fermentation, the amount of fructose (% d.w.) and glucose (% d.w.) in EPS- BSG was similar to native BSG, while it had a slightly lower amount of maltose (% d.w.). In fermented EPS+BSG, no sucrose and glucose were detected. Fructose increased significantly up to 21 g, while 50% of maltose was consumed during the fermentation, reaching 1.1 g (Table 3).
Like for native BSG, after 24 h fermentation with W. confusa A16, no increase in viscosity and no dextran were detected in EPS-BSG. In EPS+BSG fermentation, a significant increase in viscosity was observed visually when compared to EPS-BSG samples. The increase in viscosity after fermentation corresponded to the synthesis of dextran in EPS+BSG. The dextran amount after 24 h was 7.2% (d.w.) (Table 4), corresponding to ca. 40% of the theoretical possible value (18.11%) based on sucrose addition (i.e., 10 g sucrose in 90 g wet BSG or 17.6 g dry BSG). Control BSG samples (EPS+ and EPS-) without inoculum were also prepared and incubated at 25 °C for 24 h. In these samples, no viscosity change was observed and no dextran was formed (data not shown). The chromatograms of oligosaccharide profiles analysed with HPAEC-PAD from the BSG samples is presented in Figure 1. MO (DP3-DP7), used as a reference for quantification, were present in all analysed samples. In case of EPS-BSG fermentation, without added sucrose, MO were synthesized, unlike the synthesis of MIMO after fermentation of EPS+BSG with added sucrose. Overall, a significant increase (from 1.5 to 2.6% d.w. of fermented BSG) in production of MO was observed after fermentation (Table 4) of EPS-BSG. MIMO (MOE) production increased significantly, up to 9.9% d.w. of fermented BSG, when sucrose was added (EPS+). After the fermentation, there was a significant increase in the amount of MIMO (MOE) in EPS+BSG, unlike the decrease in the amount of MO in EPS-BSG.

3.3. Technological and Chemical Profile of Breads

The specific volume of the breads was highest in control WB (5.1 mL/g) and decreased when BSG was added to the bread. Among BSG breads, the specific volume was highest in EPS+BB (3.4 mL/g), while it was ca 3.0 mL/g in EPS-BB and BB. After the first day of storage at room temperature, hardness was significantly higher in BSG breads, reaching highest value for EPS-BB (ca. 590 g), while it was more moderate in EPS+BB (ca. 282 g). The same hardness pattern was also observed after 4 days. Hence, the staling rate (hardness increase in gram per day) was different for each type of breads, with the lowest values observed for WB and EPS+BB (34.3 and 53.9, respectively). Results are reported in detail in Supplementary Table S1.
The differences in the sugar concentration of breads reflected that of the spent grain. The sucrose added for dextran synthesis was completely utilized, compared to BB (60 mg/100 g) and EPS-BB (50 mg/100 g), EPS+BB (40 mg/100 g) had lower sucrose content, whereas a higher content of fructose and glucose, released from sucrose hydrolysis, were found in EPS+BB bread. The amount of maltose in breads containing fermented BSG was lower (ca. 2.4 mg/100 g d.w) when compared to native BSG (BB) bread (3.2 mg/100 g d.w.) (Table 5).
Regarding the breads’ acidity, BSG bread containing fermented BSG (EPS+ and EPS-) had lower pH than (ca. 5) WB and BB (ca. 6). Consequently, TTA values of the bread were higher in fermented BSG bread (EPS-BB and EPS+BB; ca. 5 mL of NaOH) than in WB and native BSG bread (ca. 3 mL of NaOH).
Although FAA profiles were similar among breads, with glutamic acid (Glu), valine (Val), glycine (Gly), cysteine (Cys) and aspartic acid (Asp) being the most abundant, the total FAA content of BB was significantly (p < 0.05) higher than that of breads containing fermented BSG. A slightly but significantly higher content of FAA was also observed in EPS-BB, compared to EPS+BB bread (1.64 ± 0.02 and 1.53 ± 0.02 g/kg d.w., respectively). The concentration of all FAA in EPS+BB was lower than BB and EPS-BB breads, except for Asp and Val which were 153.00 ± 3.83 and 253.07 ± 4.82 mg/kg d.w. in the latter and 129.46 ± 4.52 and 240.05 ± 5.69 mg/kg d.w. and 117.60 ± 4.27 and 217.99 ± 5.37 mg/kg d.w. in the former (BB and EPS-BB, respectively).

3.4. SHIME® Lumen Microbial Metabolites

Based on the clustering analysis, we randomly selected a fecal donor representative of the main cluster of volunteers displaying high adherence to MD (MDS > 5). Gut microbiota composition of the selected donor are reported in Supplementary Table S2.
Results of SCFA and FAA analysis are reported in Table 6. Before treatment, no significant (p < 0.05) differences were observed between SHIME® units in both colon tracts (PC and DC), for all investigated SCFAs. This finding demonstrates that, before the start of treatment period, two SHIME® units harbored the same gut ecosystem. Overall, the consumption of different breads (EPS+BB and EPS-BB) had the potential to enhance the synthesis of all SCFAs at the colon level. The concentration of acetic acid and butyric acid showed a significant (p < 0.05) increase after treatment (1 week). Propionic acid concentration did not vary during the time before and after bread intake. Following 1 week of wash out, the content of SCFAs of all colon tracts trended to similar absolute values of those found before bread feeding.
After the treatment period, the PC tract fed with EPS+BB resulted in a significantly (p < 0.05) higher acetic acid concentration compared to that fed with EPS-BB. After the wash out period, the acetic acid concentration in both PC and DC tracts fed with EPS+BB was higher (p < 0.05) compared to that in PC and DC tracts fed with EPS-BB. Propionic acid was only significantly (p < 0.05) higher in the DC colon tract after washing out with EPS-BB compared to EPS+BB. Contrarily, butyric acid concentration showed a significant (p < 0.05) increase after treatment with EPS-BB in the PC colon tract and after washing out in the EPS+BB DC colon tract.
FAA concentration generally trended to an increase during the treatment period with both breads (EPS+BB and EPS-BB) in both colon tracts having a marked persistence after washing out in PC colon tract (Table 6). Asp, Thr, Ser, Ala, Val, Cys, Ile, Leu, Tyr, Phe and Pro were significantly (p < 0.05) higher after treatment with EPS+BB in the PC colon tract, while GABA, ammonia, Orn, Lys and Arg were higher after treatment with EPS-BB. The DC colon tracts showed slightly less statistical differences compared to PC tracts. Asp, Ala, Val, Ile, Leu, Tyr, Phe and Pro kept their significant (p < 0.05) also in the DC colon tract after treatment with EPS+BB, while Gly, Met, GABA, Trp turned out to be significantly (p < 0.05) higher, exclusively during EPS+BB treatment in the DC colon tract.

3.5. Correlation between Bread Variables and Microbial Metabolites

The use of Pearson correlation analysis showed n = 41 (Table S3) and n = 15 (Table S4) significant (p < 0.05) correlations between bread variables and colon metabolites when SHIME® was fed with EPS+BB and EPS-BB, respectively. Furthermore, non-zero correlations at 99% confidence level were found in PC-EPS+BB (n = 4), DC-EPS+BB (n = 1) and PC-EPS–BB (n = 2) tract. Specifically, 27 positive and 14 negative correlations were found within EPS+BB and SHIME microbial metabolites.
A range (80.5%) of significant (p < 0.05) correlations (r) (from −0.999 to 1) were found for the relationship between nutritional composition (fiber, dextran, MIMO, glucose, fructose, sucrose, maltose, total carbohydrates, protein and fat) of bread and metabolites produced when SHIME® was fed with EPS+BB. Within nutritional variables of EPS+BB, MIMO showed the highest number of significant (p < 0.05) correlation (n = 13). The concentration (mg/100 g d.w.) of MIMO (MOE) in EPS+BB (DP3-DP4, 183.32 ± 6.84; DP5 363.46 ± 20.69; DP6-DP7, 178.69 ± 4.29) showed a significant (p < 0.05) positive correlation with the release of free amino acids in DC-EPS+BB lumen (n = 8). The only negative significant (p < 0.05) correlation between EPS+BB MIMO and amino acids was found for Thr in both colon tracts (PC-EPS+ and DC-EPS+). The abundance of MIMO in EPS+BB is strongly positively related with the release of SCFAs from the colon microbial community. Specifically, a positive significant (p < 0.05) relationship was found between MIMO (MOE) of DP5 in EPS+BB and the release of butyric acid (r = 0.998). The release of GABA in the PC lumen seems to be strongly positively significant (p < 0.01) dependent by the presence of the fructose and fiber in EPS+BB. However, the dextran variable in bread EPS+BB seems to be negatively correlated with the production of GABA and total amino acids in SHIME® colon tracts (PC and DC, respectively). In PC, a strongly significant (p < 0.01) positive correlation was observed with fat in EPS+BB with two fecal amino acids (Pro and Lys), and a significant (p < 0.05) positive correlation was observed with seven fecal amino acids (Arg, Met, Orn, Ser, Ala, Ile and Phe); meanwhile no significant (p < 0.05) correlation was observed when digested in the DC.
The percentage of significant (p < 0.05) correlation from a nutritional source for EPS-BB was 60%. EPS-BB variables had significant (p < 0.05) influence only on the release of His, Tyr, Trp, Leu and Thr. A negative and significant (p < 0.05) relationship was also found between EPS-BB lactic acid content and propionic acid. The same negative correlation (p < 0.05) was found for lactic and acetic acids and SHIME® lumen amino acids. All correlations are graphically presented in Figure 3 and Figure 4.

4. Discussion

In this study, BSG containing dextran and oligosaccharides synthesized in situ during fermentation with W. confusa A16 was used as an ingredient in bread making, allowing for successful integration of fermented BSG into wheat bread.
Microbial growth during controlled fermentations of BSG with and without addition of sucrose had a similar pattern to that observed previously [7]. After 24 h of fermentation, BSG inoculated with W. confusa A16 showed an increase in presumptive LAB cell density of ca. three logarithmic cycles, while other microbial groups remained below the detection level from the beginning to the end of fermentation, indicating a good microbiological quality of the spent. Acidification during BSG fermentation was higher in this study (when fermentation was performed without addition of water) than that previously observed in [7], in which BSG sourdough was fermented with 60% water. The amount of lactic acid in EPS-BSG was lower than in EPS+BSG, while acetic acid content did not differ significantly between the two types of fermentations. BSG is a lignocellulosic material with high content of hemicellulose, cellulose and lignin, but a limited amount of fermentable sugars [32]. Firstly, available fermentable sugars are consumed at the beginning of the fermentation and different sugars, released during the endogenous and microbial enzymatic activities, are consumed at later stages of fermentation [32,33]. During EPS+BSG fermentation, fructose is released due to the action of dextransucrase enzyme on added sucrose [34]. W. confusa A16 lacks the capability to form mannitol from fructose, which is then retrieved in an amount close to the theoretical (i.e., 50% of the added sucrose) [35,36]. With no sucrose present in the environment, the starter utilized mainly maltose, while during fermentation, in presence of sucrose (or EPS+), the carbohydrate fermentation pattern changed, as previously observed when different BSG was fermented with the same strain with addition of water [7]. However, in the conditions of this study, where fermentation was performed without adding water, in the presence of sucrose, the strain consumed glucose completely and utilized ~50% of maltose, while only 10% of maltose was used with no added sucrose. The increased use of maltose also corresponds to the synthesis of a higher amount of MIMO (ca. four times more than in EPS-BSG fermentation), ranging from panose to malto-heptaose (DP7). Without sucrose in the fermenting environment, small MIMO (MOE) could have been utilized along with the free maltose for both the metabolism and synthesis of the higher amount of bigger oligosaccharides. Dextransucrases synthesize low molecular weight oligosaccharides beside dextran in the presence of sucrose and acceptor molecules like maltose, isomaltose and panose [37]. The presence of oligosaccharides with higher DP (but only up to DP6) was previously observed during fermentation of a different type of BSG with W. confusa A16 [7]. In this study, the increase in the type of oligosaccharides in EPS+BSG compared to EPS-BSG was analyzed. Malto-pentaose (DP5) was mostly found in native BSG, which might have been degraded during fermentation to simple sugars such as maltose, increasing the amount of acceptor sugars in the environment, leading to the increased synthesis of MO and MIMO [38].
A significant change in viscosity and the production of dextran were detected only after fermentation of BSG supplemented with sucrose. Based on added sucrose (36.2% of dry BSG), the theoretical limit for dextran production is 18.1% [34]. In these conditions, 7.2% dextran (d.w. or 1.4 g/100 g fermented BSG) was produced after fermentation of EPS+BSG for 24 h, which is 40% of the theoretical limit based on sucrose addition. This amount is similar to the amount reported earlier when fermenting different spent [7], highlighting the process reproducibility. Furthermore, the dextran produced was able to counteract the detrimental effects of BSG supplementation in wheat bread. In fact, the specific volume of EPS+BB was 13% higher when compared to BB and EPS-BB. Hardness decreased by 38% when compared to BB breads and up to 58% when compared to EPS-BB. The amount of maltose remained high in all breads and a high amount of fructose was found in EPS+BB due to the leftover from sucrose addition. Both essential and non-essential amino acid content was highest in BB followed by EPS-BB and EPS+BB, most probably due to limited proteolysis and thus, microbial consumption during fermentation.
In our experimental set-up, 100 g of bread was fed to the SHIME® per day (i.e., 33.3 g of bread, three times per day). Each 100 g bread slice of EPS-BB contained 0.16 g MO (DP3 to DP7), while EPS+BB contained 0.52 g of dextran, and 0.72 g MIMO (MOE, DP3 to DP7) produced after 24 h of fermentation. Prebiotic polysaccharides are metabolized during microbial fermentation inside a human gut producing SCFAs such as acetic, butyric and propionic acids as main end products, which could provide a positive effect on human gut health and could play a key role in mediating the metabolic effects on the host [39,40]. The prebiotic properties of dextran, oligodextran (DP1 to DP11+) and fructo-oligosaccharides have also been observed before [41]. Utilization of carbohydrates by gut microbiota was dependent on their respective molecular masses. In the presence of dextran and oligodextrans, an increased amount of butyric acid was already observed along with total SCFA production [41].
A significant increase in SCFA production along with an increase in beneficial commensal microorganisms was observed previously in an in vitro fermentation of malto-oligosaccharides (malto-triose, -tetraose and -pentaose) and galacto-oligosaccharides by human fecal microbiota [42]. At the concentration of 2% of malto-oligosaccharides in basal medium, the highest amount of SCFAs (acetic acid, propionic acid, butyric acid and valeric acid) were detected [42]. In a similar study, 100 g breads containing 3.3 g galactooligosaccharides were digested in vitro using a colon model system, the level of butyrate increased similarly along with the proliferation of beneficial commensal microbes (bifidobacteria and lactobacilli) after digestion [18]. Production of SCFAs varied in different colon compartments (proximal and distal) when fed with both BSG breads (EPS+BB and EPS-BB). When feeding EPS+BB with in situ dextran and MIMO, a positive correlation (even if not significant) of SCFA production with MIMO (MOE, DP3-DP4) and pH was observed when digestion occurred in the PC. Furthermore, a non-significant positive correlation was found between the release of SCFAs and the content of higher MO (M6-M7) and bread proteins when EPS-BB is digested in the PC. Fructose content, higher in EPS+BB compared to EPS-BB, had a moderate positive correlation (p > 0.05) with the production of SCFAs when EPS+BB was digested in the PC while there was a negative non-significant correlation when reaching the DC. The variable amount of SCFAs released in the PC and DC, could be due to the differences in commensal gut bacteria, as highlighted in recent studies [43,44,45].
Among the three SCFAs, the amount of acetic and butyric acids increased after feeding the bread. Generally, in a healthy human colon, the amount of acetic acid is always more than the amount of butyric and propionic acid combined. This phenomenon was clearly visible at every stage of our intervention [46,47]. The production of acetic acid is common to most of the gut bacteria metabolism, meanwhile butyric and propionic acid are specific to some bacterial species, such as Clostridium spp., Eubacterium spp. and Bacteroides spp. [48]. Acetate also acts as a precursor for the production of butyric acid, including various carbohydrates and amino acids through glycolysis, while propionic acid is produced through the succinate pathway using monosaccharides (especially hexose and pentose sugars) as precursors [47,49]. The butyric acid increase during feeding of EPS+BB and EPS-BB can be considered a positive effect of breads on gut microbiota. Higher production of butyrate tends to positively influence colonic-mucosal defense against inflammations and promote overall human health [15,45]. Butyric acid formation during feeding with both EPS+BB and EPS-BB seems to suggest an only minimal effect of in situ dextran and oligosaccharides. However, the higher content of MIMO (DP5) in EPS+BB compared with MO (DP5) in EPS-BB, showed a positive influence on the release of butyric acid from the microbial ecosystem that was harbored in the proximal colon. The similar increase in butyric acid in both colons could be due to other types of fibers and proteins present in both BSG breads. The increase in bifidobacteria, butyrate and acetate due to the high fiber content and arabinoxylan present in BSG was also observed in an earlier study [50]. The correlation pattern between BSG bread contents (fibers, polysaccharides and protein) and SHIME metabolites is visible in the correlation matrix. A recent study also disclosed evidence of the increase in butyric acid after ingesting barley rich in fiber [51]. The increased amount of butyric acid directly correlated with the pH variation in the proximal and distal colons; this variation in pH has also been found to promote the production of butyrate in the proximal colon [15,52]. BSG breads have not only influenced the production of SCFAs during microbial fermentation, but also influenced metabolism of FAA. Ingested proteins usually end up in the large intestine and they are metabolized by colonocytes releasing FAAs and different types of organic compounds such as peptides. Depending on the amount and type, ca. 10% of the ingested protein reaches the large intestine and undergoes proteolysis by colonic microbiota, generating peptides and FAAs [53].
Overall, when the SHIME® system was fed with breads containing fermented BSG, an accumulation of ammonia, Glu, Ala, and Phe was observed in the PC. In particular, the EPS+BB rather than EPS-BB bread feeding led to higher FAA bio-accessibility, despite the lower input in FAAs provided by the same amount of bread ingested. Nevertheless, FAA profiles did not correspond to those found for breads, thus indicating additional ways of release and synthesis during intestinal transit. It was previously reported that in the distal colon, where carbohydrate sources are depleted, fermentation of amino acids as an energy source is often operated by Bacteroides species that possess very intense peptidase activity [53,54]. Moreover, the presence of dextran and MIMO in EPS+BB could have stimulated proliferation of different microbial groups, e.g., bifidobacteria, involved in in the anabolism of amino acids and vitamins [55].
The amount of FAAs increased significantly for both types of bread (EPS+BB and EPS-BB) digestion in the PC except for ammonia, which has significantly higher values in DC. Among 21 analyzed FAAs, all 9 essential amino acids increased significantly after the 1-week of treatment in the PC and DC, except for His and Met for EPS-BB in DC, and Lys and His in the case of EPS+BB digestion in the DC. These amino acids are very important for synthesizing microbial protein and they are also important for microbial growth [56]. Undigested proteins or peptides reaching the later part of the colon are utilized by gut bacteria, releasing SCFAs, ammonia and FAA as products. Usually, a significant amount of ammonia is released in the environment during proteolytic fermentation [57]; this is also true in this study. Excess ammonia is either utilized as nitrogen source or is eliminated as waste [58]. Bacteria tends to proliferate efficiently with selected amino acids like glutamate, glycine, phenylalanine, arginine and tyrosine [57]. These same amino acids are also being significantly synthesized and utilized when lumen samples are analyzed after intake of EPS+BB and EPS+BB (end of treatment period) and after washing out, especially in the PC.
The main pathway of amino acid catabolism in the human colon is deamination, thus leading to the production of SCFAs and ammonia, which is why ammonium concentration in the intestinal lumen increases progressively from the ascending colon to the descending colon, due to the higher rate of protein hydrolysis in the latter [59]. The lower ammonia concentration observed in the PC and DC of EPS+BB compared to the EPS-BB fed unit could be attributed to the higher level of polysaccharides available for the gut microbiota. Indeed, decrease in ammonia release is an indirect consequence of the fermentation of carbohydrates [59] that leads to a glucose increase and, consequently, to a correlated inhibition of alanine and glutamate deaminase synthesis [60,61]. Given that ammonia is associated with tumor cancer promotion by altering morphology and functionality of intestinal colon tissues [53], a limited release can be considered as a noteworthy result.
Pearson correlation coefficient analysis between EPS+BB and EPS-BB constituents (sugars, dextran, MO, MIMO, organic acids, fiber, protein and acidity) and metabolites (SCFAs and FAAs) in lumen samples showed different FAA metabolism correlation in the PC and DC after 1 week of treatment (Supplementary Tables S3 and S4). After EPS+BB treatment in PC, in situ dextran, sucrose and fat contained in bread showed a strong positive correlation with most of the FAAs, while bread protein had moderate positive correlation. Meanwhile in the DC, total carbohydrates, fibers, protein, bigger MIMO (DP6-DP7), glucose, fructose and maltose had positive correlation with FAAs from luminal samples. Gamma aminobutyric acid (GABA) showed a very strong positive correlation (p < 0.01) with EPS+BB bread fiber and fructose content in the PC. Oligosaccharides with higher DP, such as malto-hexaose and malto-heptaose in this study, and others present in BSG, like cellulose or hemicellulose, which are more resistant to human digestive enzymes, have been found to favor the synthesis of SCFAs and peptides, promoting better health [10].
An increase in amount of GABA was observed after the digestion of EPS+BB and EPS-BB BSG breads. GABA increase was also observed after feeding sourdough breads when compared to normal wheat breads in a previous study [20]. Production and presence of the inhibitory neurotransmitter GABA is considered beneficial, due to its physiological role and capacity for modulating the gut–brain axis. The ability of gut microbiota to produce neurotransmitters like GABA during the fermentation of oligosaccharides in a high fiber diet was also previously observed [62,63,64].
Preference of colonic microbiota towards the carbohydrates was clearly different in the PC and DC. Bigger MIMO (DP6 and DP7) and BSG fibers seemed more resistant to microbial digestion and enzymes in the PC, thus they reached later part of colon i.e., the DC, in which they were more actively fermented and evidently influencing the levels of fecal FAAs. An earlier study discussed the preference of Bifidobacterium spp. towards shorter oligos, up to DP3 (like raffinose), while Bacteroides spp. preferred oligos with DP > 4 [65]. Sanchez [66] have also reported the fermentation of polysaccharides with DP up to 15 in the ascending and transverse colon, while 30% of total polysaccharides with DP higher than 15 were utilized in the descending colon. This suggests that dextran (a branched polymer) could also be utilized in a later part of colon. In this study, the enrichment of wheat bread with plant fiber and protein contained in (EPS+ and EPS-) BSG showed a positive influence on SCFA and FAA metabolism. The inclusion of plant fibers and proteins has been shown to diversify the gut microbiome compared to calorie-rich diets high in fat and animal protein, leading to potential beneficial effects on health [67].

5. Conclusions

Fermentation of BSG with W. confusa A16 enabled the synthesis of dextran and oligosaccharides with positive repercussions on the technological and nutritional quality of wheat bread. Overall, fermented BSG contained in breads induced a significant response from the gut microbiota during in vitro trials, leading to high synthesis of SCFAs and FAAs. While SCFA synthesis showed moderate differences during digestion of the two types of bread, when dextran and MIMO were present, higher FAA bioaccessibility and lower production of ammonia were observed. The supplementation of fermented BSG in the wheat bread enriched the bread with fiber and proteins that showed a positive influence on gut health. Tailored fermentation of BSG represents an effective strategy to increase the overall value of this nutritious and underutilized by-product and facilitate its use as food ingredient.

Supplementary Materials

The following supporting information can be downloaded at: https://www.mdpi.com/article/10.3390/fermentation8100487/s1, Supplementary Table S1: technological parameters and texture analysis of BSG breads. WB: control wheat bread; BB: native BSG bread; EPS-BB: EPS-fermented BSG breads; EPS+BB: EPS+ fermented BSG breads; Table S2: Gut microbiota composition of selected donor at genus level; Table S3: Pearson correlation among bread EPS+BB composition and SHIME metabolites in luminal samples after one week of treatment; Table S4: Pearson correlation among bread EPS-BB composition and SHIME metabolites in luminal samples after one week of treatment

Author Contributions

Conceptualization, methodology, investigation, writing original draft, P.K.; investigation, data analysis, writing original draft, A.C.; methodology, supervision, H.N.M.; methodology, supervision, C.G.R.; investigation, writing original draft, M.V.; data analysis, V.D.B.; methodology, data analysis, writing original draft, A.P.; conceptualization, supervision, K.K.; conceptualization, investigation, supervision, funding acquisition, R.D.C.; conceptualization, investigation, supervision, writing original draft, funding acquisition, R.C. All authors have read and agreed to the published version of the manuscript.

Funding

This study was carried out under the framework of “FUNBREW” transnational project (Biotransformation of brewers’ spent grain: increased functionality for novel food applications) part of the ERA-Net SUSFOOD2 with funding provided by national sources [FORMAS, Sweden; MMM, Ministry of Agriculture and Forestry of Finland; MIUR, Ministero Italiano dell’Università e della Ricerca] and co-funding by the European Union’s Horizon 2020 research and innovation programme. Financial support for conducting the study was also provided by Finnish Cultural Foundation (grant number 00220496).

Institutional Review Board Statement

The study aiming to the selection of the fecal donor was approved by the Research Ethical Committee of the Free University of Bolzano (17 September 2020, registration number: Mi4FO Cod 2020_06). The recruitment was done with fully informed written consent from all volunteers.

Informed Consent Statement

Informed consent was obtained from all subjects involved in the study.

Data Availability Statement

Data obtained from this study are included in the article and provided as supplementary material. Inquiries can be made to the corresponding author.

Acknowledgments

We are grateful to Carl-Fredrik Tiger and Dugges Brewery (Sweden) for providing the brewers’ spent grain for this study and to Héliciane Clement for her assistance with baking.

Conflicts of Interest

The authors declare no conflict of interest.

References

  1. Mussatto, S.I.; Dragone, G.; Roberto, I.C. Brewers’ Spent Grain: Generation, Characteristics and Potential Applications. J. Cereal Sci 2006, 43, 1–14. [Google Scholar] [CrossRef]
  2. Petrovic, J.; Pajin, B.; Tanackov-Kocic, S.; Pejin, J.; Fistes, A.; Bojanic, N.; Loncarevic, I. Quality Properties of Cookies Supplemented with Fresh Brewer’s Spent Grain. Food Feed Res. 2017, 44, 57–63. [Google Scholar] [CrossRef]
  3. Schettino, R.; Verni, M.; Acin-albiac, M.; Vincentini, O.; Krona, A.; Knaapila, A.; di Cagno, R.; Gobbetti, M.; Rizzello, C.G.; Coda, R. Bioprocessed Brewers’ Spent Grain Improves Nutritional and Antioxidant Properties of Pasta. Antioxidants 2021, 10, 742. [Google Scholar] [CrossRef] [PubMed]
  4. Verni, M.; Rizzello, C.G.; Coda, R. Fermentation Biotechnology Applied to Cereal Industry By-Products: Nutritional and Functional Insights. Front. Nutr. 2019, 6, 42. [Google Scholar] [CrossRef] [PubMed]
  5. Ktenioudaki, A.; Alvarez-Jubete, L.; Smyth, T.J.; Kilcawley, K.; Rai, D.K.; Gallagher, E. Application of Bioprocessing Techniques (Sourdough Fermentation and Technological Aids) for Brewer’s Spent Grain Breads. Food Res. Int. 2015, 73, 107–116. [Google Scholar] [CrossRef]
  6. Neylon, E.; Arendt, E.K.; Zannini, E.; Sahin, A.W. Fermentation as a Tool to Revitalise Brewers’ Spent Grain and Elevate Techno-Functional Properties and Nutritional Value in High Fibre Bread. Foods 2021, 10, 1639. [Google Scholar] [CrossRef] [PubMed]
  7. Koirala, P.; Maina, N.H.; Nihtilä, H.; Katina, K.; Coda, R. Brewers’ Spent Grain as Substrate for Dextran Biosynthesis by Leuconostoc Pseudomesenteroides DSM20193 and Weissella Confusa A16. Microb. Cell Fact. 2021, 20, 23. [Google Scholar] [CrossRef] [PubMed]
  8. Wang, Y.; Trani, A.; Knaapila, A.; Hietala, S.; Coda, R.; Katina, K.; Maina, N.H. The Effect of in Situ Produced Dextran on Flavour and Texture Perception of Wholegrain Sorghum Bread. Food Hydrocoll. 2020, 106, 105913. [Google Scholar] [CrossRef]
  9. Wang, Y.; Compaoré-Sérémé, D.; Sawadogo-Lingani, H.; Coda, R.; Katina, K.; Maina, N.H. Influence of Dextran Synthesized in Situ on the Rheological, Technological and Nutritional Properties of Whole Grain Pearl Millet Bread. Food Chem. 2019, 285, 221–230. [Google Scholar] [CrossRef]
  10. Slavin, J. Fiber and Prebiotics: Mechanisms and Health Benefits. Nutrients 2013, 5, 1417–1435. [Google Scholar] [CrossRef] [Green Version]
  11. Jana, U.K.; Kango, N.; Pletschke, B. Hemicellulose-Derived Oligosaccharides: Emerging Prebiotics in Disease Alleviation. Front. Nutr. 2021, 8, 670817. [Google Scholar] [CrossRef]
  12. Sarbini, S.R.; Kolida, S.; Deaville, E.R.; Gibson, G.R.; Rastall, R.A. Potential of Novel Dextran Oligosaccharides as Prebiotics for Obesity Management through in Vitro Experimentation. Br. J. Nutr. 2014, 112, 1303–1314. [Google Scholar] [CrossRef]
  13. Dalile, B.; van Oudenhove, L.; Vervliet, B.; Verbeke, K. The Role of Short-Chain Fatty Acids in Microbiota–Gut–Brain Communication. Nat. Rev. Gastroenterol. Hepatol. 2019, 16, 461–478. [Google Scholar] [CrossRef]
  14. Morrison, D.J.; Preston, T. Formation of Short Chain Fatty Acids by the Gut Microbiota and Their Impact on Human Metabolism. Gut Microbes 2016, 7, 189–200. [Google Scholar] [CrossRef]
  15. Hamer, H.M.; Jonkers, D.; Venema, K.; Vanhoutvin, S.; Troost, F.J.; Brummer, R.J. Review Article: The Role of Butyrate on Colonic Function. Aliment. Pharm. 2008, 27, 104–119. [Google Scholar] [CrossRef]
  16. Kumar, J.; Rani, K.; Datt, C. Molecular Link between Dietary Fibre, Gut Microbiota and Health. Mol. Biol. Rep. 2020, 47, 6229–6237. [Google Scholar] [CrossRef]
  17. Lynch, K.M.; Strain, C.R.; Johnson, C.; Patangia, D.; Stanton, C.; Koc, F.; Gil-Martinez, J.; O’Riordan, P.; Sahin, A.W.; Ross, R.P.; et al. Extraction and Characterisation of Arabinoxylan from Brewers Spent Grain and Investigation of Microbiome Modulation Potential. Eur. J. Nutr. 2021, 60, 4393–4411. [Google Scholar] [CrossRef]
  18. Costabile, A.; Walton, G.E.; Tzortzis, G.; Vulevic, J.; Charalampopoulos, D.; Gibson, G.R. Development of a Bread Delivery Vehicle for Dietary Prebiotics to Enhance Food Functionality Targeted at Those with Metabolic Syndrome. Gut Microbes 2015, 6, 300–309. [Google Scholar] [CrossRef]
  19. Wang, Y.; Maina, N.H.; Coda, R.; Katina, K. Challenges and Opportunities for Wheat Alternative Grains in Breadmaking: Ex-Situ- versus in-Situ-Produced Dextran. Trends Food Sci. Technol. 2021, 113, 232–244. [Google Scholar] [CrossRef]
  20. Da Ros, A.; Polo, A.; Rizzello, C.G.; Acin-Albiac, M.; Montemurro, M.; Di Cagno, R.; Gobbetti, M. Feeding with Sustainably Sourdough Bread Has the Potential to Promote the Healthy Microbiota Metabolism at the Colon Level. Microbiol. Spectr. 2021, 9, e00494-21. [Google Scholar] [CrossRef]
  21. Katina, K.; Maina, N.H.; Juvonen, R.; Flander, L.; Johansson, L.; Virkki, L.; Tenkanen, M.; Laitila, A. In Situ Production and Analysis of Weissella Confusa Dextran in Wheat Sourdough. Food Microbiol. 2009, 26, 734–743. [Google Scholar] [CrossRef]
  22. Xu, Y.; Wang, Y.; Coda, R.; Säde, E.; Tuomainen, P.; Tenkanen, M.; Katina, K. In Situ Synthesis of Exopolysaccharides by Leuconostoc Spp. and Weissella Spp. and Their Rheological Impacts in Fava Bean Flour. Int. J. Food Microbiol. 2017, 248, 63–71. [Google Scholar] [CrossRef]
  23. Wang, Y.; Sorvali, P.; Laitila, A.; Maina, N.H.; Coda, R.; Katina, K. Dextran Produced in Situ as a Tool to Improve the Quality of Wheat-Faba Bean Composite Bread. Food Hydrocoll. 2018, 84, 396–405. [Google Scholar] [CrossRef]
  24. Weiss, W.; Vogelmeier, C.; Görg, A. Electrophoretic Characterization of Wheat Grain Allergens from Different Cultivars Involved in Bakers’ Asthma. Electrophoresis 1993, 14, 805–816. [Google Scholar] [CrossRef]
  25. de Pasquale, I.; Verni, M.; Verardo, V.; Gómez-Caravaca, A.M.; Rizzello, C.G. Nutritional and Functional Advantages of the Use of Fermented Black Chickpea Flour for Semolina-Pasta Fortification. Foods 2021, 10, 182. [Google Scholar] [CrossRef]
  26. Mackie, A.; Rigby, N. InfoGest Consensus Method. In The Impact of Food Bioactives on Health: In Vitro and Ex Vivo Models; Springer: Cham, Switzerland, 2015. [Google Scholar] [CrossRef]
  27. van den Abbeele, P.; Duysburgh, C.; Jiang, T.A.; Rebaza, M.; Pinheiro, I.; Marzorati, M. A Combination of Xylooligosaccharides and a Polyphenol Blend Affect Microbial Composition and Activity in the Distal Colon Exerting Immunomodulating Properties on Human Cells. J. Funct. Foods 2018, 47, 163–171. [Google Scholar] [CrossRef]
  28. de Boever, P.; Deplancke, B.; Verstraete, W. Fermentation by Gut Microbiota Cultured in a Simulator of the Human Intestinal Microbial Ecosystem Is Improved by Supplementing a Soygerm Powder. J. Nutr. 2000, 130, 2599–2606. [Google Scholar] [CrossRef]
  29. van Herreweghen, F.; van den Abbeele, P.; de Mulder, T.; de Weirdt, R.; Geirnaert, A.; Hernandez-Sanabria, E.; Vilchez-Vargas, R.; Jauregui, R.; Pieper, D.H.; Belzer, C.; et al. In Vitro Colonisation of the Distal Colon by Akkermansia Muciniphila Is Largely Mucin and PH Dependent. Benef. Microbes 2017, 8, 81–96. [Google Scholar] [CrossRef]
  30. Lotti, C.; Rubert, J.; Fava, F.; Tuohy, K.; Mattivi, F.; Vrhovsek, U. Development of a Fast and Cost-Effective Gas Chromatography--Mass Spectrometry Method for the Quantification of Short-Chain and Medium-Chain Fatty Acids in Human Biofluids. Anal. Bioanal. Chem. 2017, 409, 5555–5567. [Google Scholar] [CrossRef]
  31. McKenna, S.; Meyer, M.; Gregg, C.; Gerber, S. S-CorrPlot: An Interactive Scatterplot for Exploring Correlation. J. Comput. Graph. Stat. 2016, 25, 445–463. [Google Scholar] [CrossRef]
  32. Lynch, K.M.; Steffen, E.J.; Arendt, E.K. Brewers’ Spent Grain: A Review with an Emphasis on Food and Health. J. Inst. Brew. 2016, 122, 553–568. [Google Scholar] [CrossRef]
  33. Kajala, I.; Mäkelä, J.; Coda, R.; Shukla, S.; Shi, Q.; Maina, N.H.; Juvonen, R.; Ekholm, P.; Goyal, A.; Tenkanen, M.; et al. Rye Bran as Fermentation Matrix Boosts in Situ Dextran Production by Weissella Confusa Compared to Wheat Bran. Appl. Microbiol. Biotechnol. 2016, 100, 3499–3510. [Google Scholar] [CrossRef] [PubMed]
  34. Kothari, D.; Das, D.; Patel, S.; Goyal, A. Dextran and Food Application. In Polysaccharides: Bioactivity and Biotechnology; Springer: Cham, Switzerland, 2015; pp. 735–752. [Google Scholar] [CrossRef]
  35. Galle, S.; Schwab, C.; Arendt, E.; Gänzle, M. Exopolysaccharide-Forming Weissella Strains as Starter Cultures for Sorghum and Wheat Sourdoughs. J. Agric. Food Chem. 2010, 58, 5834–5841. [Google Scholar] [CrossRef] [PubMed]
  36. Wisselink, H.W.; Weusthuis, R.A.; Eggink, G.; Hugenholtz, J.; Grobben, G.J. Mannitol Production by Lactic Acid Bacteria: A Review. Int. Dairy J. 2002, 12, 151–161. [Google Scholar] [CrossRef]
  37. Monsan, P.; Bozonnet, S.; Ecile Albenne, C.; Joucla, G. Homopolysaccharides from Lactic Acid Bacteria. Int. Dairy J. 2001, 11, 675–685. [Google Scholar] [CrossRef]
  38. Galle, S.; Arendt, E.K. Exopolysaccharides from Sourdough Lactic Acid Bacteria. Crit. Rev. Food Sci. Nutr. 2014, 54, 891–901. [Google Scholar] [CrossRef]
  39. Gibson, G.R.; Hutkins, R.; Sanders, M.E.; Prescott, S.L.; Reimer, R.A.; Salminen, S.J.; Scott, K.; Stanton, C.; Swanson, K.S.; Cani, P.D.; et al. Expert Consensus Document: The International Scientific Association for Probiotics and Prebiotics (ISAPP) Consensus Statement on the Definition and Scope of Prebiotics. Nat. Rev. Gastroenterol. Hepatol. 2017, 14, 491–502. [Google Scholar] [CrossRef]
  40. Müller, M.; Hermes, G.D.A.; Emanuel E, C.; Holst, J.J.; Zoetendal, E.G.; Smidt, H.; Troost, F.; Schaap, F.G.; Damink, S.O.; Jocken, J.W.E.; et al. Effect of Wheat Bran Derived Prebiotic Supplementation on Gastrointestinal Transit, Gut Microbiota, and Metabolic Health: A Randomized Controlled Trial in Healthy Adults with a Slow Gut Transit. Gut Microbes 2020, 12, 1704141. [Google Scholar] [CrossRef] [Green Version]
  41. Olano-Martin, E.; Mountzouris, K.C.; Gibson, G.R.; Rastall, R.A. In Vitro Fermentability of Dextran, Oligodextran and Maltodextrin by Human Gut Bacteria. Br. J. Nutr. 2000, 83, 247–255. [Google Scholar] [CrossRef]
  42. Jang, E.Y.; Hong, K.B.; Chang, Y.B.; Shin, J.; Jung, E.Y.; Jo, K.; Suh, H.J. In Vitro Prebiotic Effects of Malto-Oligosaccharides Containing Water-Soluble Dietary Fiber. Molecules 2020, 25, 5201. [Google Scholar] [CrossRef]
  43. Hughes, R.L.; Alvarado, D.A.; Swanson, K.S.; Holscher, H.D. The Prebiotic Potential of Inulin-Type Fructans: A Systematic Review. Adv. Nutr. 2021, 13, 492–529. [Google Scholar] [CrossRef]
  44. van de Wiele, T.; van den Abbeele, P.; Ossieur, W.; Possemiers, S.; Marzorati, M. The Simulator of the Human Intestinal Microbial Ecosystem (SHIME®). In The Impact of Food Bioactives on Health: In Vitro and Ex Vivo Models; Springer: Cham, Switzerland, 2015; pp. 305–317. [Google Scholar] [CrossRef]
  45. Venegas, D.P.; de La Fuente, M.K.; Landskron, G.; González, M.J.; Quera, R.; Dijkstra, G.; Harmsen, H.J.M.; Faber, K.N.; Hermoso, M.A. Short Chain Fatty Acids (SCFAs)Mediated Gut Epithelial and Immune Regulation and Its Relevance for Inflammatory Bowel Diseases. Front. Immunol 2019, 10, 277. [Google Scholar] [CrossRef]
  46. Duncan, S.H.; Holtrop, G.; Lobley, G.E.; Calder, A.G.; Stewart, C.S.; Flint, H.J. Contribution of Acetate to Butyrate Formation by Human Faecal Bacteria. Br. J. Nutr. 2004, 91, 915–923. [Google Scholar] [CrossRef]
  47. Pryde, S.E.; Duncan, S.H.; Hold, G.L.; Stewart, C.S.; Flint, H.J. The Microbiology of Butyrate Formation in the Human Colon. FEMS Microbiol. Lett. 2002, 217, 133–139. [Google Scholar] [CrossRef]
  48. Marinelli, L.; Martin-Gallausiaux, C.; Bourhis, J.M.; Béguet-Crespel, F.; Blottière, H.M.; Lapaque, N. Identification of the Novel Role of Butyrate as AhR Ligand in Human Intestinal Epithelial Cells. Sci. Rep. 2019, 9, 643. [Google Scholar] [CrossRef]
  49. Gonzalez-Garcia, R.A.; McCubbin, T.; Navone, L.; Stowers, C.; Nielsen, L.K.; Marcellin, E. Microbial Propionic Acid Production. Fermentation 2017, 3, 21. [Google Scholar] [CrossRef]
  50. Hald, S.; Schioldan, A.G.; Moore, M.E.; Dige, A.; Lærke, H.N.; Agnholt, J.; Knudsen, K.E.B.; Hermansen, K.; Marco, M.L.; Gregersen, S.; et al. Effects of Arabinoxylan and Resistant Starch on Intestinal Microbiota and Short-Chain Fatty Acids in Subjects with Metabolic Syndrome: A Randomised Crossover Study. PLoS ONE 2016, 11, e0159223. [Google Scholar] [CrossRef] [Green Version]
  51. Akagawa, S.; Akagawa, Y.; Nakai, Y.; Yamagishi, M.; Yamanouchi, S.; Kimata, T.; Chino, K.; Tamiya, T.; Hashiyada, M.; Akane, A.; et al. Fiber-Rich Barley Increases Butyric Acid-Producing Bacteria in the Human Gut Microbiota. Metabolites 2021, 11, 559. [Google Scholar] [CrossRef]
  52. Flint, H.J. Gut Microbial Metabolites in Health and Disease. Gut Microbes 2016, 7, 187–188. [Google Scholar] [CrossRef]
  53. Scott, K.P.; Gratz, S.W.; Sheridan, P.O.; Flint, H.J.; Duncan, S.H. The Influence of Diet on the Gut Microbiota. Pharm. Res. 2013, 69, 52–60. [Google Scholar] [CrossRef]
  54. Wallace, R.J.; McKain, N. Peptidase Activity of Human Colonic Bacteria. Anaerobe 1997, 3, 251–257. [Google Scholar] [CrossRef]
  55. Turroni, F.; Ribbera, A.; Foroni, E.; van Sinderen, D.; Ventura, M. Human Gut Microbiota and Bifidobacteria: From Composition to Functionality. Antonie van Leeuwenhoek. Int. J. Gen. Mol. Microbiol. 2008, 94, 35–50. [Google Scholar] [CrossRef]
  56. Neis, E.P.J.G.; Dejong, C.H.C.; Rensen, S.S. The Role of Microbial Amino Acid Metabolism in Host Metabolism. Nutrients 2015, 7, 2930–2946. [Google Scholar] [CrossRef]
  57. Smith, E.A.; MacFarlane, G.T. Enumeration of Amino Acid Fermenting Bacteria in the Human Large Intestine: Effects of PH and Starch on Peptide Metabolism and Dissimilation of Amino Acids. FEMS Microbiol. Ecol. 1998, 25, 355–368. [Google Scholar] [CrossRef]
  58. Diether, N.E.; Willing, B.P. Microbial Fermentation of Dietary Protein: An Important Factor in Diet–Microbe–Host Interaction. Microorganisms 2019, 7, 19. [Google Scholar] [CrossRef]
  59. Macfarlane, G.T.; Gibson, G.R.; Cummings, J.H. Comparison of Fermentation Reactions in Different Regions of the Human Colon. J. Appl. Bacteriol. 1992, 72, 57–64. [Google Scholar] [CrossRef]
  60. Cárdenas-Castro, A.P.; Bianchi, F.; Tallarico-Adorno, M.A.; Montalvo-González, E.; Sáyago-Ayerdi, S.G.; Sivieri, K. In Vitro Colonic Fermentation of Mexican “Taco” from Corn-Tortilla and Black Beans in a Simulator of Human Microbial Ecosystem (SHIME®) System. Food Res. Int. 2019, 118, 81–88. [Google Scholar] [CrossRef] [Green Version]
  61. Epps, H.M.R.; Gale, E.F. The Influence of the Presence of Glucose during Growth on the Enzymic Activities of Escherichia Coli: Comparison of the Effect with That Produced by Fermentation Acids. Biochem. J. 1942, 36, 619. [Google Scholar] [CrossRef] [PubMed]
  62. Al-Khafaji, A.H.; Jepsen, S.D.; Christensen, K.R.; Vigsnæs, L.K. The Potential of Human Milk Oligosaccharides to Impact the Microbiota-Gut-Brain Axis through Modulation of the Gut Microbiota. J. Funct Foods 2020, 74, 104176. [Google Scholar] [CrossRef]
  63. Bourassa, M.W.; Alim, I.; Bultman, S.J.; Ratan, R.R. Butyrate, Neuroepigenetics and the Gut Microbiome: Can a High Fiber Diet Improve Brain Health? Neurosci. Lett. 2016, 625, 56–63. [Google Scholar] [CrossRef] [PubMed]
  64. Turck, D.; Bohn, T.; Castenmiller, J.; de Henauw, S.; Hirsch-Ernst, K.I.; Knutsen, H.K.; Maciuk, A.; Mangelsdorf, I.; McArdle, H.J.; Naska, A.; et al. Tolerable Upper Intake Level for Dietary Sugars. EFSA J. 2022, 20, e07074. [Google Scholar] [CrossRef]
  65. Ose, R.; Hirano, K.; Maeno, S.; Nakagawa, J.; Salminen, S.; Tochio, T.; Endo, A. The Ability of Human Intestinal Anaerobes to Metabolize Different Oligosaccharides: Novel Means for Microbiota Modulation? Anaerobe 2018, 51, 110–119. [Google Scholar] [CrossRef]
  66. Sanchez, J.I.; Marzorati, M.; Grootaert, C.; Baran, M.; van Craeyveld, V.; Courtin, C.M.; Broekaert, W.F.; Delcour, J.A.; Verstraete, W.; van de Wiele, T. Arabinoxylan-Oligosaccharides (AXOS) Affect the Protein/Carbohydrate Fermentation Balance and Microbial Population Dynamics of the Simulator of Human Intestinal Microbial Ecosystem. Microb Biotechnol. 2009, 2, 101–113. [Google Scholar] [CrossRef]
  67. de Filippo, C.; Cavalieri, D.; di Paola, M.; Ramazzotti, M.; Poullet, J.B.; Massart, S.; Collini, S.; Pieraccini, G.; Lionetti, P. Impact of Diet in Shaping Gut Microbiota Revealed by a Comparative Study in Children from Europe and Rural Africa. Proc. Natl. Acad. Sci. USA 2010, 107, 14691–14696. [Google Scholar] [CrossRef] [Green Version]
Figure 1. Chromatograms (obtained from HPAEC-PAD) of malto-oligosaccharides present in native BSG produced during fermentation of BSG without addition of sucrose (EPS-BSG) and malto-oligosaccharides equivalent maltosyl-isomaltooligosaccharides produced during fermentation of BSG with addition of sucrose (EPS+BSG). X axis denotes the retention time of different compounds. Profile of malto-oligosaccharides and MIMO present in native and fermented BSG with (EPS+BSG) and without (EPS-BSG) sucrose. Reference oligosaccharides: panose (Pan), maltotriose (DP3), maltotetraose (DP4), maltopentaose (DP5), maltohexaose (DP6) and maltoheptaose (DP7) were detected in all analysed samples.
Fermentation 08 00487 g001
Figure 2. Experimental design of the Simulator of the Human Intestinal Microbial Ecosystem (SHIME®). Different running periods and sampling points are illustrated in the schematic diagram. After fecal inoculation, a stabilization (2 weeks) and a steady state (2 weeks) period were followed by one week of treatment period and one week of wash out period. During the treatment period, digested EPS+BB and EPS-BB breads were added to the SHIME® feeding cycles (one for each unit).
Fermentation 08 00487 g002
Figure 3. Pearson correlation among EPS+BSG bread (EPS+BB) content of total carbohydrate, dietary fiber, protein, fat, lactic and acetic acids, dextran, MIMO (MOE, DP3–DP7), glucose, fructose, sucrose, maltose, pH, total titratable acidity (TTA) and microbial metabolites (short chain fatty acids and free amino acids) in proximal (A) and distal (B) colon after one week of treatment period. (B) indicates bread variables. F indicates fecal sample variables. The color scale bar indicates a positive (blue) or negative (red) correlation (* p < 0.05, ** p < 0.01).
Fermentation 08 00487 g003
Figure 4. Pearson correlation among EPS-BB content of total carbohydrate, dietary fiber, protein, fat, lactic and acetic acids, dextran, malto-oligosaccharides (DP3–DP7), glucose, fructose, sucrose, maltose, pH, total titratable acidity (TTA) and microbial metabolites (short chain fatty acids and free amino acids) in proximal (A) and distal (B) colon after one week of treatment period. (B) indicates bread variables. F indicates fecal sample variables. The color scale bar indicates a positive (blue) or negative (red) correlation (* p < 0.05, ** p < 0.01).
Fermentation 08 00487 g004
Table 1. Recipes for fermented BSG and BSG bread doughs.
WBBBEPS-BBEPS+BB
g *% d.w. **g% d.w.g% d.w.g% d.w.
BSG 523.333.32523.3 526.033.49
Sucrose 58.43.72
Fermented BSG 523.333.32584.4
Wheat flour90057.3179850.8179850.8173947.06
Water54034.38118.77.56118.77.56116.67.42
Salt13.50.8613.50.8613.50.8613.50.86
Sugar18.01.1518.01.1518.01.1518.01.15
Yeast45.02.8745.02.8745.02.8745.02.87
Fat54.03.4454.03.4454.03.4454.03.44
Total1570.5100.01570.5100.01570.5100.01570.5100.0
Bread recipes for wheat control bread (WB), native BSG bread (BB), EPS negative BSG bread (EPS-BB) and EPS positive BSG bread (EPS+BB). * gram, ** dough weight. Similar amounts of fermented BSG and water in (EPS-BB and EPS+BB) sourdoughs, and total dough amounts are reported in bold format.
Table 2. Acidity (pH and TTA) and amount of organic acids (lactic and acetic) before and after fermentation of BSG with W. confusa A16 with (EPS+) and without (EPS-) addition of sucrose.
TimepointsBSGpHTTALactic AcidAcetic Acid
mL of 0.1 N NaOHmg/100 g Fermented BSG
T0EPS-5.9 ± 0.0 a2.4 ± 0.1 and *nd *
EPS+1.9 ± 0.1 a
T24EPS-4.6 ± 0.4 b7.1 ± 1.4 b246.2 ± 24.5 a106.4 ± 6.9 a
EPS+4.3 ± 0.1 c7.2 ± 0.3 b398.9 ± 7.8 b91.8 ± 1.9 a
a–c Values with different letters in the same column are significantly different (Tukey’s test. p < 0.05). * nd: not detected.
Table 3. Consumption and release of sugars during fermentation of BSG with W. confusa A16. Amount of sugars (% dry weight of fermented BSG) quantified before (native) and after fermentation of BSG with W. confusa A16 with (EPS+) and without (EPS-) addition of sucrose.
FructoseGlucoseSucroseMaltose
Native0.5 ± 0.01 a0.4 ± 0.01 and *2.3 ± 0.01 a
EPS-0.5 ± 0.01 a0.5 ± 0.01 and *2.1 ± 0.1 b
EPS+21.0 ± 1.0 bnd *,bnd *1.1 ± 0.1 c
a–c Values with different letters in the column are significantly different (Tukey’s test. p < 0.05). * nd: not detected.
Table 4. Synthesis of dextran and oligosaccharides during fermentation of BSG with W. confusa A16. Amount of dextran (% dry weight of fermented BSG), malto-oligosaccharides present in native BSG (% dry weight of fermented BSG), malto-oligosaccharides synthesized during fermentation of BSG with W. confusa A16 without (EPS-), addition of sucrose and malto-oligosaccharides equivalent maltosyl-isomaltooligosaccharides synthesized during fermentation of BSG with W. confusa A16 with (EPS+) addition of sucrose.
DextranOligosaccharides
DP3-DP4 **DP5 **DP6-DP7 **
Nativend *0.6 ± 0.02 a0.5 ± 0.04 a0.4 ± 0.01 a
EPS-0.3 ± 0.04 b1.2 ± 0.11 b1.1 ± 0.06 b
EPS+7.2 ± 0.32.5 ± 0.13 c4.8 ± 0.39 c2.6 ± 0.25 c
a–c Values with different letters in the column are significantly different (Tukey’s test. p < 0.05). * nd: not detected, ** DP3-DP4: Panose, malto-triose and malto-tetraose, DP5: malto-pentaose and DP6-DP7: malto-hexaose and malto-heptaose.
Table 5. Acidity (pH and TTA) and sugar analysis of BSG breads (WB: wheat bread, BB: native BSG bread, EPS-BB: EPS-BSG breads and EPS+BB: EPS+BSG breads). TTA values are the amount (ml) of NaOH required during titration. Amount of sugars are expressed g/kg of dried breads.
Bread TypespHTTA (mL)Sugars
GlucoseFructoseSucroseMaltose
WB5.9 ± 0.1 a3.2 ± 0.1 and *
BB5.8 ± 0.1 a3.4 ± 0.1 a2.3 ± 0.07 ab11.6 ± 0.07 b0.6 ± 0.07 a32.4 ± 1.02 a
EPS-BB5.3 ± 0.1 b5.0 ± 0.4 b1.3 ± 0.07 b8.5 ± 0.01 c0.5 ± 0.04 b24.9 ± 0.95 b
EPS+BB5.1 ± 0.1 b5.5 ± 0.1 b3.3 ± 0.08 a29.02 ± 0.02 a0.3 ± 0.00 c22.8 ± 0.91 b
a–c Values with different letters in the column are significantly different (Tukey’s test. p < 0.05). * nd: not determined.
Table 6. Short chain fatty acid (SCFA) (mM) and individual free amino acid (FAA) (mg/Kg) concentration in proximal colon (PC) and distal colon (DC) tracts of the SHIME model, before and after treatment, and after washing out while fed with digested EPS+BB and EPS-BB. Sampling points refer to the end of the steady state period (i.e., before the start of treatment period), after one week of treatment period and after one week of wash out period.
SCFA Short Chain Fatty Acids (mM)
TreatmentsPC1 (EPS+BB)PC2 (EPS-BB)DC1 (EPS+BB)DC2 (EPS-BB)
Acetic acidBefore treatment20.86 ± 1.78 b22.56 ± 0.67 b30.72 ± 1.65 b33.73 ± 2.23 a
After treatment38.47 ± 2.14 a/*33.91 ± 1.85 a45.19 ± 3.71 a43.00 ± 2.10 a
After washing out24.15 ± 0.05 b/*21.75 ± 0.22 b35.45 ± 0.19 b/*34.94 ± 2.91 a
Propionic acidBefore treatment2.71 ± 0.17 a3.02 ± 0.12 a3.45 ± 0.20 a3.73 ± 0.05 b
After treatment3.09 ± 0.27 a3.21 ± 0.20 a4.33 ± 0.58 a4.66 ± 0.40 a
After washing out2.80 ± 0.28 a3.06 ± 0.07 a3.71 ± 0.08 a3.97 ± 0.09 b/*
Butyric acidBefore treatment8.88 ± 0.17 b9.23 ± 0.15 b9.62 ± 0.22 b9.91 ± 0.04 b
After treatment11.16 ± 0.32 a12.05 ± 0.41 a/*13.39 ± 0.92 a13.46 ± 0.48 a
After washing out9.02 ± 0.17 b9.24 ± 0.09 b10.43 ± 0.10 b/*9.95 ± 0.07 b
FAA Free Amino Acids (mg/Kg)
TreatmentsPC1 (EPS+BB)PC2 (EPS-BB)DC1 (EPS+BB)DC2 (EPS-BB)
AspBefore treatment3.44 ± 0.24 b2.89 ± 0.20 b1.91 ± 0.12 c1.83 ± 0.13 b
After treatment72.67 ± 5.13 a/*33.26 ± 2.35 a3.63 ± 0.26 a/*2.86 ± 0.20 a
After washing out5.11 ± 0.36 b/*3.85 ± 0.27 b2.55 ± 0.18 b/*1.89 ± 0.13 b
ThrBefore treatment0.79 ± 0.01 c/*0.52 ± 0.01 b0.12 ± 0.01 c0.17 ± 0.01 b/*
After treatment80.43 ± 0.53 a/*11.33 ± 0.07 a0.32 ± 0.01 a0.52 ± 0.01 a/*
After washing out2.78 ± 0.02 b/*0.26 ± 0.01 c0.16 ± 0.01 b/*0.11 ± 0.01 c
SerBefore treatment1.09 ± 0.05 b/*0.69 ± 0.03 b0.40 ± 0.02 b/*0.20 ± 0.01 b
After treatment15.14 ± 0.76 a/*4.41 ± 0.22 a0.64 ± 0.03 a0.74 ± 0.04 a
After washing out1.20 ± 0.06 b/*0.75 ± 0.04 b0.22 ± 0.01 c/*0.15 ± 0.01 b
GluBefore treatment220.41 ± 36.13 b180.89 ± 29.65 b8.54 ± 1.36 b9.26 ± 1.52 b
After treatment497.21 ± 81.50 a488.63 ± 80.10 a23.50 ± 3.85 a23.62 ± 3.87 a
After washing out205.78 ± 33.73 b185.34 ± 30.38 b8.78 ± 1.44 b7.86 ± 1.29 b
GlyBefore treatment78.36 ± 2.24 c/*65.54 ± 1.87 b0.16 ± 0.01 b0.15 ± 0.01 c
After treatment147.59 ± 4.22 a/*142.98 ± 4.08 a12.93 ± 0.37 a/*1.41 ± 0.04 a
After washing out92.11 ± 2.63 b/*38.31 ± 1.09 c0.17 ± 0.01 b0.29 ± 0.01 b/*
AlaBefore treatment7.95 ± 0.29 b/*5.08 ± 0.18 b1.24 ± 0.05 b/*0.66 ± 0.02 b
After treatment166.07 ± 5.97 a/*113.19 ± 4.06 a43.14 ± 1.55 a/*2.91 ± 0.10 a
After washing out7.40 ± 0.27 b/*1.51 ± 0.05 c1.18 ± 0.04 b/*0.45 ± 0.02 c
ValBefore treatment12.29 ± 0.67 b15.30 ± 0.84 b/*0.31 ± 0.20 b0.34 ± 0.02 b
After treatment117.78 ± 6.45 a/*80.75 ± 4.42 a5.09 ± 0.29 a/*1.55 ± 0.09 a
After washing out8.71 ± 0.48 b9.25 ± 0.50 c0.34 ± 0.02 b/*0.02 ± 0.01 c
CysBefore treatment5.85 ± 0.90 b8.09 ± 1.24 b0.27 ± 0.04 b0.63 ± 0.10 b/*
After treatment33.50 ± 5.14 a/*13.61 ± 2.09 a1.56 ± 0.24 a1.81 ± 0.28 a
After washing out0.61 ± 0.09 c3.14 ± 0.48 c/*0.54 ± 0.08 b0.53 ± 0.08 b
MetBefore treatment3.03 ± 0.78 b2.72 ± 0.29 b0.16 ± 0.01 b0.15 ± 0.01 a
After treatment9.87 ± 0.61 a10.64 ± 0.65 a5.92 ± 0.36 a/*0.16 ± 0.01 a
After washing out0.72 ± 0.18 c0.62 ± 0.21 c0.12 ± 0.01 b0.11 ± 0.01 b
IleBefore treatment8.50 ± 0.52 b10.44 ± 0.63 b/*2.63 ± 0.18 b2.57 ± 0.16 b
After treatment76.70 ± 4.66 a/*38.36 ± 2.33 a5.47 ± 0.33 a/*3.30 ± 0.20 a
After washing out6.19 ± 0.38 b6.40 ± 0.39 c2.26 ± 0.14 b/*0.01 ± 0.01 c
LeuBefore treatment5.79 ± 0.36 b6.87 ± 0.43 b1.82 ± 0.13 b/*0.89 ± 0.06 b
After treatment73.69 ± 4.58 a/*58.89 ± 3.66 a2.91 ± 0.18 a/*1.61 ± 0.10 a
After washing out4.45 ± 0.28 b/*3.45 ± 0.21 c1.27 ± 0.08 c/*0.01 ± 0.01 c
TyrBefore treatment4.69 ± 0.34 b/*1.63 ± 0.12 b0.81 ± 0.07 b/*0.52 ± 0.04 b
After treatment53.20 ± 3.86 a/*14.14 ± 1.03 a10.25 ± 0.74 a/*2.36 ± 0.17 a
After washing out6.84 ± 0.50 b/*1.45 ± 0.11 b0.64 ± 0.05 b/*0.34 ± 0.02 b
PheBefore treatment6.07 ± 0.43 c/*1.78 ± 0.13 b1.46 ± 0.12 b/*1.03 ± 0.07 b
After treatment134.13 ± 9.54 a/*44.27 ± 3.15 a75.52 ± 5.37 a/*6.10 ± 0.43 a
After washing out10.62 ± 0.76 b/*0.99 ± 0.07 b0.99 ± 0.07 b0.83 ± 0.06 b
GABABefore treatment5.91 ± 0.04 a/*4.14 ± 0.03 c3.93 ± 0.04 b4.64 ± 0.03 b/*
After treatment5.82 ± 0.04 a10.93 ± 0.08 a/*8.72 ± 0.06 a/*8.43 ± 0.06 a
After washing out4.83 ± 0.03 b/*4.68 ± 0.03 b2.01 ± 0.01 c/*1.78 ± 0.01 c
AmmoniaBefore treatment387.23 ± 11.97 a369.68 ± 25.86 a597.77 ± 41.82 b632.95 ± 44.28 b
After treatment287.21 ± 20.09 b408.31 ± 28.56 a/*779.79 ± 54.55 a811.31 ± 56.76 a
After washing out361.28 ± 25.28 a422.16 ± 29.53 a606.98 ± 42.46 b688.60 ± 48.17 b
OrnBefore treatment1.43 ± 0.09 c3.96 ± 0.25 b/*1.16 ± 0.08 b/*0.51 ± 0.03 c
After treatment6.27 ± 0.40 a25.76 ± 1.66 a/*2.14 ± 0.14 a5.55 ± 0.36 a/*
After washing out2.29 ± 0.15 b3.59 ± 0.23 b/*0.46 ± 0.03 c1.31 ± 0.08 b/*
LysBefore treatment8.62 ± 0.70 c33.24 ± 2.73 b/*1.66 ± 0.15 a1.41 ± 0.12 b
After treatment23.64 ± 1.94 a70.59 ± 5.80 a/*1.94 ± 0.16 a2.44 ± 0.20 a
After washing out13.55 ± 1.11 b30.73 ± 2.52 b/*1.60 ± 0.13 a1.62 ± 0.13 b
HisBefore treatment29.25 ± 5.74 b23.55 ± 4.62 b0.12 ± 0.01 a0.18 ± 0.01 a
After treatment44.96 ± 8.82 a47.48 ± 9.32 a0.17 ± 0.03 a0.17 ± 0.03 a
After washing out23.27 ± 4.57 b23.73 ± 4.66 b0.13 ± 0.03 a0.07 ± 0.01 b
TrpBefore treatment14.21 ± 1.47 b/*7.17 ± 0.74 c1.14 ± 0.21 b/*0.47 ± 0.04 b
After treatment35.30 ± 3.65 a36.43 ± 3.76 a2.31 ± 0.24 a/*1.07 ± 0.11 a
After washing out15.31 ± 1.58 b13.27 ± 1.37 b0.82 ± 0.09 b/*0.48 ± 0.05 b
ArgBefore treatment1.60 ± 0.17 b3.46 ± 0.36 c/*NFNF
After treatment13.06 ± 1.34 a19.85 ± 2.04 a/*0.93 ± 0.09 a1.51 ± 0.16 a/*
After washing out2.92 ± 0.30 b6.62 ± 0.68 b/*0.01 ± 0.01 b0.32 ± 0.03 b/*
ProBefore treatment1.35 ± 0.05 b/*0.93 ± 0.03 c0.90 ± 0.03 b0.98 ± 0.03 b
After treatment12.90 ± 0.47 a/*2.02 ± 0.07 a1.76 ± 0.06 a/*1.44 ± 0.05 a
After washing out0.82 ± 0.03 b1.47 ± 0.05 b/*0.86 ± 0.03 b/*0.77 ± 0.03 c
TotalBefore treatment807.87 ± 19.35 b748.57 ± 45.42 b626.51 ± 42.33 b659.55 ± 43.58 b
After treatment1907.15 ± 24.32 a/*1675.85 ± 21.01 a988.65 ± 58.68 a880.88 ± 55.18 a
After washing out776.82 ± 25.24 b761.57 ± 10.18 b632.11 ± 43.10 b707.52 ± 48.87 b
a–c values in the same column with different superscript letters differ significantly (p < 0.05) based on one-way ANOVA and individual post hoc comparisons with Tukey–Kramer. For each colon tract (PC1, PC2, DC1, DC2) at different sampling points, comparison was performed for every compound. The data are the means of three independent analyses ± standard deviations (n = 3). * Values with asterisks in the same row differ significantly (p < 0.05) based on Student’s t-test. Comparison between bioreactors of different SHIME units at the same sampling point were performed for every colon tract. NF means not found.
Publisher’s Note: MDPI stays neutral with regard to jurisdictional claims in published maps and institutional affiliations.

