Article

Integrating Life Cycle Principles in Home Energy Management Systems: Optimal Load PV–Battery–Electric Vehicle Scheduling

by
Zaid A. Al Muala
,
Mohammad A. Bany Issa
and
Pastora M. Bello Bugallo
*
TECH-NASE Research Group, Department of Chemical Engineering, Universidade de Santiago de Compostela, 15705 Santiago de Compostela, Spain
*
Author to whom correspondence should be addressed.
Batteries 2024, 10(4), 138; https://doi.org/10.3390/batteries10040138
Submission received: 29 February 2024 / Revised: 5 April 2024 / Accepted: 13 April 2024 / Published: 19 April 2024
(This article belongs to the Special Issue Towards a Smarter Battery Management System)

Abstract

:
Energy management in the residential sector contributes to energy system dispatching and security with the optimal use of renewable energy systems (RES) and energy storage systems (ESSs) and by utilizing the main grid based on its state. This work focuses on optimal energy flow, ESS parameters, and energy consumption scheduling based on demand response (DR) programs. The primary goals of the work consist of minimizing electricity costs while simultaneously extending the lifetime of ESSs in conjunction with extracting maximum benefits throughout their operational lifespan and reducing CO2 emissions. Effective ESS and photovoltaic (PV) energy usage prices are modeled and an efficient energy flow management algorithm is presented, which considers the life cycle of the ESSs including batteries, electrical vehicles (EVs) and the efficient use of the PV system while reducing the cost of energy consumption. In addition, an optimization technique is employed to obtain the optimal ESS parameters including the size and depth of discharge (DOD), considering the installation cost, levelized cost of storage (LCOS), winter and summer conditions, energy consumption profile, and energy prices. Finally, an optimization technique is applied to obtain the optimal energy consumption scheduling. The proposed system provides all of the possibilities of exchanging energy between EV, battery, PV system, grid, and home. The optimization problem is solved using the particle swarm optimization algorithm (PSO) in MATLAB with an interval time of one minute. The results show the effectiveness of the proposed system, presenting an actual cost reduction of 28.9% and 17.7% in summer and winter, respectively, compared to a base scenario. Similarly, the energy losses were reduced by 26.7% in winter and 22.3% in summer, and the EV battery lifetime was extended from 9.2 to 19.1 years in the winter scenario and from 10.4 to 17.7 years in the summer scenario. The integrated system provided a financial contribution during the operational lifetime of EUR 11,600 and 7900 in winter and summer scenarios, respectively. The CO2 was reduced by 59.7% and 46.2% in summer and winter scenarios, respectively.

Graphical Abstract

1. Introduction

Over the last decade, there has been a rise in energy demand, which is directly tied to population growth around the world [1]. As countries heavily depend on energy for their development, reducing energy consumption poses significant challenges. Globally, concerns over the environmental impact of fossil fuels and issues related to the geopolitics of global energy security have emerged as crucial topics demanding attention and resolution [2]. Accordingly, due to environmental and energy security issues, harnessing renewable energy systems (RESs) as alternatives to fossil fuel sources to generate energy has become of utmost importance [3]. However, intermittent and variable RES generation is unavoidable; these systems do not demonstrate consistent performance in fulfilling continuous energy demand, significantly affecting grid stability [4,5]. Therefore, continuously meeting energy demand is the main challenge of any power generation system. Hence, in the sustainability realm, the role of energy storage systems (ESSs) is to improve the reliability of the energy system by storing surplus energy from RES and redistributing it during RES energy shortage and grid peak periods. This dynamic functionality ensures a more resilient and efficient energy system, marking a significant stride toward a sustainable and reliable energy future [6,7].
For example, the residential sector represented 27% of the final energy consumption, emphasizing its notable contribution to overall energy usage, the potential impact of optimizing consumption through energy-efficient practices, and its contribution to energy sustainability [8]. Integrating ESSs such as batteries and electrical vehicles (EVs) with a local photovoltaic (PV) system in the residential sector proves to be an efficient strategy. This strategy addresses the fluctuations of PV energy generation by storing excess energy during periods of abundance and discharging it when faced with insufficient PV energy generation and periods of high grid energy price [9,10]. Furthermore, RESs and ESSs compose a large portion of the distributed generators in the residential sector [6], especially with the continuous drop in their installation costs [11]. In addition, utilizing RESs and ESSs has economic benefits in the residential sector by reducing energy costs [12]. The implementation of smart grid (SG) technology and innovative electricity tariffs, such as real-time pricing (RTP) and time-of-use (TOU) pricing, play a pivotal role in sustainable energy management [13]. Accordingly, household energy consumers receive real-time information about the grid’s electricity prices by employing smart meters that facilitate seamless data exchange.
While harnessing the potential of PV systems involves an initial investment, mitigating this challenge requires a strategic approach that entails optimizing the utilization of PV systems by synchronizing their operation with the fluctuating energy demand and energy prices throughout the day. In addition, this allows informed decisions to be made on whether to store excess energy in ESSs or capitalize on excess energy by selling it to the grid. Failure to effectively align the use of PV systems with demand patterns and market conditions can directly impact the owner’s income, particularly concerning the initial investment and operational costs. Hence, the prudent management of energy resources and market dynamics is essential for maximizing returns on PV system investments [14]. Similarly, ESSs have an investment cost, requiring an efficient operational approach. Accordingly, considering the fluctuating charging prices from the grid throughout the day, it becomes imperative to manage the charging/discharging operation times [15]. This consideration not only optimizes the life cycle of ESSs but also yields real economic benefits for household energy consumers. The depth of discharge (DOD) holds significance in the operations of ESSs and profoundly influences their life cycle [16]. Moreover, when evaluating the levelized cost of storage (LCOS), the DOD exhibits an inverse relationship with the LCOS, while directly correlating with the allowable charge/discharge to/from the ESSs. Therefore, establishing an optimal DOD for ESSs ensures both cost-effectiveness and efficient charge/discharge operations. Thus, energy management through finding the optimal energy distribution and scheduling of energy consumption has benefits for consumers and operators in ensuring system reliability [17] and achieving various goals such as reducing electricity bills [18], reducing CO2 emissions [19], effectively using PV power [20], and preserving the life cycle of ESSs [21].
As the home energy management systems (HEMSs) field continues to evolve, significant strides have been made in understanding and enhancing strategies such as optimal power flow and scheduling the operating time of household appliances. The literature abounds with noteworthy advances, with various research studies proposing innovative approaches to further optimize and refine these crucial aspects of HEMS functionality. In the system presented by Bouakkaz et al. [22], the prioritization involves utilizing RES power as the primary source, followed by the battery, and ultimately diesel generator (DG) power to meet the load. The optimization of energy consumption scheduling revolves around minimizing the number of battery cycles. Bhattacharjee et al. [23] proposed an energy flow strategy focused on scheduling power generation from the PV system, biogas engine generator, energy stored in the battery, and grid. In the event of a shortage of RES energy, this energy flow prioritizes the available discharge energy in the biogas engine generator, followed by the battery, and ultimately the grid price. The optimization cost is based on minimizing the operation and maintenance expenses of the energy sources, and battery, along with the imported/exported energy cost from/to the grid. In the work published by Mbungu et al. [24], a flexible communication control strategy was created to manage the energy flow for the residential sector, aiming to maximize the energy usage from RESs and ESSs and thereby reduce the purchased energy from the grid. The system algorithm is designed based on the FMINCON optimal structure, in which the grid and RES energy usage prices are constant. In the work performed by Mbungu et al. [25], a closed-loop optimization was applied to manage the energy flow of an EV connected to a home and grid. The EV functions as an energy supplier to the home and can also be charged from the grid, where the objective function is minimizing the cost of energy imported from the grid. The Genetic Algorithm (GA) was employed to schedule the energy flow in a residential power system [26]. The dispatching ratio of energy sold to the grid was considered an optimization variable. The objective function is to minimize the energy cost by maximizing the benefit of energy sold to the grid and minimizing the cost of energy imported from the grid. To meet the energy demand, the order of priority was assigned to RESs, followed by the battery, and, as a final source, the grid. Li et al. [27] developed a dynamic programming algorithm based on the Bellman equation to solve an energy flow optimization problem considering battery-cycling aging. Azaroual et al. [28] proposed an energy management strategy based on the GA, Pattern Search Optimization Solver (PSOA), Fmincon Optimization Solver, and hybrid GA–Fmincon algorithms to maximize self-consumption utilizing a combination of PV, wind turbine, and battery resources. The optimization problem incorporated factors such as energy cost imported from the grid, daily battery operation, battery degradation, and profit from selling excess energy to the grid. Another study proposed an HEMS optimization strategy using Grey Wolf Optimization (GWO) to minimize the electricity cost and peak-to-average ratio (PAR), in which the ESS charging/discharging management strategy was formulated based on the average of RTP over the day and the state of charge (SoC) [29]. The PSO and Jaya algorithms were employed by Wang et al. [30] to achieve optimal energy scheduling. The proposed system offers the capability to fulfill the energy demand through EVs. The daily costs associated with RESs and ESSs were incorporated into the optimization problem to be constant according to their installation costs and life cycles. A Mixed Integer Linear Programming (MILP) optimization algorithm was implemented by Munankarmi et al. [31] to address a multi-objective HEMS model. This model revolves around optimizing energy cost, ensuring thermal comfort, and considering PAR. A model for optimal energy flow considering the battery life cycle was introduced by Lee et al. [32] to minimize grid and battery energy usage costs. The optimization problem incorporated the battery degradation cost, with its determination based on the SOC. An energy management system was designed by Seal et al. [33] to minimize grid energy purchases, optimize the selling of energy to the grid for profit, and ensure thermal comfort. The optimization problem was solved using the MATLAB function FMINCON. Bouakkaz et al. proposed a model for battery energy usage pricing based on the battery capital cost and life cycle, incorporating the SoC as a determining factor. In this model, the price increases with a low SoC and decreases with a high SoC [34]. A multi-objective HEMS model was introduced by Huy et al. [35] to achieve optimal energy scheduling. The optimization problem was addressed through the augmented ε-constraint method and lexicographic optimization. The optimization considerations relate to economic, technical, and end-user comfort factors.
The innovation of the present work lies in its comprehensive approach to energy management in the residential sector by integrating an effective energy management system including optimal power flow, optimal ESS parameters, and optimal energy consumption scheduling. The proposed system aims to reduce electricity costs while extending the ESS lifetime, reducing energy losses, reducing CO2 emissions, and maximizing the benefits of PV–battery–EV energy systems throughout their lifetime. The main contributions of the proposed system involve the following:
1.
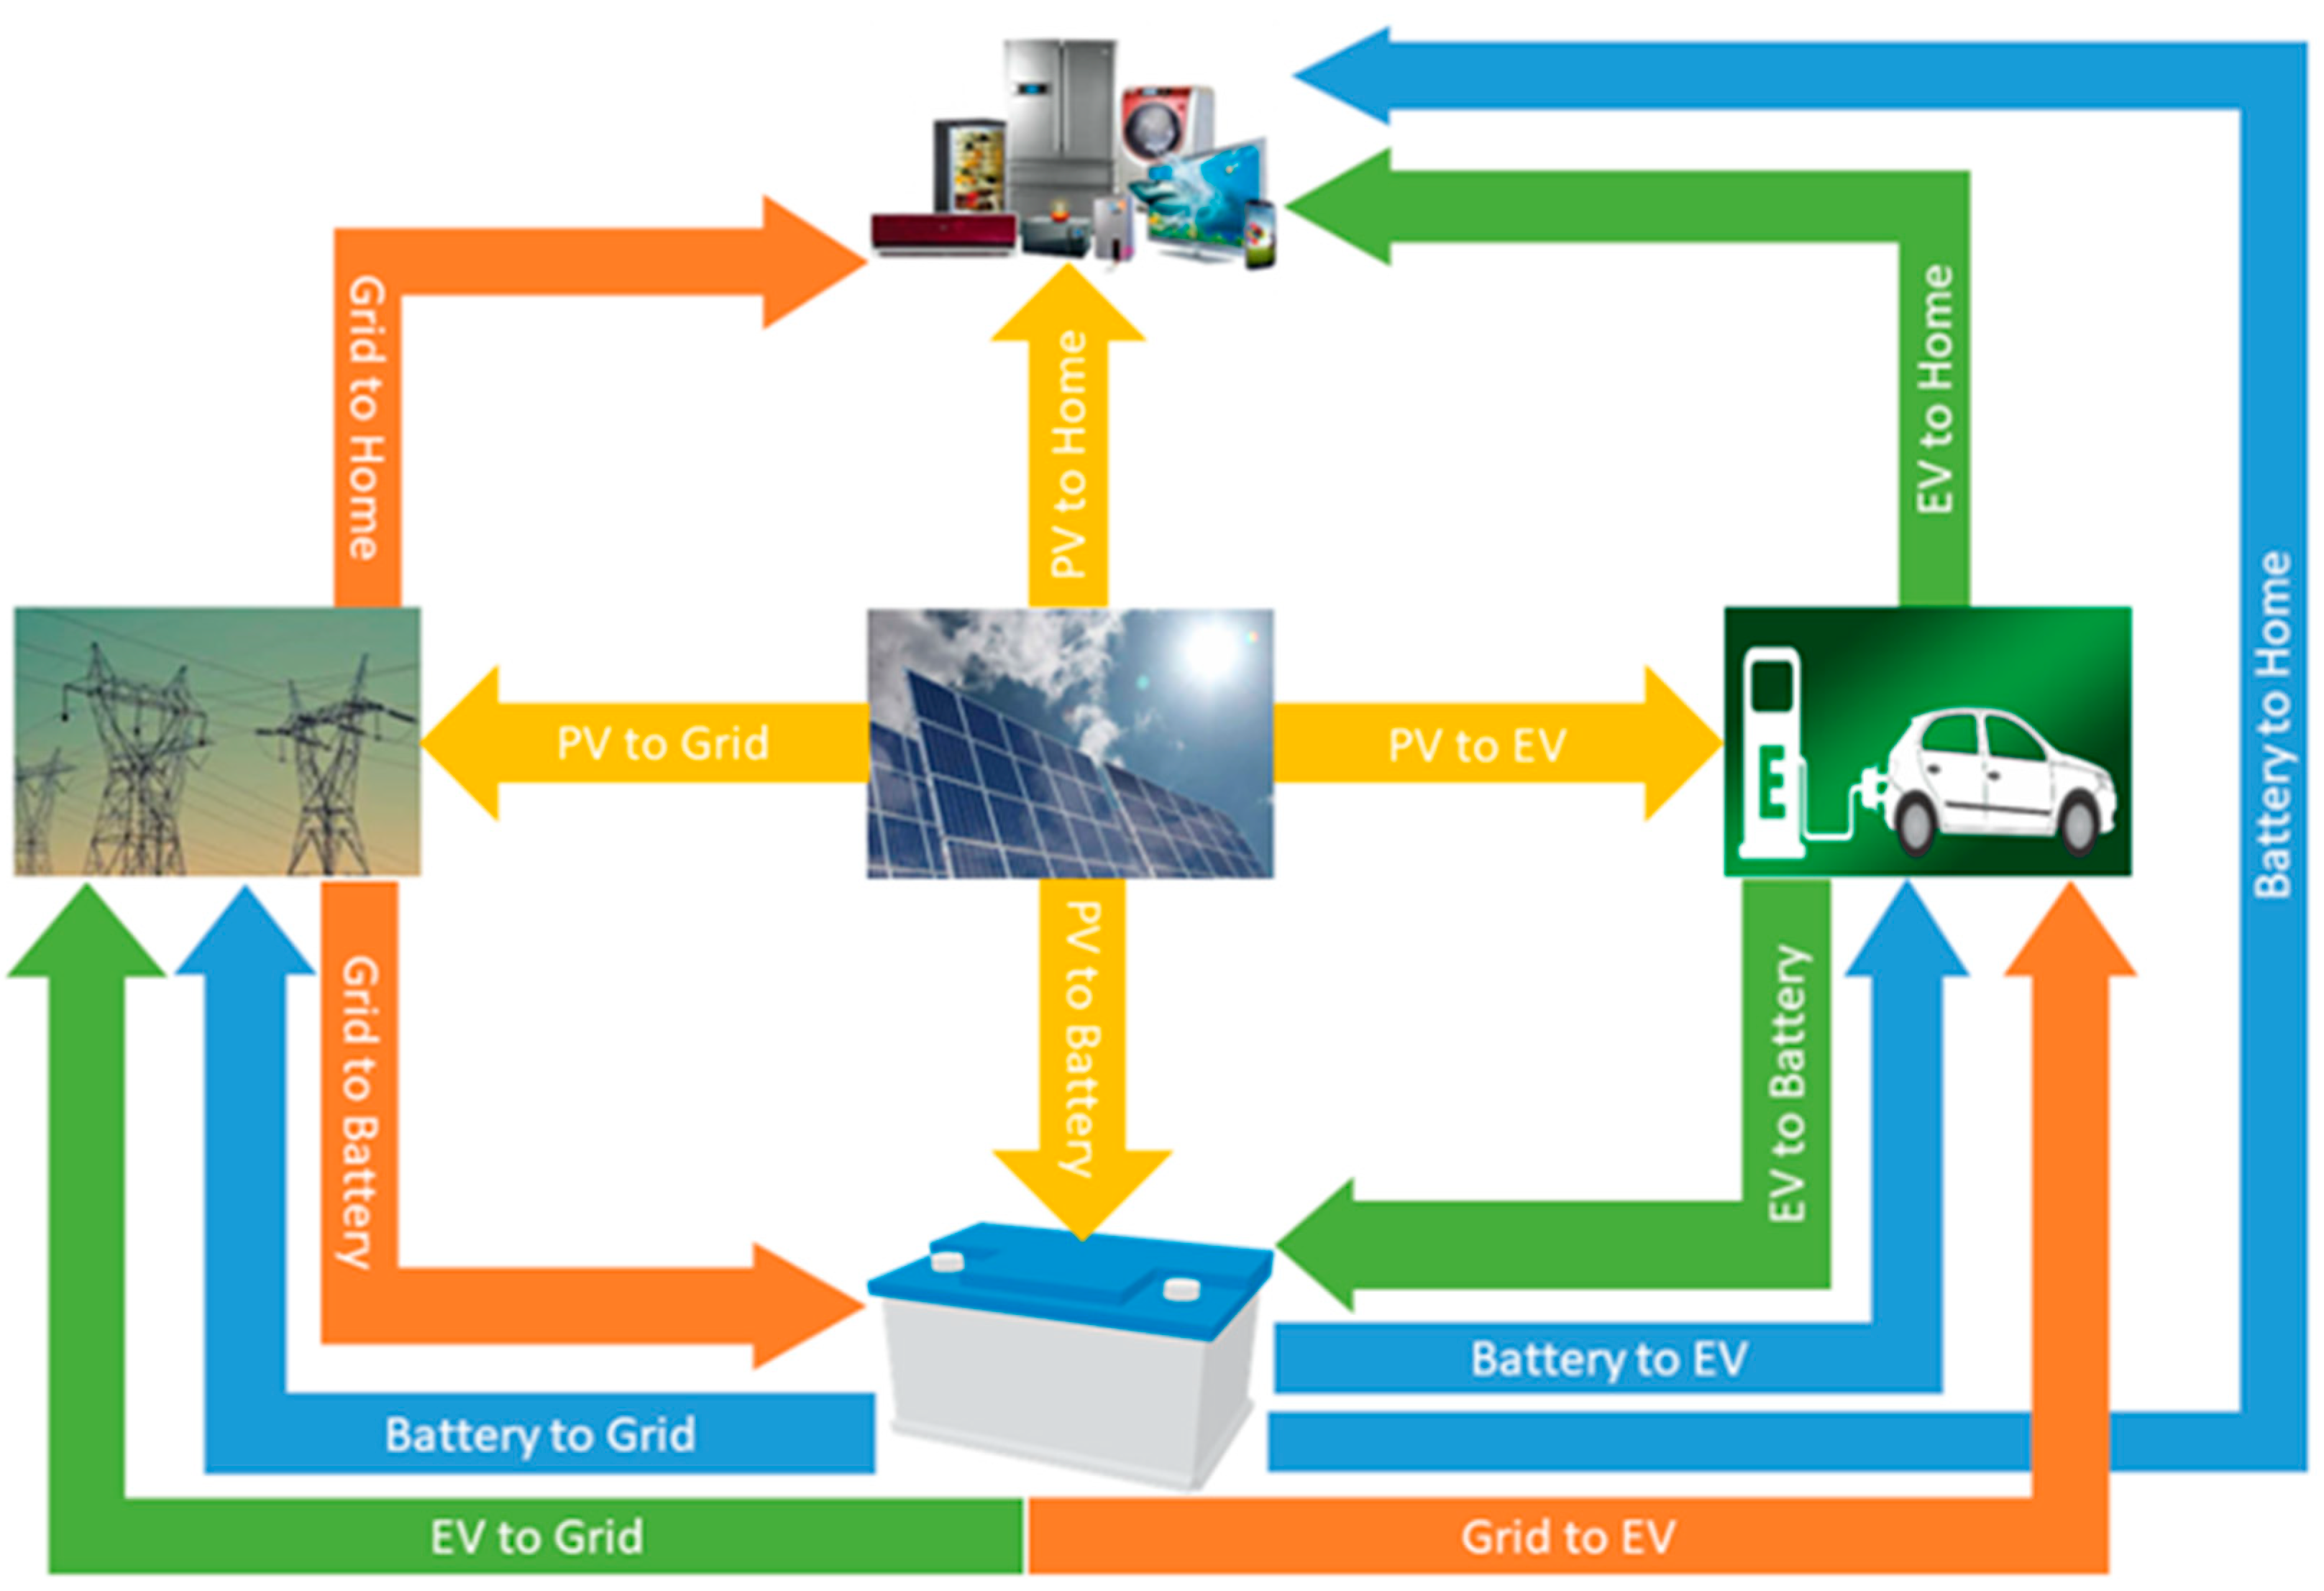
The possibilities of energy exchange are as follows: EV to grid (EV2G), EV to battery (EV2B), EV to home (EV2H), battery to grid (B2G), battery to EV (B2EV), battery to home (B2H), PV system to home (PV2H), PV system to battery (PV2B), PV system to EV (PV2EV), PV system to grid (PV2G), grid to home (G2H), grid to battery (G2B), and grid to EV (G2EV).
2.
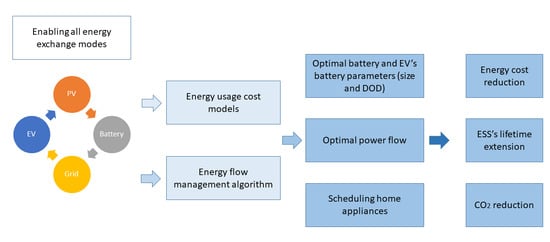
Developing PV, battery, and EV energy usage prices.
3.
Creating an effective energy flow management algorithm.
4.
Optimizing the size and DOD parameters for the battery and EV battery.
5.
Optimizing the operation time of home appliances.
6.
Considering seasonal conditions (winter and summer) in the optimization processes.
7.
Applying the PSO algorithm for solving the previous optimization problems with an interval time of one minute to obtain an accurate solution.
8.
A real case study is considered.

2. Methodology

The methodology section provides insight into the approach taken to accomplish the objectives of this work, and it is outlined as follows:
1.
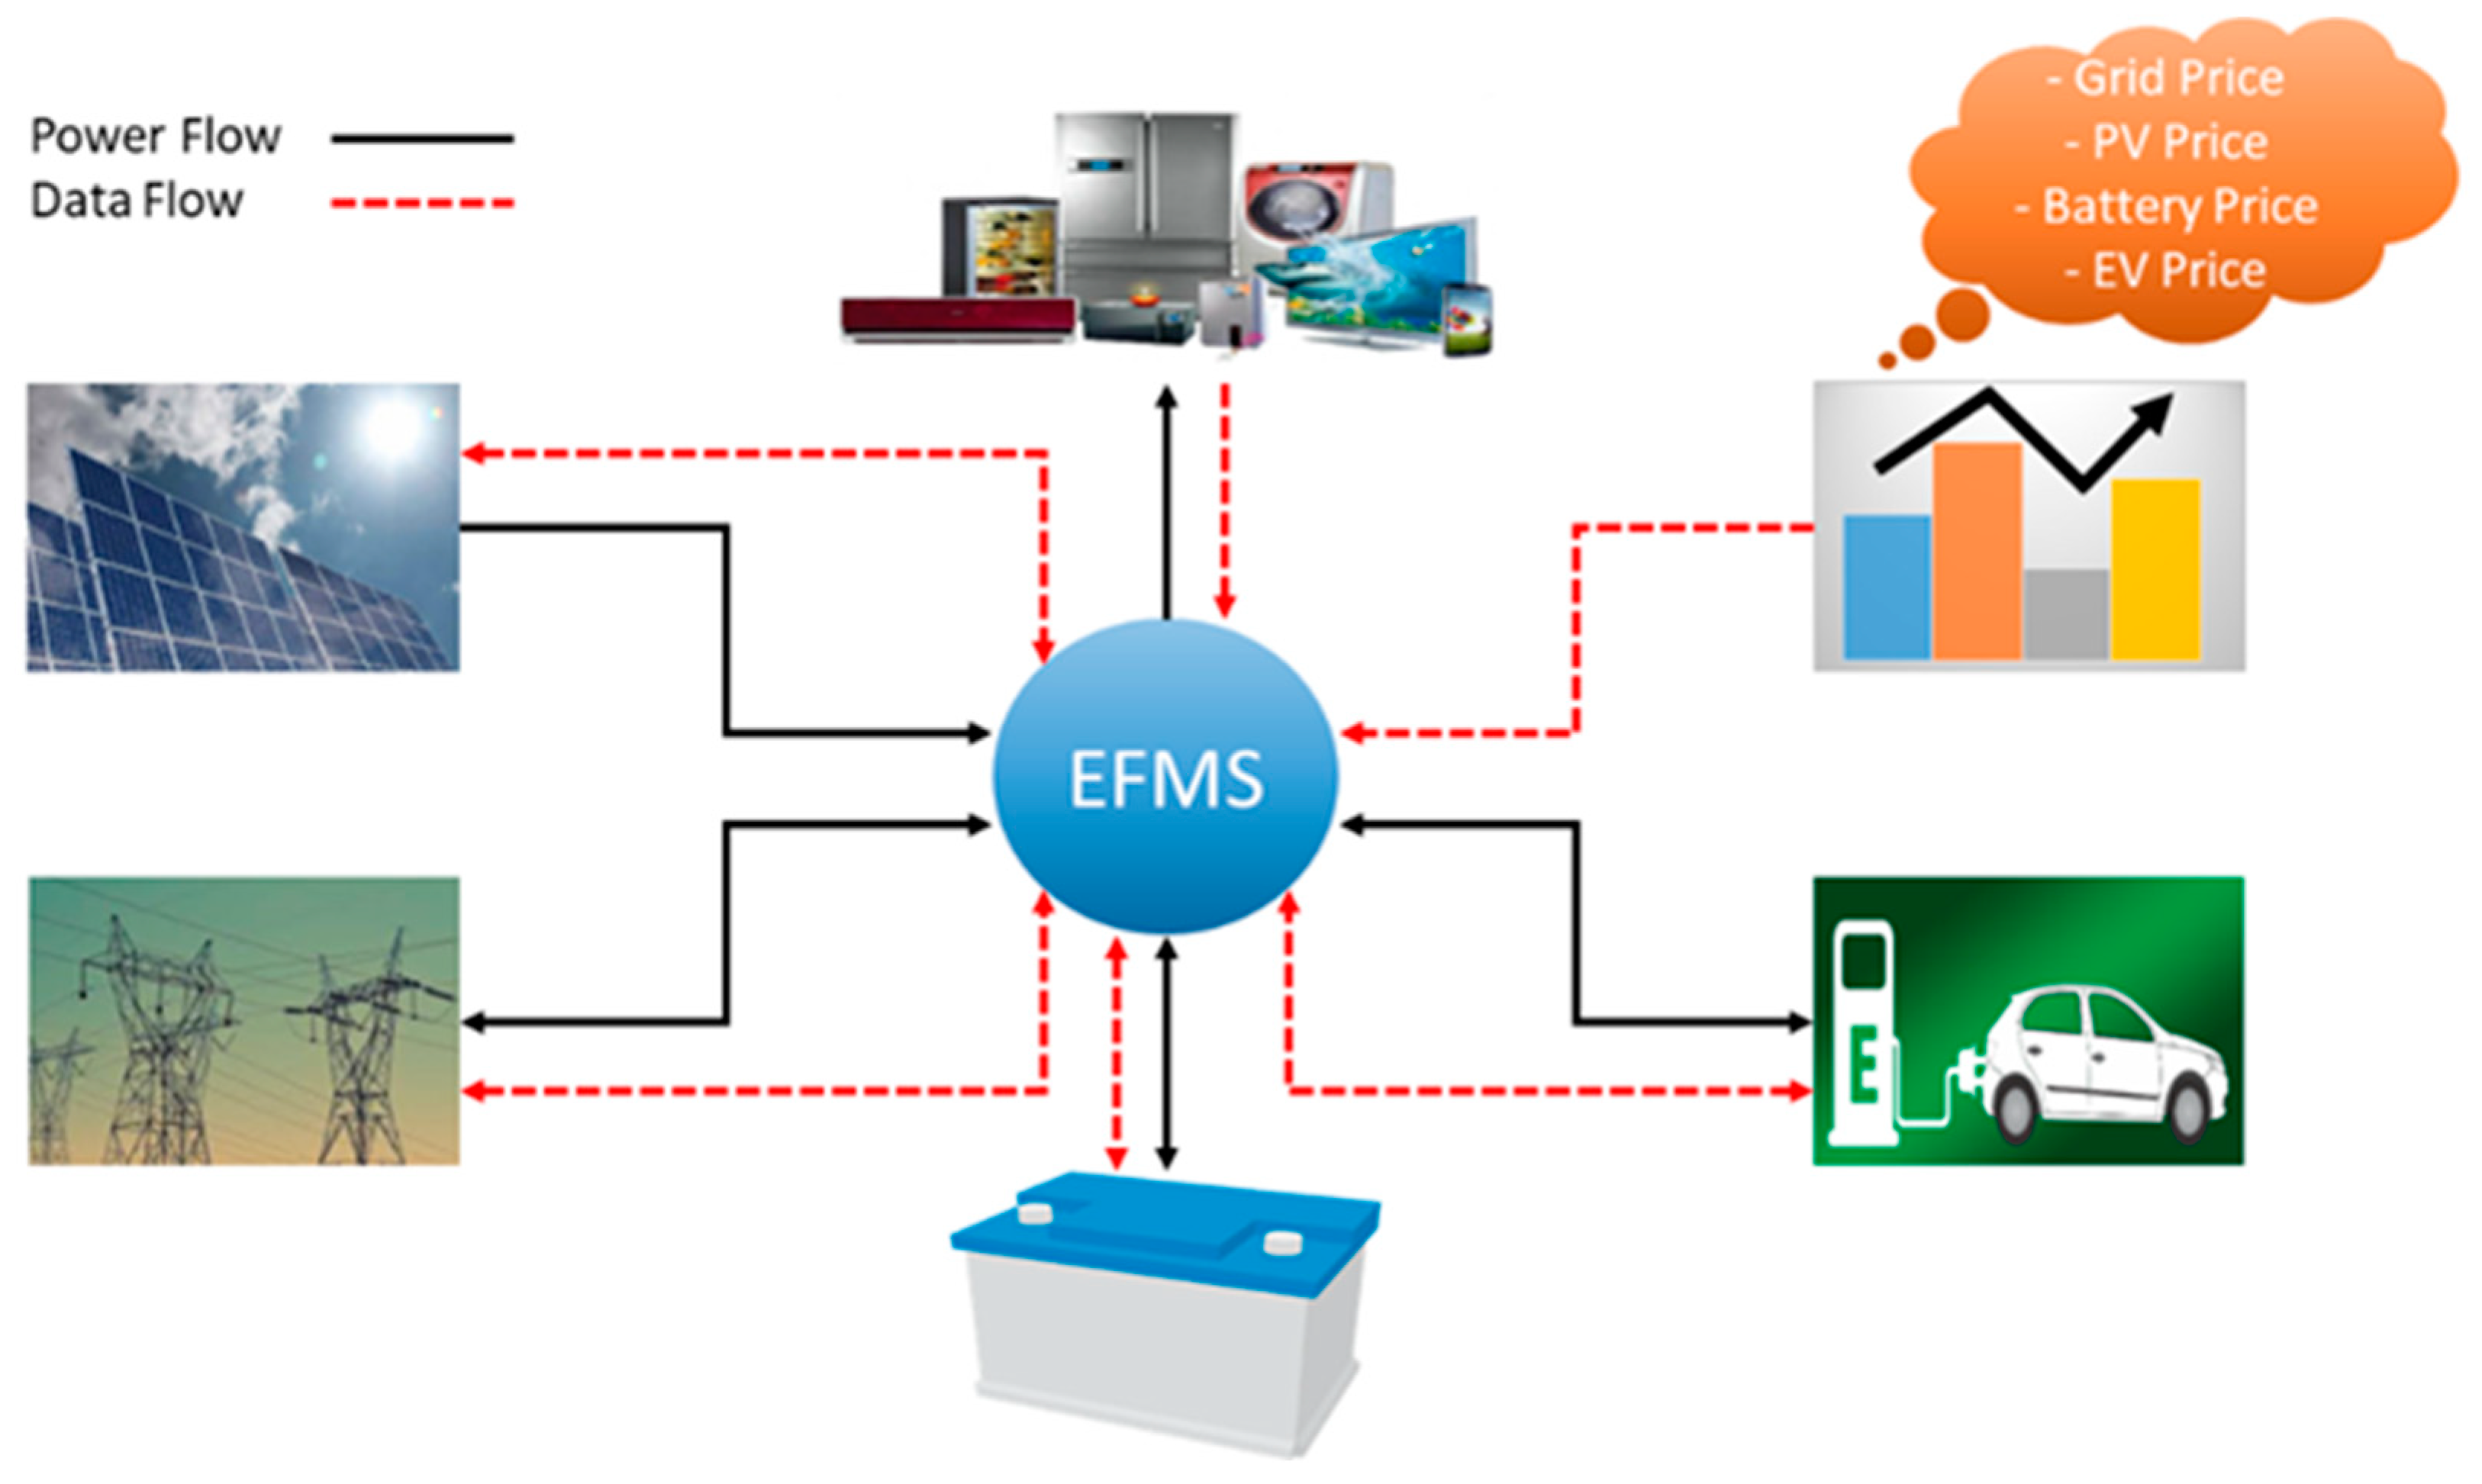
Describing the system configuration and the dynamic process of energy exchange.
2.
Formulating a mathematical model for PV, battery, and EV systems.
3.
Formulating a mathematical model for selling energy to the grid, DOD and lifecycle relationship, PV/battery/EVs ener-gy-usage costs, objective function, and problem constraints.
4.
Developing an algorithm for achieving optimal energy flow.
5.
Developing an optimization strategy for obtaining optimal ESS parameters and scheduling home appliances focusing on one-minute operation intervals.
6.
Selecting and outlining the case study (load profile, solar radiation, temperature, PV–battery–EV integrated system, and the grid’s buying/selling price).
7.
Selection and assessment of sustainability factors, including modeling and running: estimated battery and EV lifespan, CO2 emission intensity, and the integrated energy systems’ contributions throughout their life cycles.

3. Development

3.1. System Architecture

The configuration of the typical grid-connected residential power system is shown in Figure 1. It includes the grid, PV system, battery storage system, EV, and load profile.
The energy flow management system (EFMS) assumes responsibility for the optimal scheduling of power system operation and energy exchange between the system’s components and the grid. The energy management process requires control inputs such as the grid electricity price (buy/sell), PV power generation, EV parameters, battery parameters, and energy demand at each time step. Moreover, the work proposes and introduces the energy usage cost of PV, battery, and EV systems as control inputs. This approach helps to utilize these systems efficiently considering their life cycle and installation costs, thus reducing actual costs, minimizing energy losses, and prolonging the system lifespan.
Figure 2 illustrates the energy exchange process among the system’s agents.

3.2. System Modeling

3.2.1. PV Model

The generated power of PV systems depends on the number and area of solar panels, PV system efficiency, ambient temperature, and solar irradiance. The PV output power is calculated using Equation (1) [36].
P P V t = P S T C I r t I r , S T C ( 1 + γ ( T o ( t ) T S T C ) ) ,
where  P P V t  represents the PV output power (kW) at each time slot t P S T C  is the maximum power of the PV (kW) module in standard test conditions (STCs),  I r t  is the solar irradiance (kW/m2) at each time slot t, and  I r , S T C  is the solar irradiance at STCs (kW/m2).  γ  denotes the temperature coefficient, which is equal to 0.005.  T o ( t )  is the ambient temperature (°C) at each time slot t and  T S T C  represents the reference temperature at STCs (25 °C).

3.2.2. Battery Model

The battery’s energy varies at each time slot t, determined by its charging or discharging status. The charging process includes charging the battery from the PV system, EV, and grid. The discharging process includes discharging the battery to the home, EV, and grid. The instantaneous energy in the battery is calculated as follows:
E B t + 1 = E B t + P B c h t μ t P B d i s t μ t ,
P B c h t = P p v t b t + P e v t b t + P g t b t ,
P B d i s t = P b t h t + P b t e v t + P b t g t ,
where  E B t + 1  expresses the energy stored in the battery (kWh) at t + 1,  E B t  represents the energy stored in the battery (kWh) at t P B c h t  and  P B d i s t  define the amounts of charging/discharging power to/from the battery (kW) at each time slot t, respectively.  μ  is the converter charging/discharging efficiency, assumed to be 0.95, and  t  is the simulation time (equal to 1 divided by 60).  P p v t b t  and  P e v t b t  represent the amounts of power sent from the PV system and EV to the battery (kW) at each time slot t, respectively, and  P g t b t  is the amount of power imported from the grid for charging the battery (kW) at each time slot t P b t h t  and  P b t e v t  express the power discharged from the battery to the home and EV (kW) at each time slot t, respectively.  P b t g t  is the amount of power exported from the battery to the grid (kW) at each time slot t.

3.2.3. EV Model

The EV battery can be used as a storage energy system to store and provide electrical energy, where many EV key features can be employed in a smart grid environment. Similar to the battery storage system, the EV battery energy varies according to the charging/discharging processes. In particular, the charging process involves charging the EV from the PV system, battery, and grid, while the discharging process involves discharging the EV to the home, battery, grid, and energy consumed during the EV trip distance. The instantaneous energy in the EV battery is calculated using Equation (5), and the charged/discharged power are calculated using Equations (6) and (7), respectively. The required energy for the EV trip  E V t r i p  (kWh) is calculated using Equation (8) [37].
E E V t + 1 = E E V t + P E V c h t μ t P E V d i s t μ t E V t r i p ,
P E V c h t = P p v t e v t + P b t e v t + P g t e v t ,
P E V d i s t = P e v t h t + P e v t b t + P e v g t ,
E V t r i p = μ d r i v i n g D ,
where  E E V t + 1  expresses the energy stored in the EV battery (kWh) at t + 1, and  E E V t  is the energy stored in the EV battery (kWh) at t P E V c h t P E V d i s t  define the charging/discharging power to/from the EV battery (kW) at each time slot t, respectively.  P p v t e v t  and  P b t e v t  are the amounts of power sent from the PV system and battery to the EV battery (kW) at each time slot t, respectively, and  P g t e v t  is the power imported from the grid for charging the EV battery (kW) at each time slot t P e v t h t  and  P e v t b t  express the power discharged from the EV battery to the home and battery (kW) at each time slot t, respectively.  P e v t g t  is the power exported from the EV battery to the grid (kW) at each time slot t μ d r i v i n g  is the vehicle efficiency (kWh/km), and  D  represents the vehicle travel distance (km).

3.2.4. Home Appliance Model

For load scheduling, the home appliances are classified into shifted and fixed appliances. The shifted appliances are scheduled based on many factors such as energy prices, PV power generation, instantaneous battery energy, and EV availability. Equation (9) expresses the operation model of the shifted appliances.
E s h t = S = 1 X P r a t e d S O P S ( t ) t ,
where  E s h t  is the energy consumption of the shifted appliances (kWh) at each time slot t S  is the set of shifted appliances ranging (1, 2, 3, …, X),  P r a t e d s h  is the rated power of each shifted appliance (kW), and  O P S  is the ON/OFF variable that expresses the shifted appliances’ operation status (0 or 1) at each time slot t.

3.3. Problem Formulation

3.3.1. PV Energy Usage Price

The levelized cost of energy (LCOE) is the cost of generating energy from an energy system over its lifespan, considering the planning, initial investment, operation, maintenance costs, construction, and cost of capital [38,39]. LCOE expresses the price of generated energy, and the U.S. Department of Energy (DOE) selected it as a primary metric for assessing the PV system [40]. The LCOE of PV systems in the Spanish residential sector was found to be equal to 0.092 EUR/kWh [11]. In this work, the LCOE expressed the cost of using PV energy in the residential sector, while Equation (10) calculates the cost of using the PV energy (EUR/kWh) at each time slot t. The LCOE of the PV system is introduced into the optimization problem to utilize the PV power generated efficiently.
C P V t = L C O E p v P p v t h t t ,
where  C P V t  is the cost of using PV energy to cover the load (EUR) at each time slot t L C O E p v  expresses the PV energy usage price (EUR/kWh) at each time slot t, and  P p v t h t  represents the power (kW) sent from the PV system to the load at each time slot t.

3.3.2. Battery Energy Usage Price

Batteries play a crucial role in system balance and reducing electricity costs by storing energy in the cases of RES excess energy and during the low-price periods of the grid to fulfill the energy demand in the cases of shortages of RES energy and high-price periods. Moreover, batteries can be used to charge EVs. However, batteries have installation costs, such as battery, infrastructure, and power of balance costs [41,42]. The capital cost of the battery can be calculated using Equation (11) [27,42].
B c a p i t a l = C U n i t E b a t t + C B O P E b a t t + C P C S P B ,
where  B c a p i t a l  is the capital cost of the battery system (EUR),  C U n i t  is the cost of the battery per unit (EUR/kWh).  C B O P  expresses the infrastructure cost of the battery system (EUR/kWh), and  C P C S  expresses the power conversion system cost (EUR/kW). The  C B O P  and  C P C S  were assumed to be 33.868/kWh and 24.695/kWh, respectively [42,43].  E b a t t  represents the battery capacity (kWh) and  P B  expresses the battery-rated power (kW).
Manufacturers provide a data sheet for each product showing the specifications and the operation conditions. For batteries, manufacturers provide information such as the expected number of battery life cycles  n  at a specific depth of discharge  D O D . These two parameters are more relevant to consider to operate the battery effectively. The LCOS is the investment cost divided by amount of energy stored in the storage system during its life cycle. The present study uses the LCOS to calculate and express the cost of storing and discharging energy during the battery lifespan. Considering this, the cost of storing and discharging energy during the battery lifespan in the units of (EUR/kWh) can be calculated based on the capital cost,  E b a t t n , and  D O D . The expected amount of charged/discharged energy to/from the battery  B E l i f e s p a n  (kWh) during its lifespan can be calculated using Equation (12). The cost of using the battery throughout its lifespan, which is presented as  B L C O S  (EUR/kWh) can be calculated using Equation (13).
B E l i f e s p a n = E b a t t n D O D ,
B L C O S = B c a p i t a l B E l i f e s p a n ,
The term “battery energy usage price” refers to the price associated with using the energy stored in a battery. This cost can vary depending on various factors and contexts, such as the battery specifications, the battery capital cost, the cost of energy purchased from the grid and RES, the cost of charging the battery from the EVs, LCOS, and the charging/discharging process (time and amount). In regards to this, we designed a price model for battery energy usage that expresses the battery price for each time slot t. Hence, the battery can be used efficiently. Equations (14)–(16) are used to calculate the cost of purchased energy from the PV system, grid, and EV, respectively, including the storage cost of the purchased energy in a battery.
C p v t b t = [ ( P p v t b t L C O E p v ) + ( ( P p v t b t B L C O S ) ] t ,
C g t b t = [ ( P g t b t G r i d p r i c e b u y t ) ] + P g t b t B L C O S ] t ,
C e v t b t = [ ( P e v t b t E V p r i c e o v e r a l l t ) ] + P e v t b t B L C O S ] t ,
where  C p v t b t C g t b t , and  C e v t b t  are the costs of purchased energy from the PV system, grid, and EV and the cost of the energy stored in the battery (EUR), respectively, at each time slot t G r i d p r i c e b u y t  expresses the grid price (EUR/kWh) at each time slot t E V p r i c e o v e r a l l t  represents the EV energy usage price (EUR/kWh) at each time slot t, which is calculated in the next section.
Then, the price of the total purchased energy  B p r i c e c h . ( t )  from the PV system, grid, and EV, which is stored in the battery (EUR/kWh), at each time slot t can be expressed in units of (EUR/kWh) using Equation (19); this is achieved by dividing the total cost of the purchased energy by the total purchased energy. Equation (17) calculates the total cost, while Equation (18) calculates the total purchased energy at each time slot t.
T b c o s t t = C p v t b t + C g t b t + C e v t b t ,
T b e n e r g y ( t ) = [ P p v t b t + P g t b t + P e v t b t ] t ,
B p r i c e c h . ( t ) = T b c o s t t T b e n e r g y ( t ) ,
where  T b c o s t t  is the total cost of the purchased energy stored in the battery (EUR) at each time slot t, and  T b e n e r g y ( t )  represents the total purchased energy stored in the battery (kWh) at each time slot t.
The newly purchased energy that charged the battery will be added to the previous battery’s net energy. The newly purchased energy price will be factored into the overall battery energy usage price. Consequently, a fresh battery energy usage price for the next time slot t + 1 will be established, considering the updated quantity and price of the purchased energy in addition to the previous battery’s net power and its associated price. Equation (20) is used to calculate the battery energy usage price, while Equation (21) expresses the cost of battery energy usage in the home  C b a t t t  (EUR) at each time slot t.
B p r i c e o v e r a l l t + 1 = B p r i c e o v e r a l l t E B ( t ) + ( B p r i c e c h . t T b e n e r g y ( t ) ) E B ( t ) + T b e n e r g y ( t ) ,
C b a t t t = B p r i c e o v e r a l l t P b t h t t ,
where  B p r i c e o v e r a l l t + 1  is the battery energy usage price (EUR/kWh) for the time slot t + 1.  B p r i c e o v e r a l l t  is the battery energy usage price (EUR/kWh) in the time slot t.

3.3.3. EV Battery Energy Usage Price

Electric vehicles are crucial in reducing CO2 emissions, saving energy, and grid stability. Having an EV at home offers homeowners financial savings, convenience, environmental benefits, and the potential for energy management and backup power. However, the cost of replacing the EV battery and its life cycle should be considered to ensure efficient EV battery operation. The cost of using the EV battery  E V L C O S  (EUR/kWh) during its lifespan is calculated using Equation (22).
E V L C O S = E V c a p i t a l N E e v n e v D O D e v ,
where  E V c a p i t a l  represents the replacement cost of the EV battery (EUR),  E V L C O S  signifies the cost of using the EV battery throughout its lifespan (EUR/kWh), and  N E e v  quantifies the nominal energy of the EV battery (kWh).  n e v  corresponds to the number of charging/discharging cycles of the EV battery at a specific depth of discharge denoted as  D O D e v .
In the proposed model, the EV can exchange energy with the load, battery, and grid. Thus, it is necessary to manage the operation time of the EV efficiently. Firstly, the cost of purchasing energy from PV, battery, and the grid is calculated using Equations (23)–(25). In contrast, Equations (26)–(28) are used to calculate the price of the total purchased energy stored in the EV battery.
C p v t e v t = [ ( P p v t e v t L C O E p v ) + ( ( P p v e v t E V L C O S ) ] t ,
C g t e v t = [ ( P g t e v t G r i d p r i c e b u y t ) ] + P g t e v t E V L C O S ] t ,
C b t e v t = [ ( P b t e v t B p r i c e o v e r a l l p r i c e t ) + P b t e v t E V L C O S ] t ,
T e v c o s t t = C p v t e v t + C g t e v t + C b t e v t ,
T e v e n e r g y ( t ) = [ P p v t e v t + P g t e v t + P e v t b t ] t ,
E V p r i c e c h . ( t ) = T e v c o s t t T e v e n e r g y ( t ) ,
where  C p v t e v t C g t e v t , and  C b t e v t  are the cost of purchased energy from the PV, grid, and battery and the cost of the energy stored in the EV battery (EUR), respectively, at each time slot t E V p r i c e c h . ( t )  is the price of the total purchased energy from the PV, grid, and battery, which is stored in the EV battery (EUR/kWh) at each time slot t and can be expressed in the unit (EUR/kWh).  T e v c o s t t  is the total cost of the purchased energy and stored energy in the EV battery (EUR) at each time slot t, and  T e v e n e r g y ( t )  is the total purchased energy and stored energy in the EV battery (kWh) at each time slot t.
Then, the purchased energy for recharging the EV battery is integrated with the existing net energy of the EV battery. The cost of the newly charged energy is then factored into the comprehensive calculation of the price of the EV battery energy usage. As a result, the energy usage price for the EV battery for the next time slot t + 1 is determined, considering the updated quantity and cost of the purchased energy, along with the net power of the previous EV battery and its associated price. Equation (29) is the designated formula for calculating the price of the EV battery energy usage. Equation (30) expresses the cost of the EV battery energy usage in the home  C E V t  (EUR) at each time slot t.
E V p r i c e o v e r a l l t + 1 = E V p r i c e o v e r a l l t E V B t + ( E V p r i c e c h . t T e v e n e r g y ( t ) ) E V B t + T e v e n e r g y ( t ) ,
C E V t = E V p r i c e o v e r a l l t P e v t h t t ,
where  E V p r i c e o v e r a l l t + 1  is the EV battery energy usage price (EUR/kWh) for the time slot t + 1.  E V p r i c e o v e r a l l t  is the EV battery energy usage price (EUR/kWh) in the time slot t.

3.3.4. Selling Energy to the Grid

The profitability model hinges on a comprehensive analysis of PV, battery, EV, and grid energy usage prices to optimize energy selling to the grid. This holistic approach ensures efficient energy management while factoring in installation costs and system life cycle. Equations (31)–(33) calculate the net profit of selling energy from the PV, battery, and EV systems to the grid considering the integrated system installation cost and lifespan. Equation (34) calculates the total net profit  P r o f i t S e l l t  of selling energy from the integrated system to the grid (EUR).
P r o f i t p v t g ( t ) = ( P p v t g t ( G r i d s e l l t L C O E p v ) ) t ,
P r o f i t b t g t = ( P b t g t ( G r i d s e l l t B p r i c e o v e r a l l t ) ) t ,
P r o f i t e v t g t = ( P e v t g t ( G r i d s e l l t E V p r i c e o v e r a l l t ) ) t ,
P r o f i t S e l l t = P r o f i t p v t g t + P r o f i t b t g t + P r o f i t e v t g t ,
where  P r o f i t p v t g ( t )  and  P r o f i t b t g t  are the financial gains (EUR) from exporting energy to the main grid from the solar and battery systems, respectively, at each time slot t, respectively.  P r o f i t e v t g t  is the financial gain from exporting EV battery energy back to the main grid (EUR) at each time slot t P p v t g t  is the quantity of solar power exported to the grid (kW) at each time slot t, and  G r i d s e l l t  denotes the grid price for selling energy (EUR/kWh) at each time slot t.

3.3.5. Depth of Discharge and Life Cycle Relationship

The battery life is influenced by several factors, such as average SOC, DOD, temperature, and battery chemistry. This work focused on determining the optimal value of DOD, thereby adjusting the optimal range of the battery’s SOC. DOD determines the extent to which the stored energy in the ESS is utilized, directly affecting the system’s performance and life cycle [16]. The DOD has an inverse relationship with the life cycle for ESSs, the more DOD increases, the more life cycle decreases [44]. Consequently, this study aims to optimize the DOD for the ESS to obtain the optimal ESS life cycle to gain maximum financial benefit compared to the investment costs through their life cycle. Equation (35) expresses the relationship between the DOD and the life cycle for lithium-ion batteries [45].
N c y c l e , E S S = a D O D b ,
where  N c y c l e , E S S  means the ESS life cycle at a specific DOD, while the parameters  a  and  b  were simulated as 4000 and −1.632, respectively [45].

3.3.6. Objective Function

The main objective function of this study is to achieve an optimal HEMS that minimizes the total cost of electricity while reducing energy losses and ensuring an extended lifespan for the integrated system. Equation (36) shows the objective function comprising five parts. The first part is the cost of power purchased from the grid for home use, as determined by Equation (37). The second and third parts are the daily PV and battery energy usage costs for home consumption, respectively. The fourth part is the cost of using the EV battery energy in the home to meet home energy demand. The fifth part is the cost of using the EV battery energy for traveling, as formulated in Equation (38). The sixth part calculates the total daily profit from selling excess power back to the grid from the integrated system.
M i n i m i z e C o s t = M i n 1 1440 C G r i d t + C P V t + C B a t t t + C E V t + C T r i p t P r o f i t S e l l t ,
C G r i d t = P g t h t G r i d p r i c e b u y t t ,
C T r i p t = E V t r i p t E V p r i c e o v e r a l l t t ,
where  C G r i d t  means the cost of grid energy usage for the vehicle trip (EUR) at each time slot t P g t h t  represents the power sent from the grid to the home (kW) at each time slot t, and  C T r i p t  represents the cost of EV energy usage cost for the vehicle trip (EUR) at each time slot t.

3.3.7. Constraints

In the modeling process, constraints serve as essential parameters that define the boundaries and limitations within which the system operates. These restrictions are pivotal in shaping the behavior and outcomes of the model, ensuring that it aligns with real-world systems. For the PV system, the sum of PV power supplied for home use, charging the battery and the EV, and exporting to the grid should equal the total PV power generated. Therefore, Equation (39) is modeled for this purpose.
P p v t h t + P p v t b t + P p v t e v t + P p v t g t = P P V t ,
For the battery system, the SoC is a percentage value representing how much electrical energy a battery currently holds, expressed as a percentage of its total capacity, as described in Equation (40). To avoid deep charging/discharging and ensure that the battery operates within the minimum and maximum allowable capacity, Equation (41) was introduced as a constraint. Furthermore, the battery has other constraints regarding the maximum battery charging/discharging powers during each period; consequently, Equations (42) and (43) are established to address these constraints.
S o C   t B = E b ( t ) E b a t t ,
S o C m i n S o C   t B S o C m a x ,
0 P B c h t t C h B m a x ,
0 P B d i s t t D i s B m a x ,
where  C h B m a x D i s B m a x  represent the maximum charge and discharge rates, respectively, of the battery (kWh) during the time slot t, and these rates are determined by the battery’s characteristics.
Similar to the battery SoC constraint, the SoC for the EV must maintain its SoC within a specified range defined by the maximum and minimum SoC levels, as detailed in Equations (44) and (45). Moreover, the EV battery has specific limitations concerning its maximum charging and discharging powers during each interval. To address this, we introduced Equations (46) and (47).
S o C   t E V = E E V ( t ) N E e v ,
S o C m i n S o C   t E V S o C m i n ,
0 P E V c h t t C h E V m a x ,
0 P E V d i s t t D i s E V m a x ,
where  C h E V m a x  represents the maximum charge rate of the EV battery (kWh) during the time slot t, and  D i s E V m a x  is the maximum discharge rate of the EV battery (kWh) during the time slot t, which is determined by the characteristics of the EV battery.
For power balance, the total supplied power from the PV system, battery, EV, and grid should meet the home load  P l t  (kW) at each time slot t. For this purpose, the following constraint is set.
P p v t h t + P b t h t + P e v t h t + P g t h t = P l t ,
Moreover, to ensure the optimal performance of ESSs during the life cycle, it is necessary to avoid simultaneous charging and discharging. This objective is accomplished by incorporating constraints as specified in Equations (49) and (50).
P B c h t P B d i s t = 0 ,
P E V c h t P E V d i s t = 0 ,

3.4. Energy Flow Management Algorithm Development

In Figure 3, the EFMS algorithm (EFMSA) is illustrated. This algorithm is designed for optimal energy utilization, considering the PV system, battery, and EV life cycles, and ensuring efficient use. Initially, the PV system powers household appliances. During periods of excess PV generation, EFMSA evaluates the economic benefits of storing PV surplus energy in the battery or EV for utilization during high-priced grid periods versus selling it to the grid. If storing PV surplus energy in the battery or EV proves more economically advantageous, EFMSA determines the optimal choice based on the lowest LCOS of the battery and EV. Otherwise, if selling the PV surplus energy to the grid is more beneficial, EFMSA opts for this alternative.
When PV generation falls short of the load, the EFMSA assesses the PV, battery, and grid energy usage price to determine the best viable option. If the battery price is the lowest, the EFMSA prioritizes the battery to fulfill the remaining consumption. If the battery cannot cover the remaining consumption, the EFMSA selects either the EV or grid based on the lowest energy usage price to assist the PV system and battery to meet the energy demand. If the EV energy usage price is the lowest, the EFMSA prioritizes the EV to meet the energy demand. However, if the EV cannot cover the remaining consumption, the EFMSA chooses between the battery and grid based on the lowest energy usage price to assist the PV system and EV in meeting the energy demand. If the grid energy usage price is the lowest, the EFMSA gives priority to the grid to meet the energy demand.
The EFMSA ensures efficient battery and EV charging/discharging from/to the grid, considering the life cycle and economic considerations. During potential charging periods, EFMSA evaluates whether storing energy is cost-effective compared to the grid’s high prices; if so, it proceeds with charging the battery/EV. Otherwise, if the economic benefit of selling battery/EV energy to the grid outweighs discharging it to cover the load during high-priced periods, EFMSA opts for selling the energy to the grid. Otherwise, the battery/EV remains uncharged or undischarged. In the context of energy exchange between the battery and EV, the EFMSA ensures an efficient process. During potential charging periods, the EFMSA evaluates whether charging the battery from the EV is cost-effective for discharging this energy from the battery during the grid’s high prices and absence of the EV; if so, it proceeds with charging the battery from the EV. Similarly, for charging the EV from the battery, the EFMSA evaluates whether charging the EV from the battery is cost-effective for using this energy in the vehicle trip rather than later in the grid’s high price periods and rather than charging the EV from the grid. Moreover, before each trip, the EFMSA ensures that the EV has sufficient energy for the upcoming trip. It is worth noting that, in this work, the energy flow prioritization varies from period to period based on grid, battery, PV, and EV energy usage prices.

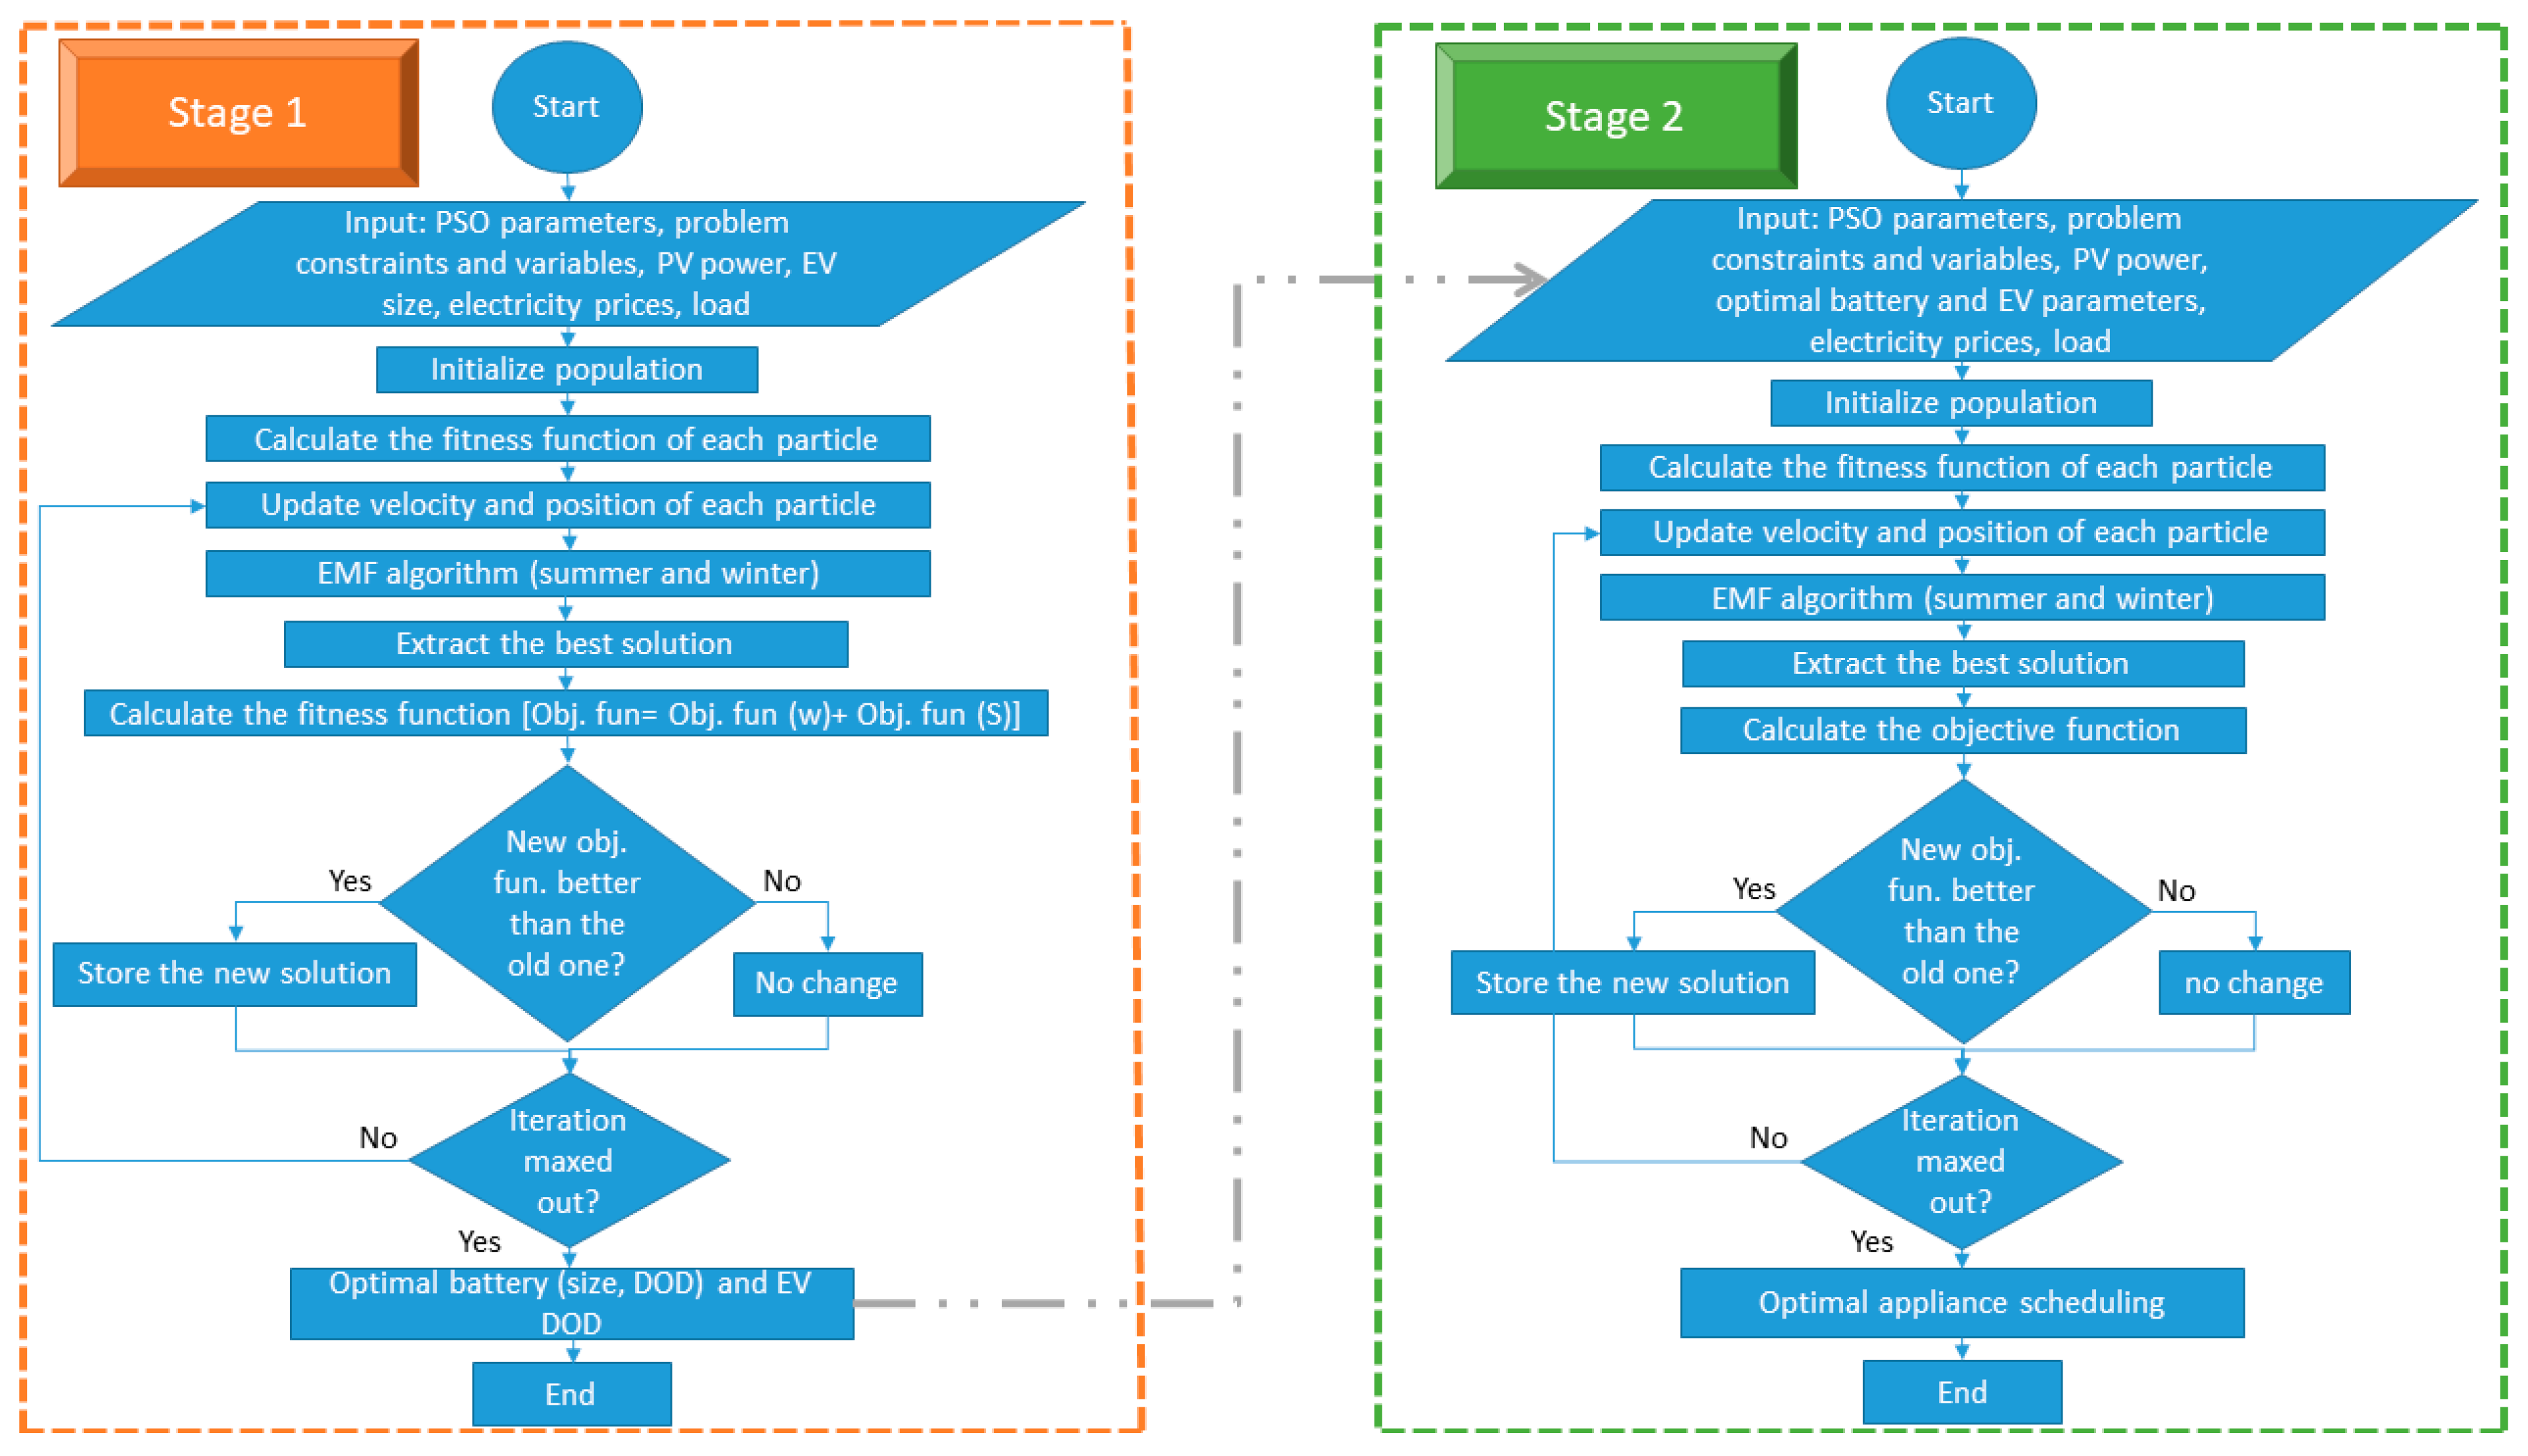
3.5. Optimization Strategy

PSO has demonstrated remarkable efficacy in yielding favorable outcomes in various optimization tasks [46]. Its inherent capacity to mimic social behavior and swarm intelligence enables it to navigate solution spaces effectively and converge toward optimal results. PSO’s ability to balance exploration and exploitation enables the identification of solutions that achieve the optimal objective function while considering diverse constraints. In addition, the iterative nature of PSO ensures continual refinement, allowing it to converge toward solutions that align with the specified optimization goals [47]. PSO stands out as a robust algorithm in the realm of home energy management, especially household appliance scheduling [21,48,49,50]. As a result, the optimal ESS parameters and operation time matrix of each appliance for this study are computed using PSO, as described in Figure 4.
The optimization process of this study consists of two key stages. The first stage optimizes the battery’s size and DOD and the EV battery’s DOD, while the second stage optimizes the operation time of controllable appliances. The main goal of the proposed strategy is to reduce the energy cost considering the investment cost of the integrated energy system and its life cycle, where the objective function in Equation (36) is set for both stages, to obtain optimal parameters for the battery and the EV battery and optimal load scheduling, resulting in accomplishing the main goal.
The first stage considers seasonal factors such as the summer and winter conditions for selecting the optimal parameters. Therefore, one value of each parameter appropriate for both seasons’ conditions in terms of the objective function is obtained, which is about getting the minimum summation of the energy cost for winter and summer. The optimal values are used in Section 3.3.2 and Section 3.3.3 to calculate the LCOS of the battery and the EV battery, which are directly linked to the energy usage cost models of the battery and the EV battery that are introduced into the objective function in Equation (36). Following the determination of optimal parameters for the ESSs in the first stage of optimization, the study progresses to the second optimization stage. In the second stage, the previously identified optimal parameters serve as inputs for scheduling household appliance operation times. The primary objective of this stage is to achieve the minimum energy cost by strategically managing the operation time of household appliances, contributing to the overall efficiency and cost-effectiveness of the integrated system.

3.6. Case Study

The home energy consumption and user preference of a home in Spain are used as a case study obtained from previous work by Al Muala et al. [21]. A PV system of 1.125 kWp in size is used [51], where the solar radiation data and temperature were collected from the database of PVGIS 5.2 and Open-Meteo, respectively [52,53]. Figure 5 illustrates the daily power demand, along with the PV power generation and grid prices on both winter and summer days [54,55].
For the optimization process of ESS parameters, three battery systems with capacities of 2.4 kWh, 3.6 kWh, and 4.8 kWh were considered, along with varying DOD levels (ranging from 50% to 100% in 10% increments). The data and prices for these batteries were sourced from [56]. In addition, a Kia e-Niro was selected as an EV with a 64 kWh battery capacity (7.2 kW charger) and an efficiency of 171 Wh/km. The data and the battery replacement cost (EUR/kWh) of the EV were obtained from [57,58,59]. The daily EV trip was divided into two intervals: the first, from 8 a.m. to 12 p.m., with a distance of 34 km, and the second trip, from 3 p.m. to 6 p.m., with a distance of 48 km.

3.7. Sustainability Factors Analysis

3.7.1. ESS Lifetime

This study significantly emphasizes extending the batteries’ lifespan in conjunction with maximum benefits, a goal tied to the count of charge/discharge cycles [41]. Throughout its operational life, each battery undergoes a series of cycles. A cycle is a process wherein the battery is charged to full capacity and discharged to empty. This process can occur in a single continuous interval or intermittently at irregular intervals. Equations (51) and (52) are used to calculate the expected lifetime of the ESSs (battery and EVs).
E S S d a y c y c l e s = 1 1440 P E S S c h ( t ) t + 1 1440 P E S S d i s t t E E S S ,
E S S l i f e = N c y c l e , E S S E S S d a y c y c l e s d y ,
where  E S S d a y c y c l e s  means the number of charging/discharging cycles throughout the day of ESS, whether for battery or EV.  P E S S c h ( t )  and  P E S S d i s t  are the charged/discharged power to/from the ESS (kWh) at each time slot t, respectively.  E E S S  represents the nominal energy of the ESS (kWh),  E S S l i f e  denotes the expected ESS lifetime (years),  N c y c l e , E S S  represents the number of ESS cycles, which is calculated using Equation (35), and  d y  represents the total days within a year.

3.7.2. CO2 Emissions

Moving towards local RES and implementing efficient HEMSs provides a viable strategy for curbing the adverse environmental and health effects linked to fossil fuel power plants, ultimately leading to a reduction in CO2 emissions. According to the European Environment Agency (EEA), the CO2 emission intensity  I C O 2  directly correlates with electricity generation, which in Spain is estimated to be 0.177 (kgCO2/kWh) in 2020 [60]. Consequently, the CO2 emissions can be calculated using Equation (53).
C O 2 = I C O 2 t = 1 1440 P g t h t + P g t b t + P g t e v t t ,
where  C O 2  is the amount of CO2 emissions produced from the energy consumed in the home (kgCO2) at each time slot t.

3.7.3. The Integrated Energy System Contribution

Implementing sustainable practices involves optimizing the management of energy resources by utilizing them efficiently during their lifetime, which is what our proposed system aims to do. On the other hand, household energy consumers express valid economic concerns when considering the installation of solar panels and batteries. However, consumers often weigh these upfront costs against the potential long-term benefits and return on investment. For that reason, in this study, careful consideration was given to the installation costs associated with the integrated system. We proposed an efficient HEMS to maximize financial benefit throughout its life cycle relative to installation costs.
Equations (54)–(56) calculate the daily contribution of each energy system in reducing the energy cost, whereas Equations (57)–(59) calculate the net contribution during the system’s lifetime. This approach would exemplify a real cost reduction compared to the installation cost, encouraging household energy consumers to install local energy systems and optimize their energy consumption patterns.
P V c o n . = t = 1 1440 ( P p v t h t ( G r i d p r i c e b u y t L C O E p v ) + P p v t g t ( G r i d s e l l t L C O E p v ) ) t ,
B c o n . = t = 1 1440 ( P b t h t G r i d p r i c e b u y t B p r i c e o v e r a l l t + P b t g ( t ) ( G r i d s e l l t B p r i c e o v e r a l l t ) ) t ,
E V c o n . = t = 1 1440 ( P e v t h t G r i d p r i c e b u y t E V p r i c e o v e r a l l t + P e v t g ( t ) ( G r i d s e l l t E V p r i c e o v e r a l l t ) ) t ,
P V c o n . l i f e c y c l e = P V c o n . P V l i f e ,
B c o n . l i f e c y c l e = B c o n . B l i f e ,
E V c o n . l i f e c y c l e = E V c o n . E V l i f e ,
where  P V c o n . B c o n . , and  E V c o n .  represent the total daily contributions of the PV, battery, and EV (EUR), respectively.  P V c o n . l i f e c y c l e B c o n . l i f e c y c l e , and  E V c o n . l i f e c y c l e  represent the total contributions of the PV, battery, and EV (EUR), respectively.  P V l i f e  represents the estimated PV system lifetime, which is 25 years [61].  B l i f e  and  E V l i f e  represent the estimated battery and EV lifetime, which are calculated using Equations (51) and (52).

3.7.4. Energy Saving

The dynamics of ESS losses and costs contribute to assessing the overall sustainability of energy systems. Achieving sustainability in this context involves minimizing losses during the charging and discharging processes, optimizing the lifetime of batteries, and ensuring a balance between economic benefits and energy saving. This approach ensures that energy systems meet economic objectives and align with sustainable practices. Therefore, Equations (60)–(62) are formulated to quantify the energy losses and associated costs, providing a comprehensive assessment of the proposed system.
C h l o s s e s t = P B c h ( t ) + P E V c h ( t ) 1 μ μ t ,
D i s l o s s e s t = P B d i s ( t ) + P E V d i s ( t ) ( 1 μ ) t ,
E S S L C t = [ ( P p v t b t + P p v t e v t ) 1 μ μ L C O E p v t ] + [ ( P g t b ( t ) + P g t e v ( t ) ) 1 μ μ G r i d p r i c e b u y t t ] + [ P b t e v ( t ) 1 μ μ B p r i c e o v e r a l l t t ] + [ P e v t b ( t ) 1 μ μ E V p r i c e o v e r a l l t t ] + [ ( P b t h ( t ) + P b t g ( t ) ) ( 1 μ ) B p r i c e o v e r a l l t t ] + [ ( P e v t h ( t ) + P e v t g ( t ) ) ( 1 μ ) E V p r i c e o v e r a l l t t ] ,
where  C h l o s s e s t D i s l o s s e s t  are the ESS energy losses (kWh) due to the converter efficiency during the charging and discharging intervals at each time slot t, respectively.  E S S L C t  represents the cost of energy losses (EUR) associated with the ESS charging and discharging process at each time slot t.

4. Results

The optimization problem was solved using the PSO algorithm with a population size of 100 and 200 iterations. Simulations were implemented using MathWorks MATLAB R2021a installed on an Intel(R) Core(TM) i7-3520M CPU @ 2.90 GHz and 8 GB RAM with Windows 10 Pro. Four scenarios for summer and winter conditions, detailed in Table 1, were simulated to evaluate the performance of the EFMSA and the proposed optimization strategy. The first scenario served as a baseline scenario for the comparison with the other proposed scenarios, allowing us to illustrate the contribution of each scenario.

4.1. First Scenario

In this scenario, the main grid fulfilled the home energy consumption, with a total daily demand of 18.464 kWh. Additionally, the main grid charged the EV battery assuming that the EV’s DOD is 90%, using Equations (22) and (35). It was found that the LCOS of the EV battery was equal to 0.033 EUR/kWh with 4750 cycles. Table 2 describes the results of the first scenario.

4.2. Second Scenario

In this scenario, the PV system, battery, and EV were integrated into the HEMS, where the EFMSA is implemented to achieve optimal energy flow. Random ESS parameters ere assumed to evaluate the ESS parameters optimization process by considering a battery size of 4.8 kWh and a DOD of 80%, while a DOD of 90% was considered for the EV battery. It was found that the LCOS and life cycle of the battery were 0.076 EUR/kWh and 5757 cycles, respectively. Likewise, the LCOS and life cycle of the EV battery were 0.033 EUR/kWh and 4750 cycles, respectively. Table 3 describes the results obtained considering the second scenario. Figure 6 presents the system’s energy balance for summer and winter seasonal conditions.

4.3. Third Scenario

In this scenario, the optimization of ESS parameters was implemented using PSO. The results reveal that the optimal parameters for both winter and summer conditions were a battery size of 2.4 kWh with a DOD of 50%, and a DOD of 50% for the EV. As a result, the LCOS and life cycle of the battery were 0.056 EUR/kWh and 12,397 cycles, respectively. For the EV, the LCOS and life cycles of its battery were 0.023 EUR/kWh and 12,397 cycles, respectively. Table 4 describes the results obtained from the third scenario. Figure 7 shows the energy balance of the system for winter and summer conditions.

4.4. Fourth Scenario

In this scenario, household appliance scheduling was applied, where the optimized ESS parameters served as input for the optimization process. The findings and outcomes from the fourth scenario are comprehensively detailed in Table 5, providing a thorough overview of the results achieved. Figure 8 shows the convergence of the PSO for winter and summer, underscoring that PSO and the population size and iteration parameters were appropriate for the proposed optimization problem, which resulted in a good performance in reaching the optimal solution. Figure 9 shows the energy balance of the system for winter and summer. These visual representations contribute to a more holistic understanding of the optimization process and its implications in diverse climatic conditions.

5. Discussion

5.1. Energy Flow and Energy Usage Prices

The EFMSA controls the energy flow in the integrated system, aiming to achieve the maximum actual energy cost reduction. The fourth winter scenario is a representative example of discussing the optimal power flow to meet the energy consumption, as shown in Figure 10. Additionally, the third winter scenario is highlighted to discuss the battery and EV’s energy exchange, see Figure 11.
In the event of excess PV generation, the PV system covers the load, as shown in the periods (10:00–12:00). The remaining excess energy is first sent to the EV in case it is connected to the system due to the low LCOS of the EV compared to the battery, so the stored energy will be used later with a lower price, ensuring higher energy cost reduction. While the EV is on a trip, excess PV generation is sent to the battery or the grid depending on the maximum financial option.
If the PV system falls short of meeting the load or during the absence of solar radiation at night, the EFMSA covers the remaining consumption using other available resources considering their energy usage cost. For example, in the periods (05:00–8:00, 12:00–15:00, and 18:00–22:00), the EV covered the remaining consumption since it had the lowest energy usage price. In the period (08:00–10:00), the battery covered the remaining consumption, as the EV was on a trip and the grid price was higher than the battery’s price. In the periods (00:00–05:00), the grid covered the remaining consumption due to its lower price, even though the battery or the EV battery had energy. In some cases, more than two energy systems covered the energy demand as illustrated in the periods (16:00–17:00 and 23:00–24:00).
Moreover, scenario three for winter is considered as a representative example to discuss the battery and EV energy exchange dynamics, as detailed in Figure 11. The EV charged the battery in the period (12:00–12:51), where the amount of energy stored at this period is 1.279 kWh with a purchased price of 0.1883 EUR/kWh. This strategy is beneficial for cost reduction, as the battery can be discharged to the home in the upcoming periods when the grid price is high and the EV is on a trip (15:00–18:00), with a grid price ranging between 0.198 and 0.238 EUR/kWh. Similarly, the EV charged the battery intermittently for the same purpose during the period (18:00–22:07). However, there is no energy sent from the battery to the EV, which refers to the high battery energy usage cost, where it would not be beneficial for cost reduction. Moreover, due to the low grid sell price, no energy is sold from the battery and EV to the grid. The same charging strategy is established for charging the battery and the EV battery from the grid, considering the grid energy price during the upcoming periods. The proposed algorithm (EFMSA) achieves an efficient energy flow within the integrated system, aligning with fluctuating energy prices and ensuring cost-effectiveness and the sustainable utilization of the energy systems.

5.2. Energy Cost

Table 6 outlines the simulation results of energy costs and cost reduction compared to the first scenario. The comparison results show the effectiveness of the proposed system in achieving maximum cost reduction, reaching 28% in winter and 17% in summer. By factoring in the installation and O&M costs, the cost reduction results provide household consumers with a clear insight into the advantages of adopting HEMS.
Figure 12 and Figure 13 illustrate the energy consumption with and without appliance scheduling for winter and summer, respectively. The operation time of household appliances is scheduled according to the availability of PV power, along with the battery, EV, and grid energy usage prices, which is reflected in the reduction of energy cost.

5.3. The ESS Lifetime and Energy Losses

The study’s outcomes shed light on the battery and EV battery lifetimes and energy-saving aspects. Using the mathematical model detailed in Section 3.7.4, Table 7 presents the simulation results of energy losses and their associated cost. In both winter and summer scenarios, the simulation results revealed valuable insights. The proposed system managed the operation time of the integrated system efficiently in terms of extending the lifetime and obtaining actual energy cost reduction. The proposed system in the fourth scenario reduced the energy losses compared to the first scenario by 26.730% and 22.340% in winter and summer, respectively. Consequently, the cost resulting from the energy losses is reduced by 35.966% and 24.190% compared to the first scenario in winter and summer, respectively.
Using the mathematical models detailed in Section 3.3.5 and Section 3.7.1, Table 8 shows the estimated lifetime of the EV battery in summer and winter and the estimated battery lifetime in winter. The proposed system in the fourth scenario achieved the most extended battery and EV lifetime. The EV battery lifetime was extended compared to the second scenario by 45.498% in winter, from 13.141 to 19.120 years, and 59.557% in summer, from 11.085 to 17.687 years. Similarly, the battery lifetime was extended compared to the second scenario by 94.274%, from 4.087 to 7.940 years in winter. Our results are aligned with Davide Fioriti et al. (2023) and Lehtola et al. (2019) in that the battery lifetime is influenced by the usage patterns and DOD, and that the fewer the daily battery cycles, the higher the battery lifetime, which reach more than 20 years [62,63].
The utilization pattern of the battery differs from winter to summer. This variance can be attributed to the grid energy prices and LCOS of the battery and its energy usage cost, as well as the lack of battery charging amount from the PV system, where the battery energy usage price was higher than the EV and grid energy usage prices. For that, the estimated battery lifespan in the summer scenario is undisclosed since the battery was not utilized to supply the energy demand, see Figure 9b.
This comprehensive evaluation offers valuable information for optimizing system parameters and operational strategies to enhance energy efficiency and extend the lifetime of the integrated energy system. Additionally, the proposed system affirms its capability to enhance operational longevity while minimizing energy losses across varied seasonal conditions.

5.4. The Integrated Energy System Contribution

Through the efficient integration of a PV system, battery, EV, and smart management, the system has demonstrated a capacity to optimize energy systems utilization, resulting in reduced energy costs and enhanced financial returns. The integrated energy system has exhibited commendable financial contributions over its operational lifetime, as inferred from the results shown in Table 9. The proposed system achieved the maximum economic benefits compared to the installation cost of the integrated energy system, with a daily contribution of 1.619 EUR in winter and 0.973 EUR in summer. In addition, using the mathematical model detailed in Section 3.7.3 alongside the calculated battery and EV battery lifetimes presented in the previous Section 5.3, the financial contribution of the integrated system throughout its operational lifetime was calculated, as summarized in Table 9. The results show an overall financial contribution of 11,546 EUR in winter conditions and 7973 EUR in summer conditions, with an average contribution of 9759 EUR during the integrated system operational lifetime. The EV battery contributes more due to its low energy usage cost and high stored capacity. The PV system contribution shows better results in summer than winter, influenced by the amount of solar radiation and grid prices. The battery provides a financial contribution in winter due to the high grid prices and the amount of energy stored in it from the PV. However, the battery has the lowest contribution due to its high LCOS and due to not operating in the summer scenario.
These nuanced variations underscore the system’s dynamic responsiveness to seasonal and contextual factors, optimizing economic benefits over its operational lifespan. As a result, the financial gains compared to the installation costs are further enhanced by extending the lifespan and enhancing the operation of energy systems including PV systems, batteries, and EVs, contributing to long-term cost savings and overall economic sustainability.

5.5. CO2 Emissions

Table 10 shows the simulation results of the CO2 emissions from importing energy from the grid, revealing key insights into the environmental impact and providing a comprehensive overview of CO2 emission reduction under varying conditions. The proposed system achieved a notable reduction in importing energy from the grid, resulting in a reduction of 59.713% and 46.234% in CO2 emissions compared to the first scenario in winter and summer, respectively. In particular, the trend indicates that adopting PV systems, batteries, and EVs, coupled with smart home management, contributes to a substantial decrease in reliance on traditional carbon-intensive energy generation. The observed reduction in both winter and summer suggests that the benefits are not confined to specific seasons, highlighting the system’s potential to contribute substantially to environmental sustainability throughout diverse seasonal conditions while enhancing the resilience of the household energy infrastructure.
To sum up, besides its environmental benefits, the proposed system presents promising economic advantages that can translate into long-term cost savings for households. This dual impact positions the system as a compelling solution for households aiming to minimize their carbon footprint and achieve economic efficiency in their energy consumption practices. The decentralized and diversified nature of the system minimizes vulnerability to fluctuations in energy grids, contributing to increased energy security. This multi-faceted approach underscores the holistic benefits of the proposed system, making it a comprehensive and resilient solution for households navigating the complex interplay of environmental, economic, and energy security considerations.

6. Conclusions

This paper introduced an effective home energy management system for smart homes that integrates PV systems, batteries, and EVs. An energy flow management algorithm was developed to control modes of EV to grid (EV2G), EV to battery (EV2B), EV to home (EV2H), battery to grid (B2G), battery to EV (B2EV), battery to home (B2H), PV system to home (PV2H), PV system to battery (PV2B), PV system to EV (PV2EV), PV system to grid (PV2G), grid to home (G2H), grid to battery (G2B), and grid to EV (G2EV). Additionally, it introduced an optimization strategy using PSO to obtain optimal parameters for the battery (DOD and size) and EV battery (DOD) and to schedule the household appliances. The PV system, battery, and EV energy usage cost models were formulated and introduced into the optimization process, considering each system’s installation costs and life cycle, resulting in an actual cost reduction compared to the installation costs and ensuring the sustainable utilization of the integrated system throughout its operational lifetime. Four scenarios were simulated considering winter and summer weather conditions.
The proposed system aimed to reduce the actual energy cost, extend the ESS lifetime, reduce energy losses, reduce CO2 emissions, and maximize the financial returns from installing the PV system, battery, and EV at home. The results revealed that the proposed system achieved the study’s objectives and its capability to deal with varied seasonal conditions, energy price variations, and user preferences, and to sustain energy systems utilization. Additionally, the results encourage household consumers seeking to reduce their environmental impact and increase their financial returns associated with investing in PV, battery, and EV energy systems at home, resulting in promoting sustainable and efficient energy practices at the household level.
In the future, the authors propose expanding the scope of the study by incorporating several homes in diverse geographical regions (energy demand patterns), considering monthly weather variations (seasonal dynamics), and investigating and optimizing various parameters of the integrated energy system to identify the most practical options for residential applications (scalability/replicability).

Author Contributions

Conceptualization, Z.A.A.M. and P.M.B.B.; methodology, Z.A.A.M. and P.M.B.B.; software, Z.A.A.M. and M.A.B.I.; validation, Z.A.A.M. and P.M.B.B.; formal analysis, Z.A.A.M.; investigation, Z.A.A.M. and P.M.B.B.; resources, Z.A.A.M. and P.M.B.B.; data curation, Z.A.A.M. and P.M.B.B.; writing—original draft preparation, Z.A.A.M., M.A.B.I. and P.M.B.B.; writing—review and editing, Z.A.A.M., M.A.B.I. and P.M.B.B.; visualization, Z.A.A.M. and P.M.B.B.; supervision, P.M.B.B.; project administration, P.M.B.B. All authors have read and agreed to the published version of the manuscript.

Funding

This research received no external funding.

Data Availability Statement

The original contributions presented in the study are included in the article, further inquiries can be directed to the corresponding author.

Acknowledgments

We would like to show our gratitude to Renata Costa from Faculdade de Ciências da Universidade do Porto, Portugal, who provided insight and expertise that greatly assisted this work. Also, thanks for the support received from Josefa Salgado Carballo from the Faculty of Physics of the Universidade de Santiago de Compostela, Spain.

Conflicts of Interest

The authors declare no conflicts of interest.

Nomenclature

  t The simulation time (hour)
  μ The converter charging/discharging efficiency (%)
  γ The temperature coefficient
  μ d r i v i n g The vehicle efficiency (kWh/km)
a b The simulated parameters for ESS life cycle calculation
  B E l i f e s p a n The expected amount of charged/discharged energy to/from the battery during its lifespan (kWh)
  B c a p i t a l The capital cost of the battery system (EUR)
  B c o n . The total daily contribution of the battery (EUR)
  B c o n . l i f e c y c l e The total contribution of the battery (EUR)
  B L C O S The levelized cost of storage for the battery (EUR/kWh)
  B l i f e The estimated battery lifetime (year)
  B p r i c e c h . ( t ) The price of the total purchased energy from the PV system, grid, and EV, which is stored in the battery at each time slot t (EUR/kWh)
  B p r i c e o v e r a l l t The battery energy usage price in the time slot t (EUR/kWh)
  B p r i c e o v e r a l l t + 1 is the battery energy usage price for the time slot t + 1 (EUR/kWh)
  C b a t t t The cost of battery energy usage in the home at each time slot t (EUR)
  C B O P The infrastructure cost of the battery system (EUR/kWh)
  C b t e v t The cost of energy purchased from the battery and stored in the EV battery at each time slot t (EUR)
  C e v t b t The cost of energy purchased from the EV and stored in the battery at each time slot t (EUR)
  C G r i d t The cost of grid energy usage for the vehicle trip at each time slot t (EUR)
  C g t b t The cost of energy purchased from the grid and stored in the battery at each time slot t (EUR)
  C g t e v t The cost of energy purchased from the grid and stored in the EV battery at each time slot t (EUR)
  C P C S The power conversion system cost (EUR/kW)
  C P V t The cost of using PV energy to cover the load at each time slot t (EUR)
  C p v t b t The cost of energy purchased from the PV system and stored in the battery at each time slot t (EUR)
  C p v t e v t The cost of energy purchased from the PV system and stored in the EV battery at each time slot t (EUR)
  C T r i p t The cost of EV energy usage cost for the vehicle trip at each time slot t (EUR)
  C U n i t The cost of the battery per unit (EUR/kWh)
  C h B m a x The maximum charge rate of the battery during the time slot t (kWh)
  C h E V m a x The maximum charge rate of the EV battery during the time slot t (kWh)
  C h l o s s e s t The ESS energy losses due to the converter efficiency during the charging intervals at each time slot t (kWh)
  C O 2 ( t ) The amount of CO2 emission produced from the energy consumed in the home at each time slot t (kgCO2)
  D The vehicle travel distance (km)
  d y The total days within a year
  D i s B m a x The maximum discharge rate of the battery during the time slot t (kWh)
  D i s E V m a x The maximum discharge rate of the EV battery during the time slot t (kWh)
  D i s l o s s e s t The ESS energy losses due to the converter efficiency during the discharging intervals at each time slot t (kWh)
  D O D Depth of discharge (%)
  E B t The energy stored in the battery at each time slot t (kWh)
  E B t + 1 The energy stored in the battery at t + 1 (kWh)
  E b a t t The battery capacity (kWh).
  E E V t The energy stored in the EV battery at each time slot t (kWh)
  E E V t + 1 The energy stored in the EV battery at t + 1 (kWh)
  E s h t The energy consumption of the shifted appliances (kWh) at each time slot t
  E S S d a y c y c l e s The number of charging/discharging cycles throughout the day of ESS
  E S S L C t The cost of energy losses associated with the ESS charging and discharging process at each time slot t (EUR)
  E S S l i f e The expected ESS lifetime (years)
  E V c o n . The total daily contribution of the EV (EUR)
  E V c o n . l i f e c y c l e The total contribution of the EV (EUR)
  E V c a p i t a l The replacement cost of the EV battery (EUR)
  E V L C O S The levelized cost of storage for the EV battery (EUR/kWh)
  E V l i f e The estimated EV lifetime (year)
  E V p r i c e c h . ( t ) The price of the total purchased energy from the PV, grid, and battery, which is stored in the EV battery at each time slot t (EUR/kWh)
  E V p r i c e o v e r a l l t The EV battery energy usage price in the time slot t (EUR/kWh)
  E V p r i c e o v e r a l l t + 1 The EV battery energy usage price for the time slot t + 1 (EUR/kWh)
  G r i d p r i c e b u y t The grid price at each time slot t (EUR/kWh)
  G r i d s e l l t The energy selling price to the grid at each time slot t (EUR/kWh)
  I C O 2 The CO2 emission intensity (kgCO2/kWh)
  I r t The solar irradiance (kW/m2)
  I r , S T C The solar irradiance at standard test condition (kW/m2)
  L C O E p v The PV energy usage price (EUR/kWh)
  n The expected number of battery life cycle
  N c y c l e , E S S The ESS life cycle
  n e v The number of charging/discharging cycles of the EV battery
  N E e v The nominal energy of the EV battery (kWh)
  O P S The ON/OFF variable that expressed the shifted appliances operation status (0 or 1) at each time slot t
  P B c h t The amount of charging power to the battery at each time slot t (kW)
  P B d i s t The amount of discharging power from the battery at each time slot t (kW)
  P b t e v t The power discharged from the battery to the EV at each time slot t (kW)
  P b t g t The power discharged from the battery to the grid at each time slot t (kW)
  P b t h t The power discharged from the battery to the home at each time slot t (kW)
  P E V c h t The charging power to the EV battery at each time slot t (kW)
  P E S S c h ( t ) The charged power to the ESS at each time slot t (kWh)
  P E S S d i s t The discharged power from the ESS at each time slot t (kWh)
  P E V d i s t The discharging power from the EV battery at each time slot t (kW)
  P e v t b t The amount of power sent from the EV to the battery at each time slot t (kW)
  P e v t g t The power exported from the EV battery to the grid at each time slot t (kW)
  P e v t h t The power discharged from the EV battery to the battery at each time slot t (kW)
  P g t b t The amount of power sent from the grid to the battery at each time slot t (kW)
  P g t e v t The power imported from the grid for charging the EV battery at each time slot t (kW)
  P g t h t The power sent from the grid to home at each time slot t (kW)
  P l t The home load at each time slot t (kW)
  P p v t b t The amount of power sent from the PV system to the battery at each time slot t (kW)
  P p v t e v t The amount of power sent from the PV system to the EV battery at each time slot t (kW)
  P p v t g t The amount of PV power sent to the grid at each time slot t (kW)
  P p v t h t The power sent from the PV system to the load at each time slot t (kW)
  P r a t e d s h The rated power of each shifted appliance (kW)
  P r o f i t b t g t The economic benefit of selling energy from battery to the grid at each time slot t (EUR)
  P r o f i t e v t g t The economic benefit of selling energy from EV to the grid at each time slot t (EUR)
  P r o f i t p v t g ( t ) The economic benefit of selling energy from the PV system to the grid at each time slot t (EUR)
  P V c o n . The total daily contribution of the PV system (EUR)
  P V c o n . l i f e c y c l e The total contribution of the PV system (EUR)
  P S T C The maximum power of PV module at standard test condition (kW)
  P P V t The PV output power at each time slot t (kW)
  S The set of shifted appliances ranged (1, 2, 3, …, X)
  T o ( t ) The ambient temperature at each time slot t (°C)
  T b c o s t t The total cost of the purchased energy and stored in the battery at each time slot t (EUR)
  T b e n e r g y ( t ) The total purchased energy stored in the battery at each time slot t (kWh)
  T e v c o s t t The total cost of the purchased energy and stored in the EV battery at each time slot t (EUR)
  T e v e n e r g y ( t ) The total purchased energy and stored in the EV battery at each time slot t (kWh)
  T S T C The reference temperature at standard test conditions (°C)
Abbreviations
  t The simulation time
  μ The converter charging/discharging efficiency (%)
  γ The temperature coefficient
  μ d r i v i n g the vehicle efficiency (kWh/km)
  D The vehicle travel distance (km)
  E B t The energy stored in the battery at each time slot t (kWh)
  E B t + 1 The energy stored in the battery at t + 1 (kWh)
  E E V t The energy stored in the EV battery at each time slot t (kWh)
  E E V t + 1 The energy stored in the EV battery at t + 1 (kWh)
  I r t The solar irradiance (kW/m2)
  I r , S T C The solar irradiance at standard test condition (kW/m2)
  P B c h t The amount of charging power to the battery at each time slot t (kW)
  P B d i s t The amount of discharging power from the battery at each time slot t (kW)
  P E V c h t The charging power to the EV battery at each time slot t (kW)
  P E V d i s t The discharging power from the EV battery at each time slot t (kW)
  P P V t The PV output power (kW)
  P b t e v t The power discharged from the battery to the EV at each time slot t (kW)
  P b t g t The power discharged from the battery to the grid at each time slot t (kW)
  P b t h t The power discharged from the battery to the home at each time slot t (kW)
  P e v t b t The amount of power sent from the EV to the battery at each time slot t (kW)
  P e v t g t The power exported from the EV battery to the grid at each time slot t (kW)
  P e v t h t The power discharged from the EV battery to the battery at each time slot t (kW)
  P g t b t The amount of power sent from the grid to the battery at each time slot t (kW)
  P g t e v t The power imported from the grid for charging the EV battery at each time slot t (kW)
  P p v t b t The amount of power sent from the PV to the battery at each time slot t (kW)
  P p v t e v t The amount of power sent from the PV to the EV battery at each time slot t (kW)
  P S T C The maximum power of PV module at standard test conditions (kW)
  T o ( t ) The ambient temperature (°C)
  T S T C The reference temperature at standard test conditions (°C)

References

  1. Our World in Data. Available online: https://ourworldindata.org/energy (accessed on 12 November 2023).
  2. Proskuryakova, L. Updating energy security and environmental policy: Energy security theories revisited. J. Environ. Manag. 2018, 223, 203–214. [Google Scholar] [CrossRef] [PubMed]
  3. Gökgöz, F.; Güvercin, M.T. Energy security and renewable energy efficiency in EU. Renew. Sustain. Energy Rev. 2018, 96, 226–239. [Google Scholar] [CrossRef]
  4. Notton, G.; Nivet, M.L.; Voyant, C.; Paoli, C.; Darras, C.; Motte, F.; Fouilloy, A. Intermittent and stochastic character of renewable energy sources: Consequences, cost of intermittence and benefit of forecasting. Renew. Sustain. Energy Rev. 2018, 87, 96–105. [Google Scholar] [CrossRef]
  5. Aziz, T.; Ketjoy, N. PV penetration limits in low voltage networks and voltage variations. IEEE Access 2017, 5, 16784–16792. [Google Scholar] [CrossRef]
  6. Mahesh, M.; Vijaya Bhaskar, D.; Narsa Reddy, T.; Sanjeevikumar, P.; Holm-Nielsen, J.B. Evaluation of ancillary services in distribution grid using large-scale battery energy storage systems. IET Renew. Power Gener. 2020, 14, 4216–4222. [Google Scholar] [CrossRef]
  7. Al-Saadi, M.; Short, M. Multiagent-Based Control for Plug-and-Play Batteries in DC Microgrids with Infrastructure Compensation. Batteries 2023, 9, 597. [Google Scholar] [CrossRef]
  8. Eurostat. Available online: https://ec.europa.eu/eurostat/statistics-explained/index.php?title=Energy_consumption_in_households (accessed on 11 November 2023).
  9. Gong, H.; Rallabandi, V.; McIntyre, M.L.; Hossain, E.; Ionel, D.M. Peak reduction and long term load forecasting for large residential communities including smart homes with energy storage. IEEE Access 2021, 9, 19345–19355. [Google Scholar] [CrossRef]
  10. Mohandes, B.; Acharya, S.; El Moursi, M.S.; Al-Sumaiti, A.S.; Doukas, H.; Sgouridis, S. Optimal design of an islanded microgrid with load shifting mechanism between electrical and thermal energy storage systems. IEEE Trans. Power Syst. 2020, 35, 2642–2657. [Google Scholar] [CrossRef]
  11. International Renewable Energy Agency (IRENA). Renewable Power Generation Costs in 2020; International Renewable Energy Agency (IRENA): Abu Dhabi, United Arab Emirates, 2021. [Google Scholar]
  12. Rana, M.M.; Uddin, M.; Sarkar, M.R.; Shafiullah, G.M.; Mo, H.; Atef, M. A review on hybrid photovoltaic–Battery energy storage system: Current status, challenges, and future directions. J. Energy Storage 2022, 51, 104597. [Google Scholar] [CrossRef]
  13. Meliani, M.; Barkany, A.E.; Abbassi, I.E.; Darcherif, A.M.; Mahmoudi, M. Energy management in the smart grid: State-of-the-art and future trends. Int. J. Eng. Bus. Manag. 2021, 13, 18479790211032920. [Google Scholar] [CrossRef]
  14. SA Power Networks. Available online: https://www.sapowernetworks.com.au/public/download.jsp?id=310828 (accessed on 1 December 2023).
  15. Dong, S.; Kremers, E.; Brucoli, M.; Rothman, R.; Brown, S. Improving the feasibility of household and community energy storage: A techno-enviro-economic study for the UK. Renew. Sustain. Energy Rev. 2020, 131, 110009. [Google Scholar] [CrossRef]
  16. Omar, N.; Monem, M.A.; Firouz, Y.; Salminen, J.; Smekens, J.; Hegazy, O.; Gaulous, H.; Mulder, G.; van den Bossche, P.; Coosemans, T.; et al. Lithium iron phosphate based battery–Assessment of the aging parameters and development of cycle life model. Appl. Energy 2014, 113, 1575–1585. [Google Scholar] [CrossRef]
  17. Haddadian, H.; Noroozian, R. Multi-microgrids approach for design and operation of future distribution networks based on novel technical indices. Appl. Energy 2017, 185, 650–663. [Google Scholar] [CrossRef]
  18. Mbungu, N.T.; Bansal, R.C.; Naidoo, R.; Miranda, V.; Bipath, M. An optimal energy management system for a commercial building with renewable energy generation under real-time electricity prices. Sustain. Cities Soc. 2018, 41, 392–404. [Google Scholar] [CrossRef]
  19. Tabar, V.S.; Jirdehi, M.A.; Hemmati, R. Sustainable planning of hybrid microgrid towards minimizing environmental pollution, operational cost and frequency fluctuations. J. Clean. Prod. 2018, 203, 1187–1200. [Google Scholar] [CrossRef]
  20. Kusakana, K. Optimal peer-to-peer energy management between grid-connected prosumers with battery storage and photovoltaic systems. J. Energy Storage 2020, 32, 101717. [Google Scholar] [CrossRef]
  21. Al Muala, Z.A.; Bany Issa, M.A.; Sansó-Rubert Pascual, D.; Bello Bugallo, P.M. Realistic Home Energy Management System Considering the Life Cycle of Photovoltaic and Energy Storage Systems. Sustainability 2023, 15, 11205. [Google Scholar] [CrossRef]
  22. Bouakkaz, A.; Haddad, S.; Martín-García, J.A.; Gil-Mena, A.J.; Jiménez-Castañeda, R. Optimal scheduling of household appliances in off-grid hybrid energy system using PSO algorithm for energy saving. Int. J. Renew. Energy Res. 2019, 9, 427–436. [Google Scholar]
  23. Bhattacharjee, A.; Samanta, H.; Ghosh, A.; Mallick, T.K.; Sengupta, S.; Saha, H. Optimized integration of hybrid renewable sources with long-life battery energy storage in microgrids for peak power shaving and demand side management under different tariff scenario. Energy Technol. 2021, 9, 2100199. [Google Scholar] [CrossRef]
  24. Mbungu, N.T.; Bansal, R.C.; Naidoo, R. Smart energy coordination of a hybrid wind/PV with battery storage connected to grid. J. Eng. 2019, 2019, 5109–5113. [Google Scholar] [CrossRef]
  25. Mbungu, N.T.; Ismail, A.A.; Bansal, R.C.; Hamid, A.K.; Naidoo, R.M. An optimal energy management scheme of a vehicle to home. In Proceedings of the 2022 IEEE 21st Mediterranean Electrotechnical Conference (MELECON), Palermo, Italy, 14–16 June 2022. [Google Scholar]
  26. Zhang, S.; Tang, Y. Optimal schedule of grid-connected residential PV generation systems with battery storages under time-of-use and step tariffs. J. Energy Storage 2019, 23, 175–182. [Google Scholar] [CrossRef]
  27. Li, Y.; Peng, J.; Jia, H.; Zou, B.; Hao, B.; Ma, T.; Wang, X. Optimal battery schedule for grid-connected photovoltaic-battery systems of office buildings based on a dynamic programming algorithm. J. Energy Storage 2022, 50, 104557. [Google Scholar] [CrossRef]
  28. Azaroual, M.; Ouassaid, M.; Maaroufi, M. Optimum energy flow management of a grid-tied photovoltaic-wind-battery system considering cost, reliability, and CO2 emission. Int. J. Photoenergy 2021, 2021, 5591456. [Google Scholar] [CrossRef]
  29. Mohammad, A.; Zuhaib, M.; Ashraf, I. An optimal home energy management system with integration of renewable energy and energy storage with home to grid capability. Int. J. Energy Res. 2022, 46, 8352–8366. [Google Scholar] [CrossRef]
  30. Wang, M.; Abdalla, M.A.A. Optimal Energy Scheduling Based on Jaya Algorithm for Integration of Vehicle-to-Home and Energy Storage System with Photovoltaic Generation in Smart Home. Sensors 2022, 22, 1306. [Google Scholar] [CrossRef]
  31. Munankarmi, P.; Wu, H.; Pratt, A.; Lunacek, M.; Balamurugan, S.P.; Spitsen, P. Home energy management system for price-responsive operation of consumer technologies under an export rate. IEEE Access 2022, 10, 50087–50099. [Google Scholar] [CrossRef]
  32. Lee, J.O.; Kim, Y.S. Novel battery degradation cost formulation for optimal scheduling of battery energy storage systems. Int. J. Electr. Power Energy Syst. 2022, 137, 107795. [Google Scholar] [CrossRef]
  33. Seal, S.; Boulet, B.; Dehkordi, V.R. Centralized model predictive control strategy for thermal comfort and residential energy management. Energy 2020, 212, 118456. [Google Scholar] [CrossRef]
  34. Bouakkaz, A.; Mena, A.J.G.; Haddad, S.; Ferrari, M.L. Efficient energy scheduling considering cost reduction and energy saving in hybrid energy system with energy storage. J. Energy Storage 2021, 33, 101887. [Google Scholar] [CrossRef]
  35. Huy, T.H.B.; Dinh, H.T.; Kim, D. Multi-objective framework for a home energy management system with the integration of solar energy and an electric vehicle using an augmented ε-constraint method and lexicographic optimization. Sustain. Cities Soc. 2023, 88, 104289. [Google Scholar] [CrossRef]
  36. Mohamed, F.A.; Koivo, H.N. Online management of microgrid with battery storage using multiobjective optimization. In Proceedings of the 2007 International Conference on Power Engineering, Energy and Electrical Drives, Setubal, Portugal, 12–14 April 2007. [Google Scholar]
  37. Abdalla, M.A.A.; Min, W.; Mohammed, O.A.A. Two-stage energy management strategy of EV and PV integrated smart home to minimize electricity cost and flatten power load profile. Energies 2020, 13, 6387. [Google Scholar] [CrossRef]
  38. Branker, K.; Pathak, M.J.M.; Pearce, J.M. A review of solar photovoltaic levelized cost of electricity. Renew. Sustain. Energy Rev. 2011, 15, 4470–4482. [Google Scholar] [CrossRef]
  39. Lai, C.S.; McCulloch, M.D. Levelized cost of electricity for solar photovoltaic and electrical energy storage. Appl. Energy 2017, 190, 191–203. [Google Scholar] [CrossRef]
  40. Shen, W.; Chen, X.; Qiu, J.; Hayward, J.A.; Sayeef, S.; Osman, P.; Meng, K.; Dong, Z.Y. A comprehensive review of variable renewable energy levelized cost of electricity. Renew. Sustain. Energy Rev. 2020, 133, 110301. [Google Scholar] [CrossRef]
  41. Aghdam, F.H.; Ghaemi, S.; Kalantari, N.T. Evaluation of loss minimization on the energy management of multi-microgrid based smart distribution network in the presence of emission constraints and clean productions. J. Clean. Prod. 2018, 196, 185–201. [Google Scholar] [CrossRef]
  42. Zakeri, B.; Syri, S. Electrical energy storage systems: A comparative life cycle cost analysis. Renew. Sustain. Energy Rev. 2015, 42, 569–596. [Google Scholar] [CrossRef]
  43. Schoenung, S.M. Economic Analysis of Large-Scale Hydrogen Storage for Renewable Utility Applications; Sandia National Laboratories (SNL): Albuquerque, NM, USA, 2011. [Google Scholar]
  44. Kintner-Meyer, M.C.; Balducci, P.J.; Jin, C.; Nguyen, T.B.; Elizondo, M.A.; Viswanathan, V.V.; Guo, X.; Tuffner, F.K. Energy Storage for Power Systems Applications: A Regional Assessment for the Northwest Power Pool (NWPP); Pacific Northwest National Lab. (PNNL): Richland, WA, USA, 2010. [Google Scholar]
  45. Dallinger, D.; Link, J.; Büttner, M. Smart grid agent: Plug-in electric vehicle. IEEE Trans. Sustain. Energy 2014, 5, 710–717. [Google Scholar] [CrossRef]
  46. Jain, M.; Saihjpal, V.; Singh, N.; Singh, S.B. An overview of variants and advancements of PSO algorithm. Appl. Sci. 2022, 12, 8392. [Google Scholar] [CrossRef]
  47. Kennedy, J.; Eberhart, R. Particle swarm optimization. In Proceedings of the ICNN’95-International Conference on Neural Networks, Perth, WA, Australia, 27 November–1 December 1995. [Google Scholar]
  48. Menos-Aikateriniadis, C.; Lamprinos, I.; Georgilakis, P.S. Particle swarm optimization in residential demand-side management: A review on scheduling and control algorithms for demand response provision. Energies 2022, 15, 2211. [Google Scholar] [CrossRef]
  49. Nguyen, T.H.; Nguyen, L.V.; Jung, J.J.; Agbehadji, I.E.; Frimpong, S.O.; Millham, R.C. Bio-inspired approaches for smart energy management: State of the art and challenges. Sustainability 2020, 12, 8495. [Google Scholar] [CrossRef]
  50. Dinh, H.T.; Yun, J.; Kim, D.M.; Lee, K.H.; Kim, D. A home energy management system with renewable energy and energy storage utilizing main grid and electricity selling. IEEE Access 2020, 8, 49436–49450. [Google Scholar] [CrossRef]
  51. SECONDSOL. Available online: https://www.secondsol.com/en/anzeige/15345/modules/crystalline/poly/rec/225-wp-235-wp-poly (accessed on 20 December 2023).
  52. European Commission. Photovoltaic. Available online: https://re.jrc.ec.europa.eu/pvg_tools/en/#HR (accessed on 29 December 2023).
  53. Open-Meteo. Available online: https://open-meteo.com/en/docs/historical-weather-api (accessed on 30 December 2023).
  54. Red Eléctrica de España (REDE). Active Energy Invoicing Price. Available online: https://www.esios.ree.es/en/pvpc?date=11-02-2022 (accessed on 30 December 2023).
  55. Red Eléctrica de España (REDE). Self-Consumption Surplus Energy Price for the Simplified Compensation Mechanism (pvpc). Available online: https://www.esios.ree.es/en/analsis/1739?vis=1&start_date=08052019t00%3a00&end_date=03042022t23%3a00&compare_start_date=07052019t00%3a00&groupby=hour&compare_indicators=1013,1014,1015 (accessed on 30 December 2023).
  56. WccSolar. Available online: https://www.wccsolar.net/baterias-litio?lang=en (accessed on 31 December 2023).
  57. KIA. Available online: https://www.kia.com/uk/new-cars/niro/specification.carcode.niro-ev_2022/?shareData={%22trimCode%22:{}}&previewMode=1 (accessed on 2 January 2024).
  58. EV Database. Available online: https://ev-database.org/car/1338/Kia-e-Niro-64-kWh (accessed on 2 January 2024).
  59. Office of Energy Efficiency & Renewable Energy. Available online: https://www.energy.gov/eere/vehicles/articles/fotw-1272-january-9-2023-electric-vehicle-battery-pack-costs-2022-are-nearly (accessed on 17 December 2023).
  60. European Environment Agency (EEA). Available online: https://www.eea.europa.eu/data-and-maps/daviz/sds/co2-emission-intensity-from-electricity-generation-6/@@view (accessed on 20 December 2023).
  61. IRENA and IEA-PVPS. End of Life Management: Solar Photovoltaic Panels; National Renewable Energy Lab. (NREL): Golden, CO, USA, 2016. [Google Scholar]
  62. Fioriti, D.; Scarpelli, C.; Pellegrino, L.; Lutzemberger, G.; Micolano, E.; Salamone, S. Battery lifetime of electric vehicles by novel rainflow-counting algorithm with temperature and C-rate dynamics: Effects of fast charging, user habits, vehicle-to-grid and climate zones. J. Energy Storage 2023, 59, 106458. [Google Scholar] [CrossRef]
  63. Lehtola, T.A.; Zahedi, A. Electric vehicle battery cell cycle aging in vehicle to grid operations: A review. IEEE J. Emerg. Sel. Top. Power Electron. 2019, 9, 423–437. [Google Scholar] [CrossRef]
Figure 1. System configuration.
Batteries 10 00138 g001
Figure 2. Energy exchange process.
Batteries 10 00138 g002
Figure 3. The EFMS algorithm.
Batteries 10 00138 g003
Figure 4. The flow chart of optimization strategy.
Batteries 10 00138 g004
Figure 5. Case study data.
Batteries 10 00138 g005
Figure 6. Energy balance for the second scenario in (a) winter and (b) summer.
Batteries 10 00138 g006
Figure 7. Energy balance for the third scenario in (a) winter and (b) summer.
Batteries 10 00138 g007
Figure 8. The convergence of the PSO for winter and summer scenarios.
Batteries 10 00138 g008
Figure 9. Energy balance for the fourth scenario in (a) winter and (b) summer.
Batteries 10 00138 g009
Figure 10. Power flow and energy prices of the fourth scenario in winter.
Batteries 10 00138 g010
Figure 11. Battery and EV battery energy exchange for the third scenario in winter.
Batteries 10 00138 g011
Figure 12. Energy consumption with and without scheduling in winter.
Batteries 10 00138 g012
Figure 13. Energy consumption with and without scheduling in summer.
Batteries 10 00138 g013
Table 1. Simulation scenarios.
ScenarioPVBatteryEVGridEFMSAOptimizing ESS ParametersHousehold Appliance Scheduling
1
2
3
4
Table 2. The simulation results of the first scenario.
WinterSummer
Cost (EUR)6.6205.723
Grid Imported Energy (kWh)90.26489.053
CO2 Emissions (kgCO2/kWh)15.97615.762
Energy Losses (kWh)4.2914.230
Energy Loss Cost (EUR)0.5950.587
EV Lifetime (Years)9.23010.401
Table 3. The simulation results of the second scenario.
WinterSummer
Cost (EUR)5.2105.083
Grid Imported Energy (kWh)40.72556.264
CO2 Emissions (kgCO2/kWh)7.2089.958
Energy Losses (kWh)3.5353.757
Energy Loss Cost (EUR)0.4620.517
EV Lifetime (Years)13.14111.085
PV Daily Financial Contribution (EUR)0.2710.530
Battery Daily Financial Contribution (EUR)0.2260
EV Daily Financial Contribution (EUR)1.0190.337
Total Financial Contribution (EUR)1.5160.867
Table 4. The simulation results of the third scenario.
WinterSummer
Cost (EUR)4.9054.831
Grid Imported Energy (kWh)36.94647.520
CO2 Emissions (kgCO2/kWh)6.5398.411
Energy Losses (kWh)3.1793.389
Energy Loss Cost (EUR)0.3870.459
EV Lifetime (Years)19.05317.363
PV Daily Financial Contribution (EUR)0.2710.530
Battery Daily Financial Contribution (EUR)0.1290.007
EV Daily Financial Contribution (EUR)1.2370.418
Total Financial Contribution (EUR)1.6370.955
Table 5. The simulation results of the fourth scenario.
WinterSummer
Cost (EUR)4.7604.708
Grid Imported Energy (kWh)36.36447.879
CO2 Emissions (kgCO2/kWh)6.4368.474
Energy Losses (kWh)3.1433.284
Energy Loss Cost (EUR)0.3810.445
EV Lifetime (Years)19.12017.687
PV Daily Financial Contribution (EUR)0.2670.631
Battery Daily Financial Contribution (EUR)0.0800
EV Daily Financial Contribution (EUR)1.2710.342
Total Financial Contribution (EUR)1.6180.973
Table 6. The energy cost simulation.
WinterSummer
ScenarioCost (EUR)Cost Reduction (%)Cost (EUR)Cost Reduction (%)
16.620-5.723-
25.21021.2995.08311.182
34.90525.9064.83115.586
44.7428.3984.70817.735
Table 7. The simulation results of energy losses and energy losses cost.
WinterSummer
ScenarioEnergy
Losses
(kWh)
Energy
Losses
Reduction (%)
Losses
Cost
(EUR)
Losses
Cost
Reduction
(%)
Energy
Losses
(kWh)
Energy
Losses
Reduction
(%)
Losses
Cost
(EUR)
Losses
Cost
Reduction (%)
14.291-0.595-4.230-0.587-
23.53517.6180.46222.3523.75711.1820.51711.925
33.17925.9140.38734.9573.38919.8810.45921.805
43.14426.7300.38135.9663.28522.3400.44524.190
Table 8. The simulation results for the ESS lifetime.
WinterSummer
ScenarioEV
Lifetime
(Years)
EV
Lifetime
Extension (%)
Battery
Lifetime
(Years)
Battery
Lifetime
Extension (%)
EV
Lifetime
(Years)
EV
Lifetime
Extension (%)
Battery
Lifetime (Years)
Battery
Lifetime
Extension (%)
19.230---10.401---
213.141-4.087-11.0856.576--
319.05344.9885.96745.99917.36366.934--
419.12045.4987.94094.27417.68770.047--
Table 9. The simulation results of financial contribution.
Winter Summer
ScenarioPV
(EUR)
Battery (EUR)EV
(EUR)
Daily
(EUR)
Operational
Lifetime
(EUR)
PV
(EUR)
Battery (EUR)EV (EUR)Daily
(EUR)
Operational
Lifetime
(EUR)
1----------
20.2710.2261.0191.51677050.53000.3370.8676203
30.2710.1291.2371.63711,3630.5300.0070.4180.9557546
40.2670.0801.2711.61811,5460.63100.3420.9737973
Table 10. The simulation results of CO2 emissions.
WinterSummerAverage
ScenarioCO2 (kgCO2/kWh)CO2 Reduction (%)CO2 (kgCO2/kWh)CO2 Reduction (%)CO2 Reduction (%)
115.976-15.762--
27.20854.8829.95836.81945.850
36.53959.0688.41146.63852.853
46.43659.7138.47446.23452.973
Disclaimer/Publisher’s Note: The statements, opinions and data contained in all publications are solely those of the individual author(s) and contributor(s) and not of MDPI and/or the editor(s). MDPI and/or the editor(s) disclaim responsibility for any injury to people or property resulting from any ideas, methods, instructions or products referred to in the content.

