Article

Sol-Gel Synthesized Antimony Anodes for Sodium-Ion Batteries: Identifying Key Parameters for Optimization

by
Nicholas E. Drewett
1,
Juan Luis Gómez-Cámer
1,
Begoña Acebedo
1,
Montserrat Galceran
1 and
Teófilo Rojo
1,2,*
1
CIC energiGUNE, Parque Tecnológico de Álava, 01510 Miñano, Spain
2
Departamento de Química Inorgánica, Universidad del País Vasco UPV/EHU, P.O. Box. 644, 48080 Bilbao, Spain
*
Author to whom correspondence should be addressed.
Batteries 2017, 3(3), 20; https://doi.org/10.3390/batteries3030020
Submission received: 30 March 2017 / Revised: 22 May 2017 / Accepted: 26 June 2017 / Published: 30 June 2017
(This article belongs to the Special Issue Physical Properties of Sodium-Ion Battery Materials)

Abstract

:
The potentially high gravimetric capacities of intermetallic anodes, coupled with the low cost and readily available materials used in sodium-ion batteries, has generated interest in antimony—an anode capable of alloying with sodium. However, presently there are few synthetic routes to antimony particles for use in sodium-ion batteries. One pot, sol-gel synthetic routes from readily available, chloride-free precursors have been developed. The resulting products have been characterized and, from this data, several key parameters’ optimization have been identified and are presented here. Finally, using this information, some initial optimization has been carried out, which resulted in minor improvements to the physical and electrochemical properties of the resulting product.

1. Introduction

Currently, modern society has a strong dependence on the ability to generate, store, and manage energy, and—from transportation and portable electronic devices to stationary and grid storage—alkali metal-ion batteries have proven an attractive option in meeting these ever-increasing demands. Furthermore, there is considerable impetus to develop lithium- and sodium-ion batteries as their versatile nature and wide range of tailorable properties make them well-suited to optimization for specific applications [1,2,3,4,5,6,7,8,9,10,11]. While lithium-ion batteries have proven a versatile and popular choice of energy storage system, growing demand combined with the geographic constraints on lithium natural resources has generated considerable interest in developing “beyond lithium” systems. Sodium-ion batteries consist of abundant, low cost, readily available materials and exhibit similar insertion chemistries to lithium-ion batteries. As a consequence of these attractive properties, sodium-ion batteries are currently regarded as an emerging technology that may compliment, or even substitute, lithium-ion technology. However, continuing improvements to gravimetric energy densities are necessary in order to increase the competitiveness of these systems. Thus, developing anode and cathode systems with higher specific charges and energy densities is a crucial area of research. Due to the potentially achievable high gravimetric capacities, there has been interest in using intermetallic particles in negative electrodes (anodes). However, these high gravimetric capacities are also frequently accompanied by large volume changes occurring during sodiation/desodiation, which can lead to loss of electrical contact within the anode and pulverization of the active particles. This pulverization may, in turn, result in damage to the surface of the intermetallic particles, leading to continuous solid-electrolyte interphase (SEI) formation/breaking and irreversible capacity loss [12,13,14,15].
However, despite the drawbacks, the possibility of high electrochemical performance still generates interest in developing and improving these types of materials, particularly for sodium-ion batteries [16,17].
Intermetallic antimony (Sb) has a range of properties that make it a potentially attractive anode material—it can alloy with sodium or lithium with a theoretical gravimetric capacity of 660 mAh g−1 Sb (based on the capacity of M3Sb), and even bulk Sb is relatively attractive (with reversibility at low to moderate current density) [17,18,19,20].
However, the stress and strain caused by volumetric changes during cycling remains a key issue for Sb, and this will require some degree of mitigation in order to obtain an improved electrochemical performance [21,22,23]. Nevertheless, there has been a significant level of interest in using Sb in both its pure form and as the basis of a composite anode material.
A range of approaches to improving Sb anode performance have been considered, such as the development of novel micro- and nano-structures [17,21,22] or modifications of its crystalline nature [23]. Stable and reversible sodiation has been demonstrated for bulk antimony and in thin films [18,20], with work also having been carried out into sodiation of antimony/carbon fibers synthesized by electrospinning [24] or by oxidative polymerization [25]. Excellent cycle life has been demonstrated for Sb/C composites prepared by mechanical milling [26] or spray pyrolysis [27].
Recently, nano-sized antimony particles were synthesized and, after additional processing, were able to demonstrate excellent rate capability and cyclability during both sodiation and lithiation [19]. However, these also exhibited poorer coulombic efficiencies than bulk antimony in the initial cycle, which has been attributed to the larger surface area of the nanomaterials leading to increased decomposition of electrolyte during the formation of the SEI layer [16,19]. This may suggest that antimony particles whose size is between that of the nano- and bulk materials could have improved characteristics compared to both. Thus, the ability to tailor the size and morphology of the antimony particles during synthesis may well be significant.
In order to further explore the use of Sb as an intermetallic anode, it will first be necessary to investigate and optimize the material at the lab-scale. However, while currently there are several synthetic routes to choose from which lead to Sb materials with excellent properties, these frequently involve challenging conditions such as time consuming, continuous ball milling [28] or a complex, multistep colloidal route followed by ball milling [19]. Moreover, many syntheses involve the use of antimony chloride as the antimony source, which in turn introduces chloride species contaminants (which are both difficult to remove and environmentally unfriendly). Thus, it would seem reasonable to propose that there is some use in developing a faster, easier route to synthesizing Sb particles.
In this study, we present an investigation into key parameters for developing a simple sol-gel route, using readily available and halogen-free precursors to Sb particles for use in sodium-ion batteries.

2. Results

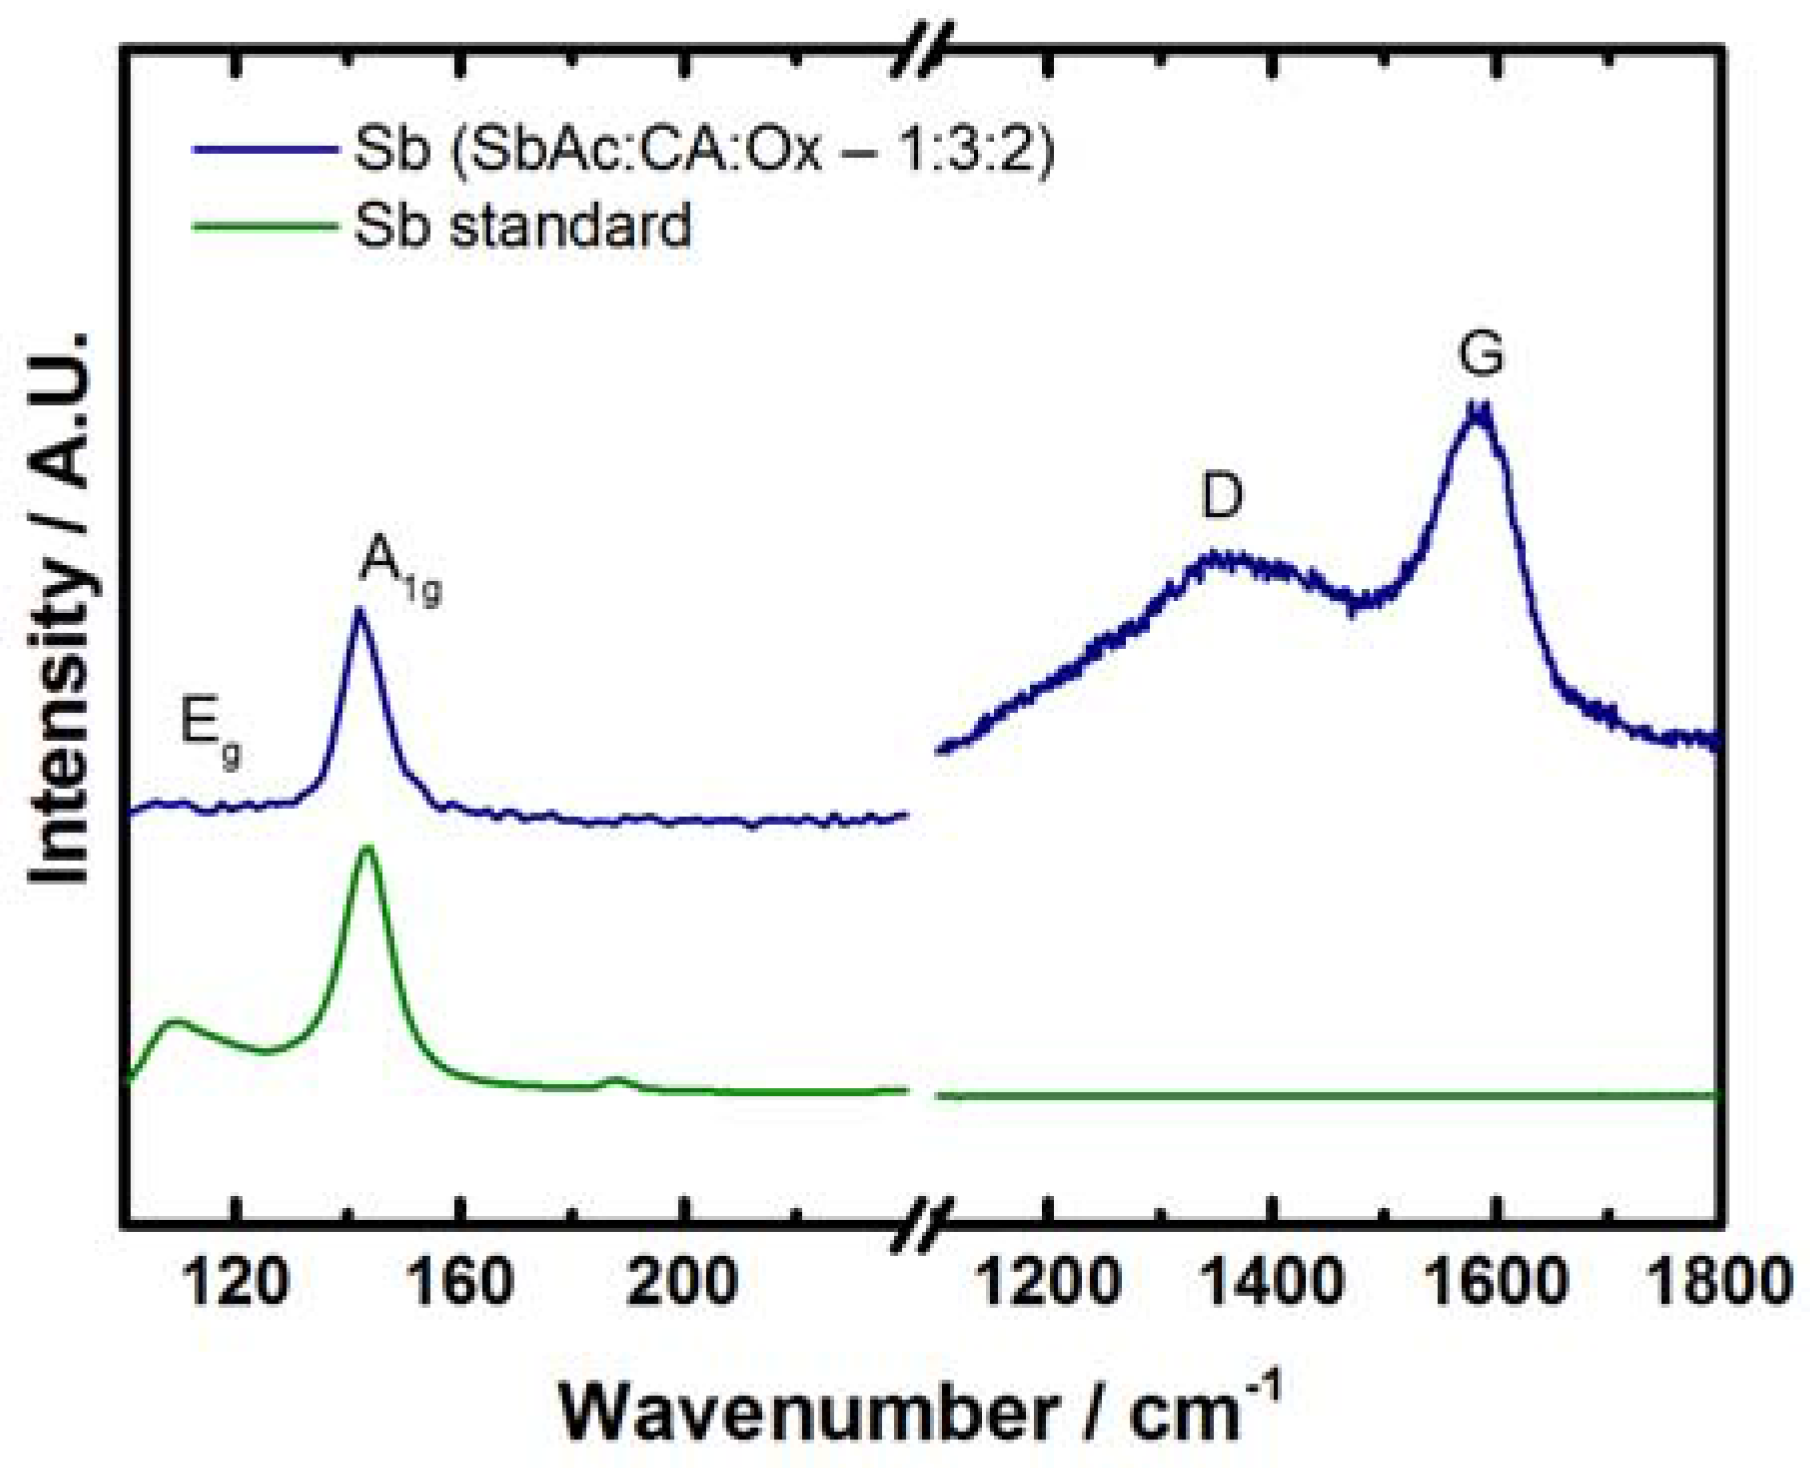
2.1. Antimony Acetate/Acetic Acid Synthetic Route

Previous research into autoignition self-combustion reactions has shown that it is possible to form particles of the pure metal by a routine sol-gel method [29]. This is a result of reductive gases formed from the reaction between citric acid and the nitrate salts of the metals, and reducing in situ the metal ion to its 0+ charge state. While there are few stable and potentially soluble antimony precursors suitable for this work, one objective was to avoid the presence of chloride ions (which typically result from the widely used antimony chloride precursor). Furthermore, it was desirable to make use of readily available chemicals. Thus, antimony acetate was selected as the antimony source and ammonium nitrate as the nitrate salt. Since the reducing gases are generated in situ as a result of the autoignition self-combustion reaction between ammonium nitrate (Ox) and citric acid (CA), it is possible to control the degree of reduction by altering the Ox:CA ratio.
Thus, the ratio of antimony to antimony oxide in the final product may be optimized, and subsequently quantified through the use of powder X-ray diffractometry (PXRD) as seen in Figure 1a.
Initially, prior to optimization, a high ratio of SbAc was used. However, examination of the PXRD patterns shows that the products with the SbAc:CA:Ox molar ratios of 1:0.3:0.3 and 1:0.3:0.1 do not appear to have any antimony metal present. This was likely due to the low amount of citric acid present in the gel limiting the amount of in situ reducing gases formed, and thus the reduction of the antimony ion. Interestingly, while the PXRD pattern of the 1:0.3:0.3 product corresponds to pure senarmontite Sb2O3, that of the 1:0.3:0.3 product exhibits additional peaks (marked with *) which appear to correspond to valentinite Sb2O3. While Sb2O3 may be used as an anode material, the conversion reaction between sodium ions and the oxide leads to a high irreversible capacity loss on the first cycle [30,31,32,33,34]. This might be undesirable in a full cell, so additional optimization was undertaken so as to obtain a pure Sb product. The PXRD pattern of Sb (SbAc:CA:Ox—1:1:2) shows some small quantity of Sb metal formation in the product. Increasing the quantity of CA in the starting precursor increased the Sb metal and decreased the Sb2O3 content. Finally, the PXRD pattern of the Sb (SbAc:CA:Ox—1:3:2) product showed only pure Sb metal present.
The presence of carbon from CA reduction gives a broad band at ca. 25–30 ° in PXRD, shown in Figure 1a, becoming more intense as the CA content is increased. However, it should be noted that the Sb metal in the Sb (SbAc:CA:Ox—1:3:2) product exhibits broad, weak peaks in the PXRD pattern. This may be indicative of the small crystallite size present in the Sb particles, or the low crystallinity of the sample.
Since Sb particle size is a key factor affecting its electrochemical performance, it is important to determine this prior to subsequent testing. Scanning electron microscopy (SEM) was carried out on the Sb (SbAc:CA:Ox—1:3:2) material, as shown in Figure 1b,c. Examination of these images showed the presence of large particles (up to, and including, 100 µm in size) in the product. It has previously been noted that autoignition self-combustion reactions can reach high temperatures, sometimes in excess of 1000 °C [29]. Given that the melting point of Sb is ca. 630 °C, and that of Sb2O3 is ca. 656 °C, it seems likely that high temperatures were reached during the self-combustion stage, leading to the product melting and agglomerating to form these large Sb particles. Further characterization of the particle size was undertaken, and the results presented in Table 1.
As can be seen from this, the obtained Sb (SbAc:CA:Ox—1:3:2) material consisted predominantly of large particles. It is worth noting that such large particles are poorly suited for electrochemical testing, and are particularly susceptible to pulverization resulting from the large volume changes they incur during cycling. Moreover, an electrode would be less able to mitigate the volume expansion, leading to faster fading due to loss of electrical contact. Thus, from the perspective of their physical properties, this material is not well suited for electrochemical testing.
Raman spectroscopy was then carried out on the Sb (SbAc:CA:Ox—1:3:2) material in order to examine the Sb and carbon content in greater detail, as shown in Figure 2.
It has previously been shown that the structure of Sb metal is trigonal A7, and that its Raman spectrum consists of an Eg and A1g band (here seen at ca. 112 cm−1 and 150 cm−1), which correspond to transverse and longitudinal motion within the structure, respectively [35].
Thus, as can be seen from the spectrum, the Sb (SbAc:CA:Ox—1:3:2) product contains Sb metal. It is worth noting that, in comparison to the Sb standard spectrum, the Sb (SbAc:CA:Ox—1:3:2) Eg band is smaller than the A1g band. This may be indicative of some slight degree of structural disorder in the transverse direction, possibly due to the partially amorphous nature of the Sb or to the short-ranged crystallinity from small crystallites, as seen by PXRD. However, further characterization would be necessary to determine this. Also visible in the Raman spectrum are D and G bands, which may be associated with carbon residue remaining after the decomposition of the citric acid gel. Quantification was undertaken and the amount of carbon residue was found to be ca. 35 wt %. While the presence of large quantities of carbon in the product might be expected to help mitigate volume expansion, and thus increase cyclability, it would also necessarily significantly decrease the gravimetric capacity based on the total composite mass. The low ID/IG value found in the Raman spectrum indicates the highly graphitic structure of the carbon residue, which could be a consequence of the previously mentioned high temperatures reached during the self-combustion.
Given the presence of significant quantities of carbon, as well as the large particle size, it seems unlikely that these materials are currently well-suited to use as “battery grade” pure antimony for lab-scale research. However, it should be noted that this synthetic route nevertheless possesses some attractive properties, such as the rapidity with which the synthesis may be completed, the relatively low temperatures needed, the availability of reagents, and the lack of halogenated precursors and contaminants. Further optimization of this synthetic route may lead to a purer product with smaller particle size, which would be better suited for electrochemical testing.

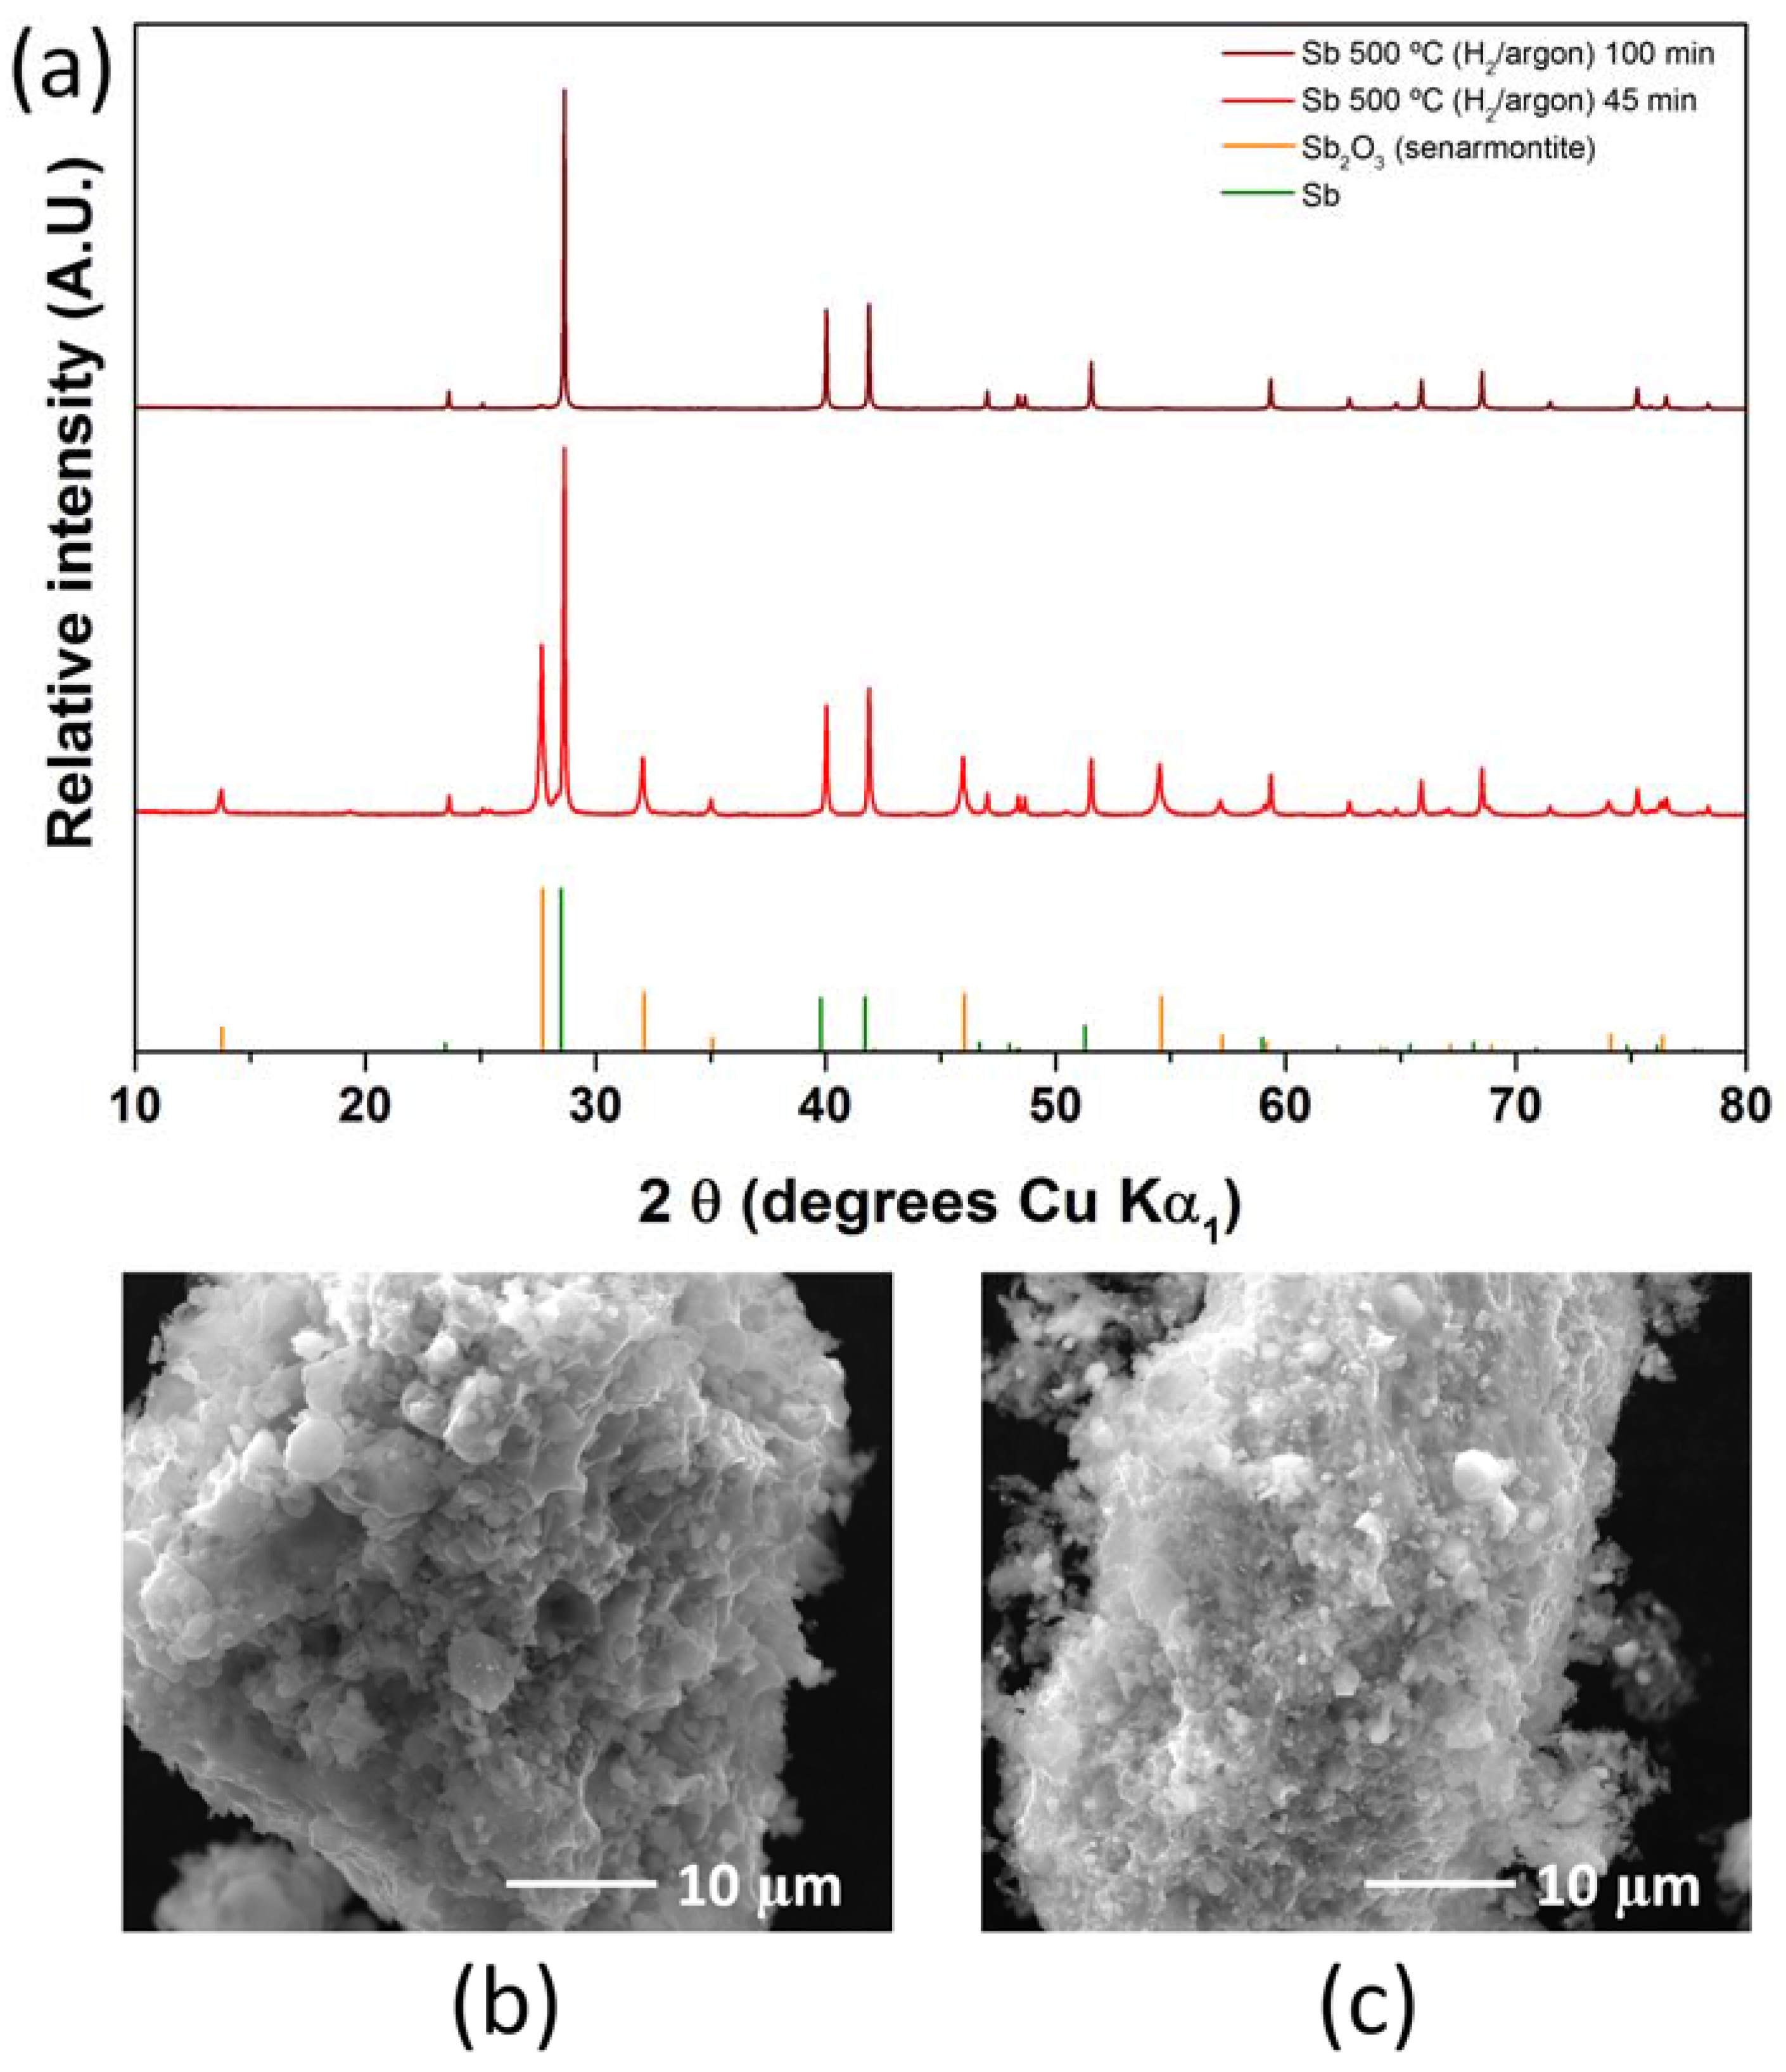
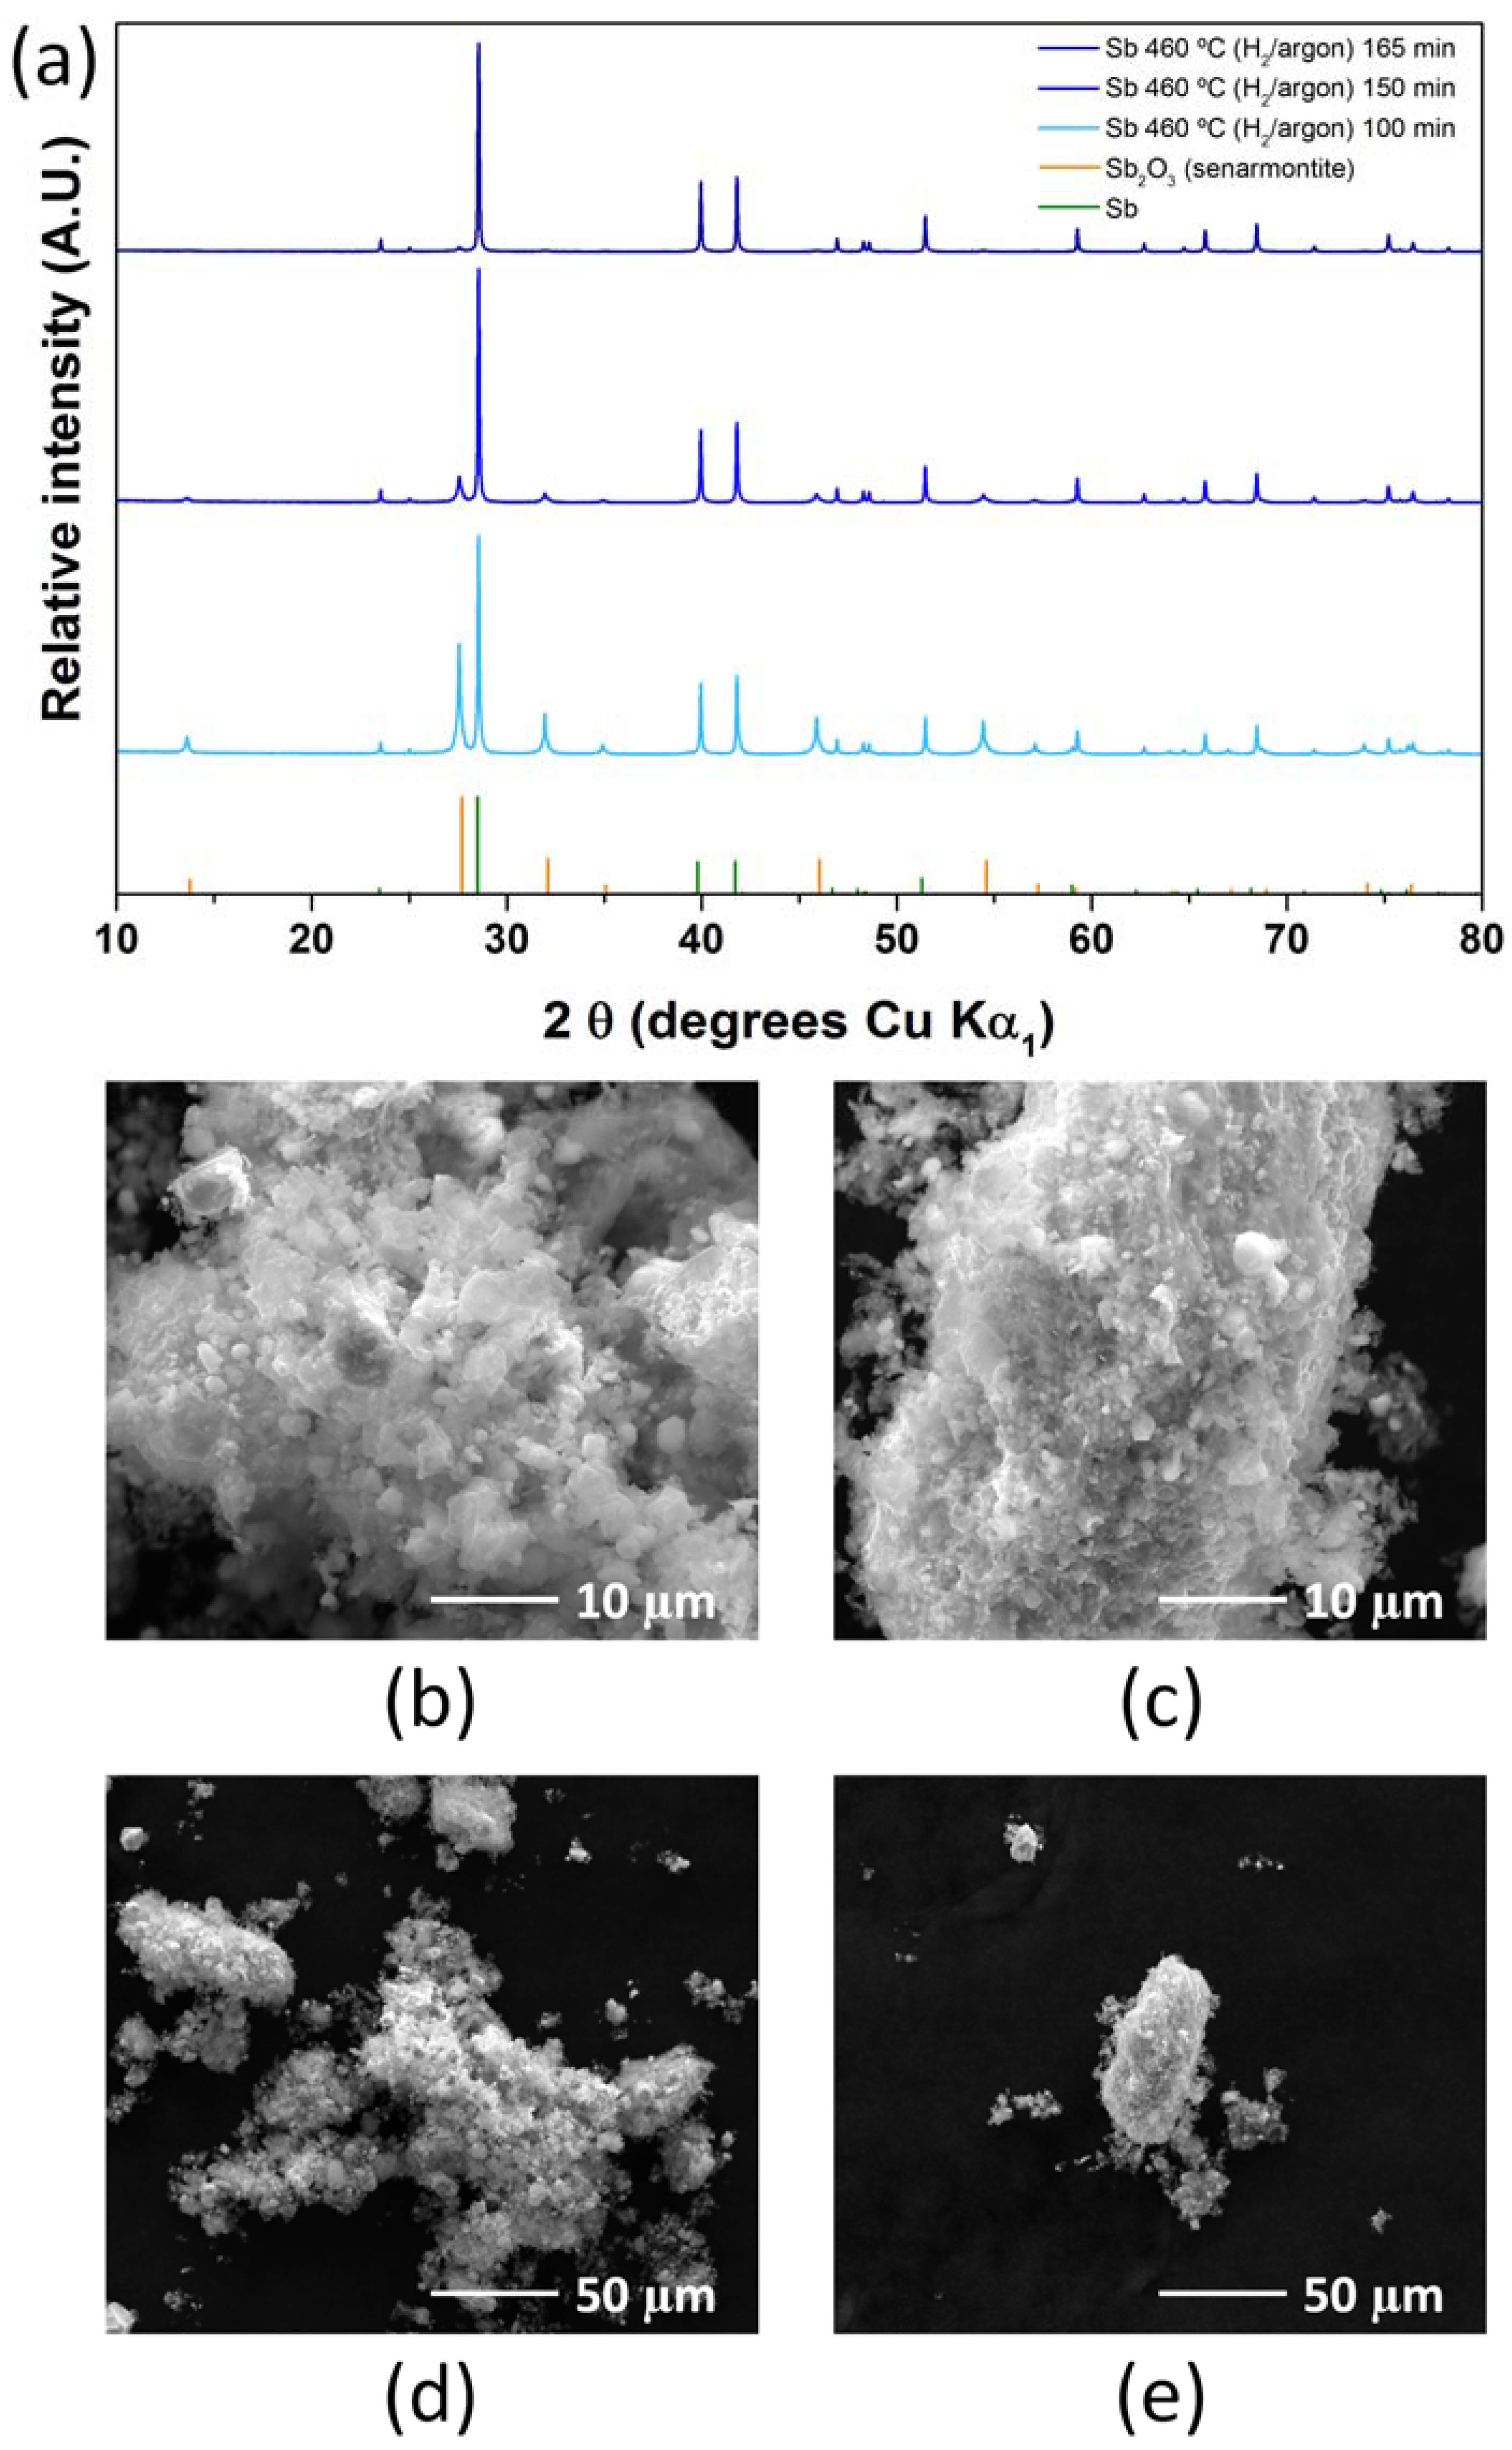
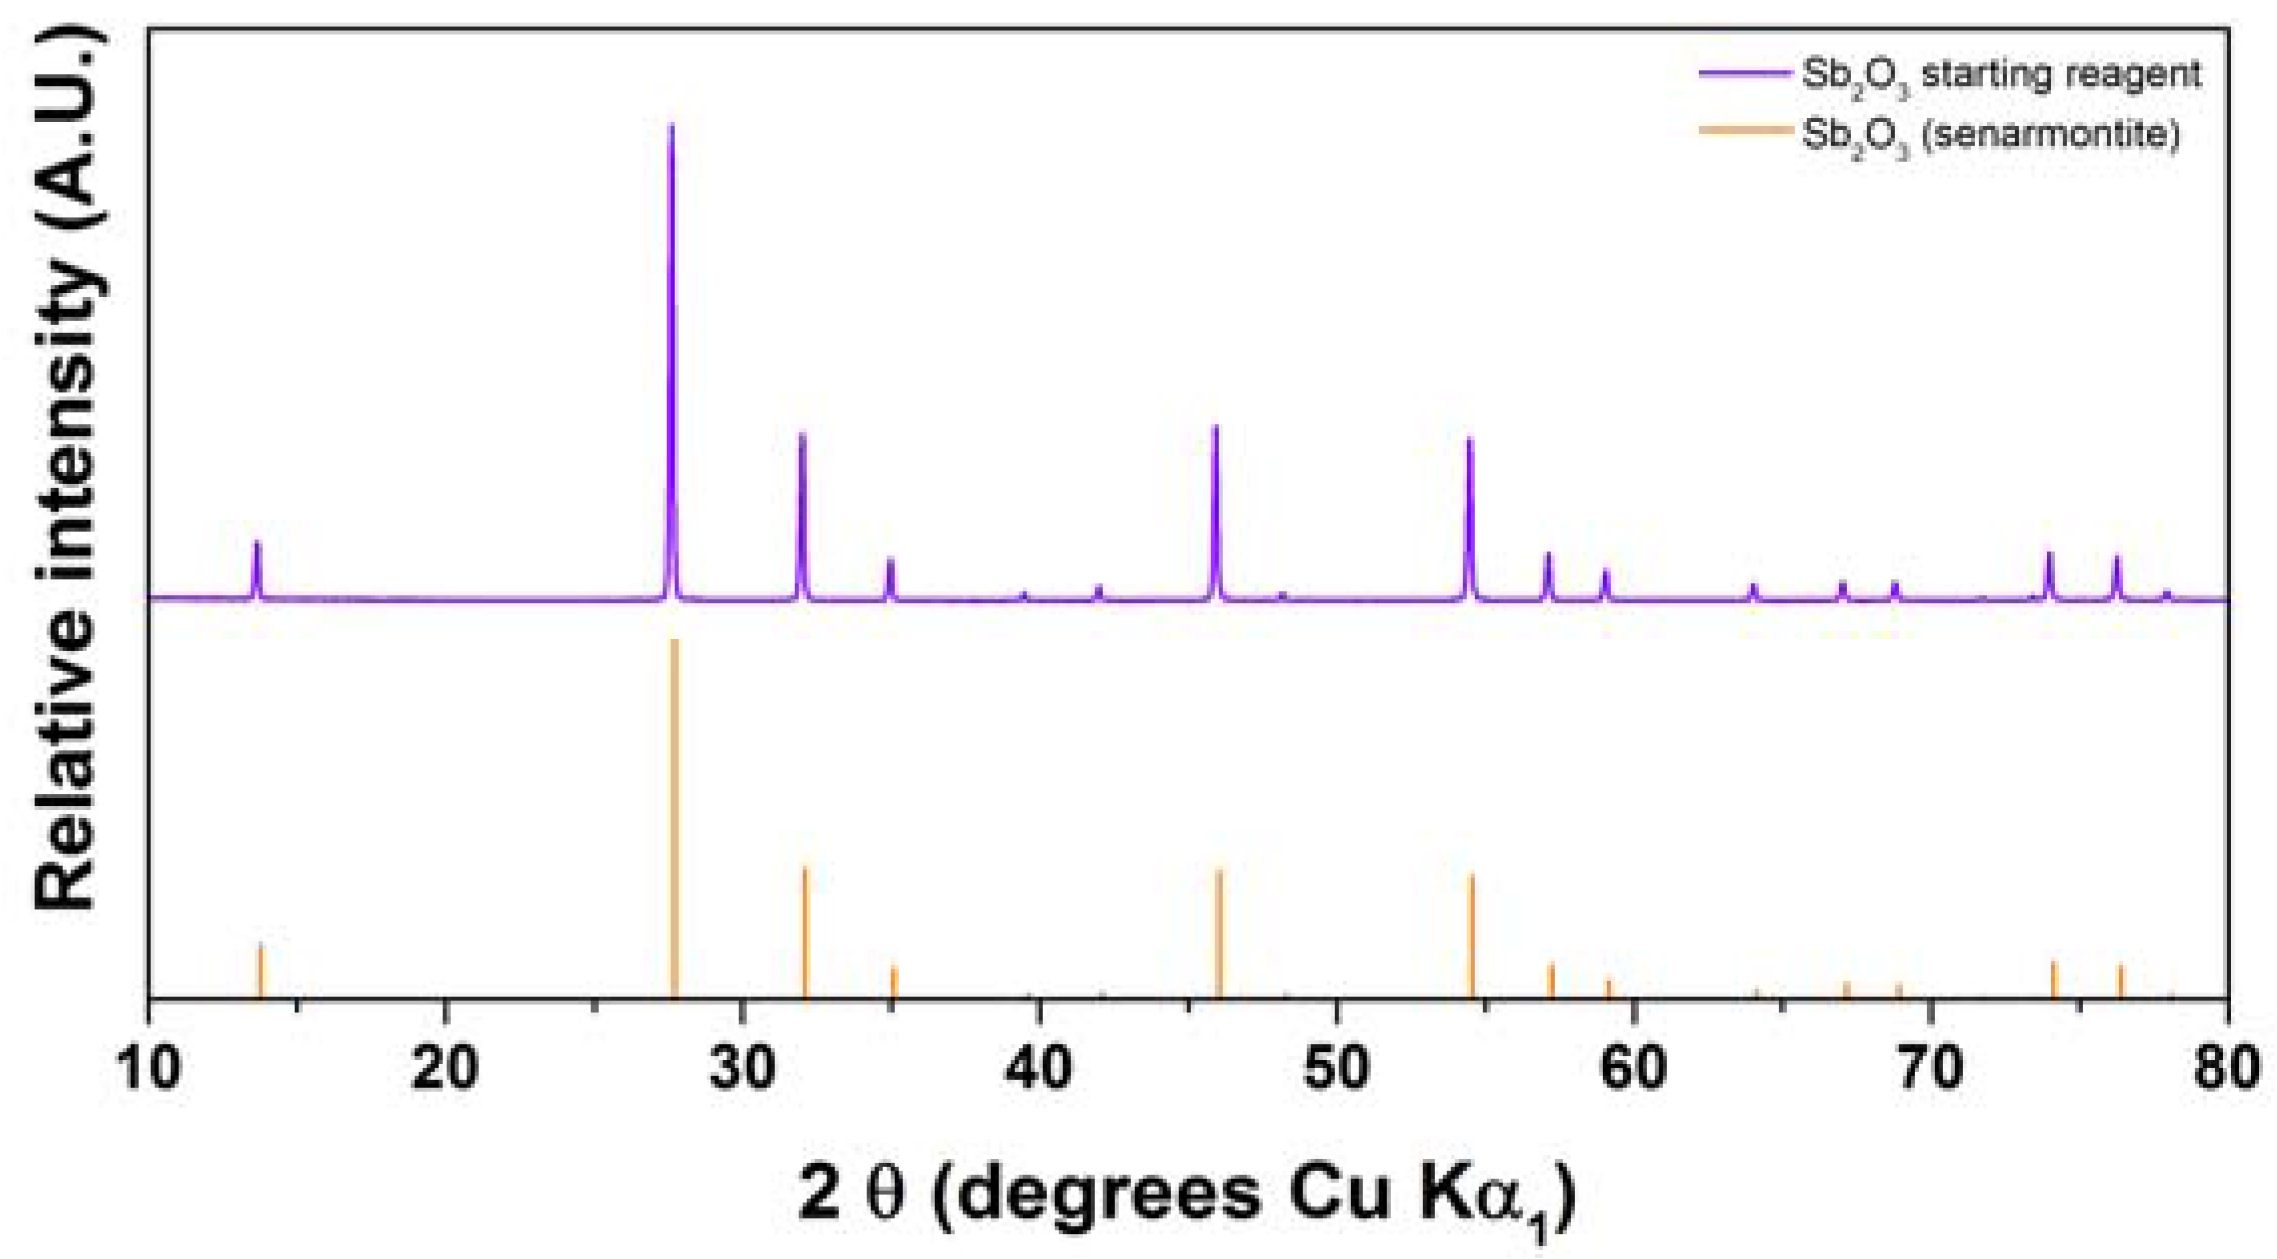
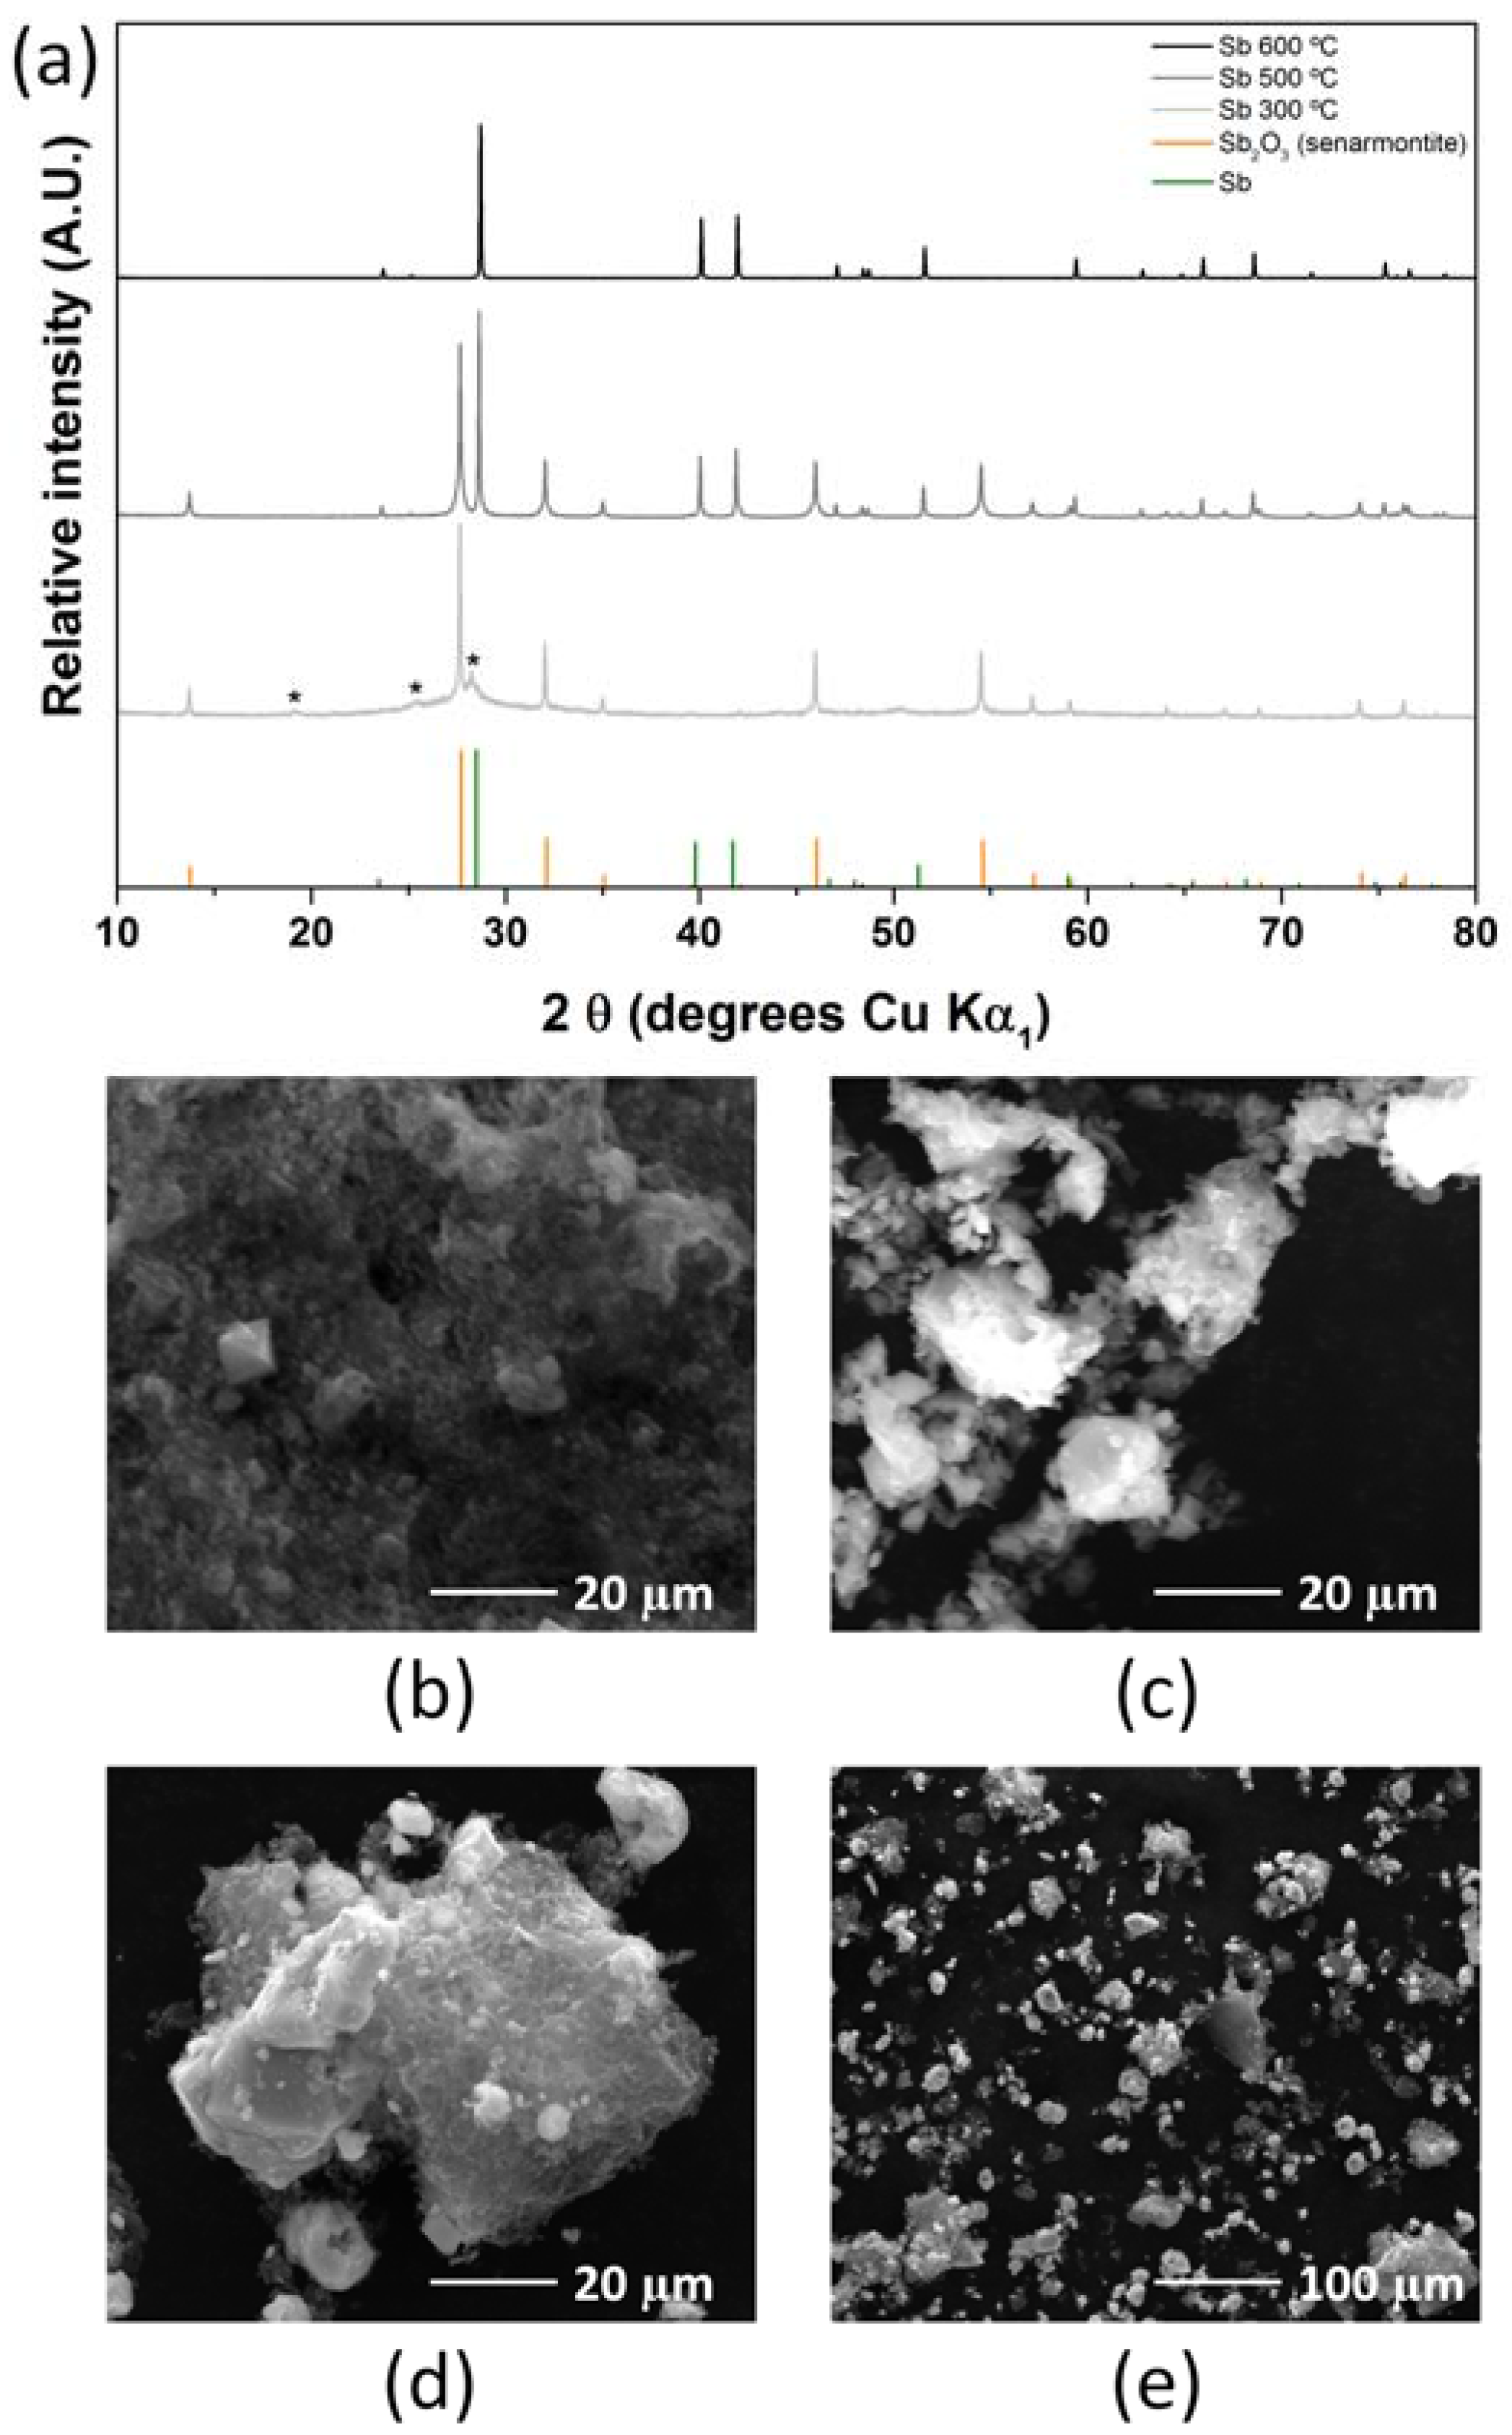
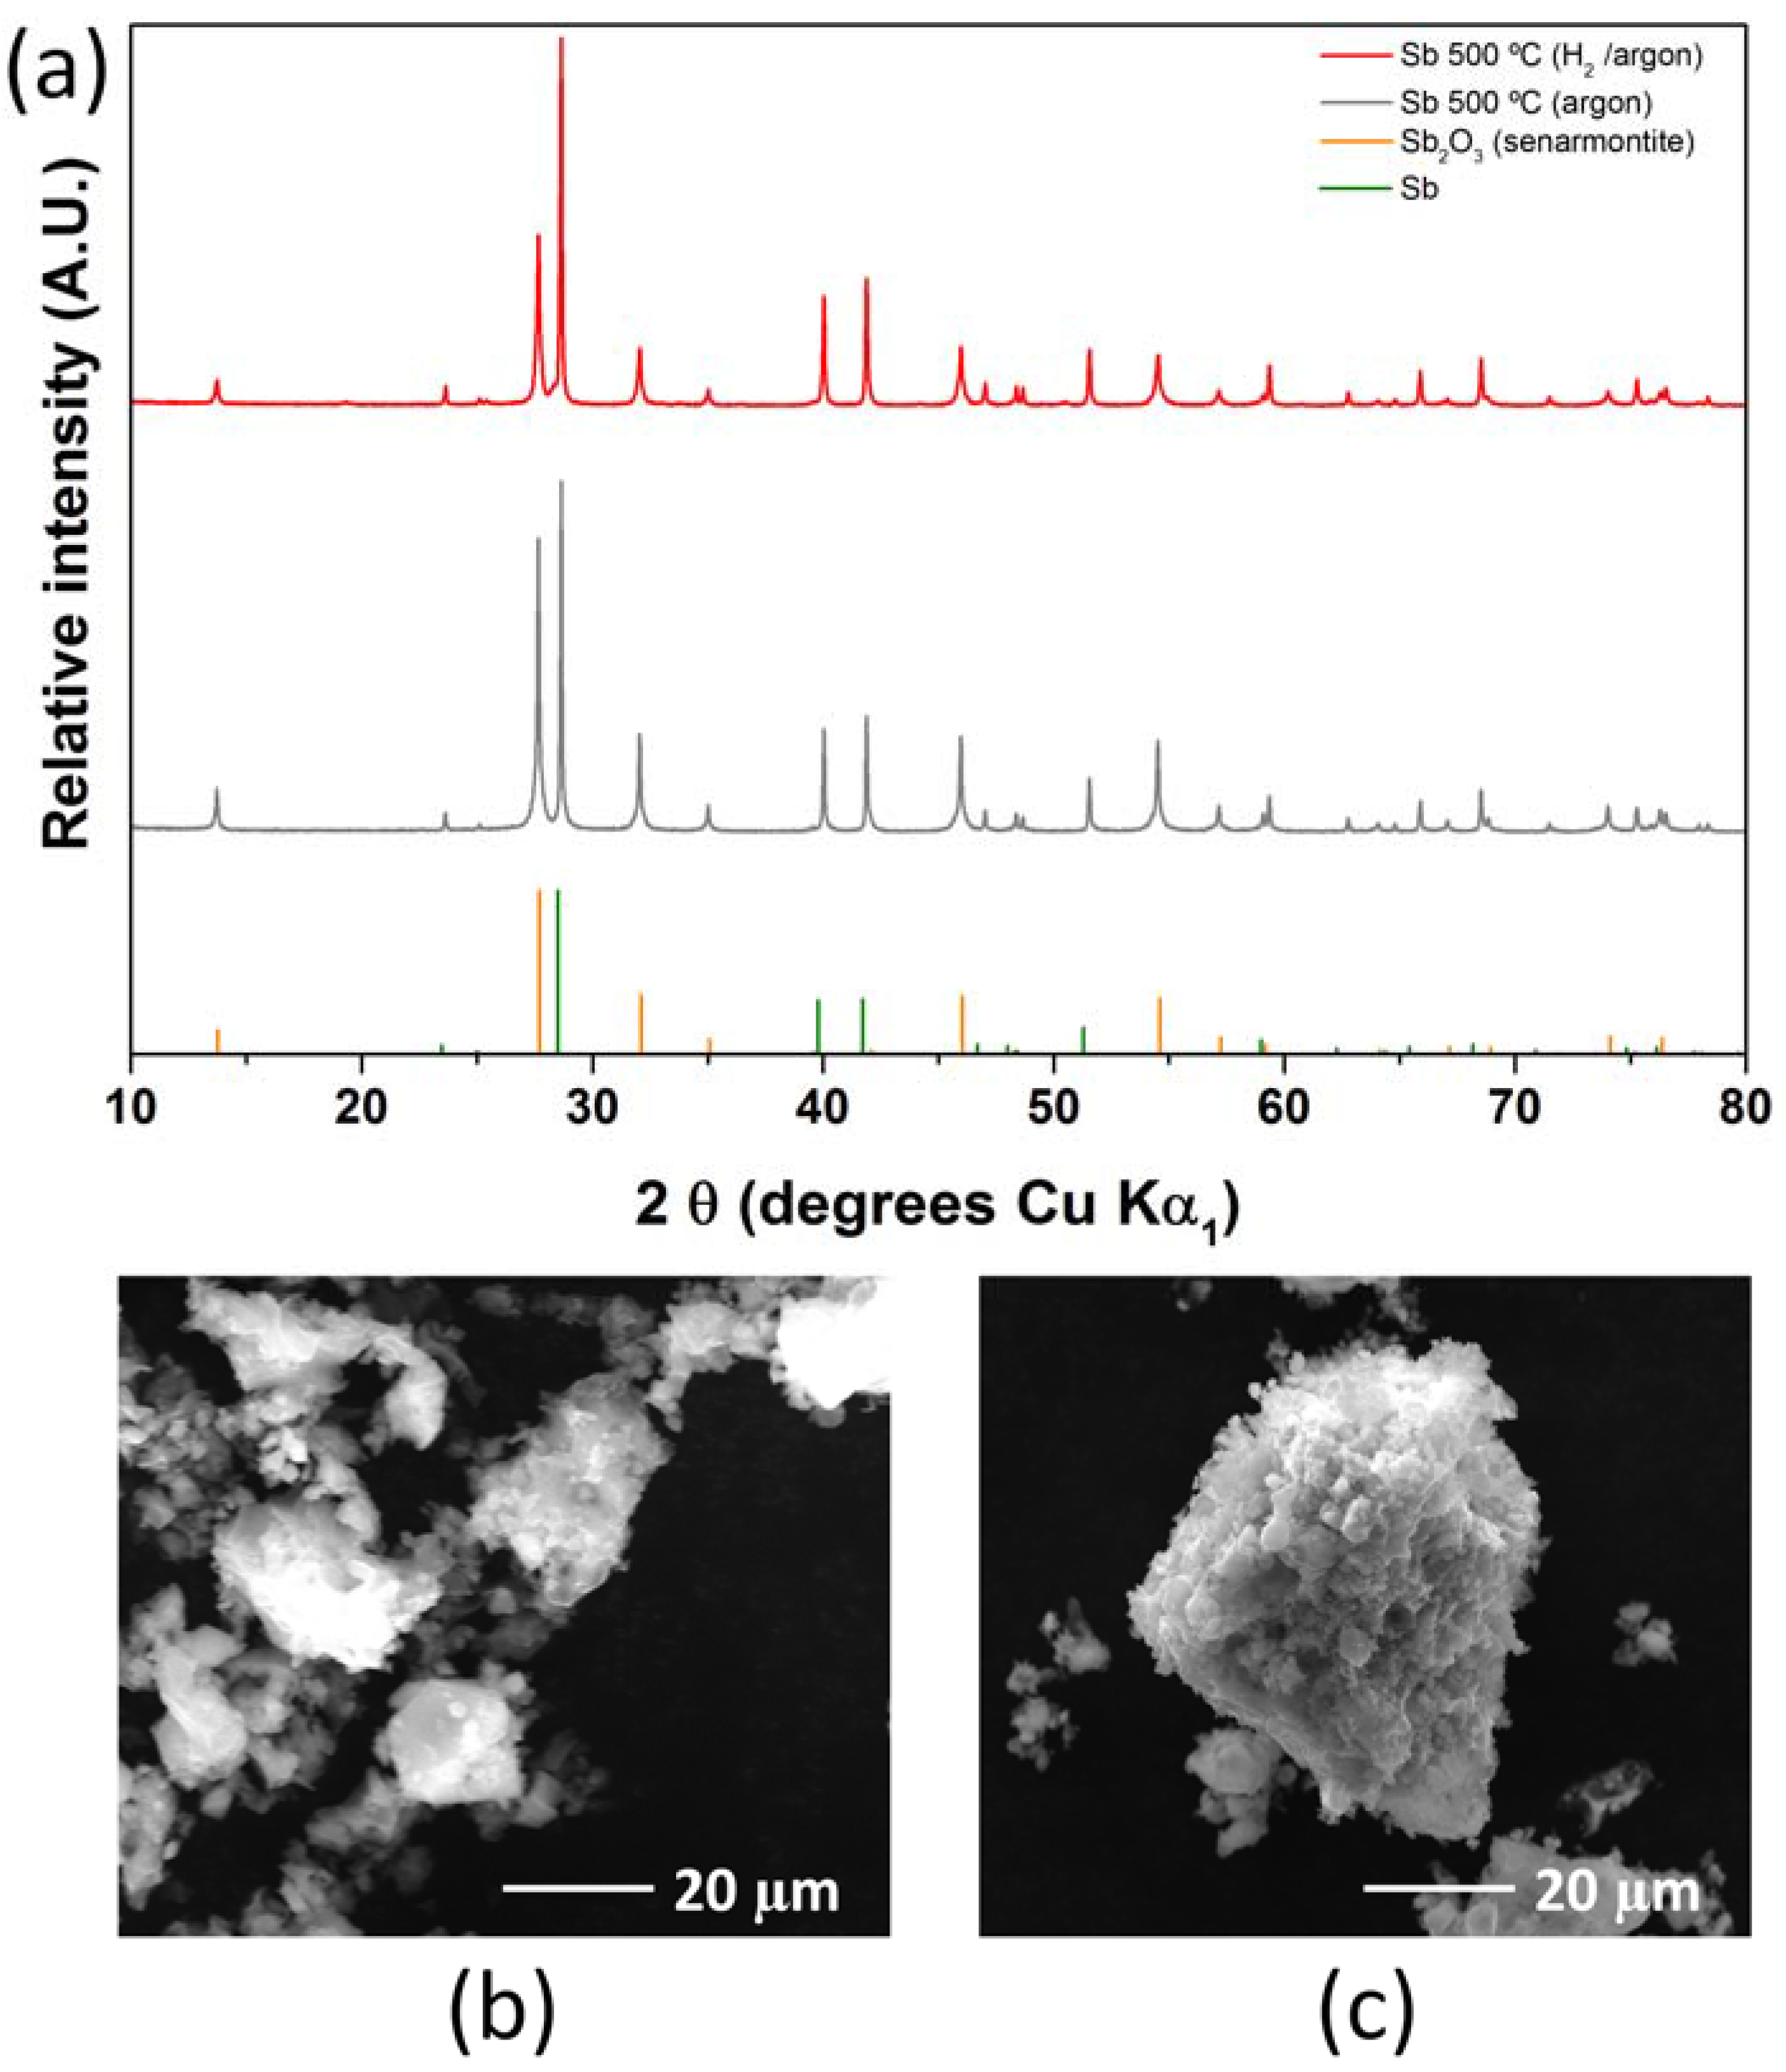
2.2. Antimony Oxide Synthetic Route

In order to have greater control of the temperature during the combustion of the citric acid (CA) gel, an alternative route was devised which eliminated the use of the ammonium nitrate oxidizing agent. Again, to make use of readily available, chloride-free chemicals, antimony oxide, nitric acid, and citric acid were employed as the starting reagents. In summary, this synthesis may be thought of as taking place over two steps: (i) Gelation, and (ii) Combustion, as shown in Scheme 1.
Step (i) Gelation is undertaken by dissolving the Sb2O3 precursor and citric acid gelling agent in nitric acid, followed by heating to form the gel. Continued heating, to ensure the maximum removal of liquid, is maintained until an orange-brown solid precursor is formed. This is then removed, loosely ground via pestle and mortar to form a powder, and transferred to a boat.
Step (ii) Combustion is undertaken by heating the precursor under a constant gas flow, at the selected temperature and for the selected time. After cooling and grinding, the final product is obtained.
Examination of the starting Sb2O3 reagent was undertaken so as to identify its phase. As can be seen from the PXRD data, shown in Figure 3, it consists of pure senarmontite Sb2O3.
Thus, while the presence of senarmontite Sb2O3 may result from either unreacted precursor or insufficiently optimized reaction conditions, the presence of valentinite Sb2O3 and Sb metal may be attributed to the effect of the environment experienced during synthesis.
Initially, the synthesis was performed at 300 °C for 45 min. under a constant flow of argon gas. The PXRD pattern of the product, shown in Figure 4a, reveals that no Sb was present. Instead, there was only Sb2O3 in both senarmontite and valentinite forms.
Subsequent syntheses at increasing plateau temperatures were undertaken to investigate the effect of the heating regime on the final product. The PXRD analyses of the resulting materials shows that increasing the calcination temperature does indeed increase the Sb content in the final product.
Examination of the particle size of the products, shown in Figure 4b–d, is also revealing. From this it can be seen that increasing the calcination temperature not only results in a purer product, but also appears to increase the product particle size.
This may be significant given the previous observations regarding the particle size of the SbAc:CA:Ox—1:3:2. If, as suggested, the self-combustion of the gel with the optimized CA:Ox ratio is indeed achieving high temperatures, this would be in keeping with these results, where higher temperature syntheses have larger particles of a purer product. That being the case, careful control of temperature will be key to minimizing particle size.
In an effort to reduce the calcination temperature, slightly reducing gas (5% H2/argon) was used. Comparison between the PXRD patterns of the two materials synthesized at 500 °C, one under an argon and one under an H2/argon gas flow, reveals that the product formed under an H2/argon has decreased Sb2O3 content, as shown in Figure 5a.
Given the increasing reduction of Sb2O3 under H2/argon, it was decided that the use of this gas may well facilitate lower temperature reactions. However, a comparison between SEM images taken of the two materials, shown in Figure 5b,c, reveals that the Sb 500 °C (argon) has a non-uniform distribution of smaller particles, while the Sb 500 °C (H2/argon) material appears to have formed agglomerations of more uniform, small particles. Nevertheless, it would seem that the use of 5% H2/argon gas will be a useful tool for facilitating chemical reduction and the formation of Sb. In general, in addition to heating temperature, heating time may also have a significant effect on the nature of a product. To examine this, a comparison was made between Sb heated under the conventional regime (45 min at 500 °C under H2/argon) and Sb heated under the same conditions except for the heating time (which was increased to 100 min). Subsequently, the PXRD patterns shown in Figure 6a.
From the SEM images, shown in Figure 6b, it can be seen that the two samples share similarities, with both consisting of small particles fused together to form larger agglomerated particles. However, it may also be seen that this degree of agglomeration is greater after 100 min than after 45 min. Thus, while the increased heating time does indeed improve the product purity, care must be taken to optimize this as it may also effect the product particle size.
To summarize: it would appear that (A) decreasing heating temperature decreases particle size, but increases Sb2O3 impurity; and (B) increasing heating time decreases Sb2O3 impurities.
Thus, it was proposed that decreasing the heating temperature but increasing the time may result in an Sb product with decreased particle size. The first material was synthesized by using a decreased temperature comparative to Sb 500 °C (H2/argon) 100 min, but keeping all other parameters the same. The resulting product, Sb 460 °C (H2/argon) 100 min, was then analyzed using PXRD, as shown in Figure 7a.
From this, it can be seen that reducing the temperature but maintaining the same heating time results in an increase in Sb2O3 impurity. Increasing the heating time, however, does reduce the quantity of Sb2O3 impurity, leading to the Sb 460 °C (H2/argon) 165 min product, which contains nearly pure Sb.
Using SEM, it is possible to compare the particle size of the Sb 460 °C (H2/argon) 165 min product and the Sb 500 °C (H2/argon) 100 min sample, as shown in Figure 7b–e. This reveals that while both materials consist of fused agglomerates of small particles, by comparison the Sb 460 °C (H2/argon) 165 min product particles seems less fused and more dispersed. This would seem to demonstrate that, although further work would be necessary to truly obtain much smaller particles, the strategy being employed here was successful in leading to a product with more desirable physical properties.
Further characterization of particle size was undertaken and, as shown in Table 2, it was found that all values of particle distribution were smaller for the Sb 460 °C (H2/argon) 165 min sample than for the Sb 500 °C (H2/argon) 100 min sample.
This confirmed what was observed in the SEM images and expected from the synthesis conditions—i.e., that the Sb 460 °C (H2/argon) 165 min product consisted of smaller, less fused, more dispersed particles, making it better suited to mitigating volume changes and, thus, better suited for use as an anode material in sodium ion batteries.
In order to further investigate the properties of these two materials, the Raman spectra of both were collected and normalized using the A1g band, as shown in Figure 8.
From the Raman spectra taken of the Sb 460 °C (H2/argon) 165 min and Sb 500 °C (H2/argon) 100 min products there are several noteworthy features.
Firstly, the bands assigned to A1g and Eg are present, demonstrating the presence of antimony at the near-surface of the product particles. The Eg band of the two materials is easily visible, in contrast to the Sb (SbAc:CA:Ox—1:3:2) product which is likely due to the more crystalline nature of these products which may be inferred from the PXRD patterns.
Secondly, there is no easily discernable pattern that may be associated with Sb2O3. This would be in keeping with the expected reduction mechanism—i.e., that the reduction of the materials is likely taking place due to reductive gases reacting with the product particles predominately at the particle surface.
Thirdly, D and G bands, assigned to carbon residue originating from the citric acid hydrocarbon gel, are still present, though greatly decreased in intensity comparative to the Sb (SbAc:CA:Ox—1:3:2) product. This would imply that though carbon residue is still present, it is in far less an amount than in the acetate-based synthesis. The carbon contents of the Sb 460 °C (H2/argon) 165 min and Sb 500 °C (H2/argon) 100 min products were quantified by elemental analysis and found to be 14 wt % and 12 wt %, respectively.

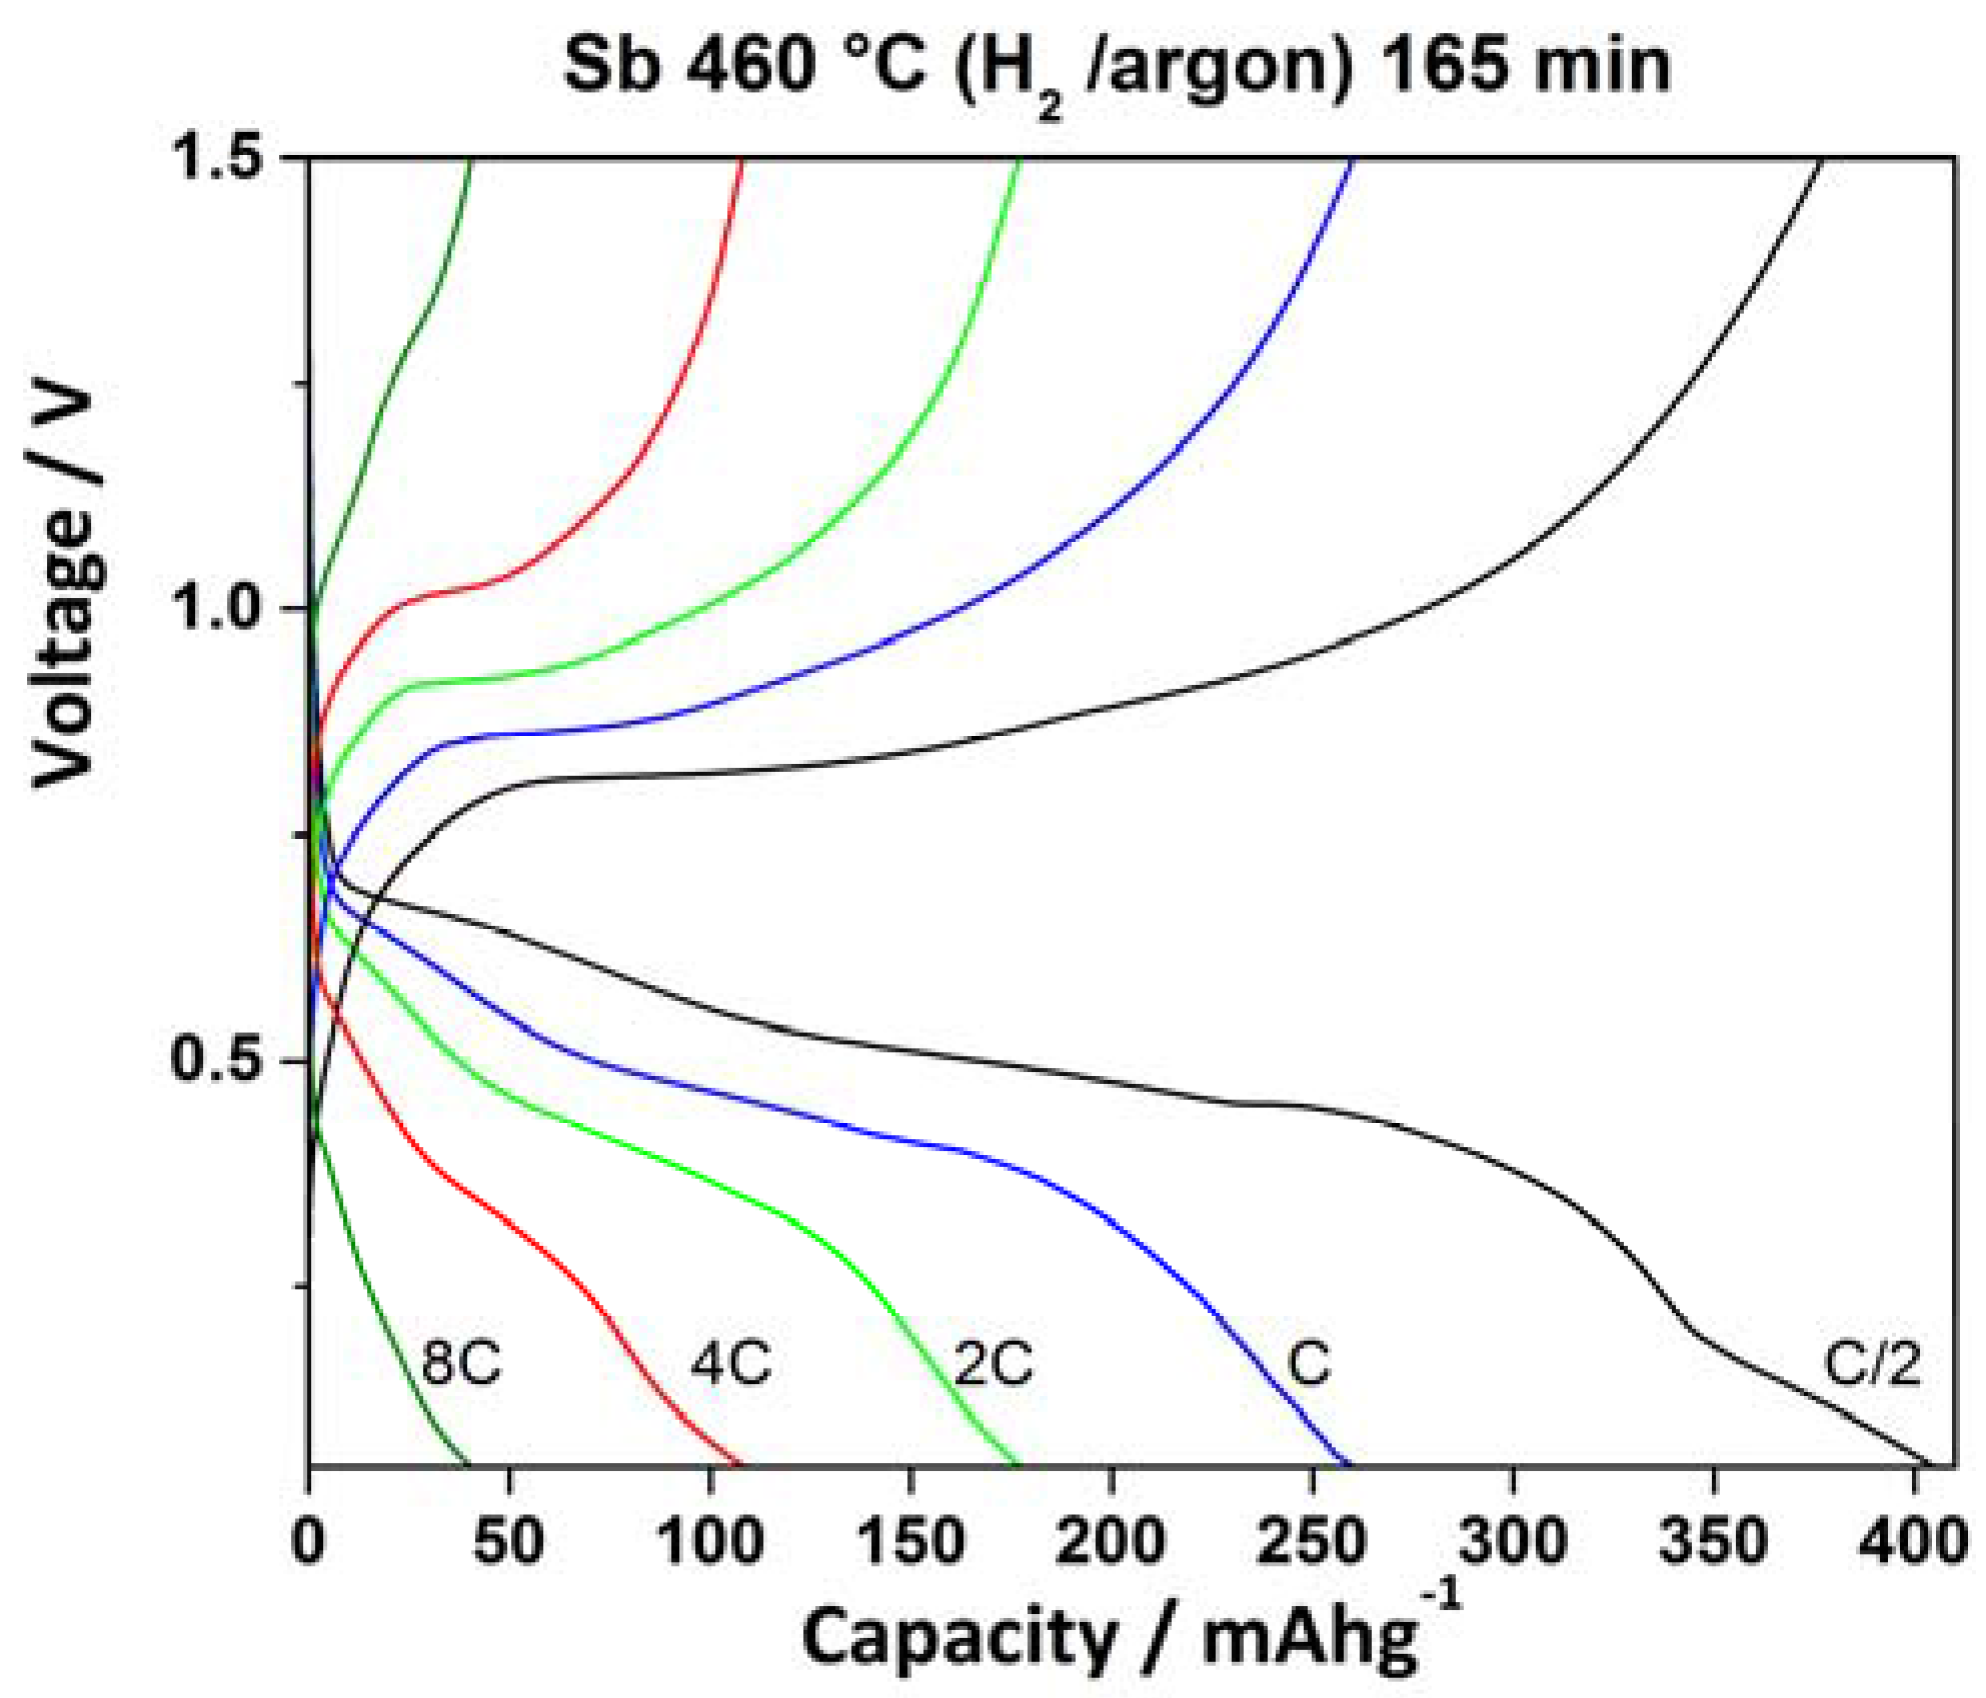
2.3. Electrochemical Characterization

To investigate the electrochemistry of the Sb 460 °C (H2/argon) 165 min and Sb 500 °C (H2/argon) 100 min products, coin cells were fabricated and cycled—first with a single C/10 preconditioning cycle, then at varying C-rates or 1C, as shown in Figure 9a,b.
The rate capability plots, shown in Figure 9a, demonstrate that the Sb 460 °C (H2/argon) 165 min material exhibits better specific charge at the higher rate of 4C (ca. 115 and 85 mAh g−1 for Sb 460 °C (H2/argon) 165 min and Sb 500 °C (H2/argon) 100 min, respectively) which is likely due to the smaller, less fused particles of this material being better suited to the diffusion of sodium ions into, and out of, the material during cycling.
At the highest rate, 8C, both materials delivered similar low capacity, indicating that the morphology of these materials, which is yet to be fully optimized, is not well-suited to sodiating and desodiating at this high rate. When returning to the slow rate, C/2, both materials were able to recover their original specific charge values, although the Sb 460 °C (H2/argon) 165 min material exhibited better capacity retention. Examination of the voltage profiles of Sb 460 °C (H2/argon) 165 min at different rates (shown in Figure 10) reveals the expected electrochemical behavior, with the plateaus decreasing at increasing rates, likely due to larger polarization.
The plateaus occur at voltages comparable to those reported in the literature, demonstrating the electrochemical behavior of this material is in keeping with that which may be reasonably anticipated.
The 1st cycle sodiation values—ca. 803 and 762 mAh g−1 for Sb 460 °C (H2/argon) 165 min and Sb 500 °C (H2/argon) 100 min, respectively—of both materials taken at the C/10 rate are shown in Figure 9b, where it can be seen that they are greater than the theoretical capacity of these materials (660 mAh g−1). This is likely due to SEI formation and other side reactions. The 1st cycle desodiation values are ca. 472 and 444 mAh g−1, lower than the theoretical capacity, likely due to A) unoptimized particle size and B) electrochemically inactive residual carbon in the product adding to the product mass. While better rate capability has been previously reported when graphene is used to from composites [30,31,32,33], initial desodiation capacities at low rates are generally reported in the range of 450 to 500 mAh g−1—similar to our findings. In some cases, the specific charge reported here are similar, or even superior, to the literature. For example, SbOx nanoplates encapsulated by carbon flakes prepared from SbCl3 in a three-step procedure [34] exhibited over 100 mAh g−1 at 4 A g−1 (ca. 6C), while our one-pot synthesis material delivered about 115 mAh g−1 at 4C. The specific charge of 260 mAh g−1 at 1C reported here also exceeds the 205 mAh g−1 at 800 mA g−1 (ca. 1.2C) demonstrated by Wang et al. [33] for graphene anchored Sb/SbOx nanoparticles prepared via a two-step wet chemical process (involving the reduction of SbCl3 with NaBH4 in benzyl alcohol).
From the cyclability plot shown in Figure 9b, it may be seen that the capacity retention at 1C of Sb 460 °C (H2/argon) 165 min is superior (ca. 50% and 38% for Sb 460 °C (H2/argon) 165 min and Sb 500 °C (H2/argon) 100 min, respectively), which may be attributed to the smaller, less fused particles being better able to mitigate the large volume changes occurring during sodiation/desodiation. The overall capacity fading may be attributed, at least in the main, to pulverization resulting from the large volume changes undergone by the antimony particles during sodiation/desodiation
The differential capacity plots of cycles 1 and 2 of Sb 460 °C (H2/argon) 165 min, taken at 1C, are shown in Figure 11.
During sodiation, electrochemical activity is observed at ca. 0.47 V vs. Na+/Na during cycle 1, and at 0.6 and 0.45 vs. Na+/Na during cycle 2. During desodiation, electrochemical activity is observed at ca. 0.78 V and 0.88 vs. Na+/Na during cycle 1, and in the 0.8–09 V vs. Na+/Na during cycle 2. These results are in keeping with those previously reported in the literature [36], implying that the sodiation/desodiation mechanism is generally consistent with the reversible alloying reaction expected for a material predominantly consisting of Sb.

3. Conclusions

This work examines sol-gel synthetic routes to producing Sb metal particles for use as anode materials in sodium-ion batteries. While further work would be necessary to fully optimize this technique, particularly towards a smaller particle size, several key parameters have been found, including: heating temperature; heating time; and choice of gas flow.
By employing an understanding of the effect of these parameters, it has been possible to undertake some initial optimization. This has resulted in the reduction of particle size from large, ≤ 100 µm particles to ≤ 60 µm fused agglomerates of smaller particles. The optimization of these physical parameters has been accompanied by an improvement to the electrochemical properties, leading to the Sb 460 °C (H2/argon) 165 min material which has an initial desodiation capacity of ca. 472 mAh g−1 and 50% retention over 60 cycles.
By further optimization of the parameters, and of heating temperature and time in particular, it may be possible to improve this process still further, leading to Sb particles with improved physical and electrochemical characteristics. Finally, it is worth noting the potential utility of this work to lab-scale research on intermetallic anode materials—namely that a fast and facile synthetic route to antimony particles with moderate electrochemical performance has been developed.

4. Materials and Methods

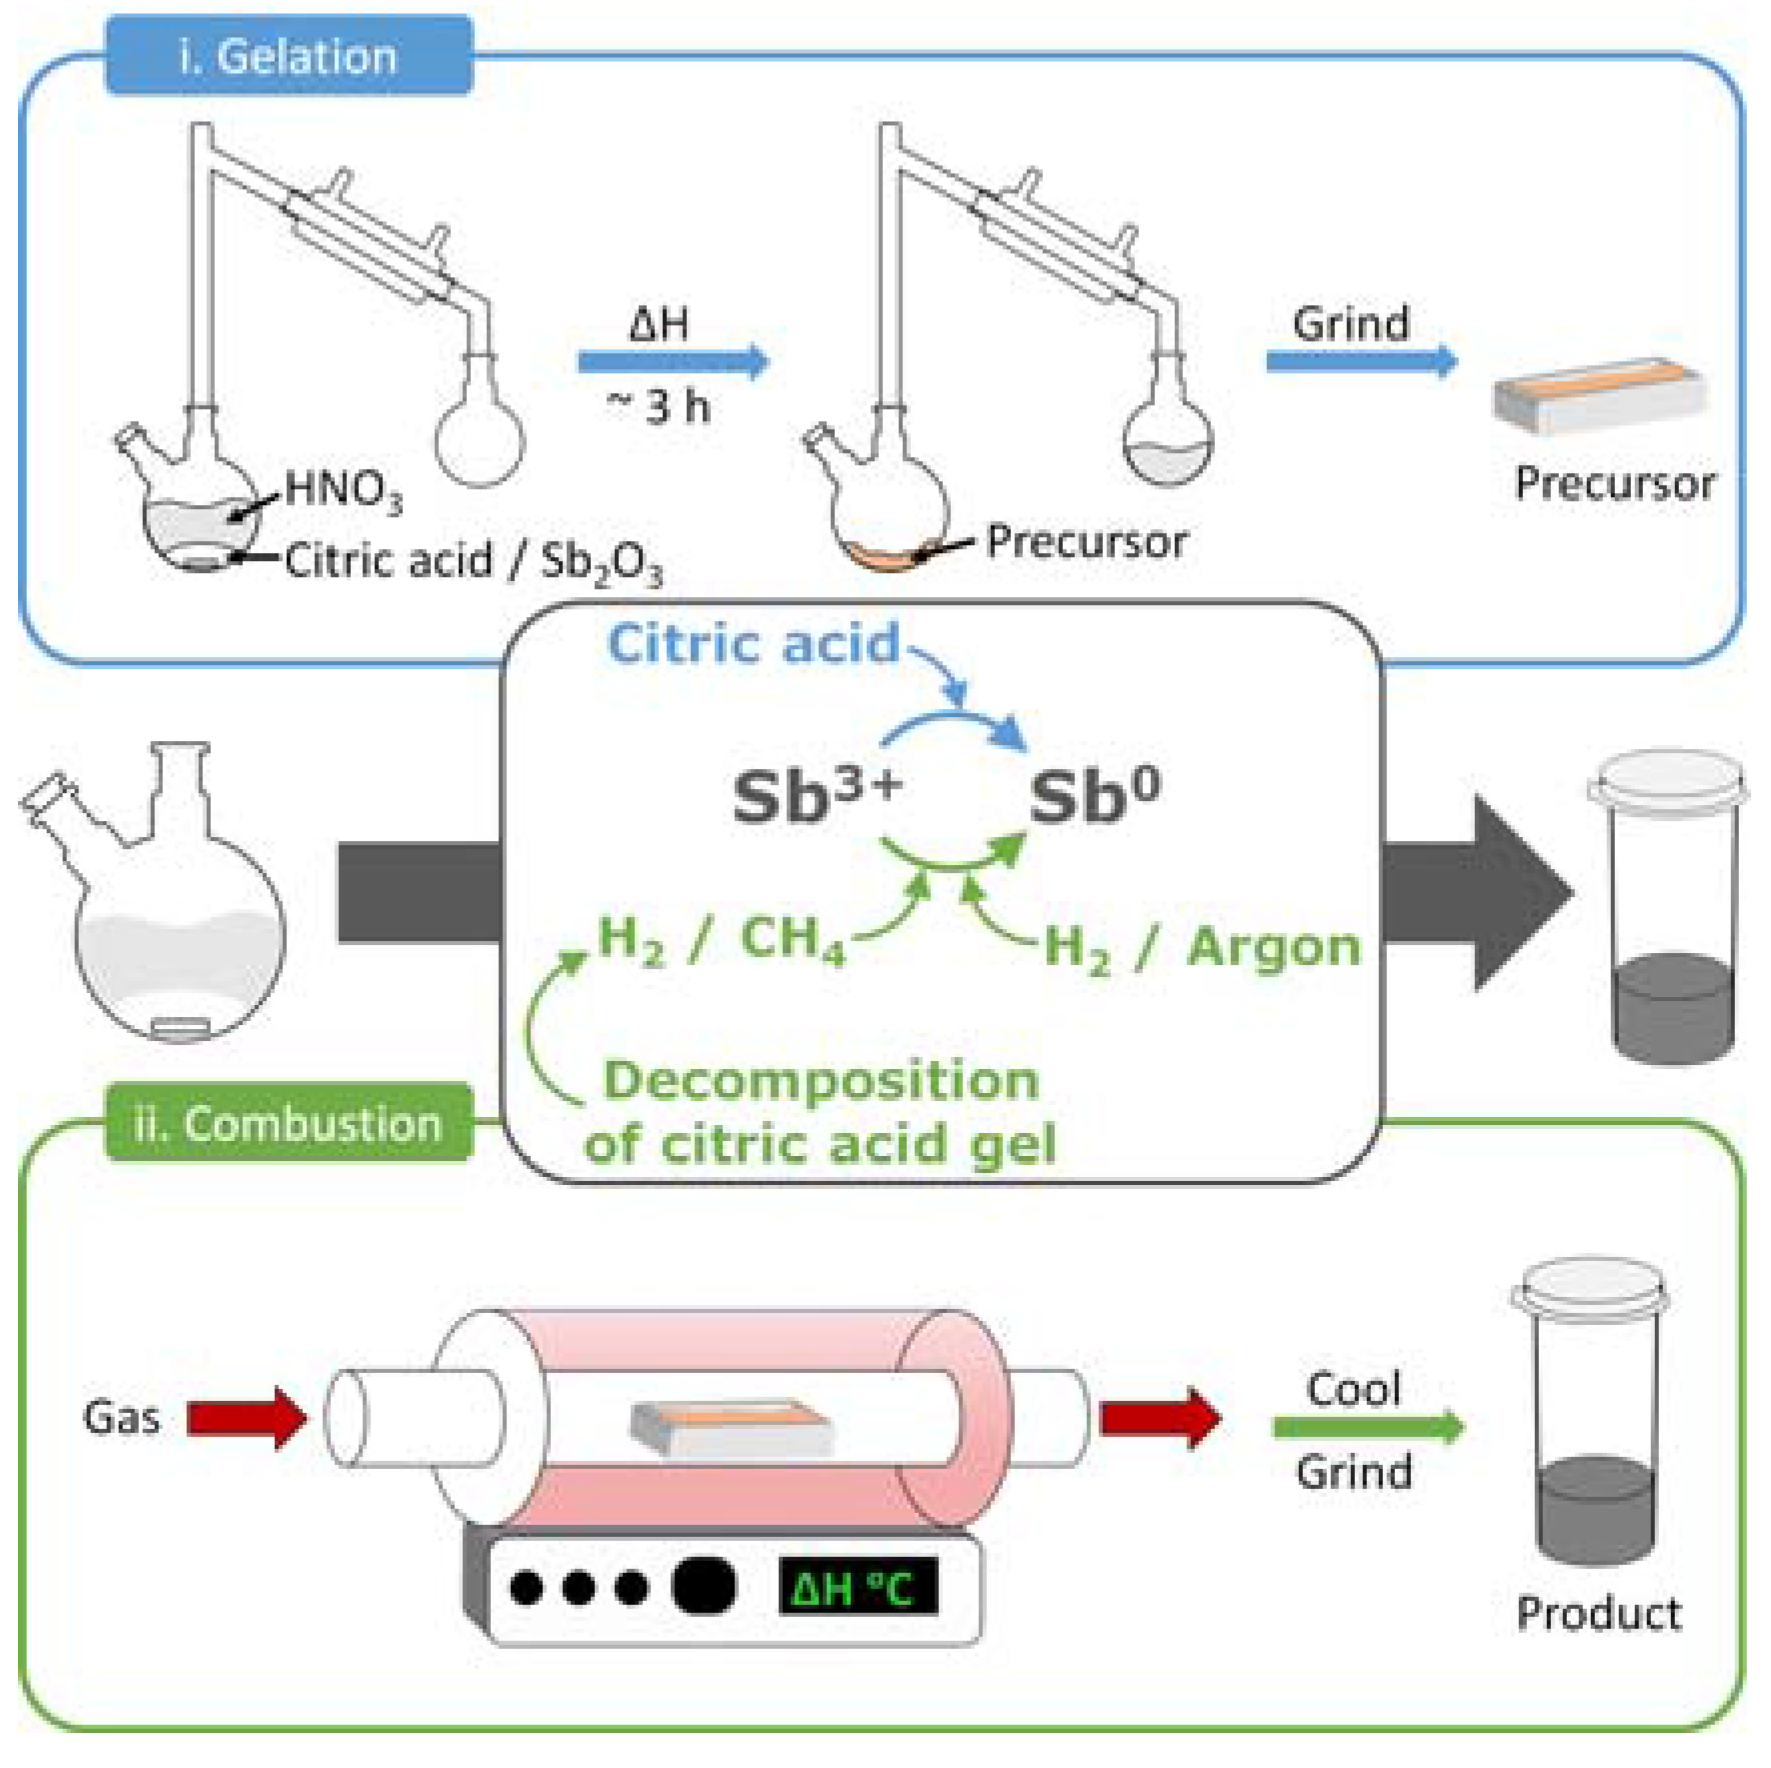
4.1. Synthetic Methods

The antimony acetate synthetic route was as follows: citric acid (C6H8O7, 99%, Sigma Aldrich), antimony acetate (Sb(CH3CO2)2, 99.99%, Sigma Aldrich), and ammonium nitrate (NH4NO3, 99.999%, Acros Organics) oxidizing agent were dissolved in glacial acetic acid (40 mL) in the molar ratios described (based on 0.0042 mol antimony acetate). This solution was heated until the acetic acid had boiled off, with the resulting solid being collected and ground to a powder. This powder was then heated at 5 °C min−1 to 240 °C for 15 min, under argon gas, to initiate the autoignition self-combustion reaction between the nitrate salt and citric acid-based hydrocarbon gel. After cooling to room temperature, the resulting product was collected for characterization.
The antimony oxide synthetic route was as follows: antimony oxide (Sb2O3, 0.5 g, 5 μm 99%, Sigma Aldrich) and citric acid (C6H8O7, 1.598 g, 99%, Sigma Aldrich) were dissolved in nitric acid (HNO3, 68–70%). The solution was heated to 140 °C to boil off the acid (which was trapped using a condenser, to prevent noxious fumes). This precursor product was then collected, ground, and heated at 10 °C min−1, under the selected gases, for the selected temperatures and times (as detailed in the results section).

4.2. Physcial and Chemical Characterisation

Powder X-ray diffraction patterns were collected on a Bruker Discover D8 diffractometer operating in reflection mode with CuKα1 radiation (λ = 1.5405Å). Scanning electron microscopy images were collected on a FEI Quanta 250 scanning electron microscope. A Raman microscope (Renishaw inVia) using a 532 nm wavelength laser was focused through a microscope (Leica) via a 50x objective (Leica). Particle size distributions were analyzed using a Mastersizer 3000 (Malvern Instruments) with a Hydro MV. Elemental analysis was carried out using a CHNS Eager 300 elemental analyzer.

4.3. Electrochemical Characterisation

Sodium and lithium electrolytes were prepared from 1 molar sodium perchlorate (NaClO4) in dried, distilled 1:1 wt % ratio ethylene carbonate:propylene carbonate, with 5 wt % fluoroethylene carbonate (FEC) additive to improve cycling stability [18,19]. To evaluate the performance of the antimony particles, composite electrodes were fabricated by casting an aqueous mixture (antimony active material:carbon black (Super C65, IMERYS Graphite & Carbon):sodium carboxymethylcellulose in a ratio of 75:15:10% by weight) onto a copper foil current collector. Coin cells were assembled from CR2032 coin cell parts, the prepared antimony electrodes, a glass fiber separator (Whatman) impregnated with the sodium electrolyte and a sodium (Na) metal counter electrode. In all cases, cells were sealed in a glove box under air and moisture free conditions (O2 < 0.1 ppm; H2O < 0.1 ppm). The electrochemical measurements were performed at 25 °C using a Maccor Series 4000 battery cycler. All batteries were cycled in the 50 mV to 1.5 V potential range and the obtained capacities were normalized by the total mass of composite material.

Acknowledgments

We acknowledge the financial support of the Ministerio de Economía y Competitividad through the projects ENE2016-75242-R and the “Juan de la Cierva” grants (JLGC, IJCI-2014-20613). The authors would also like to thank the Basque Government for financial support through ELKARTEK project CICE17. We also gratefully acknowledge the support of Elena Gonzalo for her assistance with quantifying particle size, Yan Zhang for the collection of Raman spectra, and María Jáuregui for collecting the PXRD patterns.

Author Contributions

N.E.D. and J.L.G.C. conceived the initial experiment, N.E.D. carried out the syntheses, J.L.G.C. performed the electrochemical analyses, B.A. undertook the SEM characterization, all authors discussed the results and contributed to the experimental design.

Conflicts of Interest

The authors declare no conflict of interest.

References

  1. Divya, K.C.; Østergaard, J. Battery energy storage technology for power systems—An overview. Electr. Power Syst. Res. 2009, 79, 511–520. [Google Scholar] [CrossRef]
  2. Scrosati, B.; Garche, J. Lithium batteries: Status, prospects and future. J. Power Sources 2010, 195, 2419–2430. [Google Scholar] [CrossRef]
  3. Bruce, P.G.; Freunberger, S.A.; Hardwick, L.J.; Tarascon, J.-M. Li-O2 and Li-S batteries with high energy storage. Nat. Mater. 2012, 11, 19–29. [Google Scholar] [CrossRef] [PubMed]
  4. Palomares, V.; Serras, P.; Villaluenga, I.; Hueso, K.B.; Carretero-González, J.; Rojo, T. Na-ion batteries, recent advances and present challenges to become low cost energy storage systems. Energy Environ. Sci. 2012, 5, 5884–5901. [Google Scholar] [CrossRef]
  5. Palomares, V.; Casas-Cabanas, M.; Castillo-Martínez, E.; Han, M.H.; Rojo, T. Update on Na-based battery materials. A growing research path. Energy Environ. Sci. 2013, 6, 2312–2337. [Google Scholar] [CrossRef]
  6. Lu, Q.; Chen, J.G.; Xiao, J.Q. Nanostructured electrodes for high-performance pseudocapacitors. Angew. Chemi. Int. Ed. Engl. 2013, 52, 1882–1889. [Google Scholar] [CrossRef] [PubMed]
  7. Goodenough, J.B.; Park, K.-S. The Li-ion rechargeable battery: A perspective. J. Am. Chem. Soc. 2013, 135, 1167–1176. [Google Scholar] [CrossRef] [PubMed]
  8. Dahbi, M.; Yabuuchi, N.; Kubota, K.; Tokiwa, K.; Komaba, S. Negative electrodes for Na-ion batteries. Phys. Chem. Chem. Phys. 2014, 16, 15007–15028. [Google Scholar] [CrossRef] [PubMed]
  9. Yabuuchi, N.; Kubota, K.; Dahbi, M.; Komaba, S. Research development on Sodium-ion batteries. Chem. Rev. 2014, 114, 11636–11682. [Google Scholar] [CrossRef] [PubMed]
  10. Kubota, K.; Komaba, S. Review—Practical issues and future perspective for Na-ion batteries. J. Electrochem. Soc. 2015, 162, A2538–A2550. [Google Scholar] [CrossRef]
  11. Luo, W.; Shen, F.; Bommier, C.; Zhu, H.; Ji, X.; Hu, L. Na-ion battery anodes: Materials and electrochemistry. Acc. Chem. Res. 2016, 49, 231–240. [Google Scholar] [CrossRef] [PubMed]
  12. Holzapfel, M.; Buqa, H.; Hardwick, L.J.; Hahn, M.; Würsig, A.; Scheifele, W.; Novák, P.; Kötz, R.; Veit, C.; Petrat, F.-M. Nano silicon for lithium-ion batteries. Electrochim. Acta 2006, 52, 973–978. [Google Scholar] [CrossRef]
  13. Marcinek, M.; Hardwick, L.J.; Richardson, T.J.; Song, X.; Kostecki, R. Microwave plasma chemical vapor deposition of nano-structured Sn/C composite thin-film anodes for Li-ion batteries. J. Power Sources 2007, 173, 965–971. [Google Scholar] [CrossRef]
  14. Hayner, C.M.; Zhao, X.; Kung, H.H. Materials for rechargeable Lithium-ion batteries. Annu. Rev. Chem. Biomol. Eng. 2012, 3, 445–471. [Google Scholar] [CrossRef] [PubMed]
  15. Tian, H.; Xin, F.; Wang, X.; He, W.; Han, W. High capacity group-IV elements (Si, Ge, Sn) based anodes for lithium-ion batteries. J. Mater. 2015, 1, 153–169. [Google Scholar] [CrossRef]
  16. Kim, Y.; Ha, K.-H.; Oh, S.M.; Lee, K.T. High-capacity anode materials for Sodium-ion batteries. Chem. Eur. J. 2014, 20, 11980–11992. [Google Scholar] [CrossRef] [PubMed]
  17. Kang, H.; Liu, Y.; Cao, K.; Zhao, Y.; Jiao, L.; Wang, Y.; Yuan, H. Update on anode materials for Na-ion batteries. J. Mater. Chem. A 2015, 3, 17899–17913. [Google Scholar] [CrossRef]
  18. Darwiche, A.; Marino, C.; Sougrati, M.T.; Fraisse, B.; Stievano, L.; Monconduit, L. Better cycling performances of bulk Sb in Na-ion batteries compared to Li-ion systems: An unexpected electrochemical mechanism. J. Am. Chem. Soc. 2012, 134, 20805–20811. [Google Scholar] [CrossRef] [PubMed]
  19. He, M.; Kravchyk, K.; Walter, M.; Kovalenko, M.V. Monodisperse antimony nanocrystals for high-rate Li-ion and Na-ion battery anodes: Nano versus bulk. Nano Lett. 2014, 14, 1255–1262. [Google Scholar] [CrossRef] [PubMed]
  20. Baggetto, L.; Ganesh, P.; Sun, C.-N.; Meisner, R.A.; Zawodzinski, T.A.; Veith, G.M. Intrinsic thermodynamic and kinetic properties of Sb electrodes for Li-ion and Na-ion batteries: Experiment and theory. J. Mater. Chem. A 2013, 1, 7985–7994. [Google Scholar] [CrossRef]
  21. Hou, H.; Jing, M.; Yang, Y.; Zhu, Y.; Fang, L.; Song, W.; Pan, C.; Yang, X.; Ji, X. Sodium/Lithium storage behavior of antimony hollow Nanospheres for rechargeable batteries. ACS Appl. Mater. Interfaces 2014, 6, 16189–16196. [Google Scholar] [CrossRef] [PubMed]
  22. Hou, H.; Jing, M.; Zhang, Y.; Chen, J.; Huang, Z.; Ji, X. Cypress leaf-like Sb as anode material for high-performance sodium-ion batteries. J. Mater. Chem. A 2015, 3, 17549–17552. [Google Scholar] [CrossRef]
  23. Yang, Y.; Yang, X.; Zhang, Y.; Hou, H.; Jing, M.; Zhu, Y.; Fang, L.; Chen, Q.; Ji, X. Cathodically induced antimony for rechargeable Li-ion and Na-ion batteries: The influences of hexagonal and amorphous phase. J. Power Sources 2015, 282, 358–367. [Google Scholar] [CrossRef]
  24. Zhu, Y.; Han, X.; Xu, Y.; Liu, Y.; Zheng, S.; Xu, K.; Hu, L.; Wang, C. Electrospun Sb/C fibers for a stable and fast Sodium-ion battery anode. ACS Nano 2013, 7, 6378–6386. [Google Scholar] [CrossRef] [PubMed]
  25. Hou, H.; Jing, M.; Yang, Y.; Zhang, Y.; Song, W.; Yang, X.; Chen, J.; Chen, Q.; Ji, X. Antimony nanoparticles anchored on interconnected carbon nanofibers networks as advanced anode material for sodium-ion batteries. J. Power Sources 2015, 284, 227–235. [Google Scholar] [CrossRef]
  26. Qian, J.; Chen, Y.; Wu, L.; Cao, Y.; Ai, X.; Yang, H. High capacity Na-storage and superior cyclability of nanocomposite Sb/C anode for Na-ion batteries. Chem. Commun. 2012, 48, 7070–7072. [Google Scholar] [CrossRef] [PubMed]
  27. Zhang, N.; Liu, Y.; Lu, Y.; Han, X.; Cheng, F.; Chen, J. Spherical nano-Sb@C composite as a high-rate and ultra-stable anode material for sodium-ion batteries. Nano Res. 2015, 8, 3384–3393. [Google Scholar] [CrossRef]
  28. Zhang, B.; Dugas, R.; Rousse, G.; Rozier, P.; Abakumov, A.M.; Tarascon, J.-M. Insertion compounds and composites made by ball milling for advanced sodium-ion batteries. Nat. Commun. 2016, 7, 10308. [Google Scholar] [CrossRef] [PubMed]
  29. Jiang, Y.; Yang, S.; Hua, Z.; Huang, H. Sol-gel autocombustion synthesis of metals and metal alloys. Angew. Chem. (Int. Ed. Engl.) 2009, 48, 8529–8531. [Google Scholar] [CrossRef] [PubMed]
  30. Zhou, X.; Liu, X.; Xu, Y.; Liu, Y.; Dai, Z.; Bao, J. An SbOx/reduced graphene oxide composite as a high-rate anode material for Sodium-ion batteries. J. Phys. Chem. C 2014, 118, 23527–23534. [Google Scholar] [CrossRef]
  31. Li, N.; Liao, S.; Sun, Y.; Song, H.W.; Wang, C.X. Uniformly dispersed self-assembled growth of Sb2O3/Sb@graphene nanocomposites on a 3D carbon sheet network for high Na-storage capacity and excellent stability. J. Mater. Chem. A 2015, 3, 5820–5828. [Google Scholar] [CrossRef]
  32. Li, D.; Yan, D.; Ma, J.; Qin, W.; Zhang, X.; Lu, T.; Pan, L. One-step microwave-assisted synthesis of Sb2O3/reduced graphene oxide composites as advanced anode materials for sodium-ion batteries. Ceram. Int. 2016, 42, 15634–15642. [Google Scholar] [CrossRef]
  33. Wang, G.-Z.; Feng, J.-M.; Dong, L.; Li, X.-F.; Li, D.-J. Porous graphene anchored with Sb/SbOx as sodium-ion battery anode with enhanced reversible capacity and cycle performance. J. Alloys Compd. 2017, 693, 141–149. [Google Scholar] [CrossRef]
  34. Li, W.; Wang, K.; Cheng, S.; Jiang, K. A two-dimensional hybrid of SbOx nanoplates encapsulated by carbon flakes as a high performance sodium storage anode. J. Mater. Chem. A 2017, 5, 1160–1167. [Google Scholar] [CrossRef]
  35. Degtyareva, O.; Struzhkin, V.V.; Hemley, R.J. High-pressure Raman spectroscopy of antimony: As-type, incommensurate host-guest, and bcc phases. Solid State Commun. 2007, 141, 164–167. [Google Scholar] [CrossRef]
  36. Allan, P.K.; Griffin, J.M.; Darwiche, A.; Borkiewicz, O.J.; Wiaderek, K.M.; Chapman, K.W.; Morris, A.J.; Chupas, P.J.; Monconduit, L.; Grey, C.P. Tracking Sodium-Antimonide phase transformations in Sodium-ion anodes: Insights from operando pair distribution function analysis and solid-state NMR spectroscopy. J. Am. Chem. Soc. 2016, 138, 2352–2365. [Google Scholar] [CrossRef] [PubMed]
Figure 1. (a) Powder X-ray diffractometry (PXRD) patterns of materials synthesized with varying antimony acetate (SbAc), citric acid (CA), and ammonium nitrate (Ox) ratios. Valentinite Sb2O3 is marked with *; (b) and (c) scanning electron microscopy (SEM) images of Sb (SbAc:CA:Ox—1:3:2).
Batteries 03 00020 g001
Figure 2. Raman spectra taken from the Sb (SbAc:CA:Ox—1:3:2) product and a Sb standard.
Batteries 03 00020 g002
Scheme 1. Schematic diagram of sol-gel synthesis.
Batteries 03 00020 sch001
Figure 3. PXRD pattern of the starting Sb2O3 material.
Batteries 03 00020 g003
Figure 4. (a) PXRD patterns of materials synthesized with varying temperature, valentinite Sb2O3 is marked with *; SEM images of: (b) Sb 300 °C; (c) Sb 500 °C; (d,e) Sb 600 °C.
Batteries 03 00020 g004
Figure 5. (a) PXRD patterns of materials synthesized under argon and H2/argon continuous gas flow; SEM images of (b) Sb 500 °C (argon) and (c) Sb 500 °C (H2/argon).
Batteries 03 00020 g005
Figure 6. (a) PXRD patterns of synthesized materials heated under H2/argon at 500 °C for varying times; SEM images of (b) Sb 500 °C (H2/argon) 45 min and (c) Sb 500 °C (H2/argon) 100 min.
Batteries 03 00020 g006
Figure 7. (a) PXRD patterns of materials synthesized with antimony oxide (Sb) and citric acid (CA), heated under H2/argon at 460 °C for varying times; SEM images of (b,d) Sb 460 °C (H2/argon) 165 min; and (c,e) Sb 500 °C (H2/argon) 100 min.
Batteries 03 00020 g007
Figure 8. Raman spectra taken from the Sb 460 °C (H2/argon) 165 min and Sb 500 °C (H2/argon) 100 min products, and from a Sb standard.
Batteries 03 00020 g008
Figure 9. (a) Rate capability plots and (b) cyclability plots taken at 1C for Sb 460 °C (H2/argon) 165 min and Sb 500 °C (H2/argon) 100 min products. 1C is taken as 660 mA g−1.
Batteries 03 00020 g009
Figure 10. Voltage profiles of Sb 460 °C (H2/argon) 165 min taken at varying C-rates.
Batteries 03 00020 g010
Figure 11. Differential capacity plots of Sb 460 °C (H2/argon) 165 min, cycles 1 and 2, taken at 1C.
Batteries 03 00020 g011
Table 1. Median values of particle size distribution (D90, D50, and D10) and volume mean diameter (D[4,3]) of Sb (SbAc:CA:Ox—1:3:2).
ParameterSb (SbAc:CA:Ox—1:3:2)
D90 (µm)94.8 ± 2.3
D50 (µm)39.0 ± 0.7
D10 (µm)3.9 ± 0.2
D[4,3] (µm)47.2
Table 2. Median values of particle size distribution (D90, D50, and D10) and volume mean diameter (D[4,3]) of Sb 460 °C (H2/argon) 165 min and Sb 500 °C (H2/argon) 100 min.
ParameterSb 460 °C (H2/argon) 165 minSb 500 °C (H2/argon) 100 min
D90 (µm)12.0 ± 0.519.5 ± 1.6
D50 (µm)4.2 ± 0.15.9 ± 0.2
D10 (µm)1.0 ± 0.1 1.5 ± 0.1
D[4,3] (µm)5.68.5

