Main Drivers of Battery Industry Changes: Electric Vehicles—A Market Overview


1
School of Natural Sciences and Mathematics, Ural Federal University, 620002 Ekaterinburg, Russia
2
EV Volumes, 1050-129 Lisbon, Portugal
*
Author to whom correspondence should be addressed.
Batteries 2018, 4(4), 65; https://doi.org/10.3390/batteries4040065
Submission received: 24 September 2018
/
Revised: 31 October 2018
/
Accepted: 26 November 2018
/
Published: 5 December 2018
Abstract
:The growing popularity of electric vehicles is one of the main drivers of battery industry transformation. Words like “transport system decarbonization”, “electromobility”, and “environmental-friendly society” are very popular today, but questions remain as to how to measure electric vehicles’ adoption progress and how this transition changes the battery industry. This perspective paper provides a review of the electric cars and buses market, estimates the production volumes of some other electric vehicle types, and discusses the role of traction batteries in the global battery market. A simple estimation of the sales rate allows us to evaluate the prospects of electric vehicle adoption in leading countries. Finally, the application of the main battery chemistries is reviewed and topical issues to the research society are addressed and formulated.
1. Introduction
Nowadays, electric vehicles (EV) are vivid symbols of the transformation towards a sustainability and ecologically friendly society. We would like to mention the following three main reasons for the steady governmental support of EV adoption: ecology, politics, and economics. The first is caused by the environmental impact of fuel-based transportation. End-of-pipe pollutions, well-to-wheel pollutions, and global climate change are negative effects of oil-based economics. The zero-emission vehicle mandate [1,2] imposed by the California Air Resource Board is considered as a turning point in the new EV era and manifested the idea of pollution reduction by transport electrification [3]. Recently, Dieselgate [4] and studies about the growing gap between official and real-world emissions [5] have confirmed the importance of further EV adoption support. The Deepwater Horizon oil spill clearly demonstrated the real cost of oil production and well-to-wheel transportation risks [6]. The social and economic costs of greenhouse emissions are too numerous to account for all correctly [7].
The second rather obvious reason for the growing interest in EV from leading countries is politics. The difference in the political interests of major oil exporters and importers became the reason for the 1970s energy crisis and local wars [8], thus demonstrating that sustainable shock-free development should be based on new energy vehicles [9,10]. The third reason we want to mention is the huge opportunity for the breakthrough of Chinese producers of EV and traction batteries. The steady governmental support of new energy vehicle adoption not only helps China to solve its ecological problems and to insure its political stability, but it has also already helped to rush battery production capacities and to build premises for the global expansion of Chinese carmakers (see, for example, [11]).
Thereby, these complex of ecological, economical, and political reasons [12] drive the EV market growth, but can we claim that the battery research community follows the main trends of the automobile and battery industry transformation? Unfortunately, there is a clear lack of prompt feedbacks from industry and society to science in the form of scientific publications about EV and battery markets. There are some publications on the subject. We can mention the recent perspective paper of Bresser et al. [13], the earlier detailed review by Z. Rezvani et al. [14], and some publications about EV adoption in China [15,16,17,18,19]. Of course, we have definitely missed some more interesting publications about EV market progress, but, in any case, we want to mention that the significant part of such publications are original research papers, focused on some specific areas. Review-type and perspective-type articles providing an up-to-date in-depth market analysis are much less common. In this perspective article, made in the form of a market data overview, we will evaluate the EV adoption progress, its prospects, risks, and needs. Another important part of this study is to understand the influence of the growing EV market on the battery industry and research community.
2. Results: The Progress of EV Adoption
This study analyzes the sales data for battery electric vehicles (BEV) and plug-in hybrid electric vehicles (PHEV), jointly indicated as plug-in electric vehicles (PEV), or, alternatively, new energy vehicles (NEVs; used mainly in China). The classification details are presented in the Appendix A. This article is focused on the modern history of EVs. We will not take into account the first wave of EV popularity in the very beginning of the 20th century, when EVs held a significant market share in the United States and some other countries. The second, modern wave of EV sales started in the second decade of the 21st century.
2.1. Plug-in Car Sales from 2011 until 2017
There is a lot of types of EVs (see a detailed description in Appendix A), but we will start with electric passenger cars. Figure 1 demonstrates the annual plug-in car sales’ evolution since 2011. The overall sales in 2011 were about 60,000 units; six years later, in 2017, the sales passed the seven-digits milestone and reached 1.2 million, demonstrating the significant growth from 0.77 million in 2016 [20]. The global car and light commercial vehicle (LCV) sales have grown by up to 86 million in 2017, from 82 million in 2016 [21]. The growth rate of the PEV is higher than that for the auto market in general (56% vs. 5%), but the PEV market share is still low—about 1.4% in 2017, up from 0.9% in 2016.
Such a low EV penetration is the result of the common underestimation of traction batteries’ role in the global battery market. The modern battery industry is usually considered to consist of the following three main segments: batteries for portable electronics, traction batteries for EV, and stationary battery energy storage systems (BESS) for grids and renewables. For years, portable electronics producers have been defining the rules for the lithium battery market. In this article, we will not study the market of stationary batteries for renewables and grids, we can only mention its fast-growing role for the global battery industry. In order to demonstrate the focus swifts for the battery industry, let us compare the battery demands for electric cars and portables. On the one hand, the global smartphones sales in 2017 reached 1.54 billion [22], while PEV only reached 1.2 million, about 1300 times lower. On the other hand, the smartphone battery capacity can be roughly estimated as 10 ÷ 20 W·h, while for PEV it is about 10 ÷ 100 kW·h, from 1000 to 5000 times higher, thus counterbalancing the 1300 times difference in sales volume. So, even in 2017, the traction battery demand became comparable with the portable one. Furthermore, the matured market of smartphones has already reached a 60.5% penetration in North America and Western Europe, and last year, sales growth was only 2.7% (1.537 billion units in 2017 vs. 1.496 billion units in 2016) [22], thus having much less room to grow, compared with PEV and its 1.4% market share in 2017. The overall PEV traction battery market can roughly be estimated as about 100 GW·h and is heading towards a new challenging 1 TW·h milestone.
Figure 1a also clearly demonstrates that the global PEV sales growth is driven by China, being responsible for about a half of the global PEV sales, three time higher than that in the United States (Figure 1a and Table S1). Honoring the role of China in the global EV adoption, let us further use the abbreviation NEV instead of PEV. It should be mentioned that the United States cannot boast about growth rates or an NEV market share (1.2%). The NEV market share in China reached 2.1% in 2017, which is above world average of 1.4%, but far below the European phenomenon—such as Norway, with its incredible 39% NEV market share in 2017, which will be heading beyond 50% in 2018.
The leading position of China in the global NEV market has resulted in the presence of three Chinese automobile groups among the top five NEV makers, and four in the top ten (Figure S1). The most famous symbol of electric car popularity, Tesla, occupies only the fifth place, and hybrid car veteran, Toyota, has jumped up to the tenth place because of the success of their only plug-in car model (Figure S2k).
The NEV sales data by automobile groups (Figure S1) and the best sold models (Figures S2a–k) are important for revealing the most popular cell chemistries of the NEV traction batteries (Table S2). The leading Renault–Nissan–Mitsubishi alliance is currently working with two battery suppliers, the AESC and LG Chem, but is moving towards the partial substitution of AESC by CATL. AESC (Automotive Energy Supply Corporation, Zama, Japan), the former Nissan/NEC joint venture, was almost sold in 2017 to GSR Capital, a Chinese private equity firm backed by the government of Hubei province. Recently, the deal was canceled and a new stakeholder was presented—Envision, the Chinese renewable energy giant. Both LG Chem and AESC use nickel-rich layered oxide cathodes LiNi1−x−yMnxCoyO2 (NMC) or LiNi1−x−yCoxAlyO2 (NCA), with graphite-based anodes in their NEV cells. Previously, AESC used LiMn2O4-based (LMO) cells in its traction batteries, but now we cannot find any evidence of its use in modern NEVs. The nickel-rich NMC/NCA cell chemistry is also utilized by Panasonic (the leading NEV traction battery supplier), Samsung SDI (BMW and VW supplier), and CATL, one of the two leading Chinese lithium battery makers (another one is BYD). It indicates that today, NMC/NCA cathode materials represent the dominating chemistry used for plug-in cars.
For a long time, Chinese company BYD, producing both NEVs and batteries, has been remaining the main driver of alternative LiFePO4 (LFP) chemistry. While BYD is the largest NEV manufacturer/brand and the second largest NEV automotive group for the last three years (Figure S1), LFP still remains one of the two major cathode material chemistries used in traction batteries. Also, LFP is actively used by other Chinese battery makers—CATL, A123 Systems (now part of Wanxiang Group Corp., Hangzhou, China), Lishen, CALB, and others. However, nowadays, the largest Chinese battery makers produce not only LFP-based traction batteries, but MNC/NCA ones as well [23]; for example, BAIC EC series, the global NEV best-seller (Figure S2b), utilizes a NMC-based battery. Even the main global driver of LFP battery growth, BYD, is switching its passenger NEV from LFP to NMC cells, and it recently opened up a Qinghai battery plant with a targeted 10 GW·h annual capacity, which will focus on NMC-based battery production.
The market share tracking for all the three main lithium battery segments (portable, EV, and stationary BESS) is very important for the material research community. Application defines the key battery parameters, thus defining the preferable battery chemistries. Previously, lithium battery production capacities were designed to fulfill the needs of consumer electronics. Today, new battery plants are built/planned to meet the needs of the EV market. What will drive the battery industry tomorrow? Will the same battery chemistry be used for both portable electronics and EVs? Will the EV traction battery market remain the dominating driving force of industry transformation, or will it compete with stationary BESS for production capacities? The answer can be found in the following market data analysis.
2.2. Electric Bus Sales
While Chinese battery makers have accelerated the rates of NMC cells’ adoption for traction batteries used in cars, the stagnation of LFP-based battery production is not expected. BYD, for example, will continue using it in its electric buses and trucks. Electric bus sales growth is another driving force for the battery industry, and BYD is the second largest new energy bus (NE bus) manufacturer in the world, with 14,254 units being sold globally in 2017 [24].
The world’s leading electric bus producer is Zhengzhou Yutong, with 24,865 units sold in 2017 [25]. The major battery supplier for Yutong NE buses is CATL. According to a recent IDTechEx report, CATL, similar to BYD, uses LFP-based cells in NE bus traction batteries [26], and plans to use it in the nearest future [27]. Yutong and BYD together hold about a half of all Chinese NE bus sales (Figure 2). The total NE bus sales in China were about 90,000 units [28], or 35% of the 257,000 buses sold in China in 2017 [29]. It should be mentioned that extensive use of NE buses resulted in their stable sales without growth. Nevertheless, at the very end of 2017, China reached one more important milestone—the whole bus fleet (about 16,000 units) in Shenzhen (the home city of BYD) became all-electric [30].
The electric bus sales in the rest of the world are far behind those of China, and, furthermore, are less precisely measured. In the United States, for example, about 200 units were sold and delivered to consumers in 2017 (about 2% of new public transit bus sales), and the total number of electric buses reached about 500 units [31]. The total amount of NE buses in Europe during the same time reached about 2300 units [31]. Overall, the European bus and coach market contracted slightly (−0.5%), totaling 40,515 units [32], so while the market share of NE buses in Europe is still a few percent, it demonstrates optimistic steady growth.
Among the largest non-Chinese electric bus makers, we can mention the Proterra (United States), Volvo (Sweden), and Solaris (Poland). All of the producers offer buses with two charging options, a slow depot charging and fast charging using pantograph, thus utilizing two alternative anode chemistries, Graphite and Li4Ti5O12 (LTO), respectively. While the main part of the sold NE buses utilizes cells with different forms of carbon-based materials, the LTO-based cells hold a notable market share. In 2017, Microvast, the main industrial driver of LTO cell chemistry in China, held a 15% market share of the new energy buses in China [33]. The total market share of the fast-charging buses was about 20%.
The global NE bus battery market can be estimated as about tens of GW·h annually, similar to the plug-in car’s battery market. This segment of the traction battery market is very important for cell chemistries, alternative to the dominating cells based on NMC/NCA cathodes with graphite anodes. NE buses support the steady demand for LFP cathodes (usually with graphite anodes) or LTO anodes (usually with MNC cathodes). The tracking electric bus sales in Europe and the United States will be very important for these alternative chemistries. The possible expansion of the leading NE bus makers can form the steady demand for LFP-based traction batteries in Europe. Therefore, it might result in the growth of LFP-focused scientific articles written by European research groups.
2.3. Sales of Other Types of EV
Electric trucks and light commercial electric vehicles (LCEV) are also important both for EV and traction batteries. According to the China Association of Automobile Manufacturers (CAAM), about 212,000 commercial NEV were sold in China in 2017 [34]. If we exclude about 90,000 NE buses, the total sales of light and heavy commercial NEV (LCEV and electric trucks) were above 120,000 units. The sales of electric trucks and LCEV outside China are much less, being driven mainly by BYD and the fast-growing StreetScooter (LCEV producer, recently founded by DHL), together with Renault Kango ZE and Nissan e-NV200. As a result of the steady efforts of BYD and other Chinese automakers, the commercial EV market is another driver of the demand growth for LFP-based cells.
While the growing sales of NEV, NE buses, electric trucks, and LCEV are the main driving force of the global battery market, there are some other niche markets, which are important both for transport electrification and the battery market growth. The current influence of so-called Low Speed Electric Vehicles (LSEV) on the battery market in China is often underestimated. Nevertheless, the LSEV market demonstrated a 41.6% growth from 1.2 million units in 2016 to 1.7 million units in 2017 [35]. While the growth rates are expected to slow down because of the stringent LSEV standard, LSEV sales could reach 3.4 million units in China in 2022 [35]. Estimating the LSEV battery capacity within the 5 ÷ 20 kW·h range, the LSEV battery market is about ten GW·h [36]. We can suppose that just as the MNC/NCA chemistry is expected to crowd out LFP in the Chinese passenger cars, the LFP-based batteries could gradually displace the lead–acid ones in LSEV.
The comparable battery demand is fed by another “big” market of “small” EVs—electric bicycles. With the typical battery energy capacity range of 0.1 ÷ 1.5 kW·h, and about tens of millions units market [37], e-bikes form an annual demand of about ten GW·h [36]. A similar demand in batteries can be expected from the electric scooter market [38]. While electric bikes are rather sensitive to battery weight, we can conclude that nickel-rich NMC/NCA will hold the main share of this market. The electric scooter traction battery can utilize both the MNC/NCA and LFP cathodes.
While ground EV are responsible for the major part of the traction batteries sales, both electric/hybrid vessels and electric/hybrid aircrafts can be considered as alternative highly profitable and fast growing markets for lithium batteries. In this work, we will not discuss these emerging sales, but we have to mention that these two promising markets open growth opportunities both for battery makers behind leaders and for alternative battery technologies.
The main problem impeding the proper sales estimation for the “alternative” vehicle type is the production and sales localization in China. We do believe that Chinese experience is vital for the global research community, so let us hope that studies analyzing some of the adoption practices for LSEV, LCEV, electric trucks, bicycles, and scooters, will be published by Chinese researchers in a global journal that is popular among the international material research community. It would be also interesting to learn how different chemistries fit to different needs.
3. EV and Traction Batteries Prospects
3.1. NEV Sales Prospects—Buses and Cars
The NEV sales growth is rather obvious, but the question is how to measure it and whether one can make proper assumptions about sales prospects. First, let us consider electric bus sales. China is definitely the largest electric bus market, with a 35% market share, but its further trends can be hardly evaluated with notable precision. Jump-like sales growth in 2015 (Figure 2) do not allow for conclusions about sales growth or its stagnation. The main growth driver in China is governmental subsidies, thus its decrease since 2018 could slow down the NE bus sales progress in China. Probable NE bus sales decreasing in China can be partially compensated by their fast growth in the rest of the world. A recent BNEF study supposes that the global NE bus market share will reach 50% in the not so distant 2025 [39]. In a IDTechEx report, the author expects that electric bus batteries alone will reach the same market size as batteries for consumer electronics in 2018, and later will overcome it [26]. We think that the saturation of Chinese NE bus sales with the simultaneous fast growth in Europe and in North and South America can trigger a new wave of research projects, focused on LFP and initiated by the United States and European groups. Nevertheless, even in the case of possible sales stagnation, the achieved progress in NE buses’ adoption will keep NE buses as one of the largest battery markets in near future.
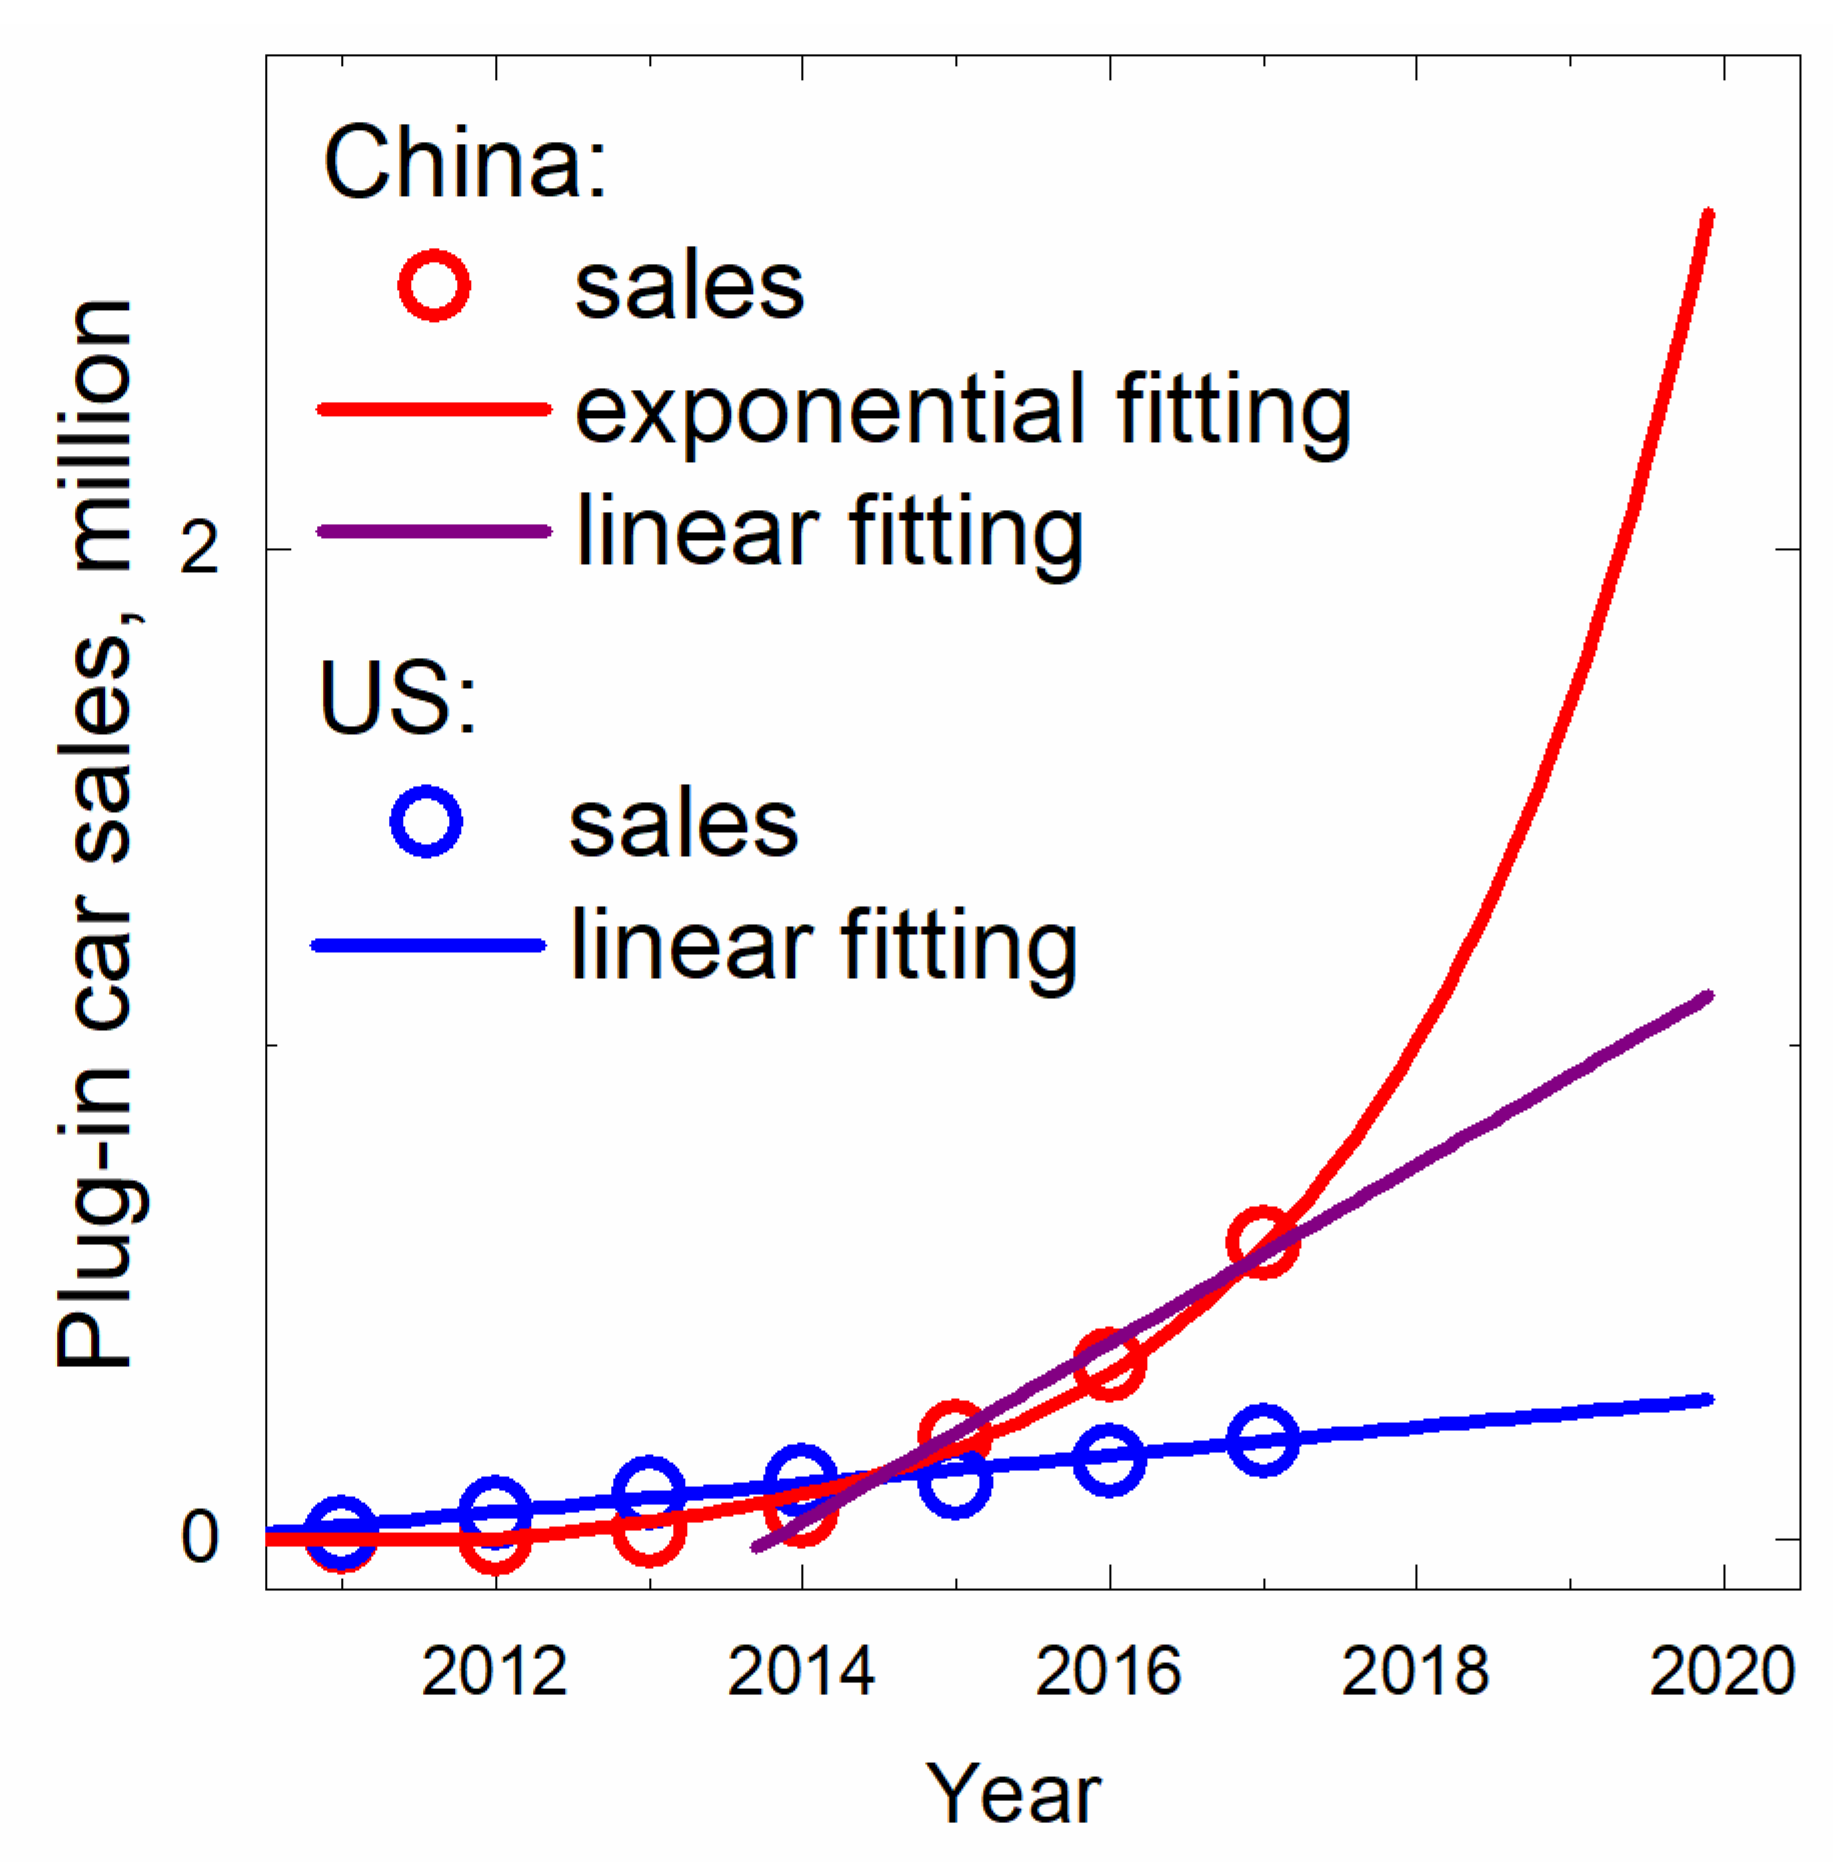
The progress in electric and plug-in hybrid car sales is much more modest. However, it eases the trend estimation. NEV sales in the United States, for example, can be properly fitted by a straight line, thus demonstrating the linear NEV sales growth, adding about 28,000 units annually (Figure 3). On the one hand, it indicates that this steady growth will drive the demand in lithium battery research for many decades. On the other hand, such a slow rate of NEV adoption means that with the same overall car sales, the NEV market share will reach 2% in 2021, and a modest 10% in the distant 2070. We have to mention that the United States strongly needs some matured governmental policy or technological breakthrough for EV mass production (for example, by Tesla, with its Model 3 production plans—see Figure S2e). In fact, the record-breaking growth of the Tesla Model 3 production and its sales in the United States has already helped to take the first step toward slow-linear-growth tendency breaking. After the first nine months of 2018, plug-in car sales in the United States reached 234,600 units, resulting in almost 35,000 units growth from 2017. At the end of 2018, the difference will further grow. But it is questionable whether the growth, based on the only carmaker, with rather risky financial indicators, can be stable.
Already, the NEV sales evolution in China can be rather properly fitted by the exponential curve (Figure 3). Nevertheless, even for such an optimistic exponential growth rate, the 10% NEV sales market share will be achieved in 2020, one year later than was planned for 2019 [40]. Another possible interpretation is the linear growth since 2014 (purple straight line), with an annual NEV sales growth of about 180,000 units. In this less optimistic scenario, the 10% market share will only be achieved in 2030.
In fact, the main idea of Figure 3 and of the whole article is not sales predictions. Any numerical estimation in such an emerging market is far from real. We only want to warn that the linear growth of NEV sales is usually not enough. If we want to live in sustainable cities and breath-in clean air, we have to initiate or support exponential growth at least for few years. The only country with a sufficient linear growth rate is Norway, with its 50% NEV market share expected for 2018 or 2019 (Figure 1b, Table S1).
Unfortunately, Norway; China; and, maybe, Sweden, are the only significant markets with an expected double-digit NEV market share in 2020.
3.2. NEV Market Growth Risks
The NEV sales progress in China and Norway, as well as the recent NEV sales spurt in Germany (Figure 1b) and Japan (Figure 4), are the examples of positive trends. Nevertheless, one can find some negative trends in the immature NEV market as well. The most vivid example is the NEV market in the Netherlands, with its inconsistent NEV subsidy policy. Twice, in 2013 and 2015, the Netherlands was the European NEV capital, but during last two years (2016 and 2017), NEV sales collapsed (Figure 4). This steady decay is also observed in the NEV market in Denmark, one of the world’s symbols of renewable energy generation progress, and was even seen in Japan from 2014 till 2016. The year 2017 is looking to be not only breakthrough year for Germany (Figure 1b), but also the turning point for Japan, bringing it back into the leading positions in global NEV sales (Table S1), with some room for further growth, keeping in mind its 1.1% NEV market share.
Moreover, the NEV market instability was demonstrated in China in the beginning of 2017. In January, NEV sales dropped (Figure 5) because of the subsidy criteria opacity. Moreover, we can suppose that such a negative feature of the Chinese NEV market with regular sales drops in January and February results in NEV sales instability, and can impede on achieving the planned Chinese NEV sales goals.
Furthermore, the Chinese and Norwegian practices of successive NEV adoption are very important for the global society. We are happy to see the growing number of articles analyzing Chinese NEV policies (see, for example [16,17,19,41]). We strongly hope that these valuable studies will find their readers among policymakers from other countries.
Governmental policy variability is the main risk for faster NEV adoption. On the one hand, such a risk makes the NEV market growth less sustainable. On the other hand, all of the trends of NEV sales decreasing in local markets are looking to be transient. We can suppose that the complex ecological, political, and economical reasons for NEV adoption initiatives will further drive governmental support in the major leading countries.
The second risk of fast NEV adoption is the limited production capacity growth both for NEV and traction batteries. According to a recent KPMG study, 55% of auto industry executives [42] still believe that pure battery EVs will fail because of infrastructure (down from 62% in 2017 [43]). We can suggest that the NEV skepticism in the automotive industry impedes on the funding allocation for NEV the production capacity increasing. The growth of battery plants’ production capacities is also very important, or, to be more correct, crucial. The overall traction battery capacity produced by the leading manufacturer, Panasonic, can be estimated as 10.1 GW·h in 2017 (up from 6.7 GW·h in 2016) [20]. VW group alone estimates its own needs as more than 150 GW·h annually, until 2025 [44]. The expected production capacity rush can be the greatest challenge for the battery industry and should be properly supported by the scientific society.
Production capacity growth is the key step towards the NEV price decreasing. It is very important to mention the recent statement by Carlos Ghosn [45], the ex-chairman of the world leading Renault–Nissan–Mitsubishi alliance (Figure S1). He has claimed that there is not much need for the further EV range increasing, and 300 km is enough for the main part of consumers, with their average daily drives of about 50 km. According to his words, the companies have only recently determined this range threshold, and today, the most important issue is NEV price. One can expect that the maturing of lithium traction battery market will be accompanied by price diversification—from very cheap batteries with a low capacity and limited warranty, to expensive batteries with the highest energy density and/or charging rates.
The third important risk of fast NEV adoption is the environmental and economic impact of traction battery recycling. The rather popular idea of traction batteries re-usage in stationary energy storage systems, announced by different NEV makers, implies that the problem of traction battery utilization is postponed, but not solved. We are afraid that the growth of lithium battery recycling capacity lags far behind the growth of lithium battery production.
The fourth risk to be mentioned is the raw material supply risk (see, for example, [46]). While the most popular cell chemistries utilize NMC/NCA cathodes, the biggest critical risk, besides lithium itself, is associated with the cobalt and nickel supply. The recent trend of specific energy increasing by nickel content growth could make nickel even more risky than the less abundant cobalt [47]. The further development of Li- and Mn-rich cathode materials can help to mitigate the risk. The underestimation of the phosphorous supply risks (LFP cathodes) are also hazardous because of the critical role of phosphorous in the food industry [48], and population growth. Natural graphite, the most popular anode material, is also a limited mineral resource, so artificial graphite production and characterization are of great importance as well.
Finally, we want to remind of the importance of charging infrastructure deployment. As we have mentioned above, the main fear of auto industry executives [42] is associated with an insufficient charging infrastructure. For example, the fast NEV sales growth in Norway and Sweden was supported by Nordic fast-charging corridor deployment (at least one fast charging outlet every 50–60 km on the main highways) [49]. However, the charging behavior studies for Norway and Sweden show that electric car drivers most frequently charge their vehicles at home or at work using slow chargers [49]. Moreover, the proper fast-charging network in Denmark did not help with NEV sales growth (see Figure 5), thus demonstrating that charging infrastructure deployment is necessary, but not a sufficient condition for NEV sales growth. Other forms of steady governmental support of faster NEV adoption are still required. And, surprisingly, even the further charging infrastructure deployment will increase the need for batteries too [50].
4. Methods
The quantitative characterization of the EV adoption progress needs data. Fortunately, there are some proper open sources. First, we can mention reports within the Electric Vehicles Initiative by International Energy Agency (IEA) [49,51], reports by the International Council on Clean Transportation (ICCT) [52], and the EV section in the Annual Energy Outlook [53] by U.S. Energy Information Administration (EIA). There are also some web-resources from the China Association of Automobile Manufacturers (CAAM) [54], the European Alternative Fuels Observatory (EAFO) [55] by the European Commission, and the EV sales blog [20]—the open source version of EV Volumes database [31]. Finally, analytical companies such as Bloomberg New Energy Finance (BNEF) with Electric Vehicle Outlook [56], Navigant research [57], IDTechEx [58], HIS Markit [59], and others can provide some paid reports. Conventional car production open source data are provided by the European Automobile Manufacturers’ Association (ACEA) [60], and JATO [61].
5. Conclusions
In conclusion, we can estimate the EV adoption rates and progress as moderately optimistic. Global sales of the electric bus stood at about 90,000 units in 2017, with an optimistic 35% market share in China. One large city, Shenzhen, can already boast of a pure electric bus fleet. The half of all of the new buses are expected to be electric in the not so distant 2025. This is a good sign both for sustainable cities and for alternative battery chemistries, namely LFP and LTO. Other promising markets for LFP-based batteries are electric trucks, vessels, and low-speed EV.
The largest part of plug-in cars utilize MNC/NCA-based batteries, and further, this chemistry is expected to be even more dominating. The global plug-in cars sales reached 1.2 million units in 2017 and a low 1.4% market share of global personal car sales. A simple estimation of sales progress for major and medium automobile markets demonstrates that at the current rates, only Norway; China; and, maybe, Sweden are expected to surpass a double-digit NEV market share in 2020. The United States, for example, with its steady linear growth of plug-in car sales, is only expected to reach 10% in the distant 2070! The most real hope for breakthrough is fed by the Tesla Model 3 production rates, but the question is whether the only auto maker can break the slow-growth trend without proper governmental support. Of course, the long-lasting prospect of NEV market growth is a good sign for the NEV industry, traction battery industry, and related research societies, but the negative environmental impact of fuel-burning transport is currently expected to last for decades. Electric cars, lagging behind electric buses, could become the weakest link in hte sustainable transportation chain.
The annual production capacity of the traction battery industry is about 100 GW·h, but the growing automobile industry needs much more. This fast-growing demand together with the small 1.4% market share in 2017, makes the automobile industry’s needs dominate over the needs of the portable electronics market, thus shifting the topical goals for both the battery industry and battery research society. Two of the most pressing issues are scaling up both the lithium battery production and recycling capacities, and the battery price decreasing. Increasing the battery specific capacity is still important, especially for challenging aerial pure electric and hybrid electric aircrafts, but it is not crucial anymore for the automobile industry.
Finally, we hope that this market study, targeted to the material research community, will not be the only one. It should be followed by studies, focused on specific electrode materials and specific vehicle types. These articles should be made with the active participation of the traction industry representatives and experts with an economy, business, or finance background. We hope that these articles will be addressed to the whole battery research community, and will be published in the corresponding journals. Lithium batteries are crucial for our sustainable future, and we believe that market-related studies will help use research resources more effectively.
Supplementary Materials
The following are available online at https://www.mdpi.com/2313-0105/4/4/65/s1, Table S1: NEV sales in 2017 and market shares in 2017 and 2016 for selected NEV markets; Table S2: Top-10 automotive groups with the highest plug-in cars sales, their battery suppliers and cell chemistries; Figure S1: Annual NEV sales of top 10 automobile groups in NEV sales (year 2017 results); Figure S2: The best sold NEV models by automobile groups.
Author Contributions
Conceptualization and writing (original draft preparation and formal analysis), D.V.P.; methodology, validation, data curation, and writing (review and editing), D.V.P. and J.P.; the authors would like to thank the reviewers for their fruitful discussion.
Funding
This work was performed within the State Task No. 3.6115.2017/8.9 of the Ministry of Education and Science of the Russian Federation, and was supported by Government of the Russian Federation (Act 211, Agreement 02.A03.21.0006).
Conflicts of Interest
The authors declare no conflict of interest.
Appendix A. Terminology and Abbreviations
Measuring the progress and rates of transport electrification requires the clear classification of EV types. First of all, electrified transport can be (1) ground (EV), (2) marine (electric vessels), and (3) aerial (electric aircrafts).
Ground EVs usually include (but are not limited to) passenger cars, light commercial vehicles (LCV), trucks (both short- and long-range), buses, a wide range of other types of passenger and cargo transport (locomotives, trams, trolleybuses, etc.), municipal service vehicles (including garbage/sanitation trucks), emergency vehicles, mining vehicles, and even heavy construction vehicles. Electric vessels include ferries, tugboats, offshore platform supply vessels, barges, cargo ships, dive support vessels, yachts, fishing boats, fish farming workboats, and so on. Electric aircrafts include short-range one- and two-seaters, both manned and unmanned vertical take-off and landing (VTOL) aircrafts, and even some airliners for short-range door-to-door travels. All of the mentioned above types of electric transport are commercially available, or, at least, are expected to be available within a few years, like fishing boats and short-range airliners with hybrid electric propulsion.
The second thing to mention in terms of classification is that electric propulsion can be both purely electric and hybrid. It is very important to understand that different types of electric propulsion require different types of batteries. The most popular hybrid car and LCV types are as follows:
- Battery electric vehicles (BEV). Other possible terms are pure electric, all-electric, and zero-emission (ZEV) vehicles;
- Hydrogen EV;
- Plug-in hybrid vehicles (PHEV);
- Conventional hybrid electric vehicles (HEV);
- Micro-hybrids;
- Mild hybrids.
The battery size can be roughly estimated, varying from about 20 to 100 kW·h for BEV, and from 10 to 20 kW·h for PHEV. Conventional, micro- and mild-hybrids usually have batteries of a few kW·h in size. Starting, lightning, and ignition (SLI) batteries used in conventional gasoline cars are about 1 kW·h and below. The main focus of this work is on BEV and PHEV, usually jointly named as plug-in electric vehicles (PEV) or new energy vehicles (NEV; mainly in China).
References
- Zero-Emission Vehicle Legal and Regulatory Activities—Background. Available online: https://www.arb.ca.gov/msprog/zevprog/background.htm (accessed on 21 December 2017).
- Collantes, G.; Sperling, D. The origin of California’s zero emission vehicle mandate. Transp. Res. Part A Policy Pract. 2008, 42, 1302–1313. [Google Scholar] [CrossRef]
- Reducing Pollution with Electric Vehicles. Available online: https://www.energy.gov/eere/electricvehicles/reducing-pollution-electric-vehicles (accessed on 8 October 2018).
- Zachariadis, T. After ‘dieselgate’: Regulations or economic incentives for a successful environmental policy? Atmos. Environ. 2016, 138, 1–3. [Google Scholar] [CrossRef]
- Tietge, U.; Zacharof, N.; Mock, P.; Franco, V.; German, J.; Bandivadekar, A.; Ligterink, N.; Lambrecht, U. From Laboratory to Road. Available online: https://www.theicct.org/sites/default/files/publications/ICCT_LaboratoryToRoad_2015_Report_English.pdf (accessed on 4 November 2018).
- Bousso, R. BP Deepwater Horizon Costs Balloon to $65 Billion. Available online: https://www.reuters.com/article/us-bp-deepwaterhorizon/bp-deepwater-horizon-costs-balloon-to-65-billion-idUSKBN1F50NL (accessed on 27 April 2018).
- Diaz, D.; Moore, F. Quantifying the economic risks of climate change. Nat. Clim. Chang. 2017, 7, 774–782. [Google Scholar] [CrossRef]
- The Geopolitics of Oil. Available online: http://science.sciencemag.org/content/210/4476/1324 (accessed on 4 November 2018).
- Zorpette, G. Technology 1991: Power and energy. IEEE Spectr. 1991, 28, 61–64. [Google Scholar] [CrossRef]
- Dunckley, M. Electric vehicles—Are they a realistic option for the future? J. Power Sources 1993, 42, 291–295. [Google Scholar] [CrossRef]
- Busch, C. China’s All in on Electric Vehicles: Here’s How That Will Accelerate Sales in Other Nations. Available online: https://www.forbes.com/sites/energyinnovation/2018/05/30/chinas-all-in-on-electric-vehicles-heres-how-that-will-accelerate-sales-in-other-nations/#668d54de5c1e (accessed on 8 October 2018).
- Pelegov, D.V. Batteries, Fuel Cells, and Their Role in Modern Society. Available online: https://www.edx.org/course/batteries-fuel-cells-role-modern-society-urfux-batfuelc (accessed on 4 November 2018).
- Bresser, D.; Hosoi, K.; Howell, D.; Li, H.; Zeisel, H.; Amine, K.; Passerini, S. Perspectives of automotive battery R&D in China, Germany, Japan, and the USA. J. Power Sources 2018, 382, 176–178. [Google Scholar] [CrossRef]
- Rezvani, Z.; Jansson, J.; Bodin, J. Advances in consumer electric vehicle adoption research: A review and research agenda. Transp. Res. Part D Transp. Environ. 2015, 34, 122–136. [Google Scholar] [CrossRef]
- Du, J.; Ouyang, D. Progress of Chinese electric vehicles industrialization in 2015: A review. Appl. Energy 2017, 188, 529–546. [Google Scholar] [CrossRef]
- Zhang, X.; Liang, Y.; Yu, E.; Rao, R.; Xie, J. Review of electric vehicle policies in China: Content summary and effect analysis. Renew. Sustain. Energy Rev. 2017, 70, 698–714. [Google Scholar] [CrossRef]
- Wang, N.; Pan, H.; Zheng, W. Assessment of the incentives on electric vehicle promotion in China. Transp. Res. Part A Policy Pract. 2017, 101, 177–189. [Google Scholar] [CrossRef]
- Cheng, M.; Tong, M. Development status and trend of electric vehicles in China. Chin. J. Electr. Eng. 2017, 3, 1–13. [Google Scholar] [CrossRef]
- Wang, S.; Li, J.; Zhao, D. The impact of policy measures on consumer intention to adopt electric vehicles: Evidence from China. Transp. Res. Part A Policy Pract. 2017, 105, 14–26. [Google Scholar] [CrossRef]
- Pontes, J. EV Sales. Available online: http://ev-sales.blogspot.com/ (accessed on 26 April 2018).
- Munoz, F. Global Car Sales up by 2.4% in 2017 Due to Soaring Demand in Europe, Asia-Pacific and Latin America. Available online: http://www.jato.com/global-car-sales-2-4-2017-due-soaring-demand-europe-asia-pacific-latin-america/ (accessed on 28 March 2018).
- Gartner Says Worldwide Sales of Smartphones Recorded First Ever Decline During the Fourth Quarter of 2017. Available online: https://www.gartner.com/newsroom/id/3859963 (accessed on 27 March 2018).
- Why The Ternary Lithium Battery is Becoming Mainstream. Available online: http://www.powerlongbattery.com/news/why-the-ternary-lithium-battery-is-becoming-ma-2868938.html (accessed on 30 March 2018).
- BYD Electric Buses Top the Sales for Four Consecutive Years. Available online: http://www.chinabuses.org/news/2018/0119/article_11422.html (accessed on 30 March 2018).
- Yutong’s Sales Volume Continues to Rank First in China’s Bus Industry. Available online: http://en.yutong.com/pressmedia/yutongnews/2018/2018APKvpvcCJL.html (accessed on 30 March 2018).
- Adesanya-Aworinde, V. Lithium-Ion Batteries for Electric Buses 2016–2026; IDTechEx Research: Cambridge, UK, 2016. [Google Scholar]
- Liang, C.; Guo, Y. Progress and Prospects of High Energy Density Materials for EV Lithium-Ion Batteries. In Proceedings of the 19th International Meeting on Lithium Batteries, Kyoto, Japan, 17–22 June 2018; p. INV-06. [Google Scholar]
- Dixon, T. China 100% Electric Bus Sales Drop to ~89,546 in 2017. Available online: https://evobsession.com/china-100-electric-bus-sales-drop-to-89546-in-2017/ (accessed on 2 April 2018).
- Trucks Drove Growth of Commercial Vehicles. Available online: http://www.caam.org.cn/AutomotivesStatistics/20180115/1305214917.html (accessed on 2 April 2018).
- Southern Chinese City Makes All Buses Electric. Available online: http://www.xinhuanet.com/english/2017-12/28/c_136857584.htm (accessed on 2 April 2018).
- Irle, R.; Pontes, J.; Irle, V. EV Volumes. Available online: http://www.ev-volumes.com/datacenter/ (accessed on 26 April 2018).
- Commercial Vehicle Registrations: +3.2% in 2017; −3.5% in December. Available online: http://www.acea.be/press-releases/article/commercial-vehicle-registrations-3.2-in-2017-3.5-in-december (accessed on 2 April 2018).
- Mattis, W.; Wu, Y. Enabling Competent Electrical Vehicles. In Proceedings of the 19th International Meeting on Lithium Batteries, Kyoto, Japan, 17–22 June 2018; p. INV-05. [Google Scholar]
- NEV Enjoyed Strong Development. Available online: http://www.caam.org.cn/AutomotivesStatistics/20180115/1305214916.html (accessed on 26 April 2018).
- China Low-Speed Electric Vehicle Industry Report, 2018-2022; ResearchInChina: Beijing, China. 2018. Available online: http://www.researchinchina.com/Htmls/Report/2018/10458.html (accessed on 4 November 2018).
- McClenny, I.; Citron, R. Advanced Battery Technologies for E-Bikes, Low Speed EVs, and E-Power Two-Wheel Vehicles: Global Market Analysis and Forecasts. Available online: https://navigantresearch.com/reports/market-data-advanced-batteries-for-light-evs (accessed on 4 November 2018).
- Citron, R.; Gartner, J. Electric Bicycles; Navigant Consulting, Inc.: Boulder, CO, USA, 2016; Available online: https://www.navigantresearch.com/research/electric-bicycles (accessed on 27 March 2017).
- Hurst, D.; Gartner, J. Navigant Research Leaderboard Report: Electric Scooters; Navigant Consulting, Inc.: Boulder, CO, USA, 2014; Available online: http://files.meetup.com/1468133/LB-ESCOOT-13-Executive-Summary.pdf (accessed on 4 November 2018).
- Chediak, M. Electric Buses Will Take over Half the World Fleet by 2025. Available online: https://www.bloomberg.com/news/articles/2018-02-01/electric-buses-will-take-over-half-the-world-by-2025 (accessed on 30 March 2018).
- Si, M.; Yu, C. Rules Set New Targets for NEVs. Available online: http://english.gov.cn/state_council/ministries/2017/09/29/content_281475892901486.htm (accessed on 29 September 2017).
- Liu, C.; Huang, W.; Yang, C. The evolutionary dynamics of China’s electric vehicle industry—Taxes vs. subsidies. Comput. Ind. Eng. 2017, 113, 103–122. [Google Scholar] [CrossRef]
- KPMG’s Global Automotive Executive Survey 2018. Available online: https://assets.kpmg.com/content/dam/kpmg/tr/pdf/2018/03/global-automotive-executive-survey-2018.pdf (accessed on 4 November 2018).
- KPMG’s Global Automotive Executive Survey 2017. Available online: https://assets.kpmg.com/content/dam/kpmg/xx/pdf/2017/01/global-automotive-executive-survey-2017.pdf (accessed on 4 November 2018).
- The Volkswagen Group Launches the Most Comprehensive Electrification Initiative in the Automotive Industry with “Roadmap E”. Available online: https://www.volkswagenag.com/en/news/2017/09/Roadmap_E.html (accessed on 12 September 2017).
- Coleman, Z. Electric Car Range Issue Has Been Solved, Says Ghosn. Available online: https://asia.nikkei.com/Business/Companies/Electric-car-range-issue-has-been-solved-says-Ghosn (accessed on 4 November 2018).
- Olivetti, E.A.; Ceder, G.; Gaustad, G.G.; Fu, X. Lithium-Ion Battery Supply Chain Considerations: Analysis of Potential Bottlenecks in Critical Metals. Joule 2017, 1, 229–243. [Google Scholar] [CrossRef]
- Susai, F.A.; Sclar, H.; Shilina, Y.; Penki, T.R.; Raman, R.; Maddukuri, S.; Maiti, S.; Halalay, I.C.; Luski, S.; Markovsky, B.; et al. Horizons for Li-Ion Batteries Relevant to Electro-Mobility: High-Specific-Energy Cathodes and Chemically Active Separators. Adv. Mater. 2018, 30, 1801348. [Google Scholar] [CrossRef] [PubMed]
- De Ridder, M.; De Jong, S.; Polchar, J.; Lingemann, S. Risks and Opportunities in the Global Phosphate Rock Market; The Hague Centre for Strategic Studies: The Hague, The Netherlands, 2012; Available online: https://www.phosphorusplatform.eu/images/download/HCSS_17_12_12_Phosphate.pdf (accessed on 4 November 2018).
- Nordic EV Outlook 2018. Available online: https://webstore.iea.org/nordic-ev-outlook-2018 (accessed on 4 November 2018).
- McClenny, I.; Shepard, S. Energy Storage for EV Charging; Navigant Consulting, Inc.: Boulder, CO, USA, 2018; Available online: https://www.navigantresearch.com/reports/energy-storage-for-ev-charging (accessed on 4 November 2018).
- Global EV Outlook 2017. Available online: https://webstore.iea.org/global-ev-outlook-2017 (accessed on 4 November 2018).
- Hall, D.; Moultak, M.; Lutsey, N. Electric Vehicle Capitals of the World. Available online: https://www.theicct.org/publications/EV-capitals-of-the-world-2017 (accessed on 4 November 2018).
- Annual Energy Outlook 2018. Available online: https://www.eia.gov/outlooks/aeo/ (accessed on 4 November 2018).
- China Association of Automobile Manufacturers. Available online: http://www.caam.org.cn/english/newslist/a101-1.html (accessed on 26 April 2008).
- European Alternative Fuels Observatory. Available online: http://www.eafo.eu/ (accessed on 26 April 2018).
- Electric Vehicle Outlook. Available online: https://about.bnef.com/electric-vehicle-outlook/ (accessed on 26 April 2018).
- Electric Vehicles. Available online: https://www.navigantresearch.com/research/transportation-efficiencies/electric-vehicles (accessed on 26 April 2018).
- Electric Vehicles: Land, Water, Air—IDTechEx Reports and Subscriptions. Available online: https://www.idtechex.com/reports/topics/electric-vehicles-land-water-air-000002.asp (accessed on 26 April 2018).
- IHS Markit. Available online: https://ihsmarkit.com/industry/automotive.html (accessed on 4 May 2018).
- European Automobile Manufacturers’ Association (ACEA). Available online: http://www.acea.be/statistics/tag/category/production (accessed on 26 April 2018).
- JATO Blog. Available online: https://www.jato.com/ (accessed on 4 November 2018).
Figure 1.
Annual plug-in car sales evolution: (a) worldwide, China, the United States, and Europe with (b) the specification for major European plug-in car markets.
Figure 1.
Annual plug-in car sales evolution: (a) worldwide, China, the United States, and Europe with (b) the specification for major European plug-in car markets.

Figure 2.
Annual new energy (NE) bus sales in China.

Figure 3.
New energy vehicle (NEV) sales estimations for China and the United States.

Figure 4.
Plug-in car sales decay in the Netherlands and Denmark, compared with the NEV market growth in Norway and, recently, Japan.
Figure 4.
Plug-in car sales decay in the Netherlands and Denmark, compared with the NEV market growth in Norway and, recently, Japan.

Figure 5.
Annual NEV sales drop in China, 2015–2018 comparison.

© 2018 by the authors. Licensee MDPI, Basel, Switzerland. This article is an open access article distributed under the terms and conditions of the Creative Commons Attribution (CC BY) license (http://creativecommons.org/licenses/by/4.0/).
Share and Cite
MDPI and ACS Style
Pelegov, D.V.; Pontes, J. Main Drivers of Battery Industry Changes: Electric Vehicles—A Market Overview. Batteries 2018, 4, 65. https://doi.org/10.3390/batteries4040065
AMA Style
Pelegov DV, Pontes J. Main Drivers of Battery Industry Changes: Electric Vehicles—A Market Overview. Batteries. 2018; 4(4):65. https://doi.org/10.3390/batteries4040065
Chicago/Turabian StylePelegov, Dmitry V., and José Pontes. 2018. "Main Drivers of Battery Industry Changes: Electric Vehicles—A Market Overview" Batteries 4, no. 4: 65. https://doi.org/10.3390/batteries4040065
Note that from the first issue of 2016, this journal uses article numbers instead of page numbers. See further details here.