1. Introduction
Li-ion secondary batteries have received increasing attention, as they have become widespread in various products, including laptop PCs and electric vehicles [
1]. In spite of the remarkable advancements in Li-ion battery technology, a higher energy and power density, safer electrodes and electrolytes, and longer durability are still required [
2]. In order to satisfy these demands, the design of battery electrodes plays a key role, in addition to developing new materials for the electrodes and electrolytes [
3,
4,
5,
6].
Numerical simulation techniques are powerful tools for the prediction of battery performance from the process parameters of the electrodes. The one-dimensional physico-chemical simulation models have been used widely, in order to predict not only the battery performance [
7,
8], but also durability [
9,
10,
11] and safety [
12,
13]. Although the calculation load is lower in these models, the mesoscale porous structures of the electrodes are not reflected, because these structures are approximated as homogeneous in the solid and liquid states. On the other hand, three-dimensional extended simulations, using 3D-SEM tomography data [
14,
15] or artificial structures [
16,
17], based on the physico-chemical model, have been developed and reported recently. As the mesoscale structures of the porous electrodes are taken into account and the three-dimensional distributions of the electrochemical reaction and Li/Li concentration are estimated in these detailed models, more accurate predictions of battery performance are expected.
Recently, parametric studies and sensitivity analyses of the process parameters, using artificial neural networks (ANNs) combined with physico-chemical models, have been carried out [
18,
19]. ANNs are brain-inspired systems, which are one of the main machine learning tools. In these papers, it has been proved that ANNs are useful tools for the regression of battery performance and analysis of the importance features. However, in most cases, a one-dimensional homogeneous model has been used, because these studies need a large amount of simulation cases. Therefore, the sensitivity and the optimized three-dimensional mesoscale structure of the electrode and process parameters for the battery performance remain unclear. In this study, we propose a theoretical prediction and optimization scheme for a three-dimensional porous electrode of an Li-ion battery using high-throughput simulation models and machine learning techniques. In this scheme, the simplification of governing equations enables us to reduce the calculation costs, and the machine learning techniques make it possible to obtain the contribution of the process parameters to the battery performance and the optimized conditions. To the best of our knowledge, this is the first study to develop such a calculation scheme in the field. The objective function adopted is the total specific resistance of the electrode, as a lower total specific resistance might improve the battery performance, including capacity and power.
For the development of prediction models, it is vital to compare the performance predicted by the model and that of the actual battery electrodes. As a step prior to the comparison, in this study, we focus on the development of the scheme, including: (1) automatic structural and performance data generation with various process conditions; (2) development of the regression model using machine learning techniques; and (3) analysis of the inverse problem. The study involves the following three steps. First, a high-throughput physico-chemical model, based on particle-aggregated structures (assuming a positive electrode), are developed and a database of the relationships between the process parameters and the battery performance is constructed. Next, the regression model of the electrode specific resistance is created, using controllable condition parameters (active material volume fraction, size, and so on) and using an ANN, in order to clarify the effect of these parameters on the total specific resistance. Finally, the optimized electrode structures and the process parameters are found by Bayesian optimization.
2. Simulation Method
2.1. Simulation Scheme
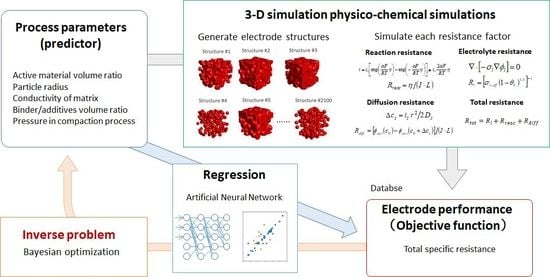
Figure 1 illustrates the proposed prediction and optimization scheme for a Li-ion battery porous electrode. In the first step, a high-throughput physico-chemical model, based on particle-aggregated structures, is developed and the database of the relationships between the process parameters—including particle volume fraction, particle radius, and so on—and the battery performance (represented by charge/discharge specific resistance) is constructed. In the second step, the regression model is developed in order to predict the charge/discharge specific resistance, using process parameters as predictors through an ANN. The optimized electrode structures and the process parameters are found by Bayesian optimization in the final step.
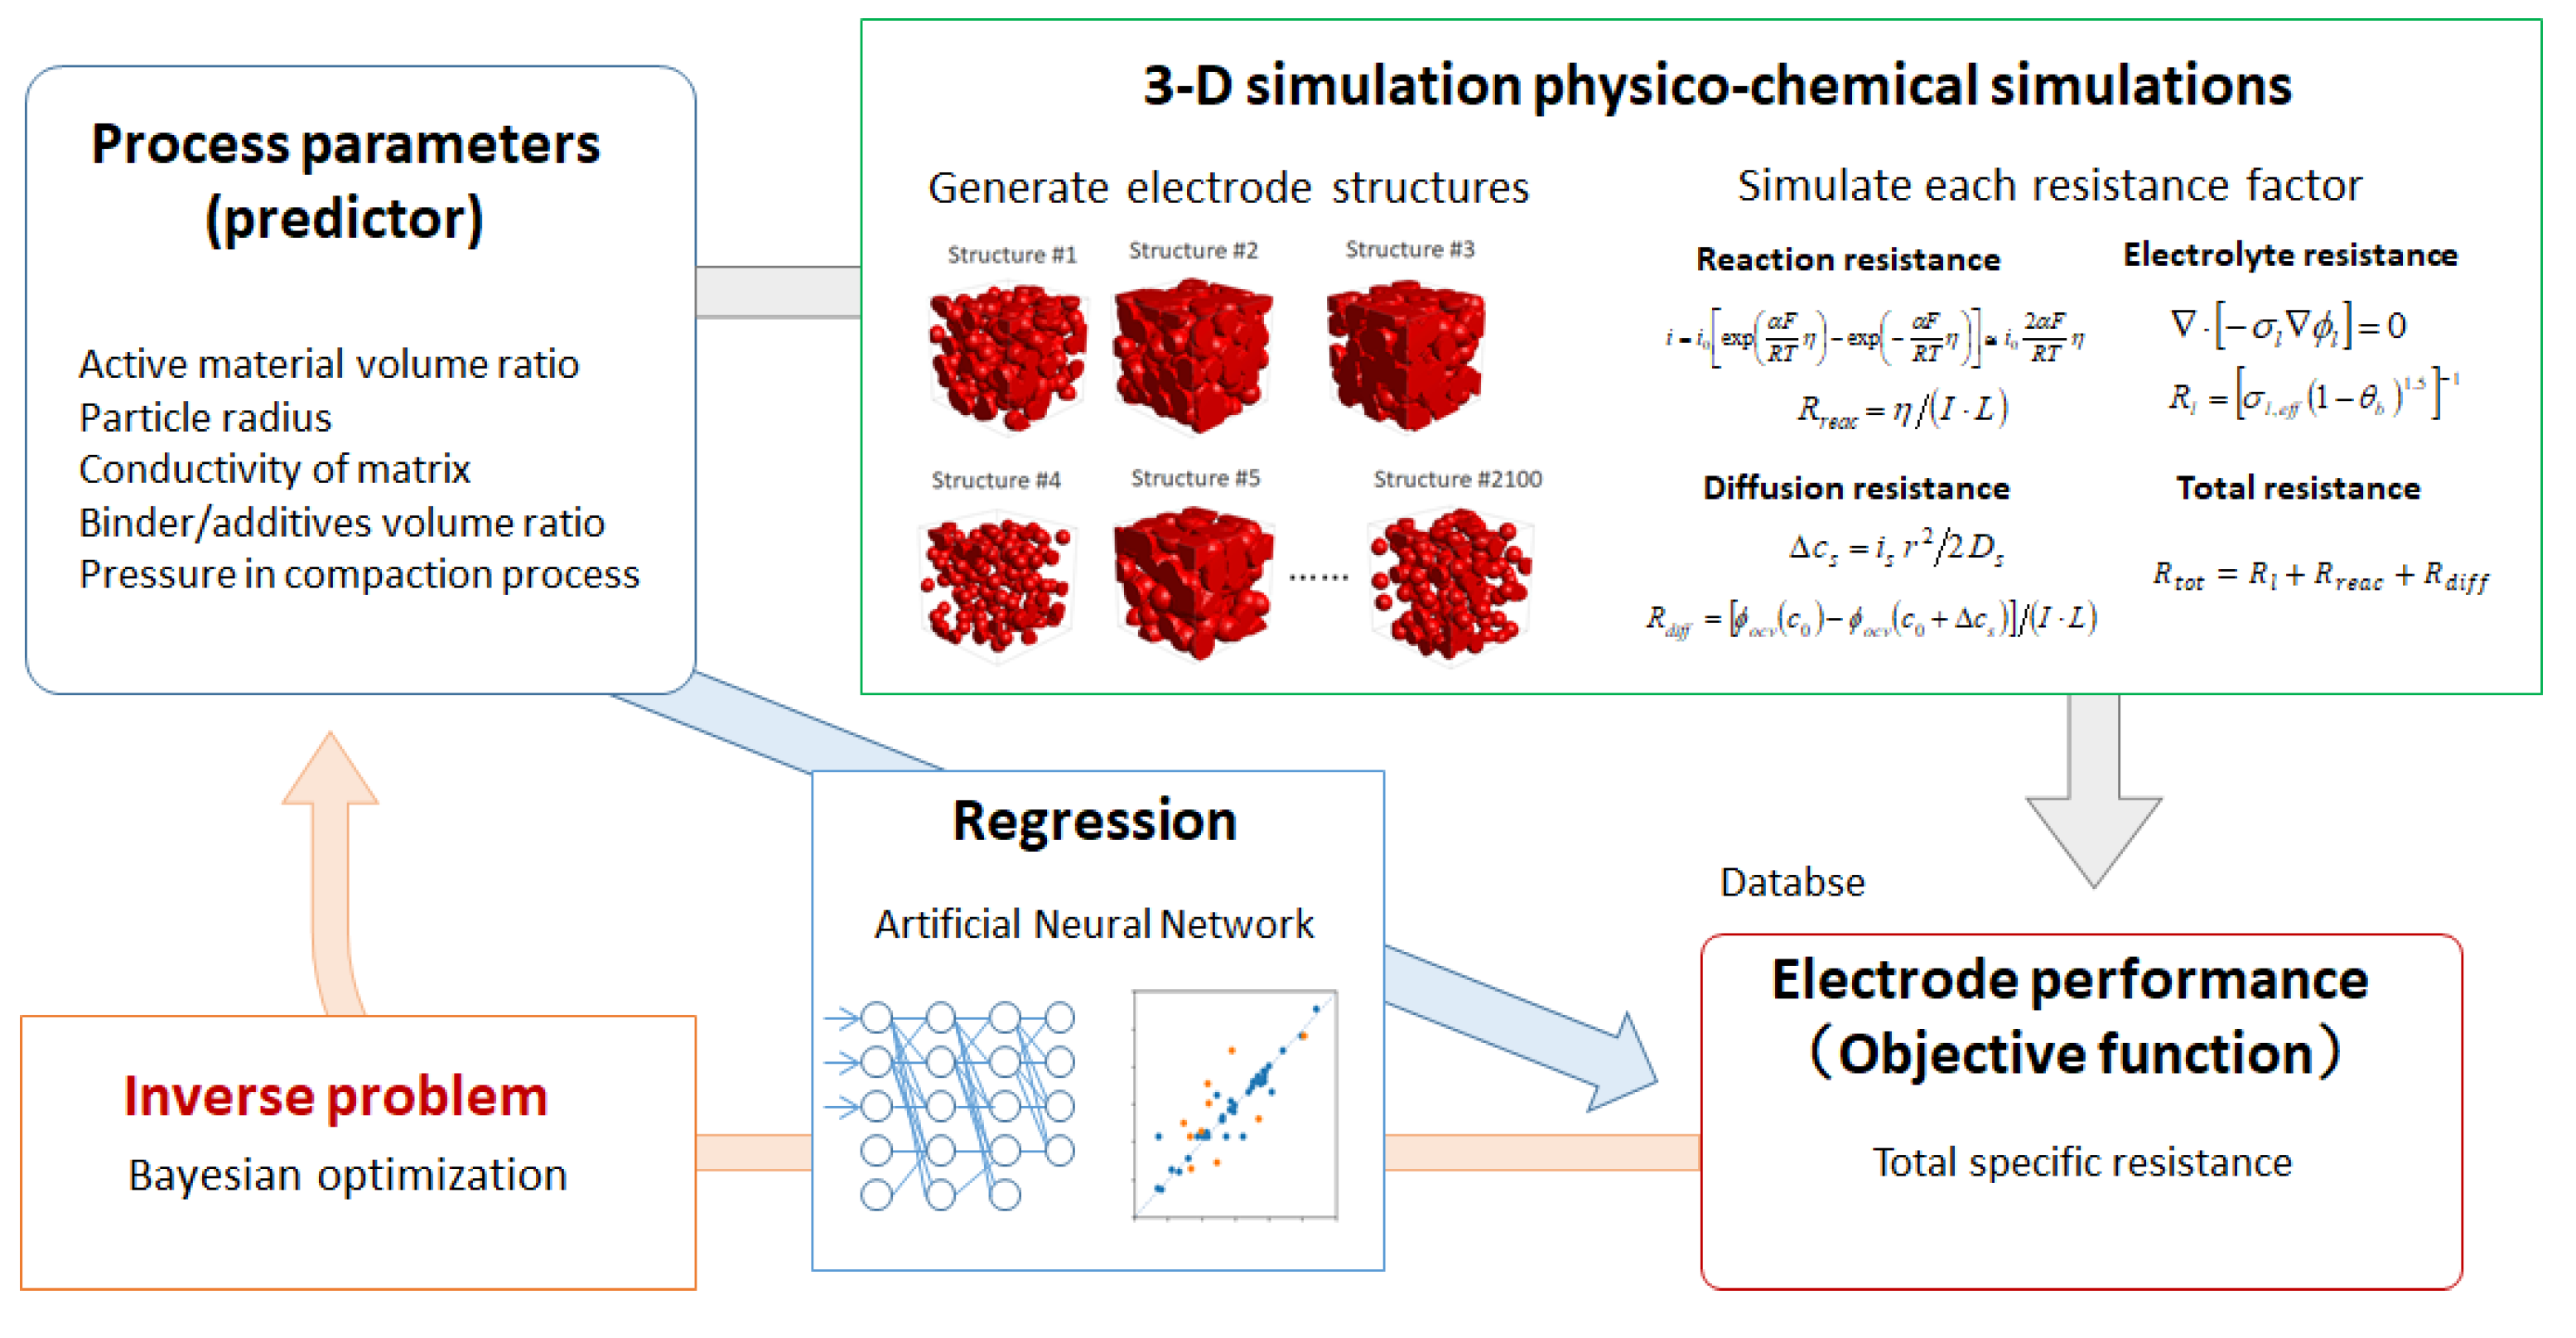
2.2. Generation of Three-Dimensional Virtual Structure of Active Material
A total of 2100 three-dimensional artificial electrode structures, composed of hundreds of aggregated particles, are generated for the evaluation of battery electrode specific resistance.
Figure 2a shows the flowchart for generating artificial structures with parameters, based on a random packed method [
20] using MATLAB code. The active material particle radius (2.5–12.5 µm) is extracted randomly with a uniform distribution, and the spheres are generated in a 50 × 50 × 50 µm
3 box, until the volume fraction reaches a randomly specified value. The compaction process of the electrode (calendaring) affects the mesoscale structure of the pore region and active material particles. Here, the maximum overlap length,
δ, between active material particles is estimated from the compaction pressure
P and the number of active material particle, using the theoretical model [
21]:
where
a,
r, and
E are the radius of contact area, the radius of the particle, and Young’s modulus (assuming 1.0 GPa), respectively. The force between the particles
F is estimated as
, where
S and
Nap indicate the cross-sectional area of the system and the number of particles, respectively. The generated mesoporous structures of the electrode are shown in
Figure 2b.
2.3. Estimation of Surface Area of Pore Region and Volume Fraction of Active Material
In the manufacturing process of the electrode, a binder and conductive aid are added to active material particles, in order to improve their adhesion and conductivity. Although prediction techniques for 3D binder structures in porous materials have been proposed [
22], it is still difficult to reproduce their accurate structure. In this study, the binder and additive region are not modeled explicitly in the 3D structure, but are assumed to be completely mixed and homogeneous, in order to estimate the effective porosity and surface area of the active material. The volume fraction of the homogeneous binder/additives region,
θb, is estimated by the volume fraction of the pore region
θp to
Nap. The effective volume fraction of the pore region,
θp,eff, and the effective surface area,
Sp,eff, are estimated by:
2.4. Simplified Physico-Chemical Model
Using the generated structures described in
Section 2.2, the simplified physico-chemical model was applied in order to evaluate the specific resistance in each structure. The effective conductivity of the electrolyte is evaluated by the 3D Poisson equation:
where
σl and
φl are the bulk electrolyte conductivity and potential, respectively. The electrolyte resistance,
Rl, is estimated from the effective conductivity of electrolyte,
σl,eff, by:
This calculation was performed using GeoDict (Math2Market GmbH) [
23].
The reaction resistance,
Rreac, between the active material and the electrolyte is evaluated by the linearized Butler–Volmer equation:
where
i0,
i,
η,
α,
F,
R, and
T denote the exchange current density, current density per surface area of active material overpotential, transfer coefficient, Faraday constant, gas constant, and temperature, respectively.
I and
L are the current density per cross section and system length, respectively.
Li diffusion in the active material is described by the steady-state diffusion equation using the diffusion coefficient,
Ds, by:
where
cs indicates the Li concentration in the active material. In this study, Equation (10) is simplified assuming a single spherical particle:
where ∆
cs is the concentration polarization. Therefore, the Li diffusion resistance can be estimated as:
using the average Li concentration in the active material,
c0, and the open circuit voltage (OCV) function:
where
cmax is the coefficient of maximum Li concentration of the active material,
pi indicates the coefficient of the polynomial OCV function given in
Table 1. These simplifications make it possible to reduce the calculation load for three-dimensional complex structures.
The total specific resistance,
Rtot, of the electrode is evaluated by the summation of the electrolyte resistance,
Rl, the reaction resistance,
Rreac, between the active material and the electrolyte, and the Li diffusion resistance,
Rdiff:
In the typical electrode and electrolyte, the previous papers have reported that the electric resistance in the electrode is 10–100 times smaller than that of electrolyte resistance [
7,
8,
10]. In this study, therefore, the electric resistance in the electrode is assumed to be negligible for simplicity.
In order to evaluate each charge/discharge specific resistance, the typical electrochemical parameters of a so-called NCM (lithium nickel manganese cobalt oxide, Li(Ni
1/3Mn
1/3Co
1/3)O
2) positive electrode (an oxide material) are employed, as shown in
Table 2.
2.5. Machine Learning Model
Based on the simulation results described in
Section 2.3, ANN models are created as a regression model of the battery specific resistance using the controllable condition parameters (active material volume fraction, size, and so on).
Table 3 shows the dataset for learning and testing, including predictors and descriptors, where 70% of the data were taken at random as the training set, and remaining data were used for validation of the ANN, using the
R2 value.
Although there are a lot of machine learning models, such as lasso [
24] and ridge regression [
25], based on linear regression techniques, ANN, based on nonlinear regression, are useful tools in predicting complex relationships between the inputs and outputs, or for finding patterns in datasets [
26]. In this study, the ANN models are constructed with three hidden layers between the input and the output, with 20 neurons and a sigmoid transfer function.
Furthermore, an inverse analysis of the process parameters from the total specific resistance was carried out using ANNs and Bayesian optimization. In this model, the process parameters are initialized randomly and the next candidate is implemented with maximum likelihood estimation (MLE). The expected improvement method is adopted as an acquisition function with a Matern 5/2 kernel function.
ANN modeling and Bayesian optimization were performed using Scikit-learn [
27] and GPyopt [
28] of Python Machine Learning library.
3. Results and Discussion
3.1. Sensitivity Analysis of Each Specific Resistance
A sensitivity analysis of the charge/discharge specific resistance to the process parameters has been carried out.
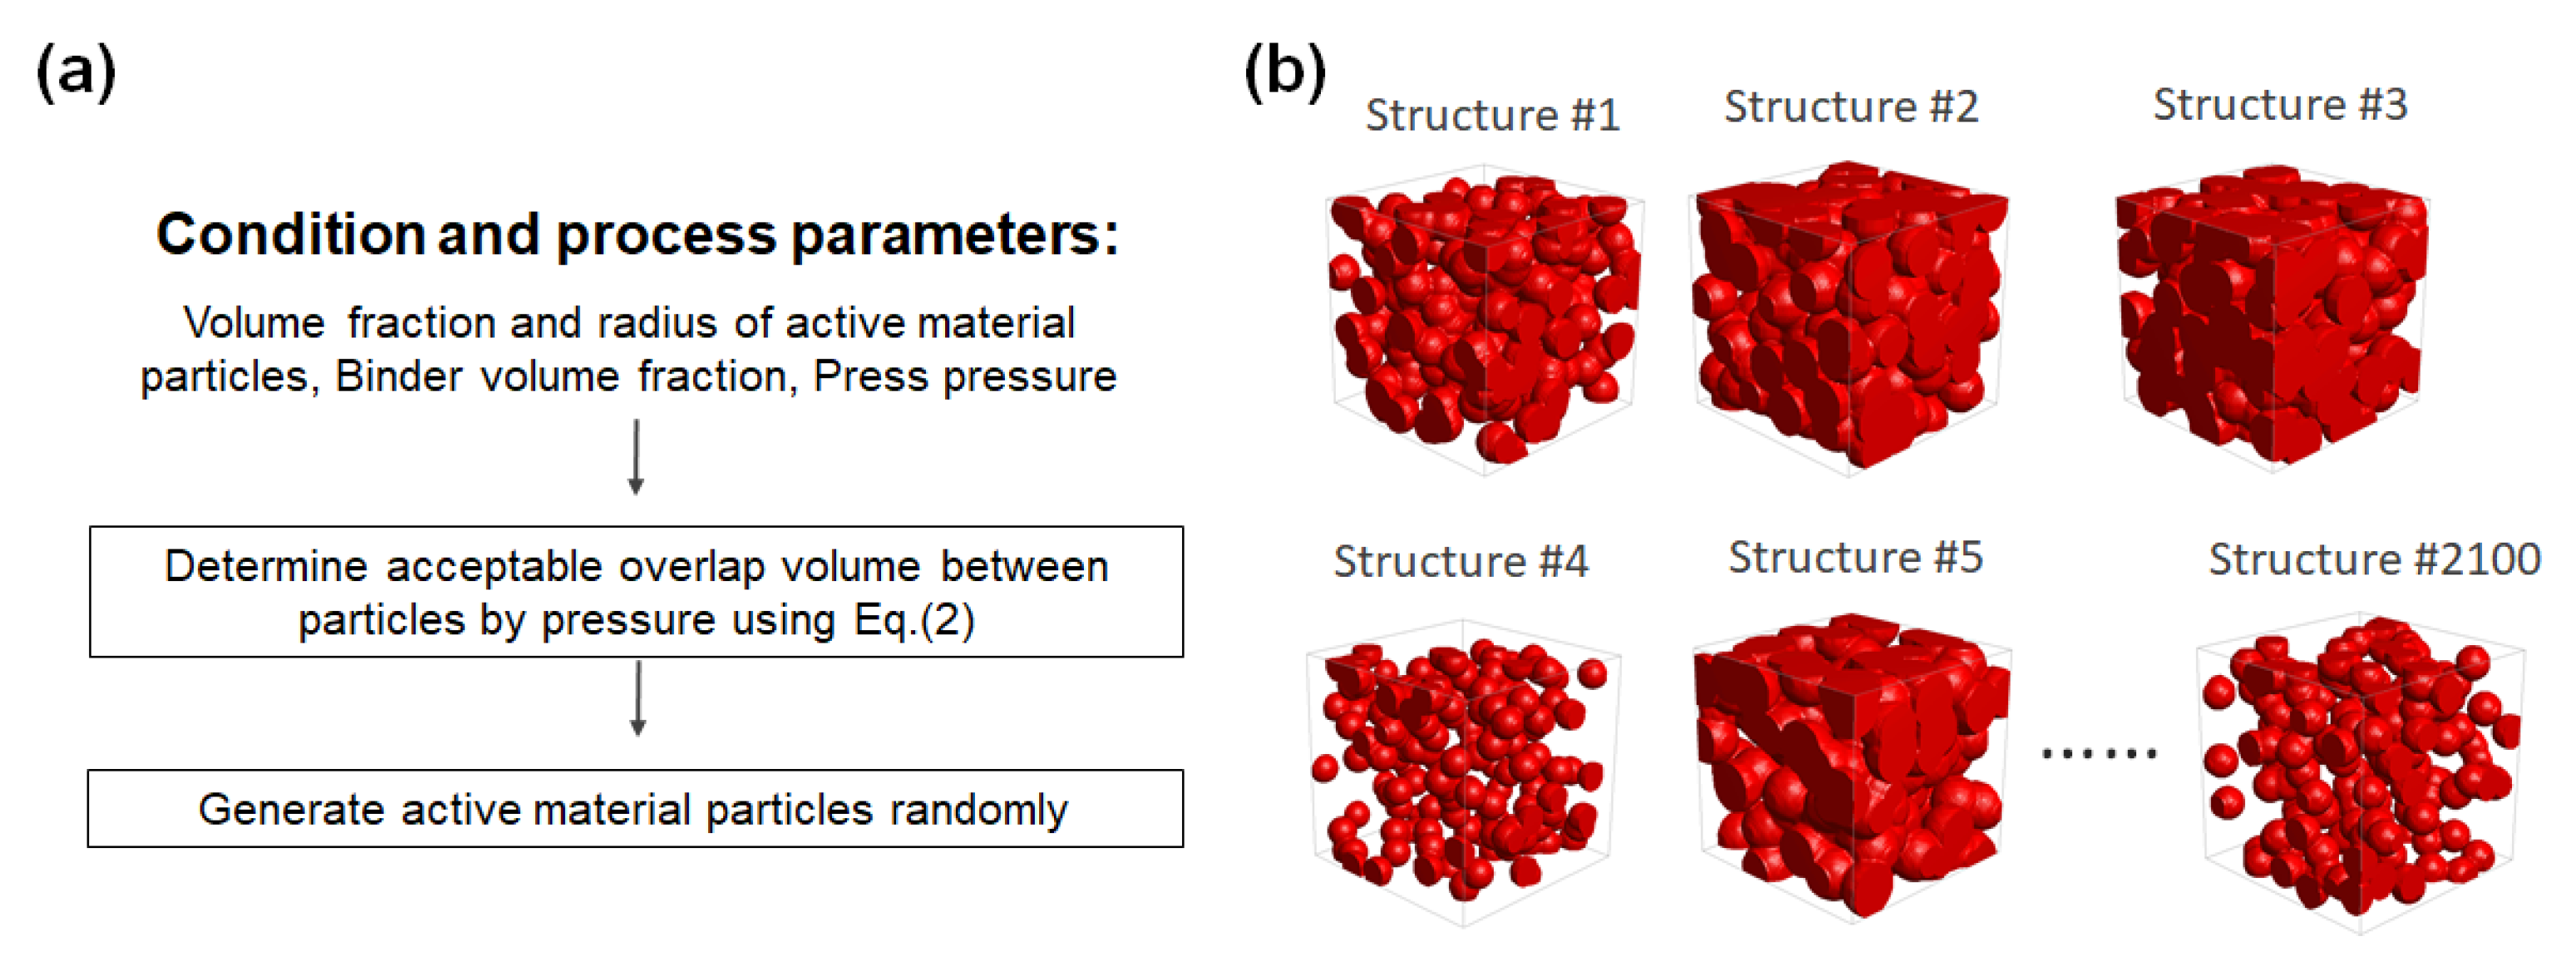
Figure 3 shows the sensitivities of the reaction resistance, the electrolyte resistance, and the Li diffusion resistance to the volume ratio of the active material with a total of 2100 simulation results. As the volume ratio increases, the reaction resistance decreases dramatically; as the effective surface area and the capacity itself increase. On the other hand, the electrolyte resistance increases with the volume ratio exponentially, since the electrolyte conductive region (i.e., the pore region) decreases with the volume fraction of the active material. The Li diffusion resistance is relatively low in all conditions of this study (except in the vicinity of zero volume fraction). Therefore, the total specific resistance, which is sum of these three specific resistances, has a minimum value to the volume ratio of the active material particles. Thus, there exists an optimum value of the volume ratio in the active material.
In the same manner, a sensitivity analysis has been performed on the active material particle size. As shown in
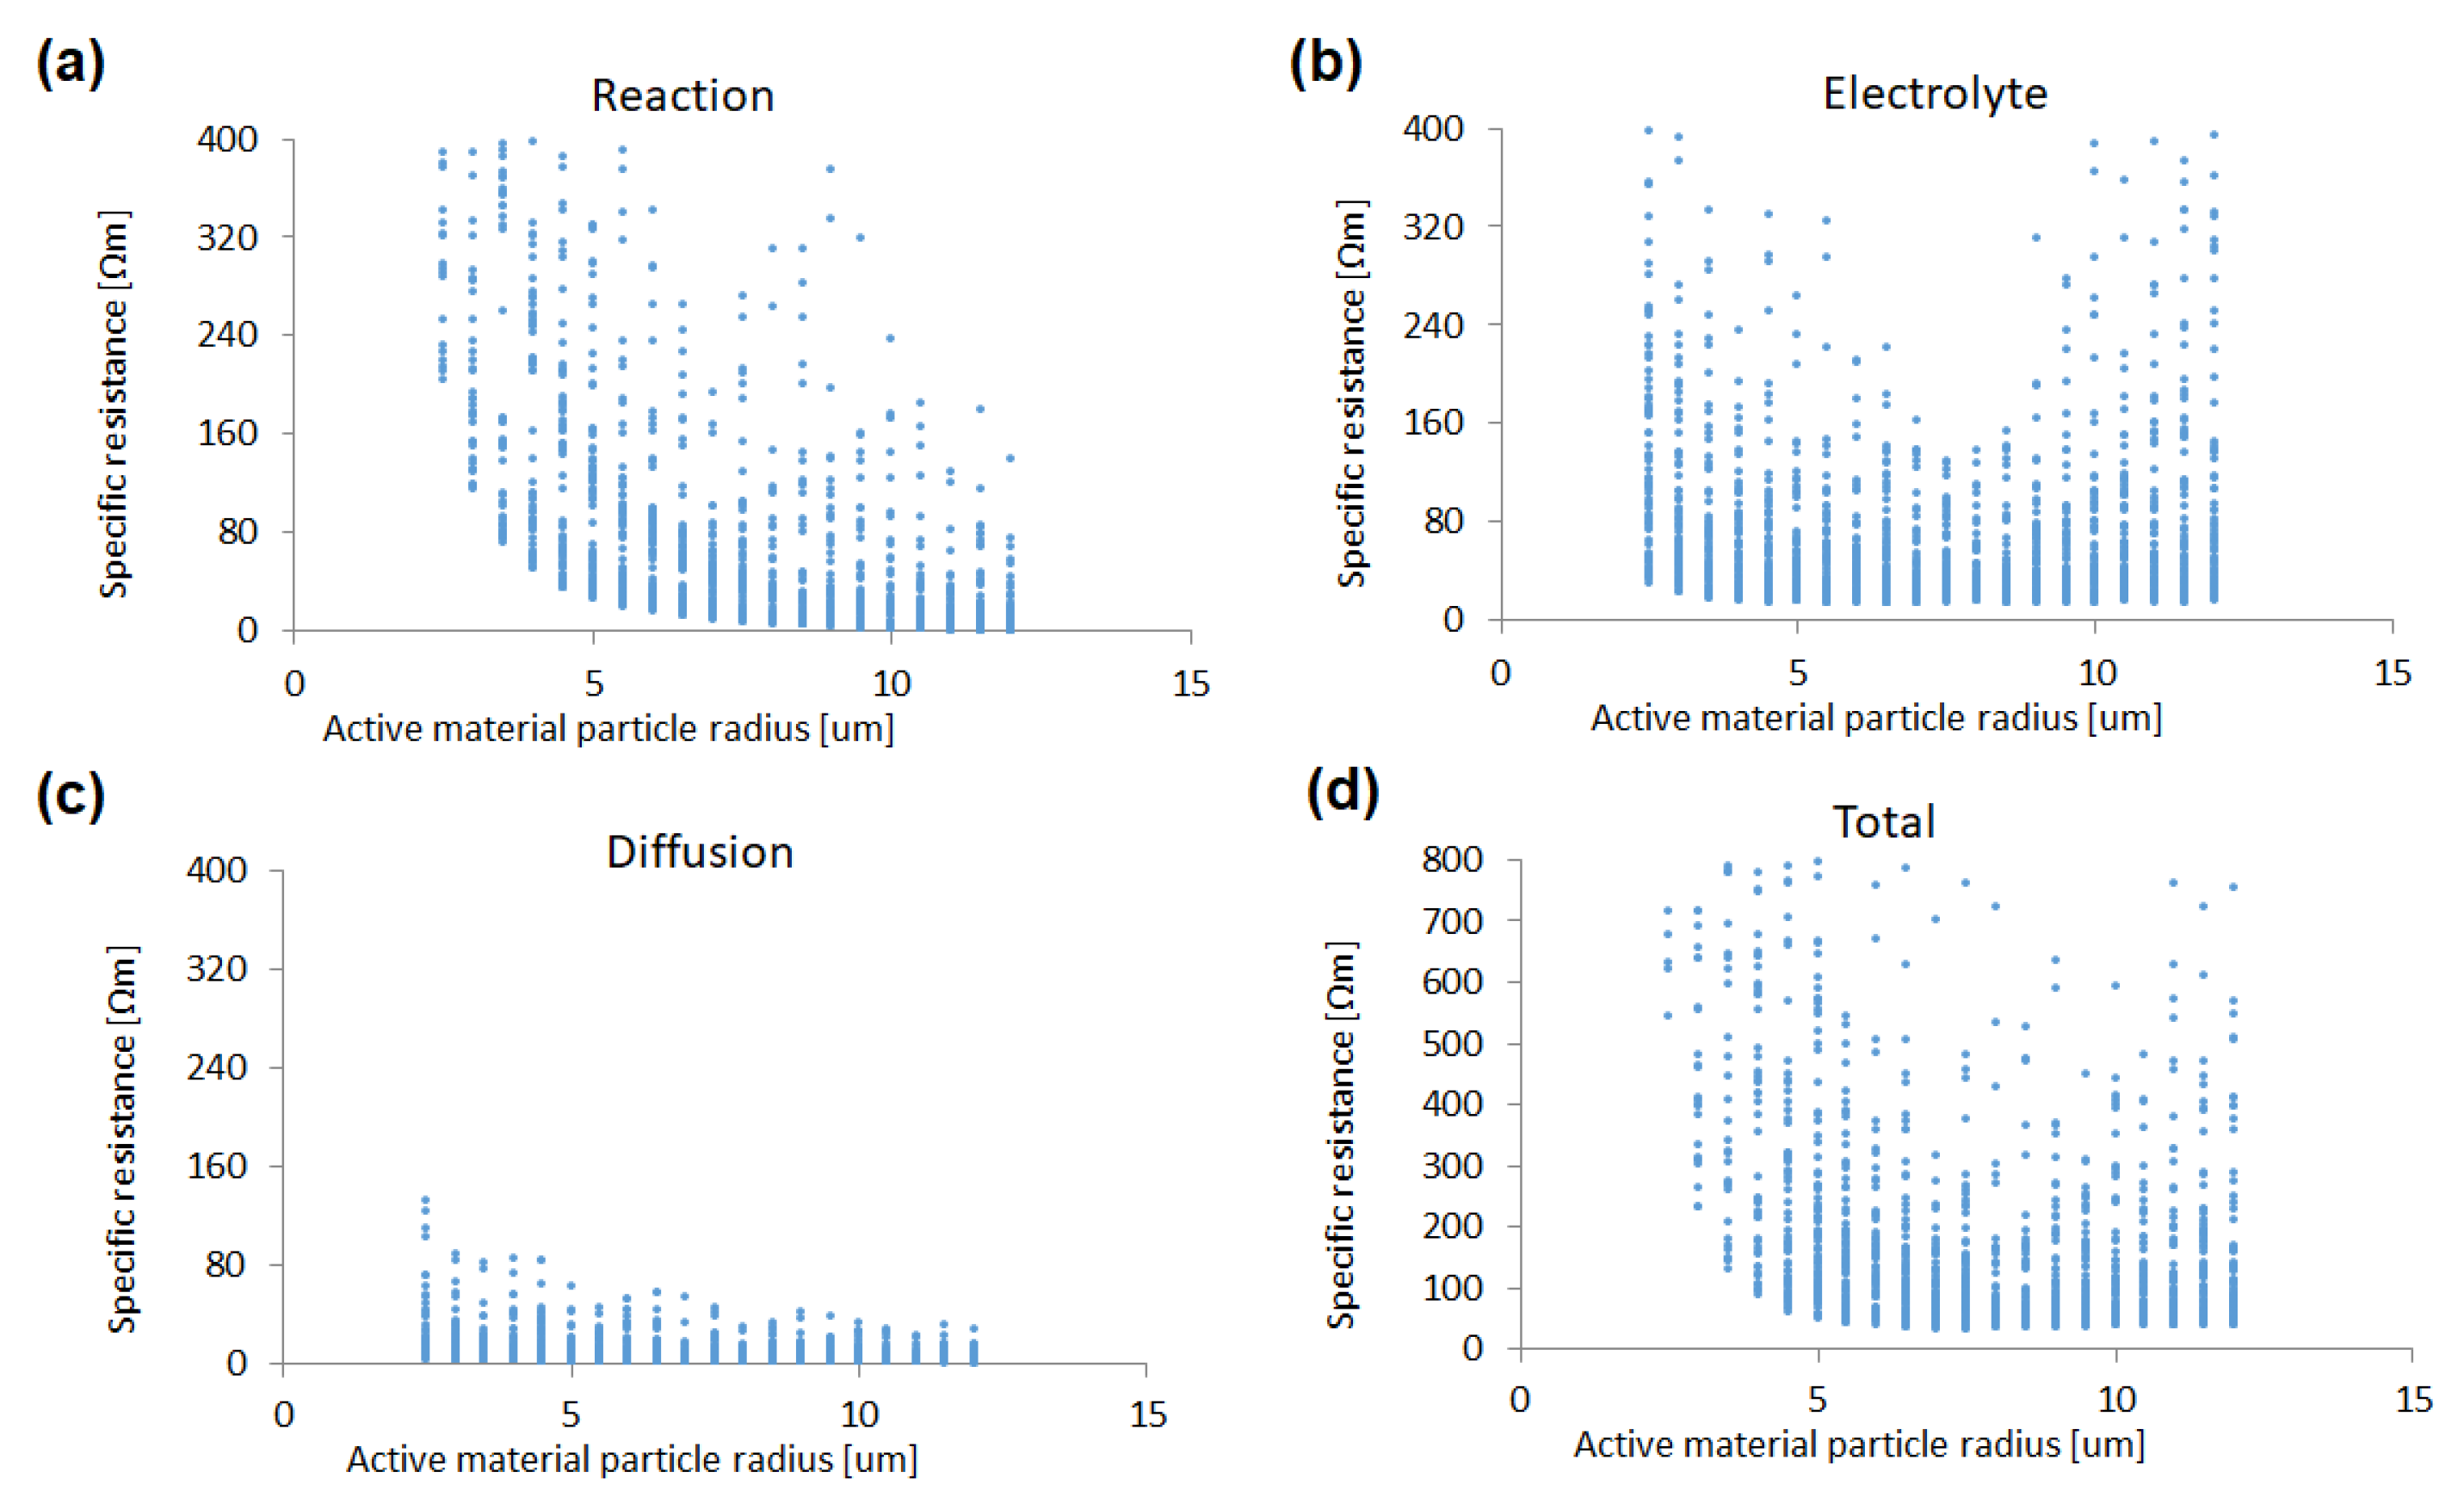
Figure 4, the reaction resistance decreases gradually as the particle size increases. This result is unexpected, as larger particles have smaller surface area and the reaction resistance should increase as the particle size increases. The reason for this is that systems composed of smaller particles have a larger number of particles and binder/additives to connect between particles; therefore, the effective surface area of the active material particles in the system decreases. Similarly, the electrolyte resistance has higher values in the region with particle size less than 4 µm. In this region, the effective electrolyte conductivity decreases, as the pore space is occupied by binder/additives according to Equation (2). As a result, smaller particles are not always as effective in decreasing the reaction resistance in this study. On the other hand, the diffusion resistance is relatively small, compared to the other specific resistances in each particle size. Therefore, the total specific resistance also has a minimum value with respect to the active material particle size. In other words, there exists an optimum value of the particle size, as well as of the volume ratio, in, the active material.
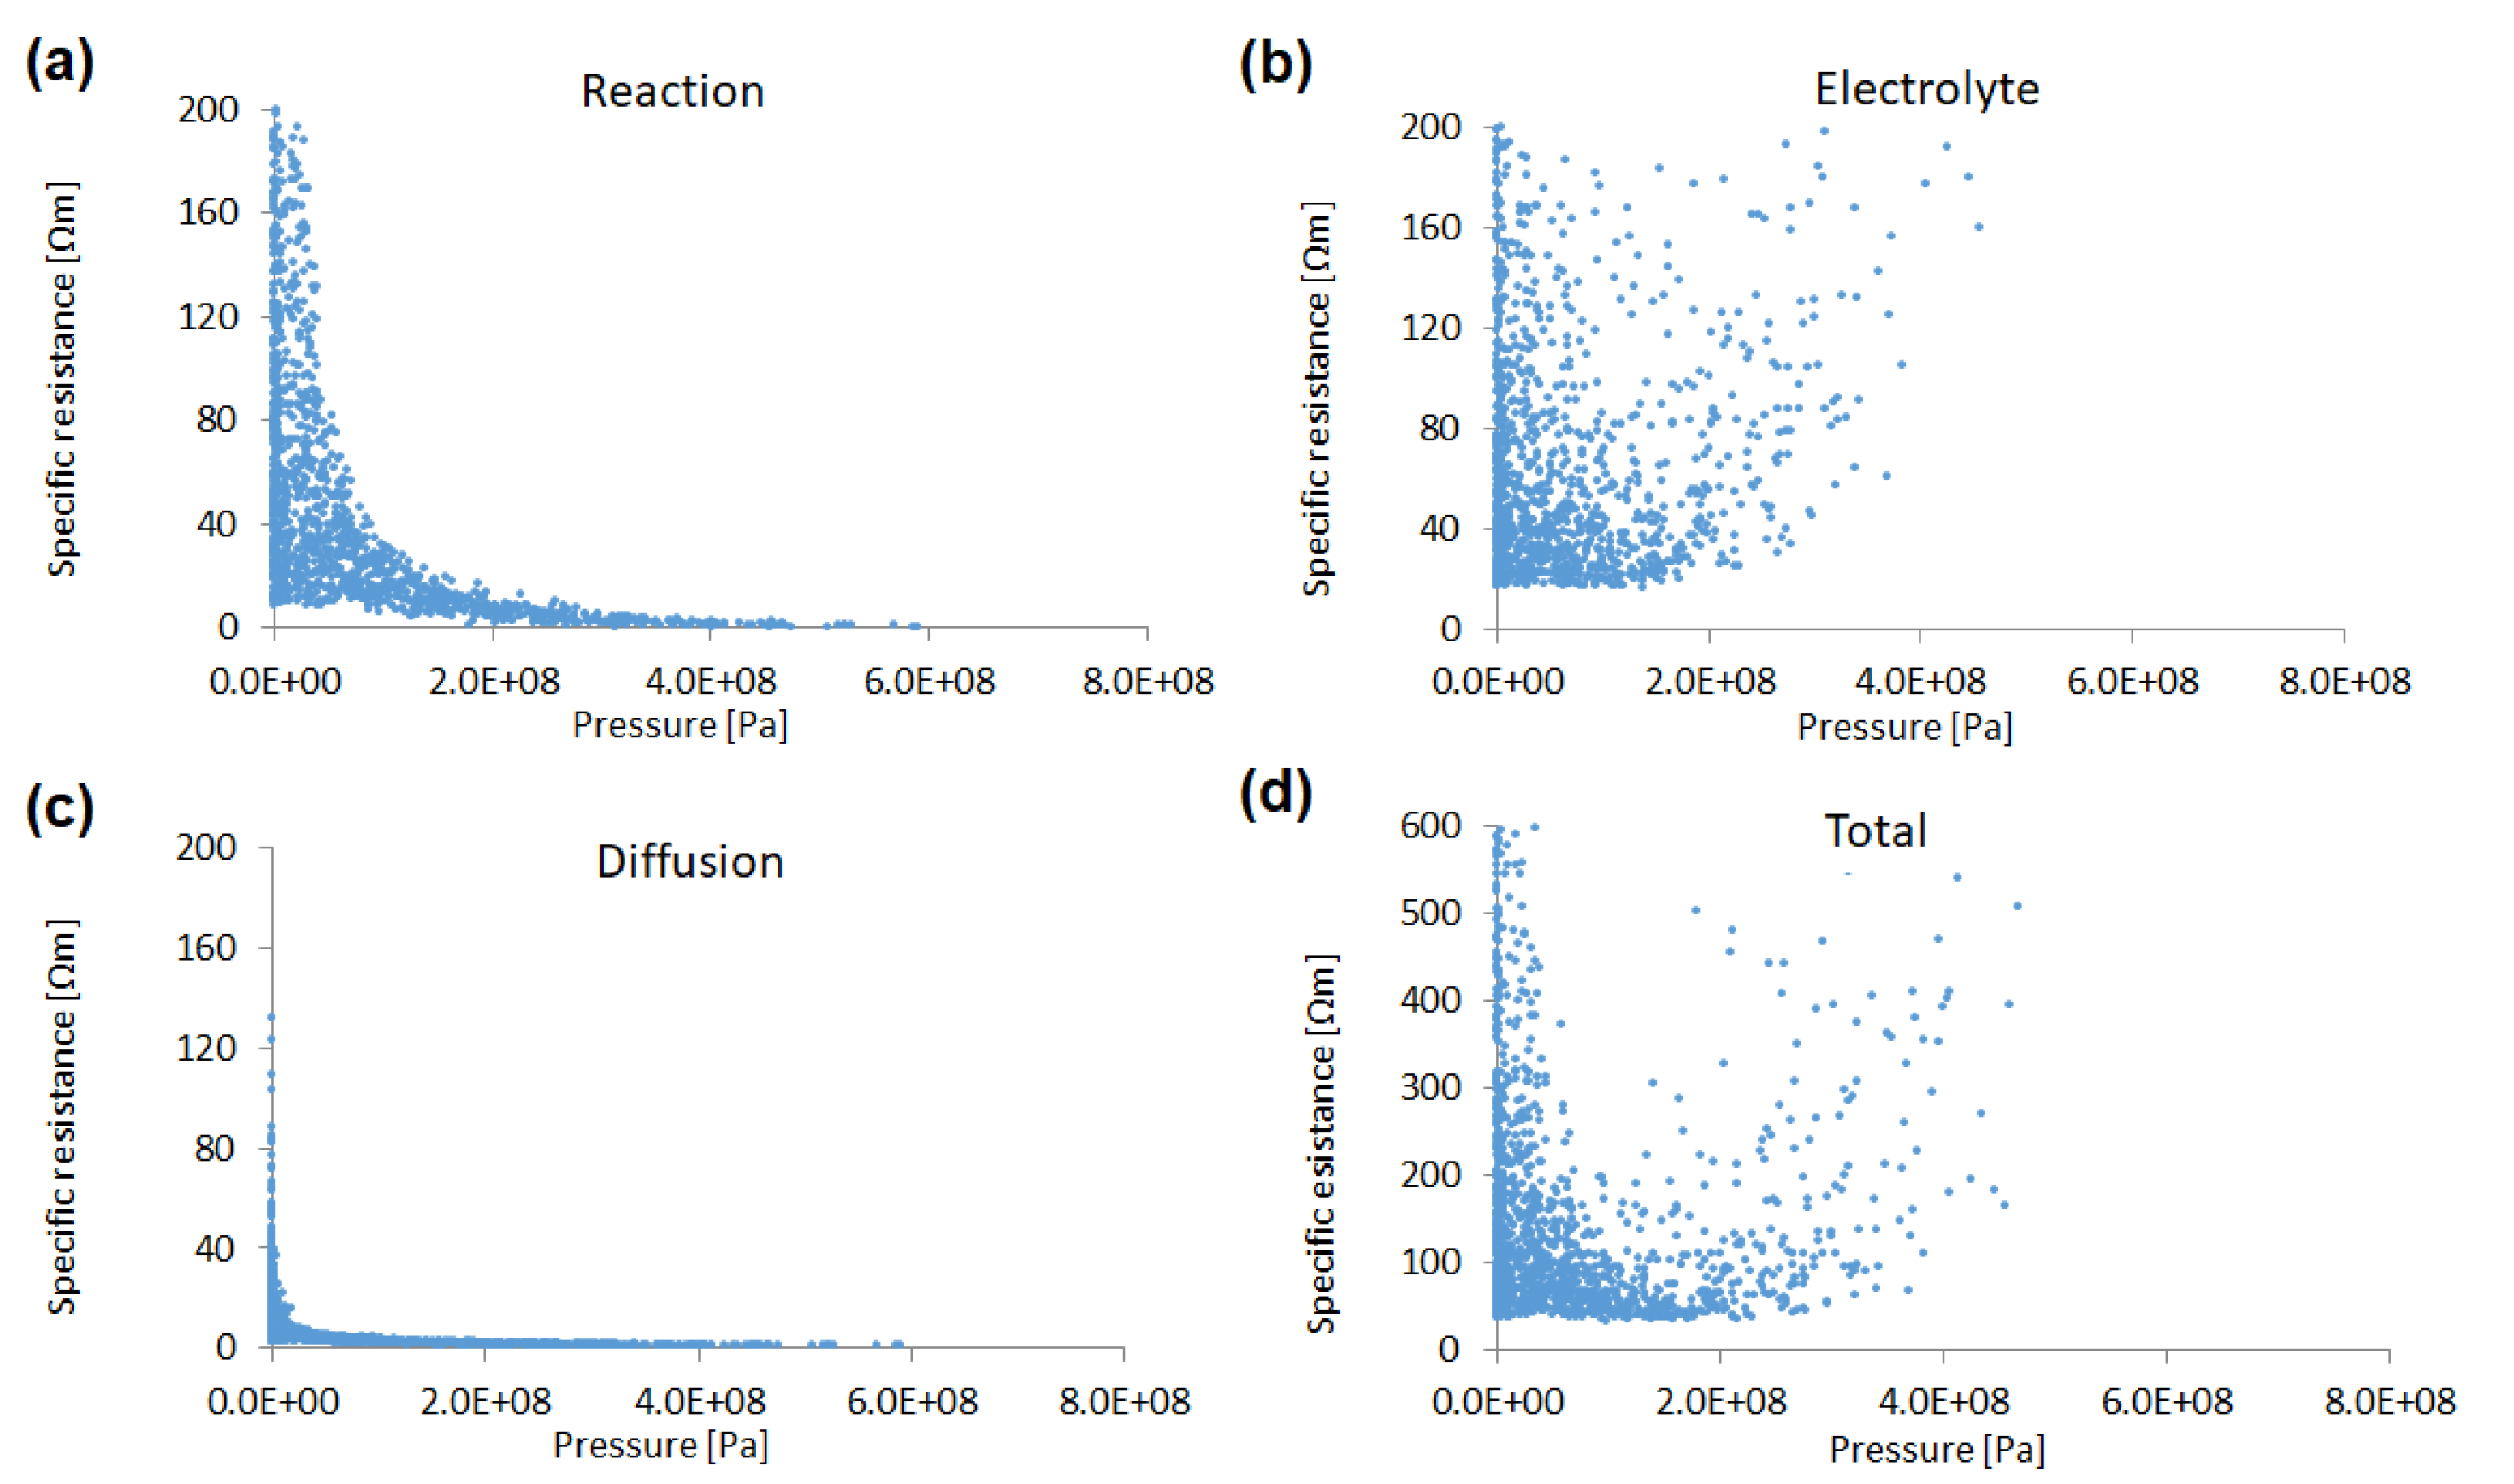
Figure 5 shows the sensitivity of each specific resistance to the pressure in the compaction process. The reaction resistance decreases exponentially as the pressure increases. This results from the fact that under conditions of higher pressure (i.e., larger overlap width), the volume fraction of the active material increases and, thus, the total surface area also increases. On the other hand, the electrolyte resistance increases in the system with a higher volume fraction in the active material (i.e., lower volume fraction of pore). The diffusion resistance is relatively small, compared to the other specific resistances in each particle size in this study.
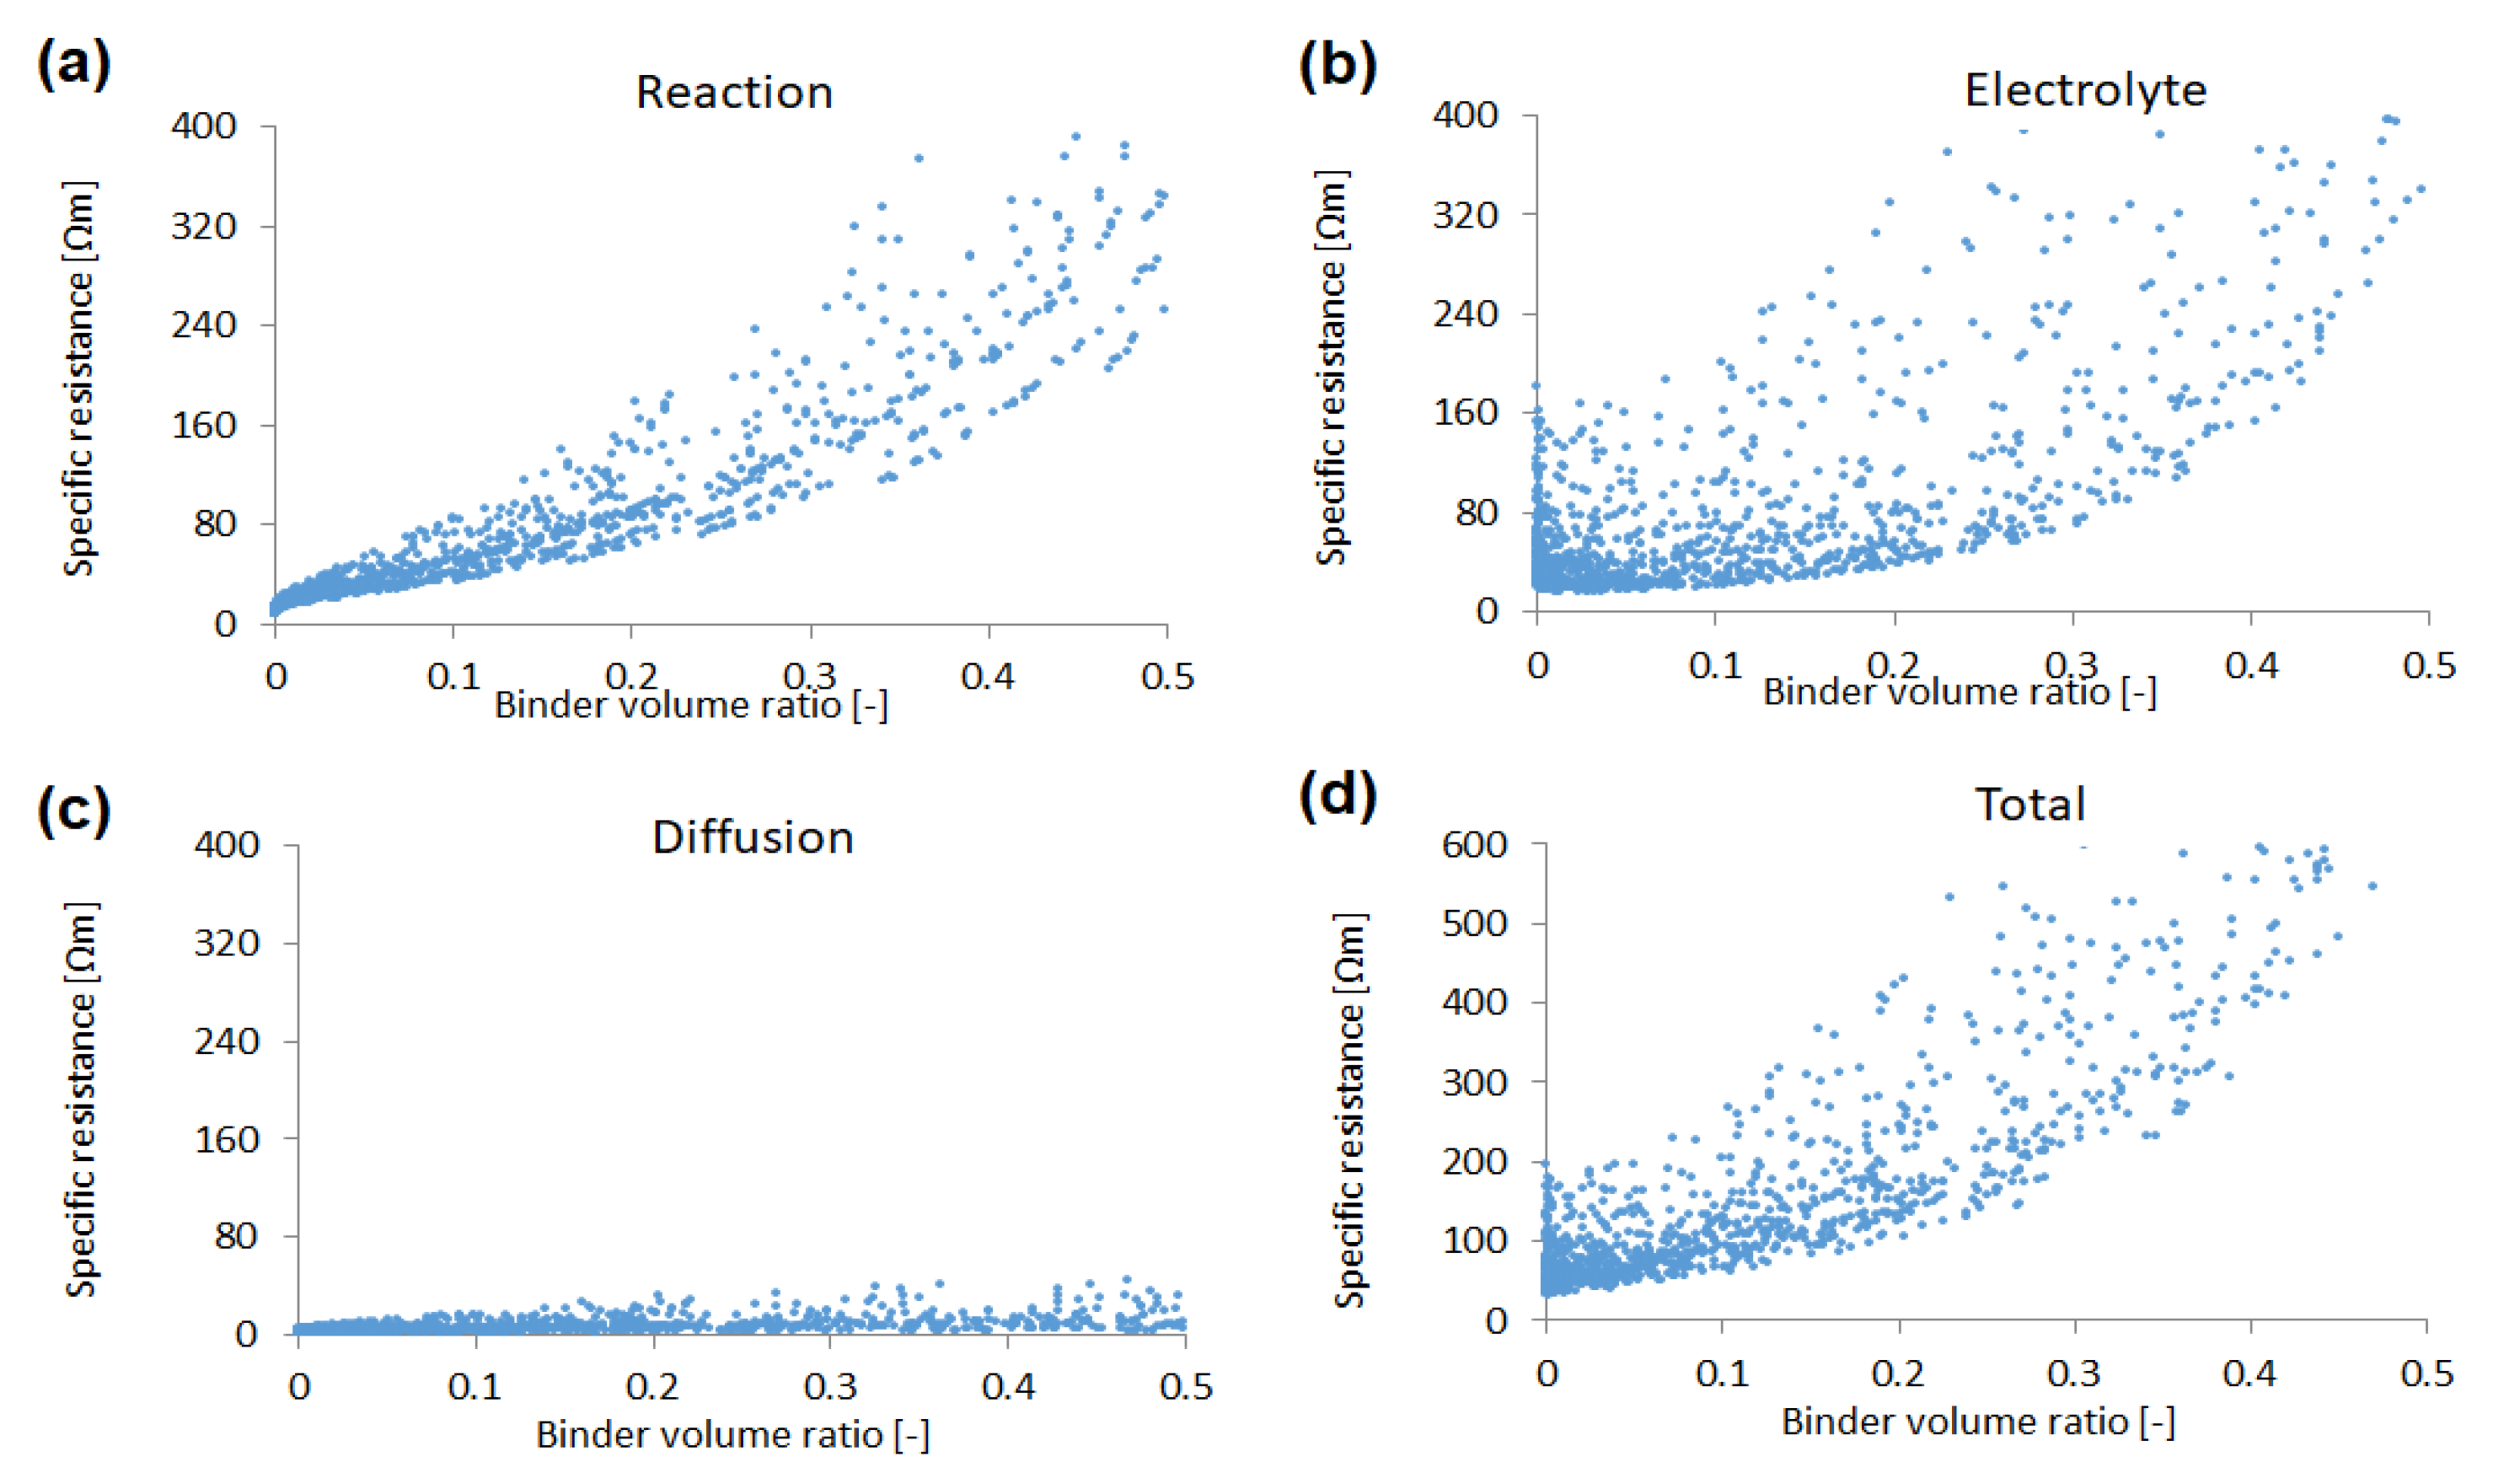
The binder/additives volume sensitivity of each specific resistance is illustrated in
Figure 6. The reaction resistance increases linearly, since the total surface area decreases with the ratio. Similarly, an approximately linear dependency of the binder/additives volume ratio is observed in the electrolyte resistance and the total specific resistance.
3.2. Neural Network Regression
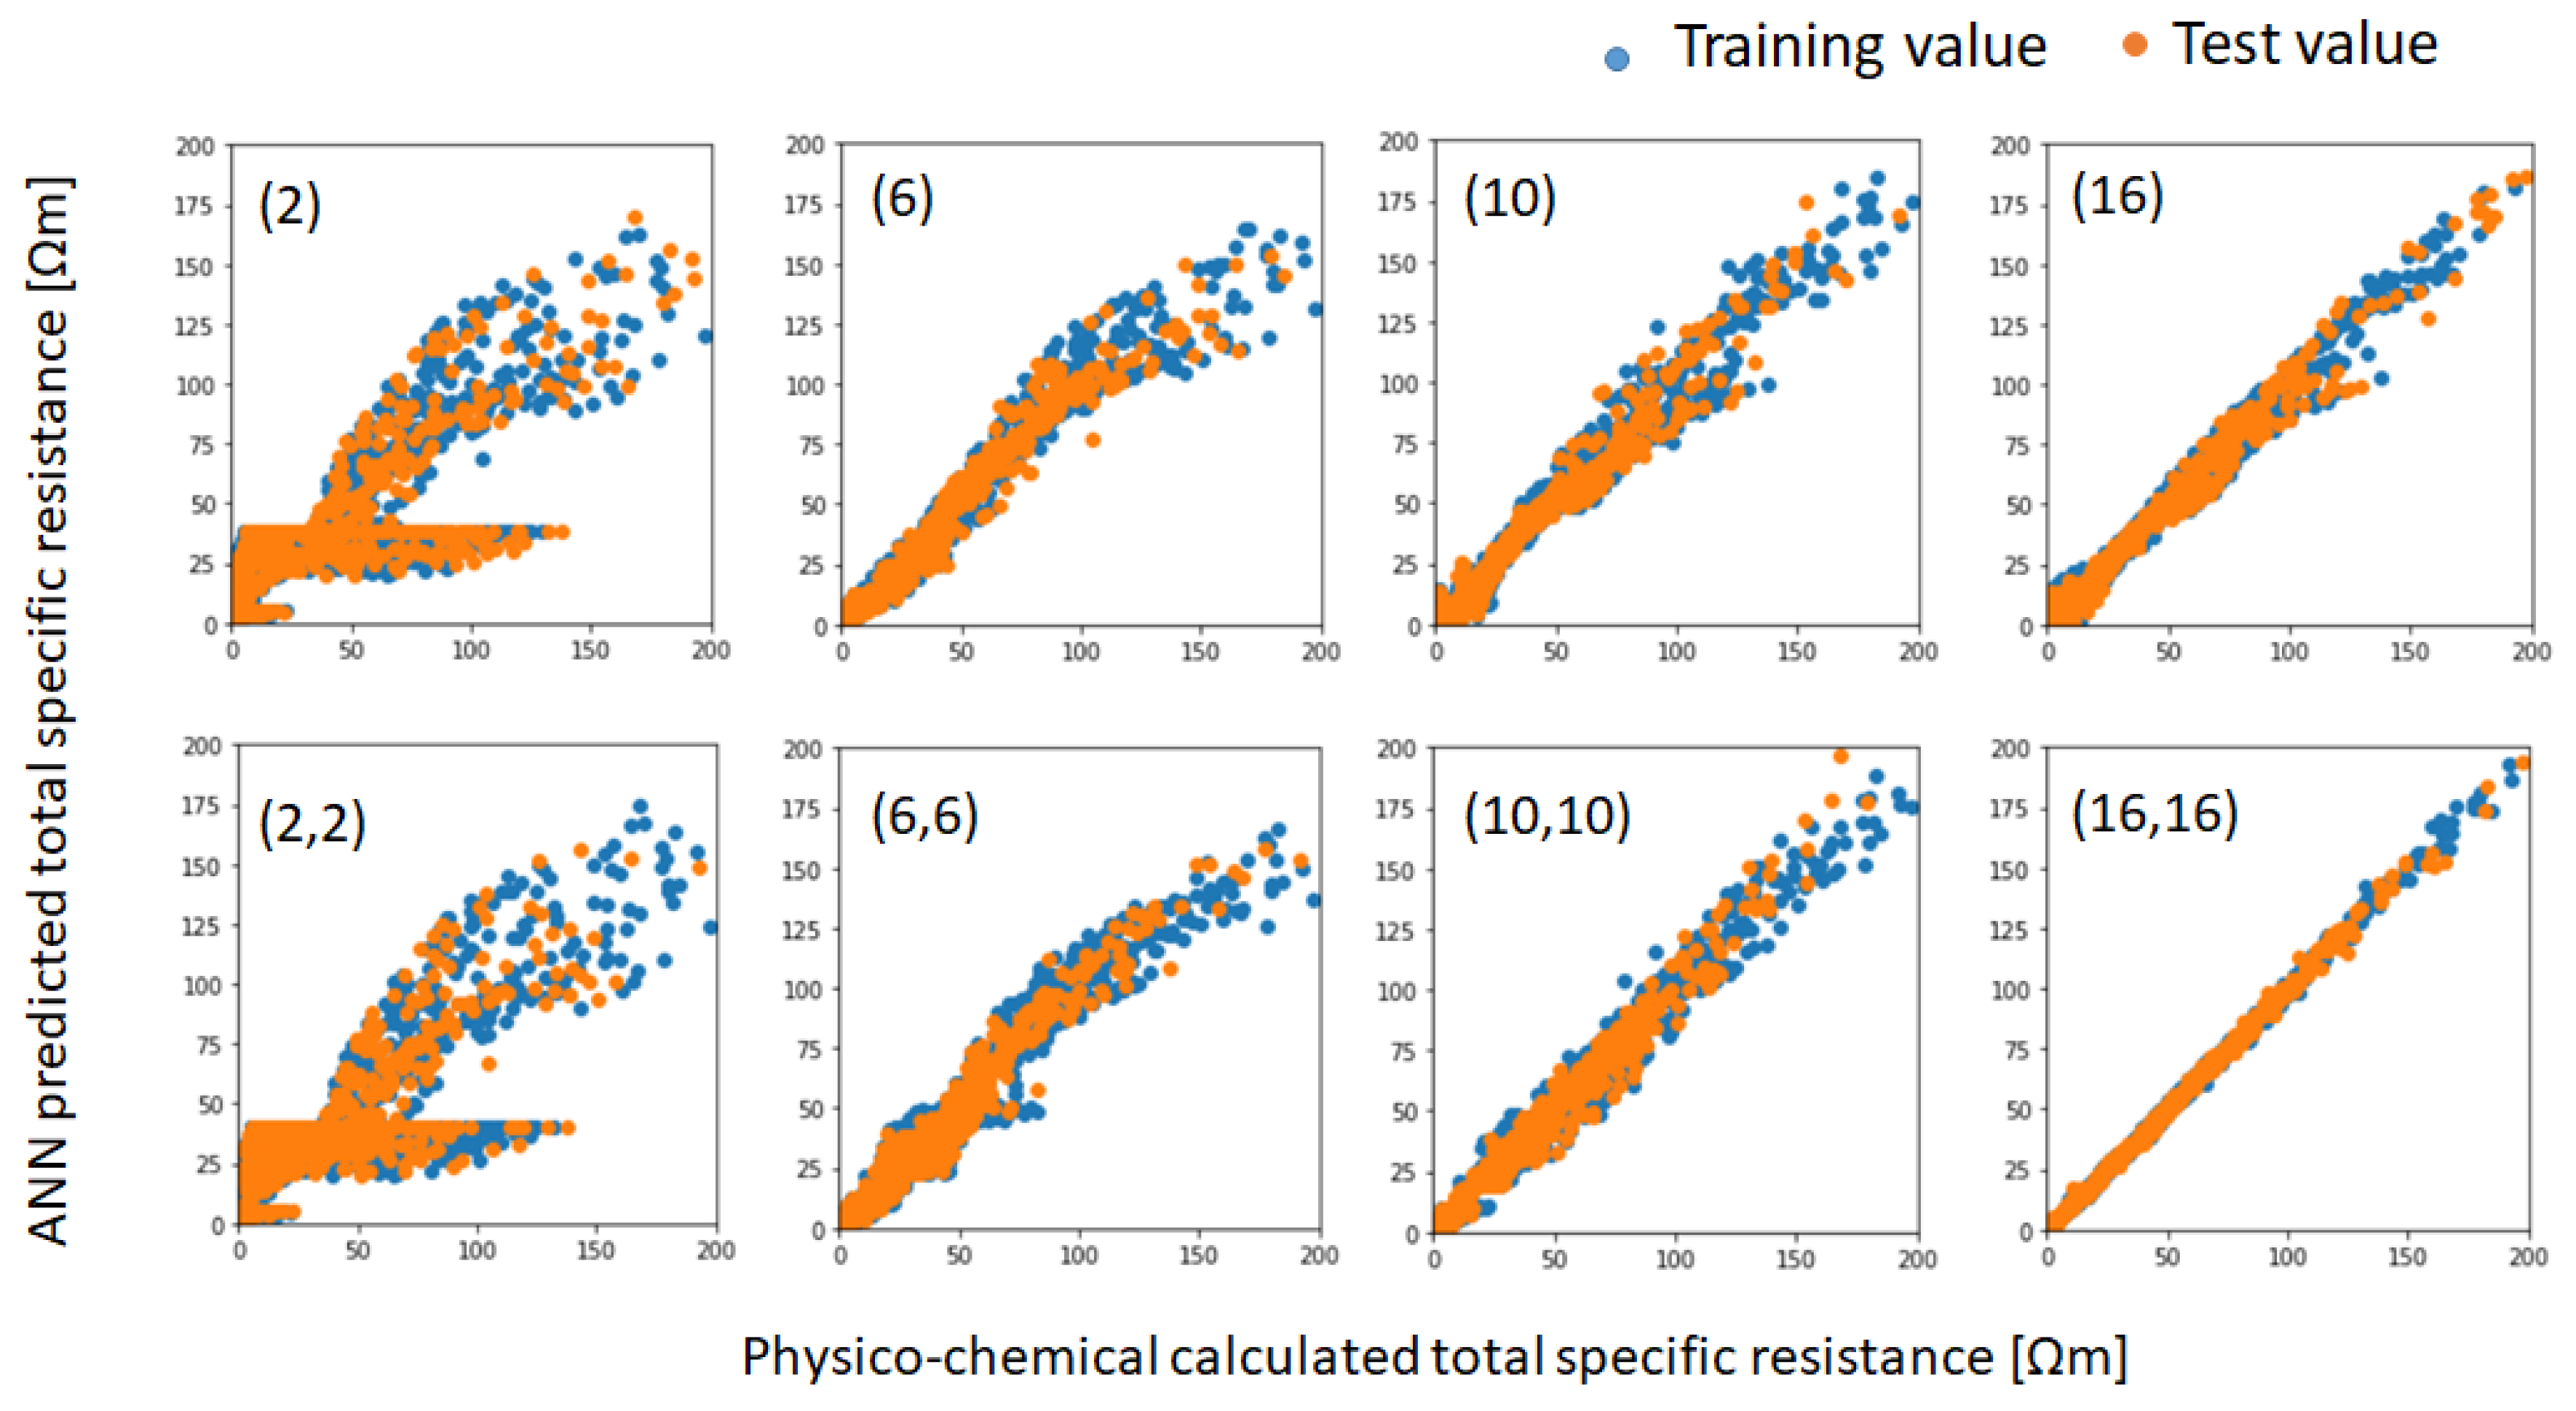
Various ANNs with different hyperparameters, including number of neurons and hidden layers, were compared, in order to determine the network configuration. The correlation coefficients,
R2, for the validation data are listed in
Table 4. The
R2 values for ANNs that consist of two hidden layers are higher than the ones that consist of a single layer. The values saturate around 16 neurons.
Figure 7 shows the scatter plots of both training and test data, with the specific resistances calculated by the simplified physico-chemical models and the values predicted by various ANN models. As can be seen in this figure, the accuracy of prediction improves with the number of neurons and hidden layers. Although the ANN model, which consists of two hidden layers with 16 neurons (indicated as 16, 16), predicts both the training and test data of the specific resistances accurately, this model was not suitable for the inverse problem by Bayesian optimization, due to its instability. Therefore, we adopted the ANN model (10, 10) for both the forward and inverse problems in this study.
It is useful to evaluate the effect of each design parameter (e.g., the volume ratio of the active material particles, radius of the active material particles, pressure in the compaction process, and volume ratio of binder/additives) on the total specific resistance, as a guiding principle for manufacturing battery electrodes. One of the simplest approaches for this purpose is to evaluate the weight coefficients of the neurons on the first hidden layer of the ANN [
29]. Here, we evaluate the summation of the weight coefficient magnitudes
|w| of the first layer neurons for each input process parameter, as shown in
Figure 8. The graph shows that volume ratio of the active material particles has the largest impact on the total specific resistance, although the effects of pressure and particle radius are relatively small. Note that these impact evaluations assume the physical parameters listed in
Table 2. In other words, these values may change under other conditions.
3.3. Process Parameters Optimized by Bayesian Optimization
Optimized process parameters have been inferred from the total specific resistance by using Bayesian optimization with the constructed ANN model. As described in
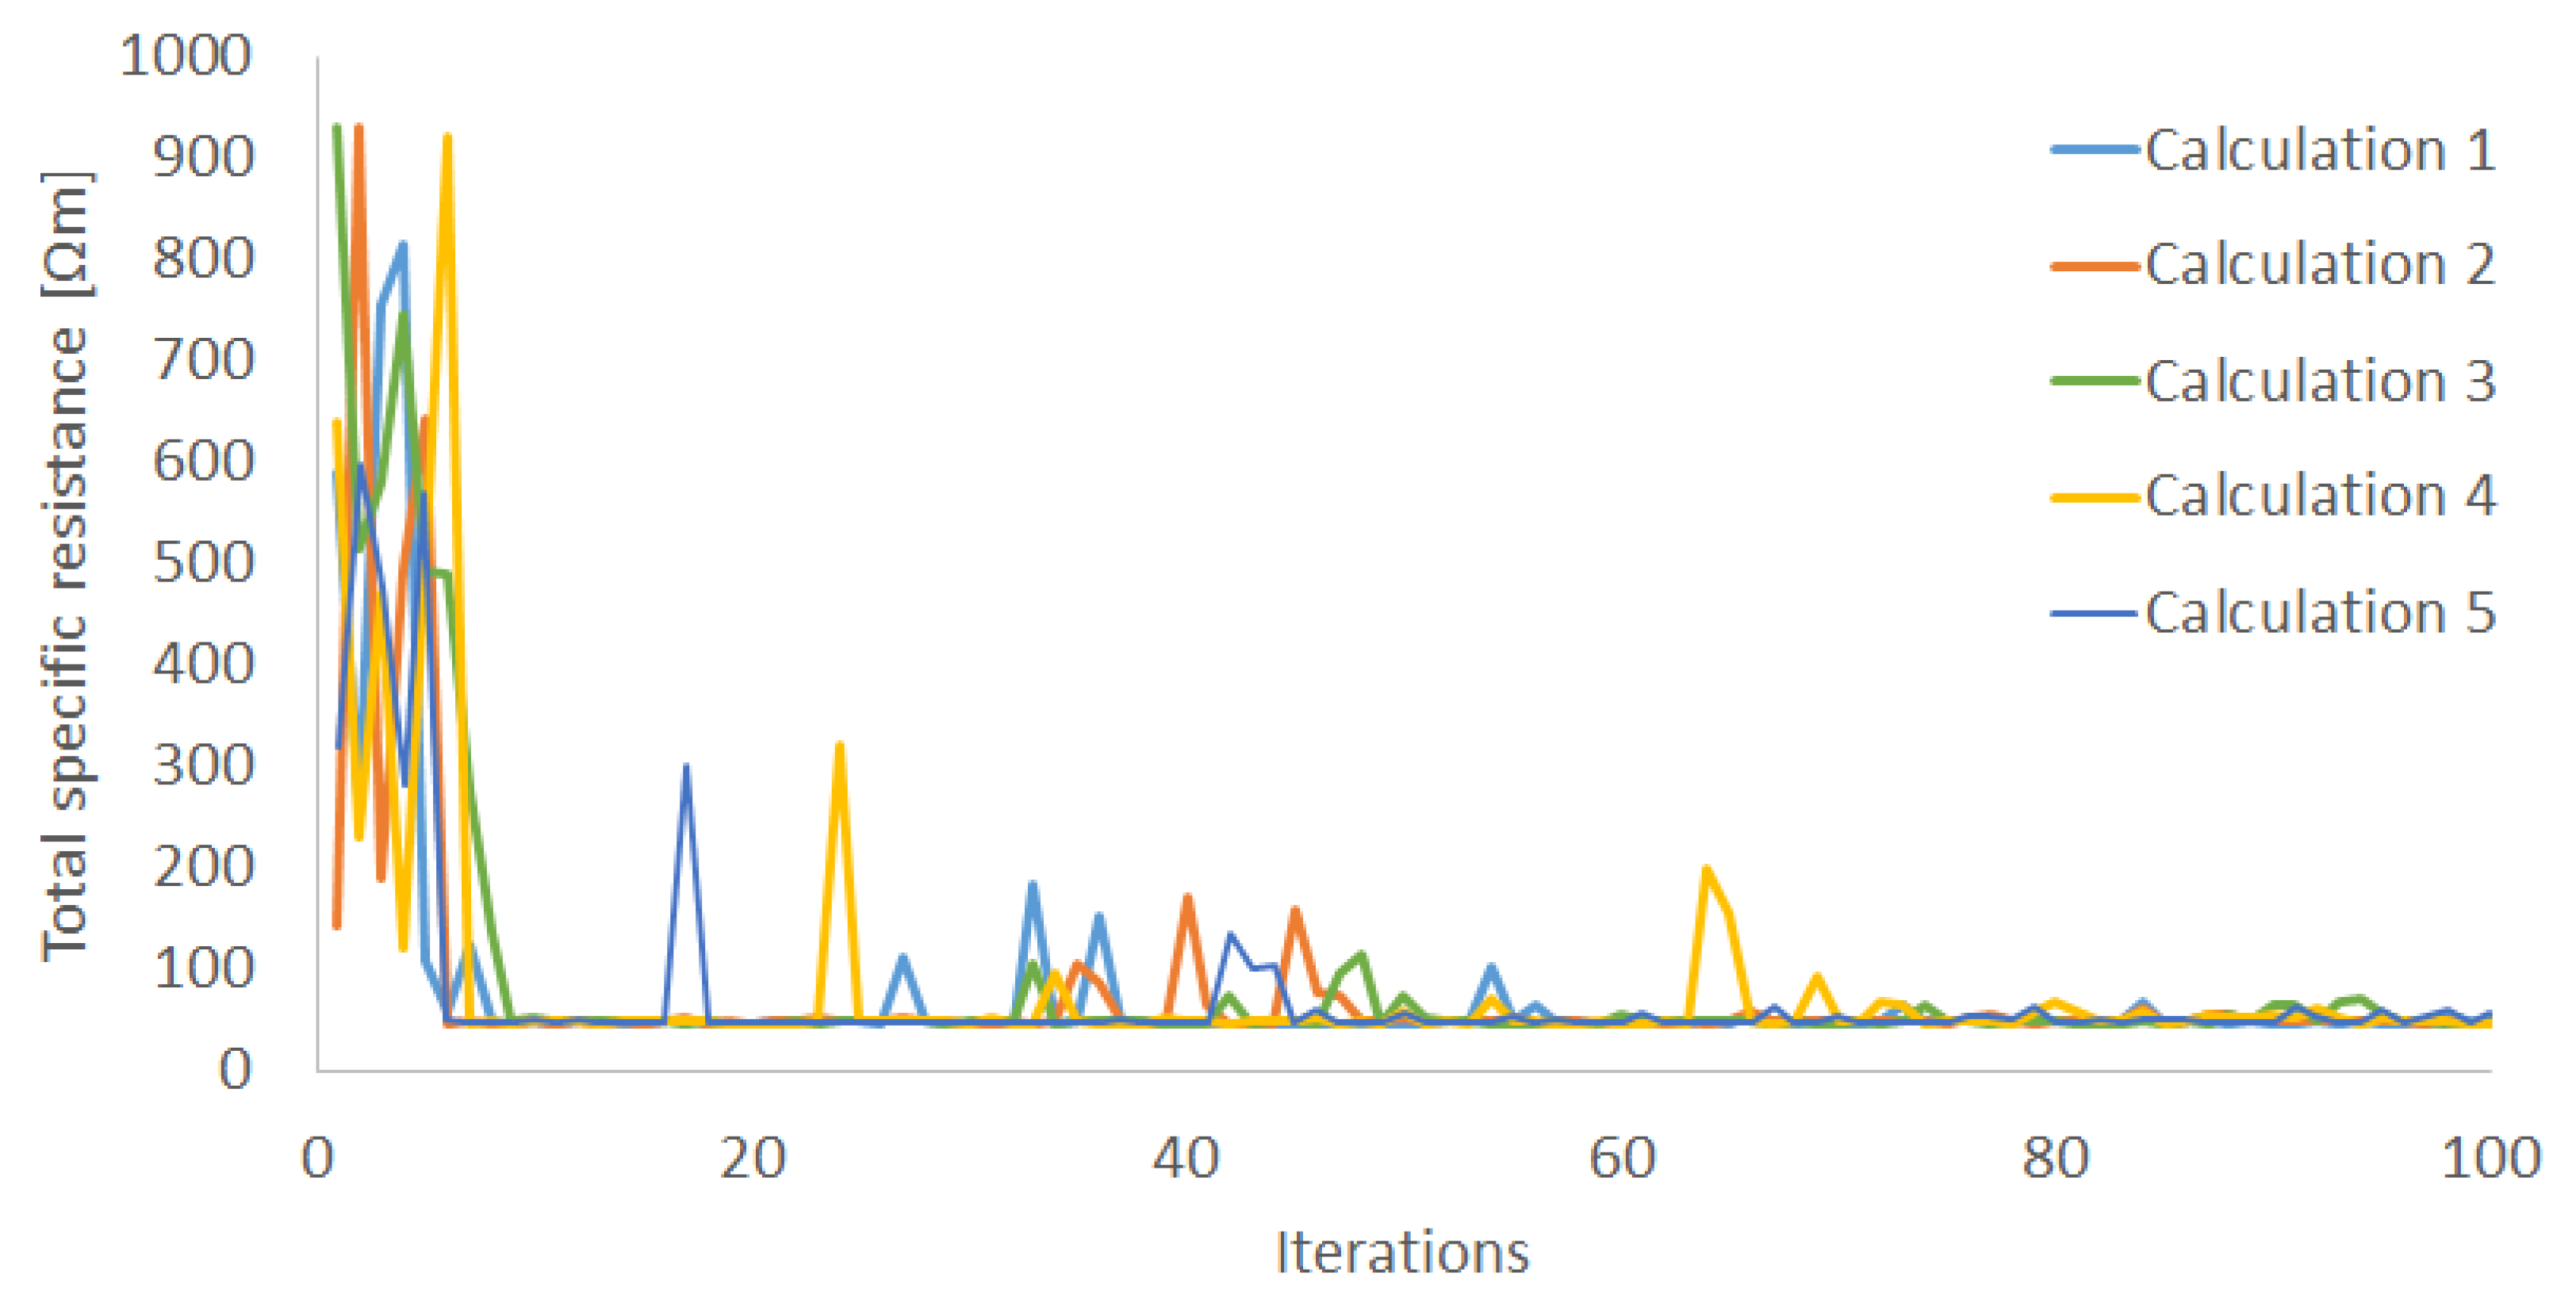
Section 3.2, we adopted the ANN model (10, 10) for the inverse problem, which is not the best configuration for the forward problem, due to its calculation stability. In order to validate the optimization, five calculations were performed with different initial conditions.
Figure 9 indicates the convergence plot of each initial condition with optimization. Each calculation almost converges within 100 iterations, to around 47 Ω·m.
The optimized process parameters for the total specific resistance are shown in
Table 5. The results suggest that the active material, composed of small size particles, should be packed at near 50% with a small number of binder/additives. The highest ionic conductivity in the range of this study is suggested, as the higher the ionic conductivity of an electrolyte is, the more the total specific resistance of the electrode decreases. The proposed compaction pressure of 459 MPa is within the typical range in the actual process [
30]. Note, however, that the negative effects of applying pressure are not taken into account in this model, such as damage to the foil and active materials.
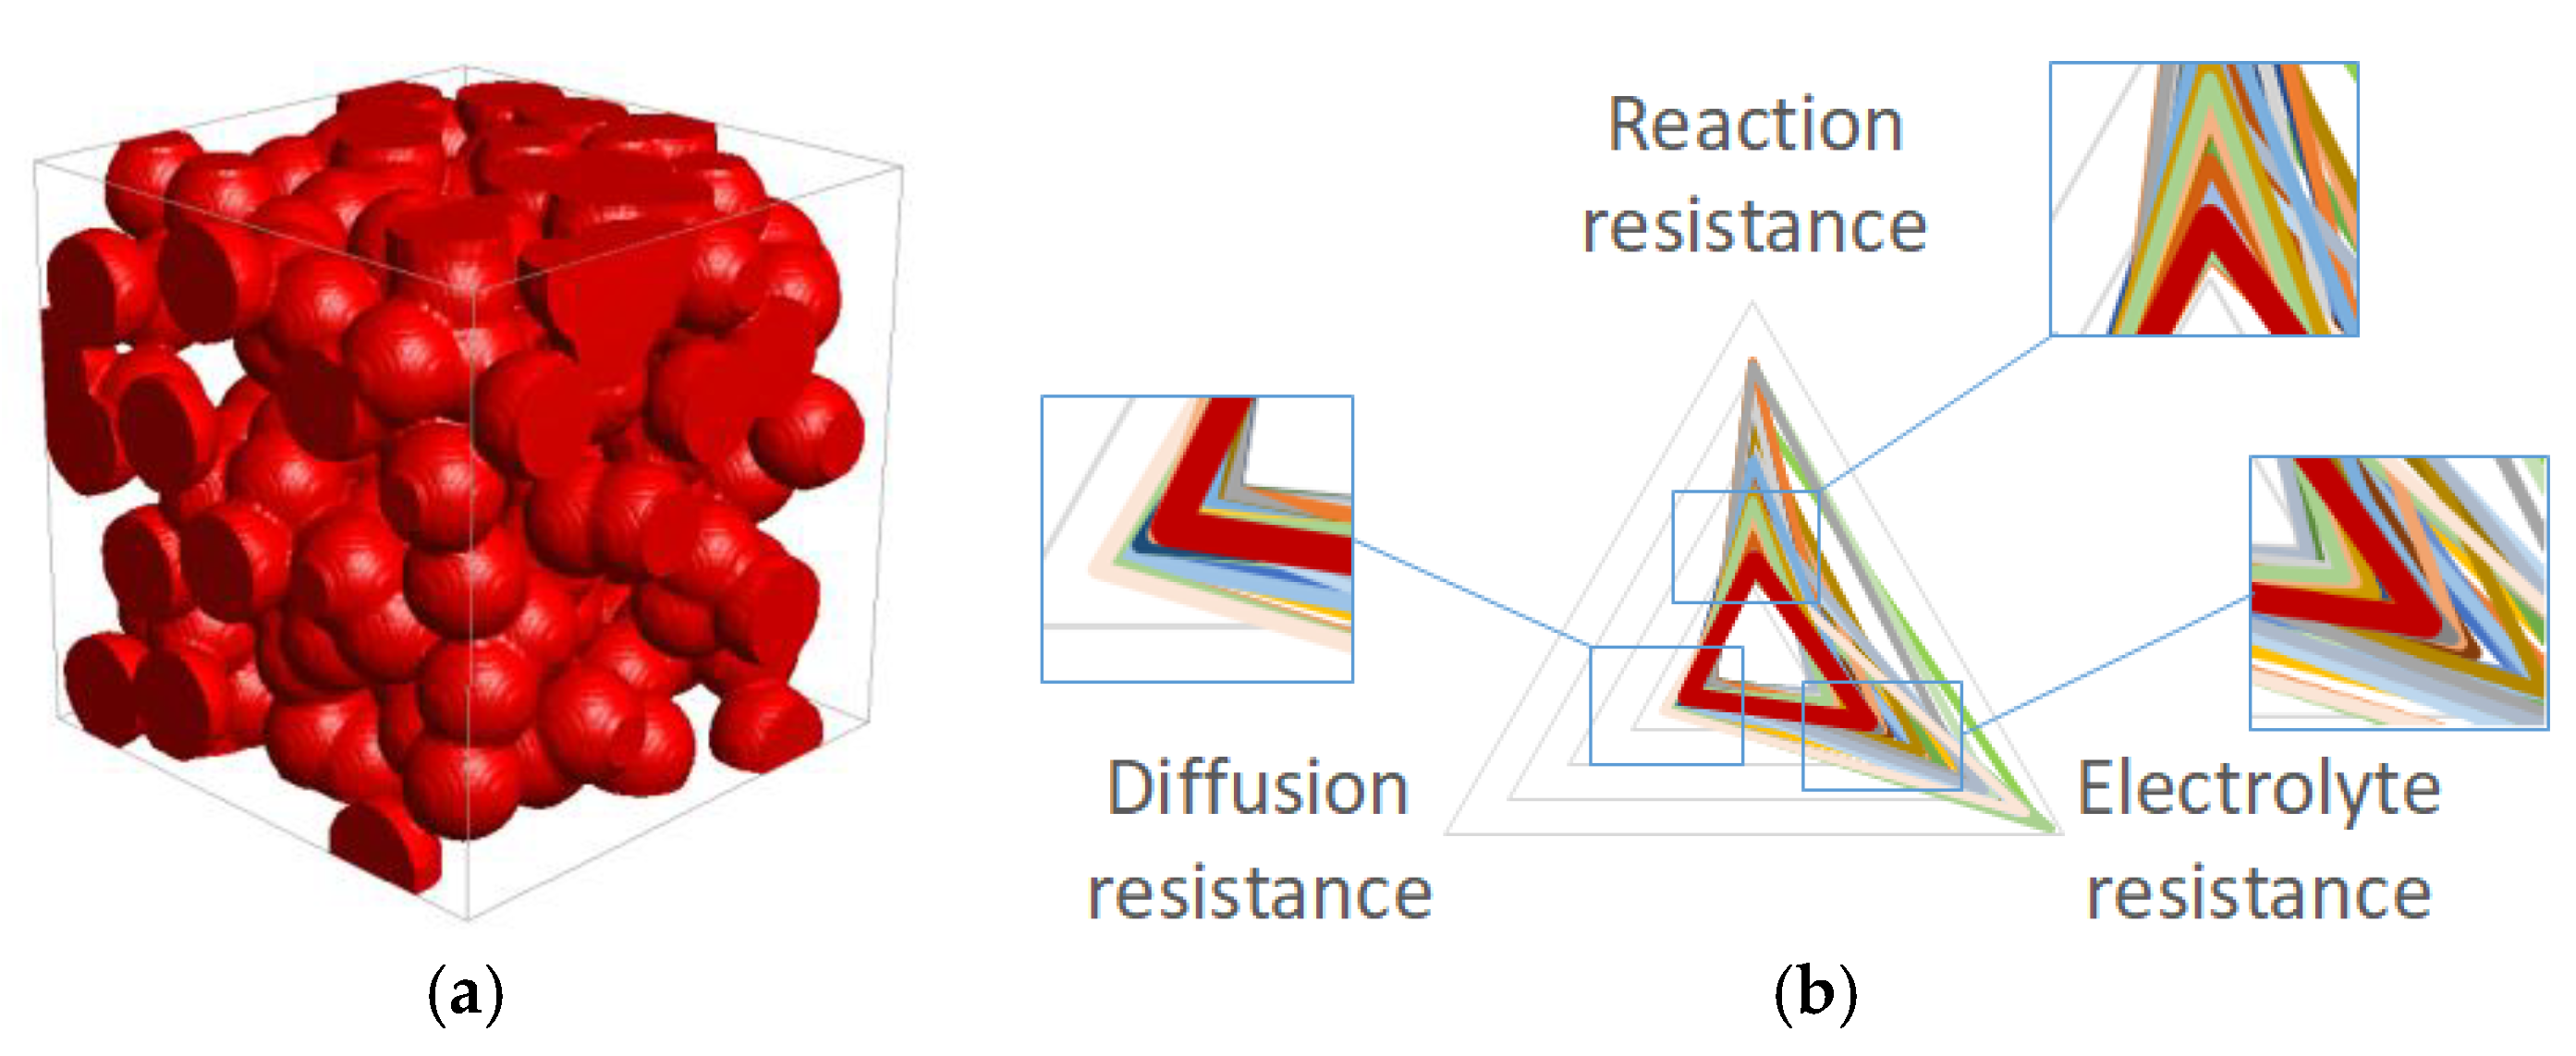
Figure 10a shows the packing structure of the active material particles in the condition of the optimized process parameters. A radar chart of each normalized specific resistance in the various process parameters is shown in
Figure 10b. The red triangle indicates the optimized (i.e., smallest total specific resistance) parameter set, and the other colors indicate other combinations. Each optimized value is within the range of the minimum and maximum values, and therefore the values are considered to be reliable. Note that the reaction resistance in the optimized parameters is smaller than the values in other parameters, although the diffusion and the electrolyte resistance are not the smallest in the optimized process parameters.
Some limitations should be noted. First, these optimized parameters depend strongly on the assumed physical parameters, including the diffusion coefficient in the active material, the exchange current density, and so on. Nevertheless, we believe that the proposed scheme for the prediction of the electrode specific resistance and optimization is also useful with various physical parameters. Next, the model needs validation, including a comparison to some experimental results; although the simulation model is based on typical reaction/diffusion equations. Finally, we adopted the ANN model (10, 10), which is not the best configuration for the forward problem, due to the calculation stability (as described in
Section 3.2). These limitations will be overcome in future work.
3.4. Optimized Process Parameters in Higher Capacity
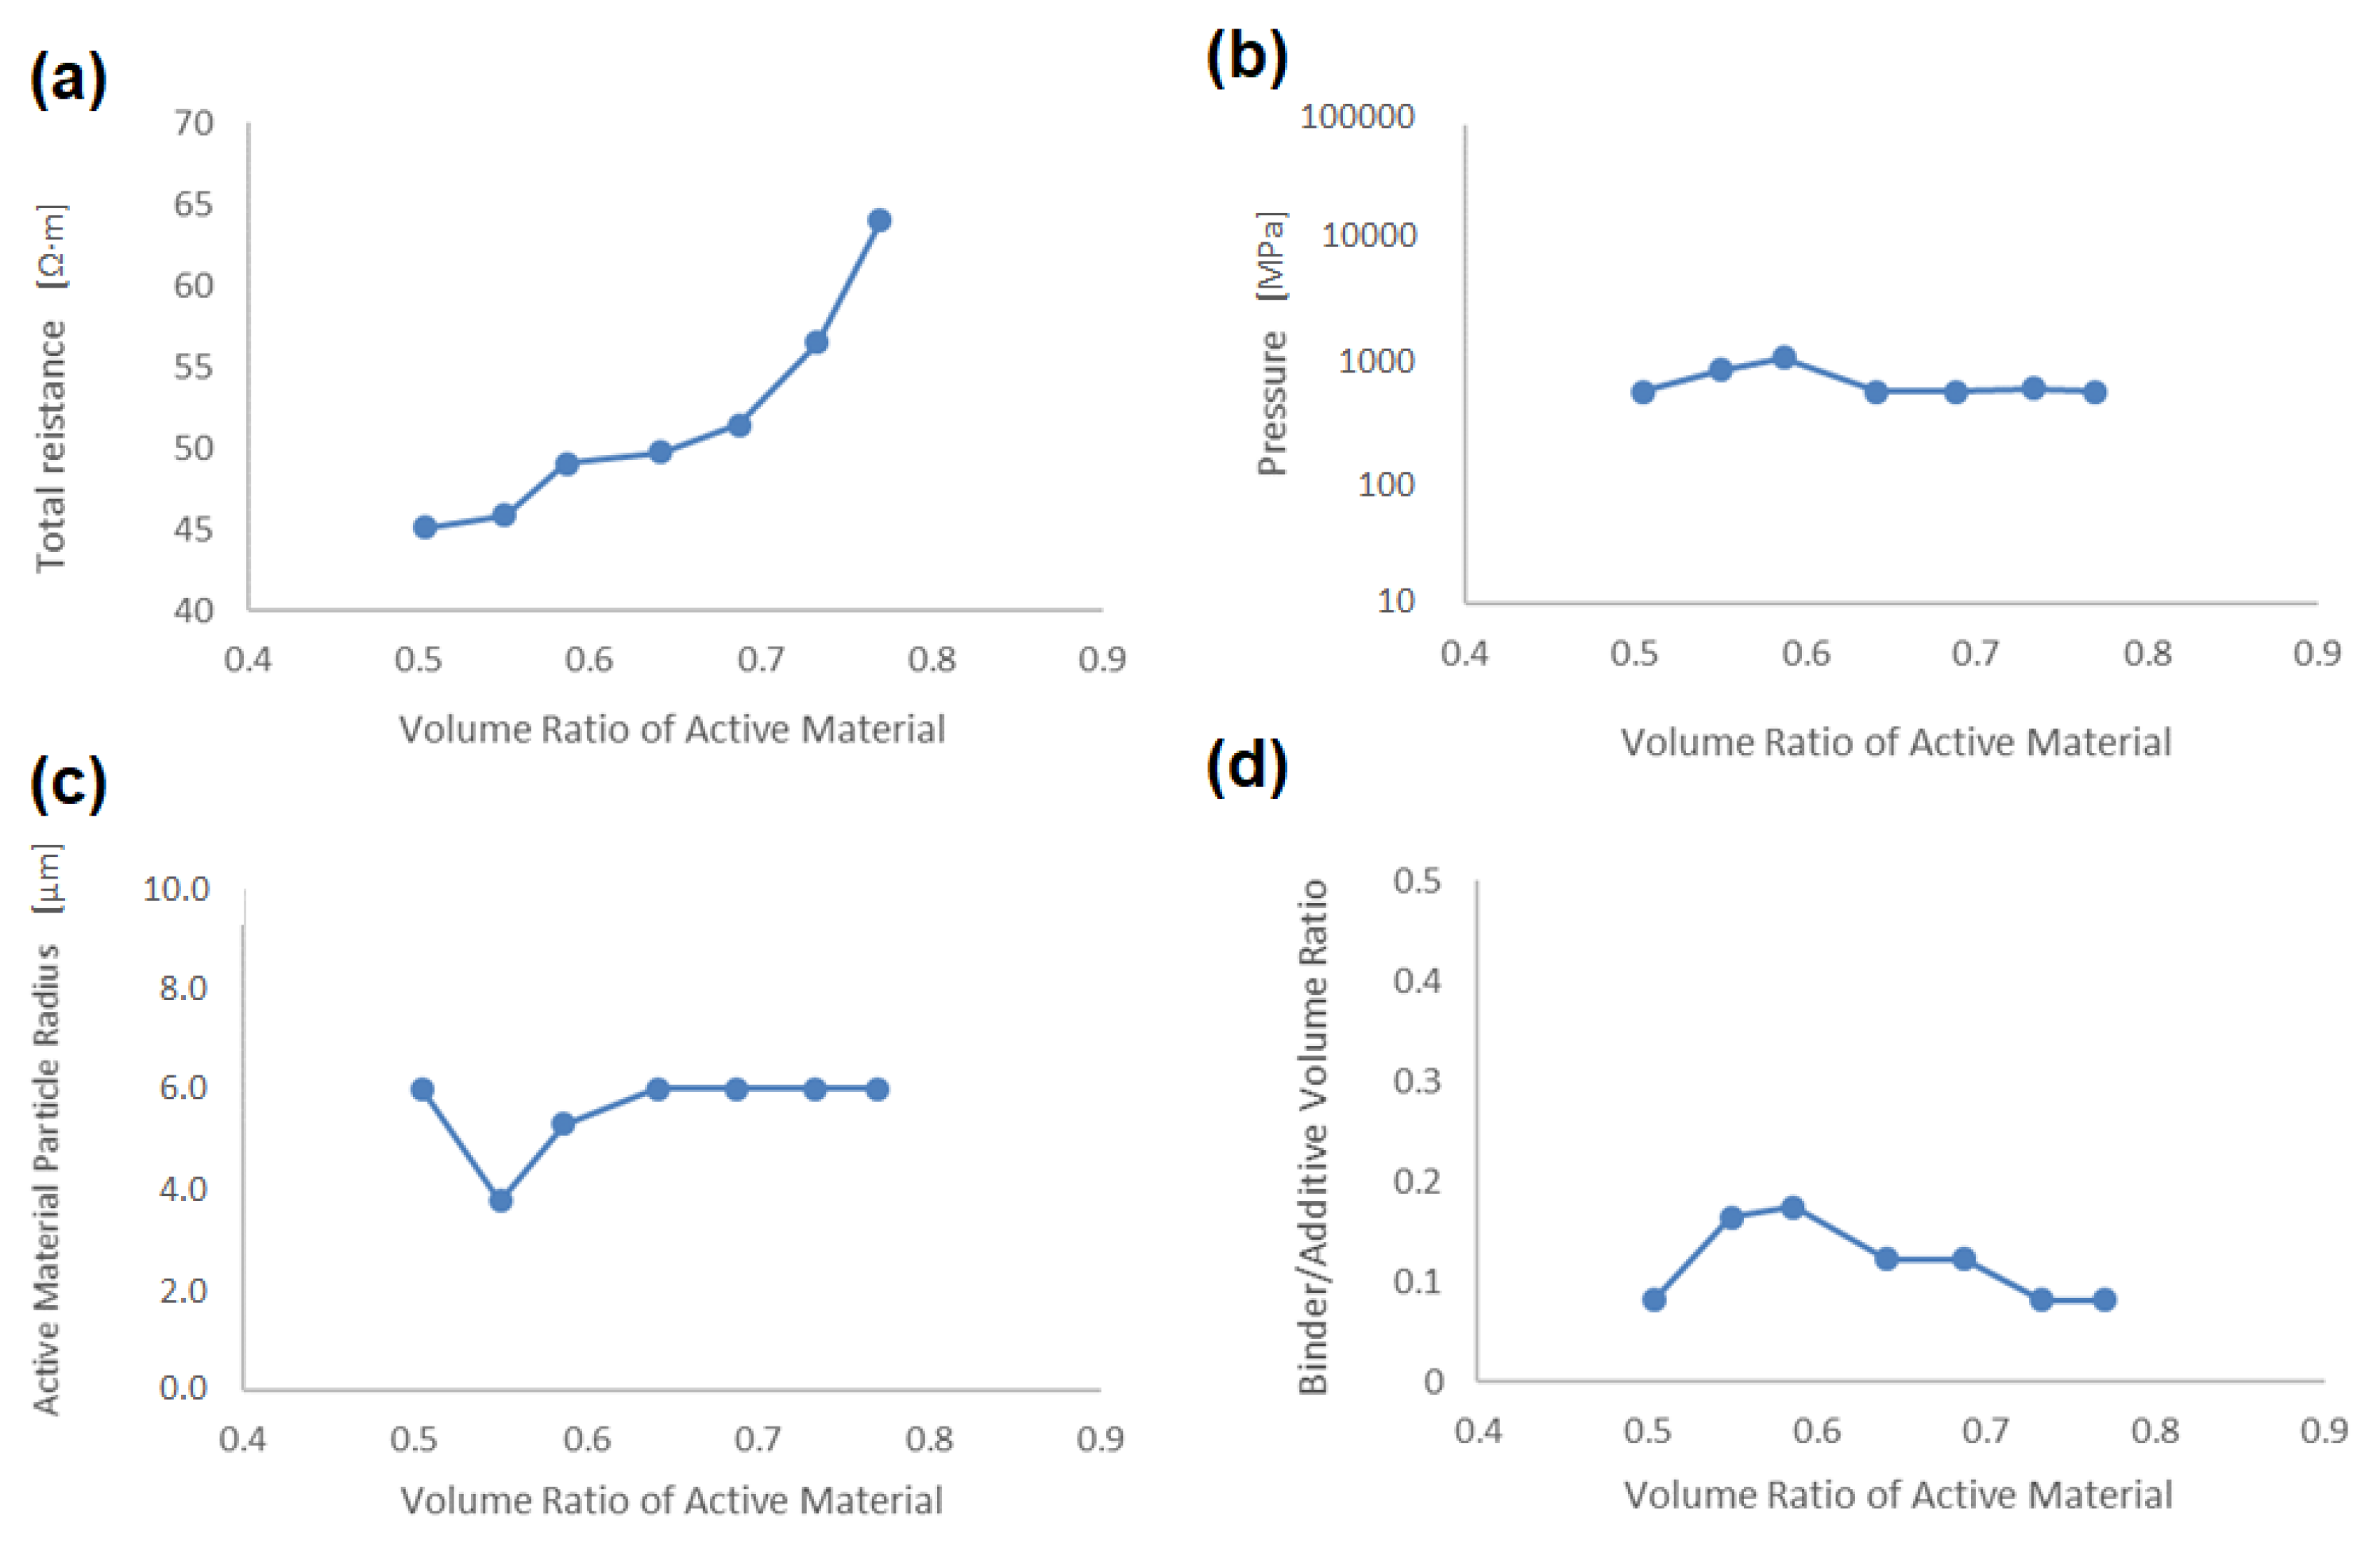
In order to predict the optimized process parameters for higher-capacity electrodes, we have conducted further calculations using the ANN model and optimization scheme described in
Section 3.3. The discharge specific resistances were predicted in the condition that the active material volume fraction is fixed between 0.5 and 0.8.
Figure 11a–d shows the dependences of specific resistance, pressure in the compaction process, active material radius, and binder/additives on the volume ratio in the active material, respectively. One can see that the total specific resistance increases exponentially with the volume ratio of the active material (see
Figure 11a). On the other hand, the process parameters are almost unchanged in values with an active material volume fraction of 0.5, although the active material particle radius and the binder/additives volume ratio slightly fluctuate. This result indicates that the optimized process parameters in the global condition (the volume ratio in the active material is not fixed, as listed in
Table 5) are also the best values in higher capacity conditions.
4. Conclusions
In this study, a prediction and optimization scheme for battery porous electrodes has been proposed as a guiding principle for manufacturing processes. First, a high-throughput simulation model, based on simplified physico-chemical equations with artificial 3D structures composed of randomly packed spheres, was constructed, and over 2000 calculations were conducted. Sensitivity analyses for the calculation results indicated that the total specific resistance (which is the summation of the reaction, electrolyte, and diffusion results) had a minimum value with respect to the volume ratio of the active material particles, their radius, and the pressure in the compact process, respectively.
Next, regression models, obtained by an ANN, were created in order to predict the charge/discharge specific resistance by various process parameters, including the active material volume ratio, the particle radius, pressure in the compaction process, and binder/additives volume ratio, using simulation results of these artificial 3D structures. The accuracy of prediction improved with the number of neurons and hidden layers, and an ANN model (consisting of two hidden layers with 16 neurons each) predicted both the training and test data of the specific resistances accurately.
Finally, optimized process parameters have been inferred from the total specific resistance using Bayesian optimization with the ANN model. The results indicated that an active material composed of small-sized particles should be packed at around 50%, with a small number of binder/additives. As a result of further calculations, with the constraint that the active material volume fraction is fixed in the range of 0.5–0.8, this parameter set is the best under higher capacity conditions, as well.
Although the optimized parameters strongly depended on assumed physical parameters, including the diffusion coefficient in active material, exchange current density, and so on, the proposed scheme for the prediction of electrode specific resistance and optimization is, nevertheless, also useful with various other physical parameters and conditions. In addition, note that work is underway to examine the predictability of the present model for actual experimental data. Model validation will be conducted in future work.
Author Contributions
Conceptualization, Y.T. and T.Y. (Tatsuya Yamaue); methodology, Y.T. and T.Y. (Takumi Yamanaka); software, Y.T.; validation, Y.T., and T.Y. (Tatsuya Yamaue); formal analysis, Y.T.; investigation, Y.T.; resources, Y.T.; data curation, Y.T.; writing—original draft preparation, Y.T.; writing—review and editing, Y.T. and T.Y. (Tatsuya Yamaue).; visualization, Y.T.; supervision, T.Y. (Tatsuya Yamaue); project administration, T.Y. (Tatsuya Yamaue).
Funding
This research received no external funding.
Conflicts of Interest
The authors declare no conflict of interest.
References
- Etacheri, V.; Marom, R.; Elazari, R.; Salitra, G.; Aurbach, D. Challenges in the development of advanced Li-ion batteries: A review. Energy Environ. Sci. 2011, 4, 3243–3262. [Google Scholar] [CrossRef]
- Lu, L.; Han, X.; Li, J.; Hua, J.; Ouyang, M. A review on the key issues for lithium-ion battery management in electric vehicles. J. Power Sources 2013, 226, 272–288. [Google Scholar] [CrossRef]
- Long, W.J.; Dunn, B.; Rolison, R.D.; White, S.H. Three-Dimensional Battery Architectures. Chem. Rev. 2004, 104, 4463–4492. [Google Scholar] [CrossRef]
- Arthur, S.T.; Bates, J.D.; Cirigliano, N.; Johnson, C.D.; Malati, P.; Mosby, M.J.; Perre, E.; Rawls, T.M.; Prieto, L.A.; Dunn, B. Three-dimensional electrodes and battery architectures. MRS Bull. 2011, 36, 523–531. [Google Scholar] [CrossRef]
- Xu, Y.; Zhou, M.; Lei, Y. Nanoarchitectured Array Electrodes for Rechargeable Lithium- and Sodium-Ion Batteries. Adv. Energy Mater. 2016, 6, 1502514. [Google Scholar] [CrossRef]
- Ni, J.; Li, L. Microbatteries: Self-Supported 3D Array Electrodes for Sodium Microbatteries. Adv. Funct. Mater. 2018, 28, 1704880. [Google Scholar] [CrossRef]
- Doyle, M.; Newman, J. Comparison of modeling predictions with experimental data from plastic lithium ion cells. J. Electrochem. Soc. 1996, 143, 1890–1903. [Google Scholar] [CrossRef]
- Fang, W.; Kwon, J.O.; Wang, Y.C. Electrochemical–thermal modeling of automotive Li-ion batteries and experimental validation using a three-electrode cell. Int. J. Energy Res. 2010, 34, 107–115. [Google Scholar] [CrossRef]
- Ning, G.; Popov, N.B. Cycle Life Modeling of Lithium-Ion Batteries. J. Electrochem. Soc. 2004, 151, A1584–A1591. [Google Scholar] [CrossRef]
- Ramadass, P.; Haran, B.; Gomadam, M.P.; White, R.; Popov, N.B. Development of First Principles Capacity Fade Model for Li-Ion Cells. J. Electrochem. Soc. 2004, 151, A196–A203. [Google Scholar] [CrossRef]
- Takagishi, Y.; Yamaue, T. Predicgtion of Li-ion Battery Module Performance under Running Condition Based on “Multifactorial Degradation Model”. Int. J. Automot. Eng. 2017, 8, 137–142. [Google Scholar]
- Melcher, A.; Ziebert, C.; Magnus, R.; Seifert, J.H. Modeling and Simulation of the Thermal Runaway Behavior of Cylindrical Li-Ion Cells—Computing of Critical Parameters. Energies 2016, 9, 292. [Google Scholar] [CrossRef]
- Abada, S.; Marlair, G.; Lecocq, A.; Petit, M.; Sauvant-Moynot, V. Safety focused modeling of lithium-ion batteries: A review. J. Power Sources 2016, 306, 178–192. [Google Scholar] [CrossRef]
- Less, G.B.; Seo, H.J.; Han, S.; Sastry, M.A.; Zausch, J.; Latz, A.; Schmidt, S.; Wieser, C.; Kehrwald, D.; Fell, S. Micro-Scale Modeling of Li-ion Batteries: Parameterization and Validation. J. Electrochem. Soc. 2012, 159, A697–A704. [Google Scholar] [CrossRef]
- Gelb, J.; Finegan, P.D.; Brett, L.J.D.; Shearing, R.P. Multi-scale 3D investigations of a commercial 18650 Li-ion battery with correlative electron- and X-ray microscopy. J. Power Sources 2017, 357, 77–86. [Google Scholar] [CrossRef]
- Trembacki, L.B.; Mistry, N.A.; Noble, R.D.; Ferraro, E.M.; Mukherjee, P.P.; Roberts, A.S. Mesoscale Analysis of Conductive Binder Domain Morphology in Lithium-Ion Battery Electrodes. J. Electrochem. Soc. 2018, 165, E725–E736. [Google Scholar] [CrossRef]
- Danner, T.; Singhc, M.; Hein, S.; Kaiserc, J.; Hahn, H.; Latz, A. Thick electrodes for Li-ion batteries: A model based analysis. J. Power Sources 2016, 334, 191–201. [Google Scholar] [CrossRef]
- Hosseinzadeh, E.; Marco, J.; Jennings, P. Electrochemical-Thermal Modelling and Optimization of Lithium-Ion Battery Design Parameters Using Analysis of Variance. Energies 2017, 10, 1278. [Google Scholar] [CrossRef]
- Dawson-Elli, N.; Lee, S.B.; Pathak, M.; Mitra, K.; Subramanian, R.V. Data Science Approaches for Electrochemical Engineers: An Introduction through Surrogate Model Development for Lithium-Ion Batteries. J. Electrochem. Soc. 2018, 165, A1–A15. [Google Scholar] [CrossRef]
- Bertei, A.; Nucci, B.; Nicolella, C. Effective Transport Properties in Random Packings of Spheres and Agglomerates. Chem. Eng. Trans. 2013, 32, 1531–1536. [Google Scholar]
- Persson, J.N.B. Contact mechanics for randomly rough surfaces. Surf. Sci. Rep. 2006, 61, 201–227. [Google Scholar] [CrossRef]
- Schneider, M.; Hofmann, T.; Andrä, H.; Lechner, P.; Ettemeyer, F.; Volk, W.; Steeb, H. Modelling the microstructure and computing effective elastic properties of sand core materials. Int. J. Solids Struct. 2018, 143, 1–17. [Google Scholar] [CrossRef]
- GeoDict, Math2Market GmbH, Kaiserslautern, Germany. Available online: http://www.geodict.de (accessed on 9 January 2017).
- Tibshirani, R. Regression shrinkage and selection via the lasso. J. R. Stat. Soc. Ser. B Methodol. 1996, 58, 267–288. [Google Scholar] [CrossRef]
- Hoerl, E.A.; Kennard, W.R. Ridge Regression: Biased Estimation for Nonorthogonal Problems. Technometrics 1970, 12, 55–67. [Google Scholar] [CrossRef]
- Donato, R.H.T.; Quiles, G.M. Machine learning systems based on xgBoost and MLP neural network applied in satellite lithium-ion battery sets impedance estimation. Adv. Comput. Intell. Int. J. 2018, 5, 1–20. [Google Scholar]
- Pedregosa, F.; Varoquaux, G.; Gramfort, A.; Michel, V.; Thirion, B.; Grisel, O.; Blondel, M.; Prettenhofer, P.; Weiss, R.; Dubourg, V.; et al. Scikit-learn: Machine Learning in Python. J. Mach. Learn. Res. 2011, 12, 2825–2830. [Google Scholar]
- Hensman, J.; Fusi, N.; Andrade, R.; Durrande, N.; Saul, A.; Lawrence, N.D. GPy. 2012. Available online: https://github.com/SheffieldML/GPy (accessed on 10 December 2018).
- Wu, B.; Han, S.; Shin, K.G.; Lu, W. Application of artificial neural network in design of lithium-ion batteries. J. Power Sources 2018, 395, 128–136. [Google Scholar] [CrossRef]
- Trana, Y.H.; Grecoa, G.; Täubert, C.; Wohlfahrt-Mehrens, M.; Haselrieder, W.; Kwade, A. Influence of electrode preparation on the electrochemical performance of LiNi0.8Co0.15Al0.05O2 composite electrodes for lithium-ion batteries. J. Power Sources 2012, 210, 276–285. [Google Scholar] [CrossRef]
Figure 1.
Proposed prediction and optimization scheme for a Li-ion battery porous electrode.
Figure 1.
Proposed prediction and optimization scheme for a Li-ion battery porous electrode.
Figure 2.
(a) Flowchart for the generation of the artificial structure with controllable process parameters, and (b) the generated mesoporous structures of the electrode (50 × 50 × 50 µm3).
Figure 2.
(a) Flowchart for the generation of the artificial structure with controllable process parameters, and (b) the generated mesoporous structures of the electrode (50 × 50 × 50 µm3).
Figure 3.
Sensitivities of (a) reaction resistance, (b) electrolyte resistance, (c) Li diffusion resistance, and (d) total specific resistance to the volume ratio of the active material, with a total of 2100 simulation results.
Figure 3.
Sensitivities of (a) reaction resistance, (b) electrolyte resistance, (c) Li diffusion resistance, and (d) total specific resistance to the volume ratio of the active material, with a total of 2100 simulation results.
Figure 4.
Sensitivities of (a) reaction resistance, (b) electrolyte resistance, (c) Li diffusion resistance, and (d) total specific resistance to the radius of the active material, with a total of 2100 simulation results.
Figure 4.
Sensitivities of (a) reaction resistance, (b) electrolyte resistance, (c) Li diffusion resistance, and (d) total specific resistance to the radius of the active material, with a total of 2100 simulation results.
Figure 5.
Sensitivities of (a) reaction resistance, (b) electrolyte resistance, (c) Li diffusion resistance, and (d) total specific resistance to the pressure, with a total of 2100 simulation results.
Figure 5.
Sensitivities of (a) reaction resistance, (b) electrolyte resistance, (c) Li diffusion resistance, and (d) total specific resistance to the pressure, with a total of 2100 simulation results.
Figure 6.
Sensitivities of (a) reaction resistance, (b) electrolyte resistance, (c) Li diffusion resistance, and (d) total specific resistance to the binder/additives volume ratio, with a total of 2100 simulation results.
Figure 6.
Sensitivities of (a) reaction resistance, (b) electrolyte resistance, (c) Li diffusion resistance, and (d) total specific resistance to the binder/additives volume ratio, with a total of 2100 simulation results.
Figure 7.
Scatter plots between the specific resistances calculated by the simplified physico-chemical models and predicted by various artificial neural network (ANN) models with training data and test data.
Figure 7.
Scatter plots between the specific resistances calculated by the simplified physico-chemical models and predicted by various artificial neural network (ANN) models with training data and test data.
Figure 8.
Comparison of summations of the weight coefficient magnitudes of the first layer neurons for various design parameters.
Figure 8.
Comparison of summations of the weight coefficient magnitudes of the first layer neurons for various design parameters.
Figure 9.
Convergence plot of five different initial conditions within 100 iterations.
Figure 9.
Convergence plot of five different initial conditions within 100 iterations.
Figure 10.
(a) Packing structure of the active material particles (50 × 50 × 50 µm3), and (b) radar chart of each specific resistance factor in the condition of the optimized process parameters.
Figure 10.
(a) Packing structure of the active material particles (50 × 50 × 50 µm3), and (b) radar chart of each specific resistance factor in the condition of the optimized process parameters.
Figure 11.
Dependence to the volume ratio in the active material of (a) total specific resistance, (b) pressure in the compaction process, (c) active material radius, and (d) binder/additives volume ratio.
Figure 11.
Dependence to the volume ratio in the active material of (a) total specific resistance, (b) pressure in the compaction process, (c) active material radius, and (d) binder/additives volume ratio.
Table 1.
Coefficients of the polynomial open circuit voltage (OCV) function [
11].
Table 1.
Coefficients of the polynomial open circuit voltage (OCV) function [
11].
| Coefficient | Value |
|---|
| p6 | −43.8299 |
| p5 | 109.273 |
| p4 | −99.9523 |
| p3 | 39.8270 |
| p2 | −5.52739 |
| p1 | −1.00539 |
| p0 | 4.19987 |
Table 2.
The parameters of the simplified physico-chemical model.
Table 2.
The parameters of the simplified physico-chemical model.
| Parameter | Value | Reference |
|---|
| Exchange current density, i0 | 0.10 A/m2 | Assumed |
| Temperature, T | 298 K | Assumed |
| Transfer coefficient, α | 0.50 | [8,10] |
| Diffusion coefficient in active material, Ds | 5.0 × 10⁻¹³ m2/s | Assumed |
| Current density, i | 20 A/m2 | Assumed |
| Maximum Li concentration of active material, cmax | 36,224 mol/m3 | [17] |
Table 3.
The dataset for learning and testing, including the predictors and descriptors.
Table 3.
The dataset for learning and testing, including the predictors and descriptors.
| # | Descriptors | Predictors |
|---|
| Active Material | Binder/Additives | Electrolyte | Compaction Process | Reaction Resistance (Ω·m) | Electrolyte Resistance (Ω·m) | Diffusion Resistance (Ω·m) |
|---|
| Volume Fraction (%) | Radius (µm) | Volume Ratio (%) | Conductivity (S/m) | Pressure (MPa) |
|---|
| 1 | 77.8 | 10.5 | 28.5 | 0.77 | 3.12 | 1.03 | 291 | 9.68 |
| 2 | 85.4 | 11.5 | 0.254 | 0.35 | 23.2 | 1.71 | 20.4 | 4.02 |
| … | … | … | … | … | | … | … | |
| 2100 | 85.4 | 11.5 | 0.852 | 0.35 | 14.6 | 1.75 | 80.7 | 2.49 |
Table 4.
The correlation coefficients, R2, for the validation data.
Table 4.
The correlation coefficients, R2, for the validation data.
| Number of Hidden Layers | Number of Neurons |
|---|
| 2 | 4 | 6 | 8 | 10 | 12 | 16 | 20 |
|---|
| 1 | 0.326 | 0.788 | 0.834 | 0.810 | 0.790 | 0.978 | 0.937 | 0.979 |
| 2 | 0.330 | 0.795 | 0.822 | 0.863 | 0.827 | 0.845 | 0.990 | 0.990 |
Table 5.
Optimized process parameters for the total specific resistance.
Table 5.
Optimized process parameters for the total specific resistance.
| Active Material | Binder/Additives | Electrolyte | Compaction |
|---|
| Volume Fraction (%) | Radius (µm) | Volume Ratio (%) | Conductivity (S/m) | Pressure (MPa) |
|---|
| 50.4 | 6.00 | 0.0820 | 1.00 | 590 |
© 2019 by the authors. Licensee MDPI, Basel, Switzerland. This article is an open access article distributed under the terms and conditions of the Creative Commons Attribution (CC BY) license (http://creativecommons.org/licenses/by/4.0/).


