1. Introduction
Indium is one of the strategically important materials that have been characterized as critical by several industrialized countries [
1,
2,
3,
4]. Up until 2025, the yearly demand for this material is estimated to grow by 70% relative to the year 2015 [
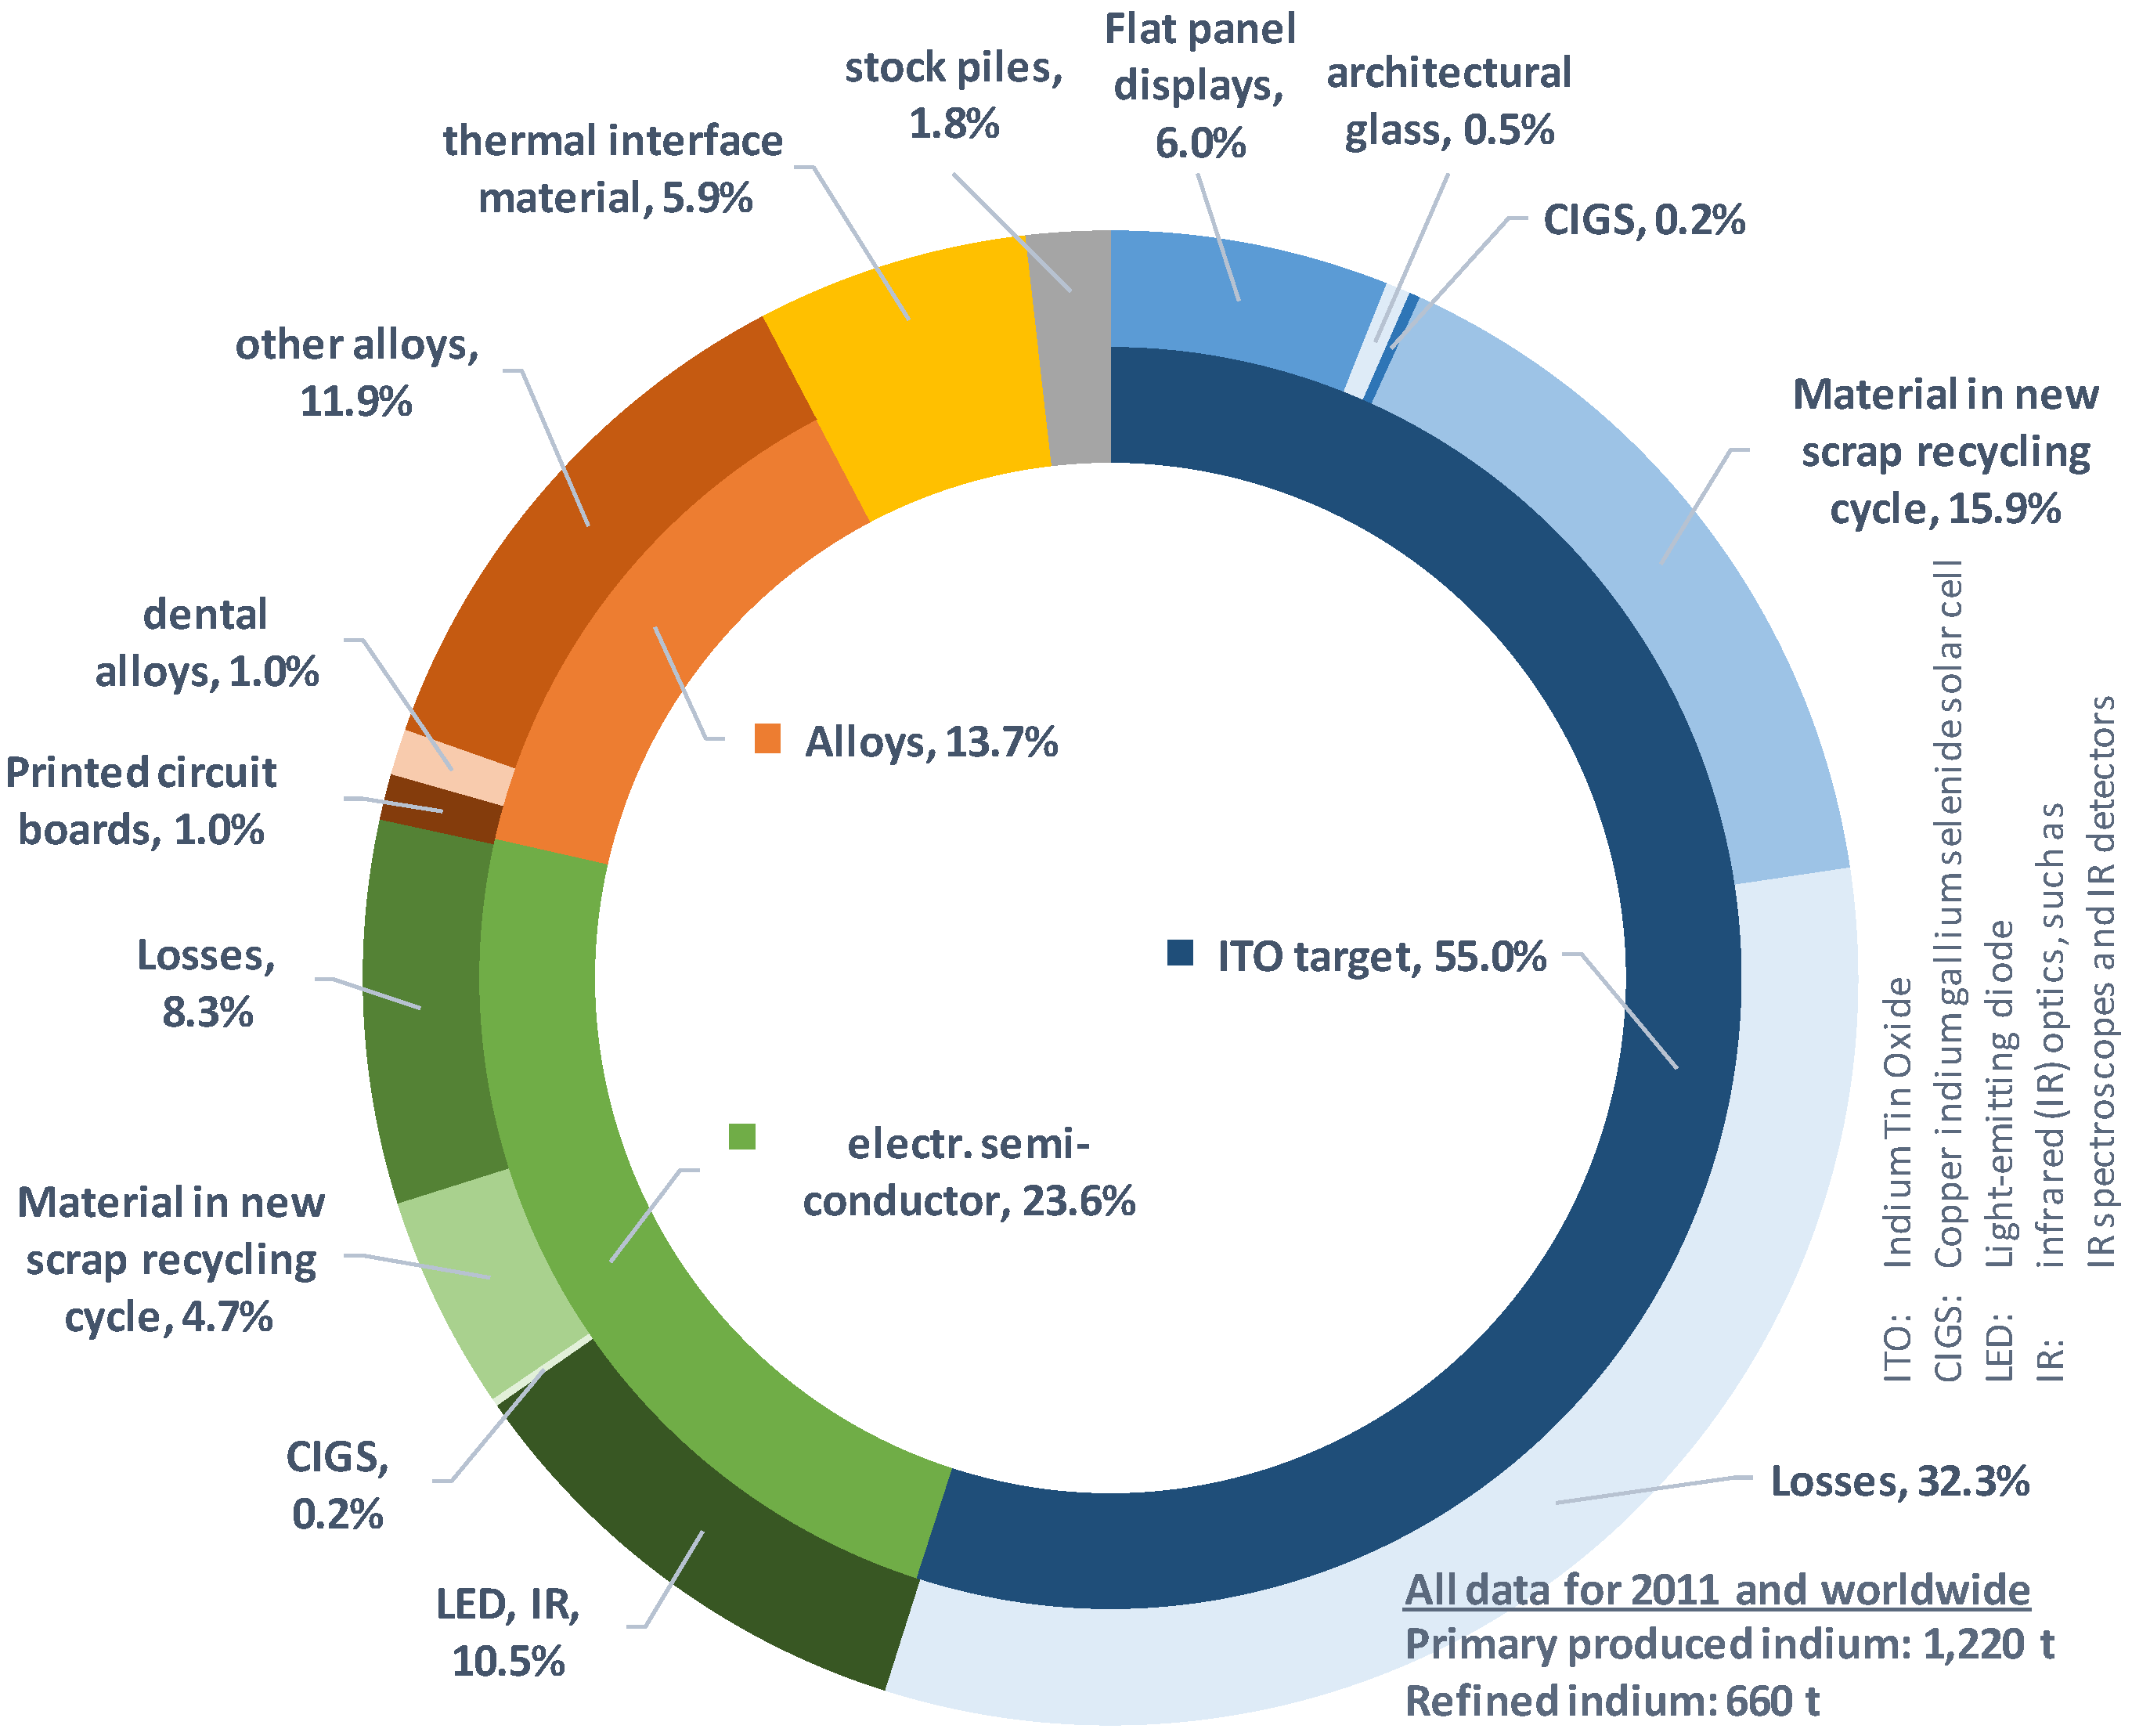
5]. In 2011, 1220 t indium was primarily mined worldwide, from which 660 t indium was refined [
5]. In recent years, the output of refined indium increased to 800 t in 2013 and 820 t in 2014 [
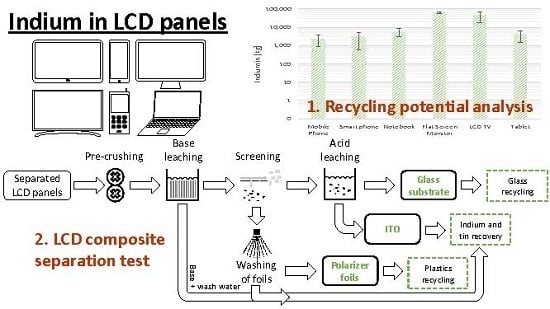
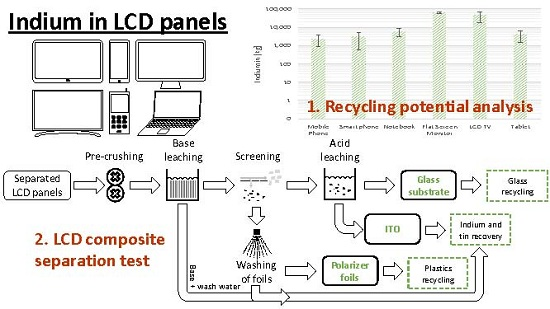
6]. Over 55% of the worldwide production of indium is used in the ITO (indium tin oxide) target industry, which is a major component in the production of liquid crystal displays (LCD) [
5,
6,
7,
8] (cf.
Figure 1). For further information about the use of indium see the text in the
Supporting Information S1.
End-of-life (EOL) LCDs account for up to 90% of the indium-bearing components in Waste Electric and Electronic Equipment (WEEE). This concentrated use of one element in a particular set of WEEE devices could provide a basis for successful recycling [
9,
10,
11]. Although a number of studies have been published, a full recycling of LCD panels has not been developed [
12,
13,
14,
15,
16,
17,
18,
19,
20,
21,
22,
23,
24,
25,
26,
27,
28,
29]. Hence, recovery of indium from WEEE is not yet being carried out [
1,
2,
30].
As significantly increasing collection rates of WEEE LCD devices are expected over time, the development of appropriate recycling processes for indium recovery has been in focus recently [
15,
31,
32,
33]. Various studies present methodologies for the recovery of indium from LCD panels using mechanical, thermal, and pyro- and hydrometallurgical approaches [
12,
13,
14,
15,
16,
17,
18,
19,
20,
21,
22,
23,
24,
25,
26,
27,
28,
29]. Most of the studies focus on the recovery of indium alone. Other integral materials like glass or plastics receive only minor attention, although they represent significant shares of LCD panels. While polarizer foils consist mostly of cellulose acetate, which is a valuable and perfectly saleable material [
26], the applied glass substrate with the highest mass share in LCDs jeopardizes end-of-life treatment through the potential presence of substances added in the production process.
However, establishing a circular economy for indium is a mandatory goal in the framework for the sustainable and future-oriented management of critical raw materials, but the recycling of this material alone cannot cover all costs. Therefore, bulk fractions like glass and plastics must also be profitably separated and integrated into recycling strategies for LCD panels. For this, an appropriate technology is required but has not yet been investigated or established.
In this study, we investigate the structure and composition of LCD panels from a variety of devices, including the most relevant, and offer first approaches for a full recycling strategy for LCD panels. Hence, our aim is to:
provide detailed information about the indium and tin mass fractions in the most relevant LCD devices and assess the co-existence and mass fractions of by-applied elements such as toxic heavy metals and strontium, which were suspected to be present in LCD panel glass and could affect the recycling process,
show the annual mass flows of indium, applied polarizer foils, and the glass substrate in put-on-market devices as well as in WEEE devices collected for recycling purposes,
present and test a new recycling approach for separating the LCD composites and provide polarizer foils, a glass substrate, and an indium-rich concentrate as single output fractions.
2. Background
2.1. Design of LCD
Based on the screen size and the primary function of the device, the shares of the applied LCD panels vary. Our own disassembly operations revealed mass shares of LCD panels in notebooks of 9.5% (
n = 8), 8.5% for mobile phones (
n = 38), 19% for tablets (
n = 16), and 14.7% for smartphones (
n = 26). Other studies show different values. EMPA (Swiss Federal Laboratories for Materials Science and Technology) and SWICO (Schweizerischer Wirtschaftsverband der Informations-, Kommunikations- und Organisationstechnik) [
34] and Westerdahl et al. [
35] state a 19% LCD panel share in notebooks. Furthermore, Westerdahl et al. [
35] determined 19% for TV sets. In contrast, EMPA and SWICO [
34] show only 6% for TVs and 9% for PC monitors. The varying shares are most probably related to different levels of disassembly. The LCD panels are usually assembled in frames, including the background lighting and electronic components like printed circuit boards/electronics. For tablets and smartphones (devices with touch functionality), the LCD panels are partially bonded with surface mounted glass, which cannot be completely separated. Hence, the category ‘LCD display’ or ‘LCD panel’ can be interpreted in different ways.
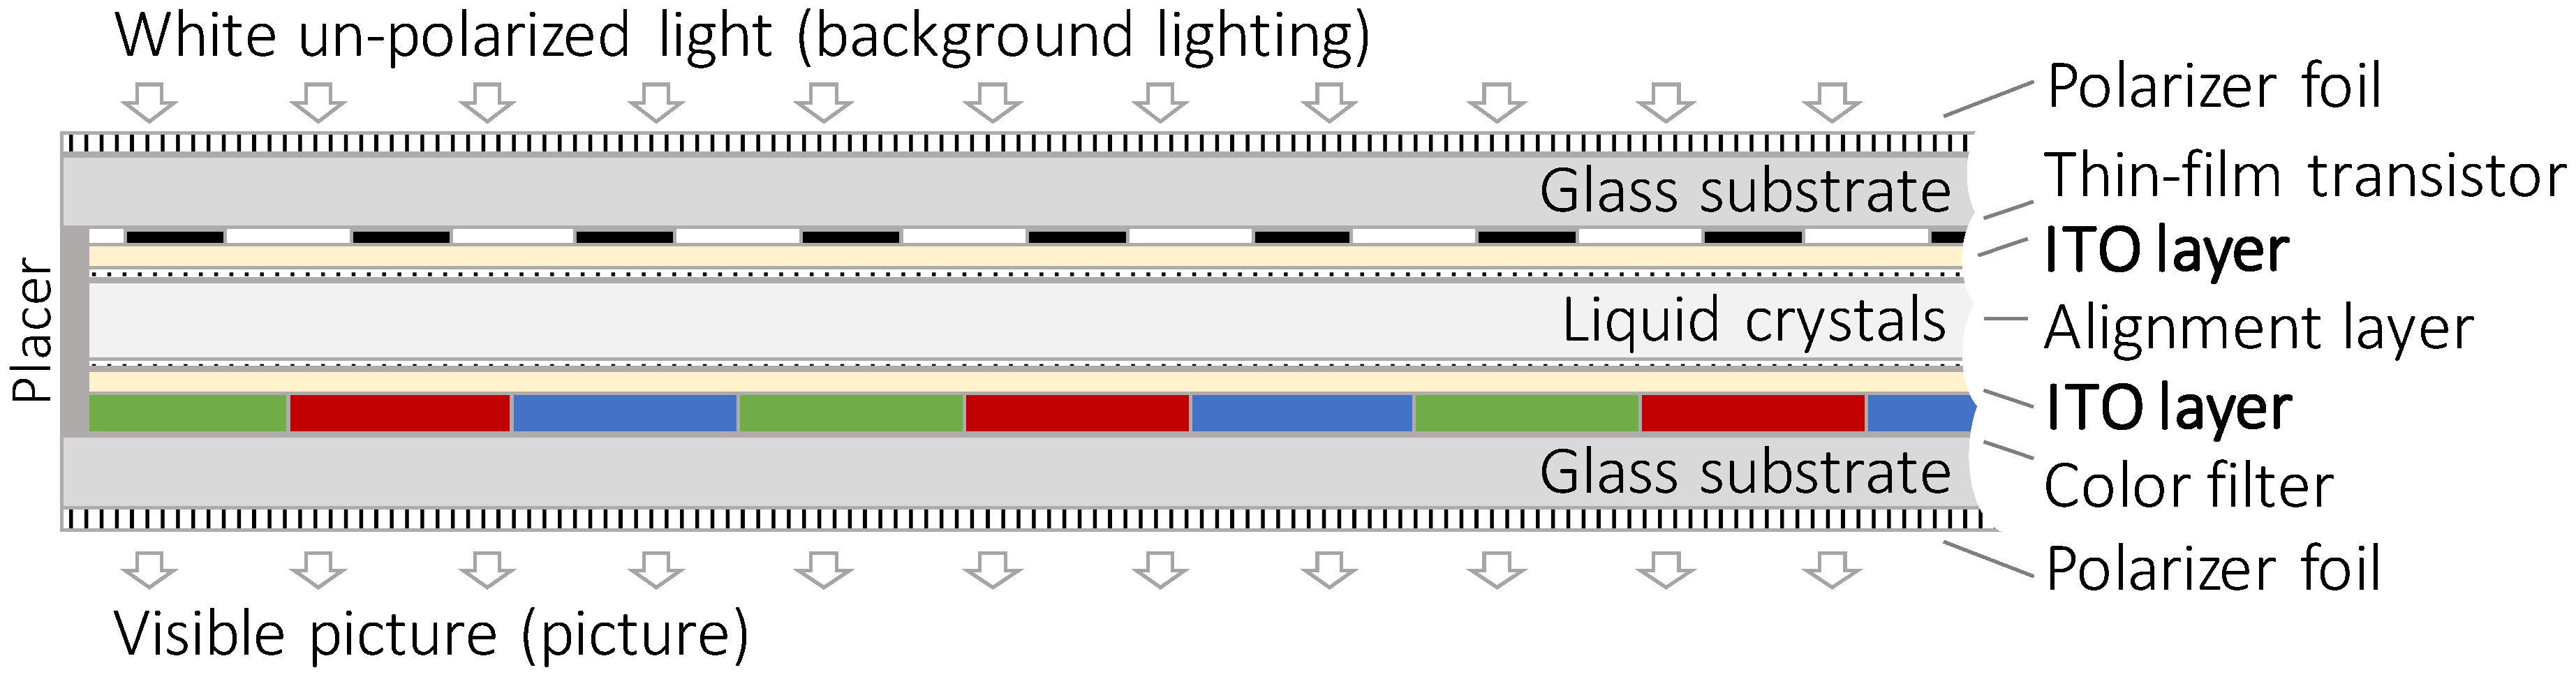
Although the shares of LCD panels vary, in the screen devices investigated here the structure and design of the panels are standardized. Each panel consists of several layers in a sandwich structure. Two glass panes made of sodium- or boron-silicate glass form the basis. The inner sides are populated with color pigments, thin film transistors, and the conductive ITO layer. On the outsides of the glass panes, polarizer foils are pasted. [
36]
Figure 2 shows the sandwich design of an LCD panel in profile.
2.2. Indium Recycling from LCD Panels
Recycling of indium is only established accompanying the production process of semi-finished and intermediate products (see the text in the
Supporting Information S2). Recycling of indium from EOL LCD panels is not yet carried out on an industrial scale [
2,
30,
37,
38]. At least, much research has been recently carried out on the topic of indium recovery from LCD panels. Various approaches have been tested with the primary focus on indium recovery.
Table 1 gives an overview of the most recently discussed studies.
The first step for most indium recovery approaches is the transfer of ITO into a liquid state via acidic dissolution. The main parameters are the preparation of the LCD panels, the concentration of the leachate used, temperature, reaction time, and repetition of the chosen process. The primary leachates used are sulfuric acid, nitric acid, and hydrochloric acid, while the chosen temperature is between 80 and 90 °C. With this approach, up to 99% of the indium can be extracted [
16,
17,
19,
20,
41].
Most of the approaches tested use a high temperature for a better and more efficient reaction. In order to reduce the energy input, the leaching process can also be executed at room temperature. Here, a specific sample preparation, such as the crushing of the LCD panels, plays an important role.
Further concentration steps via hydrometallurgical procedures such as solvent extraction purify the indium output and separate undesignated substances.
Recovery of applied polarizer foils and the glass substrate is only occasionally investigated. Most of the studies state that a separation of foils took place but was executed manually. The reason behind this was the fear that the plastics might disturb further processes. However, a focused recovery of the polarizer foils and glass substrate has not been broadly investigated in detail nor have any successful approaches been implemented in current recycling strategies. FEM (Forschungsinstitut Edelmetalle und Metallchemie, Institut für Energie- und Umwelttechnik e.V.) (2011), Götze and Rotter (2012), Zhang et al. (2015), and Zhang and Xu (2016) summarized recently investigated strategies for the recycling of LCD panels [
26,
27,
28,
29].
3. Material and Methods
3.1. Research Design
- (A)
In order to assess the mass fractions of related elements applied in LCD panels, chemical analyses were carried out using new methods originally developed in our labs. In addition to (A1) indium and tin, other elements such as (A2) toxic heavy metals and strontium, which could hinder the recycling processes, were also determined. All the elements measured were compared with reference to the manufacturing dates of each equipment type group investigated in order to (A3) deduce potential time trends. Furthermore, the (A4) plastics type of the polarizer foils was determined.
- (B)
Based on the information from the chemical analysis, annual mass flows for indium, polarizer foils, and glass have been calculated, both for put-on-market devices and for LCD devices that have been collected for recycling purposes.
- (C)
Furthermore, a composite separation test (CST) was carried out as a first approach for a possible integral recycling process of LCD panels. Using this method, the major components, glass substrate and polarizer foils, can be separated. The ITO mainly remains on the glass substrate and can be chemically washed off and recovered by different means.
3.2. (A) Analysis of LCD Panels
3.2.1. (A1) Determination of Indium and Tin in the Panel Sandwich
Earlier we developed an optimized test method to quantify the indium mass fraction in the LCD panel [
36]. Our approach avoided any pretreatment of the LCDs in order to minimize indium losses prior to analysis. Consequently, the panels were analyzed without a crushing step or the removal of the polarizer films. As the large panels could not be analyzed as a whole, single pieces were cut out with masses of around 0.5 to 1 g and a cross-section of approximately 1 cm
2. A microwave assisted leaching of the indium from the glass surface was carried out (CEM Ultra-High Throughput Microwave Digestion System CEM MarsXpress 5, Kamp-Lintfort, Germany) with 10 mL nitric acid (HNO
3, 65%, Rotipuran Supra; Fa. Roth) at 180 °C. Further parameters were a maximal pressure of 20 bar, 20 min heating ramp, 20 min reaction time at 180 °C, and 20 min cooling time. Three parallel measurements per sample were carried out. In order to avoid systematic effects from the analysis procedures and to check the quality of the results, the chemical analysis was carried out in parallel with an ICP–OES (Inductively Coupled Plasma—Optical Emission Spectrometry) (Thermo Fisher iCAP 6300 Duo, Dreieich, Germany) and a flame AAS (atomic absorption spectroscopy) (Perkin Elmer F-AAS 1100 B, Rodgau, Germany). The validation of the chemical analyses is provided in the text and figures in the
Supporting Information S11.
This methodology was applied to six different LCD device groups originating from dismantling studies; mobile phones (UNU key 0306-01; n = 11), smartphones (UNU key 0306-02, n = 26), tablets (UNU key 0303-02, n = 26), notebooks (UNU key 0303-01, n = 20), PC monitors (UNU key 0309-01, n = 11), and LCD TVs (UNU key 0408-01, n = 9). Please note that mobile phones were defined as cell phones with basic functionalities such as voice communication, SMS (Short Message Service), and MMS (Multimedia Messaging Service). Smartphones are defined by their advanced operating systems and almost full-size screens with touch functionality.
3.2.2. (A2) Determination of Toxic Heavy Metals and Strontium in Panel Glass
The samples were prepared as described for the determination of indium in the LCD panels. After cutting out a 1 cm2 large piece from the center of the panel, the panels disintegrated into two halves. Due to the application of the elements to be measured in the glass panels, a wet chemical analysis using an ICP would have only been possible after a complete digestion of the panels with hydrofluoric acid. For safety reasons and to facilitate the measurements, the analyses were conducted via X-ray fluorescence (XRF). The two halves were each analyzed for As, Cr, Pb, Sb, and additionally Sr from both sides with a handheld device from Thermo Fisher/Analyticon XL3 air.
Devices from the six different LCD equipment groups mentioned above were analyzed; mobile phones (0306-01, n = 26), smartphones (0306-02, n = 27), tablets (0303-02, n = 26), notebooks (0303-01, n = 18), PC monitors (0309-01, n = 10), and LCD TVs (0408-01, n = 5).
3.2.3. (A3) Time Trend Analysis
In order to identify product trends regarding the use of indium, tin, and the toxic heavy metals + Sr, the dates of manufacture of all devices investigated were evaluated and compared with the individual mass fraction of the elements determined.
3.2.4. (A4) Polymer Analysis of Polarizer Foils
The type of polymers applied as polarizer foils in LCD panels plays an important role in the economic efficiency of future recycling strategies. Cellulose acetate represents a high-value polymer, which would support recycling efforts if it was recovered in high quality throughout the range of relevant LCD devices. Therefore, small samples of polarizer foils were manually separated from ten LCD panels obtained from smartphones and tablets and investigated regarding their polymer type to verify the widespread use of cellulose acetate. Polarizer foils were subjected to an Attenuated Total Reflectance Fourier Transform Infrared spectroscopy (ATR-FTIR, Spectrum One, Perkin Elmer) without further pretreatment. Resulting spectra were matched with spectra from the ‘ATR of polymer’ database from Perkin Elmer for identification of polymer type.
3.3. (B) Assessment of Mass Flows of Indium, Polarizer Foils, and Glass Substrate
For all equipment types investigated, the potential indium, polarizer foil, and glass substrate mass flows were calculated for put-on-market (POM) product flows, and WEEE flows through LCD devices collected for recycling purposes.
We calculated the theoretical potential for both Germany and the global market in 2013 according to Equations (1) and (2). Literature, our own data, and data from statistical institutions have been reviewed [
36,
45,
46,
47,
48,
49,
50].
where
mj,i POM is the mass of material
j (indium, polarizer foils, glass substrate) in products
i POM (kg);
mj,i WEEE is the mass of material
j in
WEEE products
i (kg);
Ni is the number of product
i POM (-);
is the average mass of product
i (kg);
is the average mass share of LCD panels in product
i (%); and
is the average mass share of material j in product
i (%).
3.4. (C) Development of a New Recycling Approach for LCD Panels
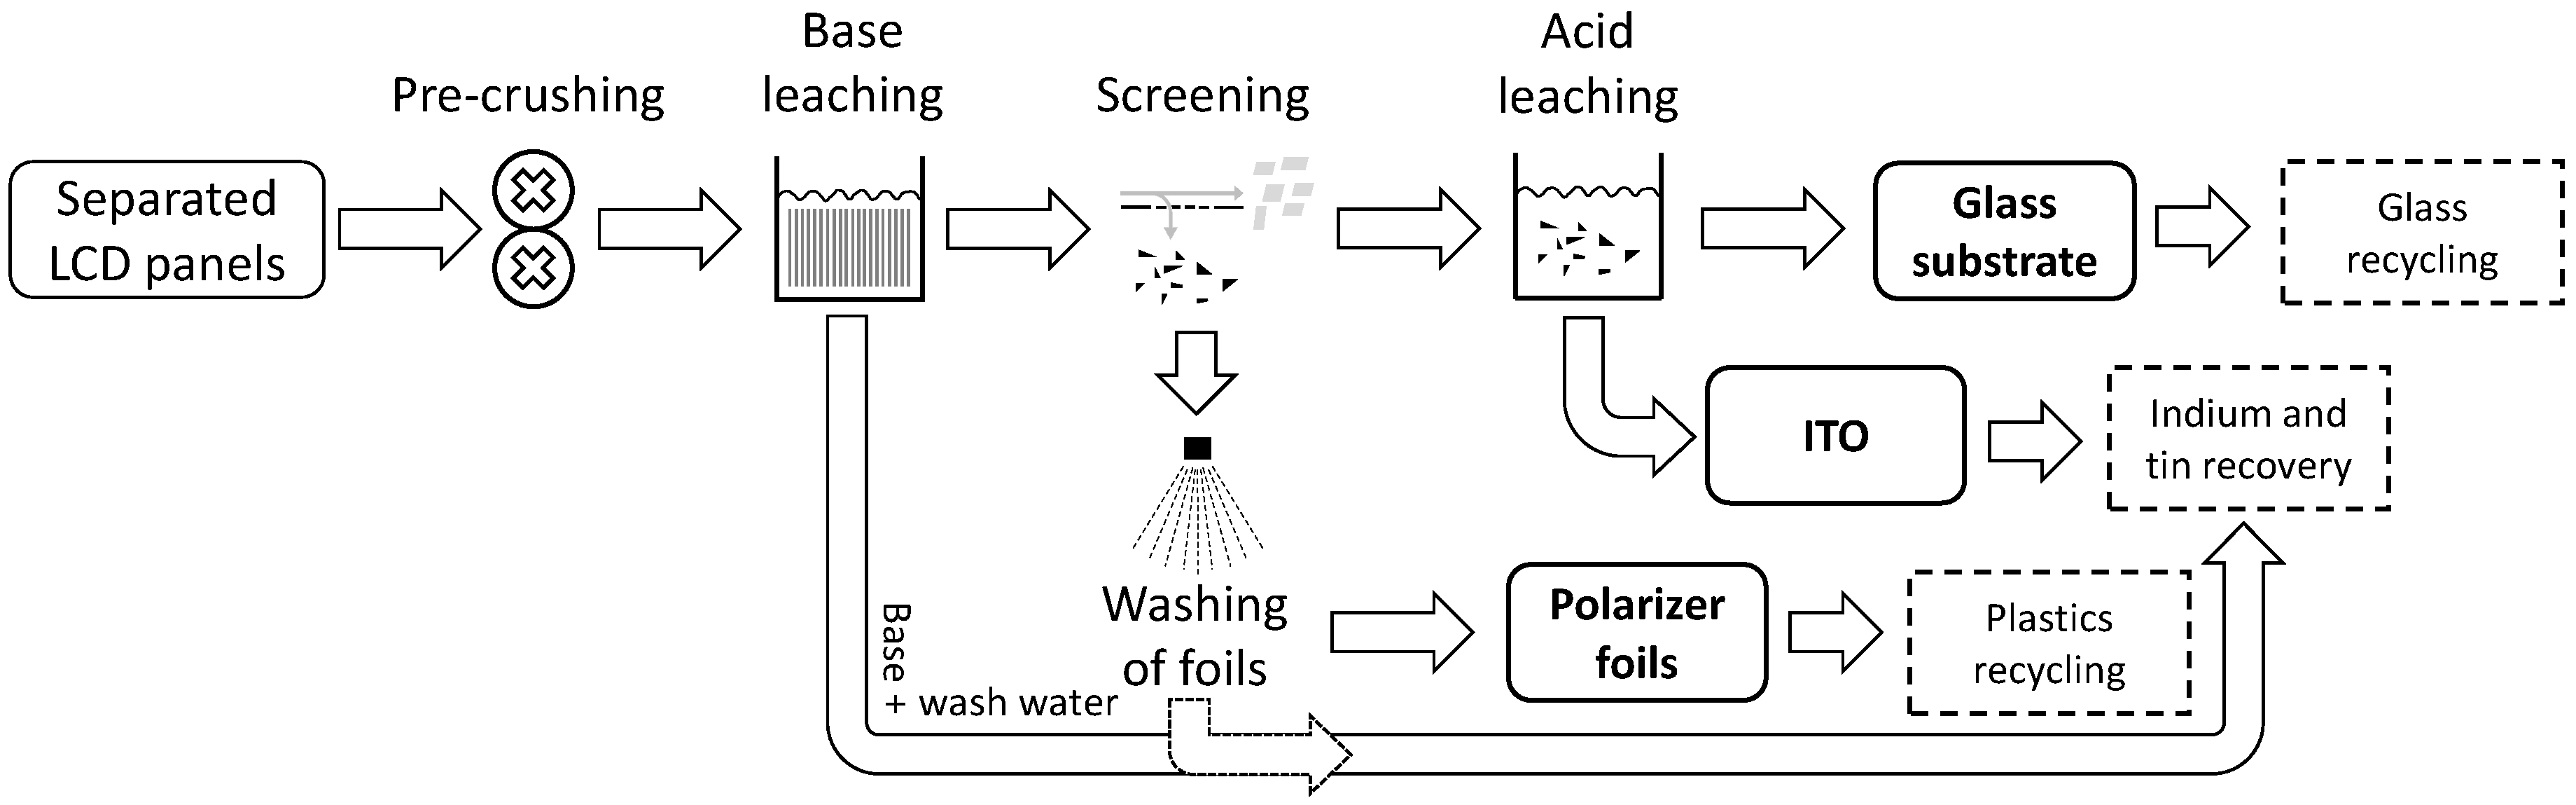
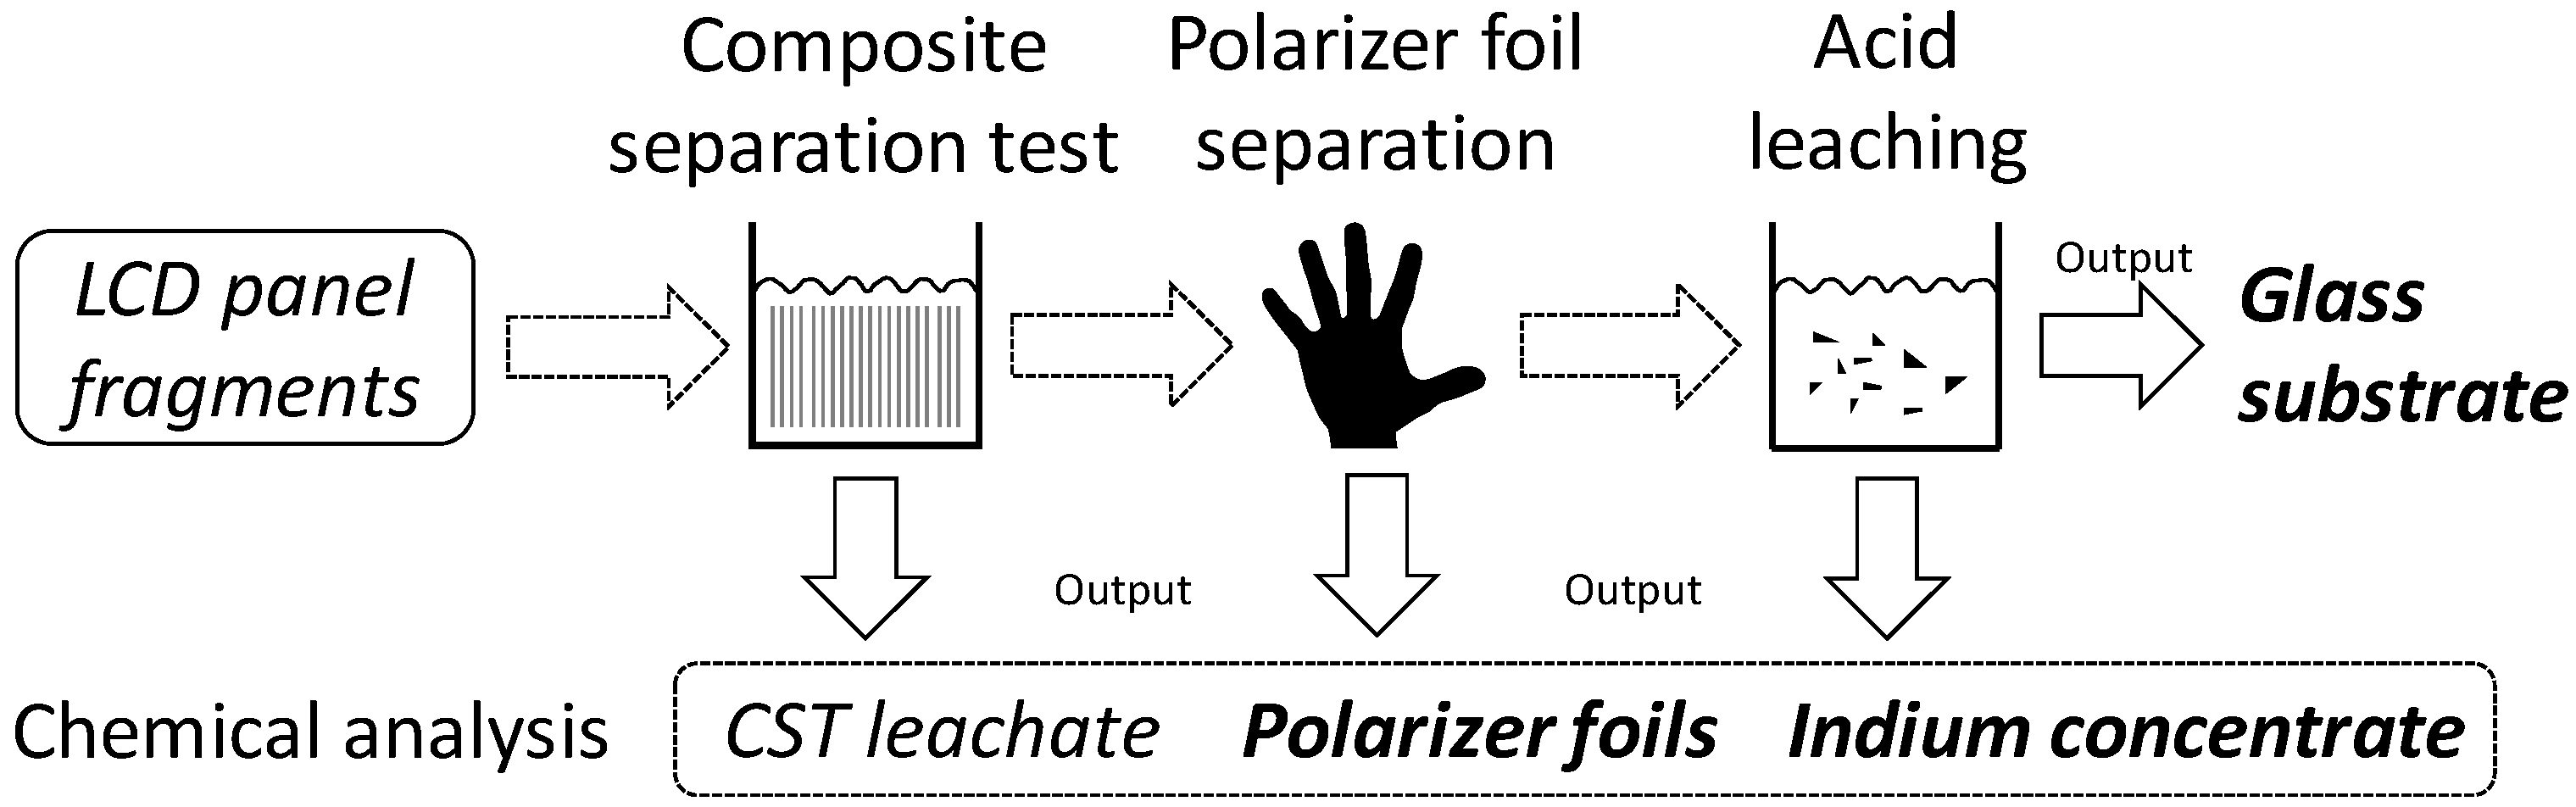
The tested recycling approach is carried out in two separate steps (cf.
Figure 3). The first step is the composite separation test (CST) in which the polarizer foils are removed from the glass substrate. In the second step, the ITO is separated by acid leaching applying the above-mentioned method to generate pure glass substrate. The recycling approach was exemplarily carried out on various LCD panel samples from two different equipment types, smartphones and tablets. For tablets, the sample mass was 8 g and for smartphones 10 g. All samples were cut into pieces of 2–4 cm
2.
3.4.1. Composite Separation/Polarizer Foils Separation
For the separation of polarizer foils, the samples were treated with a water/base solution with 10 vol. % NaOH over 72 h at room temperature. This treatment caused a separation of the polarizer foils from the glass substrate by interfacial unbinding without digesting the polymer. At the end of the reaction time, the polarizer foils could be separated easily. The residues from the treatment are glass substrates covered on one side by an ITO layer.
To protect the plastics from further attack by the base and to recover any leached indium that might be attached to the polarizer foils, subsequent washing with an aliquot volume of distilled water was conducted. The leachate from the NaOH solution and the aliquot washing water were subsequently combined, weighed, and prepared for chemical analysis.
3.4.2. Acid Leaching/ITO Separation
For the separation of ITO from the glass residues, the same methodologies were used as described for the chemical analysis of the whole LCD panels. This methodology consists of a microwave assisted (CEM Ultra-High Throughput Microwave Digestion System MarsXpress) leaching of the indium from the glass surface with 10 mL nitric acid (HNO3, 65%, Rotipuran Supra; Fa. Roth) at 180 °C, maximal pressure 20 bar, 20 min heating ramp, 20 min reaction time at 180 °C, and 20 min cooling time. Three parallel measurements per sample were carried out.
3.4.3. Quality Assessment of the New Recycling Approach
In total, four output fractions were generated in the composite separation test of the new recycling approach: (1) foils fraction; (2) foil leachate residues; (3) ITO + liquid crystals (organics); and (4) a pure glass fraction. To evaluate the efficiency of the process and to determine the individual flows of In, Sn, Cu, and Sr as well as the toxic heavy metals As, Cr, Sb, and Pb, chemical analyses of the output fractions were subsequently carried out. The remaining glass fraction is ITO-free and is not investigated in detail any further.
For the foils fraction, a method for an optimized determination of the target elements with an ICP-OES had to be developed. To transfer the elements of interest to the liquid phase, three different acid digestions were tested on foil fraction samples from both smartphones and tablets. The following standard leaching agents were chosen; hydrochloric acid (HCl), nitric acid (HNO3), and aqua regia (volume ratio conc. HNO3 to conc. HCl 1:3). The resulting leachate was directly analyzed using ICP-OES.
4. Results & Discussion
102 LCD devices from six different product groups were investigated for their mass shares of polarizer foils and glass substrate. Due to the design, glass substrate and polarizer foils account for the major mass shares in LCD panels. Only minor shares are related to liquid crystal and ITO layers. On average, 20% ± 5% of LCD panels consist of polarizer foils, while 80% ± 5% are related to the glass substrate. More detailed information is provided in the table in the
Supporting Information S3.
4.1. (A) Analysis of LCD Panels
4.1.1. (A1) Indium and Tin Mass Fractions
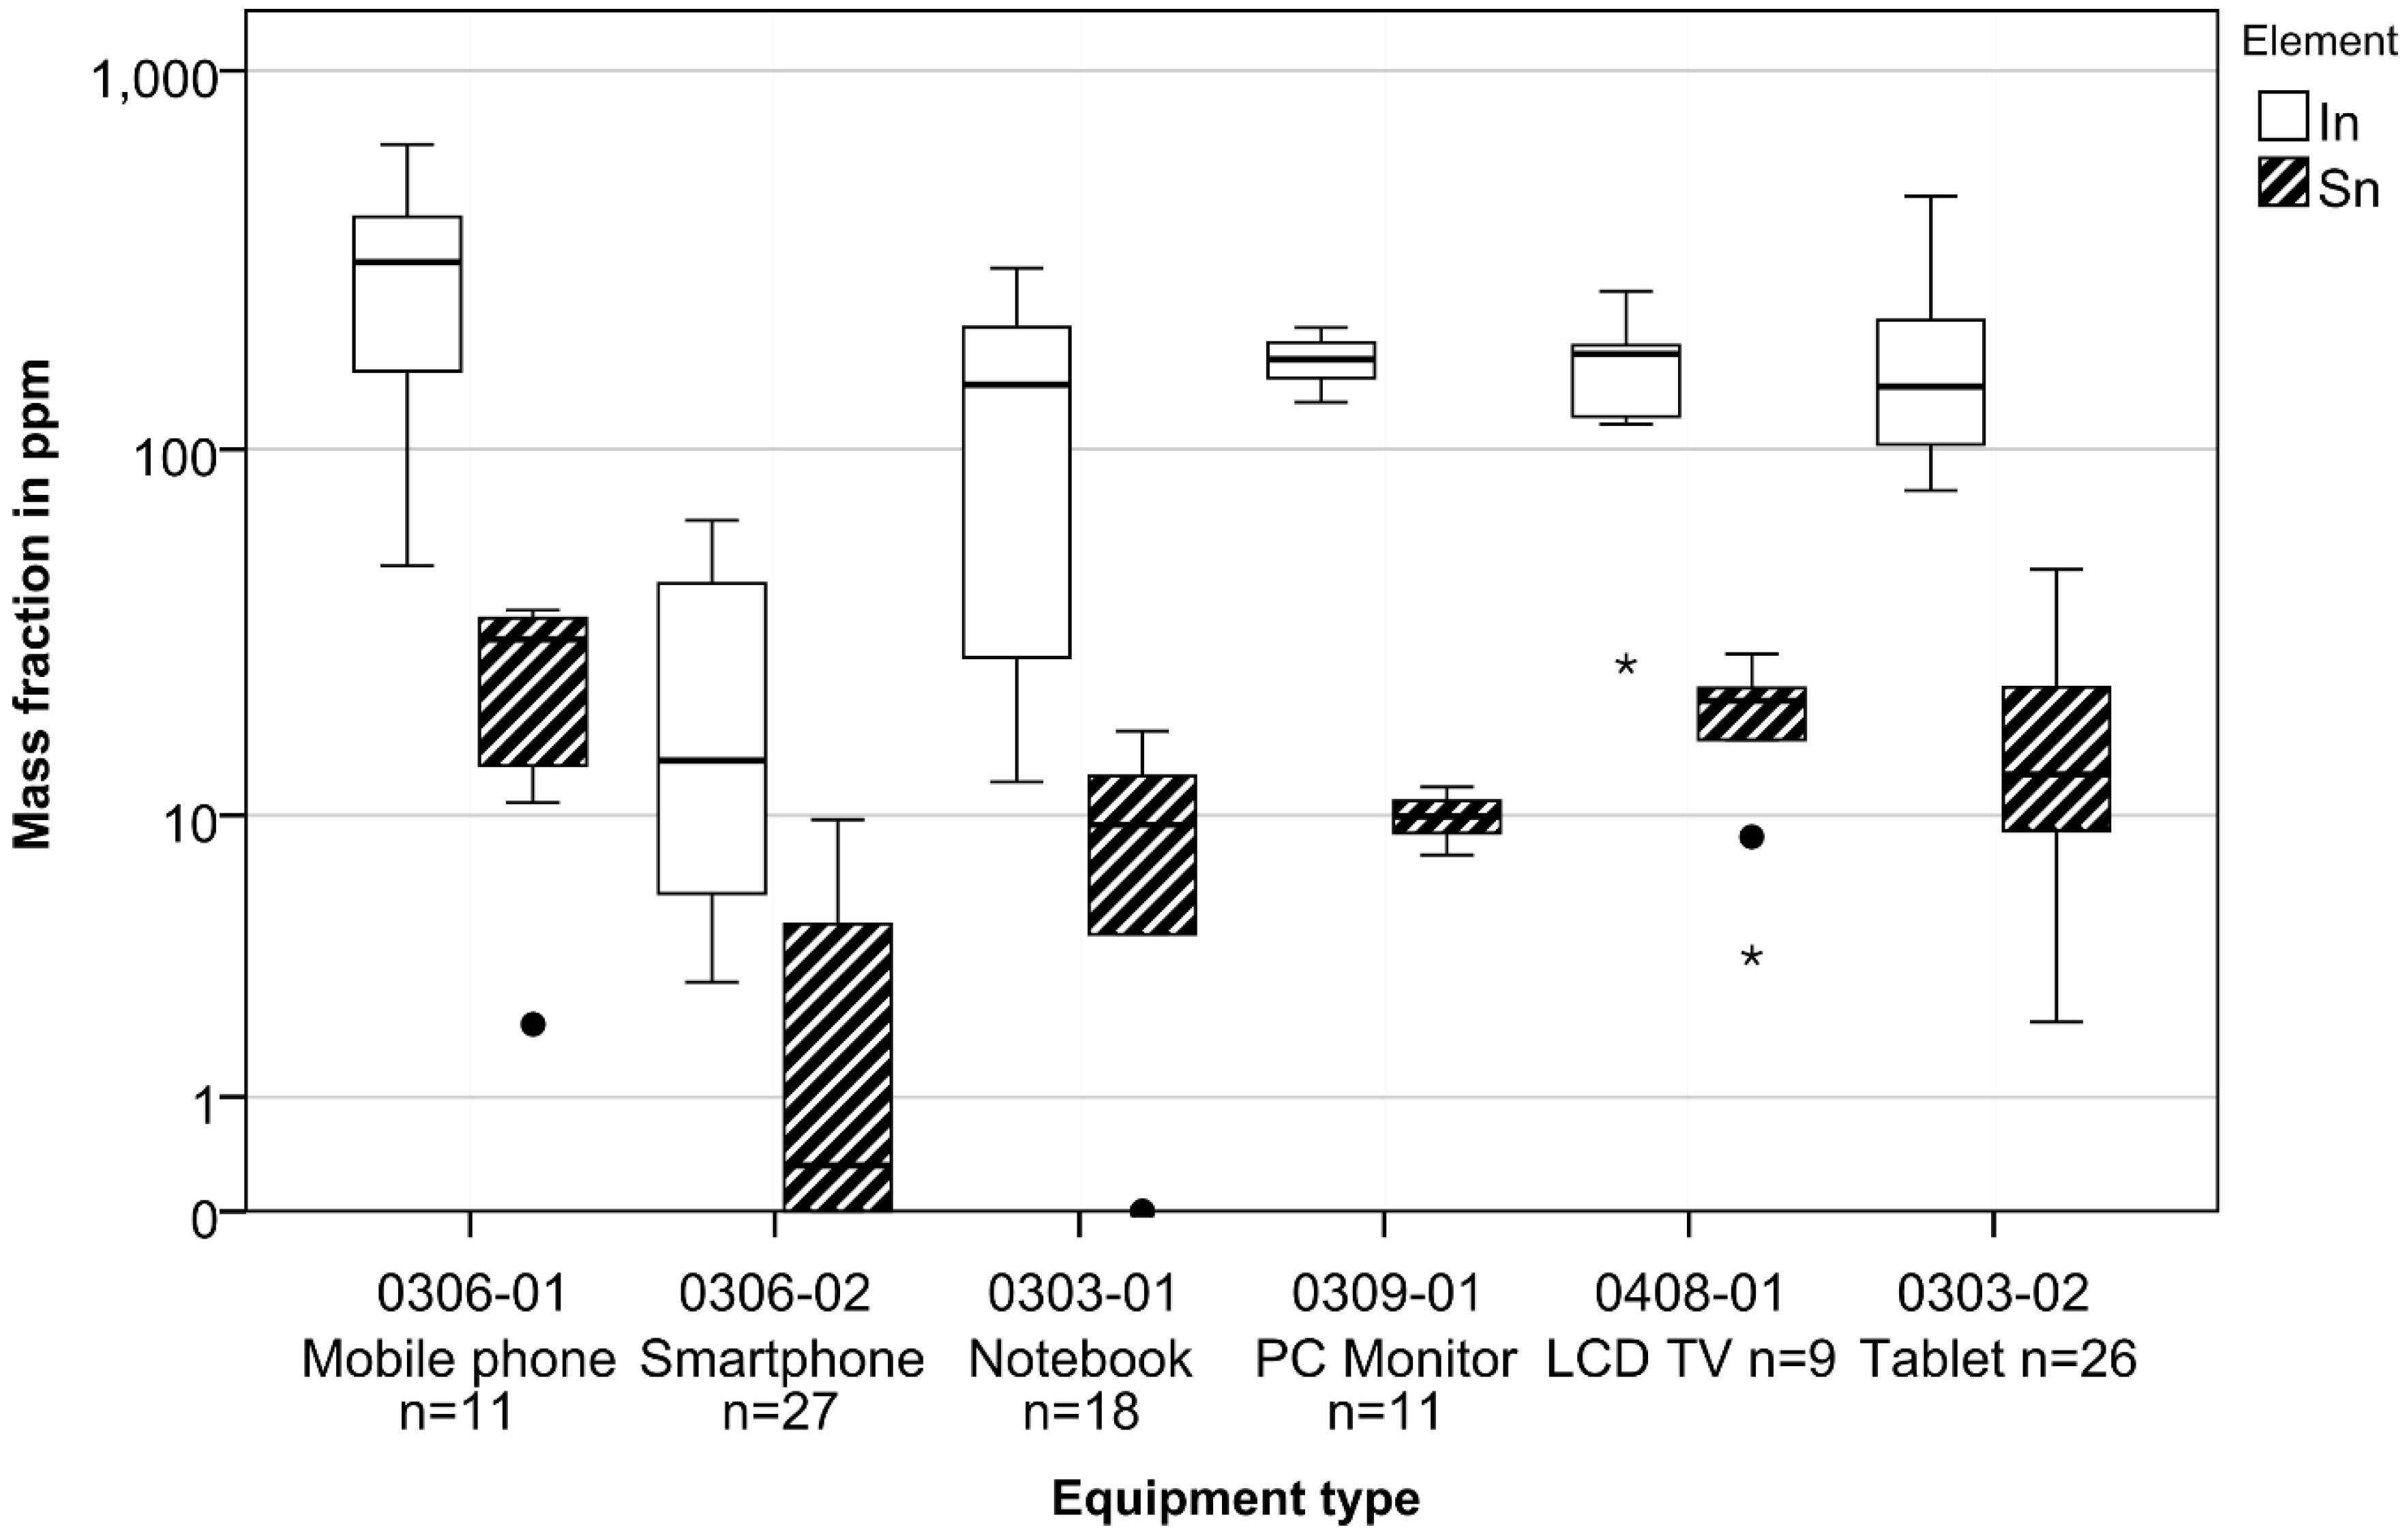
In
Figure 4, it is shown that the indium mass fraction in the LCD panels of various LCD devices varies between three and 660 ppm. By far the most indium per LCD panel mass is applied in mobile phones. Indium mass fractions in tablets, PC monitors, LCD TVs, and notebooks are between 10–500 ppm in a similar range. Significant lower mass fractions of indium were found in smartphones. A more detailed picture of the distribution and information about the indium mass per panel weight and screen is provided in the table and figures in the
Supporting Information S4–S6.
Tin and indium are applied with comparable relative shares. The ratio of tin to indium fluctuates slightly for mobile phones at 7% ± 2%, tablets at 9% ± 3%, PC monitors at 6% ± 1%, LCD TVs at 11% ± 2%, notebooks at 8% ± 2%, and smartphones at 9% ± 7%. The literature refers to a normal tin dopant concentration in indium between 8% and 10% to achieve sufficient conductivities. The results of the chemical analysis of the LCD panels from various LCD devices show varying indium contents.
Indium mass fractions vary widely within such equipment groups investigated as smartphones, mobile phones, and notebooks, but these variations do not show correlations for example to the screen size. An overview of the relationship between screen size and the indium mass fraction is shown in the figures in the
Supporting Information S5 and S6. While both the highest and some of the lowest values for indium concentrations are found in mobile phones, the results for smartphones and PC monitors show only small ranges. One explanation might be the different LCD technologies applied. For example, the mobile phones investigated had both monochrome and colored picture displays.
4.1.2. (A2) Toxic Heavy Metals + Sr Mass Fractions
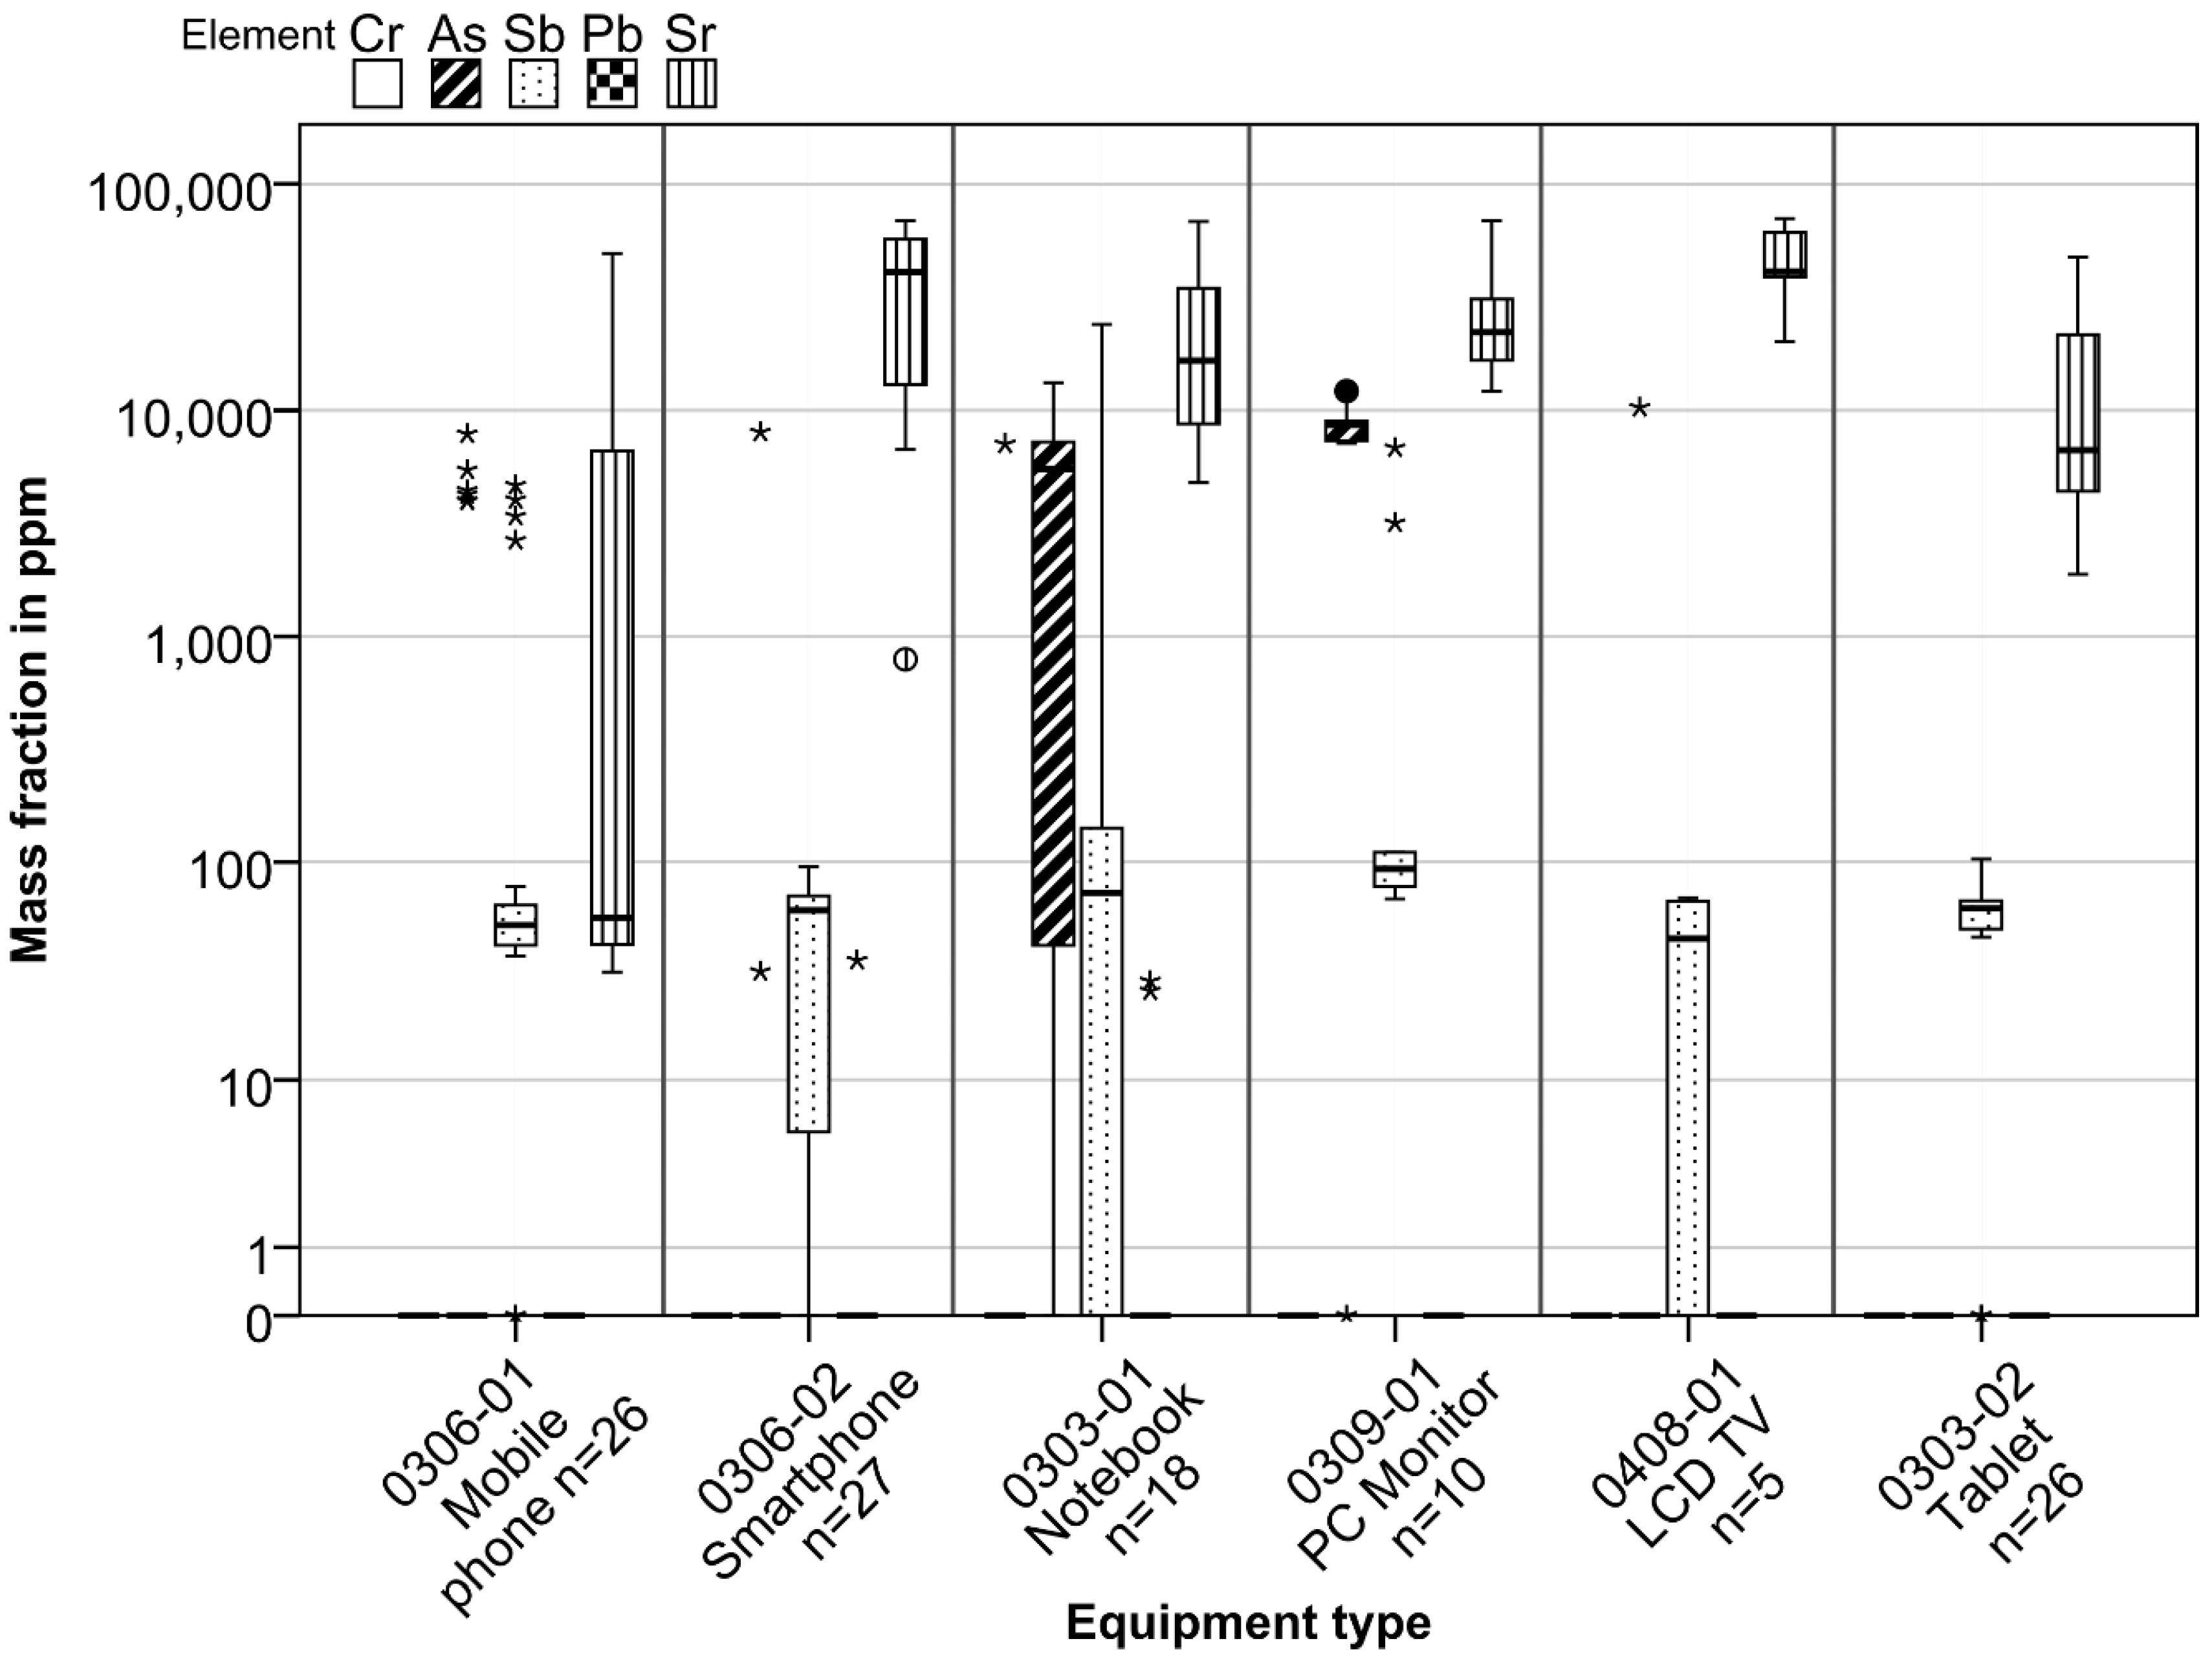
An XRF screening of the LCD panel glass for toxic heavy metals + Sr revealed the presence of As, Sb, Pb, and Sr, which might hinder the recycling of the glass fraction. Not all elements were detected in all equipment types nor in all single panels of the investigated equipment types. While the presence of strontium was verified for each LCD panel investigated in all equipment types, chromium could not be detected at all. Lead was found only in a few panels from smartphones and notebooks. Arsenic was found in only 20% of the mobile phones and LCD TVs but in no tablet LCD panels. Higher shares were determined for notebooks and in particular for PC monitors. Antimony was determined in most LCD panels, and lead was found only in a few panels from smartphones and notebooks. A full overview is given in the table in the
Supporting Information S8.
Figure 5 shows mass fractions of chemically analyzed toxic heavy metals + Sr in the panel glass of equipment types investigated. The figures in the
Supporting Information S9 show a detailed boxplot and histogram assessment for each element and all equipment types examined.
The highest mass fractions of the toxic heavy metals and Sr in all the LCD devices investigated were determined for strontium. Arsenic in considerable amounts was found only in notebooks and, to a lesser extent, in PC monitors. In other equipment types, higher mass fractions were determined in only a few of the panels analyzed. Antimony was determined in all equipment types with roughly the same mass fractions, though some showed greater fluctuations in measured values. No mass fractions could be identified for chromium, but in all devices measured there was a high level of error for this element. This is discussed in the text and figures in the
Supporting Information S11. Furthermore, chemical analyses carried out on the output materials generated by the composite separation test on tablets and smartphones revealed traces of Cr. A direct comparison of the results with other studies was hardly possible. Savvilotidou et al. [
25] compared the literature and their own data for heavy metals. Cr and As showed fluctuating results from 1 to 600 ppm in laptops, PC monitors, and mobile phones.
4.1.3. (A3) Time Trends
It was not possible to determine production dates for all the devices investigated. Therefore, only a reduced data set could be assessed. The only time trends for indium that could be interpreted were those for TV sets and notebooks, where a negative trend was noticeable. For tablets and smartphones, only short-term data sets were available, due to the recent market entry of such devices. Generally, a significant drop in the indium mass fractions over time did not reveal itself, and any potential reduction of applied indium and tin content could not be verified. Detailed information is shown in the figure in the
Supporting Information S7.
Furthermore, no time trend can be derived for toxic heavy metals + Sr. The peaks of the toxic heavy metals + Sr used occur randomly. A graphical depiction is shown in the figures in the
Supporting Information S10.
4.1.4. (A4) Polymer Types of Polarizer Foils
Cellulose acetate and cellulose triacetate were the highest rated matches (95%) in the ATR of the polymers library (Perkin Elmer), which was used to identify the polymer type. The match of a cellulose triacetate database spectrum and an exemplary measured spectrum is depicted in the figure in the
Supporting Information S12. Following these results, though based only on a small-scale evaluation, waste polarizer foils may represent an excellent input for plastic recycling if separated thoroughly from the glass substrate.
4.2. (B) Available Mass Flows of Indium, Polarizer Foils, and Substrate Glass
In order to establish LCD panel recycling, sufficient input material related to suitable LCD devices must be available. Therefore, potentially available mass flows of indium, polarizer foils, and the glass substrate were assessed.
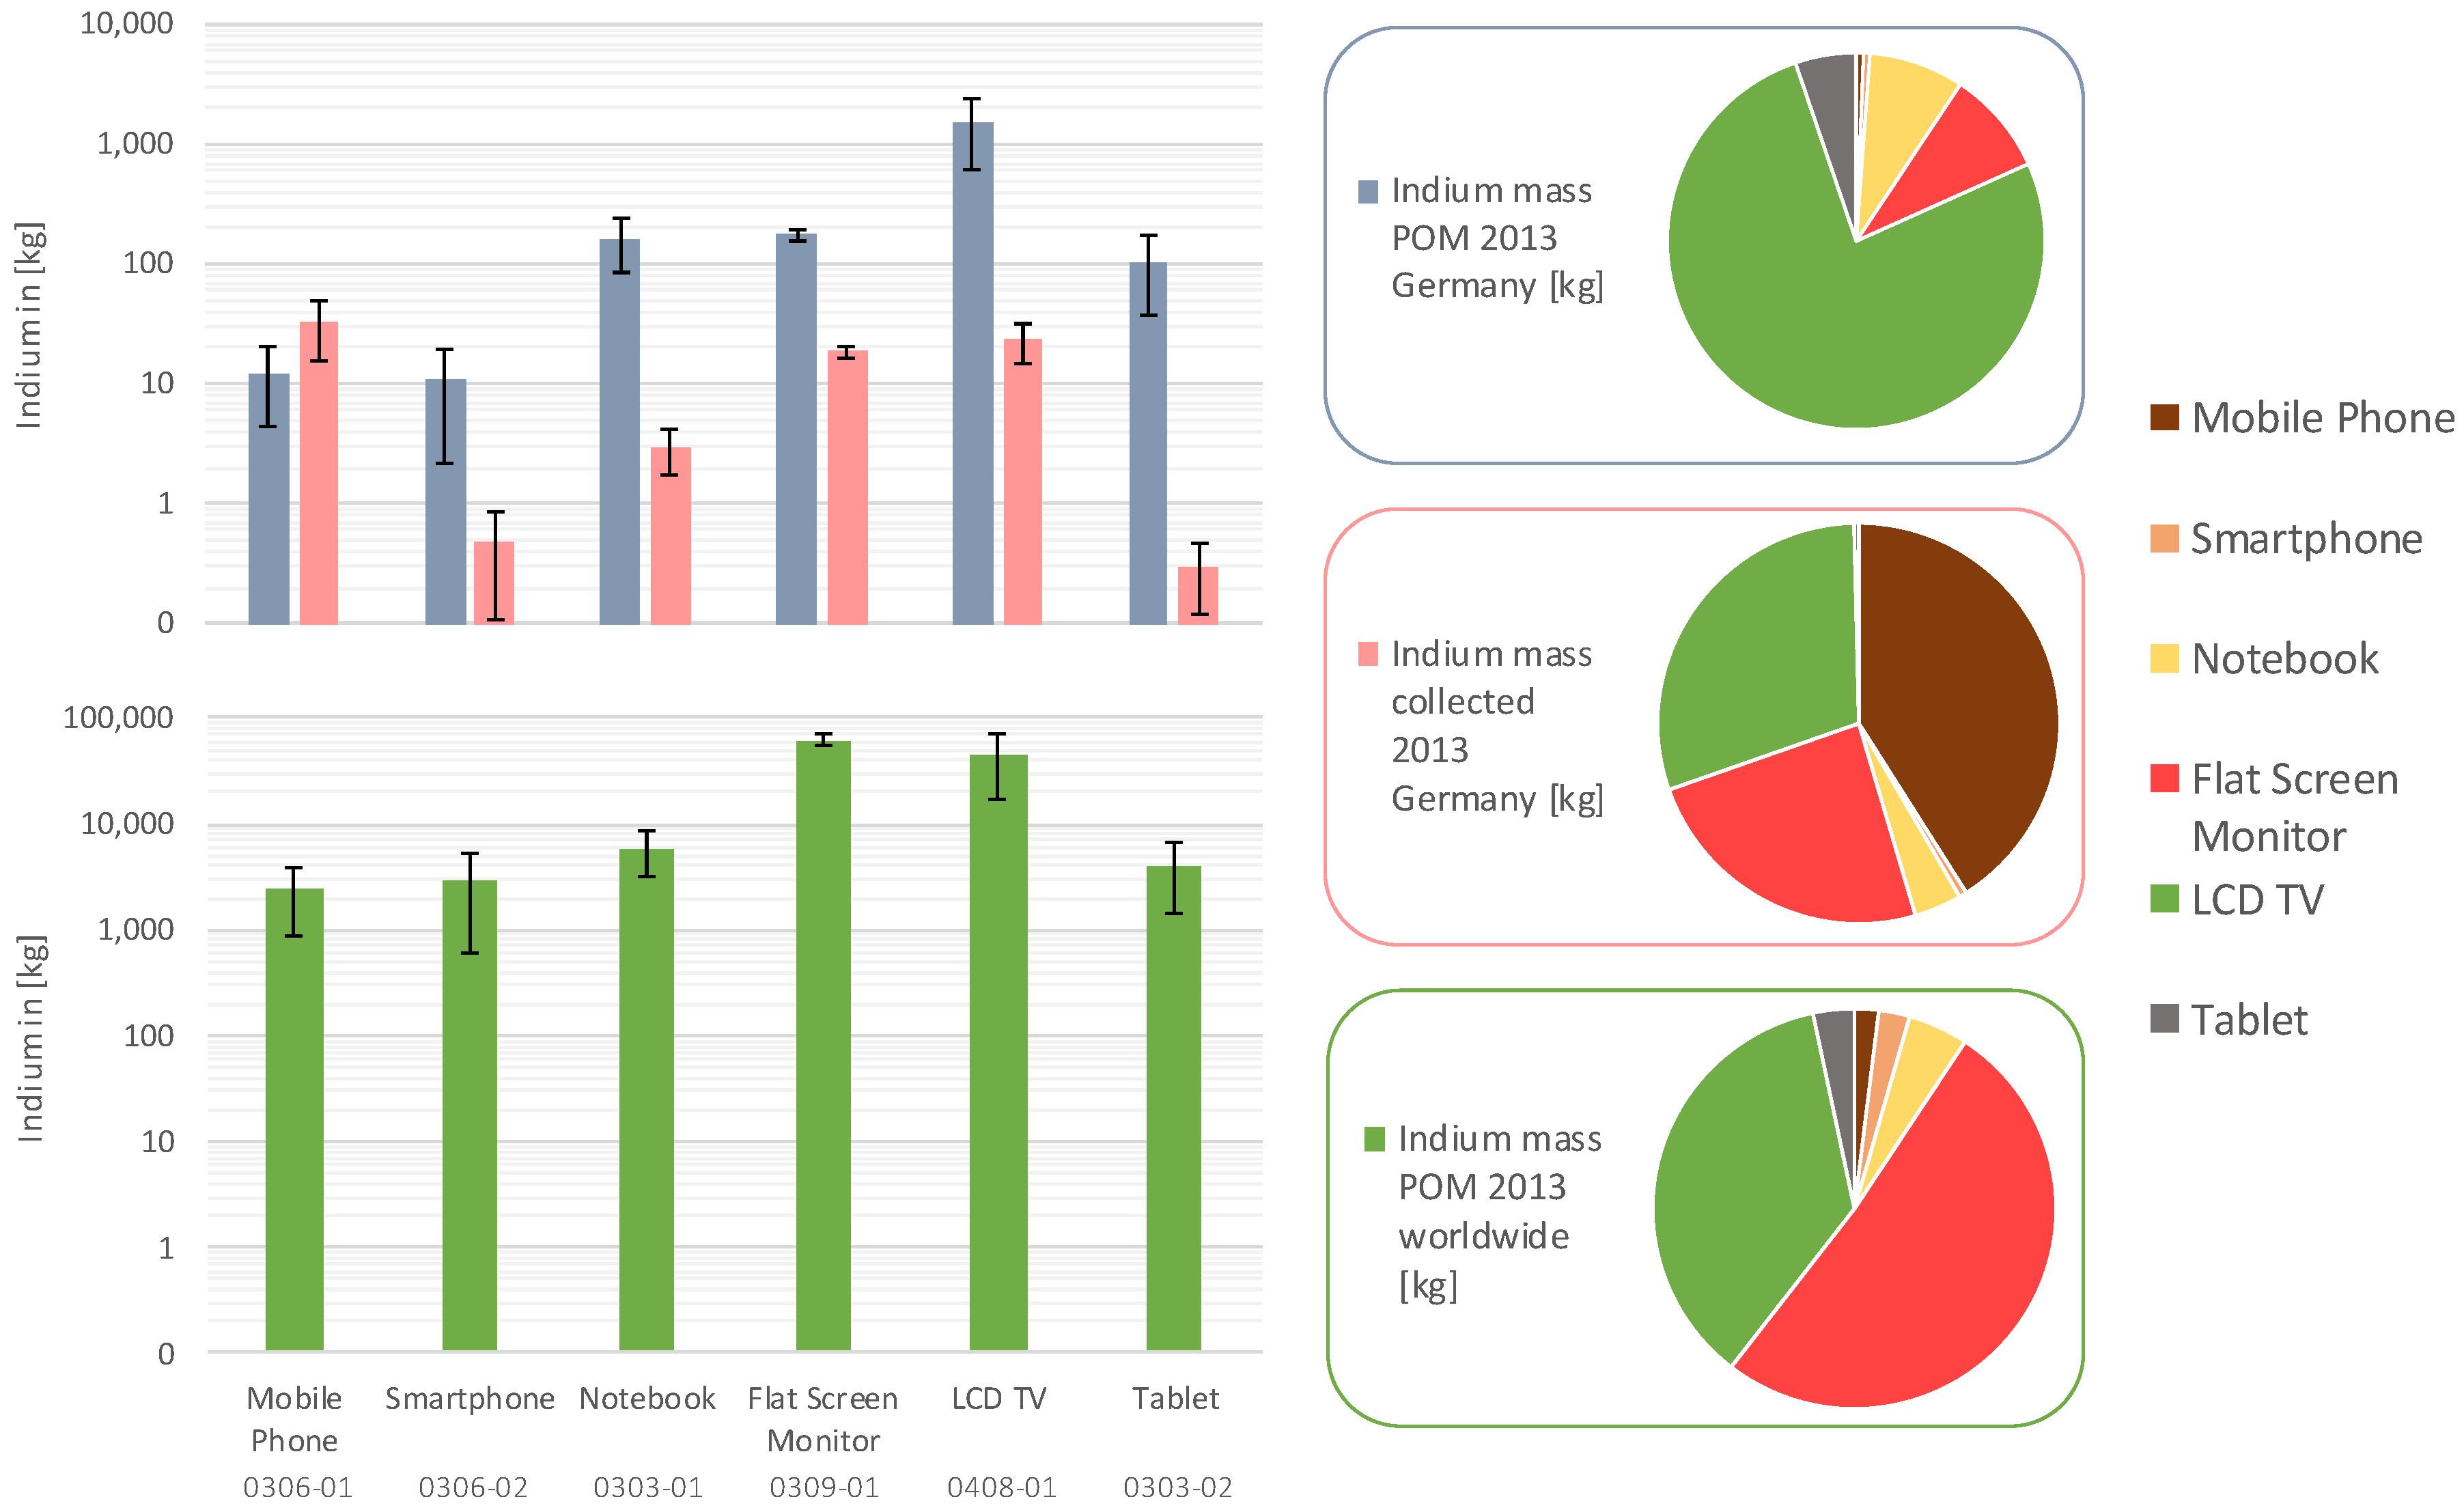
The results revealed a total indium flow of 2 ± 1 t POM in Germany in 2013, deriving from approximately 12,000 ± 7400 t of LCD panels. The quantities are correspondingly higher for POM worldwide with 120 ± 30 t indium (710,000 ± 220,000 t LCD panels).
In contrast, the collection rate for WEEE LCD panels in Germany is much lower, with 390 ± 70 t. Here, only 0.08 ± 0.02 t indium was collected in Germany in 2013. The complete calculation is shown in the table in the
Supporting Information S13.
Figure 6 shows the differentiated WEEE and POM data for indium from the LCD panels for each equipment type investigated. Additional mass data for the polarizer foils and the glass substrate is shown in the figures in the
Supporting Information S14.
The differences in the indium share of the various equipment types of the total mass are remarkable. While in Germany the POM indium mass flow is dominated by LCD TVs, followed by far lower quantities of LCD monitors, notebooks, and tablets, the worldwide mass flow is mainly driven by LCD panels from flat screen monitors and LCD TVs. The share of tablets, notebooks, smartphones, and mobile phones is much lower.
The indium mass flow relating to WEEE LCD devices collected for recycling purposes derives mainly from mobile phones, LCD TVs, and flat screen monitors. The collection of notebooks contributes to about 4% to the total indium flow. Smartphones and tablets play a minor role for indium flows (<1%) in the WEEE streams as no large-scale collection of these devices currently takes place yet. Consequently, recovery strategies should mainly focus on those equipment types with the highest potential.
4.3. (C) Evaluation of the Newly Developed Recycling Procedure for LCD Panels
4.3.1. Material Flow Analysis (MFA)
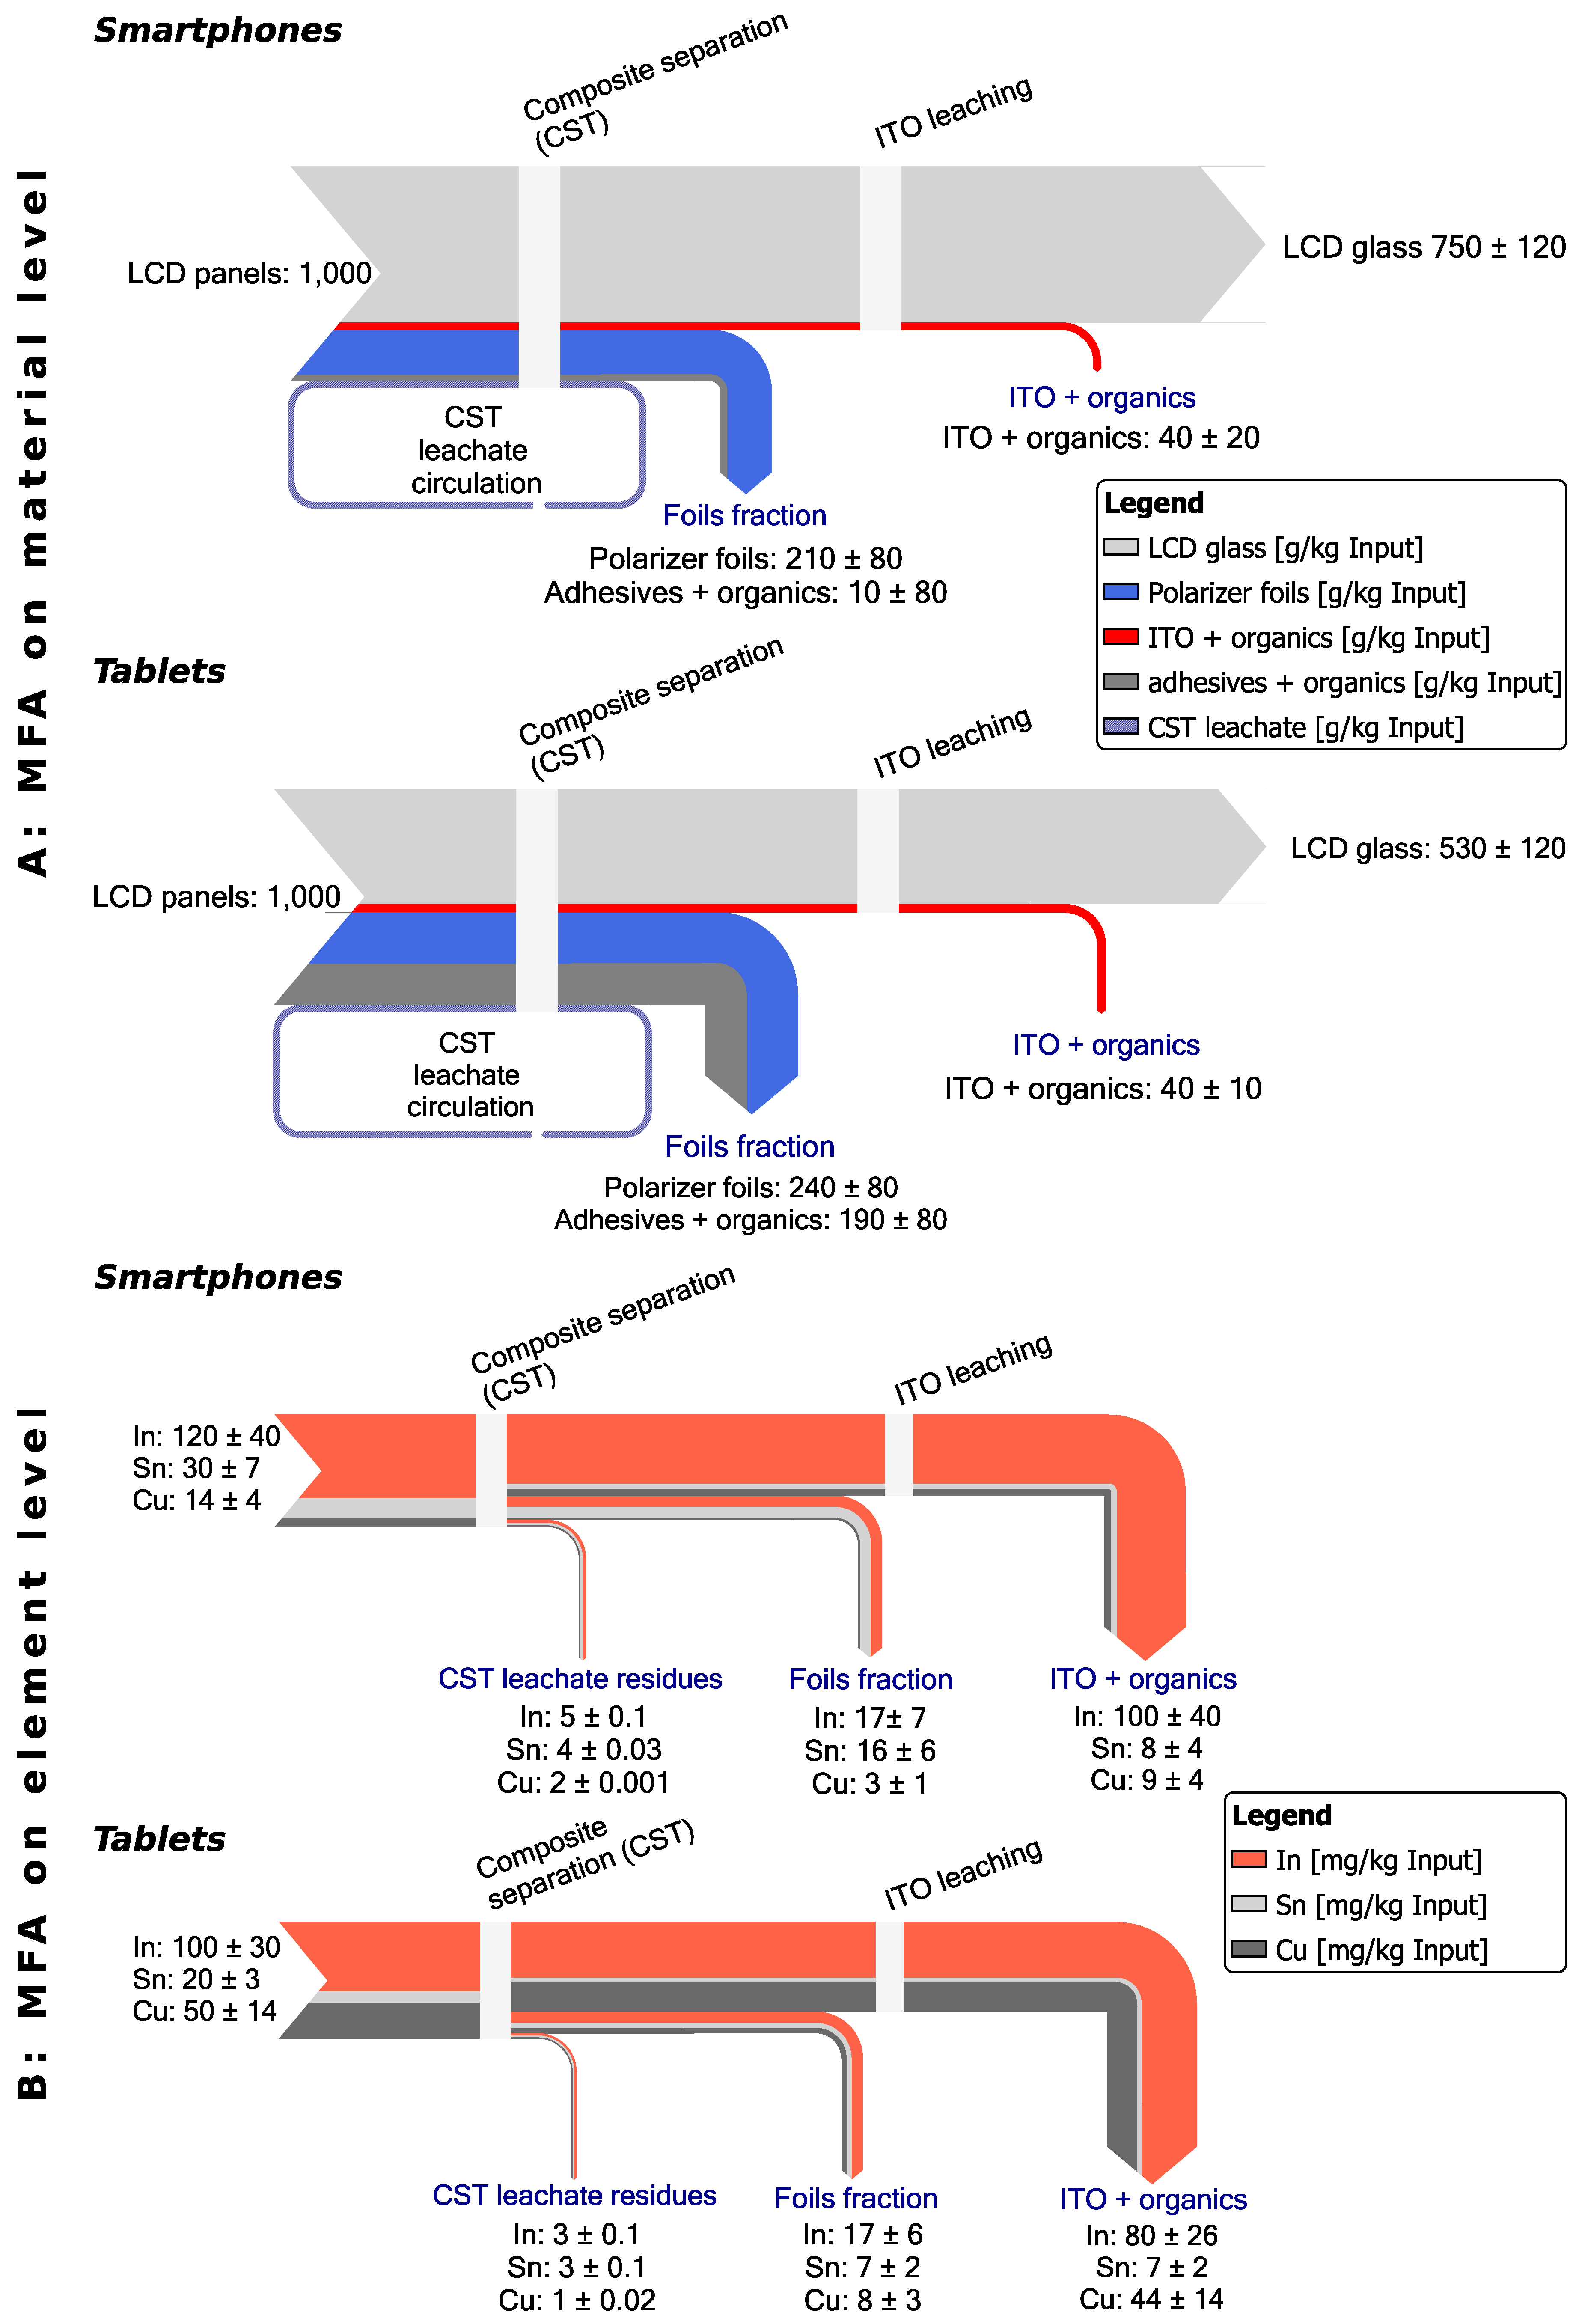
The newly developed recycling approach consists of a composite separation test (CST) and dissolution of the ITO from the glass substrate conducted on samples taken from smartphones and tablets. For both steps, a mass flow analysis was carried out, depicted on a material level in a percentage and on an element level as mg/kg input material in order to assess the quality of the generated output fractions.
Figure 7 shows the results.
The mass flow analysis for smartphones and tablets shows that all polarizer foils were separated successfully in a separate output. The same applies to the glass substrate. After the base leaching step, the glass residues were leached with acid to remove all surface applied substances. This allows a pure LCD glass fraction to be provided. Due to reactions during the base leaching, the separated liquid phase represents an indium concentrate with organics like liquid crystals, adhesives, or potentially converted polarizer foils. Compared to the smartphone samples, the mass flow of tablets shows a lower overall quantity of glass and comparable quantities of ITO and polarizer foils. Only the organic material, which could consist of adhesives or degenerated polarizer foils, has a much higher share in the tablet test with 190 ± 80 g/kg input material compared to 10 ± 80 g/kg in smartphones.
The material flow analysis on an elemental level shows that a selective separation of indium and copper is possible. About 80% of the total indium was transferred to the ITO output in the composite separation test for smartphones and tablets. Only minor masses were found in the foils fraction and the leachate. Interestingly, tin was not selectively separated and was distributed to all output fractions.
Table 2 shows the transfer coefficients for these three elements.
4.3.2. Cross Contaminations through Toxic Heavy Metals + Sr
Not only the flows of strategically important elements like indium and tin or valuable materials like copper are of interest. Flows of possibly present toxic heavy metals + Sr must be investigated as well. Although these materials are supposed to be applied only to the glass, traces can be washed out and transferred to the generated output fractions. In total 1400 ± 300 μg As/kg input material, 20,000 ± 8000 μg Cr/kg input, 450 ± 70 μg Pb/kg input, 9400 ± 2500 μg Sb/kg input, and 38,000 ± 6000 μg Sr/kg input were dissolved and distributed in the separation test for smartphones. For tablets, 400 ± 40 μg As/kg input, 500 ± 100 μg Cr/kg input, 350 ± 70 μg Pb/kg input, 4200 ± 1400 μg Sb/kg input, and 55,000 ± 10,000 μg Sr/kg input was mobile in the separation test. Sb was mostly transferred to the foils fraction as it was apparently applied to the polarizer foils. Pb was not found in the indium-rich output fraction. Further general statements cannot be deduced. The distribution of most of the toxic heavy metals + Sr into the various output fractions seems to be random.
Table 2 shows the transfer coefficients of all substances investigated and chemically analyzed in both composite separation tests with smartphones and tablets.
4.3.3. Transformation of Polarizer Foils
The base leaching process might affect the quality of the polarizer foils. A comparison of the flexibility of the untreated polarizer foils with the flexibility of those from the separation tests revealed that the treated foils were much more brittle. Therefore, 50 base-treated polarizer foils were investigated again by ATR-FT-IR. Only seven out of 50 treated foils showed a spectrum of cellulose triacetate, while the majority turned out to be a material like cellophane, which results from hydrolysis of the cellulose triacetate.
As polymer recycling was not a focus of this study, only minor work was performed to improve the quality of treated polarizer foils. One approach for optimization involves a shorter base treatment or the application of lower base concentrations. However, the authors do not expect that base treatment can be applied without the danger of hydrolyzing the target polymer, which would dramatically reduce the material value for recycling.
Therefore, another approach was tested on a small laboratory scale, using a proprietary CreaSolv
® formulation [
51]. Treatment of LCD devices with this solvent dissolved the polarizer films and enabled a separation of foil free glass substrates. After evaporation of the solvent from the polymer solution, the resulting recycled polarizer films turned out to be non-hydrolyzed cellulose acetate. Such a solvent based treatment step could be integrated into a future recycling concept for LCDs as it enables closed-loop-usage of the solvent and the production of purified recycled polymers if the polymer solution is subjected to the appropriate filters before drying. However, the suitability and economic feasibility of such an approach need to be investigated in more detail.
4.3.4. Upscaling with a Recommended Recycling Process for LCD Panels
The results presented here provide necessary data and offer an analysis of the recycling potential of the different components. A possible recycling process line for LCD panels is summarized in
Figure 8.
The pre-crushing step is supposed to break only the glass substrate, leaving the polarizer foils intact. The practicability of this approach was successfully tested in pre-tests with a mangle for textiles. The foils can then be sieved off after the base-leaching step as their cross section is bigger compared to the glass fragments. Next, an explicit washing step of the separated polarizer foils is introduced to rinse off any potentially remaining traces of ITO, which could lead to a lower transfer of indium in the output fraction. Furthermore, the base neutralized with the wash water can be forwarded to a subsequent indium recovery. The above discussed solvent approach for the separation of glass and polarizer foils could replace the base leaching and the washing of the foils without affecting the other unit operations.
5. Conclusions
WEEE LCD devices represent by far the most important source of secondary indium from the consumer sector. The highest indium mass fraction was determined in LCD panels from mobile phones and the least indium was found in LCD panels from smartphones. Therefore, recovery strategies should focus on those equipment types with both the highest mass fraction and the highest mass flow. The available mass flow is directly related to the number of newly sold devices POM and the number of WEEE devices and therefore varies regionally and temporally. Worldwide, the highest POM indium flows in 2013 originated from LCD monitors, and in Germany these originated from LCD TVs. In contrast, the highest WEEE related indium flows in Germany in 2013 were assigned to mobile phones. Due to the rapid development of new LCD equipment types and market changes, WEEE indium flows are at variance with the equipment POM. Currently, WEEE indium potential cannot cover the production demands of new WEEE LCD devices. In Germany, the indium mass incorporated in equipment POM is 25× higher than the indium mass in WEEE return flows. From a long-term perspective, this gap will be reduced by market saturation. Sales of LCD TVs and LCD monitors are stagnating worldwide, including in Germany. With the exception of smartphones, even for very young equipment types like tablets, market saturation is noticeable. Future available indium masses will probably not be affected by decreasing mass fractions. A general time trend was not evidenced in this study. Still, generally increasing screen sizes will lead to a higher indium demand per device.
The new recycling approach for LCD panels presented demonstrates the possibility of the selective separation of the glass substrate, polarizer foils, and the elements indium and copper into an individual output. Tin, however, dissipates to all output fractions, resulting in the loss of this resource. Toxic heavy metals + Sr, mostly strontium and arsenic, that were present in the glass were partially dissolved and distributed to all output fractions. Only antimony was concentrated in the foil fractions, as it had obviously been applied to the polarizer foils as a flame retardant. The polarizer foils consist of cellulose acetate, which is a valuable material if not degraded during the treatment process. A major fraction of the LCD panels is the glass substrate, which contains small quantities of toxic heavy metals + Sr. Whether the present mass fractions exceed any limits for being processed in glass recycling must be clarified in further research. For a full circular economy, a dilution with other glass grades just to enable recycling is not preferable. However, an economically feasible recycling of LCD panels is not possible without an appropriate route for the glass substrate fraction. The design for recycling could provide the basis for a successful recycling of LCD panels.
Supplementary Materials
Supplementary materials are available online.
Acknowledgments
This work was funded by the German Federal Ministry of Education and Research (BMBF) (UPgrade—Project reference number 033R087A).
Author Contributions
Maximilian Ueberschaar, Daniel Jalalpoor, and Vera Susanne Rotter conceived and designed the indium and tin measurements in LCD panels. Maximilian Ueberschaar and Daniel Jalalpoor performed the indium and tin measurements. Maximilian Ueberschaar conceived and designed the toxic heavy metals + Sr measurements in the LCD panel glass. Nora Kaup performed these measurements. Martin Schlummer conceived, designed and performed the analysis of the used plastic types in polarizer foils. Maximilian Ueberschaar and Martin Schlummer conceived and designed the LCD composite separation test. Maximilian Ueberschaar performed the tests and conducted the chemical analyses for quality assurance. Maximilian Ueberschaar performed the evaluation of data, extrapolation of available mass flows, the derivation of time trends and writing of this article.
Conflicts of Interest
The authors declare no conflict of interest.
References
- European Commission. Critical raw materials for the EU. Ad-hoc Work. Gr. Defin. Crit. raw Mater. 2010, 1–84. [Google Scholar]
- European Commission. Report on critical raw materials for the EU. Ad-hoc Work. Gr. Defin. Crit. raw Mater. 2014, 41. [Google Scholar]
- Hatayama, H.; Tahara, K. Criticality Assessment of Metals for Japan’s Resource Strategy. Mater. Trans. 2014, 56, 229–235. [Google Scholar] [CrossRef]
- Graedel, T.E.; Reck, B.K. Six Years of Criticality Assessments: What Have We Learned So Far? J. Ind. Ecol. 2016, 20, 692–699. [Google Scholar] [CrossRef]
- Licht, C.; Peiró, L.T.; Villalba, G. Global Substance Flow Analysis of Gallium, Germanium, and Indium: Quantification of Extraction, Uses, and Dissipative Losses within their Anthropogenic Cycles. J. Ind. Ecol. 2015, 19, 890–903. [Google Scholar] [CrossRef]
- U.S. Geological Survey. Mineral Commodities Summaries; U.S. Geological Survey: Menlo Park, CA, USA, 2015.
- Li, Y.; Liu, Z.; Li, Q.; Liu, Z.; Zeng, L. Recovery of indium from used indium-tin oxide (ITO) targets. Hydrometallurgy 2011, 105, 207–212. [Google Scholar] [CrossRef]
- Nakashima, K.; Kumahara, Y. Effect of tin oxide dispersion on nodule formation in ITO sputtering. Vacuum 2002, 66, 221–226. [Google Scholar] [CrossRef]
- Swain, B.; Mishra, C.; Hong, H.S.; Cho, S.-S. Beneficiation and recovery of indium from liquid-crystal-display glass by hydrometallurgy. Waste Manag. 2016, 57, 207–214. [Google Scholar] [CrossRef] [PubMed]
- Chou, W.-L.; Huang, Y.-H. Electrochemical removal of indium ions from aqueous solution using iron electrodes. J. Hazard. Mater. 2009, 172, 46–53. [Google Scholar] [CrossRef] [PubMed]
- Wang, H.-Y. The effect of the proportion of thin film transistor–liquid crystal display (TFT–LCD) optical waste glass as a partial substitute for cement in cement mortar. Constr. Build. Mater. 2011, 25, 791–797. [Google Scholar] [CrossRef]
- Zhan, L.; Xu, Z. State-of-the-Art of Recycling E-Wastes by Vacuum Metallurgy Separation. Environ. Sci. Technol. 2014, 48, 14092–14102. [Google Scholar] [CrossRef] [PubMed]
- Wang, R.; Chen, Y.; Xu, Z. Recycling Acetic Acid from Polarizing Film of Waste Liquid Crystal Display Panels by Sub/Supercritical Water Treatments. Environ. Sci. Technol. 2015, 49, 5999–6008. [Google Scholar] [CrossRef] [PubMed]
- Sun, Z.; Cao, H.; Xiao, Y.; Sietsma, J.; Jin, W.; Agterhuis, H.; Yang, Y. Toward Sustainability for Recovery of Critical Metals from Electronic Waste: The Hydrochemistry Processes. ACS Sustain. Chem. Eng. 2017, 5, 21–40. [Google Scholar] [CrossRef]
- Ciacci, L.; Reck, B.K.; Nassar, N.T.; Graedel, T.E. Lost by Design. Environ. Sci. Technol. 2015, 49, 9443–9451. [Google Scholar] [CrossRef] [PubMed]
- Zeng, X.; Wang, F.; Sun, X.; Li, J. Recycling Indium from Scraped Glass of Liquid Crystal Display: Process Optimizing and Mechanism Exploring. ACS Sustain. Chem. Eng. 2015, 3, 1306–1312. [Google Scholar] [CrossRef]
- Rasenack, K.; Goldmann, D. Herausforderungen des Indium-Recyclings aus LCD-Bildschirmen und Lösungsansätze. In Recycling und Rohstoffe, Band 7; Thomé-kozmiensky, K.J., Ed.; Vivis Verlag: Neuruppin, Germany, 2014. [Google Scholar]
- Rocchetti, L.; Amato, A.; Beolchini, F. Recovery of indium from liquid crystal displays. J. Clean. Prod. 2014, 116, 299–305. [Google Scholar] [CrossRef]
- Silveira, A.V.M.; Fuchs, M.S.; Pinheiro, D.K.; Tanabe, E.H.; Bertuol, D.A. Recovery of indium from LCD screens of discarded cell phones. Waste Manag. 2015, 45, 334–342. [Google Scholar] [CrossRef] [PubMed]
- Virolainen, S.; Ibana, D.; Paatero, E. Recovery of indium from indium tin oxide by solvent extraction. Hydrometallurgy 2011, 107, 56–61. [Google Scholar] [CrossRef]
- Fontana, D.; Forte, F.; De Carolis, R.; Grosso, M. Materials recovery from waste liquid crystal displays: A focus on indium. Waste Manag. 2015, 45, 325–333. [Google Scholar] [CrossRef] [PubMed]
- Lee, C.H.; Jeong, M.K.; Fatih Kilicaslan, M.; Lee, J.H.; Hong, H.S.; Hong, S.J. Recovery of indium from used LCD panel by a time efficient and environmentally sound method assisted HEBM. Waste Manag. 2013, 33, 730–734. [Google Scholar] [CrossRef] [PubMed]
- Kato, T.; Igarashi, S.; Ishiwatari, Y.; Furukawa, M.; Yamaguchi, H. Separation and concentration of indium from a liquid crystal display via homogeneous liquid-liquid extraction. Hydrometallurgy 2013, 137, 148–155. [Google Scholar] [CrossRef]
- He, Y.; Ma, E.; Xu, Z. Recycling indium from waste liquid crystal display panel by vacuum carbon-reduction. J. Hazard. Mater. 2014, 268, 185–190. [Google Scholar] [CrossRef] [PubMed]
- Savvilotidou, V.; Hahladakis, J.N.; Gidarakos, E. Determination of toxic metals in discarded Liquid Crystal Displays (LCDs). Resour. Conserv. Recycl. 2014, 92, 108–115. [Google Scholar] [CrossRef]
- Völker, M. Metallurgische Rückgewinnung von Indium, Gallium und Germanium aus Elektronikschrott und Entwicklung entsprechender Aufarbeitungsmethoden für die Verwertungsindustrie. Available online: http://www.veu.de/index.php?article_id=28&clang=0&show=detail&id=294&search=16040. (accessed on 12 February 2013).
- Götze, R.; Rotter, S.V. Challenges for the Recovery of Critical Metals from Waste Electronic Equipment—A Case Study of Indium in LCD Panels. In Proceedings of the 2012 Electronics Goes Green 2012+, Berlin, Germany, 9–12 September 2012.
- Zhang, K.; Wu, Y.; Wang, W.; Li, B.; Zhang, Y.; Zuo, T. Recycling indium from waste LCDs: A review. Resour. Conserv. Recycl. 2015, 104, 276–290. [Google Scholar] [CrossRef]
- Zhang, L.; Xu, Z. A Review of Current Progress of Recycling Technologies for Metals from Waste Electrical and Electronic Equipment. J. Clean. Prod. 2016, 127, 19–36. [Google Scholar] [CrossRef]
- Chancerel, P.; Rotter, V.S.; Ueberschaar, M.; Marwede, M.; Nissen, N.F.; Lang, K.-D. Data availability and the need for research to localize, quantify and recycle critical metals in information technology, telecommunication and consumer equipment. Waste Manag. Res. 2013, 31, 3–16. [Google Scholar] [CrossRef] [PubMed]
- Ylä-Mella, J.; Pongrácz, E. Drivers and Constraints of Critical Materials Recycling: The Case of Indium. Resources 2016, 5, 34. [Google Scholar] [CrossRef]
- Li, J.; Zeng, X.; Chen, M.; Ogunseitan, O.A.; Stevels, A. ‘control-Alt-Delete’: Rebooting Solutions for the E-Waste Problem. Environ. Sci. Technol. 2015, 49, 7095–7108. [Google Scholar] [CrossRef]
- Zeng, X.; Li, J. Measuring the recyclability of e-waste: An innovative method and its implications. J. Clean. Prod. 2016, 131, 156–162. [Google Scholar] [CrossRef]
- EMPA & SWICO. Entsorgung von Flachbildschirmen in der Schweiz; EMPA: St. Gallen; SWICO: Zürich, Switzerland, 2011. [Google Scholar]
- Westerdahl, J.; Belhaj, M.; Rydberg, T.; Munthe, J.; Darbra, R.M.; Àgueda, A.; Heise, S.; Ziyang, L. Additives and Other Hazardous Compounds in Electronic Products and Their Waste. In Global Risk-Based Management of Chemical Additives I; Springer: Berlin/Heidelberg, Germany, 2011; Volume 18, pp. 57–81. [Google Scholar]
- Jalalpoor, D.; Götze, R.; Rotter, V.S. Einsatz und Rückgewinnungspotential von Indium in LCD Geräten. Müll Abfall 2013, 6, 312–319. [Google Scholar]
- Chancerel, P.; Marwede, M.; Nissen, N.F.; Lang, K.-D. Estimating the quantities of critical metals embedded in ICT and consumer equipment. Resour. Conserv. Recycl. 2015, 98, 9–18. [Google Scholar] [CrossRef]
- Edelstein, D.L. Minerals Yearbook 2008; U. S. Geological Survey: Reston, VA, USA, 2010.
- Yoshida, H.; Izhar, S.; Nishio, E.; Utsumi, Y.; Kakimori, N.; Asghari Feridoun, S. Recovery of indium from TFT and CF glasses in LCD panel wastes using sub-critical water. Sol. Energy Mater. Sol. Cells 2014, 125, 14–19. [Google Scholar] [CrossRef]
- Hall, W.J.; Williams, P.T.; Takahashi, K.; Sasaki, A.; Dodbiba, G.; Sadaki, J.; Sato, N.; Fujita, T. Recovering Indium from the Liquid Crystal Display of Discarded Cellular Phones by Means of Chloride-Induced Vaporization at Relatively Low Temperature. Metall. Mater. Trans. A 2009, 40, 891–900. [Google Scholar]
- Rocchetti, L.; Amato, A.; Fonti, V.; Ubaldini, S.; De Michelis, I.; Kopacek, B.; Vegliò, F.; Beolchini, F. Cross-current leaching of indium from end-of-life LCD panels. Waste Manag. 2015, 42, 180–187. [Google Scholar] [CrossRef]
- Yang, J.; Retegan, T.; Ekberg, C. Indium recovery from discarded LCD panel glass by solvent extraction. Hydrometallurgy 2013, 137, 68–77. [Google Scholar] [CrossRef]
- Yang, J.; Ekberg, C.; Retegan, T. Optimization of indium recovery and separation from LCD waste by solvent extraction with bis(2-ethylhexyl) phosphate (D2EHPA). Int. J. Chem. Eng. 2014, 2014, 186768. [Google Scholar] [CrossRef]
- Savvilotidou, V.; Hahladakis, J.N.; Gidarakos, E. Leaching capacity of metals–metalloids and recovery of valuable materials from waste LCDs. Waste Manag. 2015, 45, 314–324. [Google Scholar] [CrossRef] [PubMed]
- Cemix. Consumer Electronics Marktindex Deutschland (CEMIX) 2013; Bundesverband Technik des Einzelhandels (BVT): Köln, Germany, 2013. [Google Scholar]
- Statista. Prognose zum Absatz von Tablets, Laptops und Desktop-PCs weltweit von 2010–2015. Available online: https://de.statista.com/statistik/daten/studie/183419/umfrage/prognose-zum-weltweiten-absatz-von-pcs-nach-kategorie/ (accessed on 30 September 2015).
- Statista. Absatz von LCD-Fernsehgeräten Weltweit von 2007 bis 2015. Available online: https://de.statista.com/statistik/daten/studie/193723/umfrage/absatz-von-lcd-fernsehern-weltweit/ (accessed on 02 October 2015).
- Stiftung Elektro-Altgeräte Register Rücknahmemengen je Sammelgruppe. Available online: https://www.stiftung-ear.de/service_und_aktuelles/kennzahlen/ruecknahmemengen_je_sammelgruppe (accessed on 12 January 2015).
- Chancerel, P. Substance Flow Analysis of the Recycling of Small Waste Electrical and Electronic Equipment. Doctoral Thesis, Technical University Berlin, Berlin, Germany, 2010. [Google Scholar]
- Schischke, K.; Stobbe, L.; Scheiber, S.; Oerter, M.; Nowak, T.; Schloesser, A.; Riedel, H.; Nissen, N.F. Disassembly Analysis of Slates: Design for Repair and Recycling Evaluation; Fraunhofer IZM: Berlin, Germany, 2013. [Google Scholar]
- Schlummer, M.; Mäurer, A.; Leitner, T.; Spruzina, W. Recycling of flame-retarded plastics from waste electric and electronic equipment (WEEE). Waste Manag. Res. 2006, 24, 573–583. [Google Scholar] [CrossRef] [PubMed]
© 2017 by the authors. Licensee MDPI, Basel, Switzerland. This article is an open access article distributed under the terms and conditions of the Creative Commons Attribution (CC BY) license ( http://creativecommons.org/licenses/by/4.0/).


 ,
, 


