Article

Enhancing the Strength and the Environmental Performance of Concrete with Pre-Treated Crumb Rubber and Micro-Silica

by
M. R. Rajagopal
1,2,*,
Jyothikumari Ganta
2 and
Yashwanth Pamu
1
1
Department of Civil Engineering, CVR College of Engineering, Hyderabad 501510, India
2
Department of Civil Engineering, GITAM University, Hyderabad 502329, India
*
Author to whom correspondence should be addressed.
Recycling 2024, 9(3), 32; https://doi.org/10.3390/recycling9030032
Submission received: 25 March 2024 / Revised: 18 April 2024 / Accepted: 21 April 2024 / Published: 24 April 2024
(This article belongs to the Special Issue Recycling of Rubber Waste, 2nd Edition)

Abstract

:
Dumped non-biodegradable tires present a significant environmental threat, with overflowing landfills and associated health risks highlighting the urgency of tire waste disposal. Current disposal methods, such as stacking tires in open spaces, exacerbate the problem. The large-scale recycling of tire rubber waste offers environmental benefits. This study examines the effects of pre-treatment using NaOH and micro-silica as a mineral admixture on the mechanical strength of crumb rubber concrete (CRC) with partial replacement of natural sand. Samples of M20 and M30 grade were prepared with varying levels of crumb rubber (CR) replacement and evaluated at 28 days. CRC prepared with pre-treated NaOH solution and micro-silica showed improved workability and strength compared to conventional concrete and untreated CRC, with the highest strength observed for 5% CR replacement using micro-silica. Predictive models and micro-structural analysis validated these findings. Life Cycle Assessment (LCA) using OpenLCA v2.10 software and the ecoinvent database revealed that incorporating micro-silica into CRC did not significantly increase environmental impacts, compared to conventional concrete across different mixes.

1. Introduction

The world moves on wheels, and a large number of rubber tires are used in vehicles all over the world. Approximately 1000 million discarded tires are produced globally each year, and, by 2030, this number is projected to increase to 1200 million [1]. The projected increase in discarded tires over the next decade presents several challenges and implications for global waste management strategies, underlining the need for sustainable solutions. The implications are as follows: increased landfill pressure exacerbating the existing pressures on landfill capacities worldwide; environmental pollution leading to public health issues spreading vector-borne diseases; chemicals and heavy metals from waste tire rubber that can leach into the soil and groundwater posing environmental risks; tire fires, which are difficult to extinguish, release toxic pollutants into the air; valuable materials wastage, including rubber, steel, and textile fibers; and increased management costs diverting funds from other essential services. Crumb Rubber used in concrete contributes to mitigating these implications by diverting waste from landfills, recovering, and recycling resources, and reducing environmental pollution. The innovative use of crumb rubber in infrastructure leads to the development of more sustainable and resilient urban environments; there are also economic benefits from stimulating new markets for recycled tire products [2,3].
To address the environmental threats posed by non-biodegradable dumped tires, waste management policies also need to be improved and strategically implemented to encourage the recycling of rubber for construction purposes. Some of the policy recommendations which can be taken up as a priority include the following: extended producer responsibility (EPR) to reduce illegal dumping and stockpiling of tires; recycling targets and mandatory content standards to create a stable demand; financial incentives to make it economically viable; research and development support leading to technological innovations; public procurement policies giving preference to projects incorporating recycled rubber; standardization and certification to build trust among stakeholders; awareness and education campaigns to increase the understanding and acceptance of recycled rubber; and infrastructure investment to streamline the recycling process. Thus, crumb rubber concrete represents a promising approach that not only addresses the environmental and logistical challenges posed by tire waste but also offers potential benefits for the construction industry and the broader economy.
Crumb Rubber used in cement concrete is one such waste product used to reduce the global load of used rubber tires [3]. By substituting rubber crumb, created from rubber waste, as a partial replacement for natural fine aggregate in concrete, the utilization of natural sand can be reduced. Through a process known as continual shredding, it is possible to create a granulated rubber crumb, which undergoes the process repeatedly to make the crumb sufficiently small to replace aggregates as fine as sand. Owing to its improved resistance to frost and ice thawing, this type of concrete is used in the construction of reinforced pavements and bridges [2].
The elimination of discarded tire rubber is a serious issue in waste management worldwide. The estimated annual number of leftover waste tires worldwide is 1.2 billion. Additionally, it is estimated that only 4% of tires are employed for structural construction projects, and that 27% of tires are piled up as waste [1,2,3,4]. Therefore, attempts have been made to utilize waste tire rubber in structural concrete. The composition of rubber tires consists of 40 to 50% rubber, up to 40% carbon black, and up to 15% low-molecular-weight additives [5]. The primary objective of this study was to develop an environmentally friendly and sustainable material that would benefit humanity [6,7]. However, with the increase in construction activity, high-quality natural resources, such as sand, rock, and aggregates, are quickly running out. Therefore, there is a constant search for substitute materials that can better meet these needs. The characteristics of crumb rubber, when mixed in concrete as a partial fine aggregate replacement, have been examined using a variety of tests to determine the behavior of this combination [8,9,10,11,12]. If feasible, it might aid in reducing natural soil utilization and increasing the usage of leftover crumb rubber.
The term “Crumb Rubber Concrete” (CRC) refers to concrete that has fine aggregates substituted for rubber in various volumes or weight amounts. The use of crumb rubber poses no environmental danger. Therefore, the use of rubber, in the form of crumb rubber, in concrete can be an environmentally friendly and economically feasible way to convert it into a useful resource [4]. CR can partially replace some of the fine aggregates in concrete, giving it properties such as low unit weight, good protection from scraped areas, absorption to shocks and vibrations, and high ductility [13,14,15]. Higher resilience and durability are also a result of the incorporation of rubber into concrete. A few studies have demonstrated that the toughness, plastic distortion, and crack resistance of rubber samples have increased, while their strength and stiffness are reduced. To improve the overall properties of concrete, such as toughness, durability, and deformation, a percentage of fine aggregate can be replaced with crumb rubber [4,5,6,7]. Rajan et al. [16] utilized M30 grade concrete by varying the percentages of crumb rubber, used as a replacement for sand, and studied the chemical bond between rubber and the cement matrix. Salonia et al. [17] reported the efficacy of sand replacement in CRC for geopolymer concrete. NaOH pre-treatment was adopted at 8M concentration. Jokar et al. [1] used natural zeolite as a partial replacement for cement and NaOH solution of 1M concentration. Huang et al. [18] proposed a model based on microporosity theory and a correlation coefficient, and the experimental values were compared with existing models, leading to the conclusion that the model is reliable. Cauana Melo Copetti et al. [19] studied cement with NaOH pre-treatment and using silica fume at proportions of 7.5% and 15%, as a mineral additive. Juan Wang et al. [20] compared and reported similar hydration compounds in Crumb Rubber Concrete as in natural sand concrete. Wu et al. [2] concluded that crumb rubber is not suitable for structural concrete and reported a major loss in the strength of concrete. Rodríguez-Fernández et al. [3] performed a microstructural study on crumb rubber with the addition of asphalt mixtures. Taha et al. [21] used both chipped and crumb rubber tire particles, varying the replacement levels by volume, and reported their mechanical strength and fracture properties. Osama Youssf et al. [22] proposed an empirical model to forecast CRC compressive strength with a mean variation of 10.7%. The bonding between cement mortar and aggregates was found to be improved by pretreatment or by using admixtures. These findings form the premise for the authors to research crumb rubber in concrete and to fix the optimal proportion, pre-treatment, and mineral admixture to be used in the composite in order to obtain the optimum properties of the concrete, establishing this using macro-level tests and morphological studies. There are several methods to treat crumb rubber, such as soaking in NaOH solution, potassium permanganate, hydrogen peroxide, calcium chloride, sulfuric acid, and silane coupling agents [10,23,24,25,26,27,28]. Among all the treatment methods, the use of NaOH in concrete provides the most optimal and practical solution on a mass scale.
Pre-treating crumb rubber with NaOH solution reduces its inherent water absorption and mitigates the increase in porosity and permeability. Such a treatment also improves the interfacial bonding between crumb rubber particles and the cement matrix, enhancing the overall durability.
Micro-silica, also known as silica fume, is a byproduct of silicon and ferrosilicon alloy production, characterized by its ultrafine particles. When used as a mineral admixture in crumb rubber concrete, micro-silica enhances the concrete’s mechanical properties and durability by improving its compressive strength, bond strength, and resistance to abrasion and chemical attack. Incorporating supplementary cementitious materials, such as silica fume, can help to refine the pore structure and improve the durability of crumb rubber concrete. Micro-silica counteracts the increase in porosity and permeability, improving water resistance and mitigating the ingress of harmful substances.
However, the ultrafine nature of micro-silica particles poses a health risk if inhaled, potentially leading to respiratory issues. Workers handling micro-silica need to take precautions to avoid inhalation. The production of silicon and ferrosilicon alloys, from which micro-silica is derived, is energy-intensive and contributes to CO2 emissions. Fly ash, blast furnace slag, rice husk ash, natural pozzolans such as volcanic ash, calcined clay, and diatomaceous earth, biochar, and recycled glass powder are other promising options for sustainable alternatives. However, in selecting sustainable alternatives, it is crucial to consider their availability and cost. Micro-silica offers a balance of improved concrete performance, availability, and cost. Further continued research in this area is required, in order to identify and optimize such materials for widespread use in the construction industry. As a mineral additive, micro-silica was used in the current project at 10% replacement of cement. The goal of this research project was to create CRC by employing crumb rubber as a partial replacement for fine aggregate (FA). The concrete was created by replacing 5%, 10%, 15%, and 20% of the fine aggregate weight with untreated crumb rubber, pre-treated Crumb Rubber and CRC with a mineral admixture, and it was tested to determine the mechanical properties vis à vis concrete specimens without Crumb Rubber. Several predictive models have been proposed for determining the compressive strength of crumb rubber concrete. As part of this project, the compressive strength results obtained were compared with three such models to validate the experimental results and the reported findings. The microstructural properties of CRC were studied [29] and analyzed, and the findings were presented in the report.
Finally, a Life Cycle Assessment (LCA) was conducted for conventional and crumb rubber concrete. Conducting LCAs for construction materials is crucial for evaluating their environmental footprint, aiding informed decision-making, and promoting sustainable practices within the construction industry. LCA techniques have been previously employed to evaluate the environmental impact of construction activities (Means and Guggemos 2015) [30]. Saleem et al. (2018) [31] conducted a comparative analysis of the environmental impacts associated with four distinct building facades—aluminum, glass, brick, and granite—using LCA methodology. The assessment was carried out using SimaPro software (version 8.0), revealing granite as the most sustainable facade choice.

2. Results and Discussion

2.1. Results for Trial Mixes at M20 and M30 Grade

The compressive strengths of the concrete mixtures made to the M20 and M30 grades were assessed for seven days. The replacement rates of fine aggregates with crumb rubber by weight were 5%, 10%, 15%, and 20%. M20 and M30 represent the concrete grades; M20CR0 and M30CR0 denote the controlled mixes; UCR denotes untreated concrete; TCR denotes NaOH-treated crumb rubber; UCRM denotes the addition of micro-silica as an admixture in untreated crumb rubber concrete; and 0, 5, 10, 15, and 20 denote the percentages of sand replaced by weight with crumb rubber. When 10% treated crumb rubber was utilized, the compressive strength of the concrete was 5.97% and 5.5% lower, respectively, than it would have been with regular concrete. Table 1 lists the results of the trial mix tests for the compressive strength of concrete at the grades M20 and M30.

2.2. Workability

The workability test was performed to determine the slump values of concrete grades M20 and M30. Table 2 contains the slump values for various percentages of M20 and M30 grade concrete.
As per IS 456-2000, the workability of concrete should be 50 mm–100 mm, for medium workability used for normal reinforced concrete and 100 mm–150 mm, for high workability used for heavily reinforced sections.

2.3. Mechanical Strength of Crumb Rubber Concrete

2.3.1. Compressive Strength

The compressive strength results of the M20 and M30 grade concretes for different percentages are shown in Table 3 and Table 4 respectively. After 28 days, the compression strengths of all combinations were assessed. For M20 grade, the compressive strength increased by 1.4% when 5% untreated crumb rubber was used as a replacement by weight, along with micro-silica, but the strength decreased by 4.9%, 14.4%, and 30% when 10%, 15%, and 20% crumb rubber were used. For M30 grade, when crumb rubber was used as the replacement, along with micro-silica, the compressive strength increased when 5% rubber was used and decreased when 10%, 15%, and 20% rubber were used, respectively, by 11%, 30%, and 38%. A loss in strength was observed for all the proportions of crumb rubber when pre-treated with NaOH. However, the strength increased, in comparison with that of a specimen in which untreated crumb rubber was used. A substantial recovery of strength loss due to NaOH pretreatment was observed for 5% replacement, at 10.5% and 2.43% for M20 and M30 grades, respectively.

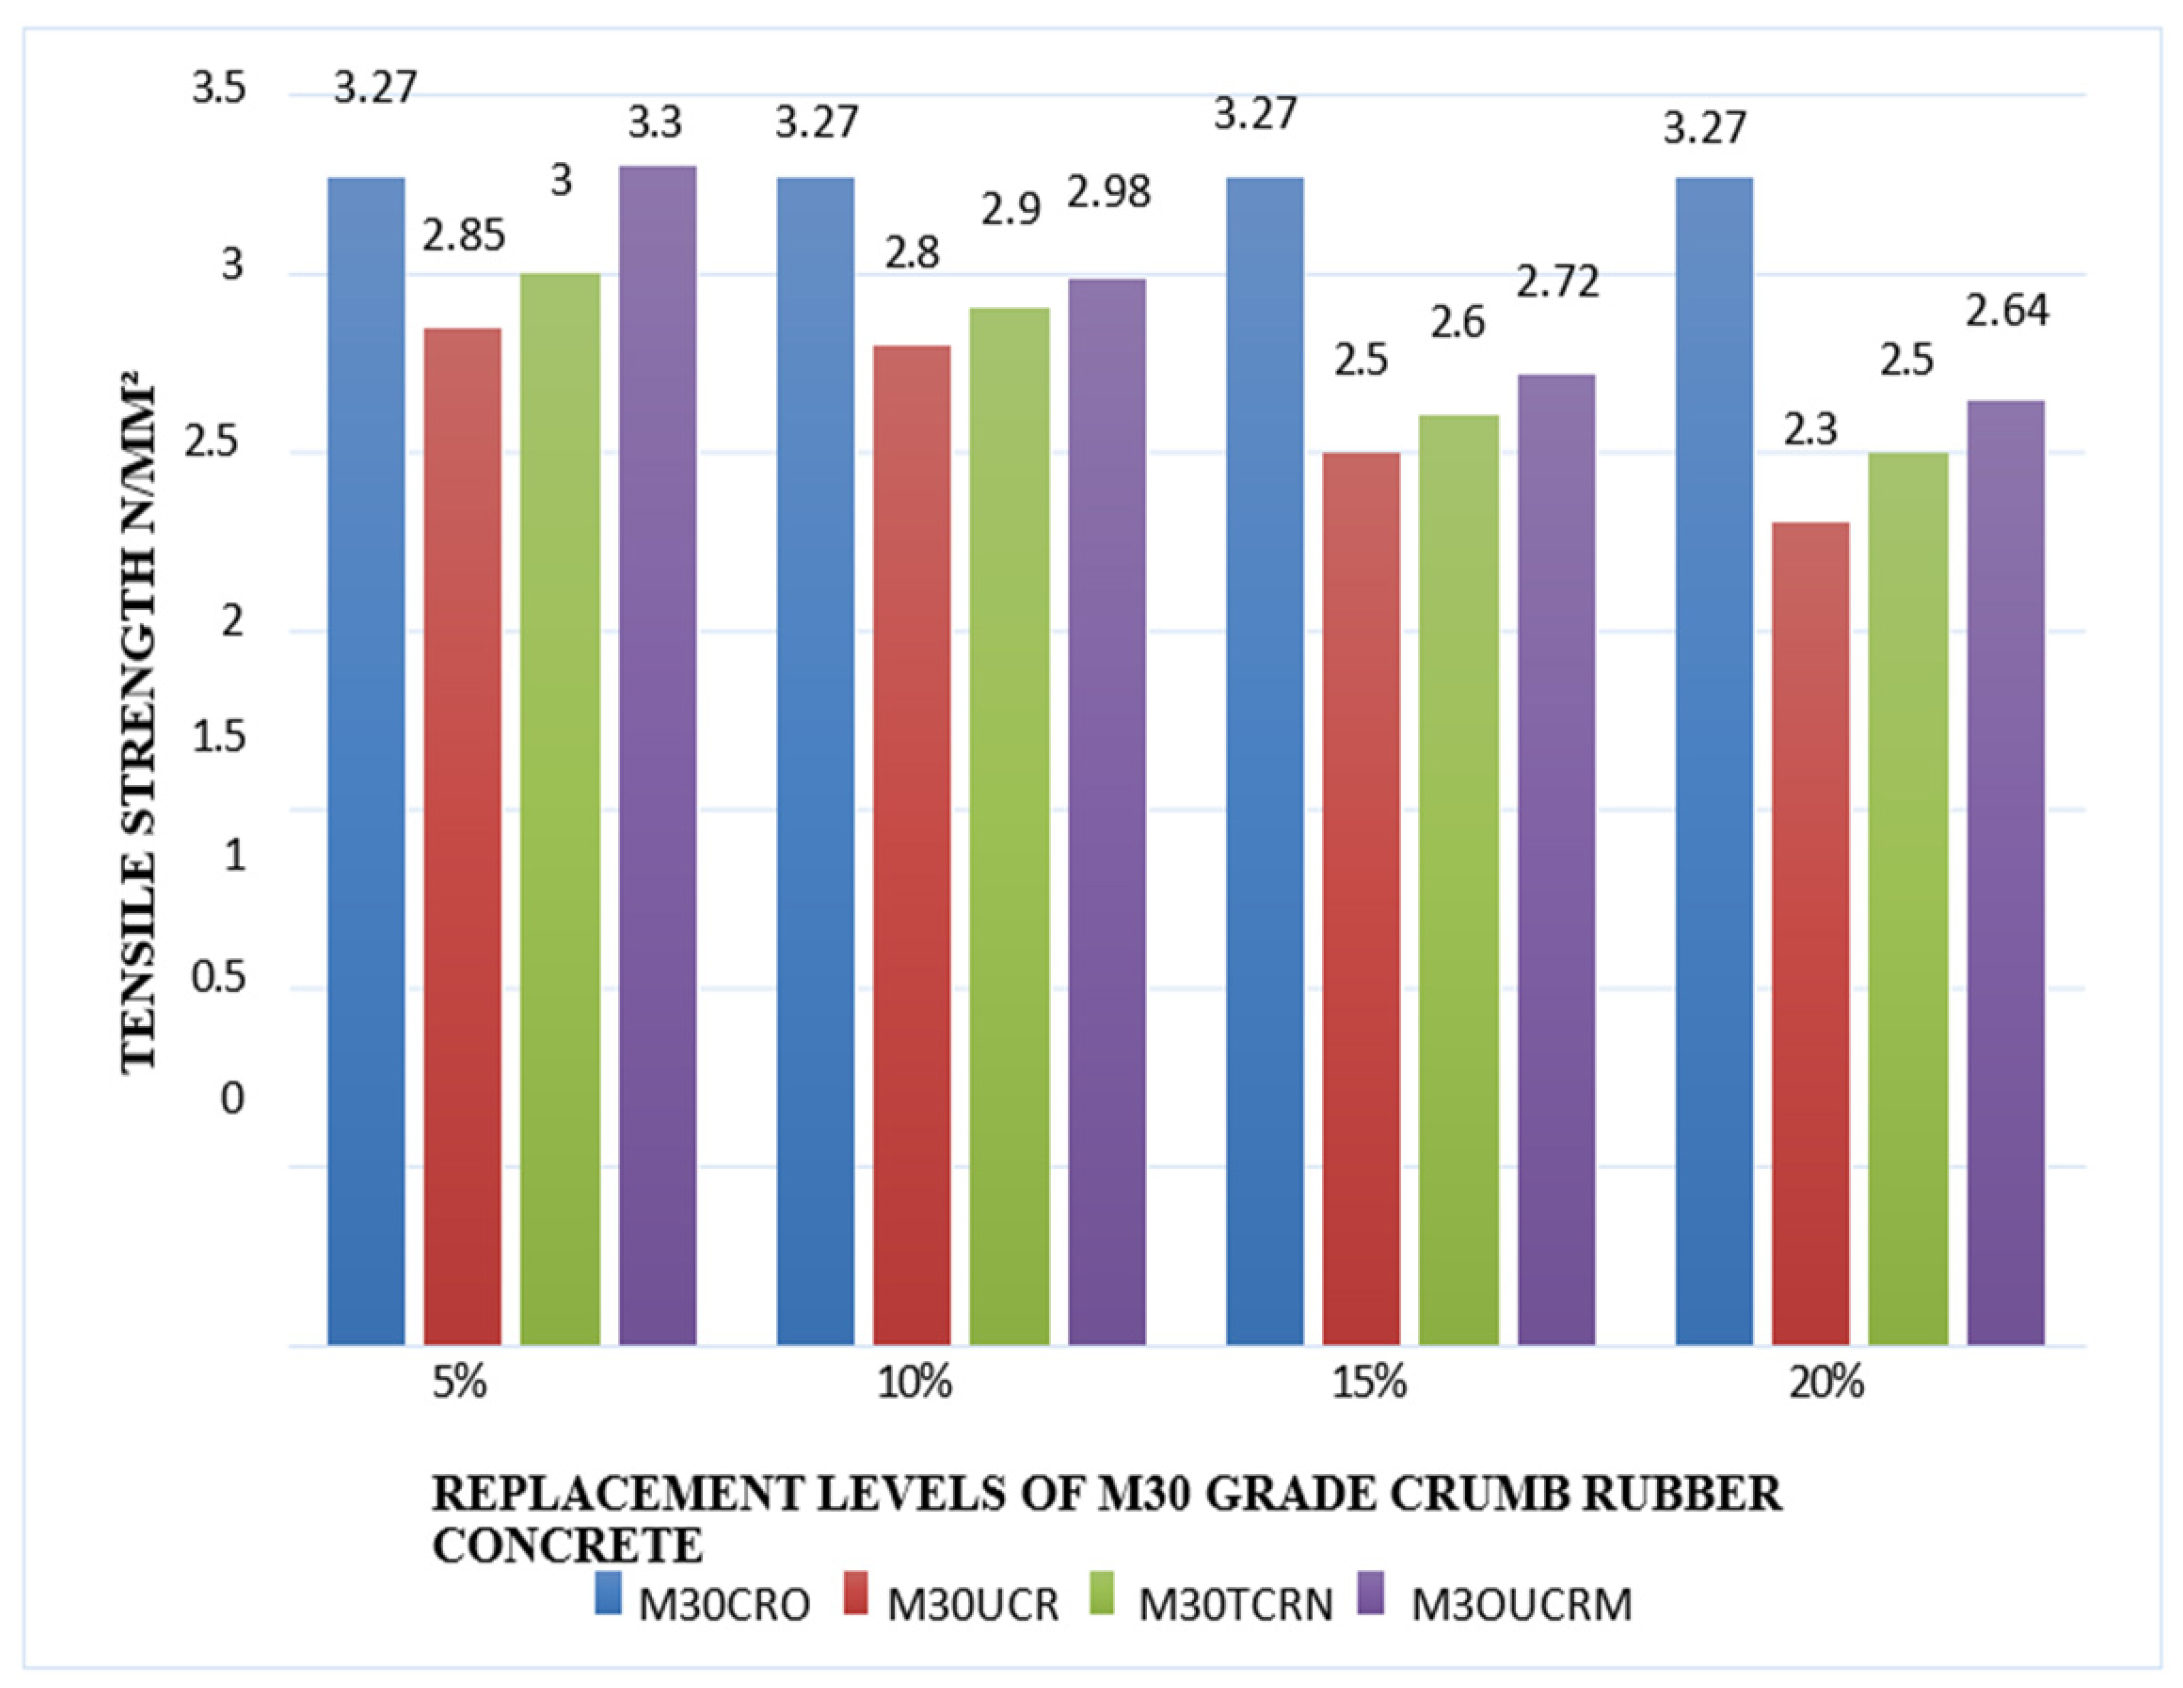
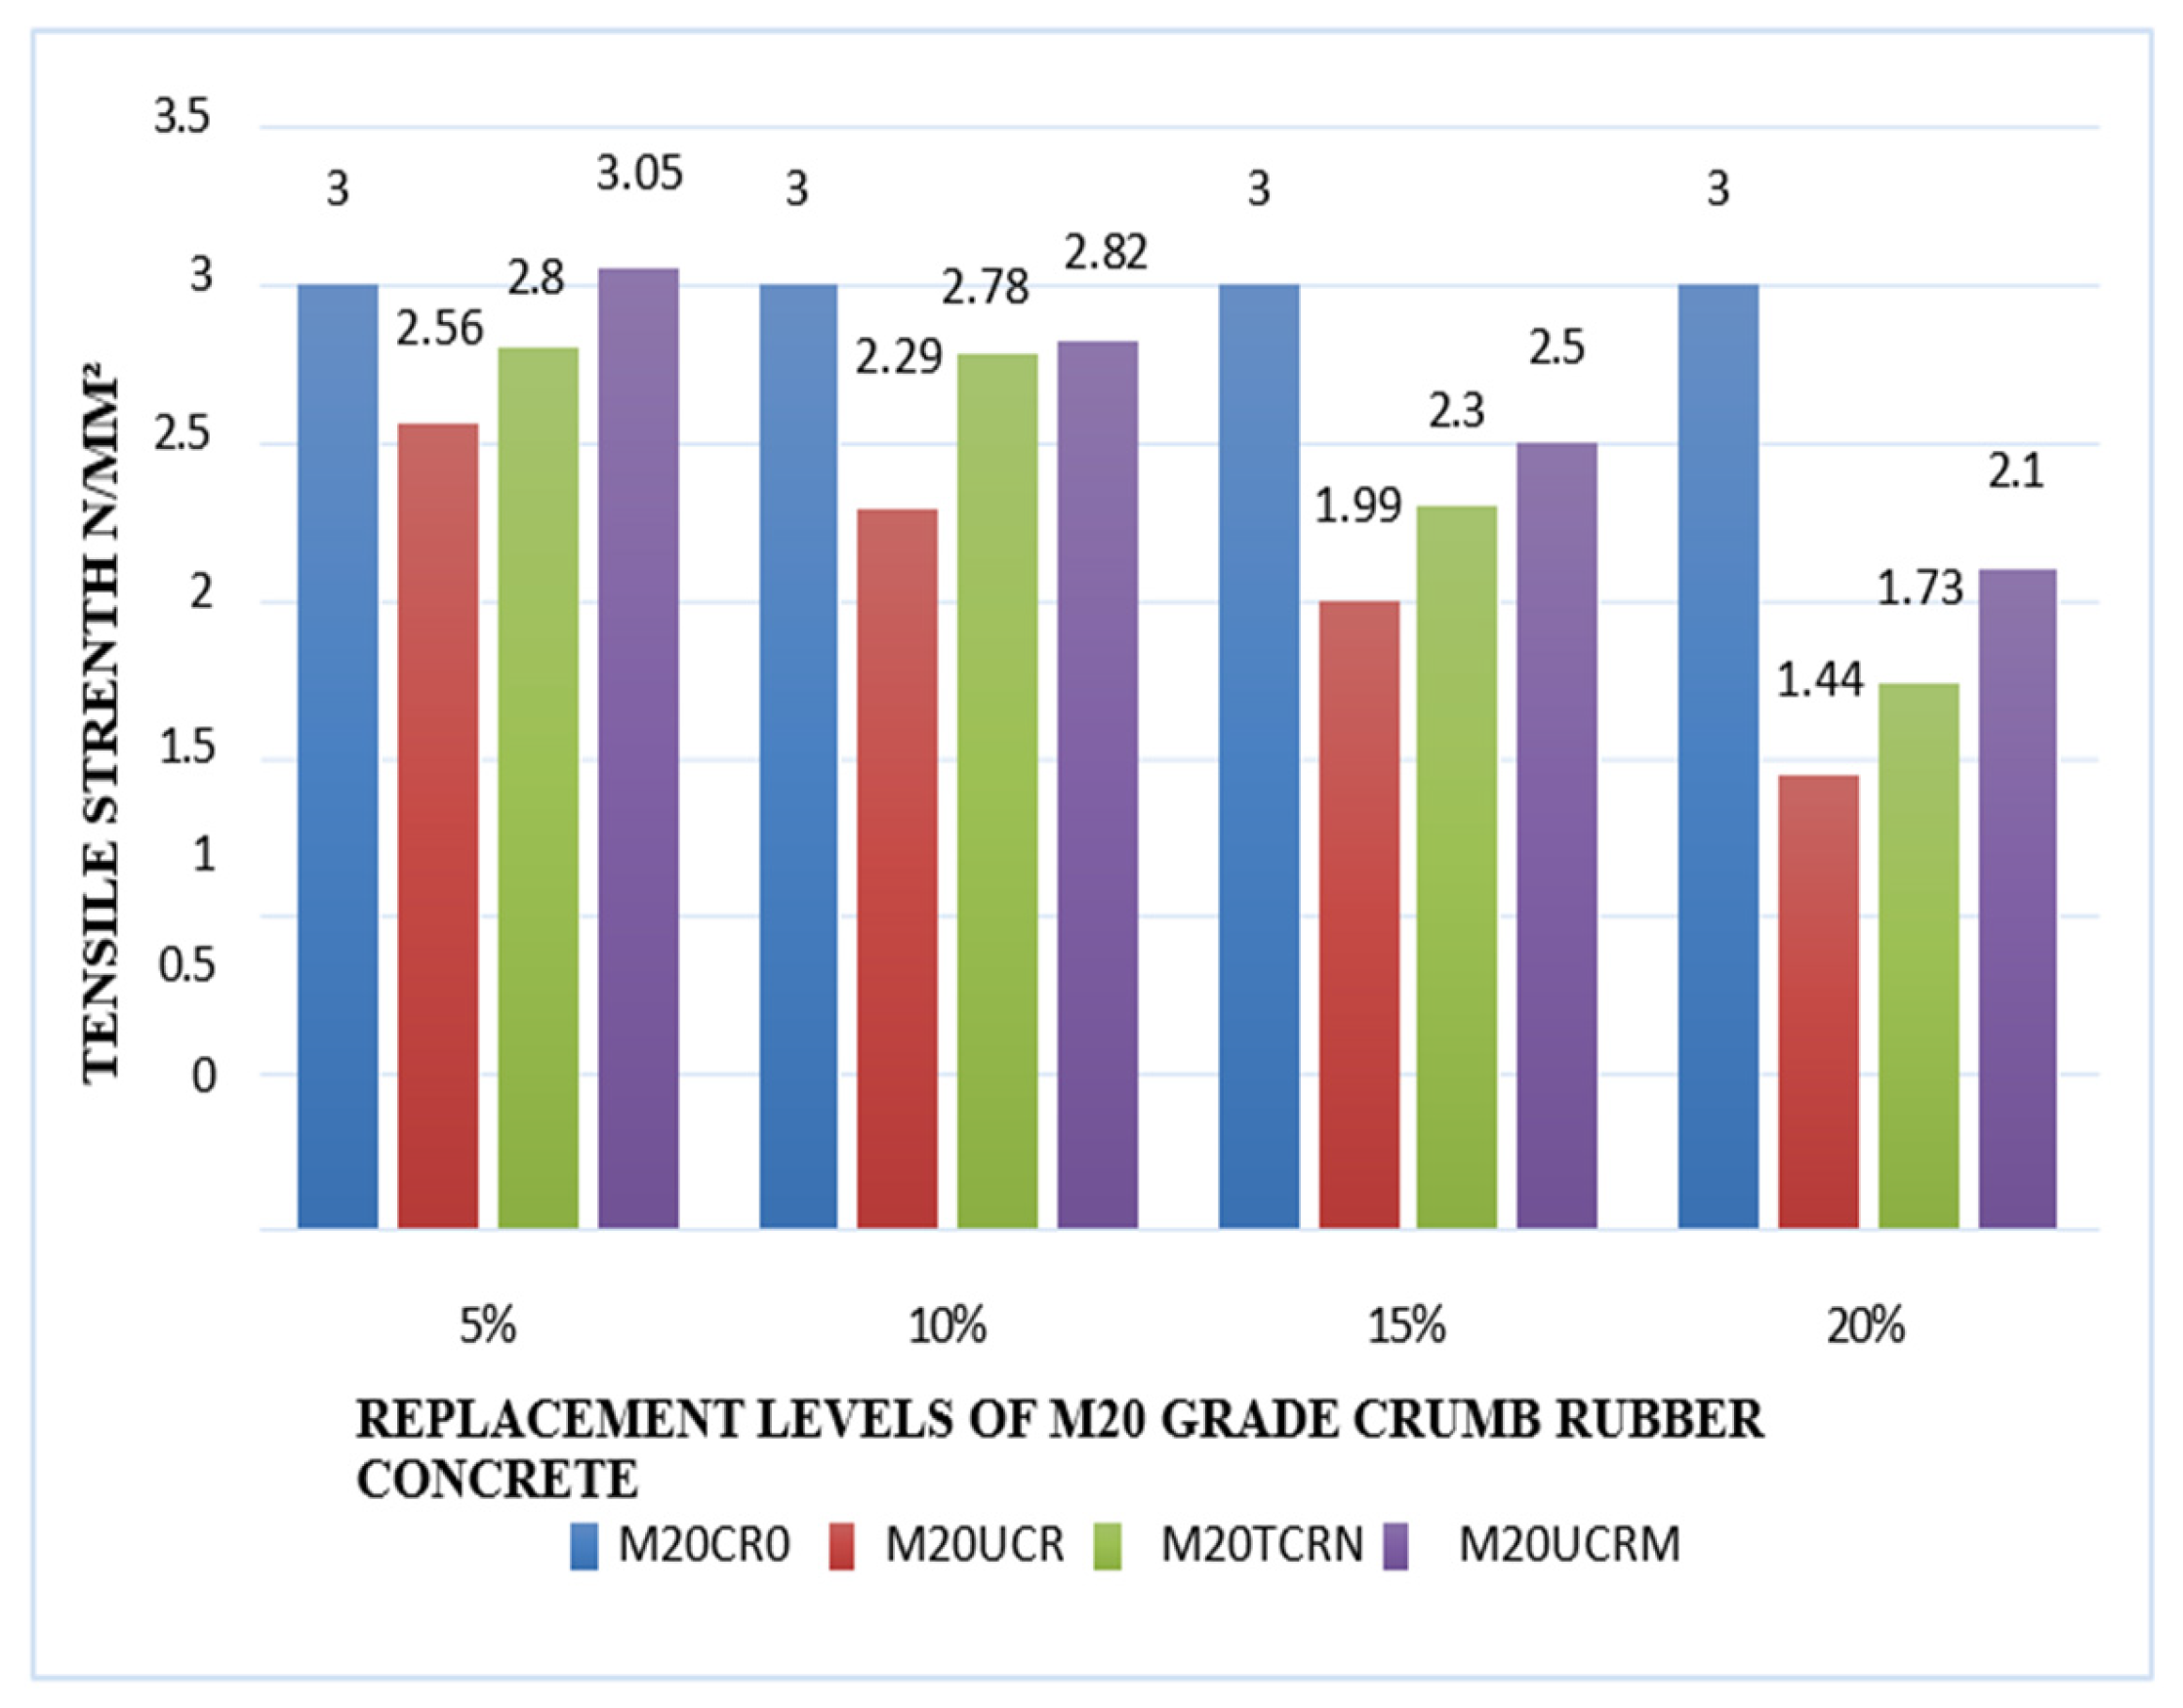
2.3.2. Tensile Strength

The split tensile strength results of the M20 and M30 grade concrete for different percentages are depicted in Figure 1 and Figure 2. After 28 days, the split tensile strengths of all combinations were assessed. For M20 grade and M30 grade concrete with 5% crumb rubber and added micro-silica, the tensile strength improved by 1%. However, in all other combinations, i.e., when 10%, 15%, and 20% crumb rubber were used, the split tensile strength declined at varying levels.

2.4. Mechanical Performance Results Analysis

The experimental results of the M20 grade and M30 grade CRC were compared with three predictive models, and a summary of the results is shown in Table 3 and Table 4.

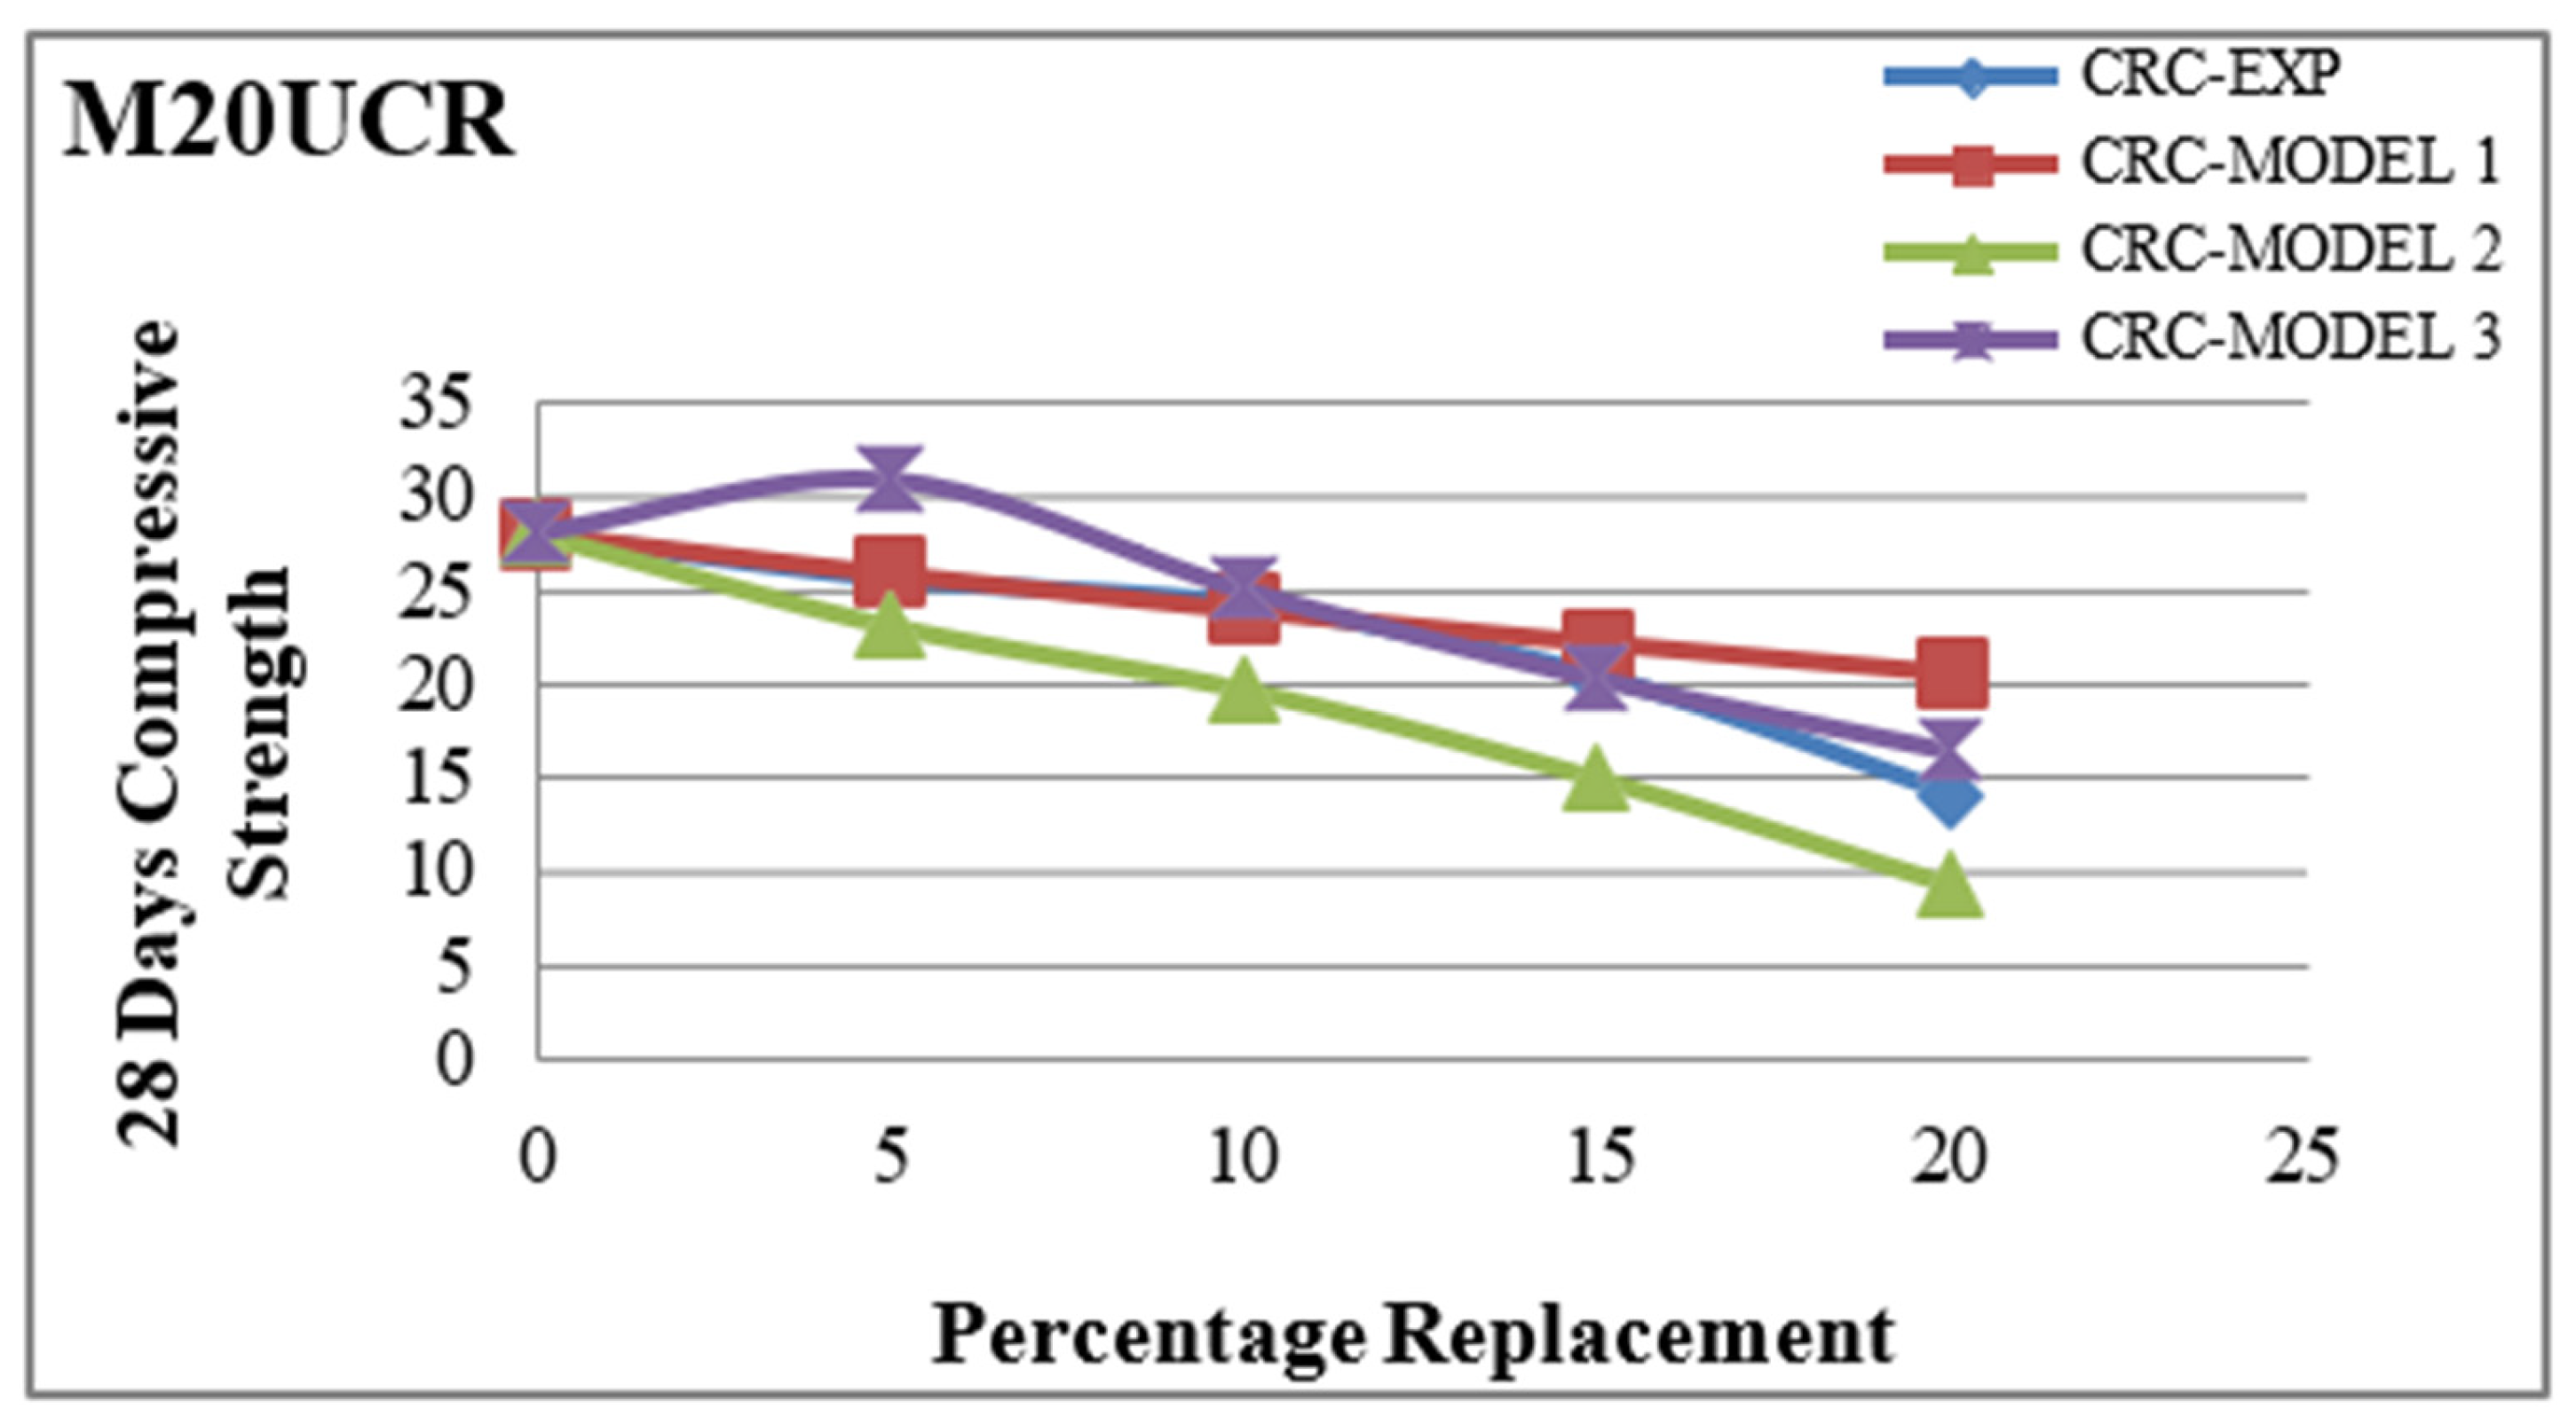
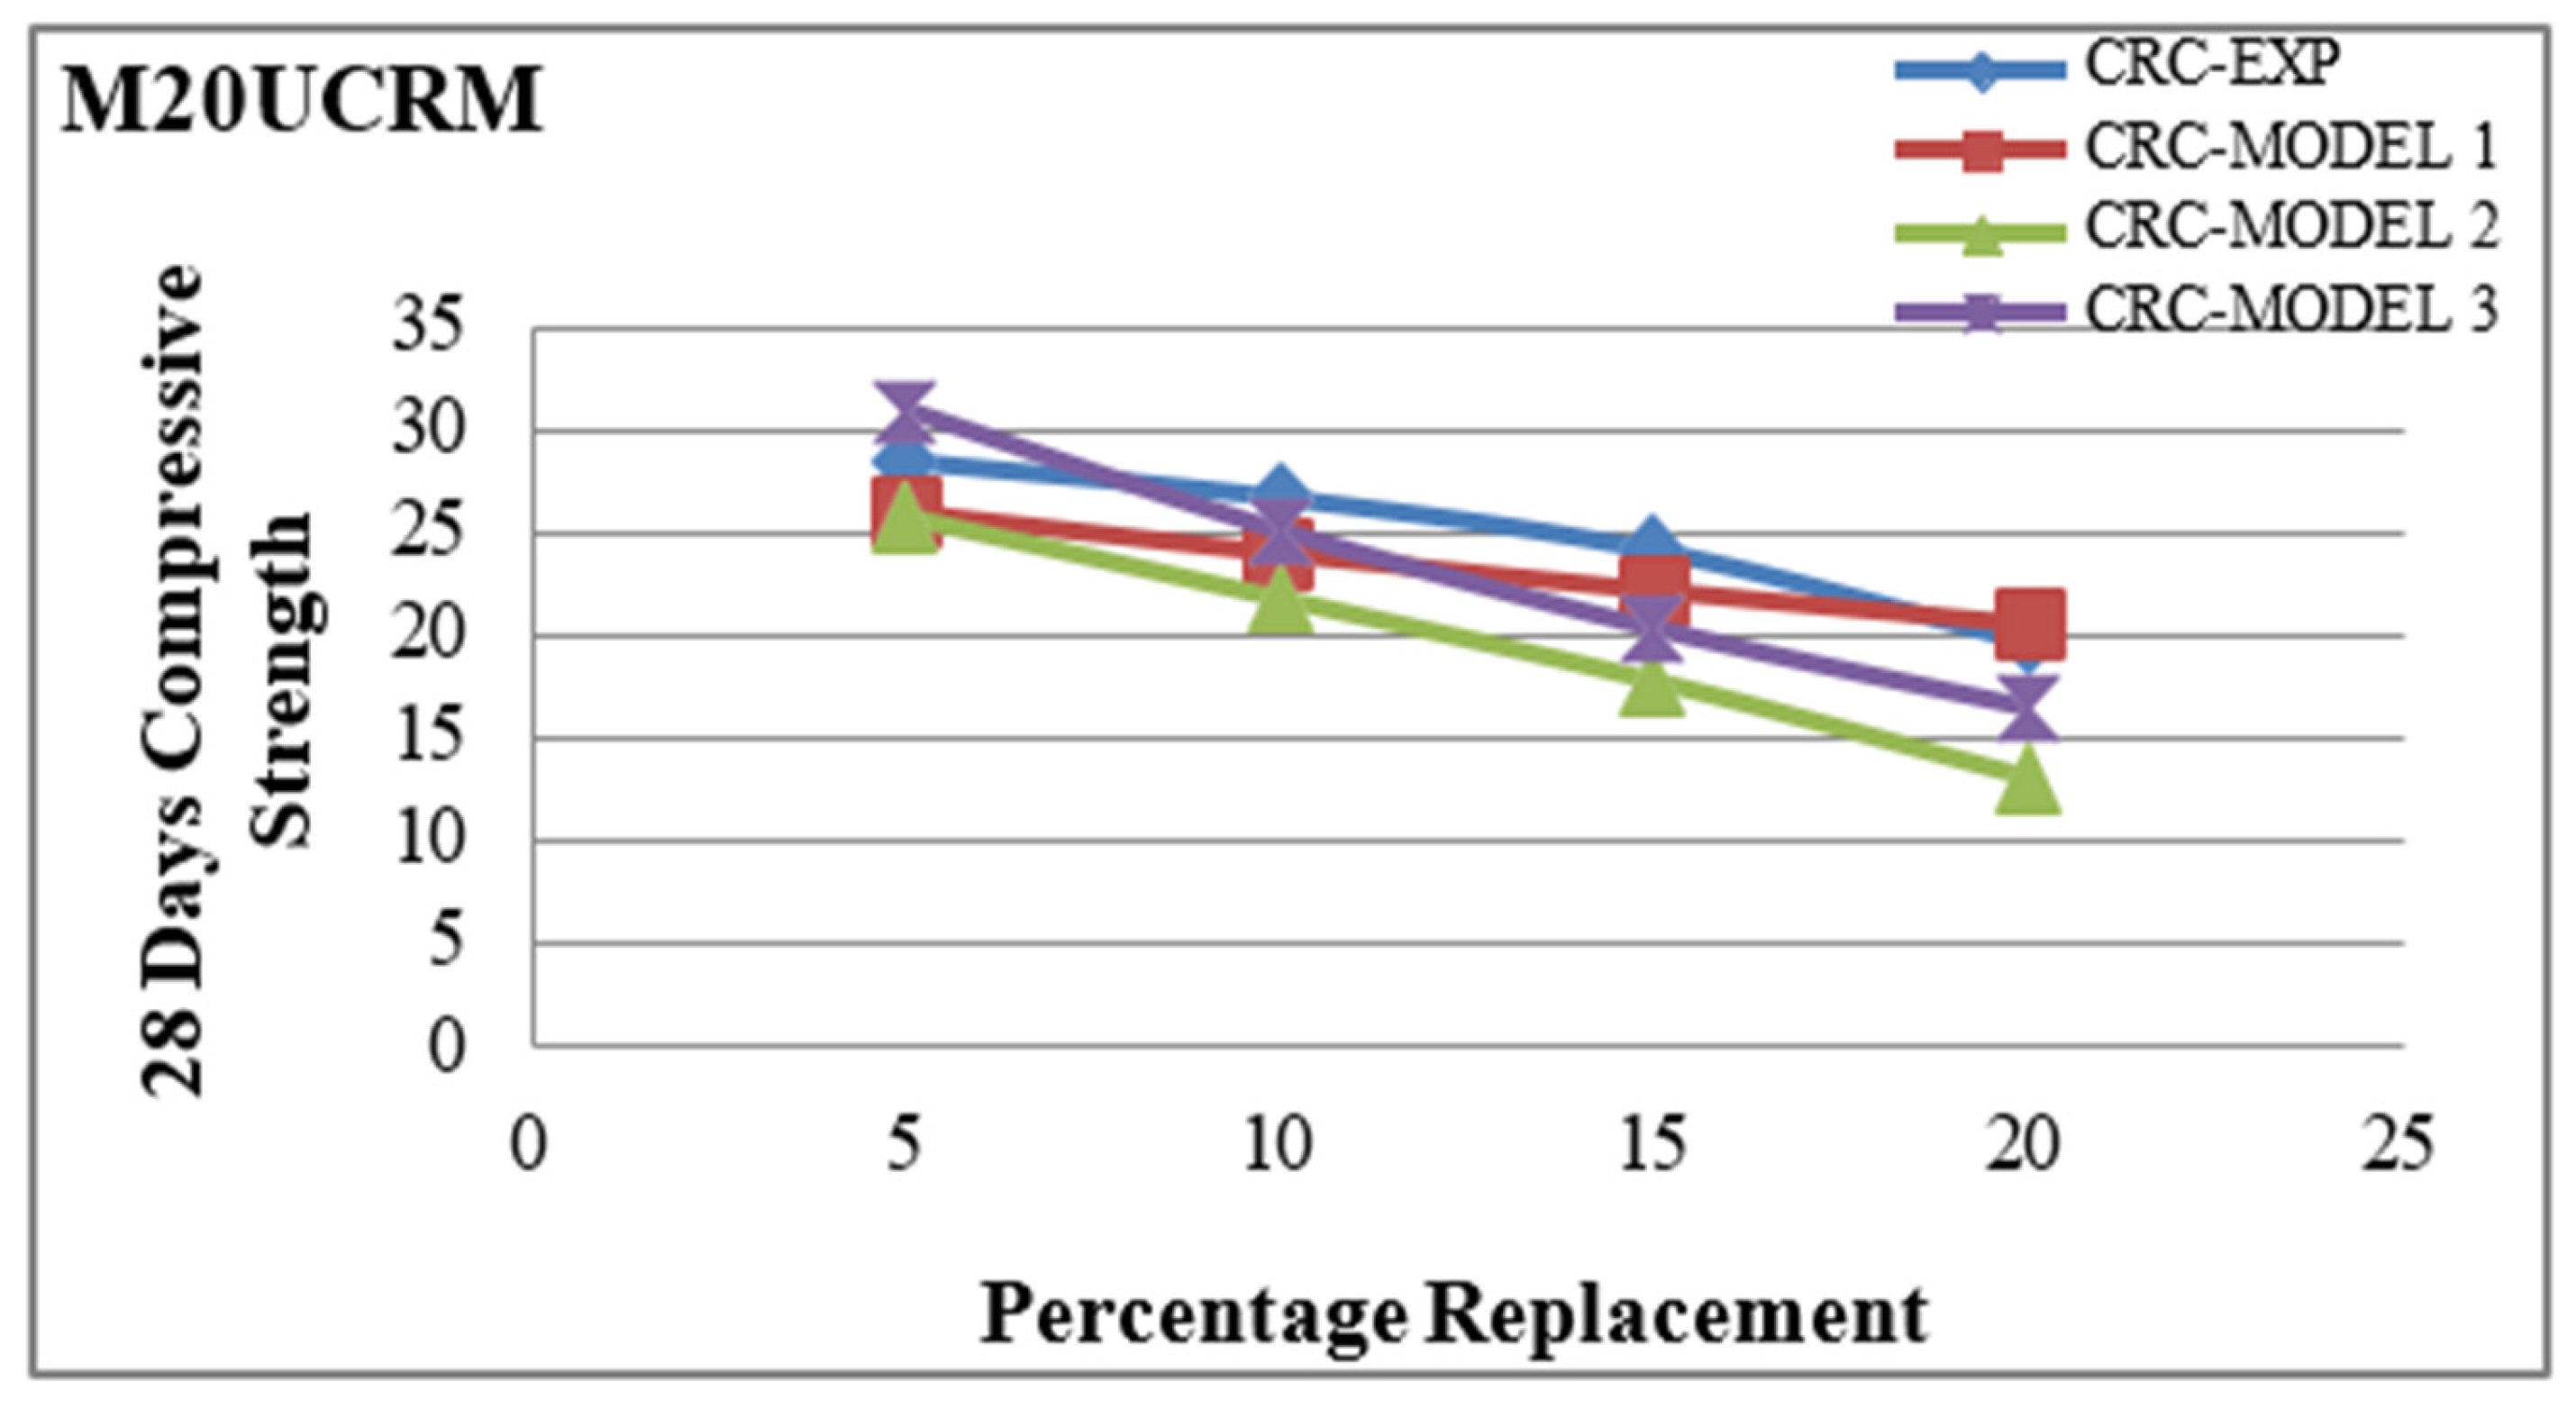
2.4.1. Predictive Compressive Strength of M20 Grade Concrete

The experimental results vis à vis the predictive models are depicted for M20UCR, M20TCR, and M20UCRM with varying partial replacements of fine aggregates at 5%, 10%, 15%, and 20% in Figure 3, Figure 4 and Figure 5, respectively.
The experimental compressive strength values for M20UCR are in alignment with Predictive Model 1 and Predictive Model 3. The compressive strength results obtained at 10% and 15% are almost the same as the predicted values obtained using Model 3. However, the experimental results for the 5% and 20% replacements are lower than the predicted results from Model 3 and vary by a percentage of 20% and 17%, respectively. The compressive strength results obtained at 5% and 10% are almost the same as the predicted values obtained using Model 1. The experimental results for the 15% and 20% replacements are lower than the Predictive Model 1 and vary by a percentage of 8% to 16%. In the case of M20TCR, similar to M20UCR, the experimental compressive strength values are in alignment with Predictive Model 1 and Predictive Model-3. The compressive strength results obtained for 5%, 10%, and 15% are almost the same as the predicted values obtained using Model 1. However, the experimental results for the 20% replacement are lower than the predicted results obtained using Model 1 and vary by a percentage of 19%. The compressive strength results obtained for the 10% and 20% replacements are almost the same as the predicted values obtained using Model 3. The experimental results at 5% are lower than the results from Predictive Model 3, and, at 15% replacement, it is higher and varies by a percentage of 12% to 15%. The experimental compressive strength values for M30UCRM are in alignment with Predictive Model 1 and Predictive Model 3. The compressive strength results obtained at 15% and 20% are almost the same as the predicted values obtained using Model 1. However, the experimental results for the 5% and 10% replacements are higher than the predicted results from Model 1 and vary by a percentage of 8% to 10%, respectively. The experimental results, in comparison with Model 3, are higher across all the replacement percentages by a varying increment, starting from 6%, increasing to 16%, and lowering at 5%. To summarize, in all three cases, i.e., M20UCR, M20TCR, and M20UCRM, the experimental compressive strength values are in closer alignment with Predictive Model 1 and Predictive Model 3. In addition, the results for the 5% and 10% replacements are comparable with these models. The results are not found to be in alignment in all three cases, i.e., M20UCR, M20TCR, and M20UCRM, with Model 2, as the experimental results are lower by a varying percentage of 9% to 33%.

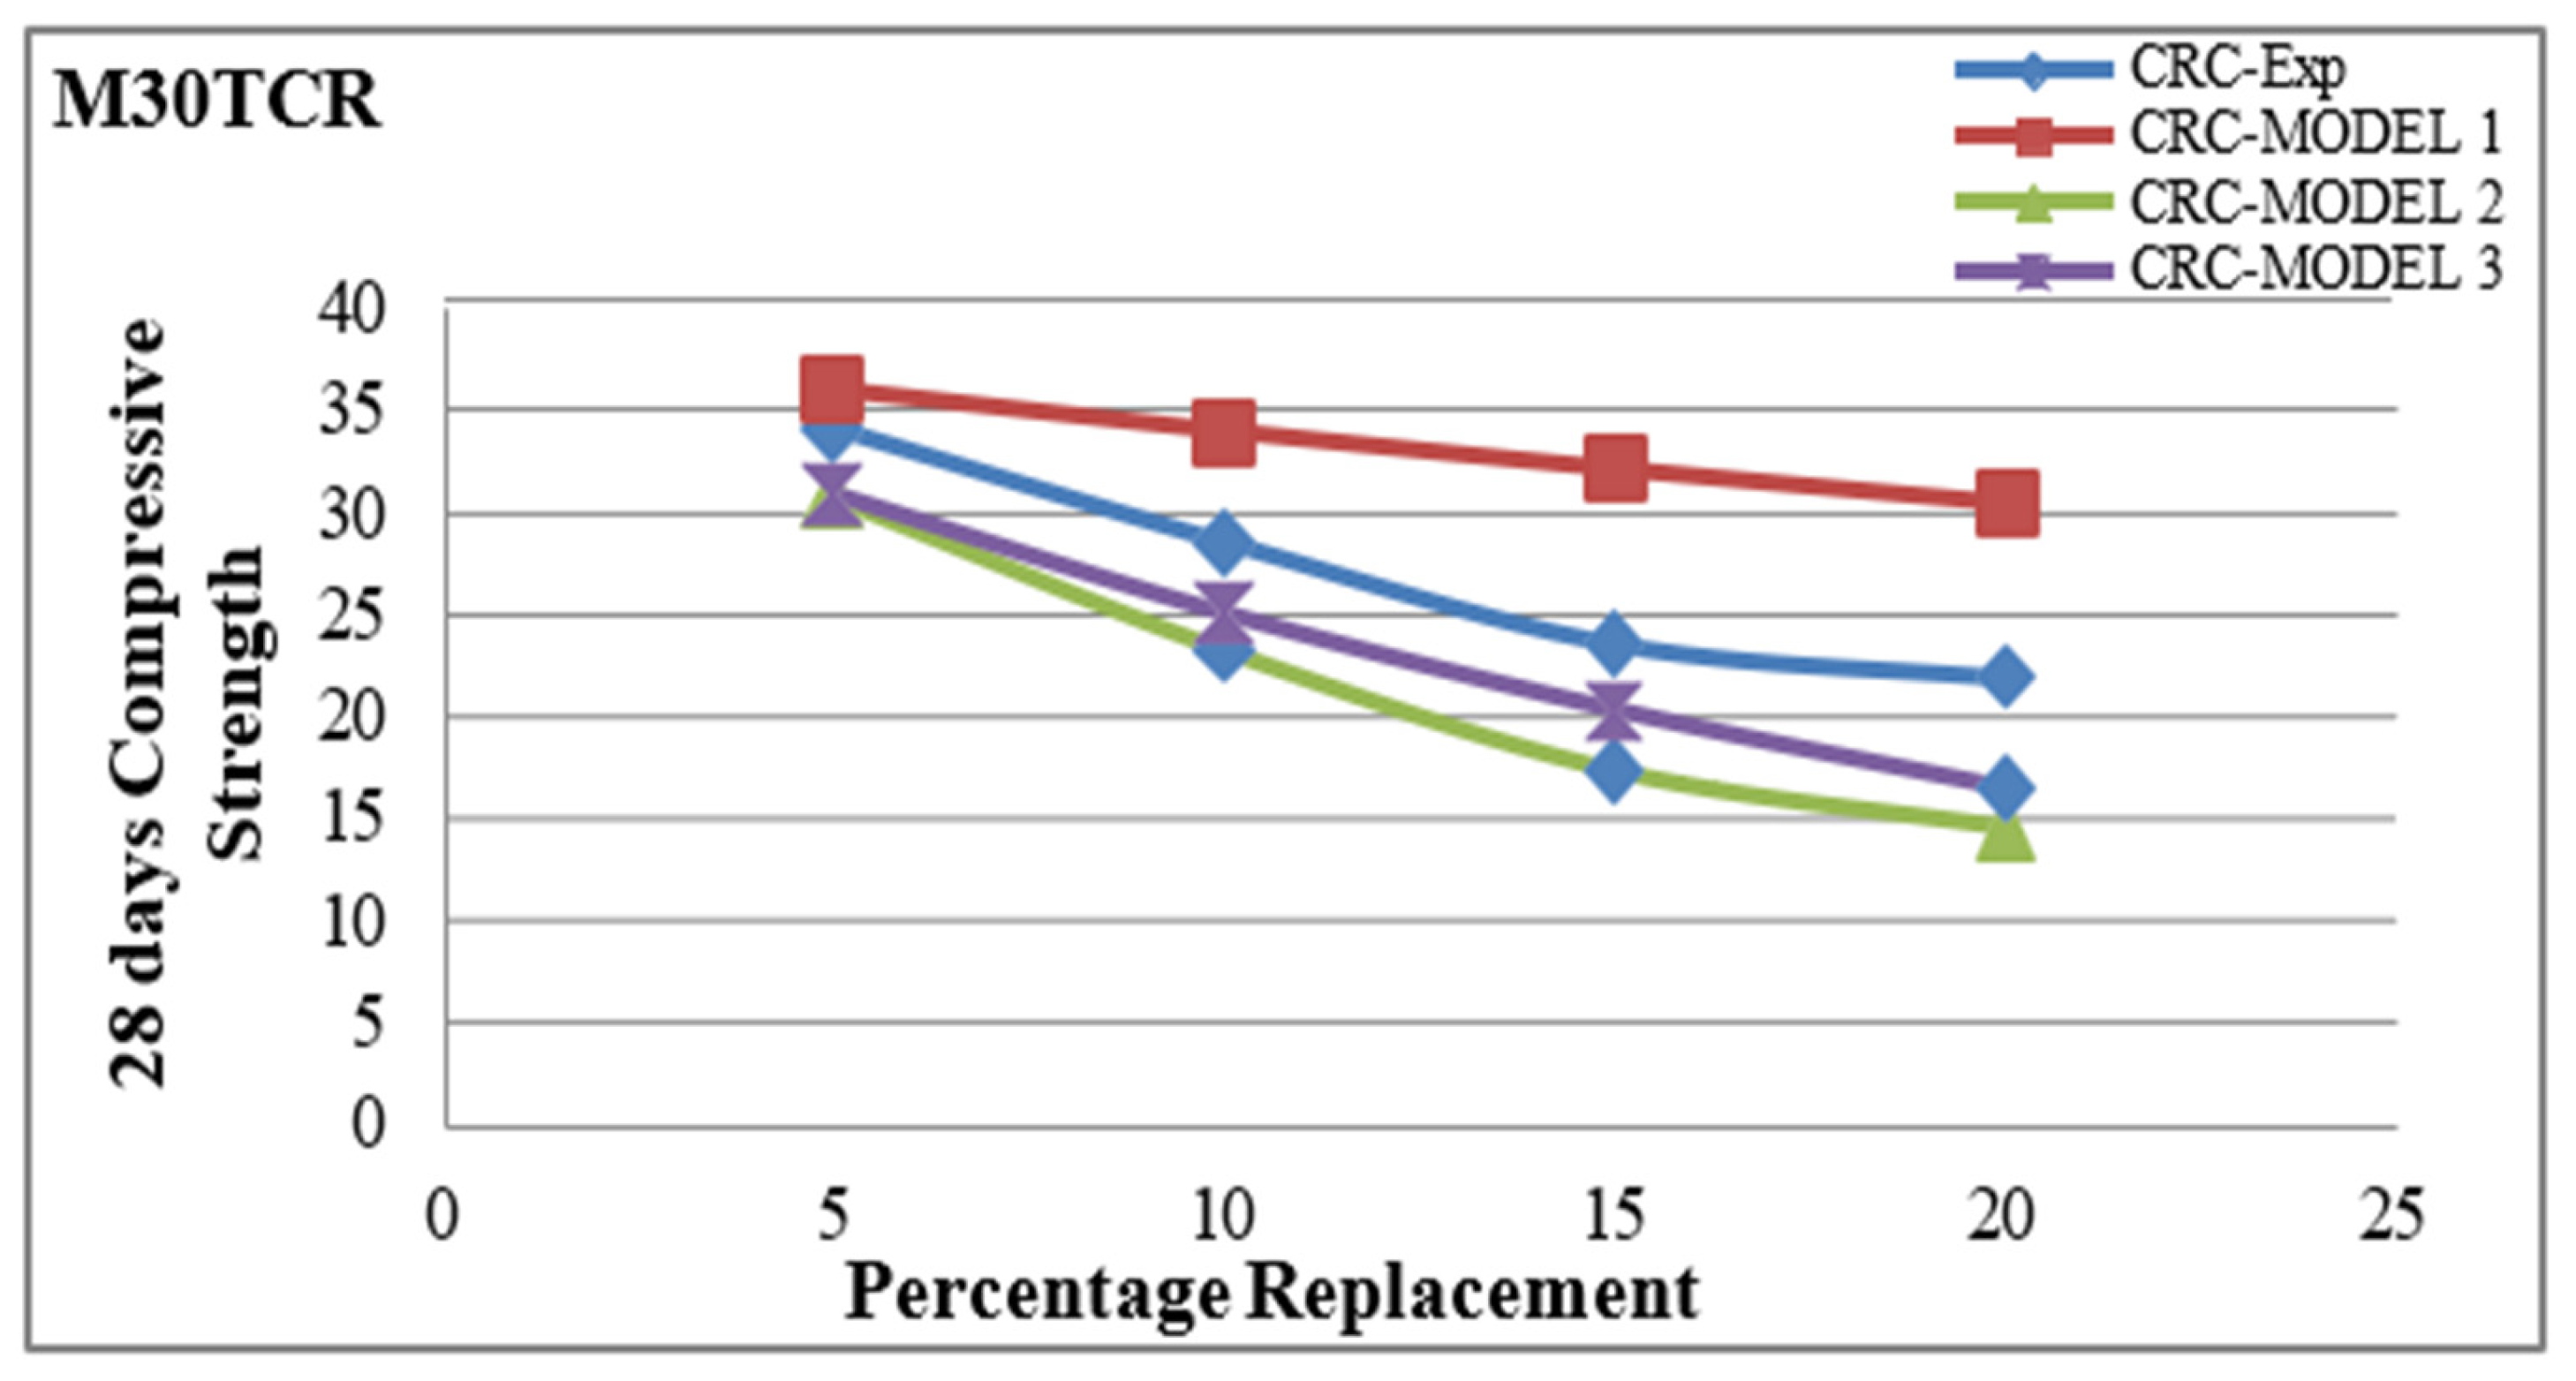
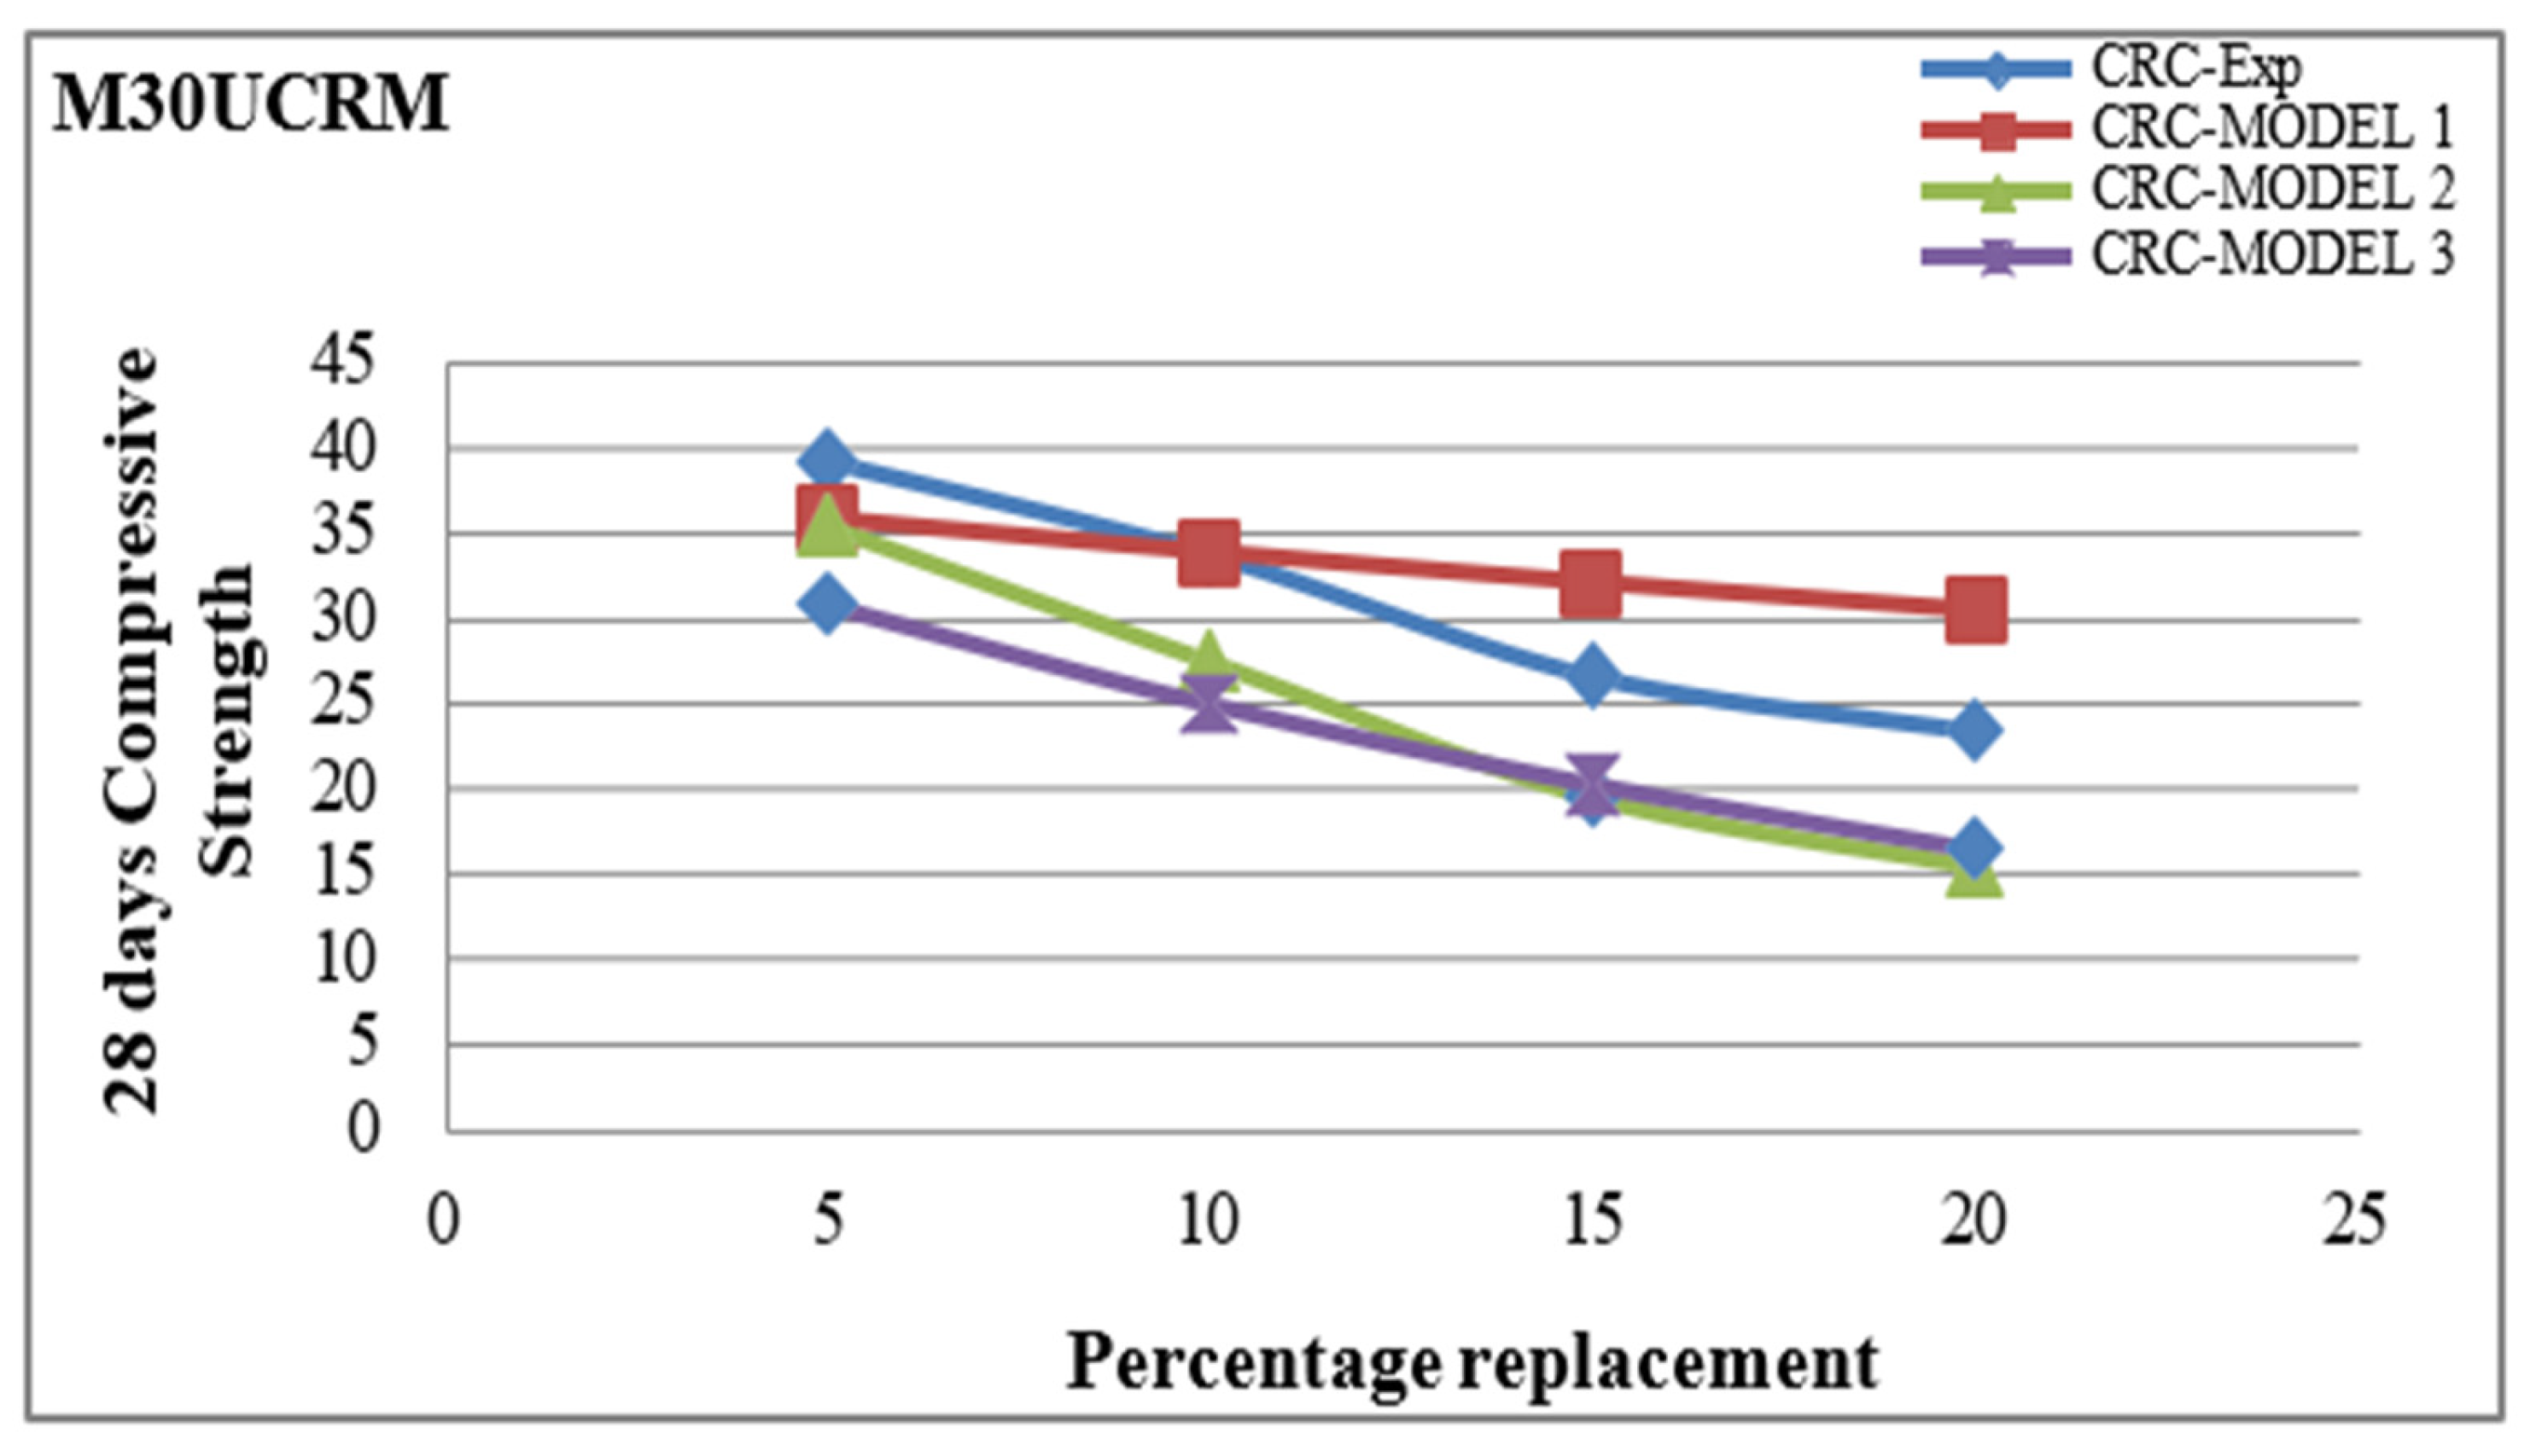
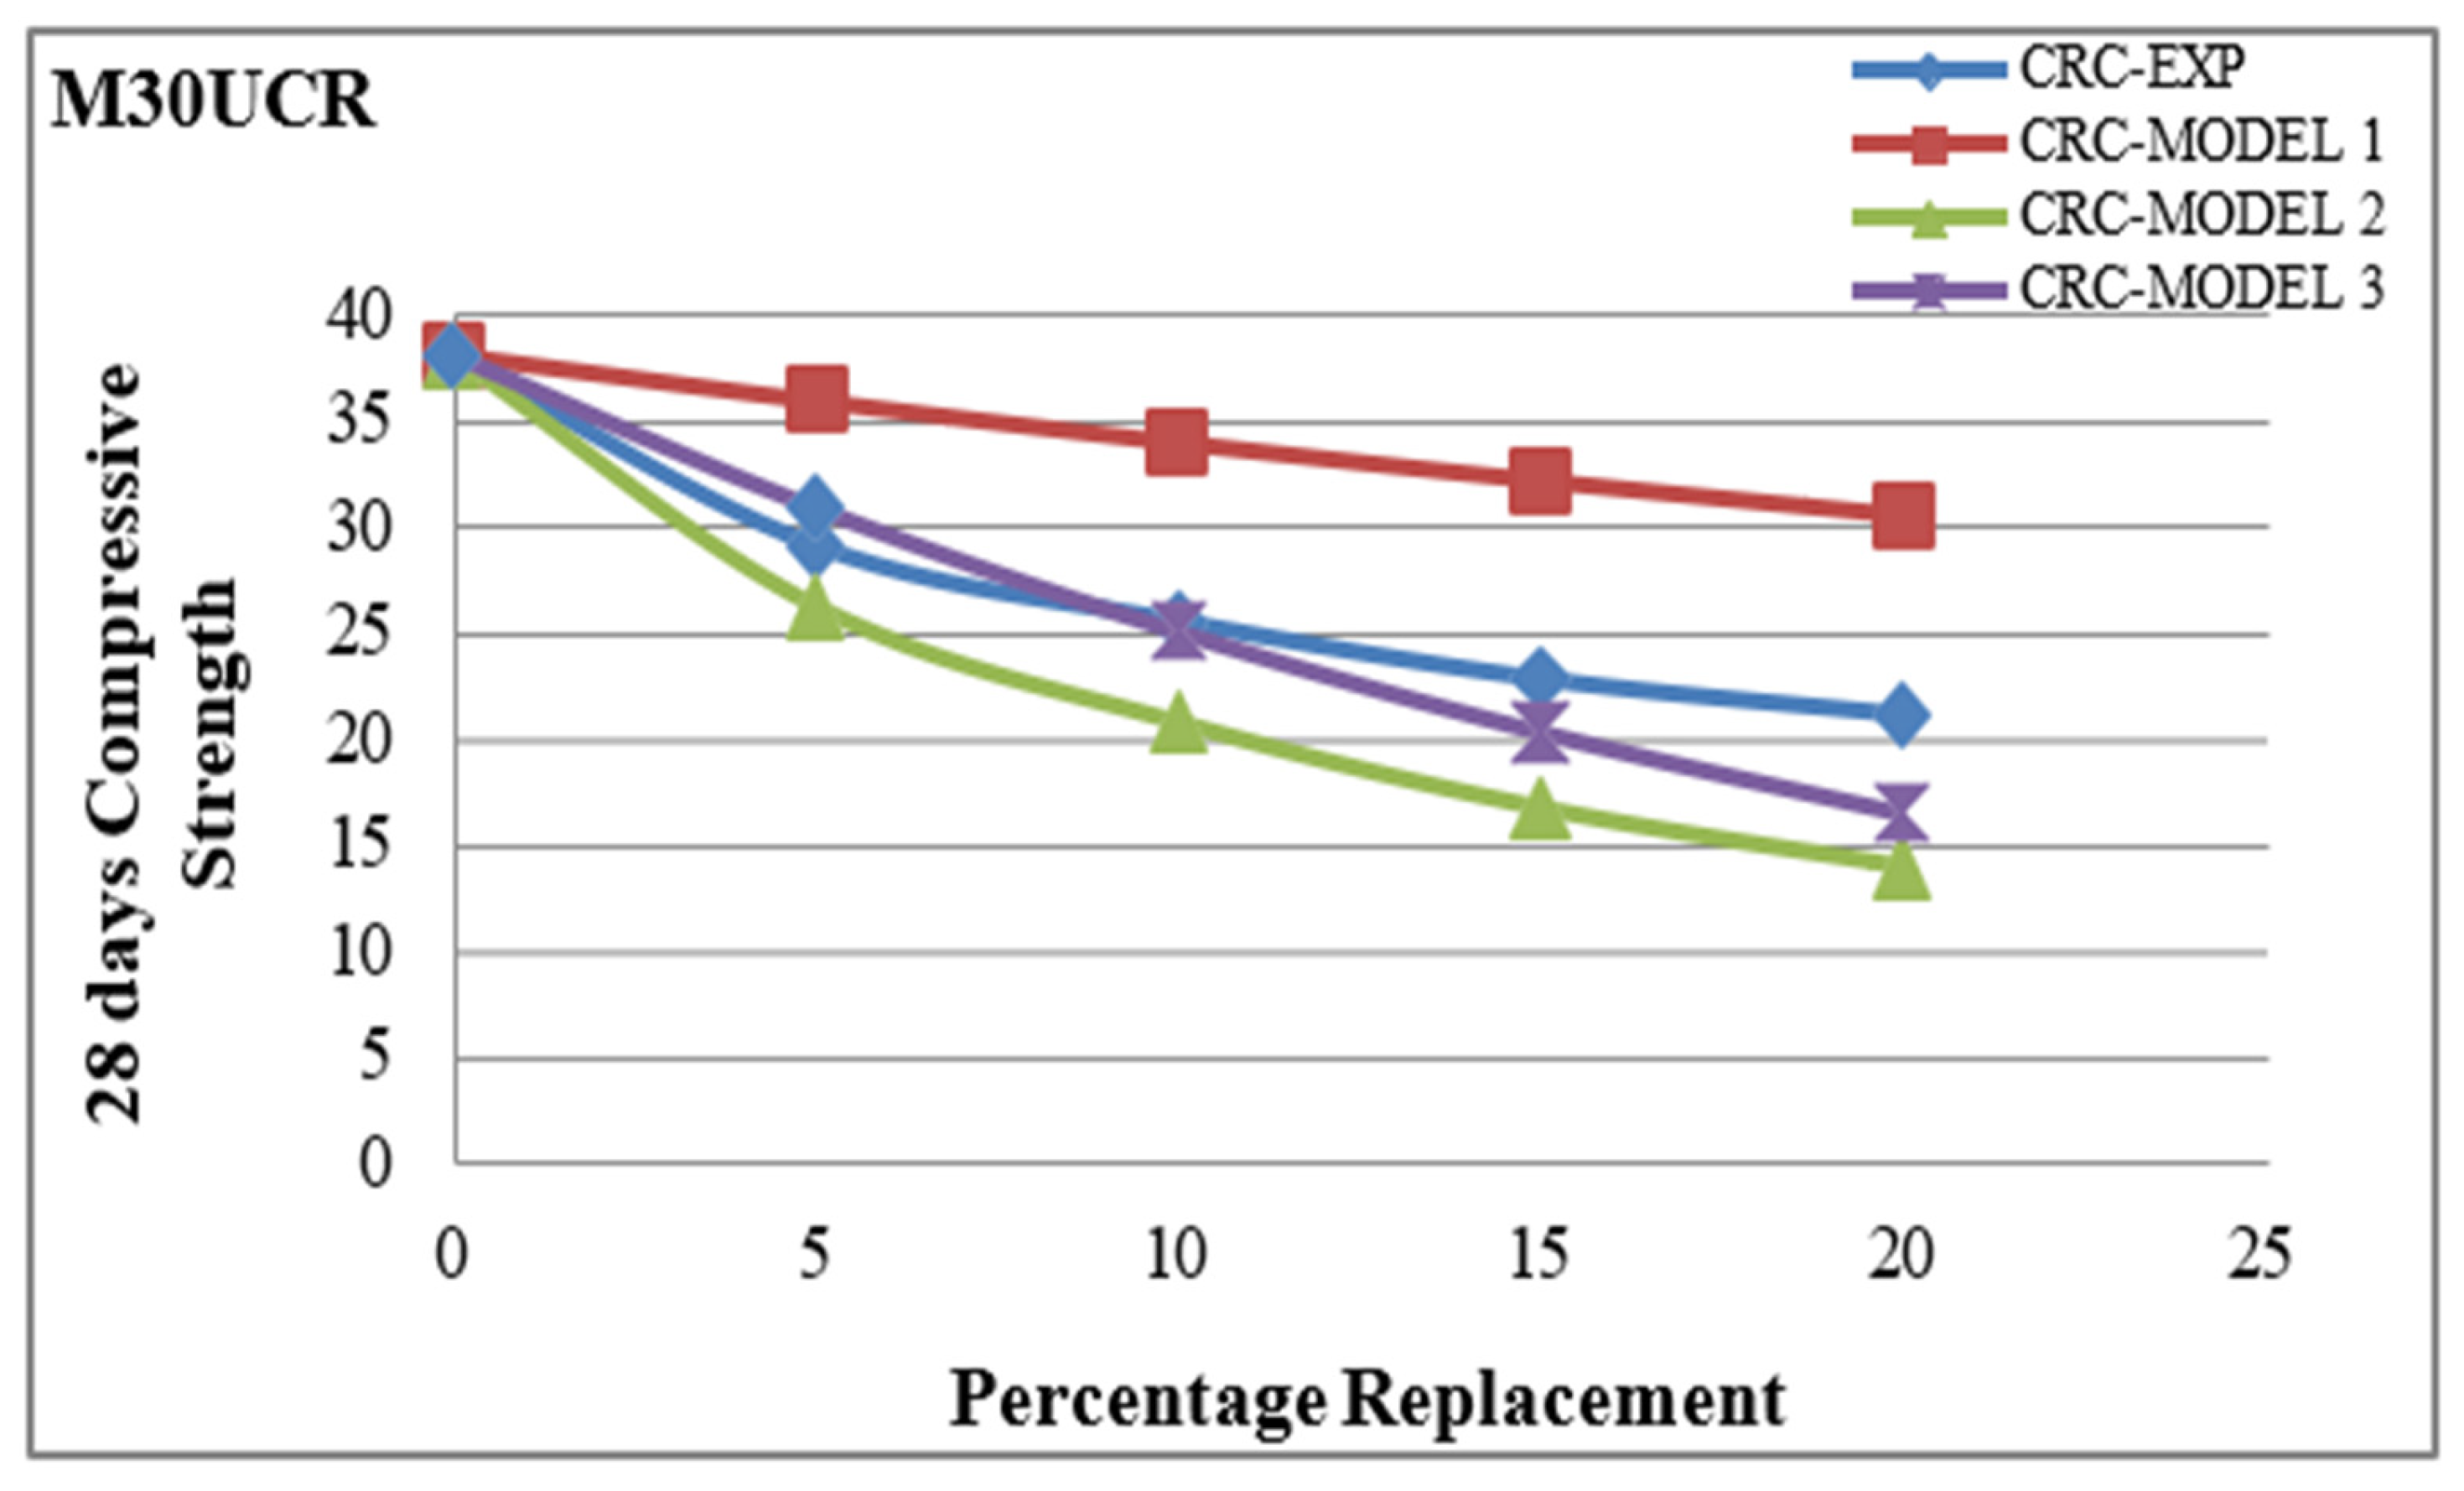
2.4.2. Predictive Compressive Strength of M30 Grade Concrete

The experimental results vis à vis the predictive models are depicted for M30UCR, M30TCR, and M30UCRM with varying partial replacements of fine aggregates, at 5%, 10%, 15%, and 20%, in Figure 6, Figure 7 and Figure 8, respectively.
For M30UCR, the experimental compressive strength values are in alignment with those of Predictive Model 2 and Predictive Model 3. The compressive strength results obtained for the 5% and 10% replacements were almost the same as the predicted values obtained using Model 3. However, the experimental results at 15% and 20% replacement were higher than those of Model-3 and vary by a percentage of 10% to 21%, respectively. The experimental results, in comparison with Model 2, were higher across all the replacement percentages by a varying increment ranging from 9% to 33%. The results were not found to be in alignment with Model 1, as the experimental results were lower by a varying percentage from 23% to 45%. For M30TCR, the compressive strength results obtained for the 5% replacement were almost the same as the predicted values obtained using Model 1. However, the experimental results for the 10%, 15%, and 20% replacements were lower by varying percentages ranging from 19% to 39%. The experimental results, in comparison with Model 2, were higher across all the replacement percentages by a varying increment, ranging from 9% to 33%. The experimental results, in comparison with Model 3, were higher across all the replacement percentages by a varying increment, ranging from 9% to 25%. In the case of M30UCRM, the experimental compressive strength value for the 10% replacement agreed with Predictive Model 1. The experimental results for the 5% replacement were higher than the predicted results from Model 1 and varied by a percentage of 8%, and, for the 15% and 20% replacements, the experimental results were lower than Model 1 by varying percentages ranging from 20% to 30%. The experimental results, in comparison with Model 2, were higher across all the replacement percentages by a varying increment ranging from 9% to 33%. The experimental results, in comparison with Model 3, were higher across all the replacement percentages by a varying increment ranging from 21% to 30%.
The predictive models did not consider the treatment methods and were based on the volumetric partial replacement percentages of crumb rubber in concrete. The predictive models can be refined further by considering the treatment methods and types of admixtures for a more refined and accurate prediction of compressive strength. Very few predictive models are available in the literature for the splittensile strength of crumb rubber concrete, which is a case for further study.

2.5. Microstructural Analysis

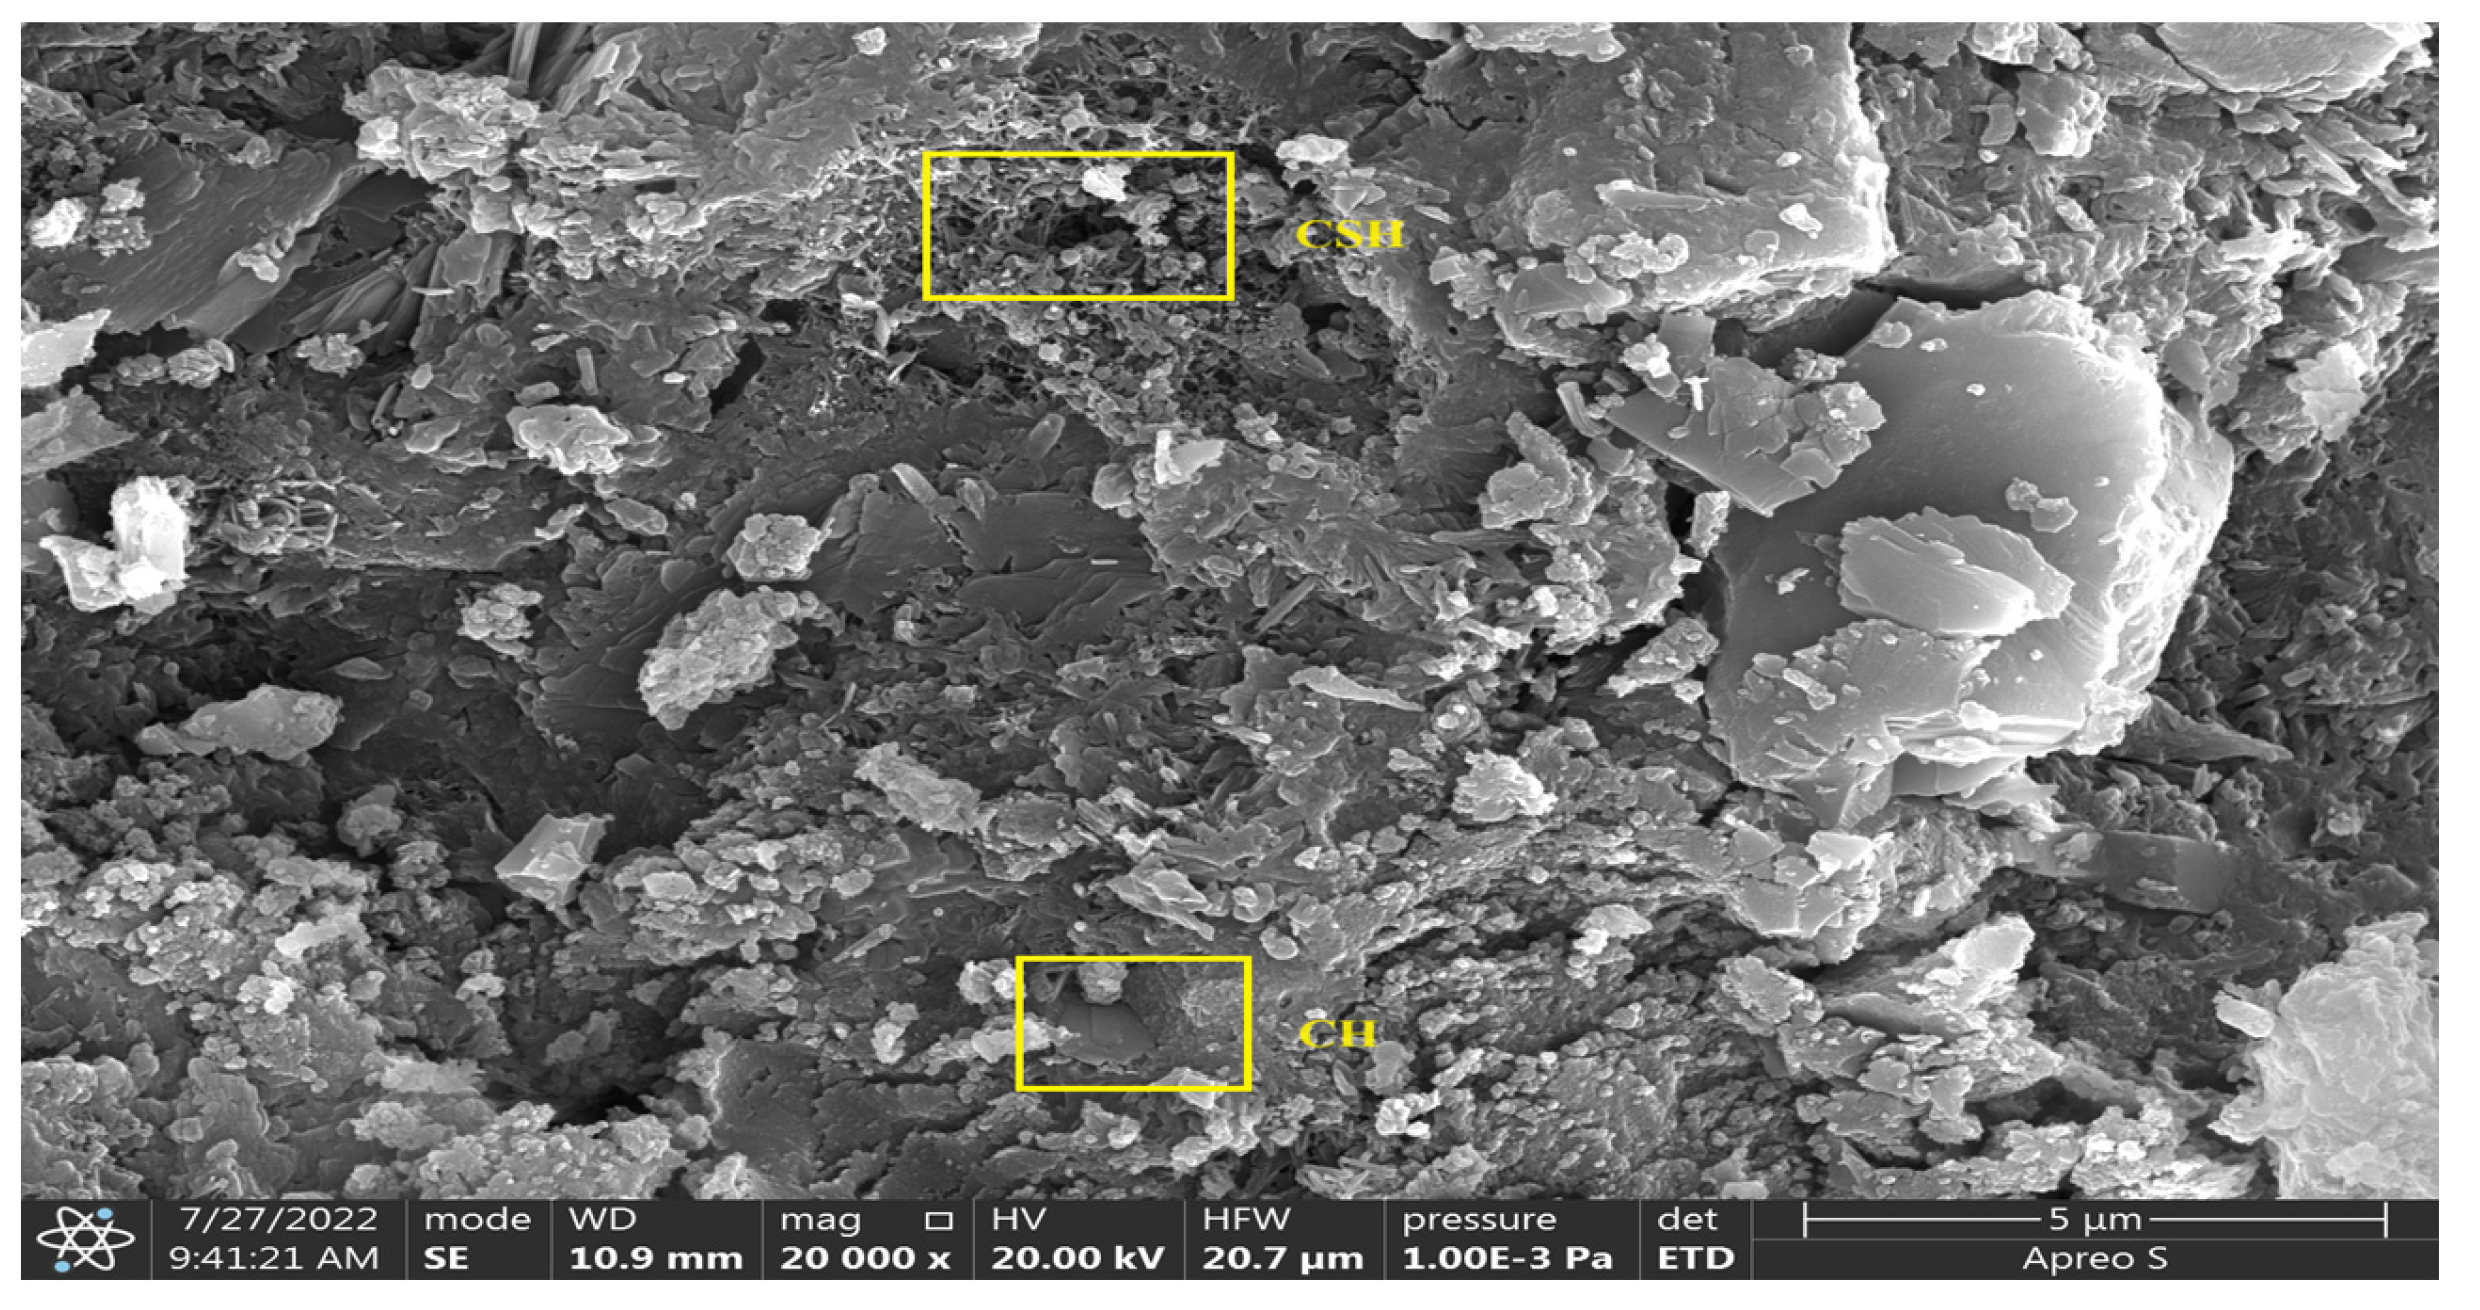
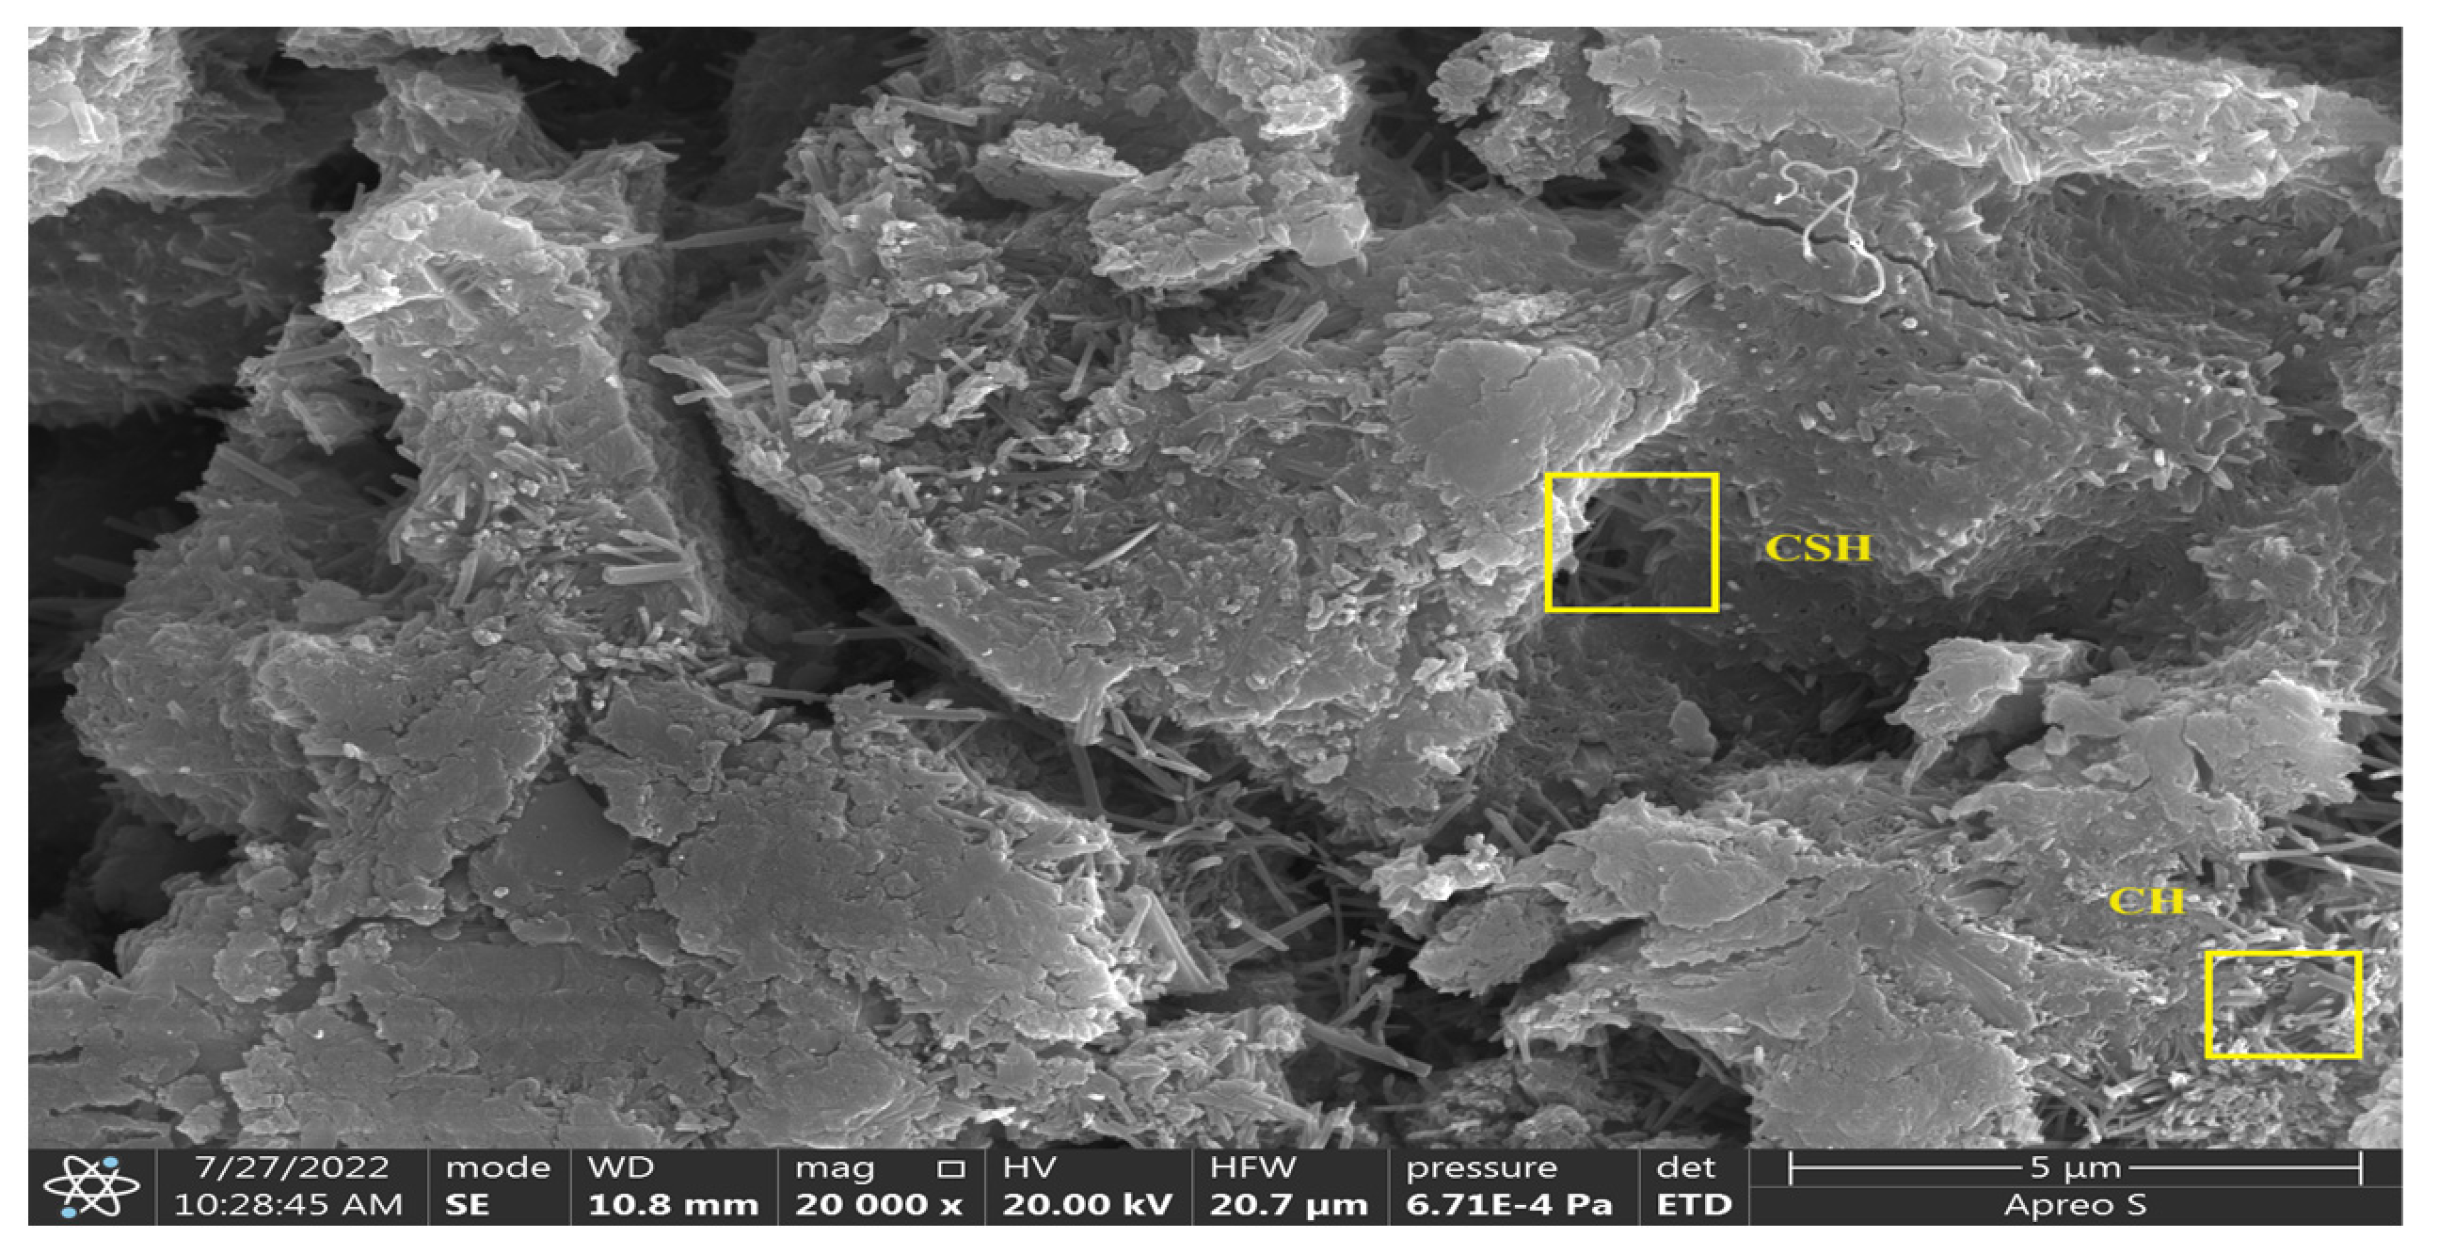
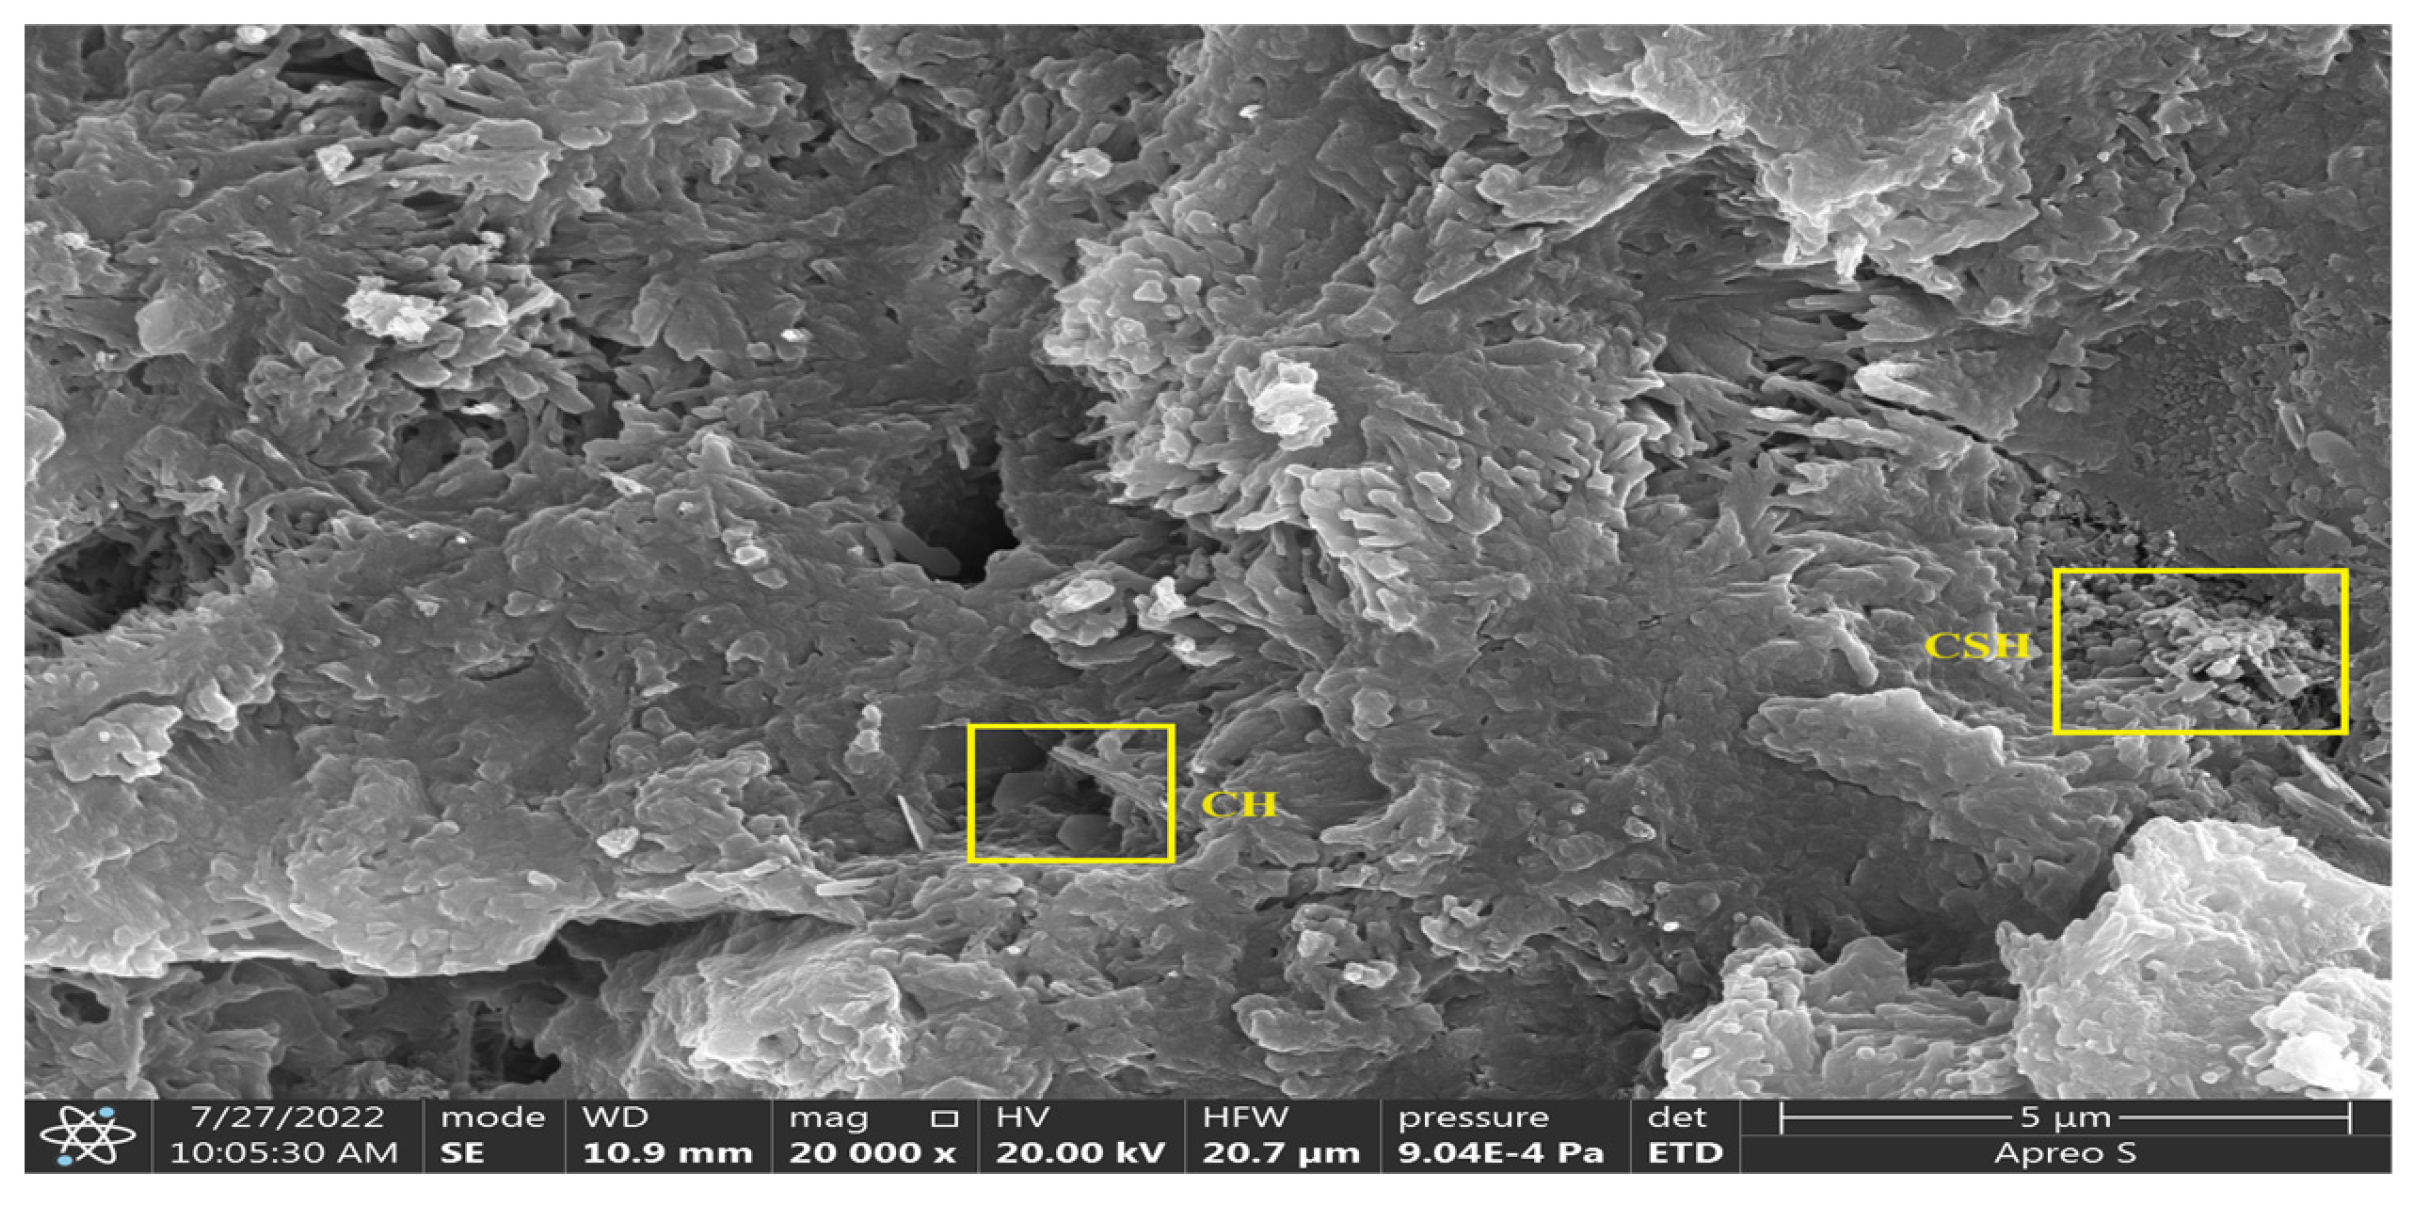
2.5.1. Scanning Electron Microscopy (SEM) Analysis

Images of the M20 grade specimens M20UCR10, M20TCRN10, and M20UCR20, using the APREOSEM equipment, were captured in the scale range of 500 µm to 500 nm. The SEM analysis of the concrete samples with 10% and 20% treated and untreated rubber (Figure 9, Figure 10, Figure 11 and Figure 12) did not seem to have undergone any substantial modifications following the NaOH treatment. In both cases, the microcracks were verifiable. Cauana Melo Copetti et al. [19] reported similar outcomes. It was discovered, through a comparison of the hydration products’ morphology in rubber concrete, that, following the typical 28-day curing, the morphology of the hydration products created between the normal concrete and CRC were similar and comparable, except that the CRC density was lower and the amount of hydration products was larger.

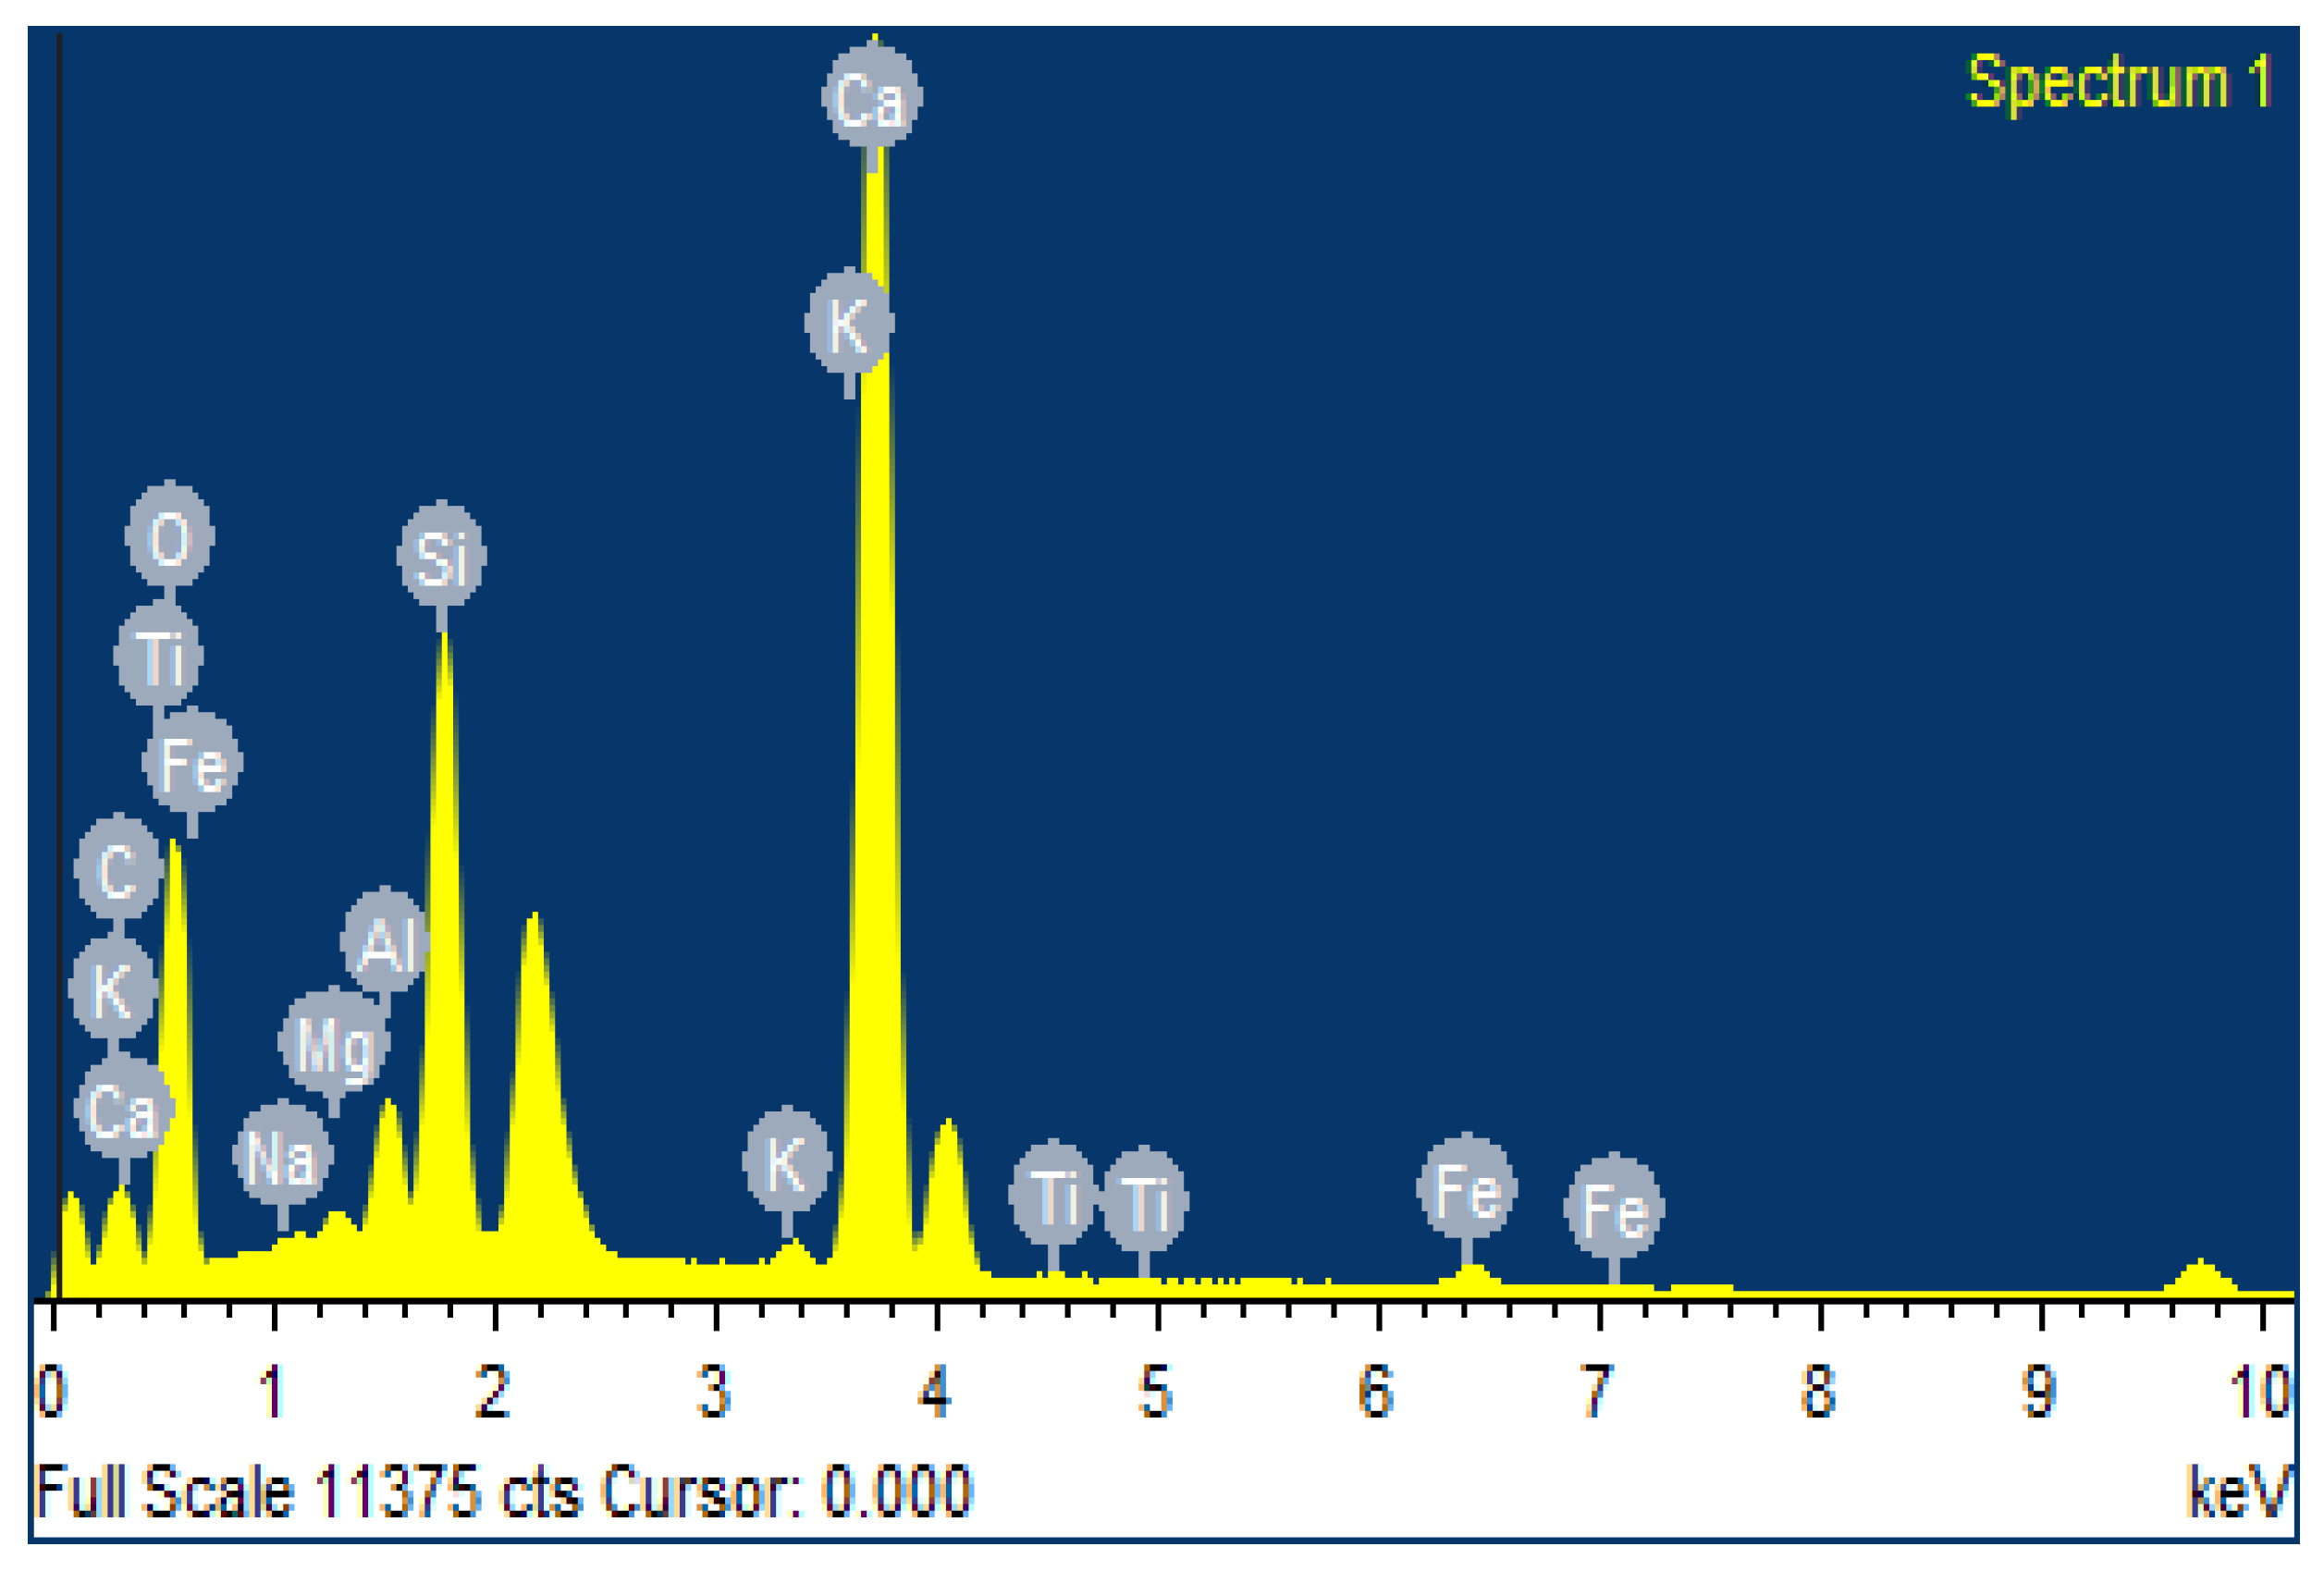
2.5.2. Energy Dispersive X-ray Spectroscopy (EDS)

The images obtained for the M20 grade samples from EDS are presented in Figure 13 and Figure 14. The Ca/Si ratios for M20UCR10, M20UCR20, M20TCR10, and M20TCR20 were 2.44, 2.47, 2.28, and 2.39, respectively. The results were within the hydration products’ acceptable range of 0.8 to 2.5.

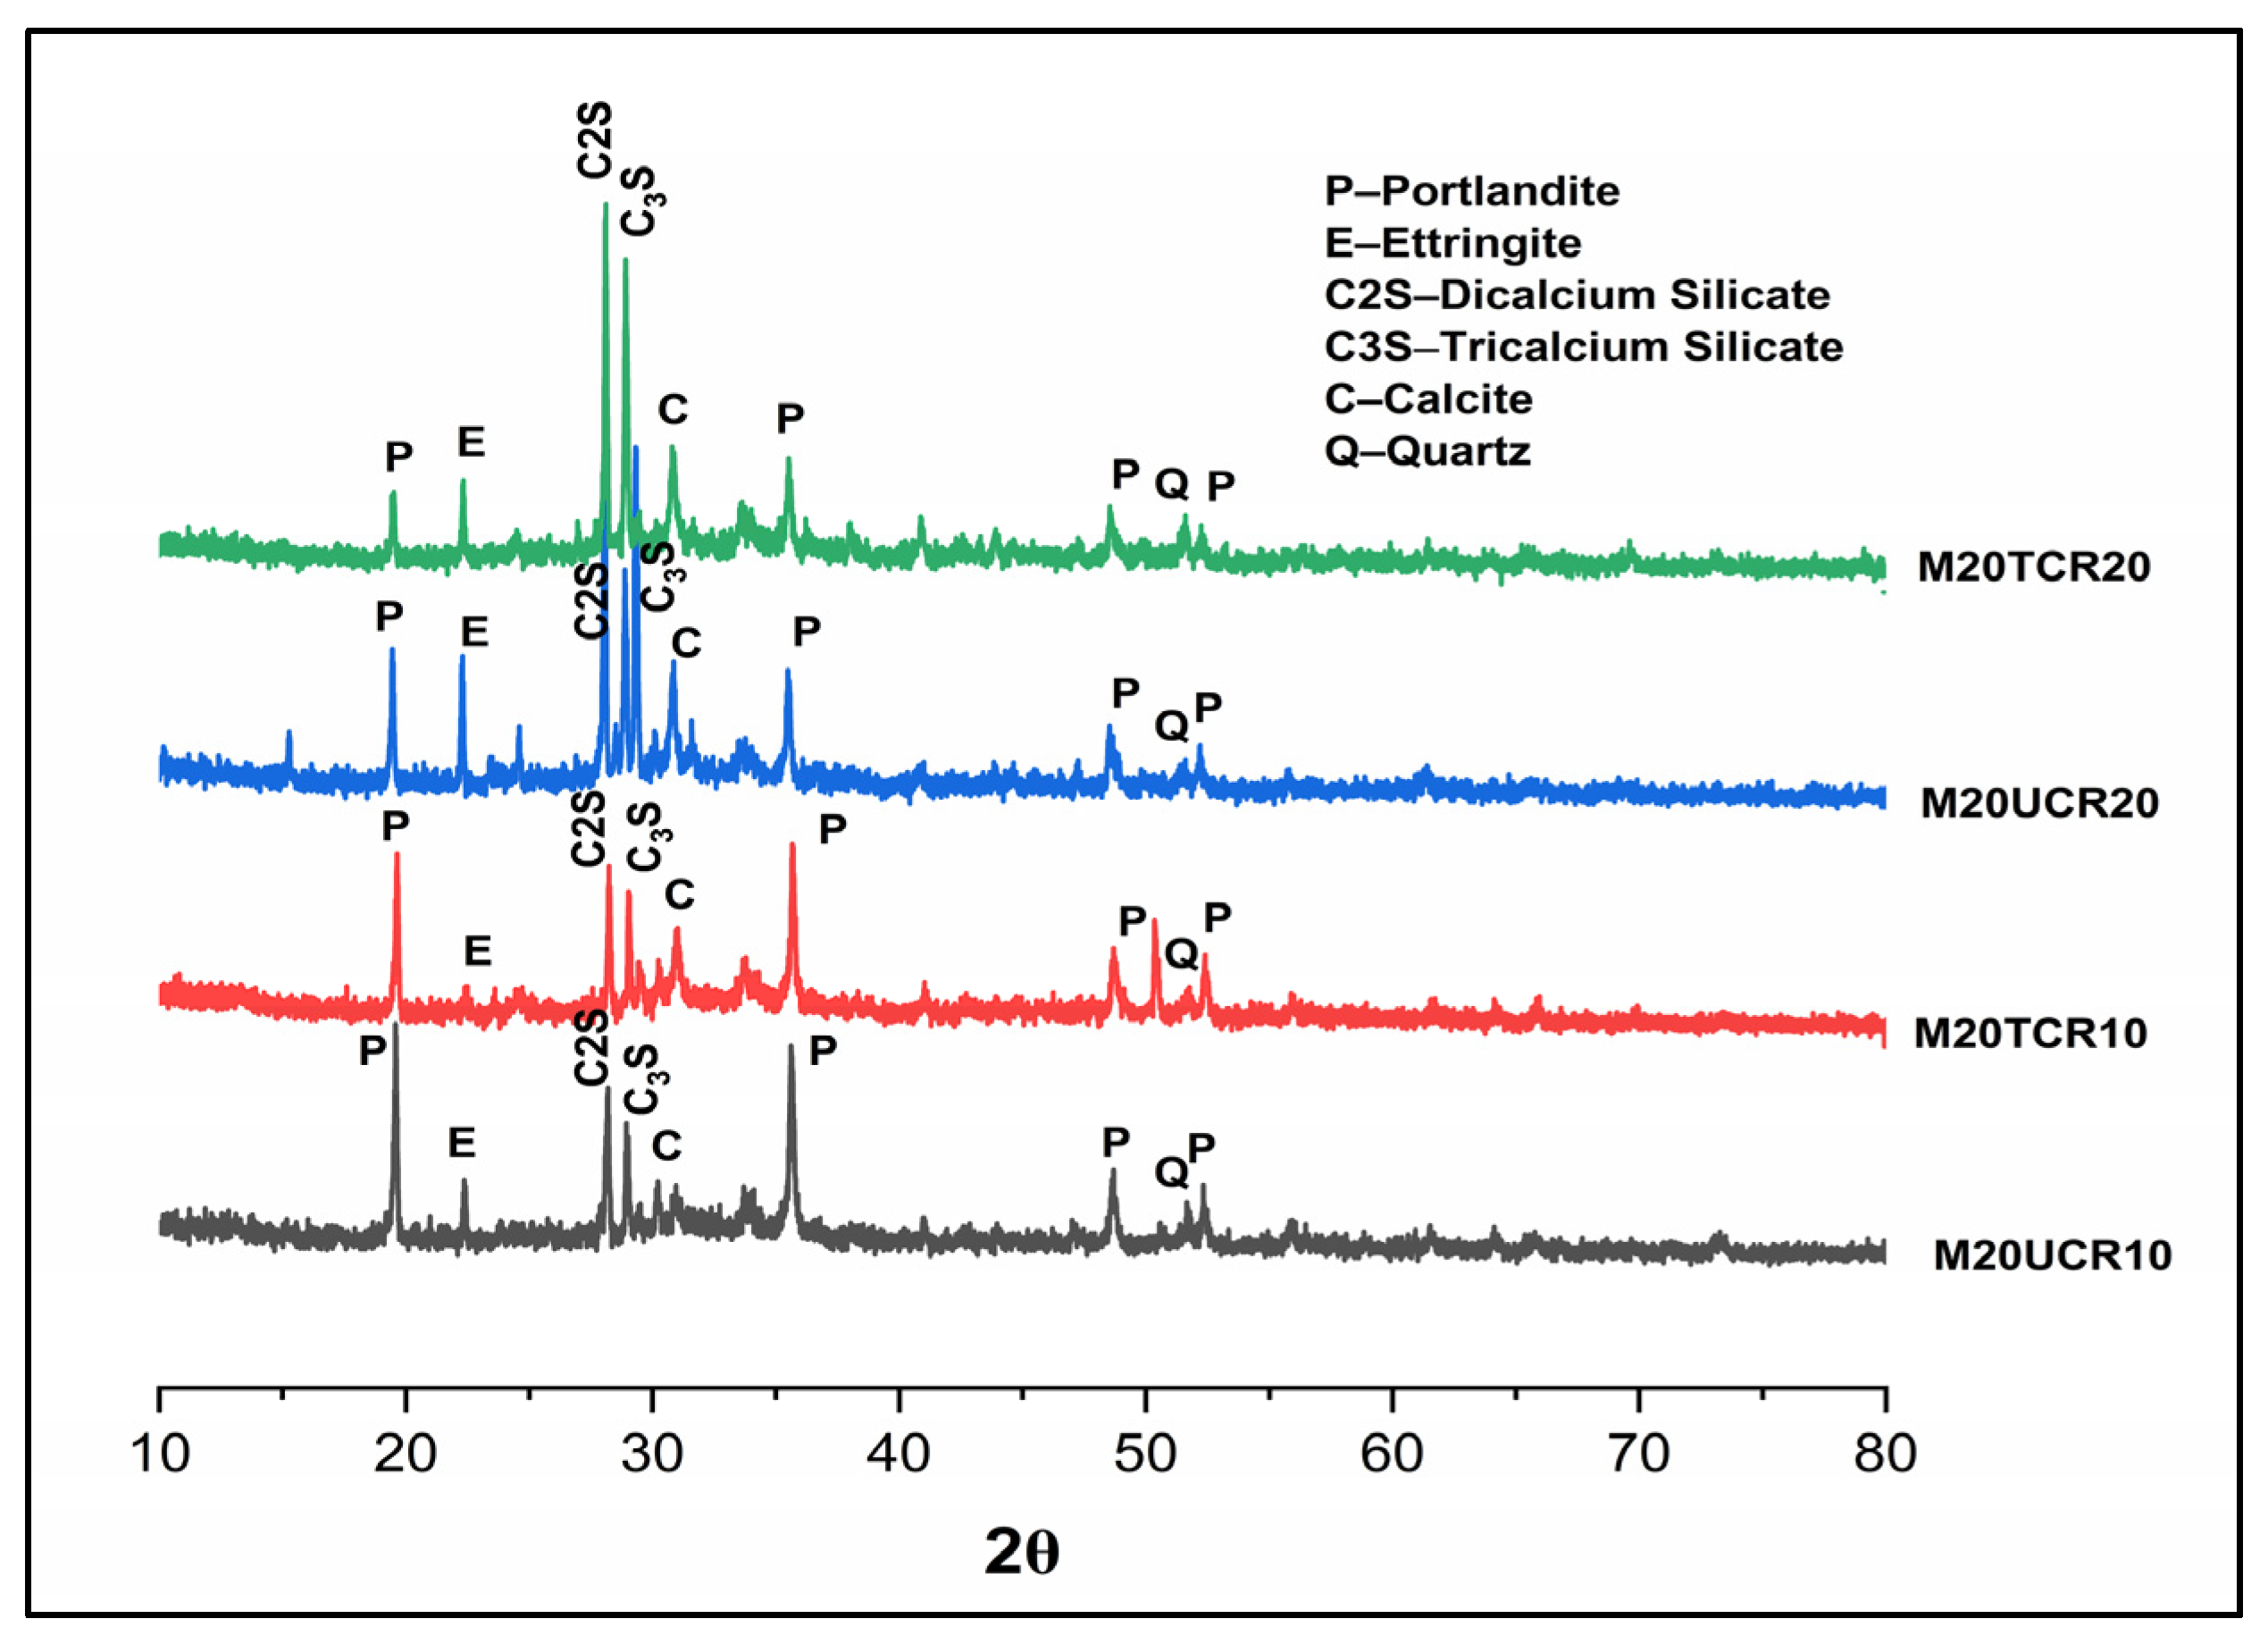
2.5.3. X-ray Diffraction (XRD)

XRD was used to identify the phases of the concrete samples. Because morphological and elemental analyses alone could not reliably identify such secondary deposits, XRD was employed. The XRD peaks (d-spacing) and 2Ɵ values were analyzed, using ORIGINPRO v2024, for the specimens M20UCR10, M20TCR10, M20UCR20, and M20TCR20, and the hydration compounds were identified based on the standard values. The analysis results are shown in Figure 15.

2.6. Life Cycle Assessment

Environmental impact values for various indicators used in the Intergovernmental Panel on Climate Change (IPCC), Life Cycle Impact Assessment (LCIA)IPCC method for M20 grade concrete, M30 grade concrete, and various mixes are presented in Table 5 and Table 6, respectively. The results clearly indicate that the M30 CRC had a higher impact than the M20 CRC across all impact categories. It is also evident that the usage of NaOH solution for pretreatment marginally increased the environmental impacts in comparison to the untreated CRC samples and untreated CRC samples with micro-silica as an admixture.

3. Materials and Methods

3.1. Cement

The widespread preference for Ordinary Portland Cement (OPC) grade 53 in building construction is rooted in its superior mechanical properties and versatility, such as high early strength, enhanced durability, economic efficiency, wide range of applications, compatibility with additives, building code compliance, and consistent quality, which makes it suitable for a broad range of applications. Hence, in this study, OPC 53 grade cement, confirming to IS 12269 (1989) [32], was used. The properties of the cement, namely specific gravity, standard consistency, fineness, and initial setting time were determined [33], and the results are listed in Table 7.

3.2. Fine Aggregate

River sand, locally available after being sifted and cleansed, was used to remove potential organic and inorganic components. To remove large and undesirable organic debris, the sand was sieved with a 4.75 mm mesh. The fineness modulus [34,35,36] and specific gravity of the sand used were 2.41 and 2.44, respectively; the details are listed in Table 8.

3.3. Coarse Aggregate

Coarse aggregate that passed through a 20 mm sieve and was retained on a 16 mm sieve was used. The fineness modulus [34,35] and specific gravity of the coarse aggregate used were 7.18 and 3.0, respectively; the details are listed in Table 9.

3.4. Water

Potable water suitable for human consumption was used for the mixing of the concrete.

3.5. Crumb Rubber

Tires from vehicles and trucks were used to make recycled crumb rubber. During recycling, the steel and tire cords were removed from the tire rubber, leaving it to have a granular consistency. The rubber particle size was further reduced by mechanical grinding, employing equipment such as granulators, hammer mills, or grinding mills, or by using cryogenic grinding, wherein rubber is cooled using liquid nitrogen to a low temperature until it becomes brittle and is then fractured into small particles using mechanical impact. Crumb rubber produced by mechanical grinding was used for this research work, with a rough surface texture that can improve mechanical interlock with the cement matrix and, hence, the strength of concrete. However, the mechanical grinding process produces a wider range of particle sizes, necessitating thorough sieving for uniformity. Color (black alone or black and white) and other characteristics, such as the size and classification of the particles, are modified. The crumb rubber employed in this study passed through a sieve with a mesh size of 2.36 mm but was retained on a mesh size of 1.18 mm, with a specific gravity of 1.154. The properties of the Crumb Rubber are listed in Table 10.

3.6. NaOH Crystals

The pretreatment procedure used in the current study involved soaking crumb rubber in 5 M concentrated NaOH for 20 min. Crumb rubber treated with NaOH for longer than 30 min has a negative impact on the mechanical qualities of crumb rubber [37]. In research contexts where the effectiveness of NaOH concentrations on the pre-treatment of crumb rubber is evaluated for use in concrete, typically a systematic experimental approach is adopted to arrive at the suitable concentration. Initially 10M concentrated NaOH was used; however, due to the high alkalinity of 10M NaOH, the strength of the samples after 7 days curing to assess early strength gain was not adequate. Subsequently, the results, when 5 M NaOH was used for pre-treatment, resulted in an acceptable 60–70% of the strength gain expected at 28 days. Hence, 5 M NaOH solution was used for the pre-treatment of Crumb Rubber. The treated crumb rubber was then rinsed with tap water and allowed to air-dry for 24 h, making it suitable for use in concrete. Figure 16 depicts the NaOH crystals used for the study.

3.7. Powdered Micro-Silica

The use of micro-silica offers several advantages, including an increase in strength, a decrease in thermal cracking owing to the heat generated by the hydration of cement, and an improved resistance to sulfates and acid attacks [15]. As a mineral additive, micro-silica, in the current project, takes the place of cement. By cement weight, 10% of the original material was replaced. Figure 17 depicts the micro-silica used for the study. According to the literature, a replacement of up to 15% of silica fume by weight of the cement can produce the best compressive and tensile strengths. The 28-day compressive strength test results revealed improved strength when 10% silica fume was used in place of cement by weight for this study. The properties of the micro-silica used are listed in Table 11.

3.8. Replacement Ratio Selection and Notations

The density of concrete mixtures is influenced by the aggregate components. There is greater motivation to look for new options because of the high cost of transporting sand and its scarcity. The replacement rates of fine aggregates with crumb rubber by weight were 5%, 10%, 15%, and 20%. M20 and M30 represent the concrete grades; M20CR0 and M30CR0 denote the controlled mixes; UCR denotes untreated concrete; TCR denotes NaOH-treated crumb rubber; UCRM denotes the addition of micro-silica as an admixture in untreated crumb rubber concrete; and 0, 5, 10, 15, and 20 denote the percentages of sand replaced by weight with crumb rubber. The replacement of fine aggregate was restricted to a maximum of 20% to evaluate the utilization of CRC in RCC structural elements of foundations, beams, columns, walls, and slabs.

3.9. Concrete Mix Design

The ratios of cement to fine aggregate to coarse aggregate considered were 1:1.5:3 and 1:1.63:2.8, while the water/cement ratios considered were 0.55 and 0.45 for M20 grade and M30 grade concrete, respectively [38]. The workability test on concrete was performed as per IS 7320 [39]. Casting, curing, compressive strength and split tensile strength tests on concrete were performed according to IS codes 456 [40] and IS516 [41].

3.10. Crumb Rubber Concrete Mechanical Performance Predictive Models

3.10.1. Predictive Model 1

This model was proposed by Reda Taha et al. [21] to predict the compressive strength of crumb rubber concrete. The reduction in compressive strength was directly proportional to the tire crumb rubber content. The model predicts the 28-day compressive strength of rubber concrete, fRC, based on the level of aggregate replacement by tire particles, R, which is represented as follows:
fRC = fc − 0.4496R + 0.004R2 − 1.65 × 10⁻⁵ × R3
where fRC is the predicted 28-day compressive strength of rubber concrete; fc is the 28-day compressive strength of concrete without tire rubber particles; and R is the replacement percentage of the aggregate with crumb rubber tire particles.

3.10.2. Predictive Model 2

This model, called the Strength Reduction Factor model, was proposed by Huang et al. [18]. It is based on the macro porosity theory and has a correlation coefficient of R2 = 0.854, where the experimental values were compared with other proposed models and concluded to be more reliable and accurate. However, the effects of crumb rubber particle size and shape were not considered in this model.
SRFC (VR) = (1 − αvR) × 10−βVR
where SRFc is the Strength Reduction Factor, α is the solid material quantity parameter (α = 0.281), β is the experimental parameter (β = 0.773), and VR is the crumb rubber volume fraction.

3.10.3. Predictive Model 3

This model was proposed by Youssf et al. [22] to predict the compressive strength of CRC. The authors considered a dataset of 148 for the CRC compressive strength to verify the proposed model. The compressive strength was proposed in an exponential form and the advantage was that, when the rubber content Rt equals zero (no rubber), the concrete’s compressive strength was not affected (e0 = 1.0). Thus, the model formula proposed is as follows:
fCRC = fC [e−4.2Rt]
where fC is the compressive strength of the control concrete (without rubber); fCRC is the compressive strength of the crumb rubber concrete; and Rt is the rubber content by volume of the total aggregates.

3.11. Microstructural Characterization

The identification of point-to-point variations in the composition, structure, and microstructure of a material is a crucial component of characterization in materials research. To maximize the performance of all materials, it is essential to understand how elements and phases are distributed in the structures. These studies sought to identify changes in the microstructures, deterioration processes, and their effects on the mechanical characteristics of both types of concrete [42,43].

3.11.1. Scanning Electron Microscopy (SEM)

Scanning electron microscopy (SEM) uses a high-energy electron beam to sweep across a sample surface, in a manner similar to a raster scan. The atoms and electrons of the sample interact, resulting in signals that provide details about the surface topography, composition, and other characteristics of the sample. In SEM, two signals, that is, secondary electrons (SE) and back-scattered electrons (BSE), are primarily measured to gather distinct data about the material. While back-scattered electron (BSE) images provide compositional information that can be distinguished by their atomic numbers, secondary electron (SE) images provide information on the topography of the samples. The brighter an element or phase in a BSE image, the greater its atomic number, according to this rule. However, the composition or constituents of BSE are not specified. Thus, Energy Dispersive X-ray Spectroscopy (EDS) analysis is required. The majority of the secondary electron (SEI) images and energy dispersive spectrometry (EDS) analyses were used for concrete examination.

3.11.2. Energy Dispersive X-ray Spectroscopy

Another well-known method for examining the chemical makeup of materials in SEM is energy dispersive spectrometry. The EDS detector is typically linked to SEM instruments and produces chemical component spectra for quantification.
The presence of desirable and undesirable compounds across the cement hydration phases was ascertained using the EDS report, and the acceptable limits [42] are listed in Table 12.

3.11.3. X-ray Diffraction (XRD)

When used to analyze crystalline materials, X-ray diffraction (XRD) is a useful technique that can provide details on crystallinity, phases, preferred crystal orientation, and other structural factors. To determine the phases, a search of the standard database was conducted after the production of X-ray diffraction peaks by the constructive interference of a monochromatic beam of X-rays dispersed at precise angles from each set of lattice planes in a sample. The expected XRD peaks and d-spacing values [44,45] are listed in Table 13.

3.12. Life Cycle Assessment

The LCA conducted in this study used OpenLCA v2.10 software and the ecoinvent database (v2.2 and v3.10). Exploring alternative Life Cycle Assessment (LCA) methodologies and tools can enrich insights into the environmental impact of crumb rubber concrete. SimaPro and GaBi offer extensive databases and advanced modelling capabilities, potentially highlighting different environmental aspects. The LCA software tool Chain Management by Life Cycle Assessment (CMLCA) focuses on supply chain impacts, offering a unique perspective on upstream and downstream effects. Another LCA tool, Footprint Expert, specializing in carbon and water footprint assessments, could provide a more focused view on specific environmental impacts. Lastly, considering sector-specific LCA approaches might reveal unique insights relevant to specific applications of crumb rubber concrete.
A Life Cycle Assessment (LCA) was performed on conventional and crumb rubber concrete and the the Life Cycle Impact Assessment (LCIA) method chosen was Ecoinvent IPCC 2021. The Intergovernmental Panel on Climate Change (IPCC) was established by the United Nations Environment Programme and the World Meteorological Organization [46]. IPCC assessments furnish governments at all tiers with scientific data for crafting climate policies. These assessments serve as pivotal inputs for global efforts to combat climate change through international negotiations. Drafting and reviewing IPCC reports occurs in multiple stages, ensuring objectivity and transparency throughout the process.

4. Conclusions

In this investigation, treated and untreated crumb rubber were used to partially replace sand in concrete mixtures. The study’s findings lead to the following conclusions:
  • Substituting 5% crumb rubber for M20 and M30 grade concrete and adding micro-silica resulted in the highest compressive and split tensile strengths. Conversely, when 20% crumb rubber replaced untreated concrete, the lowest strengths were observed.
  • A 5 M aqueous solution of NaOH was found to be optimal for the pre-treatment of CRC.
  • A reduction in the slump was observed in CRC samples that underwent NaOH pre-treatment and micro-silica addition; however, the values stayed within the acceptable range, as per IS 456 provisions.
  • The predictive models, focusing on crumb rubber’s volumetric replacement in concrete, overlooked treatment methods. Including these methods and admixture types could refine the models for more accurate compressive strength predictions.
  • According to SEM images, silica fume in concrete helped to fill gaps caused by rubber particle growth, reducing void volume and porosity while increasing density. This resulted in enhanced mechanical properties of the concrete.
  • Lower Ca/Si ratios, as per the EDS results, signified a higher presence of the CSH gel, with low Ca/Si ratio calcium silicate hydrates showing greater stability, compared to high Ca/Si ratio ones. The treated samples M20TCR10 and M20TCR20 exhibited lower Ca/Si ratios than the untreated samples, indicating a higher percentage of CSH and correlating with the improved strength observed in the treated samples.
  • According to the XRD results, different phases of the crystalline structure of CRC were observed. The highest peaks in the XRD results corresponded to the tricalcium silicate (C3S) and dicalcium silicate (C2S) phases, suggesting high strength in the concrete.
  • The comparative LCA analysis between crumb rubber concrete and conventional concrete across different M20 and M30 mixes indicated that incorporating micro-silica into crumb rubber concrete did not result in a significant rise in environmental impacts. However, treating crumb rubber with sodium hydroxide solution led to a slight increase in environmental impacts.
  • The feasibility and economic viability of scaling up crumb rubber concrete production for widespread adoption in the construction sector hinges on a complex array of factors. Despite challenges, the potential environmental advantages and the prospect of enhancing concrete properties may stimulate innovation and investment in this domain.

5. Scope for Future Research

  • The inclusion of pre-treated crumb rubber and micro-silica in concrete mixtures has shown promise in enhanced workability and strength. Building on these results, several other innovative methods and technologies, like incorporating nano-sized particles and applying a nano-coating on crumb rubber particles, could be studied further to improve these properties.
  • Using computational models to optimize the particle size distribution and packing density, involving adjusting the proportions of crumb rubber, micro-silica, and other components, could potentially improve these properties for a more viable and sustainable option.
  • To explore the lifecycle environmental benefits of crumb rubber concrete in specific applications like road construction or building facades, a comparative LCA study can be designed, utilizing a tool like SimaPro for a comprehensive environmental impact assessment.

Author Contributions

Conceptualization and design, analysis and interpretation of the data, and drafting of the paper, M.R.R.; critical review for intellectual content and supervision, J.G.; software, analysis and interpretation of the data, and peer review, Y.P. All authors have read and agreed to the published version of the manuscript.

Funding

This research received no external funding.

Data Availability Statement

The data used for conducting the research are available from the authors and will be shared on reasonable request.

Acknowledgments

The license to carry out the LCA study was granted by Open-LCA and the Eco-invent database, for which the authors are grateful.

Conflicts of Interest

The authors declare no conflicts of interest.

References

  1. Jokar, F.; Khorram, M.; Karimi, G.; Hataf, N. Experimental investigation of mechanical properties of crumbed rubber concrete containing natural zeolite. Constr. Build. Mater. 2019, 208, 651–658. [Google Scholar] [CrossRef]
  2. Wu, Y.-F.; Kazmi, S.M.S.; Munir, M.J.; Zhou, Y.; Xing, F. Effect of compression casting method on the compressive strength, elastic modulus and microstructure of rubber concrete. J. Clean. Prod. 2020, 264, 121746. [Google Scholar] [CrossRef]
  3. Rodríguez-Fernández, I.; Baheri, F.T.; Cavalli, M.C.; Poulikakos, L.D.; Bueno, M. Microstructure analysis and mechanical performance of crumb rubber modified asphalt concrete using the dry process. Constr. Build. Mater. 2020, 259, 119662. [Google Scholar] [CrossRef]
  4. Roychand, R.; Gravina, R.J.; Zhuge, Y.; Ma, X.; Mills, J.E.; Youssf, O. Practical rubber pre-treatment approch for concrete use—An experimental study. J. Compos. Sci. 2021, 5, 143. [Google Scholar] [CrossRef]
  5. Abdelmonem, A.; El-Feky, M.; Nasr, E.-S.A.; Kohail, M. Performance of high strength concrete containing recycled rubber. Constr. Build. Mater. 2019, 227, 116660. [Google Scholar] [CrossRef]
  6. Ansari, M.T.; Sakthieswaran, N.; Babu, O.G. Experimental study of an eco-friendly concrete by inbuilt with treated crumb rubber. Mater. Today Proc. 2021, 37, 1028–1031. [Google Scholar] [CrossRef]
  7. Gravina, R.J.; Xie, T. Toward the development of sustainable concrete with Crumb Rubber: Design-oriented Models, Life-Cycle-Assessment and a site application. Constr. Build. Mater. 2022, 315, 125565. [Google Scholar] [CrossRef]
  8. Rajagopal, M.R.; Bhavya, M.; Kumari, G.J. Study on the impact of pre-treatment method and admixture on the mechanical and durability prop-erties of crumb rubber concrete. AIP Conf. Proc. 2024, 3010, 020010. [Google Scholar]
  9. Ren, F.; Mo, J.; Wang, Q.; Ho, J.C.M. Crumb rubber as partial replacement for fine aggregate in concrete: An overview. Constr. Build. Mater. 2022, 343, 128049. [Google Scholar] [CrossRef]
  10. Xiao, R.; Shen, Z.; Si, R.; Polaczyk, P.; Li, Y.; Zhou, H.; Huang, B. Alkali-activated slag (AAS) and OPC-based composites containing crumb rubber aggregate: Physi-co-mechanical properties, durability and oxidation of rubber upon NaOH treatment. J. Clean. Prod. 2022, 367, 132896. [Google Scholar] [CrossRef]
  11. Emam, E.; Yehia, S. Experimental study on enhanced crumb rubber concrete. Int. J. Sci. Eng. Res. 2018, 9, 1240–1247. [Google Scholar]
  12. Adeboje, A.O.; Kupolati, W.K.; Sadiku, E.R.; Ndambuki, J.M. Characterization of modified crumb rubber concrete. Int. J. Sustain. Dev. Plan. 2020, 15, 377–383. [Google Scholar] [CrossRef]
  13. Li, Y.; Zhang, X.; Wang, R.; Lei, Y. Performance enhancement of rubberised concrete via surface modification of rubber: A review. Constr. Build. Mater. 2019, 227, 116691. [Google Scholar] [CrossRef]
  14. Najim, K.; Hall, M. Mechanical and dynamic properties of self-compacting crumb rubber modified concrete. Constr. Build. Mater. 2012, 27, 521–530. [Google Scholar] [CrossRef]
  15. Pelisser, F.; Zavarise, N.; Longo, T.A.; Bernardin, A.M. Concrete made with recycled tire rubber: Effect of alkaline activation and silica fume addition. J. Clean. Prod. 2011, 19, 757–763. [Google Scholar] [CrossRef]
  16. Rajan, R.G.; Sakthieswaran, N.; Babu, O.G. Experimental investigation of sustainable concrete by partial replacement of fine aggregate with treated waste tire rubber by acidic nature. Mater. Today Proc. 2021, 37, 1019–1022. [Google Scholar] [CrossRef]
  17. Pham, T.M.; Lim, Y.Y.; Malekzadeh, M. Effect of pre-treatment methods of crumb rubber on strength, permeability and acid attack resistance of rub-berized geopolymer concrete. J. Build. Eng. 2021, 41, 102448. [Google Scholar]
  18. Huang, W.; Huang, X.; Xing, Q.; Zhou, Z. Strength reduction factor of crumb rubber as fine aggregate replacement in concrete. J. Build. Eng. 2020, 32, 101346. [Google Scholar] [CrossRef]
  19. Copetti, C.M.; Borges, P.M.; Squiavon, J.Z.; da Silva, S.R.; Andrade, J.J.d.O. Evaluation of tire rubber surface pre-treatment and silica fume on physical-mechanical behavior and microstructural properties of concrete. J. Clean. Prod. 2020, 256, 120670. [Google Scholar] [CrossRef]
  20. Wang, J.; Guo, Z.; Yuan, Q.; Zhang, P.; Fang, H. Effects of ages on the ITZ microstructure of crumb rubber concrete. Constr. Build. Mater. 2020, 254, 119329. [Google Scholar] [CrossRef]
  21. Reda Taha, M.M.; El-Dieb, A.S.; Abd El-Wahab, M.A.; Abdel-Hameed, M.E. Mechanical, fracture, and microstructural investigations of rubber concrete. J. Mater. Civ. Eng. 2008, 20, 640–649. [Google Scholar] [CrossRef]
  22. Youssf, O.; ElGawady, M.A.; Mills, J.E.; Ma, X. Prediction of Crumb Rubber Concrete Strength. Ph.D. Thesis, University of South Australia, Adelaide, Australia, 2014. [Google Scholar]
  23. Assaggaf, R.A.; Ali, M.R.; Al-Dulaijan, S.U.; Maslehuddin, M. Properties of concrete with untreated and treated crumb rubber—A review. J. Mater. Res. Technol. 2021, 11, 1753–1798. [Google Scholar] [CrossRef]
  24. Alawais, A.; West, R.P. Ultra-violet and chemical treatment of crumb rubber aggregate in a sustainable concrete mix. J. Struct. Integr. Maint. 2019, 4, 144–152. [Google Scholar] [CrossRef]
  25. Onuaguluchi, O. Effects of surface pre-coating and silica fume on crumb rubber-cement matrix interface and cement mortar properties. J. Clean. Prod. 2015, 104, 339–345. [Google Scholar] [CrossRef]
  26. He, L.; Ma, Y.; Liu, Q.; Mu, Y. Surface modification of crumb rubber and its influence on the mechanical properties of rubber-cement concrete. Constr. Build. Mater. 2016, 120, 403–407. [Google Scholar] [CrossRef]
  27. Su, H.; Yang, J.; Ghataora, G.S.; Dirar, S. Surface modified used rubber tire aggregates: Effect on recycled concrete performance. Mag. Concr. Res. 2015, 67, 680–691. [Google Scholar] [CrossRef]
  28. Dong, Q.; Huang, B.; Shu, X. Rubber modified concrete improved by chemically active coating and silane coupling agent. Constr. Build. Mater. 2013, 48, 116–123. [Google Scholar] [CrossRef]
  29. Wang, J.; Dai, Q.; Si, R.; Guo, S. Mechanical, durability, and microstructural properties of macro synthetic polypropylene (PP) fi-ber-reinforced rubber concrete. J. Clean. Prod. 2019, 234, 1351–1364. [Google Scholar] [CrossRef]
  30. Means, P.; Guggemos, A. Framework for Life Cycle Assessment (LCA) Based Environmental Decision Making During the Conceptual Design Phase for Commercial Buildings. Procedia Eng. 2015, 118, 802–812. [Google Scholar] [CrossRef]
  31. Saleem, M.; Chhipi-Shrestha, G.; Túlio Barbosa Andrade, M.; Dyck, R.; Ruparathna, R.; Hewage, K.; Sadiq, R. Life Cycle Thinking–Based Selection of Building Facades. J. Archit. Eng. 2018, 24, 04018029. [Google Scholar] [CrossRef]
  32. IS: 12269; 53 Grade Ordinary Portland Cement. 1987. Available online: https://law.resource.org/pub/in/bis/S03/is.12269.1987.pdf (accessed on 4 January 2022).
  33. IS: 4031 (Part1); Method of Physical Tests for Hydraulic Cement. 1996. Available online: https://law.resource.org/pub/in/bis/S03/is.12269.1987.pdf (accessed on 4 January 2022).
  34. IS: 383-1970; Specification for Coarse and Fine Aggregates from Natural Sources for Concrete. Available online: https://law.resource.org/pub/in/bis/S03/is.383.1970.pdf (accessed on 4 January 2022).
  35. IS: 2386 (Part I); Methods of Test for Aggregates for Concrete Part I Particle Size and Shape. 1963. Available online: https://law.resource.org/pub/in/bis/S03/is.2386.1.1963.pdf (accessed on 4 January 2022).
  36. IS: I 2720 (Part III); Methods of Test for Soils Part III Determination of Specific Gravity. 1980. Available online: https://law.resource.org/pub/in/bis/S03/is.2720.3.1.1980.pdf (accessed on 4 January 2022).
  37. Jie, X.U.; Yao, Z.; Yang, G.; Han, Q. Research on crumb rubber concrete: From a multi-scale review. Constr. Build. Mater. 2020, 232, 117282. [Google Scholar]
  38. IS: 10262; Concrete Mix Proportioning—Guidelines. 2009. Available online: https://law.resource.org/pub/in/bis/S03/is.10262.2009.pdf (accessed on 4 January 2022).
  39. IS: 7320; Specification for Concrete Slump Test Apparatus. 1974. Available online: https://law.resource.org/pub/in/bis/S03/is.7320.1974.pdf (accessed on 4 January 2022).
  40. IS: 456; Plain and Reinforced Concrete—Code of Practice. 2000. Available online: https://law.resource.org/pub/in/bis/S03/is.456.2000.pdf (accessed on 4 January 2022).
  41. IS: 516-1959; Methods of Tests or Strength of Concrete. Available online: https://law.resource.org/pub/in/bis/S03/is.516.1959.pdf (accessed on 4 January 2022).
  42. Mehta, P.K.; Monteiro, P.J.M. Concrete: Microstructure, Properties, and Materials; McGraw-Hill Education: New York, NY, USA, 2014. [Google Scholar]
  43. Neville, A.M.; Brooks, J.J. Concrete Technology; Longman Scientific & Technical: London, UK, 1987; Volume 438. [Google Scholar]
  44. Sri Rama Chand, M.; Rathish Kumar, P.; Swamy Naga Ratna Giri, P.; Rajesh Kumar, G. Performance and microstructure characteristics of self-curing self-compacting concrete. Adv. Cem. Res. 2018, 30, 451–468. [Google Scholar] [CrossRef]
  45. Bellum, R.R.; Venkatesh, C.; Madduru, S.R.C. Influence of red mud on performance enhancement of fly ash-based geopolymer concrete. Innov. Infrastruct. Solut. 2021, 6, 215. [Google Scholar] [CrossRef]
  46. Pamu, Y.; Alugubelli, S. A comparative study of environmental impacts due to conventional and sustainable concrete. Mater. Today Proc. 2023, 92, 112–120. [Google Scholar] [CrossRef]
Figure 1. Tensile strength of M20 grade CRC.
Recycling 09 00032 g001
Figure 2. Tensile strength of M30 grade CRC.
Recycling 09 00032 g002
Figure 3. M20UCR results.
Recycling 09 00032 g003
Figure 4. M20TCR results.
Recycling 09 00032 g004
Figure 5. M20UCRM results.
Recycling 09 00032 g005
Figure 6. M30UCR results.
Recycling 09 00032 g006
Figure 7. M30TCR results.
Recycling 09 00032 g007
Figure 8. M30UCRM results.
Recycling 09 00032 g008
Figure 9. SEM analysis of M20UCR10 at 5 µm.
Recycling 09 00032 g009
Figure 10. SEM analysis of M20TCR10 at 5 µm.
Recycling 09 00032 g010
Figure 11. SEM analysis of M20UCR20 at 5 µm.
Recycling 09 00032 g011
Figure 12. SEM analysis of M20TCR20 at 5 µm.
Recycling 09 00032 g012
Figure 13. EDS image of M20UCR10.
Recycling 09 00032 g013
Figure 14. EDS image of M20TCR10.
Recycling 09 00032 g014
Figure 15. XRD images of M20 grade specimens.
Recycling 09 00032 g015
Figure 16. NaOH crystals.
Recycling 09 00032 g016
Figure 17. Micro-silica.
Recycling 09 00032 g017
Table 1. Trial mix test results for M20 and M30 grade concrete.
Type of ConcreteM20CR0M30CR0M20UCR10M30UCR10M20TCR10M30TCR10
Compressive * Strength (MPa)18.9528.0017.6025.4317.8226.46
* When the cubes were tested after 7 d of curing, the concrete should have attained 65% of its target compressive strength. After seven days of curing, the acceptable compressive strength range of M20 concrete was 17.55 N/mm2, and, for M30 grade concrete, it was 24.86 N/mm2.
Table 2. Slump values for the M20 and M30 grades of concrete.
Type of concreteM20CR0M20UCR5M20UCR10M20UCR15M20UCR20M20TCRN5M20TCRN10M20TCRN15M20TCRN20M20UCRM5M20UCRM10M20UCRM15M20UCRM20
Slump value (mm)7290981061206579869062709295
Type of concreteM30CR0M30UCR5M30UCR10M30UCR15M30UCR20M30TCRN5M20TCRN10M30TCRN15M30TCRN20M30UCRM5M30UCRM10M30UCRM15M30UCRM20
Slump value (mm)648087991136070828755607488
Table 3. M20 grade concrete’s compressive strength results.
Type of
Specimen
Compressive
Strength
(Mpa)
Predictive
Model l
(Mpa)
Predictive
Model 2
(Mpa)
Predictive
Model 3
(Mpa)
M20CRO28282828
M20UCR525.625.8523.0930.8
M20UCR1024223.8919.6924.97
M20UCR1520.3722.1014.9420.24
M20UCR201420.489.2616.4
M20TCR0527.3225.8524.6430.8
M20TCR102523.8920.3424.97
M20TCR1523.2622.1017.0620.24
M20TCR2017.1420.4811.3316.4
M20UCRM0528.425.8525.6230.8
M20UCRM1026.6223.8921.6524.97
M20UCRM1524.0422.1017.6320.24
M20UCRM2019.5820.4812.9416.4
Table 4. M30 grade compressive strength results.
Type of SpecimenCompressive
Strength MPa
Predictive
Model 1 (Mpa)
Predictive Model 2 (Mpa)Predictive Model 3 (Mpa)
M30CR03838.003838
M30UCR52935.8526.1630.8
M30UCR1025.4333.8920.6924.97
M30UCR1522.732.1016.6520.24
M30UCR202130.4813.8816.4
M30TCR053435.8530.6730.8
M30TCR1028.4633.8923.1524.97
M30TCR1523.532.1017.2420.24
M30TCR2021.8530.4814.4516.4
M30UCRM0539.235.8535.3630.8
M30UCRM1033.7333.8927.4424.97
M30UCRM1526.5832.1019.4920.24
M30UCRM2023.3430.4815.4316.4
Table 5. Environmental impacts of M20 CRC.
Climate ChangeImpact CategoryImpact Results for Different Mixes (kg CO2-Eq)
M20M20UCR05M20UCR10M20TCR05M20TCR10M20UCRM05M20UCRM10
BiogenicGlobal temperature change potential (GTP100)0.7350.7320.7301.3181.9010.7390.737
Global temperature change potential (GTP50)1.6251.6201.6162.9164.2071.6351.630
Global warming potential (GWP100)4.2204.2074.1947.57110.9224.2454.232
Global warming potential (GWP20)12.45612.41812.38122.34832.23912.53012.493
Global warming potential (GWP500)1.1251.1221.1182.0192.9121.1321.129
Including SLCFs–global temperature change potential (GTP100)0.8480.8460.8431.4602.0710.8570.855
Including SLCFs–global warming potential (GWP100)4.9514.9384.9258.48412.0165.0074.993
Including SLCFs–global warming potential (GWP20)14.70314.66414.62525.15235.60114.87014.831
FossilGlobal temperature change potential (GTP100)28,361.22228,343.00528,324.78829,572.41330,783.60428,424.16228,405.945
Global temperature change potential (GTP50)28,483.16028,464.61728,446.07429,720.44730,957.73428,547.16328,528.620
Global warming potential (GWP100)28,810.78528,791.40728,772.02930,116.88531,422.98428,877.64428,858.266
Global warming potential (GWP20)29,858.86229,836.79829,814.73431,385.46932,912.07529,934.85829,912.795
Global warming potential (GWP500)28,393.75228,375.47328,357.19329,612.27630,830.79928,456.98328,438.704
Including SLCFs–global temperature change potential (GTP100)28,417.76228,399.42128,381.07929,631.01430,844.26628,480.98728,462.645
Including SLCFs–global warming potential (GWP100)28,928.11428,908.47928,888.84330,238.49331,548.87228,995.56628,975.930
Including SLCFs–global warming potential (GWP20)30,125.20430,102.55630,079.90831,661.52733,197.85030,202.54630,179.898
Land UseLand use–global temperature change potential (GTP100)17.50517.49717.48820.03822.57117.53517.526
Land use–global temperature change potential (GTP50)17.50717.49817.49020.04122.57517.53717.528
Land use–global warming potential (GWP100)17.51217.50317.49420.04922.58717.54117.533
Land use–global warming potential (GWP20)17.52617.51817.50920.07622.62517.55717.548
Land use–global warming potential (GWP500)17.50617.49717.48920.04022.57317.53617.527
Land use, including SLCFs–global temperature change potential (GTP100)17.51417.50517.49620.05322.59317.54417.535
Land use, including SLCFs–global warming potential (GWP100)17.52917.52017.51220.08022.63117.55917.551
Land use, including SLCFs–global warming potential (GWP20)17.56617.55717.54820.14622.72517.59717.588
Table 6. Environmental impacts of M30 CRC.
Climate ChangeImpact CategoryImpact Results for Different Mixes (kg CO2-Eq)
M30M30UCR05M30UCR10M30TCR05M30TCR10M30UCRM05M30UCRM10
BiogenicGlobal temperature change potential (GTP100)0.7310.7280.7261.3712.0110.7350.732
Global temperature change potential (GTP50)1.6171.6111.6063.0334.4491.6261.621
Global warming potential (GWP100)4.1974.1834.1697.87411.5514.2224.208
Global warming potential (GWP20)12.39012.34812.30723.24434.09812.46212.420
Global warming potential (GWP500)1.1191.1161.1122.1003.0801.1261.122
Including SLCFs–global temperature change potential (GTP100)0.8450.8420.8401.5162.1870.8540.851
Including SLCFs–global warming potential (GWP100)4.9324.9174.9038.80812.6844.9874.972
Including SLCFs–global warming potential (GWP20)14.64614.60314.56026.11237.57714.81214.769
FossilGlobal temperature change potential (GTP100)28,736.16628,716.11328,696.06030,064.88731,393.60828,798.32428,778.271
Global l temperature change potential (GTP50)28,859.79128,839.37928,818.96830,217.14131,574.49128,922.99728,902.585
Global warming potential (GWP100)29,191.90129,170.57029,149.23930,624.74132,057.58129,257.92729,236.596
Global warming potential (GWP20)30,254.34030,230.05330,205.76631,929.08833,603.83530,329.38630,305.099
Global warming potential (GWP500)28,769.12028,748.99828,728.87630,105.88531,442.65128,831.56728,811.445
Including SLCFs–global temperature change potential (GTP100)28,792.96228,772.77228,752.58330,123.94431,454.92628,855.39728,835.208
Including SLCFs–global warming potential (GWP100)29,309.76229,288.14729,266.53330,747.29632,184.83029,376.36529,354.750
Including SLCFs–global warming potential (GWP20)30,521.89030,496.96030,472.02932,207.29533,892.70030,598.24730,573.317
Land UseLand use–global temperature change potential (GTP100)17.09317.08417.07419.87222.65117.12317.113
Land use–global temperature change potential (GTP50)17.09517.08517.07619.87522.65517.12417.115
Land use–global warming potential (GWP100)17.09917.09017.08019.88422.66817.12917.119
Land use–global warming potential (GWP20)17.11417.10517.09519.91122.70717.14417.134
Land use–global warming potential (GWP500)17.09417.08417.07519.87322.65317.12317.114
Land use, including SLCFs–global temperature change potential (GTP100)17.10217.09217.08319.88822.67317.13117.122
Land use, including SLCFs–global warming potential (GWP100)17.11717.10717.09819.91622.71517.14717.137
Land use, including SLCFs–global warming potential (GWP20)17.15417.14417.13519.98422.81417.18517.175
Table 7. Properties of cement.
#Tests on CementResultsAcceptable
Range
IS Code
1Fineness modulus2<10IS 4031, 1996
2Specific gravity3.153.1–3.16IS 2720-part 3
3Standard consistency28.5%26–33%IS 4031, 1988
4Initial setting time32 min>30 minsIS 4031, 1988
Table 8. Properties of fine aggregate.
#Test on Fine AggregateResultAcceptable
Range
IS Code
1Fineness modulus2.412.0–3.5IS 383, 1970
2Specific gravity2.442.5–3.0IS 2386, 1963
Table 9. Properties of coarse aggregate.
#Tests on Coarse AggregateResultAcceptable
Range
IS Code
1Fineness modulus7.185.5–8.0IS 383, 1970
2Specific gravity32.5–3.0IS 2386, 1963
Table 10. Properties of Crumb rubber.
#PropertyValue
1ColorBlack
2SizePassing through a 2.36 mm and
retained using a 1.18 mm sieve
3Fineness modulus2.4
4Specific gravity1.154
Table 11. Properties of Micro-silica.
PropertiesColorDiameterBulk DensitySpecific Gravity
Grey<1 mm130–600 Kg/m32.2–2.3
Table 12. Hydrated products range.
Hydration ProductsAcceptable Range
C S H (Calcium Silicate Hydrate)0.8 ≤ Ca/Si ≤ 2.5, (Al + Fe)/Ca ≤ 0.2
Calcium Hydroxide (CH)0.8 ≤ Ca/Si ≤ 2.5, (Al + Fe)/Ca ≤ 0.2
Monosulphate (Afm)0.8 ≤ Ca/Si ≤ 2.5, (Al + Fe)/Ca ≤ 0.2
Table 13. XRD peaks and d-spacing values.
MineralChemical Formula2-Theta (º)d-Spacing
(% Intensity)
QuartzSiO226.6343.344 (100.0)
20.8534.256 (38.8)
36.5362.457 (1.7)
PortlanditeCa(OH)234.1022.627 (100.0)
18.0084.922 (72.0)
28.6723.111 (27.0)
HatruriteCa3SiO532.1932.778 (100.0)
29.3573.040 (87.6)
32.5042.752 (87.4)
LarniteCa2SiO432.1692.780 (100)
32.5972.745 (79.9)
32.0742.788 (77.6)
GismondineCaAl2Si2O820.7754.272 (100)
12.1317.290 (99.5)
28.0043.184 (71.8)
BrownmilleriteCa2(Al,Fe)2O533.8762.472 (100)
12.1987.250 (45)
50.2291.815 (45)
EttringiteCa6Al2(SO4)3(OH)12 26H2O9.0919.720 (100)
15.7845.610 (74)
22.9443.873 (31)
VesuvianiteCa19Fe(Al6.48Fe1.52)Al4(SiO4)1032.4022.761 (100)
32.4632.7566 (83)
34.4632.6026 (64.8)
Disclaimer/Publisher’s Note: The statements, opinions and data contained in all publications are solely those of the individual author(s) and contributor(s) and not of MDPI and/or the editor(s). MDPI and/or the editor(s) disclaim responsibility for any injury to people or property resulting from any ideas, methods, instructions or products referred to in the content.

