Article

Evaluation of Thermoplastic Starch Contamination in the Mechanical Recycling of High-Density Polyethylene

by
Antonio Cascales
,
Cristina Pavon
*,
Santiago Ferrandiz
and
Juan López-Martínez
Instituto Universitario de Investigación de Tecnología de los Materiales (IUITM), Universitat Politècnica de València (UPV), 03801 Alcoy, Spain
*
Author to whom correspondence should be addressed.
Recycling 2024, 9(3), 33; https://doi.org/10.3390/recycling9030033
Submission received: 20 February 2024 / Revised: 20 March 2024 / Accepted: 24 April 2024 / Published: 26 April 2024

Abstract

:
This research highlights the importance of addressing bioplastic contamination in recycling processes to ensure the quality of recycled material and move towards a more sustainable circular economy. Polyethylene (PE) is a conventional plastic commonly used in packaging for which large amounts of waste are produced; therefore, PE is generally recycled and has an established recycling process. However, the contamination of biodegradable polymers in the PE waste stream could impact recycling. This study, therefore, focuses on polyethylene (PE) that has been polluted with a commercial thermoplastic starch polymer (TPS), as both materials are used to produce plastic films and bags, so cross-contamination is very likely to occur in waste separation. To achieve this, recycled PE was blended with small quantities of the commercial TPS and processed through melt extrusion and injection molding, and it was further characterized. The results indicate that the PE-TPS blend lacks miscibility, evidenced by deteriorated microstructure and mechanical properties. In addition, the presence of the commercial TPS affects the thermal stability, oxidation, and color of the recycled PE.

Graphical Abstract

1. Introduction

Plastics are essential in our society’s development and daily lives. In 2021, 390.7 Mt of plastic was produced worldwide [1], and the production is expected to increase to 1124 Mt in 2050 [2]. However, the linear economy model in which plastics are now made and disposed of affects the environment and misses the economic advantages of a more “circular” approach. Therefore, a circular economy model involving plastic recovery is desired in production and consumption [3]. According to ISO 15270:2008, plastic recovery refers to processing plastic waste material for its original purpose or other purposes, including energy recovery [4].
Plastic recovery comprises material recycling, mechanical or chemical reprocessing, energy recovery, and reprocessing into materials for backfilling or fuel applications [5]. Plastic recovery can be divided into four main options: quaternary recovery (incineration with energy recovery), tertiary recovery (chemical recycling through pyrolysis and solvolysis), secondary recovery (mechanical), and primary recovery (in-plant recycling) [6]. Quaternary recycling applies to practically all plastics and can save some energy, but it produces more CO2 emissions than the other three recycling procedures. Tertiary recycling can handle polluted and heterogeneous polymers, while primary and secondary recycling are best suited to thermoplastic polymers [7].
The EU has enforced plastic recycling for packaging and municipal solid waste to enable a change in the production model, avoid using fossil resources, and close the plastic loop [8]. In 2021, plastic waste recycling reached 35% of post-consumer plastics waste management, energy recovery has reached 42%, and landfilling still has 23% [1]. In this context, to increase the recycled plastic amount and guarantee the circularity of the material, it is essential to ensure the quality of the recycled plastic is at a level where the qualities of the plastic material are preserved, and it is feasible to produce similar [8].
Mechanical recycling is preferred for large-scale recycling of thermoplastic waste [9]. Since the composition and purity of the polymer waste in mechanical recycling are typically unknown, the material must first be separated and purified before being reprocessed. The secondary recycling process does not alter the polymer’s structure; however, it could experience a decrease in its mechanical qualities. This decrease could result from chain scissions from acids or water, which could lower the molecular weight or result from additional polymers contaminating the matrix or primary polymer [6]. The mechanical qualities of the blends of most polymers are not as good as those of individual polymers since most polymers are incompatible with one another [10]. For instance, PET contaminants in PVC cause considerably worsened qualities, lowering the final items’ value [11]. As such, sorting is essential before incorporating a new product in mechanical recycling. While optical color recognition cameras are widely used to distinguish between explicit and colorful materials, Fourier-transform, near-infrared spectroscopy (FTIR), and differential scanning calorimetry (DSC) are commonly employed to identify the type of polymer [11]. The new plastics, such as the bioplastics, complicate the sorting of the polymer waste because a small amount of these materials generate negligible alterations in the DSC or their FTIR bands overlap with those of the most prevalent polymer [12,13,14].
Currently, less than 1% of the plastic generated yearly is bioplastics. However, the bioplastics market is continuously growing due to consumers’ increasing demand for more environmentally friendly products. It is predicted that the capacity of the world’s bioplastics industry will increase from roughly 2.41 Mt in 2021 to nearly 7.59 Mt in 2026 [15]. According to European Bioplastics, bioplastics are a range of materials with different properties and applications that can be bio-based, biodegradable, or have both properties simultaneously [16]. Bio-based and non-biodegradable plastics have the same properties and characteristics as conventional or synthetic plastics but are synthesized from renewable resources, so their carbon footprint is lower. This group includes bio-polyethylene (bio-PE), bio-polypropylene (bio-PP), bio-polyamide (bio-PA), and bio-polyethylene terephthalate (bio-PET). The group of bio-based and biodegradable plastics is the group of plastics whose origin are renewable sources and are also biodegradable, generally used for products with a short shelf life; within this group, polysaccharides, such as starch blends and thermoplastic starch (TPS), proteins such as keratin, and polyesters such as poly (lactic acid) (PLA) and the family of poly (hydroxy alkanoates) (PHAs) can be found [16].
Biodegradable polymers require hydrolytic breakdown to decompose in their natural surroundings. They can also show various thermal stability characteristics. For instance, polylactic acid (PLA) has fair thermal stability, while thermoplastic starch (TPS) has little. At the same time, plastics such as polyethylene (PE) and polypropylene (PP) are not dried before processing. Therefore, stream contamination with biodegradable plastic will be sensitive to hydrolytic and thermal degradation and could lead to biopolymer degradation and outgassing in an extruder [17,18].
Biodegradable bio-based plastics are already present in many consumer goods and will be utilized more frequently in everyday items like bottles, trays, packaging, etc. As their manufacturing rises, so will the likelihood that they will enter the established systems for recycling fossil-based plastics and wind up in trash streams, even if sophisticated separation techniques are used [17]. Because bio-based and biodegradable plastics have different properties than fossil-based plastics, their rise jeopardizes the recycling processes, regardless of those polymers with established recycling procedures, such as polyethylene (PE) or polyethylene terephthalate (PET) [18].
Studies on bio-based and biodegradable plastic contamination in thermoplastic recycling streams have shown that even minimal quantities of contamination diminish the final properties of the material. For instance, Samper et al. (2014) studied the effect of biodegradable plastics on recycled polystyrene (PS). They determined that the immiscibility between the matrix and the biodegradable polymers causes a phase separation in the structure, which lowers the mechanical properties of recycled PS [19]. Samper et al. (2018) determined the influence of polylactic acid (PLA), polyhydroxy butyrate (PHB), and thermoplastics starch (TPS) in the polypropylene (PP) recycling process in a wide range of contents (2.5 to 15 wt.%). They discovered that biodegradable polymers in recycled polypropylene (PP) led to a significant loss of mechanical, thermomechanical, and thermal characteristics when using percentages of biodegradable polymers higher than five weight percent. PLA and PHB raise the melt flow index (MFI), which is linked to an increase in ester groups that are poorly thermally stable and relatively easily broken down [20]. Aldas et al. (2021) examined the effects of PLA, PHB, and TPS on the characteristics of recycled PET made from packaging waste. It was found that PHB presents good miscibility with recycled PET, PLA is partially miscible, and TPS presents low miscibility. However, because of the high temperatures during the recycling process (about 270 °C), which cause PHB to degrade and disrupt the miscible blend thermally, all biopolymers interfere with recycled PET’s mechanical qualities [21]. Pavon et al. (2023) determined the influence of polybutylene succinate (PBS) in the PET recycling process. The study discovered that PBS impurities reduce the mechanical properties of PET at any concentration; additionally, the DSC curve at the melting peak was barely affected by PBS. Hence, it took a lot of work to identify PBS contamination in PET using techniques that the quality control department can easily access [12]. Therefore, contamination with biodegradable plastic would risk the completion of the plastics cycle in recycling.
Given the usage of PE and TPS in films and plastic bags, there is a high possibility of cross-contamination of PE during waste separation and recycling. Although TPS is a promising option due to its abundance and biodegradability, its introduction into the conventional plastics recycling stream may pose significant challenges. TPS has low mechanical properties; moreover, it has a hydrophilic character and poor water permeability [22]. In this study, PE, obtained from recycled films, was blended with small quantities of a commercial thermoplastic starch polymer (TPS) to simulate contamination. The blends were characterized by their mechanical, surface, thermal, and visual properties. Moreover, the study measures the oxidation induction time (OIT) to see if TPS affected the blends’ thermos oxidative stability. OIT may be related to the polymer’s lifetime and quality in real-world applications [23].

2. Results and Discussion

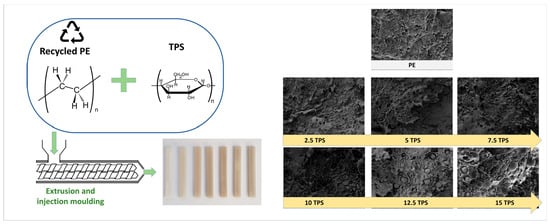
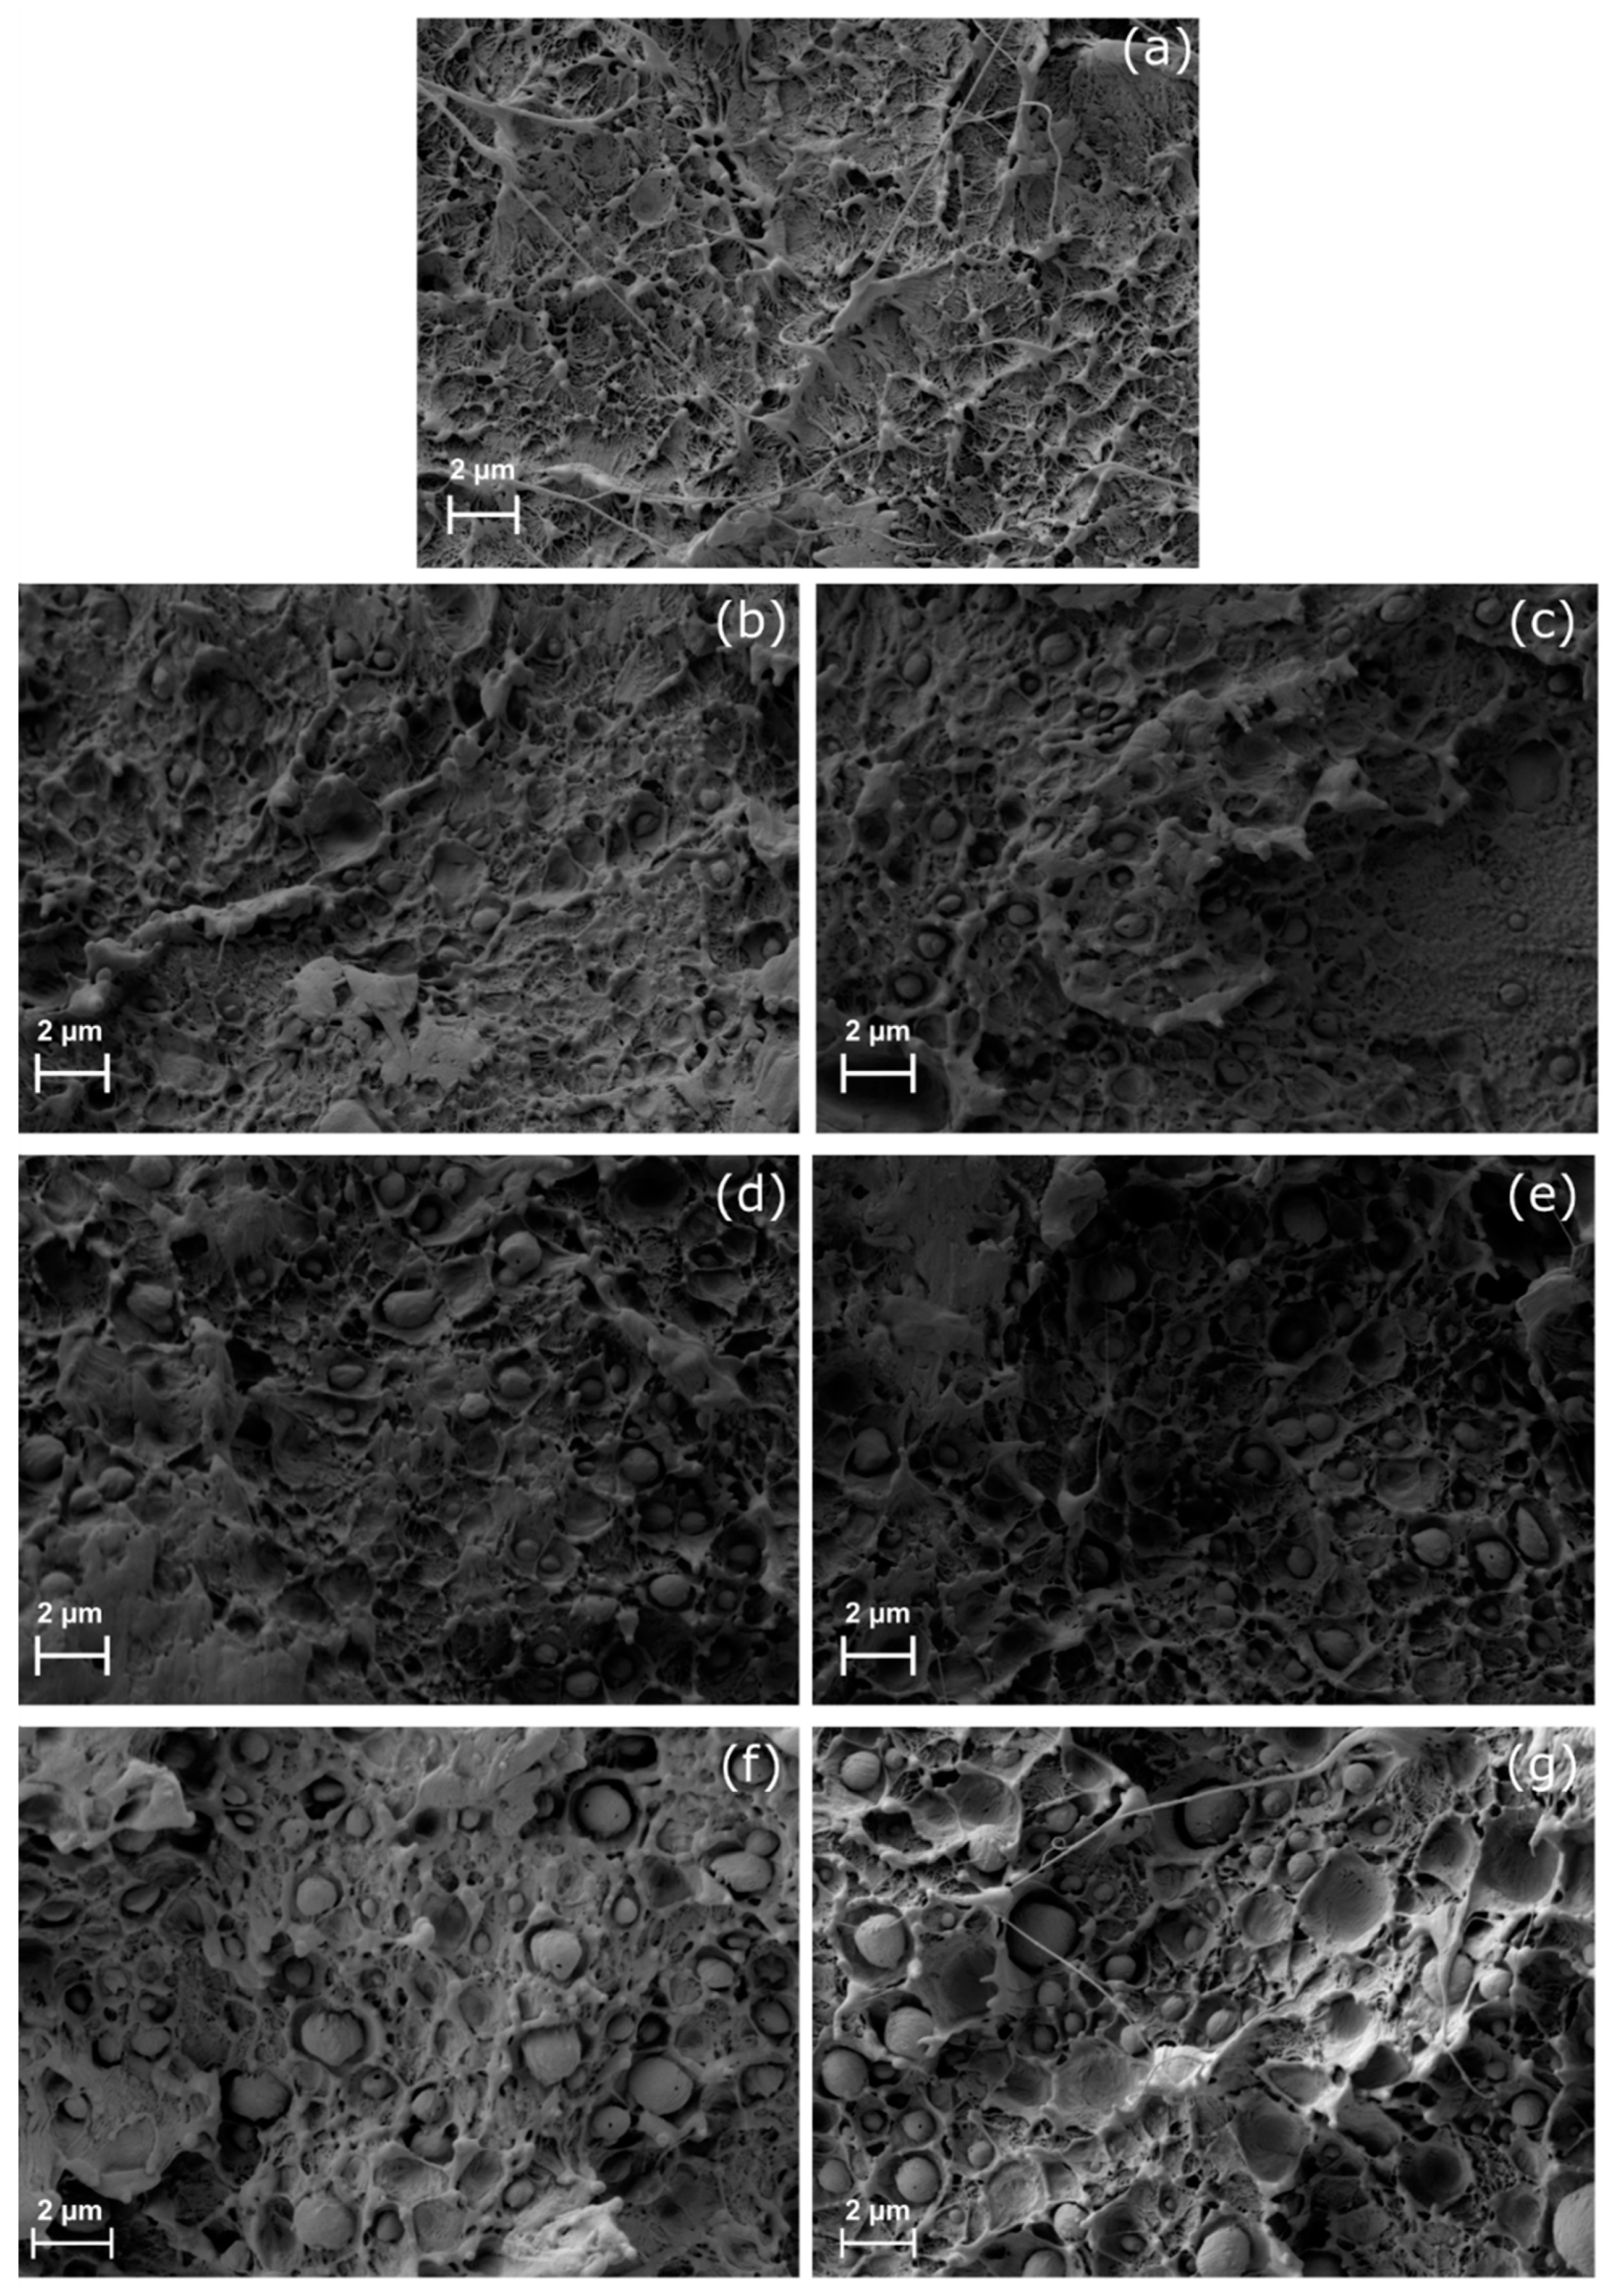
2.1. Miscibility and Microstructural Characterization

The relative affinity between two polymers can be assessed using the solubility parameter (δ) [24]. Although solubility is a rough indicator of how well two plastics get along, it is an unbiased technique created to complement experimental results when researching polymer blends [25].
Table 1 presents the results of δ , according to Small’s method, using Equation (1). PE has a δ of 16.7 MPa1/2, comparable to the solubility values for literature listed in polymerdatabase.com [26]. One can observe that PE and TPS solubility parameters are quite different. Since TPS’s solubility parameter is far from PE, it appears that the two materials are not miscible; as a result, TPS can cause recycled PE’s thermal and mechanical qualities to deteriorate.
Figure 1 shows the micrographs of PE and PE blends with 2.5, 5, 7.5, 10, 12.5, and 15 wt.% of TPS obtained FESEM. The PE-TPS blends are immiscible since a phase separation of the components in the blends is observed. The biphasic morphology suggests that the two polymers that make up a blend are immiscible, with one polymer functioning as the matrix phase and the other as the dispersion phase [19,27]. Spherical droplets scattered throughout the PE matrix are present in all PE-TPS blends. The size of these droplets rises with TPS content. Furthermore, upon fracture, some of the spherical droplets were extracted from the PE matrix, demonstrating a weak contact and immiscibility between the two polymers. These results are consistent with what the solubility parameter predicted. In addition, it is expected that the inadequate adhesion of the phases will result in stress concentration zones, leading to worse mechanical characteristics [28,29]. A similar biphasic morphology was observed in poly (ethylene terephthalate) (PET) polluted with small quantities of poly (lactic acid) (PLA) [30].

2.2. Mechanical Properties

Because the compatibility of the two polymers that make up the blend substantially impacts the material’s performance, figuring out the mechanical properties of blends is essential. Polymer incompatibilities have a detrimental effect on the performance of materials and diminish their mechanical qualities [31].
The mechanical characterization results of the PE-TPS formulations are listed in Table 2. The properties of recycled PE include an elongation break of 1253%, a tensile strength of 20 MPa, and a Young’s modulus of 1013 MPa. The addition of TPS to the mixture significantly (p < 0.05) reduces the tensile properties of PE, irrespective of the concentration.
With 15 wt.% TPS, PE Young’s modulus drops by up to 56% and the tensile strength by 38%, and for 2.5 to 15 wt.% of TPS, the elongation at break steadily declines from 3% to 78%. Even at the lowest analyzed TPS percentage (2.5 wt.%), the tensile characteristics of recycled PE decreased significantly (p < 0.05), indicating a lack of miscibility in the system.
Regarding the Charpy impact strength energy, the values in Table 2 show that the impact strength energy presents an inverse relationship with the TPS content; increasing the TPS content decreases the impact energy from 5% with 2.5 wt.% TPS to 25% with 15 wt.% TPS.
The problems in the mechanical performance of recycled PE due to TPS contamination are related to the incompatibility of two polymeric matrices, as seen in FESEM images, and suggest that the mechanical characteristics of PE could be severely harmed by TPS contamination during recycling. The effect of biodegradable polymers on the mechanical properties of a thermoplastic polymer matrix has already been documented in the literature, and issues with immiscibility or incompatibility cause it. For instance, the low-density polyethylene (LDPE) matrix becomes more brittle due to the presence of poly (butylene adipate co-terephthalate) (PBAT) particles acting as flaws in it [32]. Recycled PET displays a decrease in tensile strength due to the presence of small amounts of PLA [30].

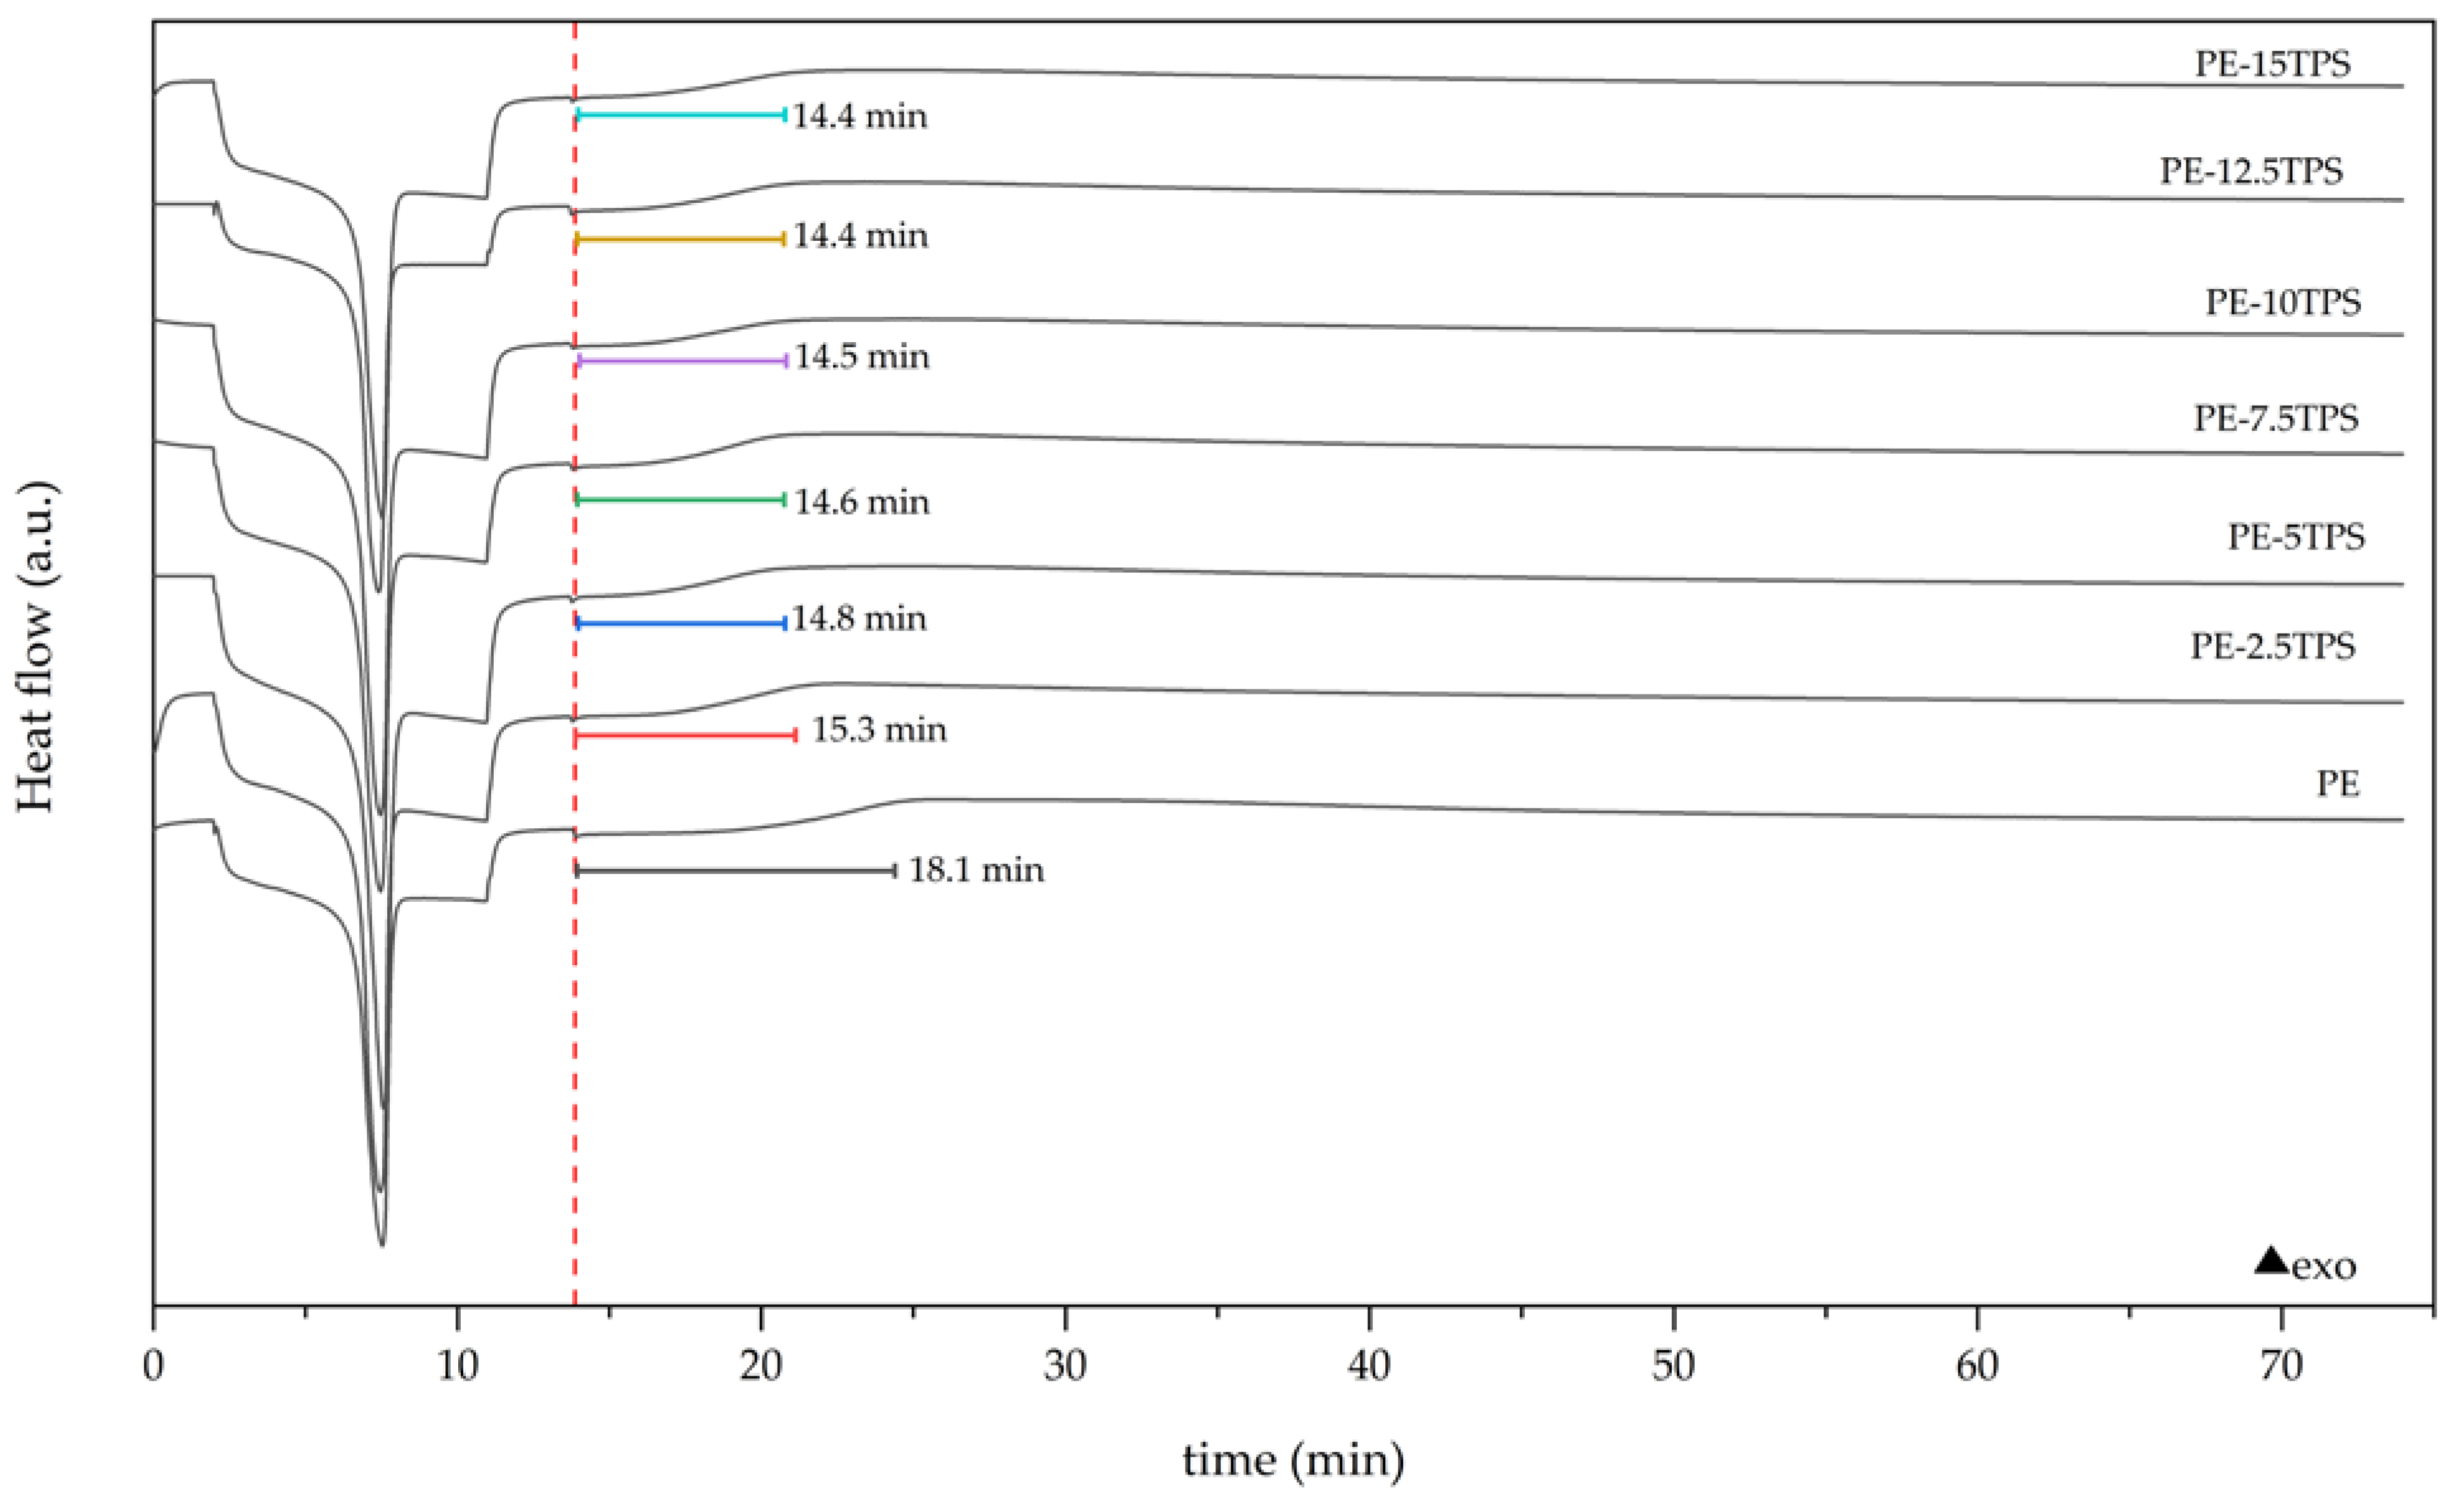
2.3. Thermal Characterization

Table 3 lists the thermal parameters derived for DSC curves. Neat PE presents a melting point of 130.2 °C, a melting enthalpy of 147.83 J/g, and a crystallinity degree (χc) of 50.5%. At the same time, neat TPS presents a melting point of 123 °C and a melting enthalpy of 23.95 J/g. All the PE-TPS blends present the melting point (Tm) as a single peak at approximately 130 °C. Moreover, as the blend’s TPS content increased, the PE’s ΔHm values slightly decreased. At the same time, the increase in TPS content correlated with a decrease in crystallinity degree (χc). This result shows that the presence of TPS acts as an impurity, causing imperfections and reducing the structure’s free volume, making it difficult for the polymer chains to pack tightly and reducing the crystal size [33,34]. For instance, [20] similarly reported that polypropylene loses some of its crystallinity when biodegradable polymers are present as contamination.
Figure 2 displays the dynamical DSC curves of PE-TPS in the air atmosphere. The OOT in PE is located at 219 °C. Tm and OOT are in temperatures similar to neat PE for all the blends. Neat TPS presents its OOT at 210 °C. It is observed that the thermal transitions in TPS are negligible in the blends compared to those of PE.
Figure 3 displays the isothermal DSC curves of PE and PE-TPS at 210 °C for 60 min. It is seen that during a 13 min heating ramp, all the samples reached 210 °C, at which point the PE and PE-TPS samples had melted and presented similar curves with oxidation occurring at different time intervals. In an isothermal experiment, the OIT value is the time that elapses before the sample exhibits a sudden exothermic oxidation reaction. One can notice that in PE, thermal oxidation is initiated at approximately 18.1 min. According to the TPS content, the addition speeds up oxidation, reducing the OIT to values between 15.3 and 14.4 min. Since most of its manufacturing includes exposure to air at high temperatures and polyethylene, like all polyolefins, is vulnerable to thermos-oxidative degradation [35], TPS contamination has considerable potential to oxidize PE even if the drop in OIT in it is minimal. Color, electrical, and mechanical qualities could diminish as this happens [23]. Therefore, as polyethylene’s OIT changes, the TPS contamination could significantly impact the material’s processing and performance characteristics and limit its potential uses.

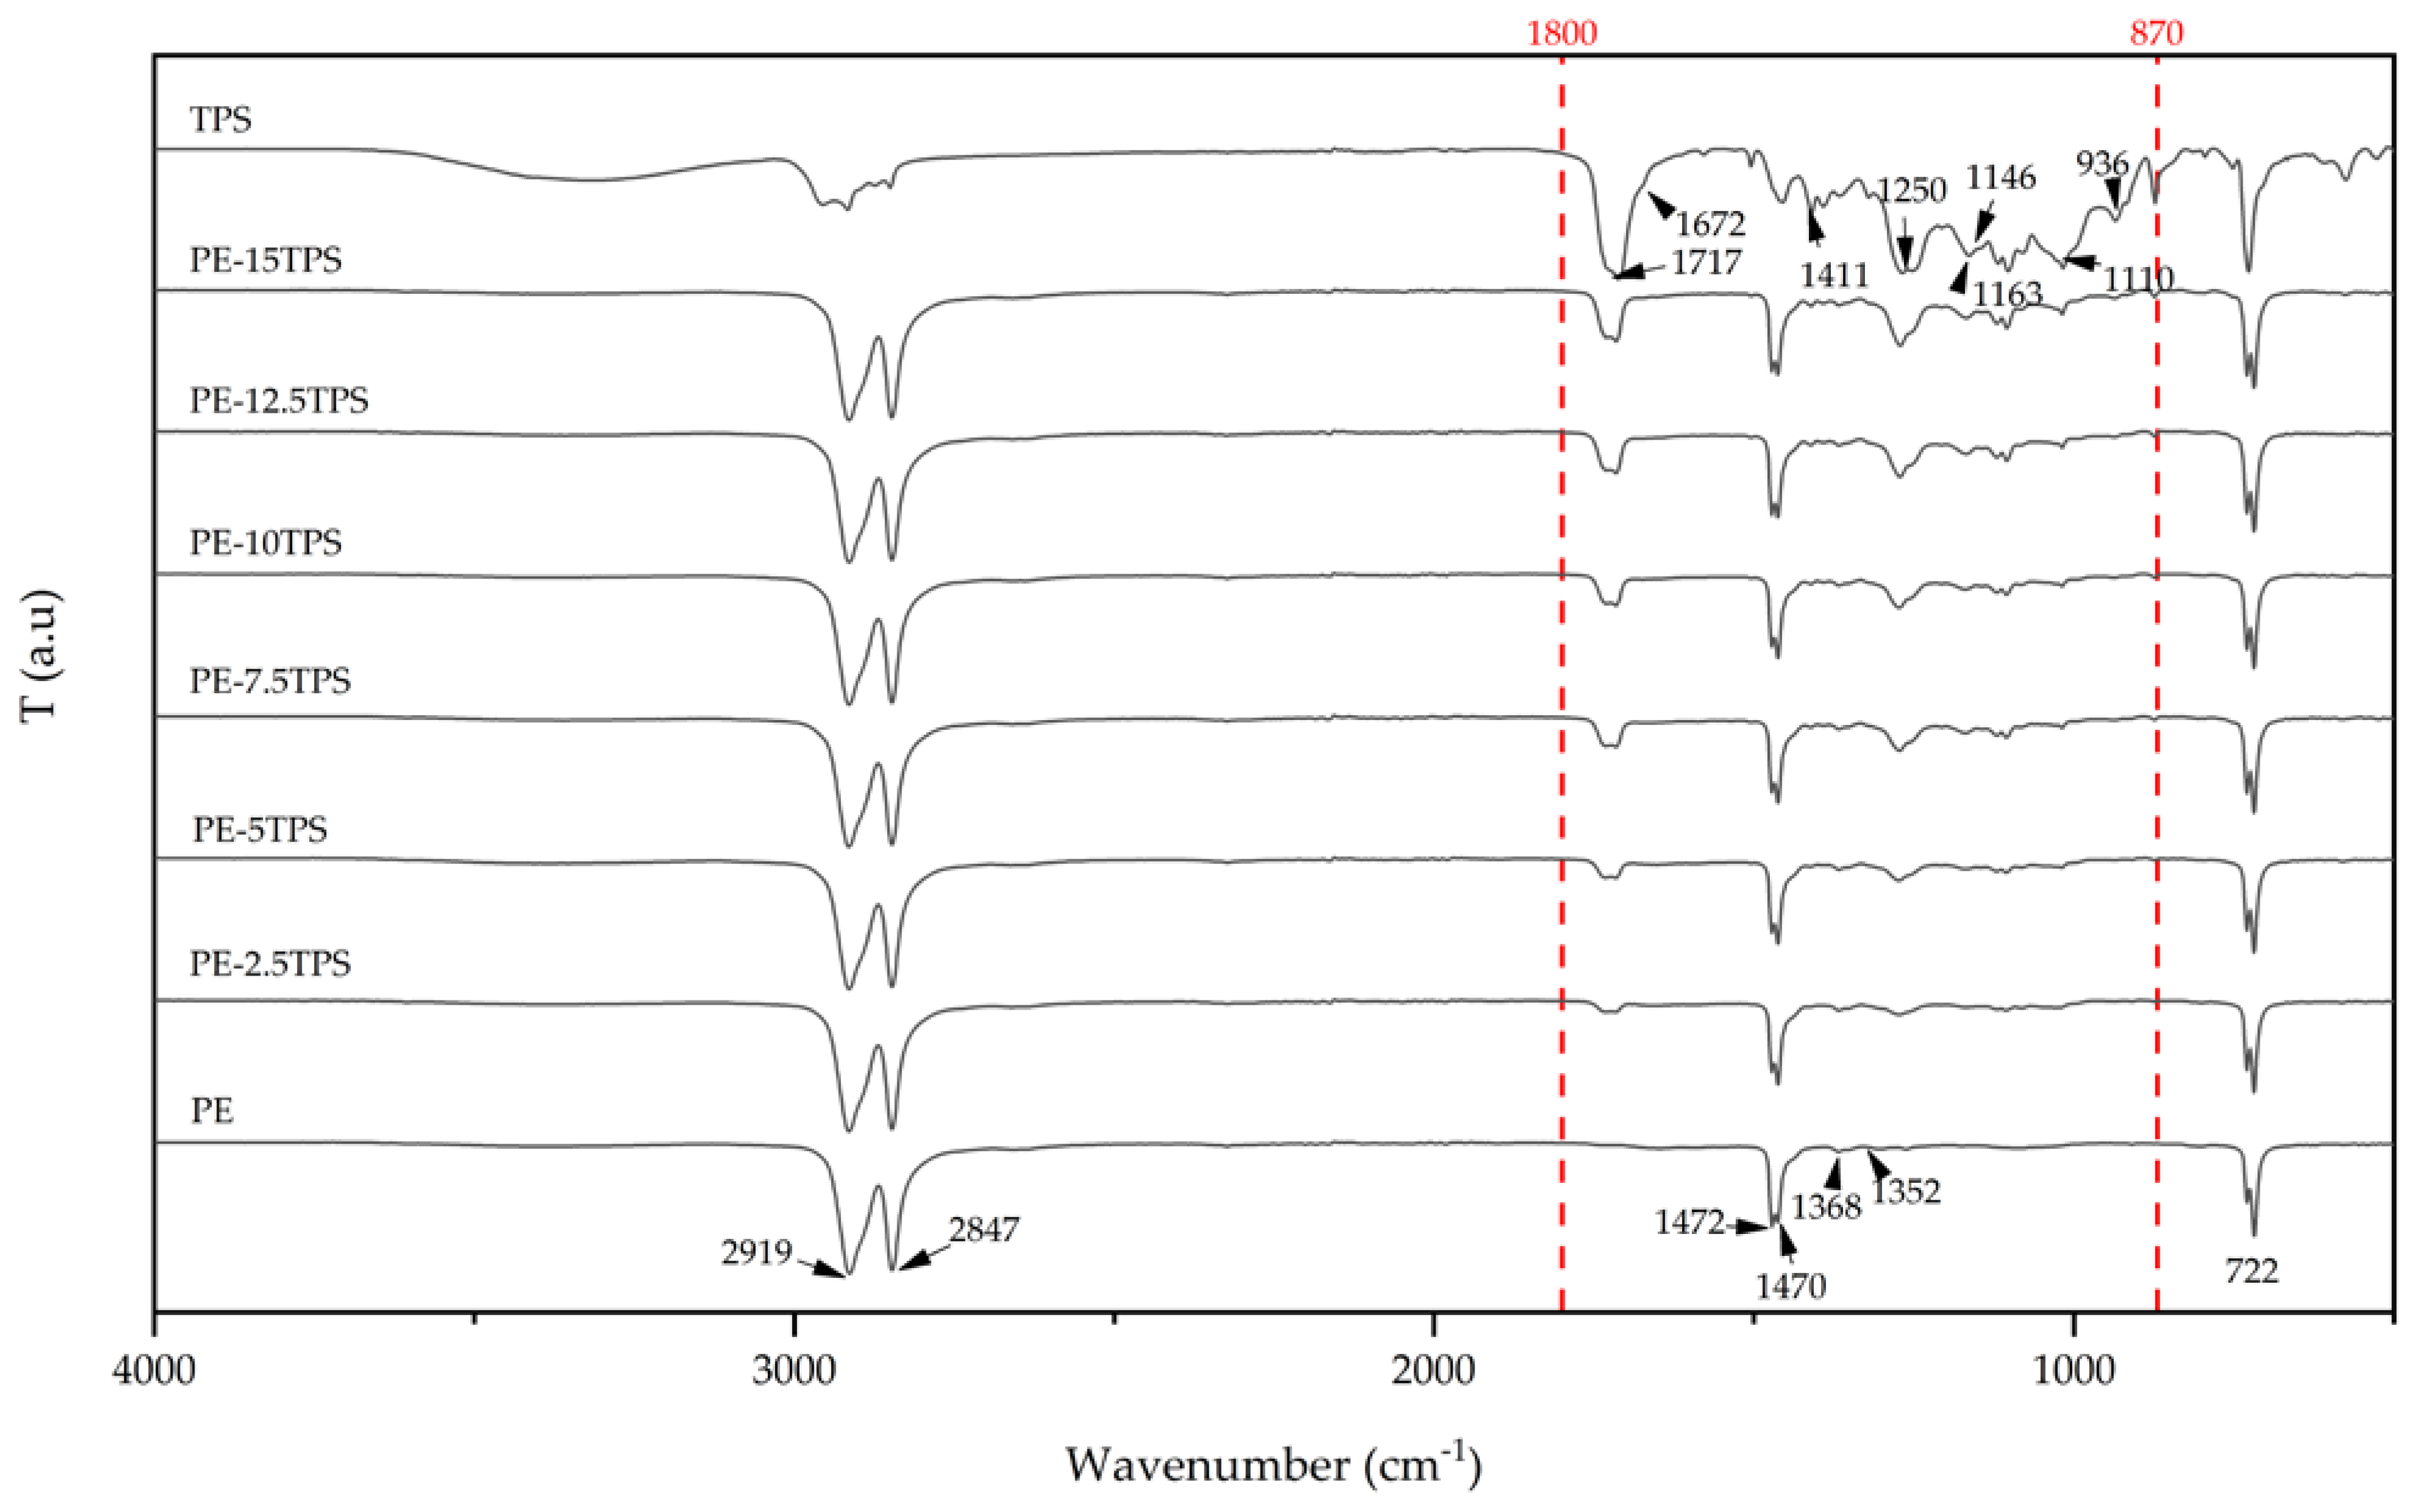
2.4. Fourier Transformed Infrared Spectroscopy

Figure 4 displays the FTIR-ATR spectra of PE and the six PE-TPS blends. It is seen that neat PE exhibits two significant bands at 2847 and 2919 cm−1 related to C-H bonds stretching vibrations and two bands at 1470 and 1472 cm−1 corresponding to C-H bending vibrations. Low-intensity bands at 1368 and 1352 cm−1 point to a C-H bend due to CH2 and CH3 vibrations, and a high-intensity band at 722 cm−1 through CH2 rocking vibrations [36,37]. Neat TPS displays bands corresponding to C-O stretching of C-O-C bond at 1110 and 1146 cm−1, the C-O stretching of pyranose rings at 936 cm−1, the bound water band located at 1672 cm−1 (δ (O-H)), the presence of carbonyl groups through the peak at 1717 cm−1, the C-O stretching associated with carbon–oxygen (C–O) characteristic of primary and secondary alcohols through the bands at 1411 cm−1 and 1163 cm−1, and the CH2OH (side chain)-related mode at 1250 cm−1 [22,38,39].
All the PE-TPS blend spectra present the characteristic bands of PE, which remain unchanged. Moreover, the blend’s spectra present the TPS typical absorption bands, between 1800 and 870 cm−1. These TPS bands appear as low-intensity bands that increase as the TPS content rises. The spectra of the blends do not display the appearance of new bands or the modification of the existing ones, which suggests that TPS contamination did not produce a chemical modification in PE.

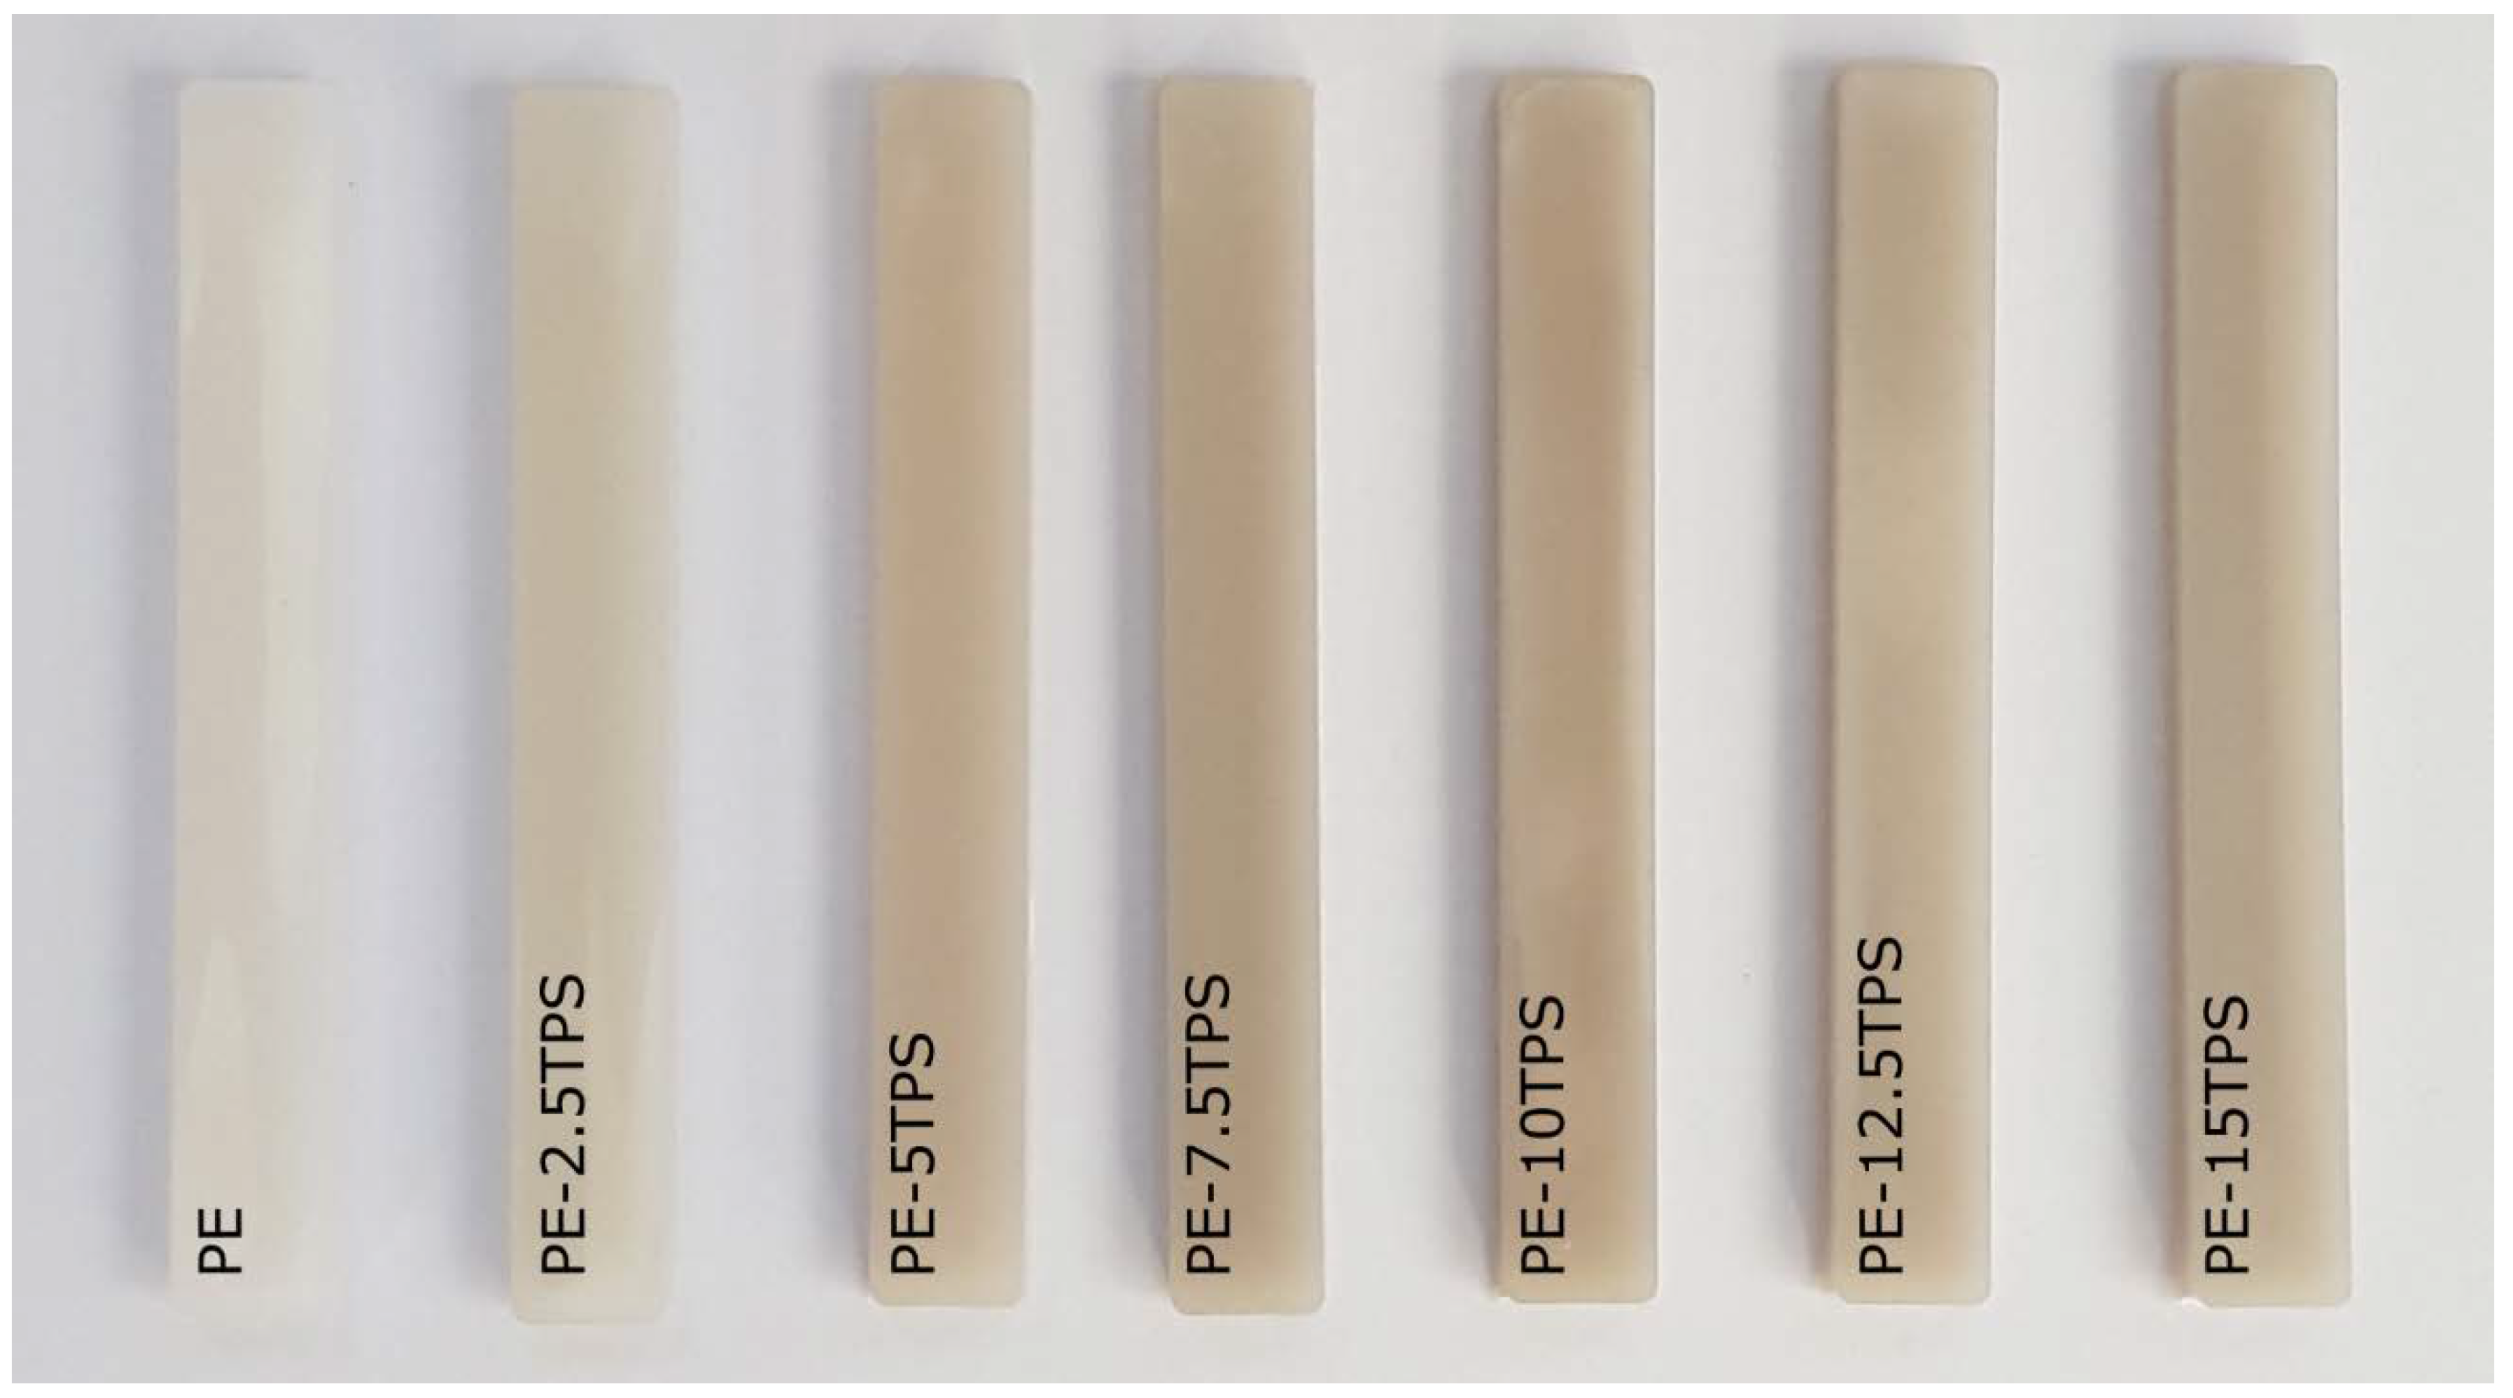
2.5. Visual Appearance
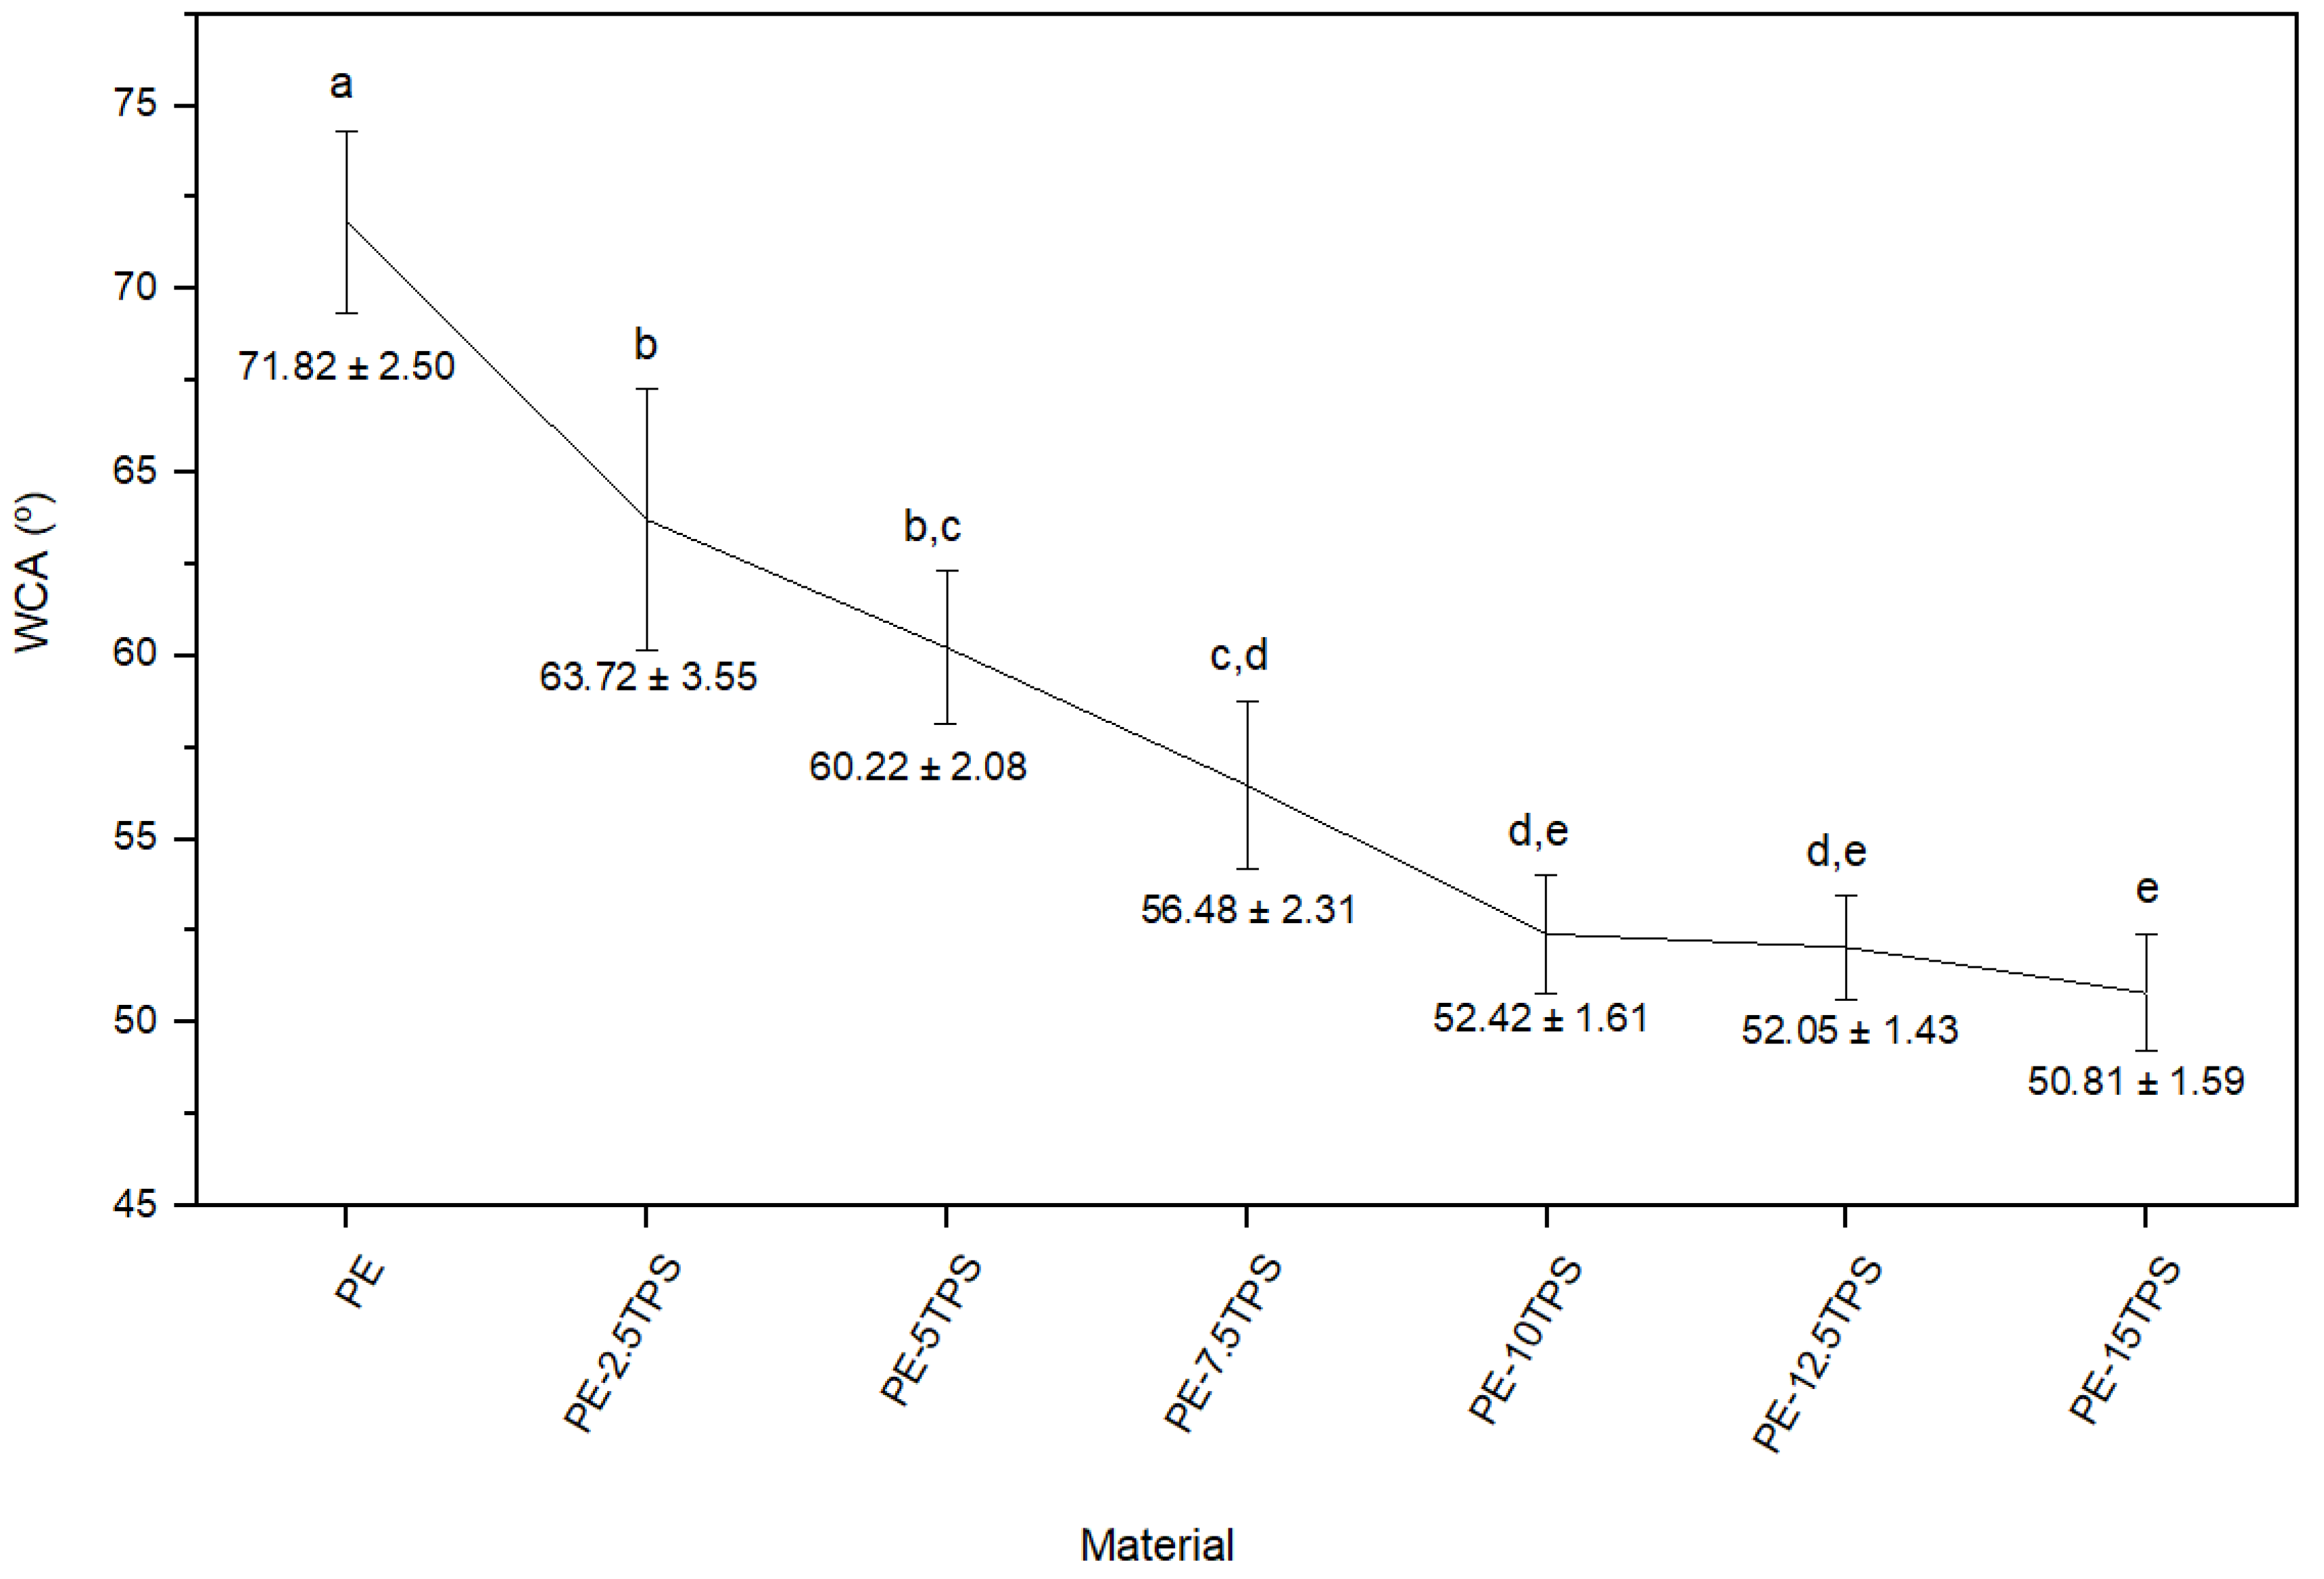
Figure 5 shows the appearance of the PE-TPS specimens obtained by injection molding. All the specimens showed high opacity and a clean, uniform surface free of flaws. Even with no colorant applied during the material’s manufacturing, it was evident from a cursory examination of these photos that TPS contamination had altered the recycled PE’s color.
The color coordinates (L*a* b*) and color variation (measured by ∆E ab*) with respect to the pure PE are summarized in Table 4. As expected, the rise in TPS content significantly (p < 0.05) decreased the L* value due to the increase in the opacity of the samples. Also, the rising TPS content significatively (p < 0.05) increases the color coordinate b* (blue to yellow), from −3.81 (PE) to −0.34 (15 wt.% of TPS), and the color coordinate a* (green to red) from −1.92 (PE) to −0.58 (15 wt.% of TPS). Moreover, the increase in TPS content results in a striking increase in ∆Eab* evolution. A content of 2.5 wt.% of TPS produced a slight difference in color as 1 ≤ ∆Eab* < 2. The color change is noticeable in contents from 5 to 7.5 since 3.5 ≤ ∆Eab* < 5. Additionally, the ∆Eab* ≥ 5 in contents of 10 and 15 wt.% shows that observers notice different colors. As expected from thermal oxidation deterioration, the color change indicated an increasing tendency with the rise in TPS concentration in PE. The change in color due to thermal degradation was reported by Agüero et al., 2019 in PLA reprocessing [40].

2.6. Wettability

The WCA was measured to determine the effect of TPS contamination on the wettability of PE. Polyethylene surfaces’ wettability can affect how effectively coatings or adhesives stick to them.
Recycled PE presents a WCA of 72°. When TPS is added to the blend, the WCA decreased proportionally to the TPS content until at 15 wt. % it reaches ~51° (see Figure 6). The reduction in the water contact angle is probably due to two reasons. First, an increased surface roughness brought on by the presence of TPS causes the water drop to expand rapidly. Second, and more likely, it is due to the intrinsic hydrophilicity of the TPS [41]. When calculating the WCA of recycled high-density polyethylene filled with maritime pine wood, Lazrak et al., 2019 noticed a similar pattern [42]. Therefore, the application of coatings or adhesives in the recycled PE product may be significantly impacted by this decrease in WCA due to the contamination with TPS.

3. Materials and Methods

3.1. Materials

Recycled PE was supplied by Extremadura Torrepet S.L. (Badajoz, Spain), and commercial thermoplastic starch Biopar® 1020 was provided by United Biopolymers (Figueira da Foz, Portugal). PE was compounded with Biopar in concentrations of 2.5, 5, 7.5, 10, and 15 wt.% and labeled PE-2.5TPS, PE-5 TPS, PE-7.5 TPS, PE-10 TPS, PE-12.5 TPS, and PE-1 TPS, respectively. Melt extrusion was used to blend the formulations in a micro compounder (MC 15HT Xplore) at 80 rpm, with a temperature profile of 140 °C to 160 °C (from die to hopper). The blends were then injected at a mold temperature of 30 °C and an injection temperature of 165 °C into Xplore’s MC 15HT micro compounder. ISO 527 test specimens of type 1BA were acquired. The materials were not dried before processing to mimic mechanical recycling and contamination.

3.2. Miscibility and Microstructural Characterization

The concept of the Hildebrand solubility parameter was used to determine the miscibility of two materials. The fundamental assumption is that two materials with comparable solubility characteristics will have balanced forces and, consequently, be miscible [43]. The Small method, also called group molar attraction constants, was used to calculate the polymer’s solubility [44]. When two mixture components have identical solubility properties, the Small method deems them compatible. Small’s list of the molar attraction constants (F) can be seen in previous works [45]. As a result, δ can be found by summing the molar attraction constants and considering each group’s contribution to the molecule’s overall structure, as indicated by Equation (1):
δ = ρ F j M n
where ρ is the polymer density, M n is the molar mass of the repetitive unit, and F j is the summation of the contributions of all polymer groups [19].
The impact specimens’ fracture surfaces were examined using field emission scanning microscopy (FESEM) at 1 kV using a Zeiss Ultra 55 microscope to confirm the miscibility results. Before analysis, the samples were coated using a gold–palladium alloy on a Quorum Technologies (East Sussex, UK) Sputter Mod Coater Emitech SC7620 to make their surface conductive.

3.3. Mechanical Characterization

Tensile tests performed in accordance with ISO 527 were used to characterize the material’s mechanical properties [46]. The analysis was conducted in an Ibertest Elib 30 universal testing machine from SAE Ibertest (Madrid, Spain) using a 5 kN load cell and a crosshead speed of 30 mm/min.
The resistance to the Charpy impact was evaluated in a Metrotec S.A. machine (San Sebastian, Spain) utilizing a 1 J pendulum and notched specimens in line with ISO 179 [47]. The results were provided as mean and standard deviation of five samples of each blend.

3.4. Thermal Characterization

Differential scanning calorimetry (DSC) data were gathered on a Mettler-Toledo DSC821e (Mettler-Toledo, Schwerzenbach, Switzerland) instrument. An amount of 4–6 mg of samples was put into aluminum crucibles. The heating and cooling programs were run in a nitrogen atmosphere (60 mL/min) at a 20 °C/min rate. The DSC program consisted of a preliminary heating phase between 30 and 200 °C, succeeded by a cooling phase up and a further heating phase up to 250 °C. The melting temperature, Tm, and the melting enthalpy, ∆Hm, were obtained from the second heating. Furthermore, the degree of crystallinity (χc) was calculated following Equation (2).
χ c = Δ H m Δ H m 0 · 1 w · 100
where Δ H m 0 corresponds to the melting enthalpy of a theoretically fully crystalline PE with a value of 293 J/g [33] and the term ( 1 w ) represents the PE weight fraction.
The oxidation induction time (isothermal OIT) and oxidation induction temperature (dynamic OOT) were determined according to [48] to assess the impact of a commercial TPS contamination on the oxidative degradation of PE. Two different types of DSC tests were conducted. In the first test, the oxidation induction temperature—also known as the oxidation onset temperature (OOT)—was determined using a dynamic program that ranged from 30 to 250 °C in an air atmosphere at a heating rate of 10 °C/min. In the second test, a heating ramp from 30 °C to 210 °C (the necessary isothermal temperature) was applied, and a nitrogen flow of 33 mL/min was used to heat the material at a rate of 10 °C per minute. The gas flow was then switched from nitrogen to air after 5 min at this temperature, and the run was continued at the isothermal temperature for 60 min. The oxidation induction time (OIT) was obtained when the DSC curves displayed an inflection due to oxidation.

3.5. Fourier Transformed Infrared Spectroscopy

The spectra of the studied blends were recorded at 4 cm−1 resolution in the wavelength between 4000 and 400 cm−1 using a PerkinElmer Spectrum Two FT-IR Spectrometer (LiTaO3 Detector).

3.6. Visual Appearance

The color of the materials was assessed with a Colorflex-Diff2 458/08 colorimeter from HunterLab (Reston, VA, EE. UU.) utilizing the CIE L*a*b color space. L*, a*, and b* are reported as the average value and standard deviation of five samples. Equation (3) was used to obtain the overall color difference (ΔEab*).
Δ E a b * = Δ a 2 + Δ b 2 + Δ L 2
The color change was assessed using the following method: unnoticeable (∆E*ab < 1), noticeable only by an experienced observer (1 ≤ ∆E*ab < 2), evident only by an unexperienced observer (2 ≤ ∆E*ab < 3.5), clearly noticeable (3.5 ≤ ∆E*ab < 5), and noticed only by an experienced observer (∆E*ab ≥ 5) [40].
Using OriginPro2018 software’s analysis of variance (ANOVA) and Tukey’s test, significant differences in colorimetry parameters were statistically assessed at a 95% confidence level.

3.7. Wettability

The water contact angle (WCA) measurement was used to determine the wettability of the samples. The experiment used an EasyDrop-FM140 optic goniometer from Kruss Equipment (Hamburg, Germany). A micrometer syringe was used to apply a droplet of water to the surface, and a Toshiba Teli CCD camera was used to scan the droplet profile 30 s after the water droplets were applied to the composite surface. For each blend, three specimens were examined in five different parts. An ANOVA variability analysis was performed using OriginPro2018 to ascertain their statistical differences.

4. Conclusions

This study evaluated the effect of a commercial thermoplastic starch Biopar® 1020 (TPS) contamination during polyethylene (PE) recycling. Microstructural characterization through FESEM showed that PE and TPS are incompatible, evidenced by the micrographs’ lack of miscibility and separated phases. In addition, the tensile test exposed that this incompatibility affects the mechanical behavior of the blends, decreasing its tensile properties even at the lowest analyzed TPS percentage (2.5 wt.%)—recycled PE decreased by 15% in Young’s modulus, 12% in tensile strength, and 4% in elongation at break—indicating that TPS contamination during recycling could be detrimental on the mechanical properties of PE. Moreover, the thermal analysis revealed that TPS contamination produces thermal degradation in PE, which was confirmed by a decrease in the enthalpy of fusion and crystallinity of PE with increasing TPS content. The OIT analysis shows that TPS contamination promotes PE thermos-oxidative degradation, which may significantly affect the material’s processing and performance properties, limiting its potential applications. Visual appearance and color change indicate that TPS contamination affects the visual quality of recycled PE. At the same time, the water contact angle showed that TPS significantly decreased the hydrophobicity of PE, which would affect the application of post-production treatments such as coatings and adhesives. However, it is essential to note that FTIR successfully detected TPS in recycled PE, indicating that it is a reliable quality control method for identifying this contamination. The results suggest that TPS contamination in the PE recycling process negatively affects the general behavior of the recycled PE even in low contents (2.5 wt.%).

Author Contributions

Conceptualization, S.F. and J.L.-M.; methodology, A.C.; validation, C.P. and S.F.; formal analysis, C.P.; investigation, A.C.; resources, J.L.-M.; writing—original draft preparation, A.C.; writing—review and editing, C.P.; visualization, C.P.; supervision, S.F.; project administration, J.L.-M.; funding acquisition, J.L.-M. All authors have read and agreed to the published version of the manuscript.

Funding

This research is a part of the grant PID2020-116496RB-C22 funded by MCIN/AEI/10.13039/501100011033 and the European Union “NextGenerationEU”/PRTR.

Data Availability Statement

The data presented in this study are available on request from the corresponding author.

Acknowledgments

Microscopy Services at UPV are acknowledged for their help in collecting and analyzing images.

Conflicts of Interest

The authors declare no conflicts of interest.

References

  1. Plastics Europe Market Research Group (PEMRG). Plastics-the Facts 2022, An Analysis of European Plastics Production, Demand and Waste Data; Plastics Europe AISBL: Brussels, Belgium, 2022. [Google Scholar]
  2. EMF (Ellen MacArthur Foundation). The New Plastic Economy—Rethinking Thefutureofplastics. Available online: https://emf.thirdlight.com/file/24/_A-BkCs_skP18I_Am1g_JWxFrX/The%20New%20Plastics%20Economy%3A%20Rethinking%20the%20future%20of%20plastics.pdf (accessed on 26 May 2023).
  3. European Commission. A European Strategy for Plastics in a Circular Economy; European Commission: Brussels, Belgium, 2018. [Google Scholar]
  4. ISO 15270:2008; Plastics—Guidelines for the Recovery and Recycling of Plastics Waste. International Standards Organization: Geneva, Switzerland, 2008.
  5. Ragaert, K.; Ragot, C.; Van Geem, K.M.; Kersten, S.; Shiran, Y.; De Meester, S. Clarifying European Terminology in Plastics Recycling. Curr. Opin. Green Sustain. Chem. 2023, 44, 100871. [Google Scholar] [CrossRef]
  6. Ignatyev, I.A.; Thielemans, W.; Vander Beke, B. Recycling of Polymers: A Review. ChemSusChem 2014, 7, 1579–1593. [Google Scholar] [CrossRef]
  7. Zhang, F.; Wang, F.; Wei, X.; Yang, Y.; Xu, S.; Deng, D.; Wang, Y.Z. From Trash to Treasure: Chemical Recycling and Upcycling of Commodity Plastic Waste to Fuels, High-Valued Chemicals and Advanced Materials. J. Energy Chem. 2022, 69, 369–388. [Google Scholar] [CrossRef]
  8. Eriksen, M.K.; Christiansen, J.D.; Daugaard, A.E.; Astrup, T.F. Closing the Loop for PET, PE and PP Waste from Households: Influence of Material Properties and Product Design for Plastic Recycling. Waste Manag. 2019, 96, 75–85. [Google Scholar] [CrossRef] [PubMed]
  9. Suzuki, G.; Uchida, N.; Tuyen, L.H.; Tanaka, K.; Matsukami, H.; Kunisue, T.; Takahashi, S.; Viet, P.H.; Kuramochi, H.; Osako, M. Mechanical Recycling of Plastic Waste as a Point Source of Microplastic Pollution. Environ. Pollut. 2022, 303, 119114. [Google Scholar] [CrossRef] [PubMed]
  10. Dobry, A.; Boyer-Kawenoki, F. Phase Separation in Polymer Solution. J. Polym. Sci. 1947, 2, 90–100. [Google Scholar] [CrossRef]
  11. Hopewell, J.; Dvorak, R.; Kosior, E. Plastics Recycling: Challenges and Opportunities. Philos. Trans. R. Soc. B: Biol. Sci. 2009, 364, 2115–2126. [Google Scholar] [CrossRef] [PubMed]
  12. Pavon, C.; Aldas, M.; Bertomeu, D.; de la Rosa-Ramírez, H.; Samper, M.D.; López-Martínez, J. Influence of the Presence of Poly(Butylene Succinate) in the Poly(Ethylene Terephthalate) Recycling Process. Clean Technol. 2023, 5, 190–202. [Google Scholar] [CrossRef]
  13. Pavon, C.; Aldas, M.; Ferri, J.M.; Bertomeu, D.; Pawlak, F.; Samper, M.D. Identification of Biodegradable Polymers as Contaminants in the Thermoplastics Recycling Process. Dyna 2021, 96, 415–421. [Google Scholar] [CrossRef]
  14. Lim, B.K.H.; Thian, E.S. Biodegradation of Polymers in Managing Plastic Waste—A Review. Sci. Total Environ. 2022, 813, 151880. [Google Scholar] [CrossRef]
  15. European Bioplastics Bioplastics Market Development. Available online: http://www.european-bioplastics.org/news/publications/ (accessed on 2 February 2022).
  16. Bioplastics, E. What Are Bioplastics?-Material Types, Terminology, and Labels—An Introduction; European Bioplastics: Berlin, Germany, 2016. [Google Scholar]
  17. Alaerts, L.; Augustinus, M.; Van Acker, K. Impact of Bio-Based Plastics on Current Recycling of Plastics. Sustainability 2018, 10, 1487. [Google Scholar] [CrossRef]
  18. Åkesson, D.; Kuzhanthaivelu, G.; Bohlén, M. Effect of a Small Amount of Thermoplastic Starch Blend on the Mechanical Recycling of Conventional Plastics. J. Polym. Environ. 2021, 29, 985–991. [Google Scholar] [CrossRef]
  19. Samper, M.D.; Arrieta, M.P.; Ferrándiz, S.; López-Martínez, J. Influence of Biodegradable Materials in the Recycled Polystyrene. J. Appl. Polym. Sci. 2014, 131, 41161–41168. [Google Scholar] [CrossRef]
  20. Samper, M.D.; Bertomeu, D.; Arrieta, M.P.; Ferri, J.M.; López-Martínez, J.; Bartomeu, D.; Arrieta, M.P.; Ferri, J.M.; López-Martínez, J. Interference of Biodegradable Plastics in the Polypropylene Recycling Process. Materials 2018, 11, 1886. [Google Scholar] [CrossRef] [PubMed]
  21. Aldas, M.; Pavon, C.; De La Rosa-Ramírez, H.; Ferri, J.M.; Bertomeu, D.; Samper, M.D.; López-Martínez, J. The Impact of Biodegradable Plastics in the Properties of Recycled Polyethylene Terephthalate. J. Polym. Environ. 2021, 29, 2686–2700. [Google Scholar] [CrossRef]
  22. Aldas, M.; Pavon, C.; López-Martínez, J.; Arrieta, M.P.P. Pine Resin Derivatives as Sustainable Additives to Improve the Mechanical and Thermal Properties of Injected Moulded Thermoplastic Starch. Appl. Sci. 2020, 10, 2561. [Google Scholar] [CrossRef]
  23. Baum, B. The Mechanism of Polyethylene Oxidation. J. Appl. Polym. Sci. 1959, 2, 281–288. [Google Scholar] [CrossRef]
  24. Odelius, K.; Ohlson, M.; Höglund, A.; Albertsson, A.C. Polyesters with Small Structural Variations Improve the Mechanical Properties of Polylactide. J. Appl. Polym. Sci. 2013, 127, 27–33. [Google Scholar] [CrossRef]
  25. Van Krevelen, D.W.; Dirk, W.; Nijenhuis, K. Properties of Polymers: Their Correlation with Chemical Structure; Their Numerical Estimation and Prediction from Additive Group Contributions; Elsevier: Amsterdam, The Netherlands, 2009; ISBN 0080915108. [Google Scholar]
  26. Chemical Retrieval on the Web (CROW) Plastic Library. Available online: https://polymerdatabase.com/polymer%20classes/Intro.html (accessed on 3 August 2022).
  27. Ghodgaonkar, P.G.; Sundararaj, U. Prediction of Dispersed Phase Drop Diameter in Polymer Blends: The Effect of Elasticity. Polym. Eng. Sci. 1996, 36, 1656–1665. [Google Scholar] [CrossRef]
  28. Sundararaj, U.; Macosko, C.W. Drop Breakup and Coalescence in Polymer Blends: The Effects of Concentration and Compatibilizationt. Macromolecules 1995, 28, 2647–2657. [Google Scholar] [CrossRef]
  29. Goonoo, N.; Bhaw-Luximon, A.; Jhurry, D. Biodegradable Polymer Blends: Miscibility, Physicochemical Properties and Biological Response of Scaffolds. Polym. Int. 2015, 64, 1289–1302. [Google Scholar] [CrossRef]
  30. La Mantia, F.P.; Botta, L.; Morreale, M.; Scaffaro, R. Effect of Small Amounts of Poly(Lactic Acid) on the Recycling of Poly(Ethylene Terephthalate) Bottles. Polym. Degrad. Stab. 2012, 97, 21–24. [Google Scholar] [CrossRef]
  31. Fekete, E.; Földes, E.; Pukánszky, B. Effect of Molecular Interactions on the Miscibility and Structure of Polymer Blends. Eur. Polym. J. 2005, 41, 727–736. [Google Scholar] [CrossRef]
  32. Titone, V.; Botta, L.; Mistretta, M.C.; La Mantia, F.P. Influence of a Biodegradable Contaminant on the Mechanical Recycling of a Low-Density Polyethylene Sample. Polym. Eng. Sci. 2024, 64, 845–851. [Google Scholar] [CrossRef]
  33. Quiles-Carrillo, L.; Montava-Jordà, S.; Boronat, T.; Sammon, C.; Balart, R.; Torres-Giner, S. On the Use of Gallic Acid as a Potential Natural Antioxidant and Ultraviolet Light Stabilizer in Cast-Extruded Bio-Based High-Density Polyethylene Films. Polymers 2020, 12, 31. [Google Scholar] [CrossRef] [PubMed]
  34. Xu, T.; Lei, H.; Xie, C.S. The Effect of Nucleating Agent on the Crystalline Morphology of Polypropylene (PP). Mater. Des. 2003, 24, 227–230. [Google Scholar] [CrossRef]
  35. Hernández-Fernández, J.; Rayón, E.; López, J.; Arrieta, M.P.; Hernández-Fernández, J.; Rayón, E.; López, J.; Arrieta, M.P. Enhancing the Thermal Stability of Polypropylene by Blending with Low Amounts of Natural Antioxidants. Macromol. Mater. Eng. 2019, 304, 1900379. [Google Scholar] [CrossRef]
  36. Novák, I.; Popelka, A.; Krupa, I.; Chodák, I.; Janigová, I.; Nedelčev, T.; Špírková, M.; Kleinová, A. High-Density Polyethylene Functionalized by Cold Plasma and Silanes. Vacuum 2012, 86, 2089–2094. [Google Scholar] [CrossRef]
  37. Chandra, R.; Rustgi, R. Biodegradation of Maleated Linear Low-Density Polyethylene and Starch Blends. Polym. Degrad. Stab. 1997, 56, 185–202. [Google Scholar] [CrossRef]
  38. Dang, K.M.; Yoksan, R. Development of Thermoplastic Starch Blown Film by Incorporating Plasticized Chitosan. Carbohydr. Polym 2015, 115, 575–581. [Google Scholar] [CrossRef]
  39. Kizil, R.; Irudayaraj, J.; Seetharaman, K. Characterization of Irradiated Starches by Using FT-Raman and FTIR Spectroscopy. J. Agric. Food Chem. 2002, 50, 3912–3918. [Google Scholar] [CrossRef] [PubMed]
  40. Agüero, A.; Morcillo, M.d.C.; Quiles-Carrillo, L.; Balart, R.; Boronat, T.; Lascano, D.; Torres-Giner, S.; Fenollar, O. Study of the Influence of the Reprocessing Cycles on the Final Properties of Polylactide Pieces Obtained by Injection Molding. Polymers 2019, 11, 1908. [Google Scholar] [CrossRef] [PubMed]
  41. Pavon, C.; Aldas, M.; López-Martínez, J.; Hernández-Fernández, J.; Patricia Arrieta, M. Films Based on Thermoplastic Starch Blended with Pine Resin Derivatives for Food Packaging. Foods 2021, 10, 1171. [Google Scholar] [CrossRef] [PubMed]
  42. Lazrak, C.; Kabouchi, B.; Hammi, M.; Famiri, A.; Ziani, M. Structural Study of Maritime Pine Wood and Recycled High-Density Polyethylene (HDPEr) Plastic Composite Using Infrared-ATR Spectroscopy, X-Ray Diffraction, SEM and Contact Angle Measurements. Case Stud. Constr. Mater. 2019, 10, e00227. [Google Scholar] [CrossRef]
  43. David, D.J.; Sincock, T.F. Estimation of Miscibility of Polymer Blends Using the Solubility Parameter Concept. Polymers (Guildf) 1992, 33, 4505–4514. [Google Scholar] [CrossRef]
  44. Small, P.A. Some Factors Affecting the Solubility of Polymers. J. Appl. Chem. 1953, 3, 71–80. [Google Scholar] [CrossRef]
  45. Carraher, C.E. Polymer Chemistry, 6th ed.; Marcel Dekker, Inc.: New York, NY, USA, 2003; ISBN 0824708067. [Google Scholar]
  46. ISO 527-1:2012; Plastics—Determination of Tensile Properties—Part 1: General Principles. International Standards Organization: Geneva, Switzerland; AENOR: Madrid, Spain, 2012.
  47. ISO 179-1:2010; Plastics—Determination of Charpy Impact Properties/Part 1: Non-Instrumented Impact Test. International Standards Organization: Geneva, Switzerland, 2010; Volume 22.
  48. ISO 11357-6:2018; Differential Scanning Calorimetry (DSC) Part 6: Determination of Oxidation Induction Time (Isothermal OIT) and Oxidation Induction Temperature (Dynamic OIT). International Standards Organization: Geneva, Switzerland, 2018.
Figure 1. FESEM images of (a) PE, (b) PE-2.5TPS, (c) PE-5TPS, (d) PE-7.5TPS, (e) PE-10TPS, (f) PE-12.5TPS, and (g) PE-15TPS.
Recycling 09 00033 g001
Figure 2. DSC dynamical curves of PE-TPS in air atmosphere. (▲ indicates an exothermic change in the positive direction of heat flow).
Recycling 09 00033 g002
Figure 3. DSC isothermal curves of PE and PE-TPS blends measured at 210 °C for 60 min. (▲ indicates an exothermic change in the positive direction of heat flow).
Recycling 09 00033 g003
Figure 4. FTIR spectra of PE-TPS blend. Black arrows show representative bands of PE and TPS.
Recycling 09 00033 g004
Figure 5. The visual appearance of PE and PE-TPS blends.
Recycling 09 00033 g005
Figure 6. Water contact angle (WCA) of PE and TPS-PE blends. a–e Different letters show statistically significant differences between the obtained films (p < 0.05).
Recycling 09 00033 g006
Table 1. Relative solubility of PET and PBS.
PolymerStructure δ (MPa1/2)
Calculated
δ(MPa1/2)
Literature
[26]
PERecycling 09 00033 i00116.714.8–19.9
TPSRecycling 09 00033 i0028.4-
Table 2. Mechanical properties of PE and PE-TPS blends in terms of tensile properties (σmax, εb, Etensile) and Charpy impact.
Materialσmax (MPa)Etensile (MPa)εb (%)Charpy Impact (kJ/m2)
PE20.2 ± 2.6 a1013 ± 64 a1253 ± 24 a5.6 ± 0.2 a
PE-2.5TPS17.8 ± 1.2 b857 ± 68 b1204 ± 13 b5.3 ± 0.2 b
PE-5TPS17.8 ± 3.2 b816 ± 54 b1121 ± 26 c4.8 ± 0.2 c
PE-7.5TPS17.5 ± 5.3 b679 ± 91 c815 ± 144 d4.7 ± 0.3 c
PE-10TPS17.3 ± 1.6 b563 ± 41 d952 ± 17 e4.6 ± 0.2 c
PE-12.5TPS12.9 ± 0.8 c560 ± 54 d537 ± 163 f4.5 ± 0.3 c,d
PE-15TPS12.5 ± 0.7 c450 ± 66 e275 ± 72 g4.2 ± 0.3 c,d
a–g Different letters show statistically significant differences between the obtained films (p < 0.05).
Table 3. Thermal parameters of PE and PE-TPS blends in terms of melting temperature (Tm), normalized melting enthalpy (ΔHm), degree of crystallinity (χc), onset oxidation temperature (OOT), and oxidation induction time (OIT).
MaterialTm (°C)ΔHm (J/g)χc (%)OOT (°C)OIT (min)
PE130.2147.8350.5219.718.1
PE-2.5TPS131.6139.2548.7218.115.3
PE-5TPS131.6129.8346.6217.714.8
PE-7.5TPS131.0127.7847.1219.814.6
PE-10TPS130.4119.9545.5220.314.5
PE-12.5TPS131.2117.3645.8220.114.4
PE-15TPS130.1115.1946.3218.014.4
TPS123.023.95---
Table 4. Color parameters of PE and PE-TPS blends in the CIEL*a*b* color space.
MaterialL*a*b*ΔEab*
PE62.89 ± 0.47 a−1.92 ± 0.25 a−3.81 ± 0.3 a-
PE-2.5TPS61.91 ± 0.35 b−1.83 ± 0.03 a−2.38 ± 0.09 b1.75 ± 0.3 a
PE-5TPS59.52 ± 0.27 c−1.31 ± 0.09 b−1.29 ± 0.18 c4.25 ± 0.3 b
PE-7.5TPS59.06 ± 0.43 c,d−1.28 ± 0.06 b−0.95 ± 0.09 d4.81 ± 0.4 b
PE-10TPS58.59 ± 0.39 d−1.38 ± 0.05 b−0.32 ± 0.12 e5.57 ± 0.3 c
PE-12.5TPS55.52 ± 0.52 e−0.87 ± 0.06 c−0.22 ± 0.07 e8.27 ± 0.5 d
PE-15TPS51.54 ± 0.76 f−0.58 ± 0.07 c−0.34 ± 0.09 e11.09 ± 0.7 e
a–e Different letters show statistically significant differences between the obtained films (p < 0.05).
Disclaimer/Publisher’s Note: The statements, opinions and data contained in all publications are solely those of the individual author(s) and contributor(s) and not of MDPI and/or the editor(s). MDPI and/or the editor(s) disclaim responsibility for any injury to people or property resulting from any ideas, methods, instructions or products referred to in the content.

