
A Risk Assessment Framework Based on Fuzzy Logic for Automotive Systems


1
Department of Information Engineering, University of Pisa, 56122 Pisa, Italy
2
Institute of Information Science and Technologies (ISTI-CNR), 56124 Pisa, Italy
*
Author to whom correspondence should be addressed.
Safety 2024, 10(2), 41; https://doi.org/10.3390/safety10020041
Submission received: 12 February 2024
/
Revised: 15 April 2024
/
Accepted: 19 April 2024
/
Published: 25 April 2024
Abstract
:Recent advancements in the automotive field have significantly increased the level of complexity and connectivity of modern vehicles. In this context, the topic of cybersecurity becomes extremely relevant, as a successful attack can have an impact in terms of safety on the car navigation, potentially leading to harmful behavior. Risk assessment is typically performed using discrete input and output scales, which can often lead to an identical output in terms of risk evaluation despite the inputs presenting non-negligible differences. This work presents a novel fuzzy-logic-based methodology to assess cybersecurity risks which takes attack feasibility and safety impact as input factors. This technique allows us explicitly model the uncertainty and ambiguousness of input data, which is typical of the risk assessment process, providing an output on a more detailed scale. The fuzzy inference engine is based on a set of control rules expressed in natural language, which is crucial to maintaining the interpretability and traceability of the risk calculation. The proposed framework was applied to a case study extracted from ISO/SAE 21434. The obtained results are in line with the traditional methodology, with the added benefit of also providing the scatter around the calculated value, indicating the risk trend. The proposed method is general and can be applied in the industry independently from the specific case study.
1. Introduction
Recent technological advancements in the automotive field have significantly increased the level of complexity and connectivity of modern vehicles [1]. This opens the door to new opportunities in terms of functionality, environmental impact, comfort, and inclusion of disadvantaged people, but, at the same time, it increases the amount of possible cyber-attacks from which the system has to be protected [2,3,4]. In this context, the topic of cybersecurity becomes extremely relevant not only for privacy concerns, but also because it can have a direct impact on the safety of the car [5,6]. Cyber-attacks can introduce unpredictable perturbations of vehicle functionality; thus, vehicle safety must be guaranteed in the presence of cyber-attacks, and risk assessment becomes a pivotal activity in cybersecurity management.
Standards play a very important role in the automotive domain to define how threats should be identified and dealt with through a well-defined risk assessment pipeline. The recent release of the ISO/SAE 21434 [7] is a step in the right direction for addressing cybersecurity concerns. The scope of the ISO/SAE 21434 is reported below as it appears in the standard. The ISO/SAE 21434 specifies engineering requirements for cybersecurity risk management regarding concept, product development, validation, production, operation, maintenance, and decommissioning of electrical and electronic (E/E) systems in road vehicles, including their components and interfaces. The standard provides a framework that includes requirements for the cybersecurity process and a common language for communicating and managing cybersecurity risks.
The risk assessment addressed in the ISO/SAE 21434 is based on consolidated methodologies, characterized by the use of discrete input and output scales, which can often lead to an identical output in terms of risk evaluation despite the inputs presenting non-negligible differences [8].
This work presents a novel methodology for assessing risks due to cyber-attacks based on fuzzy logic applicable in the automotive field. These risks are determined according to the risk assessment pipeline in the standard ISO/SAE 21434 and directly address the safety impact of cyber-attacks. This technique allows us to explicitly model the uncertainty and ambiguousness of input data, which is typical of the risk assessment process, providing an output on a more detailed scale. At the same time, the use of fuzzy logic retains the main structure of Threat Analysis and Risk Assessment (TARA) fostered by the domain standards and allows analysts to work with linguistic variables.
The fuzzy inference engine is based on a set of control rules expressed in natural language, which is crucial to maintaining the interpretability and traceability of the risk calculation. The proposed fuzzy-logic-based risk assessment model is implemented through MATLAB and therefore supported by a well-known tool set extensively used in the industry. The tool set allows us to automatically perform risk calculation, as well as to provide graphical representation. The presented approach was applied to a case study extracted from the ISO/SAE 21434.
The obtained results are in line with the traditional methodology, with the added benefit of being on a continuous scale and provided in a way that also measures the scatter and dispersion around the calculated value, indicating the risk trend. In light of such results and considering the possibility to be easily supported by automatic tools for the calculation and graphical representation of risk values, we believe that the proposed method can be used in real industrial projects. Moreover, the methodology is general enough to be applicable in the industrial context, independently of the specific case study presented in this paper.
The paper is organized as follows: Section 2 provides a general description of the basic concepts applied in the rest of the paper. Section 3 provides a survey of existing research papers related to the application of fuzzy logic in the context of risk management. Section 4 contains a detailed description of the proposed methodology. In Section 5, a report of its application to a case study derived from the ISO/SAE 21434 standard is reported. In Section 6, the outcomes of the application of the methodology are discussed and conclusions are provided.
2. Background
This section introduces some basic background concepts regarding risk assessment (especially focusing on the automotive domain) and fuzzy logic.
2.1. Risk Assessment in Automotive
Safety critical systems development must comply with certification standards. The IEC 61508: “Functional Safety of Electrical/Electronic/Programmable Electronic safety-related Systems (E/E/PE, or E/E/PES)” [9] is the reference international standard that regulates the development and deployment of programmable systems in the industry. The standard covers safety, specifically from the point of view of hazards created when failures of the safety functions performed by E/E/PE-related systems occur. Over time, several other domain-specific standards have been released using the IEC 61508 as a foundation, such as the ISO 26262 [10] in the case of the automotive domain.
These documents require that hazard and risk assessment be carried out: “The EUC (equipment under control) risk shall be evaluated, or estimated, for each determined hazardous event”. This kind of risk analysis therefore consists of the identification of hazardous events and determination of the necessary risk reduction for these events. This process has been extensively applied in safety critical systems, where the risk is typically calculated as follows:
Hazard frequency can be measured in several ways, depending on the domain. Standards such as IEC 61508 [9] and IEC 61511 [11], for example, represent it as the estimated number of hazardous events over a year (for continuously operating components) or as the product of failure probability and demand rate (for on-demand operating components). The ISO 26262 [10] suggests that a hazard can be related to the duration of a given operational situation, so such a duration should also be taken into account when calculating the hazard frequency. The evaluation of consequences is usually represented on a discrete scale in terms of the severity of injuries sustained by involved people, and it is driven by well-established methods such as those in [12,13,14]. The risk is considered tolerable when it is lower than reference thresholds defined in context based on the current values of society. Any risk that is not tolerable should be treated accordingly and reduced to tolerable levels.
According to the ISO 26262 standard, the risk is calculated considering the additional factor of controllability (which represents the ability to avoid a specified harm or damage through the timely reactions of the persons involved). The risk (R), in the context of ISO 26262, can be described as a function (F), with the frequency of occurrence (f) of a hazardous event; the ability to avoid specific harm or damage through timely reactions of the persons involved, which is the controllability (C); and the potential severity (S) of the resulting harm or damage:
The ISO 26262 standard considers vehicle safety as the absence of unreasonable risks that arise from malfunctions of the E/E system. However, an acceptable level of safety for road vehicles requires the avoidance of unreasonable risk not only caused by malfunctions, but also associated with hazards related to the intended functionality and its implementation, especially those not due to failures (e.g., due to performance limitations). To address the safety of the intended functionality (SOTIF), the automotive-specific standard ISO 21448 was released [15].
A vehicle relying on sensing the external or internal environment that is free from the faults addressed in the ISO 26262 series can have potentially hazardous behavior caused by the intended functionality or performance limitation. Such hazardous behavior can be due to insufficient robustness of the function with respect to sensor input variations or diverse environmental conditions, or to an inability of the function to correctly comprehend the situation and operate safely. From a methodological perspective, the risk assessment in ISO 21448 is aligned with ISO 26262.
The ISO 21448, while it does not specifically address cybersecurity, recognizes that a successful attack exploiting vehicle cybersecurity vulnerabilities can also lead to potentially hazardous behavior that needs to be addressed from a functional safety point of view.
The ISO/SAE 21434 Road Vehicles: Cybersecurity Engineering [7] is the emerging standard that was released in response to these issues, with the main objective of making automotive companies (both OEMs and Suppliers) aware of the importance of cybersecurity in the product development process.
The idea is that cybersecurity should be analyzed during the whole product life cycle, starting from the first stages, towards the achievement of security by design. Moreover, decisions concerning countermeasures against cyber threats should be taken based on a Threat Analysis and Risk Assessment (TARA) process, shown in Figure 1.
In particular, the standard suggests the execution of precise activities for risk assessment. Below, they are reported as they appear in the standard:
- 15.3 Asset identification: Identify the assets, i.e., objects that have value and whose security properties must be protected along with their damage scenarios, i.e., adverse consequences involving a vehicle or vehicle function and affecting a road user;
- 15.4 Threat scenarios: Identify threat scenarios, defined as potential causes of compromise of cybersecurity properties of one or more assets to realize a damage scenario;
- 15.5 Impact rating: Determine the impact rating of damage scenarios, that is, the magnitude of damage or physical harm that can be caused by the scenario itself. According to the standard, the impact rating should be evaluated on a discrete scale composed of four classes (negligible, moderate, major, and severe) and can be categorized as safety, privacy, operational, or financial, depending on the type of potential damage;
- 15.6 Attack path analysis: Identify the attack paths related to threat scenarios. An attack path is defined as a specific set of deliberate actions that the attacker can perform to realize the threat scenario itself;
- 15.7 Attack feasibility rating: For each attack path, determine the ease with which it can be exploited. The standard recommends several techniques to perform this step and suggests mapping the result on a discrete scale composed of four classes (very low, low, medium, and high);
- 15.8 Risk value determination: Determine the risk values of threat scenarios based on the impact and feasibility rating of each. This step is performed using a risk matrix similar to the one shown in Table 1 (where 1 is the lowest and 5 is the highest risk);
- 15.9 Risk treatment decision: Select appropriate risk treatment options for threat scenarios. The following risk treatment options are determined: avoiding the risk (removing risk sources), reducing the risk, sharing the risk (through contracts or transferring risk by buying insurance), and retaining the risk.
The methodology described in Section 4 directly addresses the impact rating, feasibility rating, and risk value determination phases of the TARA.
2.2. Fuzzy Logic
Fuzzy logic is a type of logic that is based on the theory of fuzzy sets, originally developed by Zadeh [16] as a generalization of the classical set theory. Zadeh observed how the sets of objects encountered in the real world often do not have precisely defined membership criteria. In response to this problem, he developed the notion of fuzzy sets, i.e., sets for which the membership degree is not binary (either yes or no), but continuous. According to this reasoning, variables can therefore have degrees of truthfulness or falsehood represented by a range of values between 1 (true) and 0 (false). This, in turn, makes it easier to represent uncertainty and opens the possibility of modeling qualitative and ambiguous information. Later on, Mamdani [17] used the fuzzy set theory to propose an experiment aimed at controlling a steam engine by developing a set of linguistic control rules based on the workers’ experience. The rules were expressed in natural language using an IF-THEN type structure, and the system proved to be very effective at controlling the engine. This type of fuzzy inference system (FIS) became very popular because of its intuitiveness (given by the easily understandable control rules), and many works have been published since then exploring the application of a fuzzy logic controller in several domains, e.g., [18,19,20].
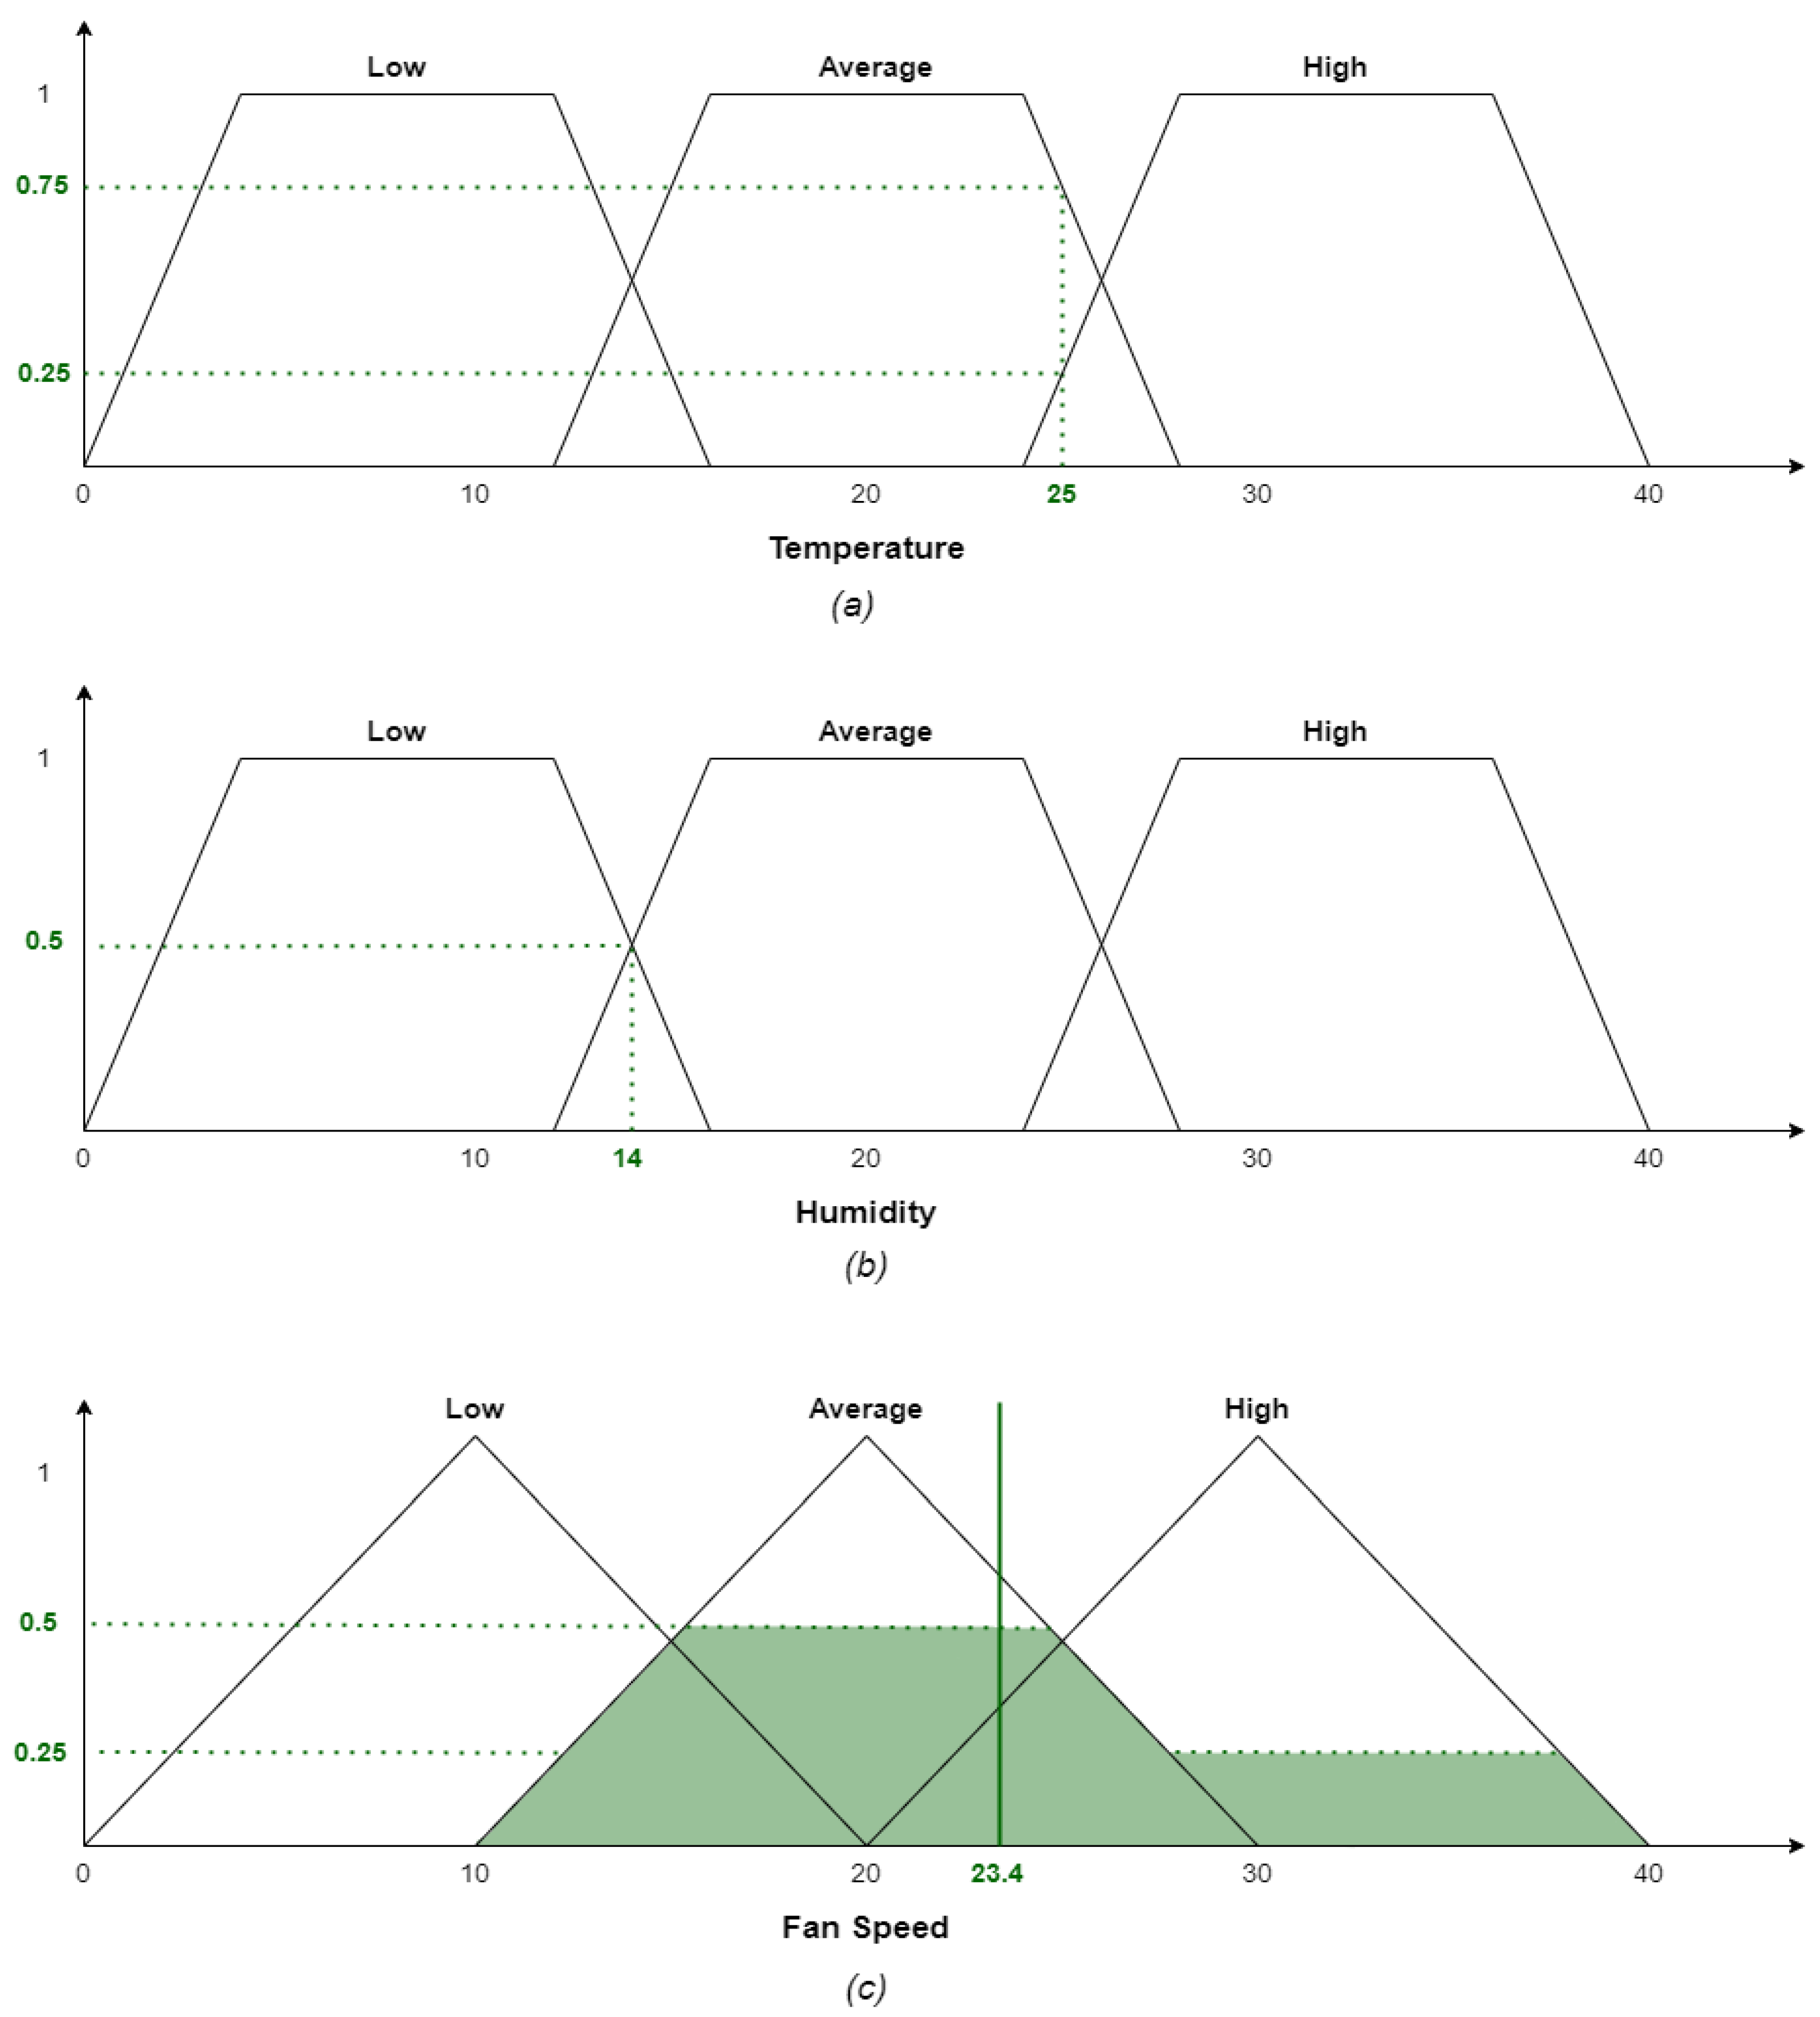
To better explain the core concepts behind a Mamdani FIS, let us consider a simple example. Suppose we want to control the speed of a cooling system fan based on ambient temperature and humidity. First, the fuzzy sets must be defined for both input (temperature and humidity) and output (fan speed). In a real-world scenario, this step would be carried out by leveraging historical and/or expert knowledge relative to the FIS applicative domain. Here, for the sake of simplicity, let {Low, Average, High} be the set of fuzzy sets and X = [0–40] be the interval of possible values for both inputs and the output.
Each set is associated with a membership function, which determines the degree of truth that an element belongs to the set. Membership functions are typically linear and shaped like trapezoids or triangles; however, they can also assume more complex shapes such as gaussian or sigmoid. Again, they are usually defined by exploiting expert knowledge or historical data, but in this case, we arbitrarily chose trapezoidal (for inputs) and triangular (for output) shapes in order to streamline the example. Note that membership functions must be consistent on the comparative basis, meaning that only one of them may be strictly increasing (or decreasing) for a certain range of the input scale. Figure 2 shows the sets (and membership functions) used for the fan control example. From Figure 2a, we can see that, for example, with a temperature of 25, it is 25% true that the temperature is High (formally indicated as = 0.25) and 75% true that the temperature is Average (formally indicated as = 0.75). It is false (or 0% true) that the temperature is Low. Similarly, Figure 2b shows that a humidity of 14 translates into a degree of truth of 50% for both the Low and Average sets. This process of mapping the inputs on fuzzy sets is known as fuzzification.
Once the membership functions are defined for both input and output fuzzy sets, the rule base must be created. The rule base contains the set of IF-THEN type rules that dictate the relationship between input and output. Every rule is composed of an antecedent, expressed in terms of input fuzzy sets, and a consequent, which represents the conclusion in terms of output fuzzy sets. Continuing with the fan control example, suppose we have the following rules:
- IF Temperature is Average AND Humidity is Low THEN Fan Speed is Average
- IF Temperature is High OR Humidity is High THEN Fan Speed is High
- IF Temperature is Low AND Humidity is Low THEN Fan Speed is Low
These rules express fuzzy relations between input and output fuzzy sets by means of logical connectors (AND, OR, THEN). The way these are translated into mathematical operations depends on the type of compositional rule of inference that is adopted [21]. The max–min composition is by far the most common, and is therefore the one that will be used in the rest of this paper.
According to the max–min compositional rule, the min and max operators correspond to fuzzy AND and OR, respectively. Given that, it is possible to calculate the firing strength of each rule (i.e., the degree of truth of its consequent) as follows:
- FiringStrengthRule1 = min [0.75, 0.5] = 0.5
- FiringStrengthRule2 = max [0.25, 0] = 0.25
- FiringStrengthRule3 = min [0, 0.5] = 0
For example, considering rule 1, the antecedent is composed of Average Temperature and Low Humidity connected by an AND operator. Given the inputs Temperature = 25 and Humidity = 14, according to the fuzzification process shown above, it results that = 0.75 and = 0.5. Since the AND operator corresponds to min according to our compositional rule, the resulting value for rule 1 is 0.5.
The next step is the aggregation, which consists of calculating the degree of truth associated with each of the output fuzzy sets (Low, Average, High). This means that, in the case of many inference rules with the same output consequent, e.g., IF A THEN C and IF B THEN C, the truth value of C is computed as the maximum firing strength among the rules having C as a consequent. This is only true under the max-mix inference rule, and the rationale behind this is that the rules IF A THEN C and IF B THEN C are equivalent to IF (A OR B) THEN C. The output of the aggregation is known as fuzzy conclusion.
In our example, the truth value of the Average output set is 0.5, the truth value of the High output set is 0.25, and the truth value of the Low output set is 0, since we have only one rule with each of those sets as consequent.
The membership function for each output set is truncated in correspondence with its calculated truth value, as shown in Figure 2c, and the resulting area (colored in green in the figure) is a graphical representation of the fuzzy conclusion.
The last step involves the transformation of the fuzzy conclusion into a crisp conclusion (i.e., represented by a single, precise value) by estimating it from the fuzzy conclusion itself. This is known as defuzzification and can be achieved by applying several different methods [22]. One of the most common is the Centroid method, which consists of calculating the center of area (COA) of the fuzzy conclusion. The x axis coordinate of the COA represents the crisp conclusion. According to this, referring again to Figure 2c, the crisp conclusion for our example results in a final value of 23.4, which represents the estimated fan speed given the temperature and humidity input values.
3. Related Work
Risk assessment and management is one of the fields where fuzzy logic was majorly explored [23] due to the fact that decisions in such a domain are usually based on inputs obtained through experts’ predictions, estimates, or evaluations, and are, therefore, intrinsically imprecise and not easily repeatable. Ramirez et al. [24], for example, used fuzzy logic to assess the risk related to silver nanoparticles in aquatic ecosystems. They used a two-layer FIS in which a toxicity parameter was first determined using size, shape, and coating of nanoparticles and then combined with concentration to extrapolate a final risk value. Petrovic et al. [25] presented a risk assessment model for mining equipment maintenance using fuzzy logic. The idea was to establish a model that would overcome the shortcomings of the conventional risk priority number (RPN) method while still maintaining the same structure of calculation involving severity, frequency, and detectability. The authors applied the model to a set of belt conveyor elements which works in severe conditions in a coal mine, showing improvements over RPN in terms of both the precision and richness of information of the assessment. A comparable approach was followed by Gallab et al. [26], who applied their methodology to liquified petrol gas supplier equipment, again demonstrating several benefits over traditional RPN. Similarly, several works explored the use of fuzzy logic in the context of performing FMEA (Failure Mode and Effect Analysis) [27,28], especially for safety critical applications such as naval [29,30] and nuclear [31]. Grassi et al. [32] instead proposed an approach to evaluate the risk associated with activities carried out in workplaces. They introduced new factors to consider the effects of human behavior and the environment on the risk level, other than the classical injury magnitude and occurrence probability of an accident. Fuzzy logic was used to allow the analyst to specify weights for different risk factors and to assign judgments by means of linguistic terms, which are better interpreted and managed by humans. In the field of financial risk management, Cheng et al. [33] constructed an early-warning model for financial distress using fuzzy regression as an alternative to well-known methods, namely, discriminant, logit, and artificial neural network analysis. Yu et al. [34] instead developed a multicriteria decision analysis tool for credit risk evaluation using fuzzy set theory.
Recent works have also applied fuzzy logic to cybersecurity risk assessment. Alali et al. [35] proposed a fuzzy inference system to evaluate risks associated with cyber threats on the internet based on four main factors: vulnerability, threat, likelihood, and impact. They structure the system in a hierarchical way, where factors such as intent and targeting are first used to determine the attacker’s capabilities, which are then evaluated alongside the vulnerabilities to determine the overall likelihood of an attack and, ultimately, the risk associated with it. They also developed a decision support system [36] with the aim of aiding in the selection of a risk mitigation strategy for cyber-crimes in Saudi Arabia. Saulaiman et al. [37] presented a fuzzy-logic-based implementation of a CVSS (Common Vulnerability Scoring System) calculator. They showed similar results with respect to the traditional CVSS, with the added benefit of explainability, and highlighted the possibility of enhancing the system with domain-specific metrics in the future. Finally, Kerimkhulle et al. [38] proposed a model to estimate the risk associated with information security in the Industrial Internet of Things (IIoT) environment using three fuzzy inference systems. One system estimates the probability of threat realization, another estimates the probable damage, and a final one estimates the information security risk for the IIoT system.
4. Proposed Methodology
To assess cybersecurity risks taking into account their impacts in terms of safety, we propose a risk assessment framework based on fuzzy logic. Conceptually, the idea is similar to the approach described in the ISO/SAE 21434, as the risk is calculated as the combination of two factors: Impact Rating, i.e., how impactful the consequences of an attack can be in terms of safety, and Feasibility Rating, i.e., how difficult it is for a malicious individual to perform the attack. With reference to Figure 1, using TARA, our approach aims at refining the phases of impact rating evaluation (15.5), feasibility rating evaluation (15.7), and risk determination (15.8). The following paragraphs will first discuss such factors and then present the complete framework.
4.1. Input Factors
Impact rating—The impact rating is determined based on the damage scenarios that can stem from a successful attack. Although the impact can be evaluated in terms of several factors, such as safety, operational, financial, and privacy, we specifically address safety. The ISO/SAE 21434 standard measures the safety impact rating using the severity of the consequences of a damage scenario in terms of injuries and harm to the people involved as the only metric. However, the standard states that factors like controllability and exposure (used in the ISO 26262) can also be considered if proper rationale is provided. Given the focus of this work on assessing the cybersecurity risks related to safety, we consider controllability to be an important factor to include in the risk calculation. Controllability refers to the probability that someone is able to gain sufficient control of the hazardous event, such that they are able to avoid specific harm. Different damage scenarios can have similar severity but significantly different levels of controllability, which would alter the actual probability of injuries occurring. In such cases, the risk associated with hardly controllable or uncontrollable scenarios should be higher, despite the severity being the same.
In line with the ISO 26262, both severity and controllability are evaluated on a discrete scale from 0 to 3, as shown in Table 2 and Table 3, respectively. To assign a rating to the severity factor, an existing injuries scale (e.g., Abbreviated Injury Scale (AIS), Injury Severity Score (ISS), New Injury Severity Score (NISS)) can be used as a reference [12,13,14]. Based on the considerations reported above, we calculate the impact rating as the mean between the values of severity and controllability, as shown by the following formula:
Feasibility rating—In this work, the feasibility rating is determined by the exploitability metric provided by the CVSS framework, which is one of the ways suggested by the ISO/SAE 21434. The exploitability metric is based on four factors: attack vector, attack complexity, privileges required, and user interaction. Table 4 provides a description of each factor, along with the list of possible values it can assume according to the CVSS framework. Each numerical value is associated with a label (or metric value) [39]. Once a value has been assigned to every factor, the feasibility rating is calculated using the following equation:
The result is therefore obtained on a continuous scale that ranges from 0.12 to 3.89.

Table 4.
Factors used to determine the exploitability metric.
| Factor | Description | Possible Values | |
|---|---|---|---|
| Numerical | Metric | ||
| Attack Vector (V) | Reflects the context in which the vulnerability is exploitable. | 0.2 | Physical |
| 0.55 | Local | ||
| 0.62 | Adjacent | ||
| 0.85 | Network | ||
| Attack Complexity (C) | Describes the conditions beyond the attacker’s control that must exist to exploit the vulnerability. | 0.44 | High |
| 0.77 | Low | ||
| Privileges Required (P) | Describes the level of privileges an attacker must possess to exploit the vulnerability. | 0.27 | High |
| 0.62 | Low | ||
| 0.85 | None | ||
| User Interaction (U) | Captures the requirement for another user, other than the attacker, to participate in the successful exploitation of the vulnerability. | 0.62 | Required |
| 0.85 | None | ||
4.2. Definition of Fuzzy Logic-Based Risk Assessment Framework
The first step towards the construction of our fuzzy-logic-based risk assessment framework is the definition of the input and output fuzzy sets. As previously mentioned in Section 2.2, fuzzy sets populate the scale of each factor. Each fuzzy set should be associated with a linguistic label and a corresponding membership function which identifies the range of input values corresponding to such a label. In our case, we defined the following fuzzy sets for the input factors:
and the following fuzzy set for risk, which is the output, according to the ISO/SAE 21434:
FS_Impact rating: {Negligible, Moderate, Major, Severe}
FS_Feasibility rating: {Very Low, Low, Medium and High}
FS_Risk rating: {Very Low, Low, Medium, High, Very High}
The shape of membership functions is particularly important since it has a significant effect on the inference system calculation process. In this work, we relied on solutions from available standards and literature.
Feasibility membership functions—The membership functions for feasibility rating were also defined starting from the ISO/SAE 21434. In Annex G, that standard suggests subdividing the input interval into four (one for each label) disjoint subintervals, as shown in Table 5.
This, however, does not fully capture the uncertainty derived from the fact that input values are intrinsically imprecise, as they are the result of a qualitative assessment made by humans. The idea is to create an overlap between each adjacent subinterval to smoothen the passage from one label (or set) to the other and represent such uncertainty. In each overlap range, the membership linearly decreases for one set while linearly increasing for the next one. This range was set to 0.5, which resulted in four trapezoidal membership functions, as shown in Figure 3a.
Considering, for example, the membership function for the Low set, it can be formally described as follows:
Impact membership functions—For the impact rating, instead, the membership functions are more difficult to define, since in the literature and the standards, such a metric is usually only expressed in linguistic terms. We assumed that the central labels (Moderate and Major fuzzy sets) should be evenly distributed across the input range, whereas the other two (Negligible and Severe) are expected to be more rare since they represent edge cases and are therefore mapped on smaller intervals. In terms of function shape, we used the triangular one, as it has been demonstrated to be the most universally effective [40]. The resulting functions are shown in Figure 3b.
Risk membership functions—The risk membership functions (shown in Figure 3c) should also have a triangular shape, but the ones corresponding to Very Low and Very High were given a trapezoidal shape. This was intended to give the final output after defuzzification (see final paragraph of this section) in the interval [1,2,3,4,5], which allows for a direct comparison with the risks calculated according to the traditional methodology provided by the ISO/SAE 21434. More precisely, the whole output is mapped on the interval [0.45–5.55].
Rule base. Next, the rule base must be defined. In this case, it was defined by following the guidance provided by the risk matrix in Annex H of the ISO/SAE 21434. With two input factors, each with four possible values (labels), we obtained a total of 16 rules, summarized in Table 6, which is a variation of the table found in the standard (Table 1), where the risk numbers have been replaced with corresponding fuzzy sets (1—Very Low, 2—Low, 3—Medium, 4—High, 5—Very High). Each element of Table 6 represents a rule. The element of row i, column j becomes the rule with the antecedent (Impact is i) AND (Feasibility is j), while the consequent is the value in position (i, j). For example, for the row Moderate and the column High, the rule is the following:
IF Impact is Moderate AND Feasibility is High THEN Risk is Medium
The rules corresponding to the last row of Table 6 can be combined together and expressed as a single rule:
IF Impact is Negligible THEN Risk is Very Low
Note that every rule uses an AND connector in the antecedent (which translates to the min operator under the max–min composition), since both the impact and the feasibility rating must be taken into account at all times to determine the resulting risk.
Defuzzification. Finally, the defuzzification technique needs to be selected to obtain a crisp value from the fuzzy conclusion set and quantitatively express the level of risk associated with the analyzed attack. As previously stated, there are several different ways to perform defuzzification [22]. We choose to apply the Centroid method, which is the most commonly used, and is calculated as follows:
Table 6.
Rule base (derived from the risk matrix in ISO/SAE 21434, Annex H).
| Feasibility Rating | |||||
|---|---|---|---|---|---|
| Very Low | Low | Medium | High | ||
| Impact Rating | Severe | Low | Medium | High | Very High |
| Major | Very Low | Low | Medium | High | |
| Moderate | Very Low | Low | Low | Medium | |
| Negligible | Very Low | Very Low | Very Low | Very Low | |
4.3. Risk Assessment Procedure
Given an attack, once the input factors have been evaluated (Impact Rating and Feasibility Rating, above), the fuzzy inference system can be used to derive the risk associated with the attack. Figure 4 shows the proposed fuzzy-logic-based procedure to assign a rating to the risk associated with a cyber-attack; each step is explained in more detail below.
Step 1—Fuzzification: The attack is evaluated based on the two risk factors mentioned above, i.e., impact rating and feasibility rating. The values are then mapped onto the respective fuzzy sets according to their membership functions. The result of this step is a fuzzified input, i.e., represented in terms of its degree of truth with respect to each input fuzzy set:
where AImpact(x) is the set of results of the impact rating membership functions related to the input value x.
AImpact(x) = {µNegligible(x), µModerate(x), µMajor(x), µSevere(x)}
AFeasibility(x) = {µVeryLow(x), µLow(x), µMedium(x), µHigh(x)}
AFeasibility(x) = {µVeryLow(x), µLow(x), µMedium(x), µHigh(x)}
Step 2—Inference: During inference, the fuzzified input is compared with the rule base to generate a fuzzy conclusion. More precisely:
- Every rule is fired to a degree that depends on the degree to which its antecedent matches the inputs. The firing strength of each rule is equal to the minimum (due to the AND operator) truth value among the fuzzy sets contained in its antecedent;
- Rules having the same consequent (and firing strength higher than 0) are aggregated (by using the max operator) in order to obtain a single truth value for each output fuzzy set.
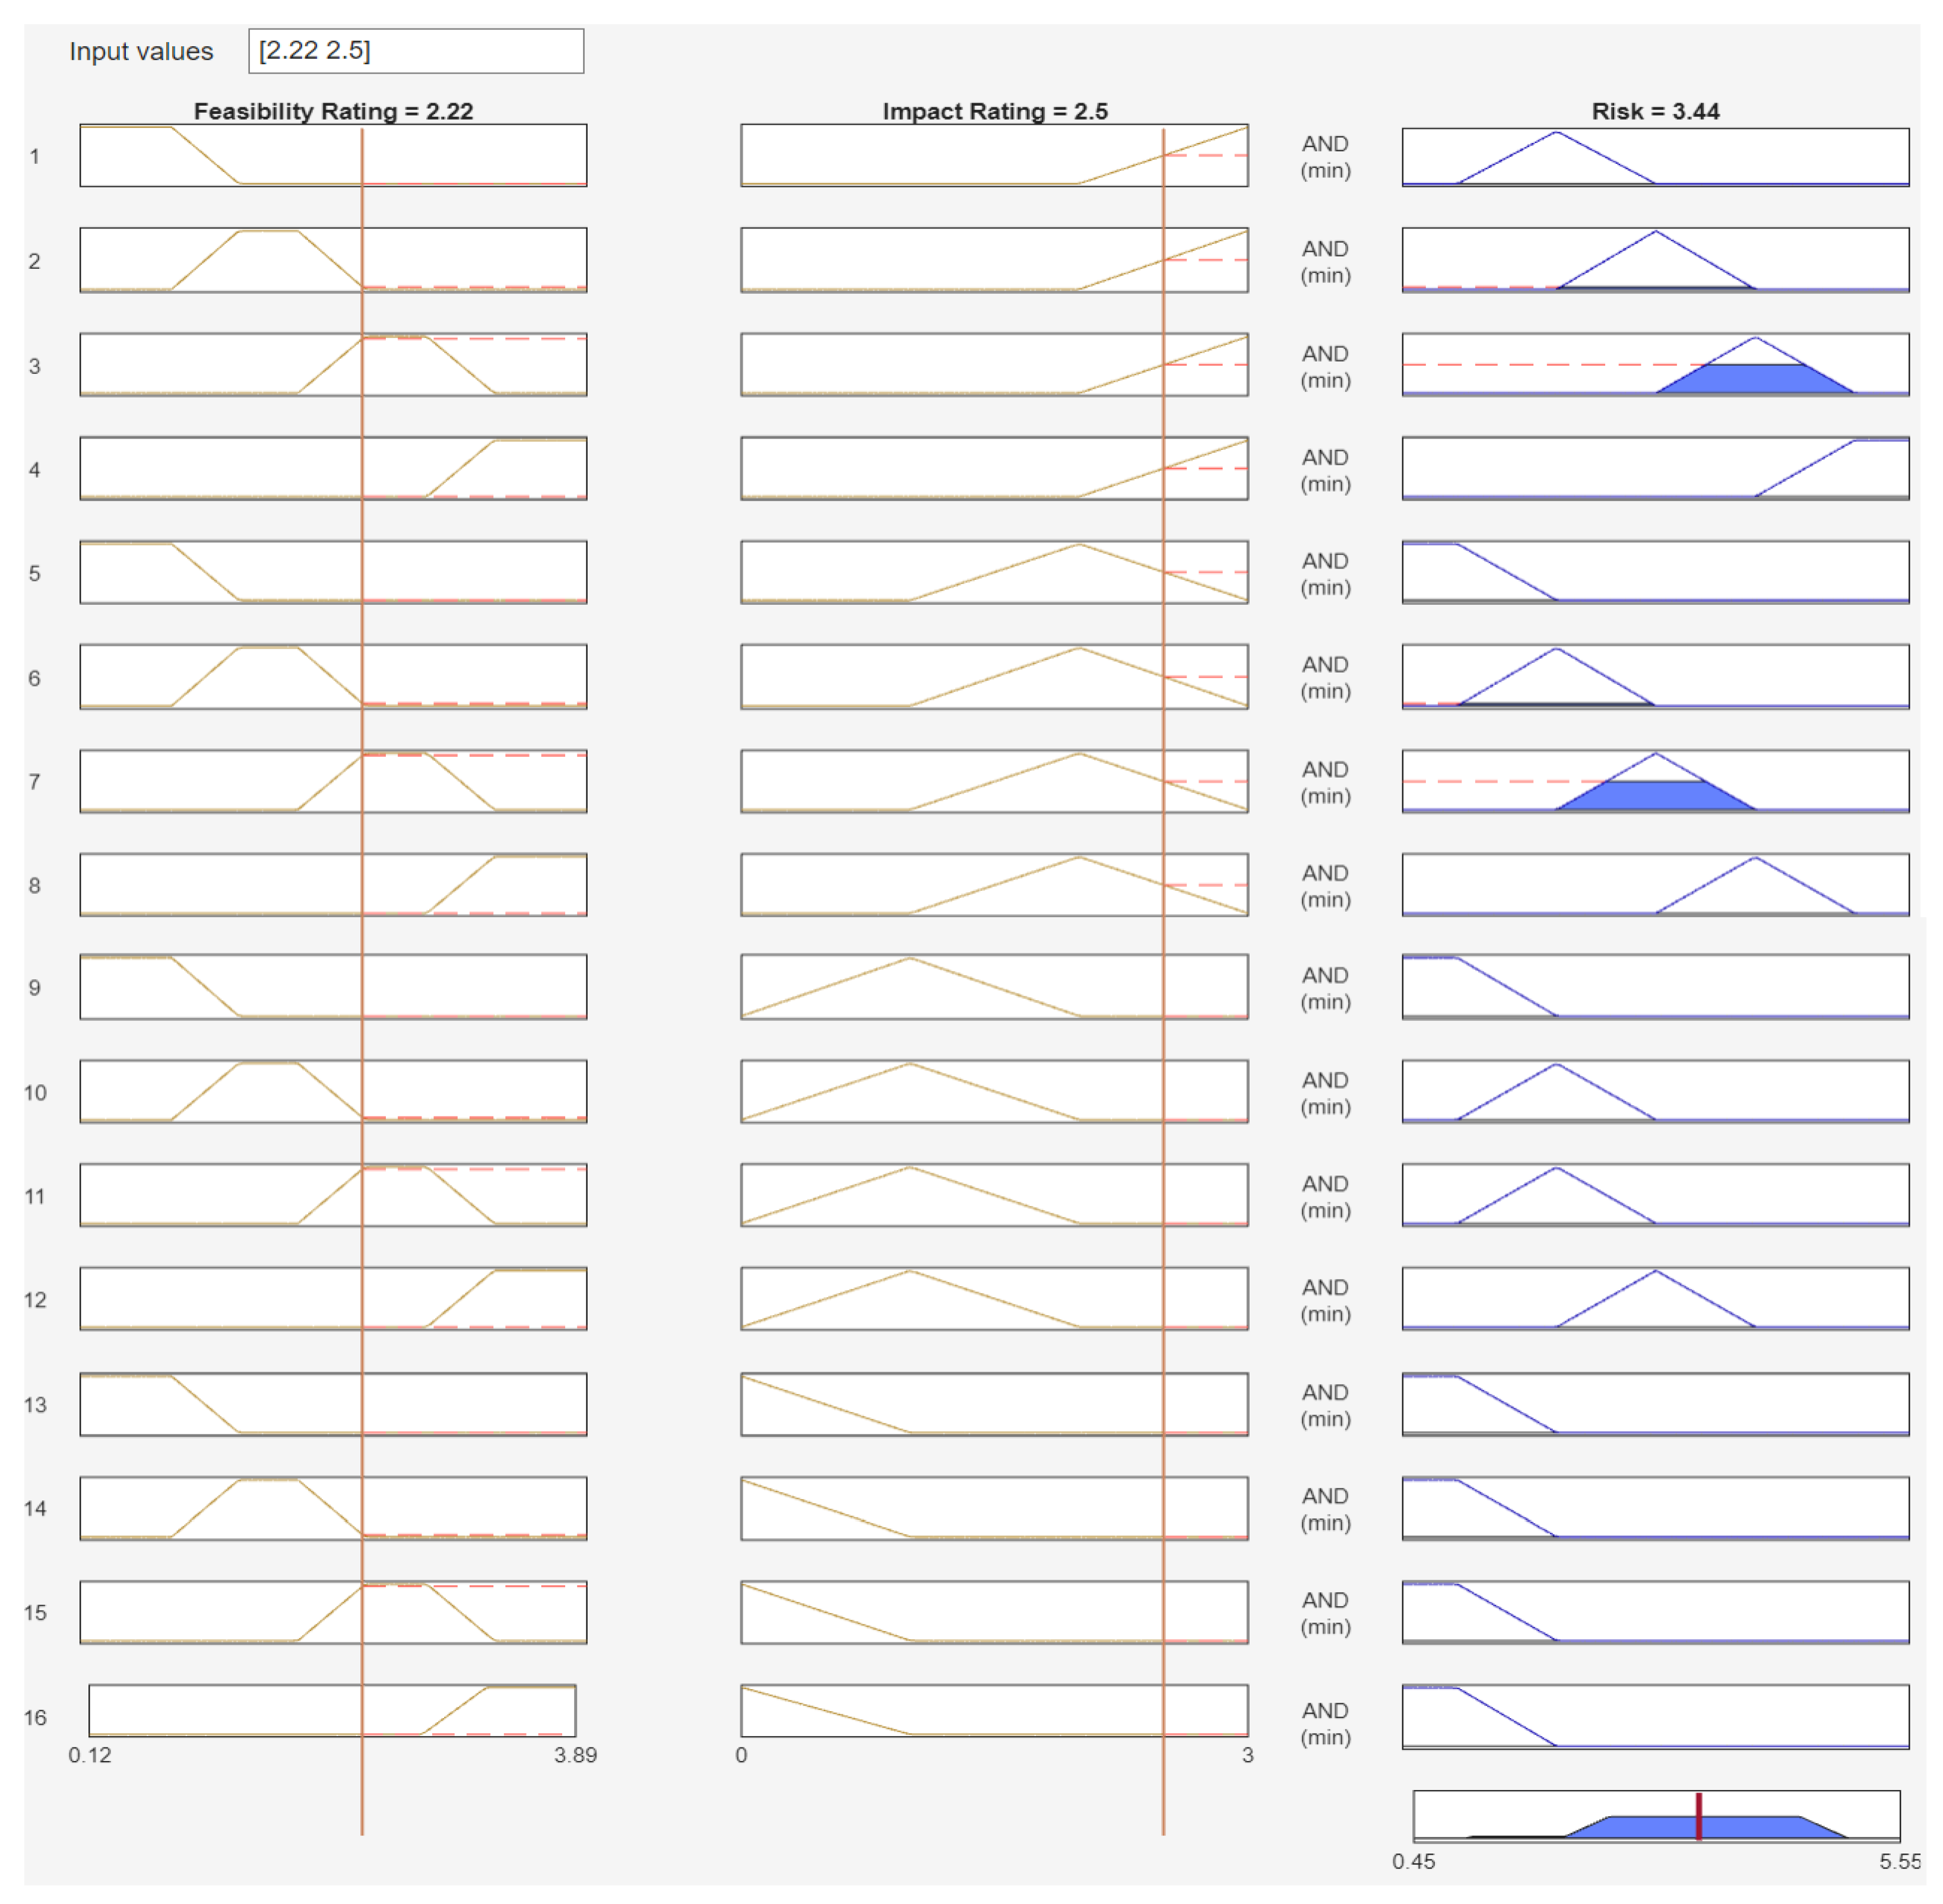
A graphical and intuitive representation of this process is shown in Figure 5.
Step 3—Defuzzification: Finally, the fuzzy conclusion is defuzzified and translated into a crisp one using the centroid method.
Figure 5.
Example of risk calculation (threat scenario 2 and damage scenario 3).

Note that the procedure described above takes place after the identification of item, asset, and damage scenarios, according to the TARA pipeline (Figure 1). Once those are identified, the impact rating can be calculated immediately, whereas the feasibility rating requires additional steps consisting of the identification of threat scenarios and related attack paths.
In the following section, we provide a case study showing the risk assessment made according to the domain reference standards approach and the proposed fuzzy-logic-based methodology.
5. A Case Study
In this section, we present a case study of the application of the proposed methodology, using the example provided by the annex H of the ISO/SAE 21434 as a reference. We selected this case study because, despite its simplicity, it is part of a standard and hence widely recognized among practitioners. This provides an easily understandable yet plausible example of application, which aligns with the main aim of this section.
The item under consideration is a headlamp system, functionally defined in the following way: “The headlamp system turns on/off the headlamp in accordance with the switch by demand of the driver. If the headlamp is in high-beam mode, the headlamp system switches the headlamp automatically to the low-beam mode when an oncoming vehicle is detected. It also returns the headlamp automatically to the high-beam mode if the oncoming vehicle is no longer detected”.
For space constraints, we will focus on one specific asset, the integrity of the data communication channel that forwards the turn on and turn off requests to the lamp system. Once the asset is identified, the damage scenarios must be defined. Contextually, each damage scenario must be evaluated in terms of severity and controllability according to (3) to associate it with an impact rating. Table 7 contains a few examples of damage scenarios to use in the case study.
Damage Scenario 1 is taken from the standard, while Damage Scenarios 2 and 3 are variants to include different vehicle speeds and road surfaces. Damage Scenarios 4 and 5, which consider the collision with a pedestrian, are introduced with aim of enriching the case study. For each damage scenario, the associated impact rating was determined by applying the steps provided by the reference standards (ISO/SAE 21434 and ISO 26262) with the support of an expert in automotive functional safety. For instance, considering Damage Scenarios 2 and 3, it can be noticed that the icy surface affects the overall impact rating as it reduces the vehicle’s controllability.
Damage scenarios must then be linked with threat scenarios, i.e., potential cause of compromise of the asset that can lead to the realization of the damage. Threat scenarios are then evaluated in terms of the feasibility of their associated attack paths. Table 8 shows two threat scenarios (which are directly taken from the ISO/SAE 21434 and are valid for all the above damage scenarios).
Table 9 shows some attack paths related to the threat scenarios in Table 8 to be considered to calculate the feasibility rating. The TARA process provided by the standard was used as a guide to define attack paths and rate their feasibility with the support of an expert in the specific field. For example, let us consider Threat Scenario 1. Attack Path (A) is executed through the cellular interface and was therefore assigned an Attack Vector (V) value of 0.85, which, based on Table 4, corresponds to Network. Similarly, Complexity (C) was assigned a value of 0.77 (corresponding to Low), and Privileges Required (P) and User Interaction (U) values of 0.85 (both corresponding to None). According to Equation (4), these values result in a feasibility rating of 3.89. Attack Path (B) is similar, the only difference being that, in this case, the attack is enacted through the Bluetooth interface. As a consequence, its Attack Vector (V) value is lower (0.62, corresponding to Adjacent), resulting in a feasibility rating of 2.84. Analogous reasoning was applied to determine the feasibility ratings for all the other attack paths.
Finally, it is possible to apply our methodology to calculate the risk value in terms of safety using the impact rating and feasibility rating obtained previously. The input and output fuzzy sets, the membership functions, and the rule base used in this case study are those defined in Section 4.2.
The fuzzy inference system was implemented using the Fuzzy Logic Designer Toolbox [41]. The toolbox is built to help the user to design, tune, and test a fuzzy inference system. This includes definition of the membership functions and rule base as well as behavior analysis, involving visualization of the inference process and output surface maps. Most importantly, once the FIS is designed (input and output membership functions and the rule base are defined), the toolbox allows the risk calculation step to be performed automatically.
Figure 5 shows an example of risk calculation on the MATLAB interface with reference to the following cases:
Given these input values, the toolbox allows us to visualize the complete inference process that leads to the final risk value. More precisely, every row in the figure corresponds to a rule in the rule base, and the white boxes contain the membership functions associated with the fuzzy sets (labels) that appear in the antecedent (input) and consequent (output) of that specific rule. In the images, the rules appear in the same order as they are presented in Table 6. The vertical lines running across the two input columns represent the input values. The points where those lines intersect with the input membership functions determine the firing strength of each rule, which can clearly be seen in the output column (represented by the blue area obtained by truncating the output membership function for the rules that have firing strengths greater than 0). In the example, the rules 2, 3, 6, and 7 are activated, with firing strengths of 0.04, 0.5, 0.04, and 0.5, respectively. The resulting area (i.e., representation of the fuzzy conclusion) is shown in the last box of the output column. Finally, the red vertical line in such a box marks the result of the defuzzification process, applied to obtain the final crisp value of 3.44.
Table 10 shows a complete comparison of the results obtained using the fuzzy inference system (ref. Column FIS) as opposed to the traditional approach contained in the reference domain standards as the ISO/SAE 21434 (ref. Column TARA, for which the output is obtained through the risk matrix presented in Table 1).
The results reported in Table 10 provide interesting evidence. We can notice that the major differences between risks occur for Damage Scenarios 3, 4, and 5 for both the Threat Scenarios considered. According to the risk assessment methodology provided by the ISO/SAE 21343 standard, those damage scenarios are evaluated as having the same risk (risk value 4 in the case of Threat Scenario 1 and risk value 3 in in the case of Threat Scenario 2), while the corresponding risks calculated according to the FIS vary significantly. In particular, if we focus on Damage Scenarios 4 and 5, we can see that the corresponding driving conditions are substantially different. Notably, in Damage Scenario 4, the road surface is icy. The risk calculated according to the FIS methodology is able to consider such a condition (the risk in the case of Damage Scenario 4 is significantly higher than in Damage Scenario 5), while the risk calculated according to the ISO/SAE 21343 methodology is not. Similar considerations can be made for Damage Scenarios 2 and 3. In summary, the finer level of granularity provided by the FIS methodology in risk calculation leads to more detailed risk values which are able to better represent the real driving situations. The ISO/SAE 21434 methodology, on the other hand, occasionally assigns identical risk values to driving scenarios that differ significantly in terms of potential safety consequences.
6. Discussion and Conclusions
Based on the outcomes shown in the previous section, we discuss the effectiveness of the risk assessment methodology based on fuzzy logic described in this paper and the related benefits for practitioners. The strengths of the proposed risk assessment methodology with respect to the ones used in the industry (that are based on the domain reference standards) are schematically argued as follows:
- Granularity of the risk value: As pointed out in previous sections, traditionally, the numerical input ranges are discretized into a certain number of disjoint subintervals, each associated with a (human-understandable) linguistic label and are finally used to extrapolate the risk value, usually with the support of domain experts. This, however, leads to a loss of information, since it does not fully capture the uncertainty deriving from the fact that such values are intrinsically imprecise, as they are the result of a qualitative assessment made by humans. Fuzzy logic is designed to explicitly model such uncertainties while retaining the ability to work with linguistic variables. The output of the process is, therefore, richer in information, as it can be represented by a linguistic variable or numerically, in a way that it also measures the scatter and dispersion around the calculated value, indicating the risk trend.Differently from the risk assessment methodologies proposed by the reference domain standards, the fuzzy inference system provides the output on a continuous scale rather than a discrete one. Figure 6 provides a graphical representation of the risk values calculated with the fuzzy-logic-based methodology described in this paper (Figure 6b) and the risk values calculated according to the methodologies proposed by the domain reference standards (Figure 6a). The surface representing the possible risk values provided by the fuzzy-logic-based methodology is continuous and smooth, while the one resulting from the risk assessment methodologies proposed by the domain reference standards has a stepped surface, showing a rougher risk calculation. This means that the risk assessment methodology we proposed allows for fine-grain output values, while the traditional approaches give coarse-grain output values.This allows for a finer level of granularity that can be crucial to the overall risk management process when the output of the risk assessment process must be used for prioritization of risks related to cyber threats. In fact, with reference to the results of the case study provided in Table 10, it can be noticed that several risk values that would have had the same value according to the standard methodology actually have significantly different values using the methodology based on fuzzy logic. Let us take, for example, the damage scenarios 3 and 5 of the threat scenario 2. The related risks would be both rated 3 according to the methodology proposed by the standards, while they are rated 3.44 and 2.50, respectively, according to the methodology proposed in this paper.
- Automatic tools support the mitigation of the increased computational and structural complexity of the proposed methodology with respect to the complexity of the methodologies proposed by the domain reference standards.The methodology we propose in this paper is more complex than those proposed by the domain reference standards for risk assessment. In fact, the latter are easily applicable as they do not require significant computational effort, being based on simple tables. The methodology proposed in this paper presents a higher level of computational complexity (e.g., the defuzzification phase), and it also requires the construction and graphical representation of the membership functions.Nevertheless, such an overhead of complexity is strongly mitigated by the availability of ready-to-use automatic tools supporting the methodology for both the computation of the risks and the definition and representation of the membership functions (the use of tools is described in Section 5).
- The results provided by our method are numerically similar to those obtained by applying the traditional methodology suggested by the reference domain standards (e.g., ISO/SAE 21434 and ISO 26262). In some instances, the output is the same; in others, there is a difference, which, however, is never greater than 0.5. We cannot state that our methodology is conservative in risk calculation (in the sense that risks are always greater or equal) with respect to the methodologies suggested by the domain reference standards. Our methodology is not to assess risks more severely, but to increase the accuracy of the risk assessment. Consequently, it reduces overestimated risks and increases underestimated risks. From the observation of Figure 6, we can derive that, as the surface of Figure 6b represents basically a non-decreasing monotonic function, the linear ordering among the risks calculated according to the risk assessment methodologies proposed in this paper is maintained. In other words, given that the risk R is calculated as Rf,I = F(f, I) (where f is the feasibility rating and I the impact rating), increasing values of f and I correspond to non-decreasing values of R. This allows the outcomes of this methodology to be effectively used in risk management and risk prioritization, and can be compared with the results derived according to the risk assessment methodologies suggested by the reference domain standards.
- The application of a Mamdani fuzzy logic inference system preserves the explainability of the process. The rule base and the labels associated with input and output fuzzy sets are expressed in natural language and are therefore interpretable for a human. The calculation process that the system enacts to correlate input and output is also transparent, and it is possible to trace back the steps that led to a certain conclusion given a certain set of inputs (see Figure 5). This is a crucial property, especially in a safety-critical domain, as it allows one to have full insight into the risk assessment process and, therefore, on the decisions that are taken based on it.
Given the characteristics listed above, we can consider the presented methodology easily applicable in practice, without any particular limitation with respect to traditional techniques.
To conclude, in this paper, we have provided a new methodology, based on fuzzy logic, to assess cyber-security risks considering the safety impact of cyber-attacks. Risk assessment is a key activity in the development process of systems with implications in terms of safety and cyber-security, in particular for the HARA (Hazard Analysis and Risk Assessment) in the safety context and TARA in the cyber-security context. Available domain standards provide guidance on how to conduct risk assessment. In particular, in the automotive domain, the availability of effective risk assessment methodologies is pivotal, as new-generation connected cars present strong concerns in terms of safety and cybersecurity, and new technologies are expected to be more and more pervasive in modern vehicles [42]. Moreover, cybersecurity vulnerabilities may represent a source of safety issues, as successful cyber-attacks may lead to potentially hazardous behavior that needs to be addressed from a safety point of view. In such a context, the risk assessment methodology we have proposed is able to explicitly model the uncertainty and ambiguousness of input data typical of the risk assessment process, providing an output on a more detailed scale.
The risk assessment methodology described in this paper, and applied in a case study taken from the ISO/SAE 21434 standard, presents several advantages, such as the increased granularity of the risk value (that allows risk management and prioritization to be improved), the capability to be easily handled by humans as preserving explainability, and the substantial preservation of the linear ordering of calculated risks. The applicability of the risk assessment methodology is assured by the support provided by available, easy-to-use, automatic tools. We believe that these features make for a practically impactful methodology, especially in a context where vehicles are becoming more complex by the day, allowing for a finer and more streamlined risk assessment and prioritization while retaining interpretability and ease of use.
In the future, we intend to extend the work presented in this paper by applying the risk assessment methodology to automotive industrial case studies in order to thoroughly validate its applicability in real contexts. A comparative analysis of the results will then be carried out. We believe that such an effort will provide a precise evaluation of the practical implications and benefits of the presented approach. Moreover, it will foster the assessment of the impact of the emerging technologies on the presented risk assessment methodology for the automotive domain.
Author Contributions
The authors’ contributions can be summarized as follows: Conceptualization F.M., C.B. and G.L.; methodology F.M.; software, F.M.; validation, F.M., C.B. and G.L.; formal analysis, F.M.; investigation, F.M., C.B. and G.L.; data curation, F.M.; writing—original draft preparation, F.M., C.B. and G.L.; writing—review and editing, F.M., C.B. and G.L.; visualization, F.M.; supervision, C.B. and G.L. All authors have read and agreed to the published version of the manuscript.
Funding
This work was partially funded by the PNRR—M4C2—Investimento 1.3, Partenariato Esteso PE00000013—“FAIR—Future Artificial Intelligence Research”—Spoke 1 “Human-centered AI” under the NextGeneration EU programme and by the Italian Ministry of University and Research (MUR) in the framework of the FoReLab and CrossLab projects (Departments of Excellence).
Institutional Review Board Statement
Not applicable.
Informed Consent Statement
Not applicable.
Data Availability Statement
All the relevant data are included in the paper.
Conflicts of Interest
The authors declare no conflicts of interest.
References
- Chen, L.; Li, Y.; Huang, C.; Li, B.; Xing, Y.; Tian, D.; Li, L.; Hu, Z.; Na, X.; Li, Z.; et al. Milestones in autonomous driving and intelligent vehicles: Survey of surveys. IEEE Trans. Intell. Veh. 2022, 8, 1046–1056. [Google Scholar] [CrossRef]
- Sun, F.R.; Zhang, P. A survey on cyber-security of connected and autonomous vehicles (CAVs). IEEE Trans. Intell. Transp. Syst. 2021, 23, 6240–6259. [Google Scholar] [CrossRef]
- Checkoway, S.; McCoy, D.; Kantor, B.; Anderson, D.; Shacham, H.; Savage, S.; Koscher, K.; Czeskis, A.; Roesner, F.; Kohno, T. Comprehensive Experimental Analyses of Automotive Attack Surfaces. In Proceedings of the 20th USENIX Security Symposium (USENIX Security 11), San Francisco, CA, USA, 8–12 August 2011; Available online: https://www.usenix.org/conference/usenix-security-11/comprehensive-experimental-analyses-automotive-attack-surfaces (accessed on 6 January 2024).
- Wang, Z.; Wei, H.; Wang, J.; Zeng, X.; Chang, Y. Security Issues and Solutions for Connected and Autonomous Vehicles in a Sustainable City: A Survey. Sustainability 2022, 14, 12409. [Google Scholar] [CrossRef]
- Tesla in Autopilot Mode Crashes into Fire Truck. Available online: https://money.cnn.com/2018/01/23/technology/tesla-fire-truck-crash/index.html (accessed on 6 January 2024).
- Uber Self-Driving Car Operator Pleads Guilty to Endangerment in Pedestrian Death Case|CNN Business. Available online: https://www.cnn.com/2023/07/29/business/uber-self-driving-car-death-guilty/index.html (accessed on 6 January 2024).
- ISO/SAE 21434; Road Vehicles—Cybersecurity Engineering. International Organization of Standardization, Society of Automotive Engineers: Geneva, Switzerland; Warrendale, PA, USA, 2021.
- Macher, G.; Sporer, H.; Berlach, R.; Armengaud, E.; Kreiner, C. SAHARA: A security-aware hazard and risk analysis method. In Proceedings of the 2015 Design, Automation & Test in Europe Conference & Exhibition, Grenoble, France, 9–13 March 2015; pp. 621–624. [Google Scholar] [CrossRef]
- IEC 61508; Functional Safety of Electrical/Electronic/Programmable Electronic Safety Related Systems. IEC: Geneva, Switzerland, 2000.
- ISO 26262; Road Vehicles—Functional Safety. International Organization of Standardization: Geneva, Switzerland, 2018.
- IEC 61511; Functional Safety—Safety Instrumented Systems for the Process Industry Sector. IEC: Geneva, Switzerland, 2016.
- Gennarelli, T.A.; Wodzin, E. AIS 2005: A contemporary injury scale. Injury 2006, 37, 1083–1091. [Google Scholar] [CrossRef] [PubMed]
- Baker, S.P.; O’neill, B.; Haddon, W.J.; Long, W.B. The injury severity score: A method for describing patients with multiple injuries and evaluating emergency care. J. Trauma Acute Care Surg. 1974, 14, 187. [Google Scholar] [CrossRef]
- Brenneman, F.D.; Boulanger, B.R.; McLellan, B.A.; Redelmeier, D.A. Measuring Injury Severity: Time for a Change. J. Trauma Acute Care Surg. 1988, 44, 580. [Google Scholar] [CrossRef]
- ISO 21448; Road Vehicles—Safety of the Intended Functionality. International Organization of Standardization: Geneva, Switzerland, 2022.
- Zadeh, L.A. Fuzzy sets. Inf. Control 1965, 8, 338–353. [Google Scholar] [CrossRef]
- Mamdani, E.H.; Assilian, S. An experiment in linguistic synthesis with a fuzzy logic controller. Int. J. Man-Mach. Stud. 1975, 7, 1–13. [Google Scholar] [CrossRef]
- Lee, C.C. Fuzzy logic in control systems: Fuzzy logic controller. I. IEEE Trans. Syst. Man Cybern. 1990, 20, 404–418. [Google Scholar] [CrossRef]
- Sharma, S.; Obaid, A.J. Mathematical modelling, analysis and design of fuzzy logic controller for the control of ventilation systems using MATLAB fuzzy logic toolbox. J. Interdiscip. Math. 2020, 23, 843–849. [Google Scholar] [CrossRef]
- Uzunsoy, E.; Erkilic, V. Development of a trajectory following vehicle control model. Adv. Mech. Eng. 2016, 8. [Google Scholar] [CrossRef]
- Jang, J.-S.R.; Sun, C.-T. Neuro-fuzzy modeling and control. Proc. IEEE 1995, 83, 378–406. [Google Scholar] [CrossRef]
- Chakraverty, S.; Sahoo, D.M.; Mahato, N.R. Defuzzification. In Concepts of Soft Computing: Fuzzy and ANN with Programming; Springer: Singapore, 2019; pp. 117–127. [Google Scholar] [CrossRef]
- Shang, K.; Hossen, Z. Applying Fuzzy Logic to Risk Assessment and Decision-Making; Casualty Actuarial Society; Canadian Institute of Actuaries, Society of Actuaries: Ottawa, ON, Canada, 2013. [Google Scholar]
- Ramirez, R.; Martí, V.; Darbra, R.M. Environmental risk assessment of silver nanoparticles in aquatic ecosystems using fuzzy logic. Water 2022, 14, 1885. [Google Scholar] [CrossRef]
- Petrović, D.V.; Tanasijević, M.; Milić, V.; Lilić, N.; Stojadinović, S.; Svrkota, I. Risk assessment model of mining equipment failure based on fuzzy logic. Expert Syst. Appl. 2014, 41, 8157–8164. [Google Scholar] [CrossRef]
- Gallab, M.; Bouloiz, H.; Alaoui, Y.L.; Tkiouat, M. Risk Assessment of Maintenance activities using Fuzzy Logic. Procedia Comput. Sci. 2019, 148, 226–235. [Google Scholar] [CrossRef]
- Bowles, J.B.; Peláez, C. Fuzzy logic prioritization of failures in a system failure mode, effects and criticality analysis. Reliab. Eng. Syst. Saf. 1995, 50, 203–213. [Google Scholar] [CrossRef]
- Gargama, H.; Chaturvedi, S.K. Criticality Assessment Models for Failure Mode Effects and Criticality Analysis Using Fuzzy Logic. IEEE Trans. Reliab. 2011, 60, 102–110. [Google Scholar] [CrossRef]
- Yang, Z.; Bonsall, S.; Wang, J. Fuzzy Rule-Based Bayesian Reasoning Approach for Prioritization of Failures in FMEA. IEEE Trans. Reliab. 2008, 57, 517–528. [Google Scholar] [CrossRef]
- Zalewski, P. Risk assessment of LNG carrier systems failure using fuzzy logic. Zesz. Nauk. Akad. Morskiej Szczecinie 2011, 25, 77–85. [Google Scholar]
- Guimarães, A.C.F.; Lapa, C.M.F. Fuzzy inference to risk assessment on nuclear engineering systems. Appl. Soft Comput. 2007, 7, 17–28. [Google Scholar] [CrossRef]
- Grassi, A.; Gamberini, R.; Mora, C.; Rimini, B. A fuzzy multi-attribute model for risk evaluation in workplaces. Saf. Sci. 2009, 47, 707–716. [Google Scholar] [CrossRef]
- Cheng, W.-Y.; Su, E.; Li, S.-J. A financial distress pre-warning study by fuzzy regression model of TSE-listed companies. Asian Acad. Manag. J. Account. Financ. 2006, 2, 75–93. [Google Scholar]
- Yu, L.; Wang, S.; Lai, K.K. An intelligent-agent-based fuzzy group decision making model for financial multicriteria decision support: The case of credit scoring. Eur. J. Oper. Res. 2009, 195, 942–959. [Google Scholar] [CrossRef]
- Alali, M.; Almogren, A.; Hassan, M.M.; Rassan, I.A.L.; Bhuiyan, M.Z.A. Improving risk assessment model of cyber security using fuzzy logic inference system. Comput. Secur. 2018, 74, 323–339. [Google Scholar] [CrossRef]
- Al-Ali, M. Fuzzy logic methodology for cyber security risk mitigation approach. J. Netw. Technol. 2017, 8, 83–90. [Google Scholar]
- Saulaiman, M.; Takacs, M.; Kozlovszky, M.; Csilling, A. Fuzzy Model for Common Vulnerability Scoring System. In Proceedings of the 2021 IEEE 15th International Symposium on Applied Computational Intelligence and Informatics (SACI), Timisoara, Romania, 19–21 May 2021; pp. 419–424. [Google Scholar] [CrossRef]
- Kerimkhulle, S.; Dildebayeva, Z.; Tokhmetov, A.; Amirova, A.; Tussupov, J.; Makhazhanova, U.; Adalbek, A.; Taberkhan, R.; Zakirova, A.; Salykbayeva, A. Fuzzy Logic and Its Application in the Assessment of Information Security Risk of Industrial Internet of Things. Symmetry 2023, 15, 1958. [Google Scholar] [CrossRef]
- Common Vulnerability Scoring System v3.1: Specification Document. Available online: https://www.first.org/cvss/v3.1/specification-document (accessed on 3 April 2024).
- Pedrycz, W. Why triangular membership functions? Fuzzy Sets Syst. 1994, 64, 21–30. [Google Scholar] [CrossRef]
- Design, Test, and Tune Fuzzy Inference Systems—MATLAB. Available online: https://www.mathworks.com/help/fuzzy/fuzzylogicdesigner-app.html (accessed on 6 January 2024).
- Lin, H.; Yan, Y.; Cheng, Q. Future role of artificial intelligence in advancing transportation electrification. J. Intell. Connect. Veh. 2023, 6, 183–186. [Google Scholar] [CrossRef]
Figure 1.
Threat Analysis and Risk Assessment—TARA [ISO/SAE 21434].

Figure 2.
Example of membership functions for a fan speed control task. The membership functions for the Temperature and Humidity input factors are shown in (a) and (b), respectively. (c) shows the membership functions for the output, Fan Speed.
Figure 2.
Example of membership functions for a fan speed control task. The membership functions for the Temperature and Humidity input factors are shown in (a) and (b), respectively. (c) shows the membership functions for the output, Fan Speed.

Figure 3.
Definitions of membership functions. The membership functions for the input factors Feasibility Rating and Impact Rating are shown in (a) and (b), respectively. (c) shows the membership functions for the Risk output.
Figure 3.
Definitions of membership functions. The membership functions for the input factors Feasibility Rating and Impact Rating are shown in (a) and (b), respectively. (c) shows the membership functions for the Risk output.

Figure 4.
Fuzzy logic risk assessment procedure. The full pipeline is shown in (a), whereas a detailed view of the fuzzification process is shown in (b).
Figure 4.
Fuzzy logic risk assessment procedure. The full pipeline is shown in (a), whereas a detailed view of the fuzzification process is shown in (b).

Figure 6.
Output surface for risk calculation using the traditional TARA method ((a), above) and the proposed fuzzy inference system ((b), below).
Figure 6.
Output surface for risk calculation using the traditional TARA method ((a), above) and the proposed fuzzy inference system ((b), below).

Table 1.
Exemplar risk matrix from ISO/SAE 21434, Annex H.
| Feasibility Rating | |||||
|---|---|---|---|---|---|
| Very Low | Low | Medium | High | ||
| Impact Rating | Severe | 2 | 3 | 4 | 5 |
| Major | 1 | 2 | 3 | 4 | |
| Moderate | 1 | 2 | 2 | 3 | |
| Negligible | 1 | 1 | 1 | 1 | |
Table 2.
Severity levels.
| 0 | 1 | 2 | 3 |
|---|---|---|---|
| No injuries | Light and moderate injuries | Severe and life-threatening injuries | Fatal injuries |
Table 3.
Controllability levels.
| 0 | 1 | 2 | 3 |
|---|---|---|---|
| Controllable in general | Simply controllable | Normally controllable | Difficult to control or uncontrollable |
Table 5.
Feasibility rating: example mapping of labels to input intervals. Taken from ISO/SAE 21434.
Table 5.
Feasibility rating: example mapping of labels to input intervals. Taken from ISO/SAE 21434.
| Label | Input Interval |
|---|---|
| High | 2.96–3.89 |
| Medium | 2.00–2.95 |
| Low | 1.06–1.99 |
| Very Low | 0.12–1.05 |
Table 7.
Damage scenarios—impact rating.
| ID | Damage Scenario | Severity | Controllability | Impact |
|---|---|---|---|---|
| 1 | Front collision with a narrow stationary object (e.g., a tree) caused by unintended turning off of headlamp during night driving at medium speed | 3 | 3 | 3 |
| 2 | Front collision with a narrow stationary object (e.g., a tree) caused by unintended turning off of headlamp during night driving at low speed (<30 km/h) | 2 | 2 | 2 |
| 3 | Front collision with a narrow stationary object (e.g., a tree) caused by unintended turning off of headlamp during night driving at low speed (<30 km/h) and on an icy road surface | 2 | 3 | 2.5 |
| 4 | Front collision with a pedestrian caused by unintended turning off of headlamp during night driving in dimly lit parking lot, at very low speed (<15 km/h) and on an icy road surface. | 2 | 3 | 2.5 |
| 5 | Front collision with a pedestrian caused by unintended turning off of headlamp during night driving in dimly lit parking lot, at very low speed (<15 km/h) | 2 | 1 | 1.5 |
Table 8.
Threat scenarios.
| ID | Threat Scenario |
|---|---|
| 1 | Spoofing of a signal leads to a loss of integrity of the data communication of the “LampRequest” signal to the power switch actuator ECU, potentially causing the headlamp to turn off unintentionally. |
| 2 | Tampering with a signal sent by body control ECU leads to a loss of integrity of the data communication of the “Lamp Request” signal to the power switch actuator ECU, potentially causing the headlamp to turn off unintentionally. |
Table 9.
Attack path feasibility rating calculation.
| Threat Scenario | Attack Path | Feasibility Rating | ||||
|---|---|---|---|---|---|---|
| V | C | P | U | Value | ||
| 1 | Attack Path (A):
| 0.85 | 0.77 | 0.85 | 0.85 | 3.89 |
Attack Path (B):
| 0.62 | 0.77 | 0.85 | 0.85 | 2.84 | |
Attack Path (C):
| 0.2 | 0.77 | 0.85 | 0.85 | 0.91 | |
| 2 | Attack Path (A):
| 0.85 | 0.44 | 0.85 | 0.85 | 2.22 |
Attack Path (B):
| 0.2 | 0.44 | 0.85 | 0.85 | 0.52 | |
Table 10.
Comparison between risks derived with the FIS approach and risk derived according to the method provided by ISO/SAE 21434.
Table 10.
Comparison between risks derived with the FIS approach and risk derived according to the method provided by ISO/SAE 21434.
| Threat Scenario | Damage Scenario | FIS Result | ISO/SAE 21434 Result |
|---|---|---|---|
| 1 | 1 | 5.00 | 5 |
| 2 | 4.00 | 4 | |
| 3 | 4.41 | 4 | |
| 4 | 4.41 | 4 | |
| 5 | 3.50 | 4 | |
| 2 | 1 | 3.94 | 4 |
| 2 | 2.94 | 3 | |
| 3 | 3.44 | 3 | |
| 4 | 3.44 | 3 | |
| 5 | 2.50 | 3 |
Disclaimer/Publisher’s Note: The statements, opinions and data contained in all publications are solely those of the individual author(s) and contributor(s) and not of MDPI and/or the editor(s). MDPI and/or the editor(s) disclaim responsibility for any injury to people or property resulting from any ideas, methods, instructions or products referred to in the content. |
© 2024 by the authors. Licensee MDPI, Basel, Switzerland. This article is an open access article distributed under the terms and conditions of the Creative Commons Attribution (CC BY) license (https://creativecommons.org/licenses/by/4.0/).
Share and Cite
MDPI and ACS Style
Merola, F.; Bernardeschi, C.; Lami, G. A Risk Assessment Framework Based on Fuzzy Logic for Automotive Systems. Safety 2024, 10, 41. https://doi.org/10.3390/safety10020041
AMA Style
Merola F, Bernardeschi C, Lami G. A Risk Assessment Framework Based on Fuzzy Logic for Automotive Systems. Safety. 2024; 10(2):41. https://doi.org/10.3390/safety10020041
Chicago/Turabian StyleMerola, Francesco, Cinzia Bernardeschi, and Giuseppe Lami. 2024. "A Risk Assessment Framework Based on Fuzzy Logic for Automotive Systems" Safety 10, no. 2: 41. https://doi.org/10.3390/safety10020041
Note that from the first issue of 2016, this journal uses article numbers instead of page numbers. See further details here.