Occupational Accidents Assessment by Field of Activity and Investigation Model for Prevention and Control


1
Department of Management, Faculty of Management in Production and Transportation, Politehnica University of Timisoara, via Victoria Square No. 2, 300006 Timisoara, Romania
2
Department of Industrial Engineering and Management, Faculty of Engineering, Lucian Blaga University of Sibiu, Bd. Victoriei No. 10, 550024 Sibiu, Romania
3
Academy of Romanian Scientists, Splaiul Independentei, 54, Sector 5, 010071 Bucharest, Romania
*
Authors to whom correspondence should be addressed.
Safety 2019, 5(1), 12; https://doi.org/10.3390/safety5010012
Submission received: 27 December 2018
/
Revised: 16 February 2019
/
Accepted: 18 February 2019
/
Published: 22 February 2019
(This article belongs to the Special Issue Design and Development of Safety Production Management)
Abstract
:The rate of occupational accidents is increasing, leading to a number of organizational deficiencies. For European Union (EU), the non-fatal accident number in 2017 was 3,315,101. An increase in the number of accidents is recorded in many of the member states. In addition, the increase in accidents tends to focus on certain sectors and is due more to the increase in the incidence rate than the increase in the workforce. Companies in these industry sectors have also implemented less intensive prevention practices than firms in other sectors. Performing a statistical evaluation of non-fatal and fatal accidents is an important one. This assessment helps managers understand the importance of implementing prevention and control methods across organizations. For this research, we used series of data obtained from the Romanian National Institute of Statistics (NIS), Labor Inspection in Romania, and Eurostatof the European Commission. Data series evaluations were conducted for the EU and Romania. A qualitative assessment of the industry data series had been carried out. Furthermore, T-tests and analysis of variance analysis (ANOVA) were performed to identify the relationships between the frequency index of fatal and non-fatal accidents, and the categories chosen. The values obtained for men were significantly higher than those of female workers. Based on the results of the qualitative assessment and European and national strategies, an experimental model for the prevention and control of occupational accidents is proposed. At the end of the paper, the situation of labor accidents in Romania and Bulgaria, two EU member states, is assessed in the agriculture, forestry and fishing, manufacturing, construction and transport, and storage sectors. A series of trends are presented for the period 2018–2020. The results obtained from the evaluation of the data series represent an important core of the Romanian Labor Inspectorate for the development of strategic actions.
1. Introduction
From the perspective of global sustainable development, occupational health and safety (OSH) is an essential issue. For OSH, workplace accidents in the European Union are the most important areas of action of the European Union’s (EU’s) social policy. The EU’s commitment to improving working policies began in 1951, with the signing of the treaty establishing the European Coal and Steel Community (ECSC). This treaty was subsequently extended to all places of work by signing the Treaty of Rome. In 1987, the Single European Act opened a new chapter emphasizing the importance of OSH in the workplace. In 2000, the Lisbon European Council developed the “Creating more and better jobs” strategy and set out the actions and targets to be followed [1,2]. Another step has been taken by developing the European Commission’s “Improving quality and productivity at work: Community strategy 2007–2012 on health and safety at work.” This action has set the overall target of achieving a 25% reduction in the overall incidence rate of work accidents (the number of workplace accidents per 100,000 workers) in the EU-27 by 2012. This could only be achieved through a series of national strategies addressing the most common and severe risks and the most vulnerable sectors of activity, businesses, and workers. The EU strategic framework for workplace health and safety 2014–2020 integrates a series of actions to prevent occupational hazards. There is an intense global concern over policies to reduce workplace accidents and improve working conditions. Emphasis is placed on risk prevention and mitigation of the consequences of occupational hazards so that each EU member country develops sustainably [1,2,3].
From the perspective of the terms used in OSH, the most important implications are presented next. By definition, an accident at work, in accordance with the European Statistics on Accidents at Work (ESAW) methodology, is a discrete event that occurs during organizational activity and results in physical or mental injury to the worker. Fatal accidents at work are defined as those that lead to the victim’s death within one year of the accident. Non-fatal workplace accidents or serious accidents at the workplace involve at least four complete days of absence from work. As a consequence, non-fatal accidents at work cause considerable damage to the organization’s workers and their families. Workers involved in non-fatal accidents will live with permanent disabilities, leave the labor market, or change their workplace. As a macroeconomic effect, work-related accidents can lead to the loss of a considerable number of working days in the national and European economy [1,2,3,4,5].
Starting in 2015, for EU, the fatal accident rate has started to decline due to preventive actions at the member state level [5]. Previous studies on the explanation of professional accidents showed that there were a number of them based on causes that had not been steadily intervened upon [6,7,8,9,10]. A study by Day et al. (2012) showed that stress and overloading the employee contributed to the occurrence of many accidents at work [11]. Occupational risk assessment was needed to be performed for each business to be effective [12,13,14,15,16].
Occupational accidents are a major challenge for some sectors of the economy (e.g., agriculture; industry and construction (except mining); services of the business economy; agriculture, forestry and fishing; crop and animal production; hunting and related service activities; and forestry and logging). Most workers face many risks and the number of accidents is high in developed and developing countries. In EU, the number of work-related accidents in 2017 reached 3,315,101. In 2017, in Germany the number of non-fatal accidents was 862,983 accidents, and in France there was 749,670 accidents. In terms of fatal accidents, France ranks first with 595 fatal accidents, Italy ranks second with 481 accidents, and Germany with third place with 413 accidents [1].
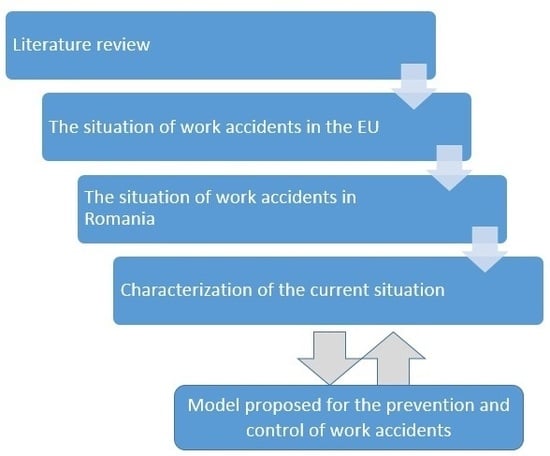
The present paper is structured in three directions—the first part presents the existing situation in EU, the second part presents the situation existing in Romania, and the third part evaluates the European and national strategies in the field of occupational safety and health. The novelty of this research consists in presenting the inventory of the risk situation in Romania compared to the EU and the proposed framework for prevention and control which takes into account the most important entities that influence the organizational policies related to occupational health and safety. We conducted an ANOVA analysis to highlight the link between the various variables considered in this research. To support this research, we evaluated a series of preventive and control models, on the basis of which we proposed one for Romania (depending on the national strategy that was in accordance with the European strategy). At the end of the paper, a series of accident trends for Romania and Bulgaria, two EU member states, are presented.
2. Materials and Methods
The present paper is based on the qualitative assessment of the statistical data for 2013–2017. An assessment of non-fatal and fatal accidents in European Union and Romania is carried out. The purpose of this assessment is to highlight Romania’s situation in relation to the European Union, and to propose strategic actions to improve the national situation. In the evaluation, statistical data series and four basic indicators were used. Statistical data refers to non-fatal and fatal accidents at work in the European Union (EU) and in Romania; the data series in the statistics used were obtained from the National Institute of Statistics of Romania (NIS), Labor Inspection from Romania, and Eurostatof the European Commission [17,18,19,20]. The data in these series were declared accidents within the enterprise. Some series may give some discontinuities because the data did not exist. The following indicators are used in the present research—rate of incidence frequency index of labor accidents, the frequency index of fatal accidents, the average duration index, and the index of severity.
The incidence rate was calculated as the number of injuries per 100,000 employees (the indicator being used in the EU situation assessment). The frequency index of non-fatal accidents is defined as the number of injuries per 1000 workers. The frequency index of fatal accidents is the number of injuries per 1000 workers.
The average durability index highlights the number of days lost, on average, by an injured person in the workplace. The severity index is defined as the total number of days of work incapacity per 1000 employees. T-test and ANOVA analysis were used to verify the statistical results. Following the evaluation, a strategic model for improving the current situation is proposed based on the national and European strategy. The EU Strategic Framework on Health and Safety at Work 2014–2020 and the National Occupational Safety and Health Strategy for the 2017–2020 are used for the model proposed for the prevention and control of work accidents. In order to highlight the situation of Romania compared to the situation existing in the EU, a comparative assessment is presented on the Romanian and Bulgarian activity domains. Based on the presented assessment, a series of accident trends are presented for the period 2018–2020.
3. The Situation of Work Accidents in the EU
This section presents the situation at EU level, assessing non-fatal and fatal accidents.
Figure 1 presents the situation of work accidents for the period 2013–2017. From the perspective of work accidents, it can be noticed that in 2013, the number of non-fatal accidents was 3,127,546, the lowest level of accidents registered in 2013–2017. In 2015, there were approximately 3.21 million non-fatal accidents that led to at least four calendar days of absence from work. Since 2016, labor accidents had started to increase, reaching 3,315,101 in 2017.
Evaluating the distribution of non-fatal accidents in EU member countries, Table 1 presents the accident situation for 2013 and 2017. Also, the dynamics of the variation (DV) is presented. The highest level of non-fatal accidents is recorded in Germany, followed by France, Spain and Italy. By realizing the dynamics of accidents, in percentages, by comparing the year 2017 to 2016, it can be noticed that Hungary recorded the highest dynamics of the variation of +45.16%. France has recorded an increase in accidents in 2017 compared to 2013, with a variation dynamics of +32.12. Greece has the highest fall in accidents in 2017 compared to 2013, with a value of −58.79% for DV. There are no datasets for Iceland [7,8,9,10,11,12,13]. The number of non-fatal accidents has increased as a result of the development of some areas of activity, consumption intensity, infrastructure development, and other arguments [21,22,23,24,25,26,27,28]. Consumers’ needs are becoming ever more intense and diverse, so that business sectors develop in line with consumer demands [25]. Fields of activity develop and increase their activity capacity so that the number of accidents can increase [27].
From the perspective of the fatal accidents that occurred in the European Union during the period 2013–2017, Figure 2, it can be noticed that in 2013, the number of accidents was 3674, a fairly high level. Until 2015, the number of fatal accidents was on the rise, and from 2016 the number of fatal accidents had started falling. In 2015, the number of fatal accidents was 3876, or about 828 non-fatal accidents for each fatal accident. There was a slight decrease in the total number of non-material workplace injuries in the EU-28 between 2014 and 2015, with about 9118 fewer (equivalent to a 0.3% reduction). In contrast, there were 102 fatal accidents in the EU-28 in 2015 compared to 2014 (equivalent to a 2.7% increase).
In terms of the distribution of fatal accidents for EU countries, Figure 3, it can be noticed that France, Italy and Germany are the countries with the most fatal accidents. In France, the number of fatal accidents in all sectors of activity was 595 and in Italy 481 in the year 2017. The lowest variation was in Cyprus, where the number of fatal accidents in 2017 reached 5 compared to 2013 when 9 accidents occurred [9]. The highest increase in fatal accidents was recorded in Luxembourg, where 22 accidents occurred in 2017 compared to 6 accidents in 2013.
From the perspective of the fields of activity where these non-fatal accidents had occurred, the main sectors of activity considered for evaluation were agriculture; industry and construction (except mining); services of the business economy; agriculture, forestry, and fishing; crop and animal production; hunting and related service activities; and forestry and logging. It can be seen, Figure 4, that agriculture, industry and construction (except mining), and services of the business economy record the most work accidents. The level reached during the analysis period was over 2.4 million accidents. The lowest number of work accidents was recorded in forestry and logging [7,8,9,10,11,12,13,14].
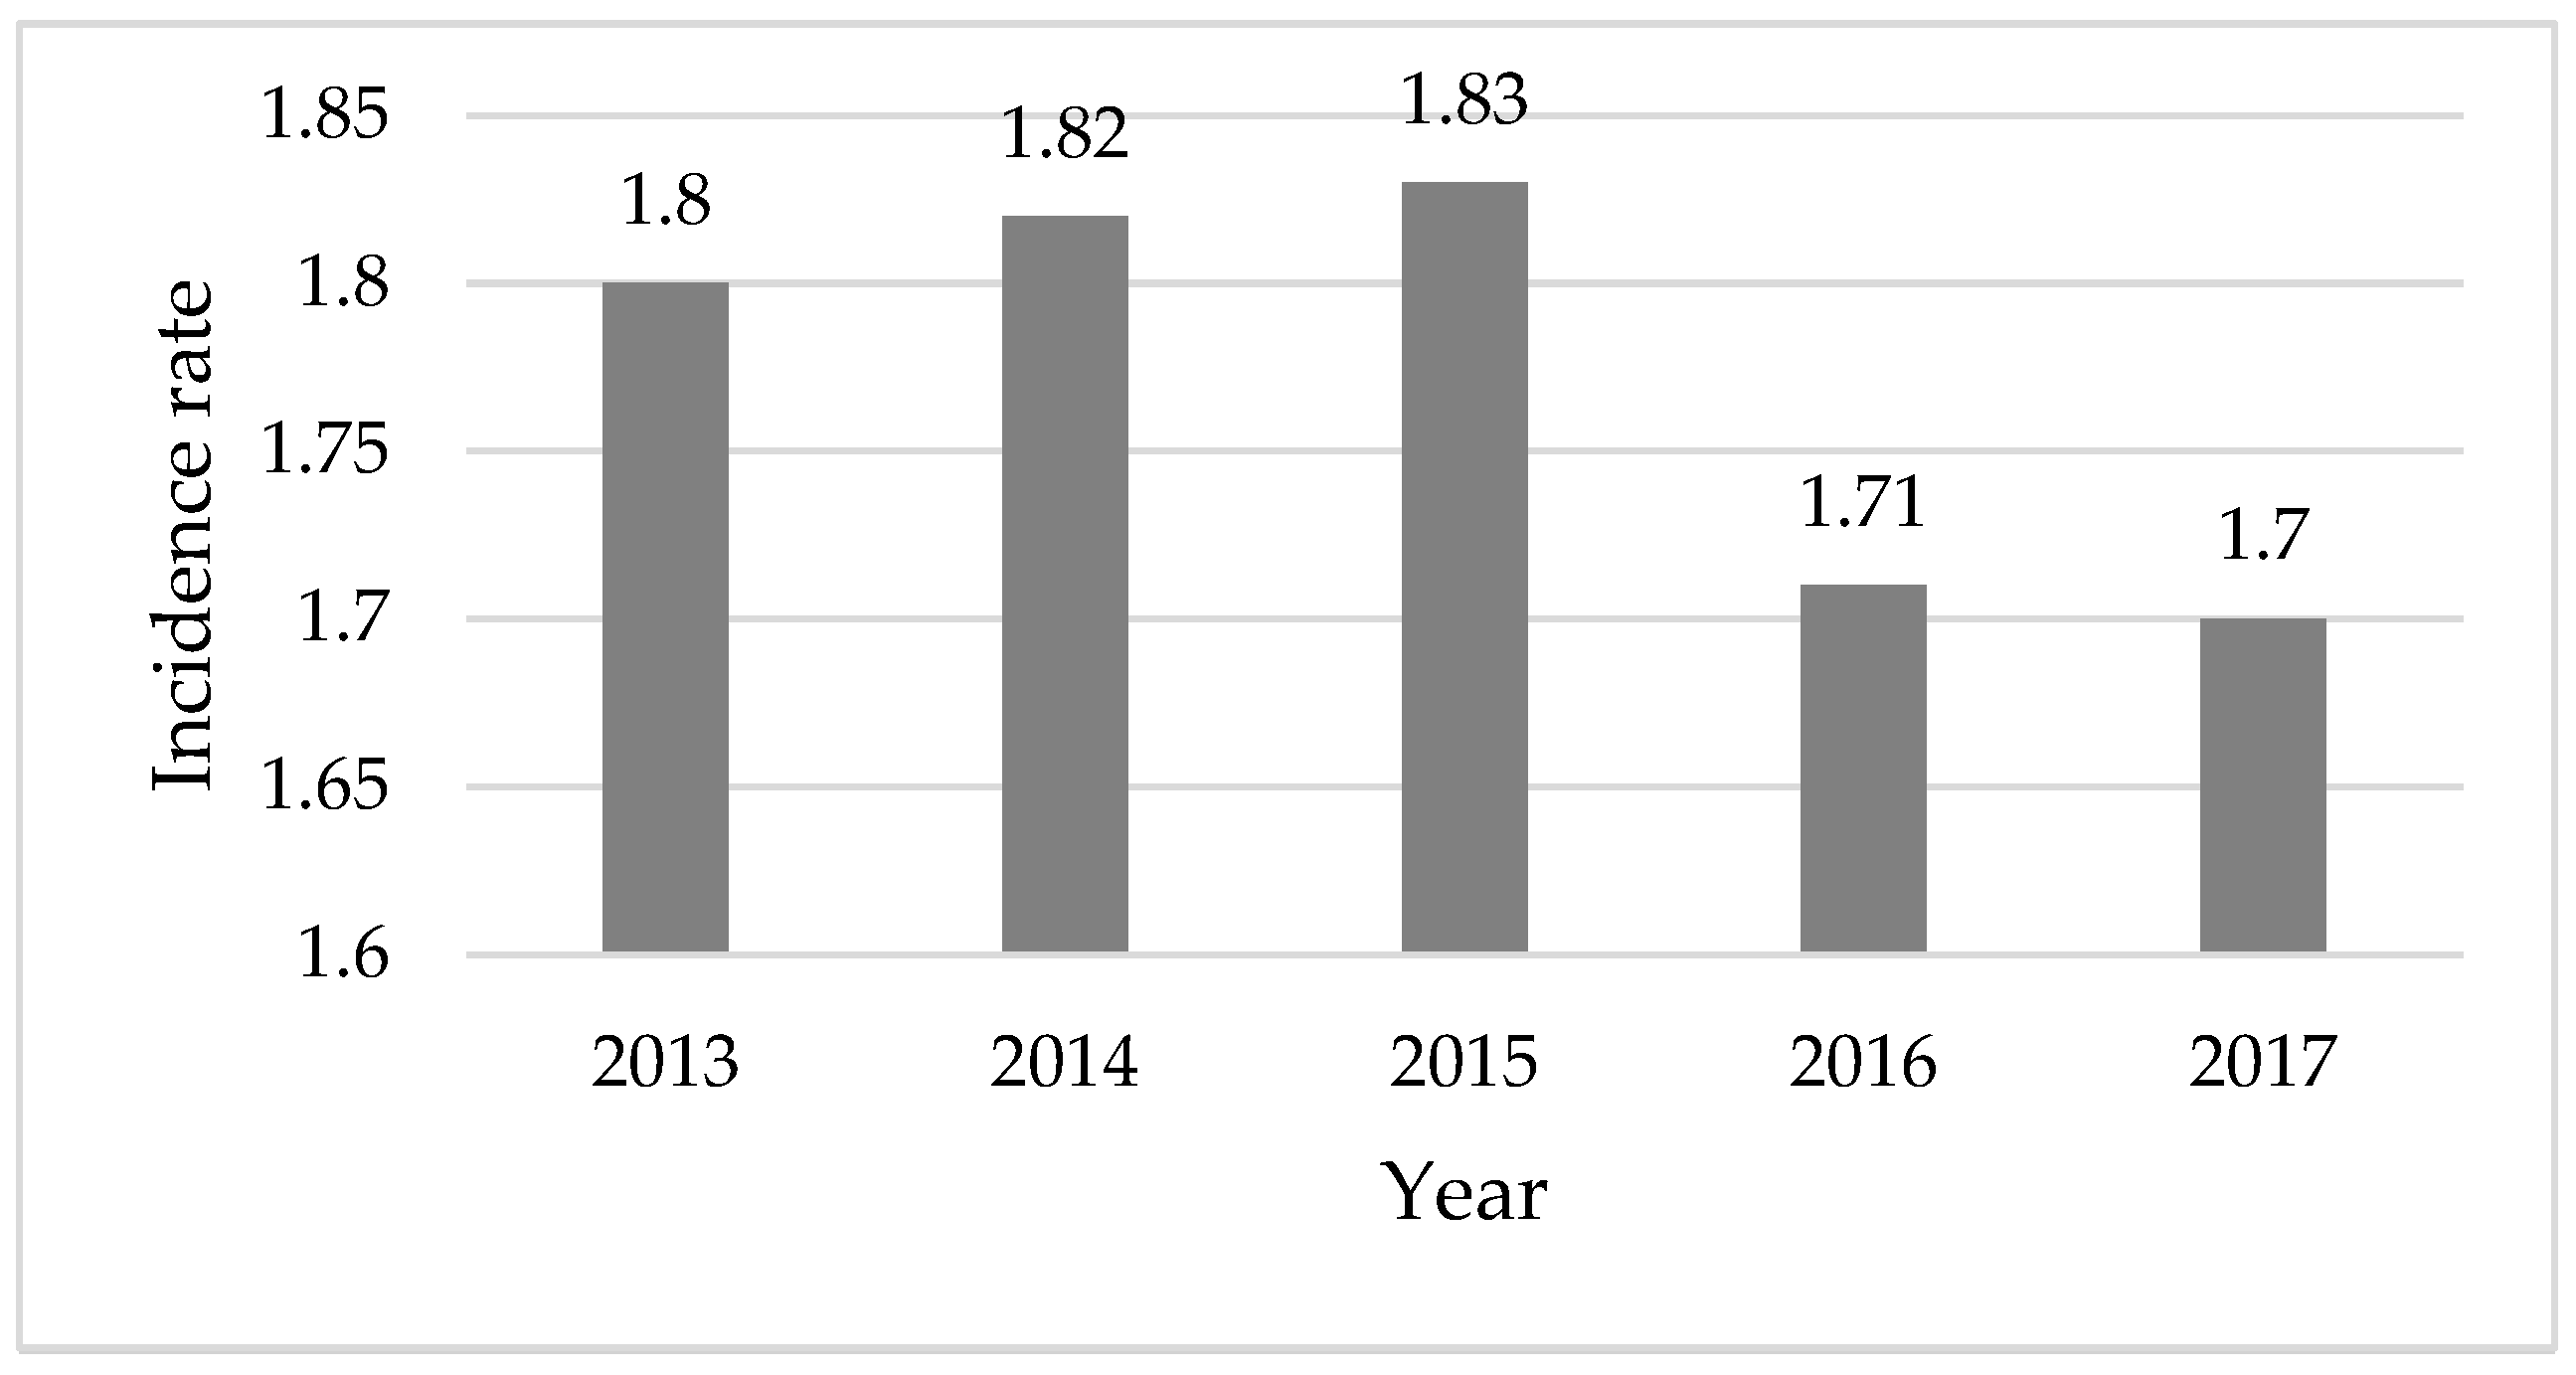
In the EU-28, an incidence rate of 1533.39 was recorded in 2013, and in the year 2015 there was an average of 1513 non-legitimate accidents per 100,000 people (see Figure 5). The incidence rate among EU member states was less than 100 accidents per 100,000 people employed in Bulgaria and Romania and over 2750 per 100,000 people employed in Spain, Portugal, and France. The highest rate was recorded in France, reaching a level of 3160 non-fatal accidents per 100,000 people employed. The incidence rate for non-fatal accidents increased in 2016 and 2017 because, among others, agriculture, industry and construction (except mining), and services of the business economy domain presented an increase of over 30,000 non-fatal accidents in 2016 compared to 2015 (see Figure 4).
According to the European Commission, the explanation for non-fatal accident rates would be that current reporting systems do not support victims in reporting accidents [1,2]. This is why many times these accidents remain undeclared and are not found in national and international statistics. It can be seen that the incidence rate is between 1.7 and 1.83. The lowest level was recorded in 2017, or 1.71 deaths per 100,000 employees, Figure 6.
Assessing the overall situation of OSH, it can be seen that the number of accidents at work varied greatly depending on the economic activity in question. Men-dominated activities generated more work-related accidents because they were more risk-intensive sectors (construction, machine-building, and others) [1]. In the EU-28, the construction, production, transport and storage sectors and agriculture, forestry, and fishing accounted for only two-thirds (67.8%) of the total fatal accidents at work and less than half (44.9%) of total fatal accidents at work, respectively, in 2015. More than one in six (16.0%) fatal accidents at work in the EU-28 in 2017 occurred in the construction sector, and the manufacturing sector had a share of 15.0% followed closely by transport and storage (15.5%). Agriculture, forestry, and fishing (13.2%) were also registered as an important share [1,2]. Outside the transport and storage domains, all other service activities recorded relatively lower rates of total fatal accidents. However, non-fatal accidents have always been present in wholesale and retail trade (13.6% of total EU-28 in 2017), human health and social work activities (10.5%), and public administration and defense (5.63%) [1].
In European Union, the situation of work accidents can be summarized by a series of statements:
- Starting in 2013, approximately 3500 workers annually lose their lives in work accidents.
- More than 3,000,000 work accidents occur annually in the EU, involving an absence of more than three days from work.
- More than 24% of employees believe their health is threatened as a result of the work done.
- Of the existing employees in the EU, over 25% say their work has a negative effect on health.
- As a result of the accident rate, the costs of medical leave are disproportionately high. In Germany, medical leave is totaling 460 million days annually.
- Social insurance leads to high costs that is the social insurance that can be attributed to illness or accidents. In some EU member states, costs are rising.
To improve the situation of accidents at work in the EU, emphasis is placed on improving and revitalizing the member states’ results of implementing health and safety policies; enhancing the capacity of micro and small enterprises to implement effective and efficient risk prevention measures; increasing prevention of occupational diseases by combating existing and new emerging risks; and assessing changes in country demographics [1,2,3].
4. The Situation of Work Accidents in Romania
The number of employees in Romania in 2017 according to the national statistics is shown in Figure 7. In 2013, there were 5,076,512 employees with 24% less than the level reached in 2017. Since 2014, the number of employees has been increasing. Hence, the idea of increased number of accidents can be supported [2].
Assessing the situation of the EU member states, it can be noticed that the dynamics of Romania’s variation for the year 2017, compared to 2013, from the perspective of non-fatal accidents was + 21.29%, and the dynamics of the variation for fatal accidents was −12.27%. It can be said that the situation is acceptable, considering the global situation for EU and national economy.
From the perspective of the number of non-fatal accidents at work, Figure 8, it can be seen that at the national level, the lowest number was registered in 2013, i.e., 3627 accidents. Starting with 2015, the number of non-fatal accidents is on the rise, with an increase of 11.70% in 2017 compared to 2015.
The non-fatal accident frequency index, Figure 9, had the lowest level in 2013, with 0.76 non-fatal accidents per 1000 employees in Romania. The value of this index was rising, reaching the highest level in 2017, i.e., 0.93‰. The percentage increase registered in 2017 was 22.30% compared to 2013.
Fatal accidents have a downward trend, Figure 10, with the highest level being recorded in 2013 when 199 fatal accidents occurred. The lowest level was recorded in 2016, with 163 fatal accidents. This situation of fatal accidents, as also stated for EU, highlights the situation of accidents declared by employers.
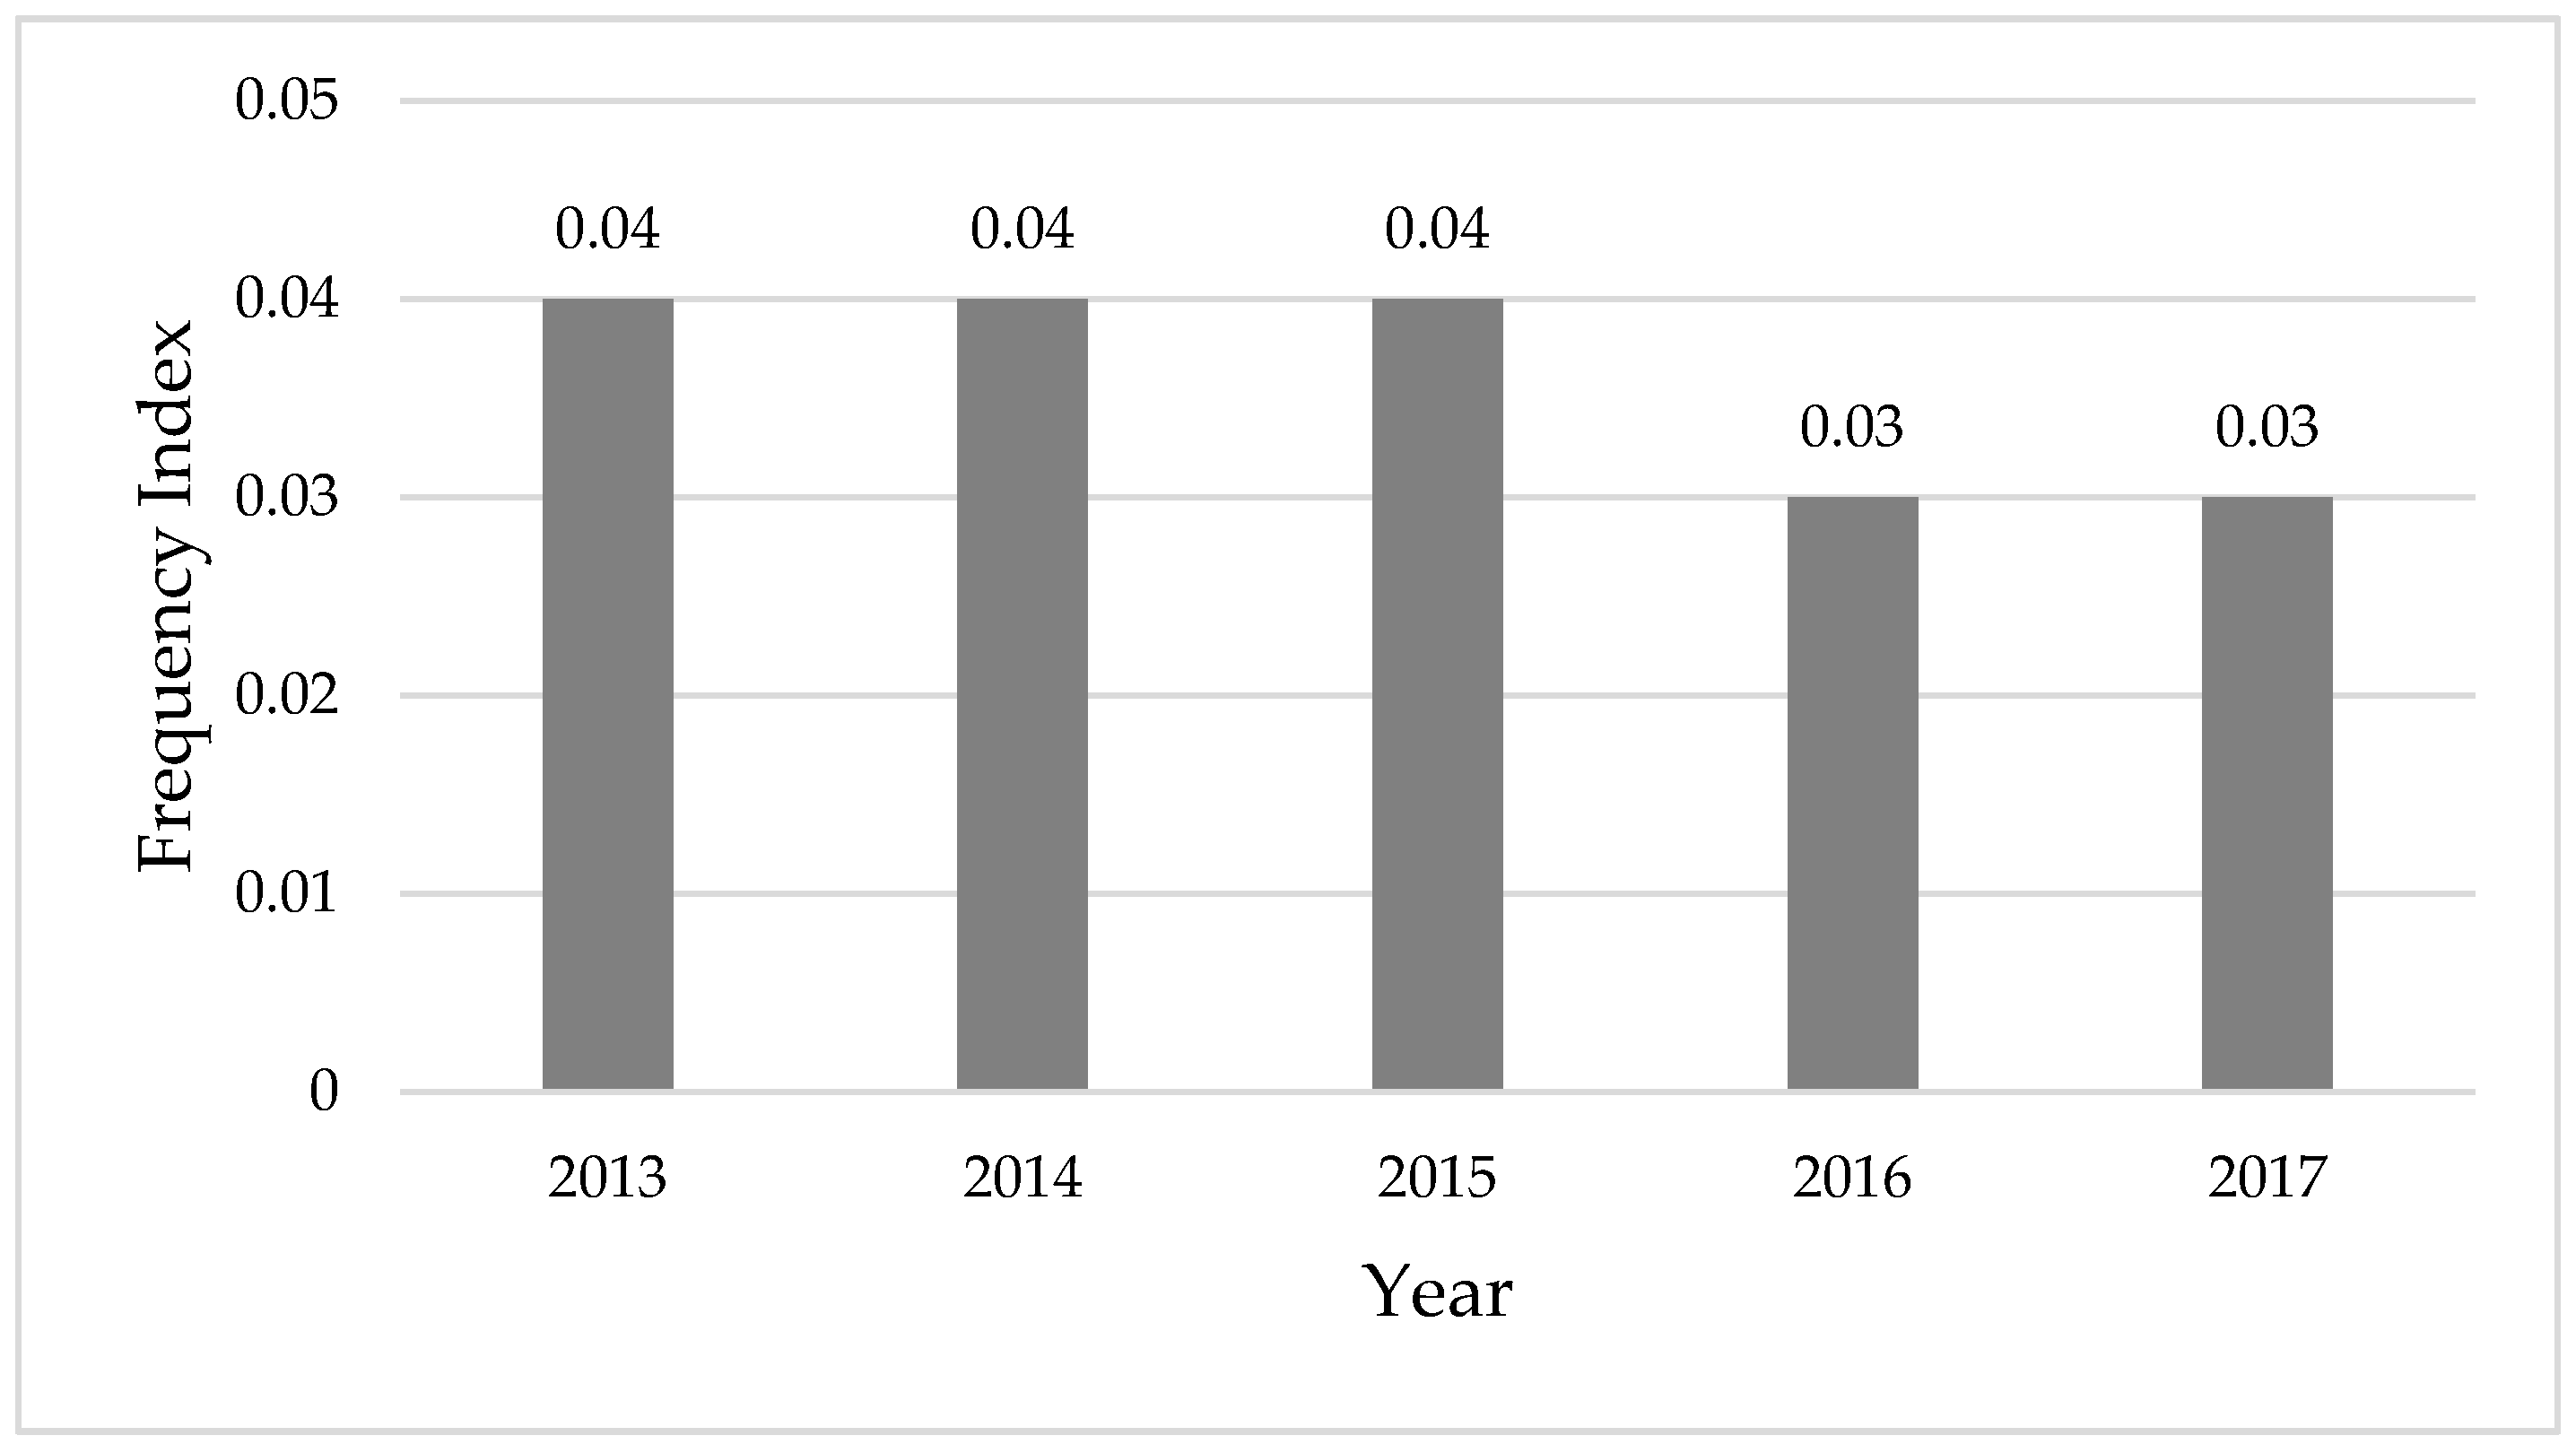
The fatal accidents frequency index, Figure 11, has a value of about 0.04 per 1000 employees in Romania. This level is maintained, approximately, throughout the analysis period. Starting with 2016, the frequency index value reached 0.03 per 1000 employees.
To identify the sectors of activity that generate the most fatal and non-fatal work accidents, the following were considered—building construction, retail, except motor vehicles and motorcycles; land transport and pipeline transport; manufacture of motor vehicles, trailers and semi-trailers; woodworking and manufacture of wood and cork products, except furniture; food industry; wholesale trade, excluding trade in motor vehicles and motorcycles; and the metal and metal products industry, excluding machinery, equipment, and installations. The situation of work accidents by sectors of activity is presented in Figure 12. The field of activity of retail trade, except for motor vehicles and motorcycles, recorded the most accidents during the entire period of analysis. This field is followed by land and pipeline transport and building construction. The highest number of accidents in 2013 was achieved in the building sector, and the lowest in the metal and metal products industry, excluding machinery, equipment, and installations. At the level of 2017, most non-fatal accidents occurred in the retail trade, except for motor vehicles and motorcycles, and the lowest in the metal and metal products industry, excluding machinery, equipment, and installations. In 2017, the number of non-fatal accidents decreased particularly in the fields of building construction; woodworking and manufacture of wood and cork products, except furniture; and retail except motor vehicles and motorcycles. Information campaigns on health and safety at work, as well as checks at companies to combat illegal work (undeclared work), were intensified in 2017. The causes of work accidents were the non-observance of the labor protection instructions, inappropriate maneuvers with ignoring the risk situation and lack of use of protective equipment [3].
From the perspective of fatal accidents, Figure 13, the building sector had the highest number of work accidents. Death rates for this industry fell between 18 and 20 fatal accidents per year per 1000 employees. For 2013, most fatal accidents were registered in the field of building activity, and the lowest in the food industry. In 2017, most accidents were recorded in the building sector and the lowest level was recorded in the wood processing and food industry. The number of fatal work accidents began to decline in most areas in 2017 due to the intensification of information campaigns on health and safety at work, as well as checks on societies to combat black work [3].
In order to identify the age groups involved in the work accidents, an evaluation is made of the following groups: <17; >60 years; 17–20 years; 20–30 years; 30–40 years; 40–50 years; and 50–60 years, Figure 14. Most accidents were recorded in the 40–50 age group, followed by the 50–60 age group. By applying prevention methods and actions at national level, the age group of 30–40 years and 20–30 years experienced a decrease in the number of accidents in the period 2016–2017 compared to the period 2013–2015. The lowest level of accidents was recorded in the age group of 17–20 years.
By assessing fatal accidents by age group, it can be noticed that the same situation of non-fatal accidents was also found in fatal accidents, Figure 15. Most accidents were recorded in the 40–50 age group, followed by the 50–60 age group. The lowest level of accidents was recorded in the age group of 17–20 years. Age groups 30–40 and 20–30 showed fewer fatalities than non-fatal.
The above-mentioned accident situation involved a number of injury costs falling into the following categories [7,8,9,10,11]:
- Productivity costs: costs related to falling production or productivity that may affect organizational competitiveness;
- Healthcare costs: direct medical costs and indirect medical costs;
- Loss of the employee’s quality of life: the financial assessment of the decrease in the quality of life, such as due to pain and suffering;
- Administration costs: administration costs related to the application for certain facilities or for the reporting of an accident at the workplace;
- Insurance costs: compensation payments and insurance premiums.
These cost categories can be assessed on the basis of stakeholders—employees and family, employers, national government, and society. Indicators that highlighted organizational costs for fatal or non-fatal accidents include the severity index and the average duration index. The severity index, Figure 16a, recorded the most days of work incapacity, reported per 1000 employees, in 2015, i.e., 48 ‰. Starting with 2015, the number of days of incapacity began to decrease. From the perspective of the average duration index, the number of days lost on average by an injured person can be seen in Figure 16b, and that the duration was decreasing from 2013 onward. The lowest level was registered in 2017, e.g., 56 per 1000 employees.
5. Trends of Work Accidents in Romania and Bulgaria
Assessing the situation of the EU member states (Table 1 and Figure 3), we selected an EU member country to make a series of comparisons regarding work accidents. This section also includes a series of predictions of accidents situations for the 2018–2020 period. In order to achieve this assessment between the two EU member states, Romania and Bulgaria, we have selected four fields of activity: agriculture, forestry, and fishing; manufacturing industry; construction; and transport and storage. These areas of activity have been selected because for the EU (Figure 4), agriculture and construction [4,5,6,7] were among the domains with the most accidents; for these domains, Romania registered the most accidents for the 2013–2017 period, and they were also among the areas with the most accidents in Bulgaria [22,23,24,25,26,27]. The cases of accidents for the period 2013–2017 are presented taking into account the employee’s gender and age.
Assessing the current situation for the EU, the situation of Romania is compared with that of Bulgaria. Both Romania and Bulgaria are EU member states. Bulgaria has 7,054,034 inhabitants, 73.5% is the employability rate, 5% unemployment rate, 100.4% industrial production rate, 3.1% GDP growth, 99.3% total producer price index, and 98.8% construction production index [21,23,25]. In 2018, Romania had 19.5 million inhabitants, with 4.2% GDP growth, 3.3% unemployment rate, 83% employment rate, increasing industrial production rate, and 99.6% construction production index [23,24].
The situation of work-related accidents for Romania (Figure 17a) and Bulgaria (Figure 17b) highlights the fact that the manufacturing industry is registering the most work accidents. The number of accidents in the manufacturing industry in 2017 increased by 23% compared to 2013. Since 2013, the number of accidents has increased in this area as a result of the development of the Romanian industry (a number of multinational companies have entered the Romanian market) [4,12]. The number of accidents for agriculture, forestry, and fishing did not increase significantly due to the fact that this sector was not very developed in Romania, and there was not much business support in this field [4,16]. The construction sector had grown in large cities in Romania as a result of the residential sector demand. The increase in the number of accidents in 2017 is about 20% compared to 2013. Legislative measures need to be improved in this area [4]. The number of accidents in the field transport and storage grew by about 20% in 2017 compared to 2013 due to the increase in activity in the industry, and also due to a lack of highways and adequate infrastructure. At the end of 2018, Romania had approximately 806 km of highway [28].
Assessing the situation in Bulgaria, Figure 17b, it can be observed that the manufacturing sector is the one that records the most accidents due to the industrialization of some areas in the country [24]. The number of accidents in 2013 was 641, 5% higher than in 2017. The number of accidents decreased as a result of the national legislation being updated [23]. The agricultural sector had the least number of accidents because this sector was not very developed. The construction sector showed a decrease in the number of accidents, reaching 187 in 2017. The transport and storage sector maintained the number of accidents at 290–300 for the analyzed period.
From the perspective of the gender of the employees injured in these sectors, the male gender predominated in Romania, Table 2. In the manufacturing industry, there was a 30% share of women, and in the rest of the domains, the number of accidents was mainly registered for the male gender.
Assessing the situation of Bulgaria, Table 3, one can notice the same trend as in Romania, Table 2. The manufacturing industry sector recorded the most accidents, and one-third of them was registered for women. The next sector in which women were injured was the transport and storage sector, as in the case of Romania.
From the perspective of the age category, for evaluation there were considered—less than 25 years, from 25 to 54 years, and 55 years or over, Table 4. These categories were considered because the series of data provided in the European Commission database were thus defined. The category “25 to 54 years” has the most accidents, being followed by the “55 years or over” category. According to [17,18,19,20,21,22,23], most injured workers and workers fell in the category from 25 to 54 years. This fact was also confirmed in Romania [28].
The injured workers’ age perspective in Bulgaria, Table 5, shows that the situation is the same as in Romania. The category “25 to 54 years” has the most accidents, being followed by the “55 years or over” category.
6. Summary of Findings
The following can be systematized from the evaluations:
(A) For EU:
- From the perspective of non-fatal work accidents, starting with 2016, their number has begun to increase as a result of overcoming economic instability and improving business activities.
- The largest number of accidents is registered in Germany, France, Spain, and Italy due to the economic level of each country and the level of industrialization.
- The fatal accident situation has been decreasing since 2015.
- Industry development will lead to increased labor accidents, so prevention and control methods need to be supported at country level.
- Developed countries, as a result of intense industrial activity, have a high rate of non-fatal accidents.
- The industry sector has the most work accidents.
- The rising rate of non-fatal accidents leads to an increase in incidence rate.
(B) For Romania:
A T-test and ANOVA analysis were conducted to compare the significant association with each category for frequency index of non-fatal accidents and frequency index of fatal accidents. The following were considered:
- Data were classified into two categories—non-fatal accidents and fatal accidents.
- The selected variables for this study were (1) sex and (2) age.
- Two indicators were calculated—the labor accident rate index (accidents per 1000 employees) and the frequency accident rate index for fatal accidents.
- Significant differences between sex groups were statistically compared using T-tests. The other groups were compared using ANOVA tests and were further compared between individual categories. p values below 0.05 were considered statistically significant.
- Two hypotheses were formulated (hypothesis (H0)—non-fatal work-related accidents did not present differences between age groups, and (H1)—at least two age categories showed differences for non-fatal work-related accidents).
The results are shown in Table 6 and Table 7. There was a significant difference in the frequency index of non-fatal on gender at p < 0.001 level. The value of male workers (mean = 0.748, SD = 0.076) was much higher than female workers’ (mean = 0.338, SD = 0.038). Age categories 30–40 (mean = 0.836, SD = 0.091), 40–50 (mean = 1.162, SD = 0.208), and 50–60 (mean = 1.062, SD = 0.138) showed higher levels of workplace accidents. As a result of the value of p, the null hypothesis was invalidated, and the hypothesis according to which there were differences in the number of accidents by age classes was confirmed.
Following the same steps, the two hypotheses are considered—(H0), fatal accidents do not show differences between age groups and (H1), at least two age categories show differences for fatal work accidents. By comparing the results obtained, it was observed that working women (mean = 2.738, SD = 1.014) recorded one-third of men’s fatal injuries (mean = 8.548, SD = 2.023). It was noticed that for the 40–50 category (mean = 2.408, SD = 1.454), the most fatalities were recorded, followed by the 50–60 category (mean = 1.748, SD = 0.890). As a result of the value of p, the null hypothesis was invalidated, and the hypothesis according to which there were differences in the number of accidents by age classes was confirmed.
- As a result of the statistical analysis, it could be noticed that for Romania, the 40–50 and 50–60 age groups were the most vulnerable to work accidents. A cause [2,3] of these accidents would be shortcomings in the organization of work activities. They accounted for about 30% of work accidents. Other causes were work-related stress (28%) and prolonged work or excessive workload (20%) [3].
- The transport sector recorded a high level of accidents at work due to the fact that the infrastructure in Romania was not very good. (The length of the road network in Romania is 198,589 km, out of which 806 km constitute highways and 15,934 km national roads.)
- The number of work accidents was increasing during the 2013–2017 analysis period as a result of the increase in the number of employees and the development of the business environment. In 2017, there was an increase of approximately 24% in the number of employees compared to 2013.
- Since 2016, work accidents have started to increase, reaching 3,315,101 in 2017.
- The number of employees was increasing in the period 2013–2017, the number of non-fatal accidents was decreasing in the period 2014–2017, and the frequency index for 2014–2017 was decreasing (except for 2015). This highlights the fact that the actions taken to reduce accidents did not show the expected efficiency.
- The number of employees was increasing during the period 2013–2017, the number of fatal accidents decreased in the period 2014–2017, and the frequency indexes for the period 2014–2017 was decreasing (the exception being 2015). This underlines that actions taken to reduce fatal accidents have had a positive impact or fatal accidents have not been declared by businesses.
- In some areas of activity, e.g., retail, except for motor vehicles and motorcycles, the accident rate was increased requiring prevention and control actions.
- Land transport reported a considerable (28%) fatal accident rate in 2013–2017.
(C) For Romania and Bulgaria:
- For the domains assessed, the regression analysis led us to the following trends in Romania and Bulgaria. The closer the R2 value to 1, the better the fit.
- For the agricultural, forestry, and fishing sector, for Romania, R-squared of 0.9355 means that 94% of the variance in the data is explained by the line and 6% of the variance is due to unexplained effects. If the level of development of this sector is maintained and the competent institutions do not develop new procedures, the trend of accidents at work is rising, reaching 184 accidents in 2020 (Table 8).
- For the manufacturing industry, R-squared of 0.9392 means that 94% of the variance in the data is explained by the line and 6% of the variance is due to unexplained effects. The number of accidents for the forecast period 2018–2020 is on the rise, reaching 1857 accidents in 2020.
- For the construction sector, R-squared of 0.9588 means that 96% of the variance in the data is explained by the line, and 4% of the variance is due to unexplained effects. The number of accidents will increase, reaching 594 in 2020.
- For the transport and storage sector, R-squared of 0.972 means that 97% of the variance in the data is explained by the line and 3% of the variance is due to unexplained effects. Accidents in this area of activity will be increased, as the situation in the country is not improving with regards to infrastructure and legislative procedures. In 2020, there will be 472 accidents.
- For the manufacturing industry, R-squared of 0.8591 means that 86% of the variance in the data is explained by the line and 14% of the variance is due to unexplained effects. The number of accidents for the projection period 2018–2020 is decreasing, reaching 575 accidents in 2020.
- For the construction sector, R-squared of 0.8591 means that 86% of the variance in the data is explained by the line and 14% of the variance is due to unexplained effects. The number of accidents will drop, reaching 149 in 2020.
- For the transport and storage sector, R-squared of 0.0511 means that 5% of the variance in the data is explained by the line and 95% of the variance is due to unexplained effects. Accidents in this area of activity will amount to 300 in 2020.
- Assessing Romania and Bulgaria, it can be noticed that in Romania the number of accidents is increasing, while in Bulgaria, except for transport and storage, the number of accidents is decreasing.
7. Discussion and Model Proposed for the Prevention and Control of Work Accidents
Taking into account the EU actions to reduce the number of accidents, the EU Strategic Framework on Health and Safety at Work 2014–2020 and the National Occupational Safety and Health Strategy for the 2017–2020 periods are further assessed. Analyzing the steps implemented at EU level and Romania’s capacity to adapt to the improvement of the fatal and non-fatal accident rate, this section proposes a model for the prevention and control of work accidents in Romania [1,2,3,4,5,6,7].
The EU Strategic Framework on Health and Safety at Work 2014–2020 provides for the following actions [1,2,3,4,5,6,7,8]:
- In-depth consolidation of national strategies by reviewing EU member countries’ strategies, creating a database that supersedes all the actions being implemented and conducting periodic meetings for debating the results.
- Facilitate compliance with OHS legislation at the level of all enterprises by offering ethnic support for implementing programs for risk assessment, developing good practice examples as the basis for different industries, promoting exchanges of best practices and actions that had results and continuing awareness campaigns.
- Implementation of OSH legislation at EU level by defining effective actions to reduce accidents and assess the effectiveness of sanctions and administrative fines.
- Simplify legislation by supporting member countries to identify regulatory complications created by their own transposing legislation.
- Treating the population aging phenomenon, managing new emerging risks, and preventing occupational illnesses
- Improving the collection of statistical data.
At national level, the strategic directions from EU are being pursued, with a series of activities being proposed, as follows [1,15,27]:
- Legislative changes for a series of laws concerning the field of health and safety at work (Law 319/2006 on Occupational Safety and Health and Methodological Norms on Law Enforcement, no. 346/2002 on insurance against accidents at work and occupational diseases).
- Reviewing the legislative framework on occupational health services to simplify the procedure for reporting and declaring occupational diseases and updating the database of occupational diseases.
- Monitoring micro-enterprises and small businesses.
- Supporting employers to carry out prevention work.
- Increasing quality in different sectors of activity.
In order to develop a strategic model for the prevention and control of work accidents, a number of existing models in specialized literature have been evaluated [17,18,19,20,21]. The first model underlining that the group of young people in Canada aged 15–24 was at a higher risk of traumatic occupational injury and a PICO framework (population, intervention, comparison, and outcome) had been developed. It was emphasized that specific indicators must be proposed to reduce the number of accidents, and the existing measures were not sufficient. Thus, it was underlined that legislative changes must be major, at the country level [17]. In the research by Mehmood et al., the situation in Qatar, a high-income country, was presented and evaluated. In Qatar also, there were a number of challenges in ensuring the health and safety of the population. This research proposed a concerted action framework through multi-sectoral involvement. This proposal underlined the importance of including the principles of damage control in the Qatar context. In the study presented by Kim et al., in 2016, emphasis was placed on developing a prevention and control model based on how to change safety cultures both in theory and practice at the workplace, and underlined the role of preventive culture at national level. Using empirical experience and analysis of previous models, it can be emphasized that legislation needs to be improved to prevent injuries at work. Improving legislation mainly refers to the proposal of measurable indicators that each sector of activity or company has to meet. The stages of the development of this model are—(1) the evaluation of the statistical data and of the existing legislation at EU and Romanian level; (2) focus group with experts from the Romanian Territorial Labor Institute; (3) systematization of the preventive and control framework; (4) theoretical pretesting of this model in 10 companies from the manufacture of motor vehicles, trailers, and semi-trailers (this model has been sent and OSH experts have amended and modified the model according to their own experience); and (5) finalizing the proposed model based on the empirical experience of the authors. By evaluating the strategies and the evaluated statistical data presented above, at EU and national level, the authors proposed a model for the prevention and control of work accidents (see Figure 18), especially for manufacture of motor vehicles, trailers, and semi-trailers. The basis for this model is EU legislation and national legislation. For these laws to be applicable at the enterprise level, organizational culture needs to be addressed and strengthened. The proposed model is based on four entities that complement and influence eachother:
- National legislation—the proposed framework takes into account all national legislation, being the basis of the present proposal. This entity is influenced by research and development (R & D) that can develop new methods for risk assessment. In turn, it influences R & D by developing new challenges to be addressed.
- Stakeholders—they are among the most important parts of a company. They influence and are influenced by organizational culture, directly contributing to the development of new organizational strategies. Organizational culture includes the ethics and norms appropriate to a company and interacts, in particular, with shareholders and stakeholders within the organization. Organizational culture based on training and real occupational risk assessments contributes to reducing hazards and risk causes.
- Personal motivation—according to the personal factor, the level of education of the employees, the model takes into account the typology of the employees of the field of activity. The level of education and training area contribute to the development of a competitive framework. This entity directly influences the preventative and control framework (indirectly by training level of the employees). The important factor to be taken into account is personal motivation, i.e., involvement of the employee in preventing accidents at work. As motivational factors, the human personality, cooperation, and ability to meet the requirements are part of the mandatory dimensions of personal motivation at work.
- Research and development—this is the entity that influences and is influenced by national legislation and contributes to the development of new methods for risk management and prevention. It also influences the Shareholders of the organization.
At the same time, national legislation is based on EU legislative requirements. Actions help prevent and control accidents. Prevention and control influence EU legislation.
8. Conclusions
As a result of the evaluation, we can see that the intensification of the activity of the industries will lead to an increase of the number of occupational accidents. In line with the existing [1,2,3,4,5,6,7] projections, industry will grow, the number of employees will increase or the level of automation will increase; thus, prevention actions are those that need to be implemented at the organizational level. Prevention actions involve avoiding risks, assessing those risks that cannot be avoided, tackling the risks at source, implementing innovation, prioritizing improvement actions, replacing hazardous substances with some less dangerous ones, and implementing global policies that integrate organizational values.
Involvement of organizational culture and individual motivation can help reduce the impact of occupational accidents. The existence of an investigative model helps managers to understand the steps that contribute to reducing accident rates. The next step consists in detailing the investigative model and its application in practice. As a result of the application, the necessary changes and correlations will be made, and then a complex model for the prevention and control of workplace accidents will be proposed.
For the consistency of the presentation, some data series have been uniformized because the same indicator has different values in different data bases. Priority was given to the European Commission data.
The limitations of the work refer to the series of data that are incomplete for some countries or years. At the same time, some data series show differences, for the same period or country, depending on the source of the collection. Another limitation refers to the fact that many accidents are not reported (fact found in the national reports).
Author Contributions
All authors contributed equally to the research presented in this paper and to the preparation of the final manuscript.
Funding
This work was supported in part by research grant GNaC2018-ARUT, no. 1359/01.02.2019, financed by Politehnica University of Timisoara.
Acknowledgments
The authors want to acknowledge the support of Politehnica University of Timisoara, Faculty of Management in Production and Transportation, Management Department, Lucian Blaga University of Sibiu, Faculty of Engineering, and Department of Industrial Engineering and Management for administrative and technical support and for the use of the infrastructure.
Conflicts of Interest
The authors declare no conflict of interest.
References
- European Statistics on Accidents at Work (ESAW). Available online: https://ec.europa.eu/eurostat/documents/3859598/5926181/KS-RA-12-102-EN.PDF/56cd35ba-1e8a-4af3-9f9a-b3c47611ff1c (accessed on 20 November 2018).
- National Institute of Statistics—Romania (NIS). Available online: http://statistici.insse.ro:8077/tempo-online/#/pages/tables/insse-table (accessed on 29 November 2018).
- The Minister of Labour and Social Justice. Available online: http://www.mmuncii.ro/j33/index.php/ro/2014-domenii/munca/mobilitatea-fortei-de-munca/705 (accessed on 12 November 2018).
- Work Inspection. Available online: https://www.inspectiamuncii.ro/statistici-accidente-de-munca (accessed on 12 November 2018).
- Jørgensen, K. Prevention of “simple accidents at work” with major consequences. Saf. Sci. 2016, 81, 46–58. [Google Scholar] [CrossRef] [Green Version]
- Day, A.J.; Brasher, K.; Bridger, R.S. Accident proneness revisited: The role of psychological stress and cognitive failure. Accid. Anal. Prev. 2012, 49, 532–535. [Google Scholar] [CrossRef] [PubMed]
- Bellamy, L.; Mud, M.; Damen, M.; Baksteen, H.; Aneziris, A.; Papazoglou, I.A.; Hale, A.R.; Oh, I.H. Which management system failures are responsible for occupational accidents? Saf. Sci. Monit. 2010, 14, 2010. [Google Scholar]
- Masi, D.; Cagno, E. Barriers to OHS interventions in Small and Medium-sized Enterprises. Saf. Sci. 2015, 71, 226–241. [Google Scholar] [CrossRef]
- Hadjimanolis, A.; Boustras, G.; Economides, A.; Yiannaki, A.; Nicolaides, L. Work attitudes and safety performance in microfirms—Results from a nationwide survey: (the opinion of the employees). Saf. Sci. 2015, 80, 135–143. [Google Scholar] [CrossRef]
- Cagno, E.; Masi, D.; Leão, C.P. Drivers for OSH interventions in small and medium-sized enterprises. Int. J. Occup. Saf. Ergon. 2016, 22, 102–115. [Google Scholar] [CrossRef] [PubMed]
- Bonafede, M.; Corfiati, M.; Gagliardi, D.; Boccuni, F.; Ronchetti, M.; Valenti, A.; Marinaccio, A.; Iavicoli, S. OHS management and employers’ perception: Differences by firm size in a large Italian company survey. Saf. Sci. 2016, 89, 11–18. [Google Scholar] [CrossRef]
- Cunningham, T.R.; Sinclair, R. Application of a model for delivering occupational safety and health to smaller businesses: Case studies from the US. Saf. Sci. 2015, 71, 213–225. [Google Scholar] [CrossRef] [PubMed] [Green Version]
- De Koster, R.B.M.; Stam, D.; Balk, B.M. Accidents happen: The influence of safety specific transformational leadership, safety consciousness, and hazard reducing systems on warehouse accidents. J. Oper. Manag. 2011, 29, 753. [Google Scholar] [CrossRef]
- Liu, Y.J.; Chen, J.L.; Cheng, S.Y.; Hsu, M.T.; Wang, C.H. Evaluation of safety performance in process industries. Process Saf. Prog. 2014, 33, 166–171. [Google Scholar] [CrossRef]
- Wu, T.C.; Chen, C.H.; Li, C.C. A correlation among safety leadership, safety climate and safety performance. J. Loss Prev. Process Ind. 2008, 21, 307–318. [Google Scholar] [CrossRef]
- Sgourou, E.; Katsakiori, P.; Goutsos, S.; Manatakis, E. Assessment of selected safety performance evaluation methods in regards to their conceptual, methodological and practical characteristics. Saf. Sci. 2010, 48, 1019–1025. [Google Scholar] [CrossRef]
- Jennifer, S.; Praneet, P.B.; Alison, M.; Ian, P. Metrics to assess injury prevention programs for young workers in high-risk occupations: A scoping review of the literature. Health Promot Chronic Dis. Prev. Can. 2018, 38, 191. [Google Scholar] [CrossRef] [PubMed]
- Mehmood, A.; Maung, Z.; Consunji, R.J.; El-Menyar, A.; Peralta, R.; Al-Thani, H.; Hyder, A.A. Work related injuries in Qatar: A framework for prevention and control. J. Occup. Me. Toxicol. 2018, 13, 29. [Google Scholar] [CrossRef] [PubMed]
- Long, H.; Huang, W.; Zheng, P.; Li, J.; Tao, S.; Tang, S.; Abdullah, A.S. Barriers and Facilitators of Engaging Community Health Workers in Non-Communicable Disease (NCD) Prevention and Control in China: A Systematic Review (2006–2016). Int. J. Environ. Res. Public Health 2018, 15, 2378. [Google Scholar] [CrossRef] [PubMed]
- Kim, Y.; Park, J.; Park, M. Creating a Culture of Prevention in Occupational Safety and Health Practice. Saf. Health Work 2016, 7, 89–96. [Google Scholar] [CrossRef] [PubMed] [Green Version]
- National Institute of Statistics—Bulgaria (NIS). Available online: http://www.nsi.bg/en (accessed on 7 February 2019).
- Eurostat European Commission. Accidents at Work Statistics—Romania. Available online: http://ec.europa.eu/eurostat/statistics-explained/pdfscache/11539.pdf (accessed on 4 February 2019).
- Eurostat European Commission. Accidents at Work Statistics—Bulgaria. Available online: http://appsso.eurostat.ec.europa.eu/nui/submitViewTableAction.do (accessed on 4 February 2019).
- Pedro, A.; Swuste, P. Occupational Health and Safety post-graduation courses in Europe: A general overview. Saf. Sci. 2012, 50, 433–442. [Google Scholar] [CrossRef]
- Wu, Y.; Schwebel, D.C.; Hu, G. Disparities in Unintentional Occupational Injury Mortality between High-Income Countries and Low- and Middle-Income Countries: 1990–2016. Int. J. Environ. Res. Public Health 2018, 15, 2296. [Google Scholar] [CrossRef] [PubMed]
- Independent Evaluation of the ILO’s Strategy on Occupational Safety and Health: Workers and Enterprises Benefit from Improved Safety and Health Conditions at Work. Available online: http://www.ilo.org/wcmsp5/groups/public/@ed_mas/@eval/documents/publication/wcms_226411.pdf (accessed on 2 February 2019).
- Hämäläinen, P.; Takala, J.; Tan, B.K. Global Estimates of Occupational Accidents and Work-Related Illnesses 2017; Workplace Safety and Health: Singapore, 2017. Available online: http://www.icohweb.org/site/images/news/pdf/Report%20Global%20Estimates%20of%20Occupational%20Accidents%20and%20Work-related%20Illnesses%202017%20rev1.pdf (accessed on 2 February 2019).
- Cioca, L.-I.; Ivascu, L. Risk Indicators and Road Accident Analysis for the Period 2012–2016. Sustainability 2017, 9, 1530. [Google Scholar] [CrossRef]
Figure 1.
The non-fatal accident situation in the European Union during 2013–2017 [1].
Figure 1.
The non-fatal accident situation in the European Union during 2013–2017 [1].

Figure 2.
Situation of fatal accidents at the level of the European Union during 2013–2017 [2].
Figure 2.
Situation of fatal accidents at the level of the European Union during 2013–2017 [2].

Figure 3.
Distribution of fatal accidents for EU member states during 2013–2017 [1].
Figure 3.
Distribution of fatal accidents for EU member states during 2013–2017 [1].

Figure 4.
The distribution of non-fatal work accidents on the main fields of activity for the EU member states during 2013–2017 [1,7].


Figure 7.
Number of employees in Romania in 2013–2017 [2].
Figure 7.
Number of employees in Romania in 2013–2017 [2].

Figure 8.
The situation of non-fatal accidents in Romania during 2013–2017 [2].
Figure 8.
The situation of non-fatal accidents in Romania during 2013–2017 [2].

Figure 9.
Frequency index of non-fatal accidents in Romania during 2013–2017 [2].
Figure 9.
Frequency index of non-fatal accidents in Romania during 2013–2017 [2].

Figure 10.
Situation of fatal accidents in Romania during 2013–2017 [2].
Figure 10.
Situation of fatal accidents in Romania during 2013–2017 [2].

Figure 11.
The frequency index of fatal accidents in Romania during 2013–2017 [2].
Figure 11.
The frequency index of fatal accidents in Romania during 2013–2017 [2].


Figure 16.
The indicator values: (a) The severity index, Ig and (b) average duration index for the 2013 period in Romania [2].
Figure 16.
The indicator values: (a) The severity index, Ig and (b) average duration index for the 2013 period in Romania [2].

Figure 17.
Situation of accidents in Romania (a) and Bulgaria (b) in the fields of: agriculture, forestry, and fishing; manufacturing industry; construction; and transport and storage in the period 2013–2017.
Figure 17.
Situation of accidents in Romania (a) and Bulgaria (b) in the fields of: agriculture, forestry, and fishing; manufacturing industry; construction; and transport and storage in the period 2013–2017.


Figure 18.
Investigation model for prevention and control.


Table 1.
The distribution of non-fatal accidents in European Union (EU) member countries [1].
Table 1.
The distribution of non-fatal accidents in European Union (EU) member countries [1].
| Country | 2013 | 2017 | DV | Country | 2013 | 2017 | DV |
|---|---|---|---|---|---|---|---|
| Belgium | 56,405 | 70,674 | +25.3% | Hungary | 18,899 | 27,434 | +45.16% |
| Bulgaria | 2164 | 2188 | +1.11% | Malta | 2601 | 1818 | −30.1% |
| Czech Republic | 44,070 | 45,282 | +2.75% | Netherlands | 152,214 | 81,165 | −46.68% |
| Denmark | 55,931 | 49,439 | −11.61% | Austria | 64,646 | 62,902 | −2.7% |
| Germany | 852,061 | 862,983 | +1.28% | Poland | 77,339 | 84,037 | +8.66% |
| Estonia | 6175 | 6354 | +2.9% | Portugal | 123,137 | 135,033 | +9.66% |
| Ireland | 18,049 | 14,088 | −21.95% | Romania | 3453 | 4188 | +21.29% |
| Greece | 9676 | 3987 | −58.79% | Slovenia | 12,537 | 12,162 | −2.99% |
| Spain | 370,176 | 432,052 | +16.72% | Slovakia | 8741 | 9814 | +12.28% |
| France | 567,407 | 749,670 | +32.12% | Finland | 47,432 | 41,106 | −13.34% |
| Republic of Croatia | 11,709 | 13,263 | +13.27% | Sweden | 36,188 | 37,858 | +4.61% |
| Italy | 329,404 | 295,967 | −10.15% | United Kingdom | 243,798 | 227,165 | −6.82% |
| Cyprus | 1529 | 1900 | +24.26% | Iceland | 1787 | – | – |
| Latvia | 1707 | 1810 | +6.03% | Norway | 22,807 | 10,150 | −55.5% |
| Lithuania | 3043 | 3541 | +16.37% | Switzerland | 86,039 | 87,386 | +1.57% |
| Luxembourg | 7055 | 7152 | +1.37% |
Table 2.
The distribution of accidents in Romania by gender [22].
Table 2.
The distribution of accidents in Romania by gender [22].
| Year | 2013 | 2014 | 2015 | 2016 | 2017 | |||||
|---|---|---|---|---|---|---|---|---|---|---|
| Domain/Gender | M | F | M | F | M | F | M | F | M | F |
| Agriculture, forestry, and fishing | 105 | 6 | 105 | 7 | 124 | 9 | 131 | 15 | 140 | 11 |
| Manufacturing industry | 914 | 283 | 924 | 271 | 1070 | 305 | 1099 | 384 | 1156 | 395 |
| Construction | 409 | 6 | 415 | 7 | 459 | 12 | 472 | 15 | 498 | 17 |
| Transport and storage | 270 | 38 | 281 | 48 | 329 | 35 | 335 | 50 | 345 | 51 |
Table 3.
The distribution of accidents in Bulgaria by gender [22].
Table 3.
The distribution of accidents in Bulgaria by gender [22].
| Year | 2013 | 2014 | 2015 | 2016 | 2017 | |||||
|---|---|---|---|---|---|---|---|---|---|---|
| Domain/Gender | M | F | M | F | M | F | M | F | M | F |
| Agriculture, forestry and fishing | 59 | 5 | 5 | 4 | 57 | 7 | 36 | 2 | 31 | 2 |
| Manufacturing industry | 460 | 181 | 181 | 183 | 485 | 141 | 417 | 187 | 420 | 190 |
| Construction | 220 | 5 | 5 | 6 | 198 | 2 | 178 | 7 | 181 | 6 |
| Transport and storage | 235 | 56 | 56 | 66 | 207 | 74 | 218 | 84 | 215 | 81 |
Table 4.
The distribution of accidents in Romania by age [23].
Table 4.
The distribution of accidents in Romania by age [23].
| Category | Less than 25 Years | From 25 to 54 Years | 55 Years or over | ||||||||||||
|---|---|---|---|---|---|---|---|---|---|---|---|---|---|---|---|
| Domain/Year | 2013 | 2014 | 2015 | 2016 | 2017 | 2013 | 2014 | 2015 | 2016 | 2017 | 2013 | 2014 | 2015 | 2016 | 2017 |
| Agriculture, forestry, and fishing | 3 | 4 | 11 | 5 | 6 | 99 | 98 | 101 | 117 | 121 | 9 | 10 | 21 | 24 | 24 |
| Manufacturing industry | 130 | 132 | 169 | 173 | 170 | 920 | 921 | 1033 | 1100 | 1159 | 147 | 142 | 173 | 210 | 222 |
| Construction | 29 | 30 | 32 | 32 | 32 | 319 | 324 | 367 | 342 | 358 | 67 | 68 | 72 | 113 | 125 |
| Transport and storage | 15 | 17 | 20 | 23 | 24 | 248 | 254 | 292 | 297 | 299 | 45 | 58 | 52 | 65 | 73 |
Table 5.
The distribution of accidents in Bulgaria by age [23].
Table 5.
The distribution of accidents in Bulgaria by age [23].
| Category | Less than 25 Years | From 25 to 54 Years | 55 Years or over | ||||||||||||
|---|---|---|---|---|---|---|---|---|---|---|---|---|---|---|---|
| Domain/Year | 2013 | 2014 | 2015 | 2016 | 2017 | 2013 | 2014 | 2015 | 2016 | 2017 | 2013 | 2014 | 2015 | 2016 | 2017 |
| Agriculture, forestry, and fishing | 10 | 5 | 5 | 1 | 1 | 42 | 41 | 44 | 28 | 29 | 12 | 13 | 15 | 9 | 3 |
| Manufacturing industry | 40 | 64 | 67 | 69 | 60 | 480 | 460 | 452 | 424 | 440 | 121 | 111 | 107 | 111 | 110 |
| Construction | 10 | 12 | 10 | 9 | 10 | 160 | 159 | 140 | 133 | 130 | 55 | 51 | 50 | 43 | 47 |
| Transport and storage | 6 | 6 | 5 | 9 | 8 | 240 | 235 | 208 | 201 | 202 | 45 | 59 | 68 | 92 | 86 |
Table 6.
Result of ANOVA analysis (frequency index of non-fatal).
| Category | Mean (SD) | Year | ||||
|---|---|---|---|---|---|---|
| 2013 | 2014 | 2015 | 2016 | 2017 | ||
| Gender (t = 16.125, p < 0.001) | ||||||
| (1) Male (2) Female | 0.748 (0.076) 0.338 (0.038) | − | − | − | − | − |
| Age (F = 175.206, p < 0.001) | ||||||
| <17; >60 | 0.116 (0.011) | − | + | + | + | + |
| 17–20 | 0.194 (0.019) | + | − | + | + | + |
| 20–30 | 0.606 (0.076 | + | + | − | * | * |
| 30–40 | 0.836 (0.091) | + | + | + | − | * |
| 40–50 | 1.162 ± 0.208 | + | * | + | + | − |
| 50–60 | 1.063 ± 0.138 | + | + | * | * | + |
+ Indicates a significant difference, p-value < 0.05; * Indicates a significant difference, p-value < 0.001.
Table 7.
Result of ANOVA analysis (frequency index of fatal).
| Category | Mean (SD) | Year | ||||
|---|---|---|---|---|---|---|
| 2013 | 2014 | 2015 | 2016 | 2017 | ||
| Gender (t = 10.144, p < 0.001) | ||||||
| (1) Male (2) Female | 8.548 (2.023) 2.738 (1.014) | − | − | − | − | − |
| Age (F = 175.206, p < 0.001) | ||||||
| <17; >60 | 0.670 (0.211) | – | + | + | * | + |
| 17–20 | 0.164 (0.039) | * | – | + | + | + |
| 20–30 | 0.606 (0.076 | + | * | – | + | + |
| 30–40 | 0.920 (0.791) | + | + | + | – | + |
| 40–50 | 2.408 (1.454) | + | * | + | + | – |
| 50–60 | 1.748 (0.890) | + | + | + | * | * |
+ Indicates a significant difference, p-value < 0.05; * Indicates a significant difference, p-value < 0.001.
Table 8.
Trends of accident at work for period 2018–2020 in Romania.
| Domain | Regression Analysis/R-Square | 2018 | 2019 | 2020 |
|---|---|---|---|---|
| Agriculture, forestry, and fishing | y = 11.4x + 96.4 R2 = 0.9355 | 165 | 176 | 184 |
| Manufacturing industry | y = 99.6x + 1061.4 R2 = 0.9392 | 1660 | 1758 | 1857 |
| Construction | y = 26.5x + 382.5 R2 = 0.9588 | 541 | 568 | 594 |
| Transport and storage | y = 23.2x + 286.8 R2 = 0.972 | 426 | 449 | 472 |
Table 9.
Trends of accident at work for period 2018–2020 in Bulgaria.
| Domain | Regression Analysis/R-Square | 2018 | 2019 | 2020 |
|---|---|---|---|---|
| Agriculture, forestry, and fishing | y = −8.3x + 76.5 R2 = 0.7713 | 27 | 24 | 18 |
| Manufacturing industry | y = −9.3x + 651.1 R2 = 0.8591 | 595 | 585 | 575 |
| Construction | y = −11.3x + 237.7 R2 = 0.8924 | 170 | 159 | 149 |
| Transport and storage | y = 1.2x + 290.4 R2 = 0.0511 | 297 | 298 | 300 |
© 2019 by the authors. Licensee MDPI, Basel, Switzerland. This article is an open access article distributed under the terms and conditions of the Creative Commons Attribution (CC BY) license (http://creativecommons.org/licenses/by/4.0/).
Share and Cite
MDPI and ACS Style
Ivascu, L.; Cioca, L.-I. Occupational Accidents Assessment by Field of Activity and Investigation Model for Prevention and Control. Safety 2019, 5, 12. https://doi.org/10.3390/safety5010012
AMA Style
Ivascu L, Cioca L-I. Occupational Accidents Assessment by Field of Activity and Investigation Model for Prevention and Control. Safety. 2019; 5(1):12. https://doi.org/10.3390/safety5010012
Chicago/Turabian StyleIvascu, Larisa, and Lucian-Ionel Cioca. 2019. "Occupational Accidents Assessment by Field of Activity and Investigation Model for Prevention and Control" Safety 5, no. 1: 12. https://doi.org/10.3390/safety5010012
Note that from the first issue of 2016, this journal uses article numbers instead of page numbers. See further details here.