
Physiological Stress Responses to Fear and Anxiety in a Height Change Experiment among Non-Labor Teenagers


1
School of Science, Exercise and Sport Science Program, University of Phayao, Phayao 56000, Thailand
2
Thammasat University Research Unit in Making of Place and Landscape, Faculty of Architecture and Planning, Thammasat University, Pathum Thani 12121, Thailand
*
Author to whom correspondence should be addressed.
Safety 2023, 9(2), 19; https://doi.org/10.3390/safety9020019
Submission received: 8 January 2023
/
Revised: 17 March 2023
/
Accepted: 24 March 2023
/
Published: 28 March 2023
Abstract
:Working on elevated surfaces without prior experience can be dangerous, particularly for young people, who are significantly more at risk of developing fear and anxiety, which might lead to falls and fatalities. This critical problem has, however, received limited research attention. The present study aimed to demonstrate the associations among physiological responses, fear, and anxiety in Thai teenagers at various height levels. Sixty teenagers (30 males and 30 females) between the ages of 15 and 18 who had no labor skills were recruited to perform the task at 11 levels, starting at zero meters and increasing by one meter at each level. The measurements were examined and recorded once the task at each level was finished. The main results indicated that heart rate was partially positively associated with mean arterial pressure, fear, and anxiety (with all p values < 0.001) in all teenagers (after controlling for level and sex), as well as male and female teenagers (after controlling for level). The present study suggested monitoring heart rate data in teenagers conducting activities at heights, which can be triggered by fear and anxiety, as a strategy for preventing falls from height hazards.
1. Introduction
The issue of child laborers working at heights, especially in developing countries, has been reported as a serious problem which causes concern [1,2]. For example, a report (2018) carried out by the Ministry of Labour, the National Statistical Office of Thailand, and the International Labour Organization revealed that 3111 young workers between the ages of 15 and 17 were engaged in work at elevations greater than 10 m [3], even though regulations currently prohibit teenagers under the age of 18 years old from working on scaffolding at heights greater than 10 m [4]. The report also stated that there were 408,679 young workers, of whom 132,589 were employed in non-hazardous positions, including those at altitudes lower than 10 m [3]. According to 2020 statistics provided by the Social Security Office of Thailand (Workmen’s Compensation Fund), there were 6332 occurrences of workers aged 15 and older falling from great heights, 120 of which resulted in organ loss, disability, or death. Furthermore, 1555 younger workers, aged 15 to 19, were reported to have been injured in workplace accidents [5]. A recent report (2021) discovered that the number of Thai teenagers working in non-hazardous occupations, including those at heights lower than 10 m, had reached 193,548 [6]. These illustrated that the increasing number of young workers, as well as serious occupational accidents from working at heights, is becoming a more serious issue that requires more attention and solutions [7]. Previous studies indicated that the risk of falling increases when physical duties are specifically required to be performed at higher elevations [8,9]. When paired with inexperience in operating tasks at heights [10] and immaturity at a young age, the risk factors for falling can be significantly heightened [11]. These unhealthy circumstances and hazardous surroundings have the potential to cause unexpected severe accidents, which can result in disability or even death [12,13].
High-altitude exposure (such as when looking down from cliffs, buildings, or even staircases) can generate feelings or sensations of fear and anxiety since the primary responsibilities of fear and anxiety are to serve as warning signs of potential dangers or harm [14]. Fear is a state of elevated autonomic arousal that can trigger the fight or flight response, which is the body’s instantaneous reaction to external stimuli, whereas anxiety refers to a condition of tension, apprehension, or worry about potential negative outcomes or events [15,16]. However, the phenomena of fear and anxiety can be either combined or isolated, depending on circumstances and confounding factors [16]. For teenagers, fear and anxiety frequently occur, but in most cases, these feelings are typically temporary and disappear within a short period of time [15].
The experiences of construction workers (e.g., iron or steelworkers) at higher surfaces, especially those undergoing first-time exposure to great heights [17], have the potential to exacerbate physiological stress, which is positively associated with sympathetic nerve activity [11]. The physiological responses to stress can be reflected in an increase in several important bodily systems, including heart rate, blood pressure, and reaction time [18,19]. Cardiovascular changes in high-elevation workers have been reported with variations in heart rate and blood pressure when compared to those workers at lower elevations or ground level [8,20]. Reaction time refers to an interval of time between the stimulus and the automatic response [21,22]. However, reaction time can be uncertain and may contribute to inconsistent results under conditions of fear and anxiety, because fear-inducing stimuli speed up reactions, while anxiety-inducing stimuli may slow them down [23]. In terms of the reaction time parameter in research studies, a previous study found that Thai workers with and without work-related injuries had significantly different simple reaction times, not only for visual but also for tactile and auditory stimuli, with the injured group being associated with stress symptoms through the sympathetic nervous system [24]. Additionally, a physiological stress signals study suggested using reaction time alongside physiological signals (i.e., electrodermal activity, electrocardiography, and electromyography) to recognize different stress states. It was also emphasized that reaction time is beneficial in stress recognition and that integrating physiological signals with reaction time can contribute to even greater stress recognition performance [25]. As suggested by the literature, heart rate, blood pressure, and reaction time have showed some potential as physiological stress indicators to reflect fear and anxiety [14,25,26], particularly for teenagers and height experiments [2,11]. These physiological indicators are also applicable to a wide population without requiring a complicated methodology and lengthy procedure and can be appropriately applied in real-life working situations.
Regarding experiments at heights, the use of virtual reality has become increasingly popular in investigating the physiological effects of fear and anxiety [27,28,29]. Still, the realistic experience of being in an actual environment can be more valid, leading to more natural behavior and more accurate biofeedback than in a stimulated scenario. Several earlier studies focused on adult workers, who are mostly professional workers [8,9,10]. However, young people have been the focus of very few studies, particularly in non-labor skills, where they are more susceptible to accidents than older and more skilled individuals. Importantly, it is less evident in clarifying the correlations among physiological stress responses (i.e., heart rate, blood pressure, and reaction time), fear, and anxiety in an aspect of occupational safety. To address this limitation, the present study was designed to examine potential differences in height levels and sexes, and the key objective was to identify the relationships between physiological responses, fear, and anxiety in a constructed environmental setting among Thai teenagers who had never worked at heights. These findings would be useful evidence for child laborers working at elevations for a fall prevention plan, which could contribute to a partial prohibition or regulation of child labor in developing countries.
2. Materials and Methods
2.1. Participants
A total of 60 participants (30 males and 30 females) aged 16.15 ± 0.76 years old were recruited from high schools in Bangkok, Thailand. Based on the suggestion for correlation analysis, to detect a correlation coefficient of 0.5, an alpha of 0.05, and a power of 0.8, a minimum of 29 participants per group is required [30]. Participants who were aged at least 15 years but not over 18 years old were included. All participants understood the aims of the present study and completed all tasks and assessments without missing data. However, those who had either experienced cardiovascular diseases, work-related musculoskeletal disorders, high place phenomenon (fear of heights or acrophobia), or prior training or experience in working at heights were excluded from the present study. All participants and their parents or legal guardians received written information about the present study and had the opportunity to contact the research team with any queries at any time before agreeing to participate and signing the consent form. All procedures performed involving human participants in the present study were approved by the local ethical review board of Thammasat University.
2.2. Measurements
The present study was conducted in a secure indoor setting on a 10-m-high open-structure metal staircase during the day with natural sunlight. The staircase was located in a spacious hall, which was roofed with a heat-resistant metal sheet. All participants wore proper safety equipment that was provided by the safety team, such as a helmet with an adjustable chin strap and a fall-prevention harness with a detachable hook. The participants were instructed to complete the 7-min light task by tying (and untying) a mini board to a handrail with cables, by starting from the ground or zero levels and going up to a 10-m height with a 1-m increment at each level. Throughout the experiment, each participant was required to complete the task while standing on a step inside the staircase, without the use of any personal supports or assistive devices. After performing the task at each level, measurements of both objective (i.e., heart rate, blood pressure, and reaction time) and subjective (i.e., fear and anxiety) indexes were assessed and collected.
Heart rate and blood pressure measures were evaluated using a digital blood pressure monitor (OMRON: HEM-7121 Standard). Each participant was invited to sit comfortably on the step with their backs against the upper step and their feet flat on the bottom step with their ankles uncrossed. The participants were asked to relax their arms [31,32,33,34], loosen their fists, and rest them next to their bodies. For the measurement, the cuff was placed over their upper left arms, which were the arms closest to their hearts, with the tube leading down positioned in the middle of the arms. They were informed that the cuff on their arms would automatically inflate and deflate for a short period of time, which might make them feel slightly uncomfortable. However, they were asked to remain still [32,34], and talking was not allowed during the measuring [33]. Data on pulse rate were collected and referred to heart rate in beats per minute (bpm). For the purpose of calculating mean arterial pressure (MAP) with a millimeter of mercury unit (mmHg), data on systolic blood pressure (SBP) and diastolic blood pressure (DBP) were recorded.
The simple reaction time measurement was assessed with an application on a smartphone. The participants were positioned to confront the examiners in a standing posture on the same step level. The upper two corners of the smartphone were held by the examiners while facing the participants at their chest levels, positioned in the central vertical space between them to ensure that there was no glare or reflection from the screen onto the participants. On the other side of the smartphone, two hands of the participants touched the tips of the lower corners to indicate that they were ready for the tests. As soon as the color of the smartphone screen changed (from black to white), the participants had to touch the screen as quickly as they could. Either the left or right hands could be used to answer the tests. The participants were asked to complete the task five times in a row for each height level. All were recorded with a millisecond unit (ms). It is worth mentioning that at the preparation phase before the measurement, each pair of participants and examiners worked together on the ground level to find the right posture with the smartphone, and they took one practice test without results being collected.
Fear and anxiety measures were investigated using a rating scale. The measurements of fear and anxiety were started within the first 5 s after the participants finished their tasks [27]. The participants were instructed to maintain their standing position on the inside step of the staircase while looking outward to continue experiencing the height level. They were asked to evaluate their current feelings on a scale from 0 to 100, where 0 and 100 points represented no fear or anxiety at all and extremely high levels of fear or anxiety, respectively [35].
The total time spent in each level was approximately 10 min, with the first 7 min spent performing tasks. Following the immediate examination of the fear and anxiety measurements (at minute 8), the simple reaction time was then measured (at minutes 8–9), and heart rate and blood pressure tests were taken at the end (at minutes 9–10). As a result, the total time of the experimental protocol for all levels was 110 min for each participant.
2.3. Statistical Analysis
Data on blood pressure were used to calculate MAP using the standard formula: DBP + 1/3(SBP − DBP) [36]. For reaction time, all recorded data were averaged values for each level of height. The Shapiro–Wilk test, histogram, and box plot were used in the normality test to check and demonstrate that the data were not normally distributed. Descriptive statistics were presented as median (interquartile range 25th, 75th percentile) for heart rate, MAP, reaction time, fear, and anxiety across all groups (Table 1, Table 2, Table 3 and Table 4). The Wilcoxon signed–rank test was used to examine level differences between zero and various levels (1–10) for all teenagers as well as male and female teenagers (Table 2). Differences between male and female teenagers were compared with the Mann–Whitney U test for overall data (Table 1) and at each level (Table 3 and Table 4). Scatterplots were illustrated between fear and anxiety to investigate their relationships (Figure 1). Associations were examined with a nonparametric partial correlation (Table 5 and Table 6) for all teenagers (with level and sex adjusted) and for male and female teenagers (with level adjusted). All the analyses were performed with IBM SPSS Statistics version 22, and results were deemed statistically significant at a p value less than 0.05 from two-sided tests. Effect sizes were estimated and interpreted with r-squared (r2) via z value squared divided by the total sample [37], R-squared (R2), and correlation coefficient (r) for the comparison, scatterplot, and correlation results, respectively. Based on Cohen’s (1988) guidelines, r-squared and R-squared values of 0.25, 0.09, and 0.01 suggested large, medium, and small effects, respectively, whereas correlation coefficient values of 0.5, 0.3, and 0.1 indicated large, medium, and small effects, respectively [37,38].
3. Results
Table 1 shows overall data obtained from all levels for objective (heart rate, MAP, and reaction time) and subjective (fear and anxiety) indexes. The median heart rate across all individuals was 87 bpm. Female participants displayed a statistically significantly greater pace than male participants (93 and 78 bpm, respectively, with p < 0.001). All teenagers had a MAP of 86.33 mmHg, with male teenagers having a statistically significantly higher MAP than female teenagers (90 and 83.33 mmHg, respectively, with p < 0.001). For reaction time, all participants spent 341.60 ms, whereas male participants responded statistically significantly faster than their female counterparts (327.90 and 350.70 ms, respectively, with p < 0.001). The significant corresponding r-squared values varied from 0.45 to 3.25, indicating a large to very large effect. Conversely, all groups had a median of 0 points for both fear and anxiety, where no statistically significant difference was found between male and female groups.
Table 2 shows descriptive data for all teenagers at different levels for both objective and subjective indexes. The comparative results for all teenagers, male teenagers, and female teenagers were indicated. However, only p values and effect sizes for all teenagers were reported in Table 2. For all teenagers, heart rates were statistically significantly higher at levels 8 and above (ranging from 87.50 to 88.50 bpm) compared to level 0 (86.50 bpm), where p values ranged between 0.015 and 0.035. The significant corresponding r-squared values ranged from 1.07 to 1.67, indicating a large effect. There were statistically significantly slower reaction times at levels 3, 7, and 8 (ranging from 329 to 342.50 ms) than at level 0 (349.80 ms), where p values ranged between 0.024 and 0.046. The significant corresponding r-squared values ranged from 0 to 0.02, indicating a small effect. For the subjective index, fear and anxiety discovered statistically significant differences between levels 0 and 1–4, with p values ranging between less than 0.001 and 0.009 for fear and less than 0.001 and 0.011 for anxiety, but no significant corresponding r-squared values were found, indicating no effect.
Additionally, male teenagers had a statistically significantly higher heart rate at level 10 (p = 0.037), shorter reaction times at levels 3 and 10 (p = 0.010 and 0.030, respectively), and lower anxiety at levels 1 and 4 (p = 0.006 and 0.070, respectively), including variations in fear at level 1 (p = 0.028), when compared to level 0. The significant corresponding r-squared values for heart rate and reaction time at level 10 ranged from 0.03 to 1.35, indicating a small to medium effect, while other values were in the range of 0. Furthermore, female teenagers had a statistically significantly faster reaction time at level 8 (p = 0.019), lower fear at levels 1–5 (p values between 0.003 and 0.043), and lower anxiety at levels 1, 3, and 4 (p values between 0.009 and 0.043). However, no significant corresponding r-squared values were found, indicating no effect. Conversely, there was no statistically significant difference between zero and other levels for MAP at all levels across all groups (as shown in Table 2).
Table 3 shows descriptive data for heart rate, MAP, and reaction time followed by a comparison of results between male and female teenagers across all levels. At all levels, the responses of female teenagers (ranging from 88.50 to 95 bpm) to their heart rates were statistically significantly higher than those of male teenagers (ranging from 74.50 to 82 bpm), where p values ranged between less than 0.001 and 0.002. The significant corresponding r-squared values ranged from 0.17 to 0.39, indicating a medium to large effect. Male teenagers (ranging from 87.83 to 91.67 mmHg) had a statistically significantly greater MAP than female (ranging from 81.33 to 84.33 mmHg) at all levels, where p values ranged between less than 0.001 and 0.044. The significant corresponding r-squared values ranged from 0.07 to 0.24, indicating a small to medium effect. For reaction time, male participants (ranging from 314.20 to 344.20 ms) performed quicker than their female participants (ranging from 334.70 to 359.90 ms) at all levels, but statistically significantly at specific levels (1st, 3rd, 5th, 6th, and 10th), where p values ranged between 0.012 and 0.045. The significant corresponding r-squared values ranged from 0.07 to 0.11, indicating a small to medium effect. Conversely, there was no statistically significant difference for reaction time at the zero, second, fourth, seventh, eighth, or ninth levels.
Table 4 shows fear and anxiety responses along with comparative results between male and female participants at various levels. The greatest fears were rated at levels nine and zero, with scores of 5 points for males and 10 points for females, respectively. On the other hand, the most intense anxieties were rated at level 10 with scores of 7 points for females and at level 0 with scores of 3.50 points for males. No statistically significant difference was found for either fear or anxiety at any of the levels 0 to 10, however.
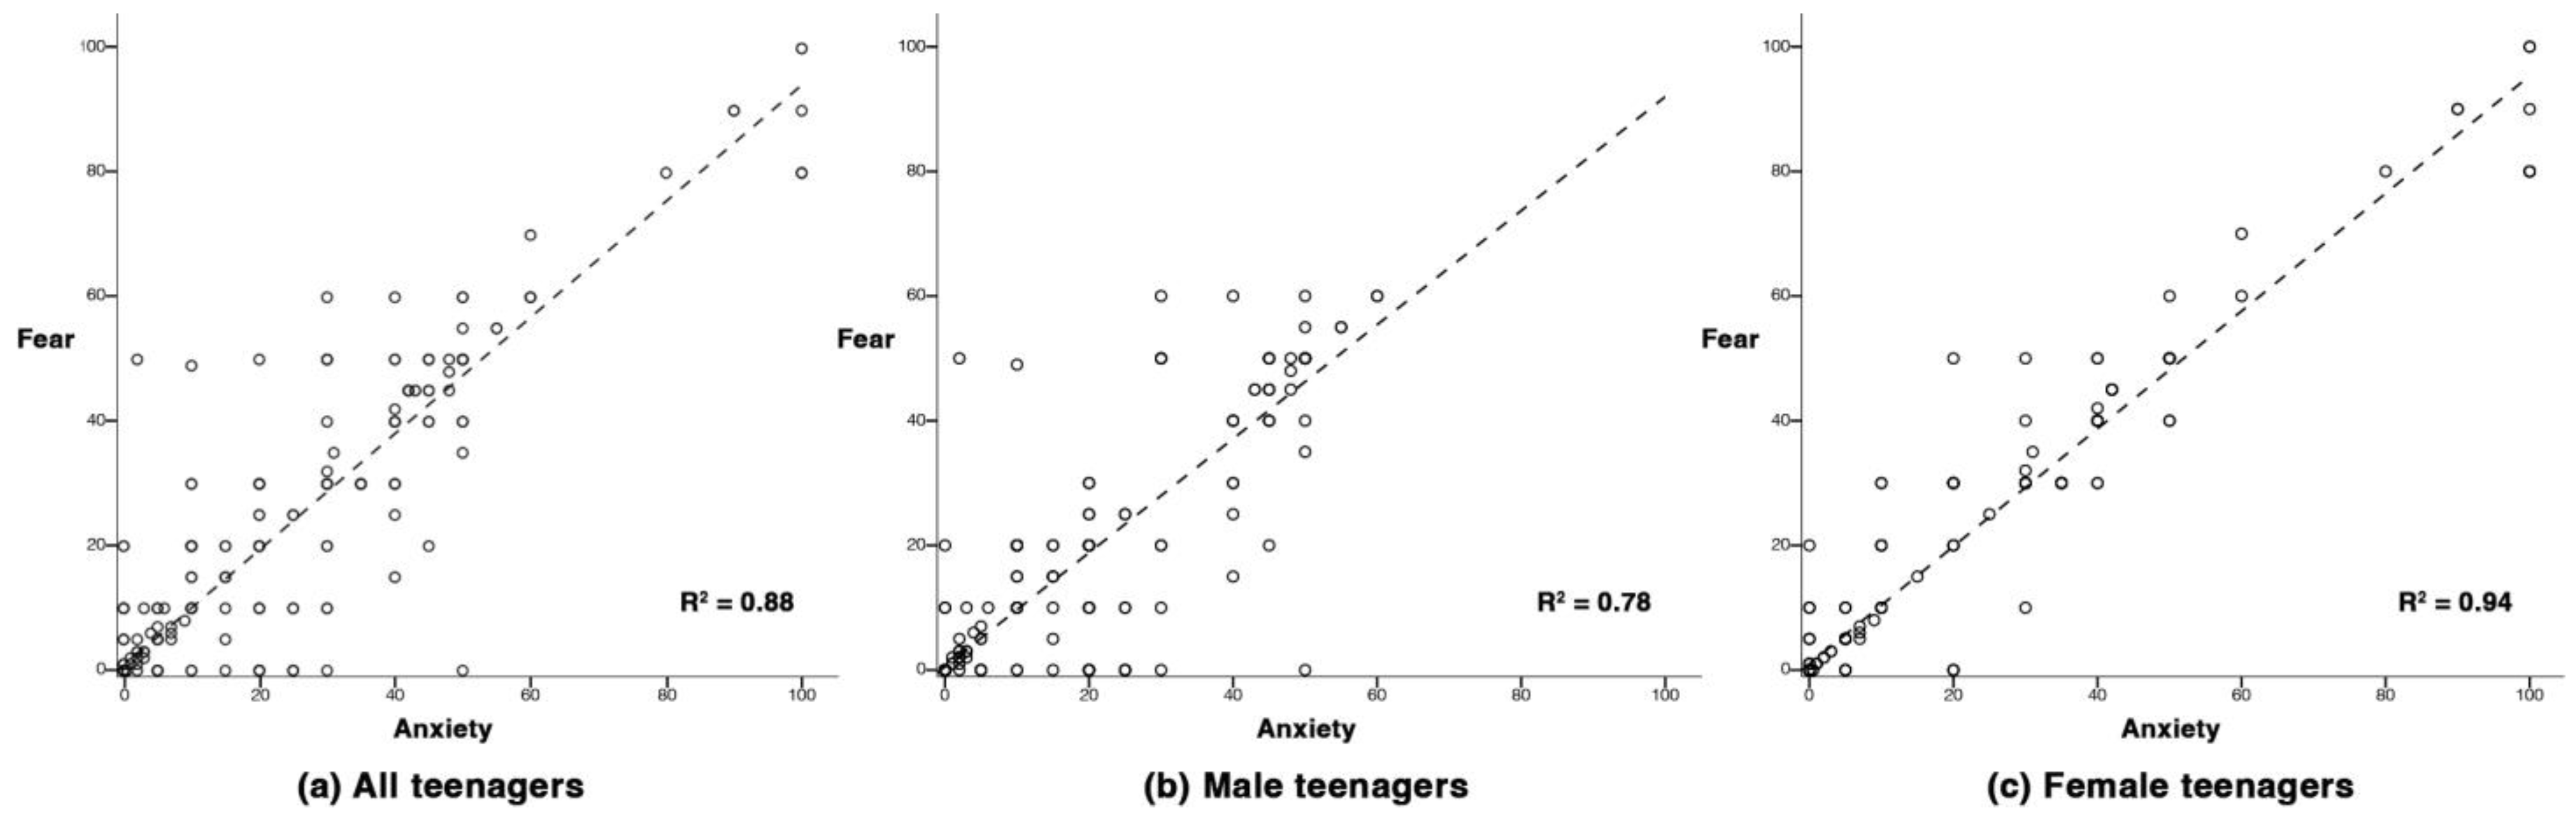
Figure 1 illustrates scatter diagrams between fear and anxiety in each group. Relationships are represented with dashed lines by R-squared linear results of 0.88, 0.78, and 0.94 for all teenagers, male teenagers, and female teenagers, respectively. These squared correlation coefficients demonstrated a strong and positive correlation between fear and anxiety.
Table 5 shows relationships among heart rate, MAP, and reaction time for all teenagers (with level and sex adjusted) as well as for male and female teenagers (with level adjusted). For all teenagers, heart rate was significantly and positively related to MAP, while reaction time was significantly and negatively related to both heart rate and MAP, where p values ranged between less than 0.001 and 0.023. The significant correlation coefficients, ranging in absolute value from 0.09 to 0.31, indicated that the strength of the correlation was relatively small to medium. Similar results were observed in female teenagers, where p values ranged between less than 0.001 and 0.012. The significant correlation coefficients, ranging in absolute value from 0.14 to 0.27, indicated that the strength of the correlation was small. Meanwhile, heart rate was significantly and positively related to MAP in male teenagers, where the p value was less than 0.001 and the significant correlation coefficient was 0.37, which indicated that the strength of the correlation was medium. Conversely, the reaction time was not statistically significantly related to the heart rate or MAP in male teenagers.
Table 6 shows relationships for all teenagers, after controlling for level and sex, as well as for male teenagers and female teenagers, after controlling for level. Heart rate was statistically significantly and positively related to fear and anxiety in all groups where the p value was less than 0.001, and significant correlation coefficients, ranging from 0.22 to 0.30, indicated that the strength of the correlation was small to medium. Meanwhile, the MAP of female teenagers was statistically significantly and positively related to fear and anxiety, where p values ranged between 0.012 and 0.015. The significant correlation coefficients, ranging from 0.13 to 0.14, indicated that the strength of the correlation was small. Conversely, neither all teenagers nor male teenagers showed a statistically significant relationship between MAP and fear or anxiety. The reaction time was also not statistically significantly related to either fear or anxiety in any groups.
4. Discussion
As mentioned earlier, the aim of the present study is to significantly extend the literature in two different directions. First, while trending investigations have explored physiological responses to fear and anxiety in working at heights via virtual simulation technology, the present study experiments with these forms of feedback in an actual environment as a real-world situation. Second, without prior experience, working at heights can be dangerous, especially for the younger population. For a further understanding of underlying physiological responses and more proof of fear and anxiety, the present study examined both male and female teenagers who had none of those experiences.
Compared to level 0, heart rates were considerably greater only at levels 8–10 for all teenagers and at level 10 for male teenagers, although heart rates were high at all levels (1–10) for both male and female teenagers. Reaction times were considerably faster at levels 3, 7, and 8 for all teenagers, at levels 3 and 10 for male teenagers, and at level 8 for female teenagers as compared to level 0. Anxiety values were considerably lower at levels 1–4 compared to level 0 for all teenagers, whereas fear values were found to be considerably varied amongst the same levels as well. These results confirmed that the change in height influenced both the objective and subjective indexes, particularly for all teenagers.
Sex differences between male and female teenagers were found to have a significant impact on heart rate, MAP, and reaction time. At all levels (0–10), female teenagers had a significantly higher heart rate with a medium to large effect and a lower MAP with a small to medium effect. They also spent more time on reaction time with a small to medium effect at levels 1, 3, 5, 6, and 10 than male teenagers. Interestingly, a closer look at heart rate responses at multiple levels showed that the lowest values were found at the zero level in both sexes, whereas the greatest values were first found at the second and eighth levels for female and male teenagers, respectively. These results revealed variations in physiological responses between male and female teenagers at various levels, indicating that teenage females had a more difficult time regulating their physiological stress when encountering heights than males.
Additionally, fear and anxiety illustrated some patterns whereby male teenagers expressed their greatest fears at around the highest height levels (9th and 10th) and most anxieties at the lowest level (zero). This pattern was also found in female teenagers but in the opposite way, where the greatest fears and anxieties occurred at zero level and at between levels 9 and 10, respectively. This mixed feeling and the inverse pattern can be varied by lack of immaturity and sex differences [15,39]. At the zero level, female teenagers may feel more fear because the activity is unfamiliar to their way of life, and they may feel even more unsafe when the activity requires wearing protective equipment for safety, whereas male teenagers may see it as an extreme and challenging activity with less fear [40,41]. However, male teenagers were found to have slightly higher anxiety than female teenagers at the zero level, which was contradictory to earlier studies that indicated that female teenagers exhibit greater fear and anxiety than male teenagers [42,43].
Our findings for objective indexes revealed weak to moderate relationships between heart rate and MAP across all groups as well as relationships among heart rate, MAP, and reaction time in all teenagers and female teenagers. Unsurprisingly, all the groups showed positive correlations between heart rate and MAP, which was supported by previous studies that reported similar relationships between these two [44,45]. It is important to note that both variables were gathered from the same blood pressure measurement. There is, however, a possibility of an existing correlation between them. Meanwhile, reaction time showed negative correlations with heart rate and MAP across all groups, but these were only significant in all teenagers and females, not in males. These may be explained by sex variations observed in our comparative results, where heart rate and MAP were found to differ at all height levels, while reaction time was shown to differ only at certain height levels. Consequently, the impact of the female group may affect the outcomes of all teenagers, even though the sex factor was taken into account when the correlation analyses were done.
Moreover, heart rate was found to be positively correlated with fear and anxiety across all groups, whereas MAP was discovered to be positively correlated with fear and anxiety in only female teenagers. These positive correlations are supported by the fact that heart rate and blood pressure normally increase as cardiac responses through autonomic modulation when fear and anxiety are stimulated, such as by heights [15,46]. Our findings also revealed that there was a strong positive relationship between fear and anxiety across all groups, which contributed to the direction of those correlation results. Thus, heart rate was found to be a useful physiological indicator by comparing to other results for observations of fear and anxiety in the younger population when performing tasks on elevated surfaces.
The strengths of the present study include that all of the outcomes were assessed and acquired from the actual contextual setting rather than virtual stimulation. A safety protocol for fall prevention from trips, slips, and heights was properly prepared, and no related falling accidents occurred during any of the experiments. The measurements were noninvasive assessments and less time-consuming without missing data or errors. The present study, nonetheless, has some limitations. There were measurements that were unassessed in the present study, such as stress level, cognitive performance, and other measurements for fear of heights and anxiety that provided objective data. Additionally, there was a restriction on the variety of tasks and the sample size was relatively small. Due to safety concerns, the experiment design was unable to be carried out at night, outside of the staircase, or in any other positions such as climbing or hanging postures since the study investigated a sensitive population and involved great heights, which limited the results. There were some confounding factors, such as variations in sitting posture during the heart rate and blood pressure tests, variations in time of day that affect changes in temperature and lighting, and the order of the measurements, where heart rate and blood pressure tests were taken as the last assessment (approximately 2 min after the task finished), which may lead to some discrepancies. Further studies conducted on a much larger population are needed to confirm our results, and assessments involving stress, cognition (e.g., processing speed and accuracy), and objective instruments for fear and anxiety should also be integrated.
5. Conclusions
Among all teenagers without prior labor experience at various heights, differences between zero and other levels were found in heart rate (levels 8–10), reaction time (levels 3, 7, and 8), and fear and anxiety (levels 1–4), but not in MAP. Heart rate and MAP showed differences between males and females in the total data collected at all levels as well as at each level. Conversely, reaction time showed differences by sex only in the total data collected at all levels and at certain levels, whereas fear and anxiety showed no sex differences. The present study also indicated that heart rate was positively correlated to MAP in all groups (total participants, and male and female participants), whereas reaction time was negatively correlated to heart rate and MAP in all participants and female participants. Moreover, all the groups demonstrated a positive correlation between heart rate and subjective data of fear and anxiety, while only female individuals showed a positive correlation between MAP and these subjective data. By performing tasks at various height levels, the present study indicated the relationship between fear and anxiety that was observed across all groups and showed a positive correlation. Therefore, these findings implied that the heart rate, particularly in relation to fear and anxiety, is an effective parameter for monitoring physiological change in teenagers working at heights. With that, it can be further suggested as a required tool for tracking real-time heart rate changes (portable devices are recommended, e.g., a fitness tracker, sport watch, smart watch, or chest strap) and should be incorporated as one of the safety management approaches for all teenagers who are engaged in any field involving height hazards. The heart rate monitoring protocol should be applied for both static and dynamic work tasks, as well as for activities that remain at the same height level and those that change levels. Also, designs for environmental safety that include teenagers engaged in activities, either physically or mentally, can combine observing variations in heart rate as an additional piece of information for risk management. Finally, the present study recommended considering heart rate in the younger population when performing work at height levels, such as scaffolding or elevated platforms, as a strategy to prevent fall incidents and accidents. This study can benefit teenage workers, particularly in developing nations, by raising awareness of the problem in height-hazardous situations, which can enhance safety, and by guiding the development of appropriate legislation and interventions.
Author Contributions
Conceptualization, Methodology, and Investigation, A.W.; Formal Analysis and Writing—Review and Editing, W.C.; Visualization and Supervision, P.S. These authors contributed equally to this work. All authors have read and agreed to the published version of the manuscript.
Funding
A.W. is supported by the Department of Labour Protection and Welfare, the Ministry of Labour, Thailand and the National Research Council of Thailand (NRCT: Grant no. 25/2561). W.C. is supported by the Thammasat Postdoctoral Fellowship.
Institutional Review Board Statement
The present study was conducted according to the guidelines of the Declaration of Helsinki, and approved by the Ethical Review Sub-Committee Board for Human Research Involving Sciences, Thammasat University (No. 3: COA No. 280/2560).
Informed Consent Statement
Prior to participating in the present study, informed consent was obtained from all participants as well as their parents or legal guardians.
Data Availability Statement
The data presented in the present study are available on reasonable request from the corresponding author. The data are not publicly available due to privacy and ethical restrictions.
Acknowledgments
The authors would like to express their gratitude to all of the participants for their kind contributions to the present study and to the research team and staff for their assistance and support.
Conflicts of Interest
The authors declare no conflict of interest.
References
- Das, B. Assessment of ergonomic exposure, work-related occupational injuries, and prevention: Child work in the brickfield industry in India? Toxicol. Ind. Health 2021, 37, 481–495. [Google Scholar] [CrossRef] [PubMed]
- Wonghempoom, A.; Piriyaprasarth, P.; Charoenporn, N.; Pongpanit, K.; Kooncumchoo, P. Heart rate variability response in children working at height. Sci. Technol. Asia 2020, 25, 29–37. [Google Scholar]
- National Statistical Office (NSO). Thailand Working Children Survey 2018; National Statistical Office (NSO): Bangkok, Thailand, 2019; pp. 1–62. [Google Scholar]
- International Labour Organization. National Legislation on Hazardous Child Labour: Thailand; International Labour Organization: Bangkok, Thailand, 2014; pp. 1–15. [Google Scholar]
- Social Security Office of Thailand. Annual Report 2020 Workmen’s Compensation Fund; Ministry of Labour, Thailand: Nonthaburi, Thailand, 2020; pp. 1–149. [Google Scholar]
- Department of Labor Protection and Welfare Thailand. Child labour; Department of Labor Protection and Welfare: Bangkok, Thailand, 2021; pp. 1–31. [Google Scholar]
- Schlick, C.; Joachin, M.; Briceño, L.; Moraga, D.; Radon, K. Occupational injuries among children and adolescents in Cusco Province: A cross-sectional study. BMC Public Health 2014, 14, 766. [Google Scholar] [CrossRef] [Green Version]
- Min, S.-N.; Kim, J.-Y.; Parnianpour, M. The effects of safety handrails and the heights of scaffolds on the subjective and objective evaluation of postural stability and cardiovascular stress in novice and expert construction workers. Appl. Ergon. 2012, 43, 574–581. [Google Scholar] [CrossRef]
- Hsu, F.-W.; Lin, C.J.; Lee, Y.-H.; Chen, H.-J. Effects of elevation change on mental stress in high-voltage transmission tower construction workers. Appl. Ergon. 2016, 56, 101–107. [Google Scholar] [CrossRef] [PubMed]
- Min, S.-N.; Subramaniyam, M.; Park, S.-J.; Lee, K.-S. Development of the fall prevention index on the movable scaffold for construction workers. Work 2020, 65, 167–173. [Google Scholar] [CrossRef]
- Chuangchai, W.; Pothisiri, W.; Wonghempoom, A. Measuring effects of height on the autonomic nervous system in middle-aged adolescents using the very low frequency band of heart rate variability. Ergonomics 2022, 1–11. [Google Scholar] [CrossRef]
- Roggero, P.; Mangiaterra, V.; Bustreo, F.; Rosati, F. The health impact of child labor in developing countries: Evidence from cross-country data. Am. J. Public Health 2007, 97, 271–275. [Google Scholar] [CrossRef]
- Shendell, D.G.; Noomnual, S.; Chishti, S.; Allacci, M.S.; Madrigano, J. Exposures resulting in safety and health concerns for child laborers in less developed countries. J. Environ. Public Health 2016, 2016, 3985498. [Google Scholar] [CrossRef] [Green Version]
- Wuehr, M.; Breitkopf, K.; Decker, J.; Ibarra, G.; Huppert, D.; Brandt, T. Fear of heights in virtual reality saturates 20 to 40 m above ground. J. Neurol. 2019, 266, 80–87. [Google Scholar] [CrossRef]
- Muris, P. Chapter 1—Normal and abnormal fear and anxiety in children and adolescents. In Normal and Abnormal Fear and Anxiety in Children; Muris, P., Ed.; Elsevier: Burlington, MA, USA, 2007; pp. 1–30. [Google Scholar]
- Steimer, T. The biology of fear- and anxiety-related behaviors. Dialogues Clin. Neurosci. 2002, 4, 231. [Google Scholar] [CrossRef] [PubMed]
- Habibnezhad, M.; Puckett, J.; Fardhosseini, M.S.; Jebelli, H.; Stentz, T.; Pratama, L.A. Experiencing extreme height for the first time: The influence of height, self-judgment of fear and a moving structural beam on the heart rate and postural sway during the quiet stance. In Proceedings of the 36th International Symposium on Automation and Robotics in Construction (ISARC), Banff, AB, Canada, 21–24 May 2019; pp. 1065–1072. [Google Scholar]
- Charkoudian, N.; Rabbitts, J.A. Sympathetic neural mechanisms in human cardiovascular health and disease. Mayo Clin. Proc. 2009, 84, 822–830. [Google Scholar] [CrossRef] [PubMed] [Green Version]
- Batley, A.; Cerda, R.; Dyke, W.; Ho, C.; Moeller, A. The effect of sympathetic nervous system stimulation on skeletal muscle reflex response time. J. Adv. Stud. Sci. (JASS). 2018. Available online: http://digital.library.wisc.edu/1793/81971 (accessed on 15 March 2023).
- Cyma-Wejchenig, M.; Maciaszek, J.; Marciniak, K.; Stemplewski, R. The effects of cognitive task and change of height on postural stability and cardiovascular stress in workers working at height. Int. J. Environ. Res. Public Health 2020, 17, 6541. [Google Scholar] [CrossRef]
- Jain, A.; Bansal, R.; Kumar, A.; Singh, K.D. A comparative study of visual and auditory reaction times on the basis of gender and physical activity levels of medical first year students. Int. J. Appl. Basic Med. Res. 2015, 5, 124–127. [Google Scholar] [CrossRef] [PubMed] [Green Version]
- Bucsuházy, K.; Semela, M. Case study: Reaction time of children according to age. Procedia Eng. 2017, 187, 408–413. [Google Scholar] [CrossRef]
- Aylward, J.; Valton, V.; Goer, F.; Mkrtchian, A.; Lally, N.; Peters, S.; Limbachya, T.; Robinson, O.J. The impact of induced anxiety on affective response inhibition. R. Soc. Open Sci. 2017, 4, 170084. [Google Scholar] [CrossRef] [Green Version]
- Ajjimaporn, A.; Widjaja, W.; Chentanez, T. Stress level and simple reaction time changes in the injured workers of the industrial rehabilitation center, social security office, Ministry of labor, Thailand. J. Med. Health Sci. 2015, 22, 15–24. [Google Scholar]
- Zhang, B.; Morère, Y.; Sieler, L.; Langlet, C.; Bolmont, B.; Bourhis, G. Reaction time and physiological signals for stress recognition. Biomed. Signal Process. Control 2017, 38, 100–107. [Google Scholar] [CrossRef]
- Hsu, D.J.; Sun, Y.M.; Chuang, K.H.; Juang, Y.J.; Chang, F.L. Effect of elevation change on work fatigue and physiological symptoms for high-rise building construction workers. Saf. Sci. 2008, 46, 833–843. [Google Scholar] [CrossRef]
- Diemer, J.; Lohkamp, N.; Mühlberger, A.; Zwanzger, P. Fear and physiological arousal during a virtual height challenge—Effects in patients with acrophobia and healthy controls. J. Anxiety Disord. 2016, 37, 30–39. [Google Scholar] [CrossRef]
- Coelho, C.M.; Waters, A.M.; Hine, T.J.; Wallis, G. The use of virtual reality in acrophobia research and treatment. J. Anxiety Disord. 2009, 23, 563–574. [Google Scholar] [CrossRef] [PubMed]
- Rimer, E.; Husby, L.V.; Solem, S. Virtual reality exposure therapy for fear of heights: Clinicians’ attitudes become more positive after trying VRET. Front. Psychol. 2021, 12, 671871. [Google Scholar] [CrossRef] [PubMed]
- Bujang, M.A.; Baharum, N. Sample size guideline for correlation analysis. World J. Soc. Sci. Res. 2016, 3, 37–46. [Google Scholar] [CrossRef]
- Carlson, D.J.; Dieberg, G.; McFarlane, J.R.; Smart, N.A. Blood pressure measurements in research: Suitability of auscultatory, beat-to-beat, and ambulatory blood pressure measurements. Blood Press. Monit. 2019, 24, 18–23. [Google Scholar] [CrossRef]
- Stergiou, G.S.; Palatini, P.; Parati, G.; O’Brien, E.; Januszewicz, A.; Lurbe, E.; Persu, A.; Mancia, G.; Kreutz, R. 2021 European Society of Hypertension practice guidelines for office and out-of-office blood pressure measurement. J. Hypertens. 2021, 39, 1293–1302. [Google Scholar] [CrossRef]
- Muntner, P.; Shimbo, D.; Carey, R.M.; Charleston, J.B.; Gaillard, T.; Misra, S.; Myers, M.G.; Ogedegbe, G.; Schwartz, J.E.; Townsend, R.R.; et al. Measurement of blood pressure in humans: A scientific statement from the American Heart Association. Hypertension 2019, 73, e35–e66. [Google Scholar] [CrossRef]
- Zeniodi, M.E.; Ntineri, A.; Kollias, A.; Servos, G.; Moyssakis, I.; Destounis, A.; Harokopakis, A.; Vazeou, A.; Stergiou, G.S. Home and ambulatory blood pressure monitoring in children, adolescents and young adults: Comparison, diagnostic agreement and association with preclinical organ damage. J. Hypertens. 2020, 38, 1047–1055. [Google Scholar] [CrossRef]
- Clerkin, E.M.; Cody, M.W.; Stefanucci, J.K.; Proffitt, D.R.; Teachman, B.A. Imagery and fear influence height perception. J. Anxiety Disord. 2009, 23, 381–386. [Google Scholar] [CrossRef] [Green Version]
- DeMers, D.; Wachs, D. Physiology, Mean Arterial Pressure. In StatPearls; StatPearls Publishing: Tampa/St. Petersburg, FL, USA, 2020. [Google Scholar]
- Fritz, C.O.; Morris, P.E.; Richler, J.J. Effect size estimates: Current use, calculations, and interpretation. J. Exp. Psychol. Gen. 2012, 141, 2–18. [Google Scholar] [CrossRef] [Green Version]
- Cote, L.R.; Gordon, R.; Randell, C.E.; Schmitt, J.; Marvin, H. Introduction to Statistics in the Psychological Sciences; University of Missouri: St. Louis, MO, USA, 2021; p. 265. [Google Scholar]
- Östberg, V.; Almquist, Y.B.; Folkesson, L.; Låftman, S.B.; Modin, B.; Lindfors, P. The complexity of stress in mid-adolescent girls and boys. Child Indic. Res. 2015, 8, 403–423. [Google Scholar] [CrossRef]
- Cowley, E.S.; Watson, P.M.; Foweather, L.; Belton, S.; Thompson, A.; Thijssen, D.; Wagenmakers, A.J.M. “Girls aren’t meant to exercise”: Perceived influences on physical activity among adolescent girls—The HERizon project. Children 2021, 8, 31. [Google Scholar] [CrossRef] [PubMed]
- Looze, M.D.; Elgar, F.J.; Currie, C.; Kolip, P.; Stevens, G.W.J.M. Gender inequality and sex differences in physical fighting, physical activity, and injury among adolescents across 36 countries. J. Adolesc. Health 2019, 64, 657–663. [Google Scholar] [CrossRef] [Green Version]
- McLean, C.P.; Anderson, E.R. Brave men and timid women? A review of the gender differences in fear and anxiety. Clin. Psychol. Rev. 2009, 29, 496–505. [Google Scholar] [CrossRef] [PubMed]
- Brody, L.R.; Lovas, G.S.; Hay, D.H. Gender differences in anger and fear as a function of situational context. Sex Roles 1995, 32, 47–78. [Google Scholar] [CrossRef]
- Christofaro, D.G.D.; Casonatto, J.; Vanderlei, L.C.M.; Cucato, G.G.; Dias, R.M.R. Relationship between resting heart rate, blood pressure and pulse pressure in adolescents. Arq. Bras. Cardiol. 2017, 108, 405–410. [Google Scholar] [CrossRef]
- Liu, L.; Mizushima, S.; Ikeda, K.; Nara, Y.; Yamori, Y. Resting heart rate in relation to blood pressure: Results from the world health organization—Cardiovascular disease and alimentary comparison study. Int. J. Cardiol. 2010, 145, 73–74. [Google Scholar] [CrossRef]
- Hyde, J.; Ryan, K.M.; Waters, A.M. Psychophysiological markers of fear and anxiety. Curr. Psychiatry Rep. 2019, 21, 56. [Google Scholar] [CrossRef]
Figure 1.
Scatterplots with a positive correlation between fear and anxiety. A positive correlation scatterplot of all teenagers (a). A positive correlation scatterplot of male teenagers (b). A positive correlation scatterplot of female teenagers (c).
Figure 1.
Scatterplots with a positive correlation between fear and anxiety. A positive correlation scatterplot of all teenagers (a). A positive correlation scatterplot of male teenagers (b). A positive correlation scatterplot of female teenagers (c).


Table 1.
Summary of data obtained at all levels and comparison results between male and female teenagers.
Table 1.
Summary of data obtained at all levels and comparison results between male and female teenagers.
| Variable (Unit) | All Teenagers (N = 60) | Male Teenagers (n = 30) | Female Teenagers (n = 30) | p Value | r2 |
|---|---|---|---|---|---|
| Objective index | |||||
| Heart rate (bpm) | 87 (77, 95) | 78 (72, 87) | 93 (87, 100) | <0.001 * | 3.25 |
| MAP (mmHg) | 86.33 (81, 93.33) | 90 (85, 95.67) | 83.33 (78.33, 88) | <0.001 * | 1.62 |
| Reaction time (ms) | 341.60 (309.80, 374.55) | 327.90 (302.10, 367.60) | 350.70 (320.30, 382.95) | <0.001 * | 0.45 |
| Subjective index | |||||
| Fear (score) | 0 (0, 20) | 0 (0, 1) | 0 (0, 26.25) | 0.428 | 0.01 |
| Anxiety (score) | 0 (0, 20) | 0 (0, 16.25) | 0 (0, 20) | 0.470 | 0.01 |
Note: Results are reported as medians (interquartile range 25th, 75th percentile). Symbol * denotes significance level at p < 0.05.
Table 2.
Descriptive statistics for all teenagers and comparison results between zero and other levels.
Table 2.
Descriptive statistics for all teenagers and comparison results between zero and other levels.
| Level | Objective Index | Subjective Index | |||||||||||||
|---|---|---|---|---|---|---|---|---|---|---|---|---|---|---|---|
| Heart Rate | p Value | r2 | MAP | p Value | r2 | Reaction Time | p Value | r2 | Fear | p Value | r2 | Anxiety | p Value | r2 | |
| 0 | 86.50 (74, 95.50) | - | - | 86.33 (81, 95.75) | - | - | 349.80 (322.40, 375.95) | - | - | 0 (0, 31.50) | - | - | 3.50 (0, 28.75) | - | - |
| 1 | 84 (76.50, 94) | 0.749 | 0.02 | 87.50 (82.83, 96.50) | 0.865 | 0 | 344.50 (312, 375) | 0.287 | 0 | 0 (0, 1.75) | <0.001 *,#,† | 0 | 0 (0, 2) | <0.001 *,#,† | 0 |
| 2 | 86.50 (77.25, 95) | 0.194 | 0.07 | 88.17 (81.08, 93.58) | 0.640 | 0 | 344.50 (310.10, 405.95) | 0.375 | 0 | 0 (0, 2) | 0.007 *,† | 0 | 0 (0, 5) | 0.007 * | 0 |
| 3 | 87 (75.75, 95.75) | 0.179 | 0.15 | 86 (81.17, 93.33) | 0.824 | 0 | 342.50 (310.70, 371.70) | 0.046 *,# | 0 | 0 (0, 5) | 0.008 *,† | 0 | 0 (0, 10) | 0.011 *,† | 0 |
| 4 | 86 (76.25, 92) | 0.858 | 0.27 | 86 (77.83, 94.33) | 0.589 | 0 | 343.60 (314.85, 375.20) | 0.230 | 0 | 0 (0, 8.75) | 0.009 *,† | 0 | 0 (0, 10) | 0.005 *,#,† | 0 |
| 5 | 86 (75.75, 96.50) | 0.113 | 0.42 | 86.17 (83, 91.92) | 0.561 | 0 | 344.70 (308.15, 381.50) | 0.375 | 0 | 0 (0, 10) | 0.083 † | 0 | 1 (0, 13.75) | 0.055 | 0 |
| 6 | 86.50 (78, 94) | 0.059 | 0.60 | 85.17 (80.83, 91.25) | 0.502 | 0 | 330.80 (307.55, 382.15) | 0.144 | 0.01 | 0 (0, 18.75) | 0.144 | 0 | 0 (0, 18.75) | 0.131 | 0 |
| 7 | 86.50 (76.25, 94) | 0.502 | 0.82 | 85.50 (80.42, 94.42) | 0.588 | 0 | 336.70 (305.40, 364.45) | 0.026 * | 0.01 | 0 (0, 20) | 0.194 | 0 | 1.25 (0, 18.75) | 0.140 | 0 |
| 8 | 87.50 (78.50, 97) | 0.027 * | 1.07 | 86.50 (81.25, 92.83) | 0.568 | 0 | 329 (306.60, 359.90) | 0.024 *,† | 0.02 | 0 (0, 20) | 0.251 | 0 | 0 (0, 15) | 0.117 | 0 |
| 9 | 88.50 (81.25, 97.75) | 0.015 * | 1.35 | 85.67 (81.33, 93.50) | 0.528 | 0 | 337.50 (309.15, 372.75) | 0.395 | 0.03 | 5 (0, 25) | 0.803 | 0 | 4 (0, 25) | 0.732 | 0 |
| 10 | 88 (78, 98) | 0.035 *,# | 1.67 | 87.17 (80.75, 94.67) | 0.919 | 0 | 341.80 (306.40, 382.90) | 0.383 # | 0.05 | 4 (0, 30) | 0.827 | 0 | 2.50 (0, 30) | 0.984 | 0 |
Note: Results are reported as medians (interquartile range 25th, 75th percentile) with p values and effect sizes for all teenagers. Symbols *, #, and † denote significance level at p < 0.05 for all teenagers, male teenagers, and female teenagers, respectively.
Table 3.
Objective indexes’ descriptive statistics and comparison results by sex at different levels.
Table 3.
Objective indexes’ descriptive statistics and comparison results by sex at different levels.
| Level | Heart Rate | MAP | Reaction Time | |||||||||
|---|---|---|---|---|---|---|---|---|---|---|---|---|
| Male Teenagers | Female Teenagers | p Value | r2 | Male Teenagers | Female Teenagers | p Value | r2 | Male Teenagers | Female Teenagers | p Value | r2 | |
| 0 | 74.50 (68.75, 88) | 88.50 (86, 101) | <0.001 * | 0.28 | 89.50 (83.75, 97.58) | 83.67 (79.25, 90.83) | 0.029 * | 0.08 | 344.20 (320.65, 375.50) | 357.60 (323.40, 382.95) | 0.569 | 0.01 |
| 1 | 78.50 (69.75, 84) | 93 (84, 98.50) | <0.001 * | 0.33 | 91.67 (87.50, 98.08) | 84.17 (77.67, 87.58) | <0.001 * | 0.21 | 338.40 (299, 360.65) | 354.50 (317.80, 386) | 0.045 * | 0.07 |
| 2 | 77.50 (71.50, 87) | 95 (86.75, 102.50) | <0.001 * | 0.39 | 90.50 (87.83, 97.33) | 82.83 (78.33, 89.67) | 0.001 * | 0.19 | 328.70 (303.55, 402.80) | 353 (316.50, 411.95) | 0.535 | 0.01 |
| 3 | 81 (70, 87.50) | 95 (86.75, 98.25) | <0.001 * | 0.32 | 89.17 (84, 94.08) | 84.33 (79.58, 90.25) | 0.044 * | 0.07 | 314.20 (299.85, 359.40) | 351 (329.35, 376.30) | 0.012 * | 0.11 |
| 4 | 77.50 (70, 87.50) | 89.50 (84.75, 99.25) | <0.001 * | 0.23 | 87.83 (83, 95.58) | 82.67 (75.50, 90.50) | 0.025 * | 0.08 | 326.40 (301.55, 368) | 350.60 (330.90, 382.85) | 0.095 | 0.05 |
| 5 | 78 (72.50, 86.25) | 95 (85.50, 101) | <0.001 * | 0.35 | 88.50 (85.67, 94.17) | 83.50 (79.58, 87.67) | 0.001 * | 0.20 | 324.70 (302.40, 359.20) | 356.30 (337.85, 390.80) | 0.043 * | 0.07 |
| 6 | 78.50 (75, 86.25) | 92 (87.25, 100) | <0.001 * | 0.33 | 90.50 (83.58, 93.83) | 83.17 (77.92, 85.92) | <0.001 * | 0.24 | 316.60 (297, 378.55) | 341.20 (320.25, 385.25) | 0.032 * | 0.08 |
| 7 | 77.50 (72.75, 90) | 92.50 (85.75, 97.50) | <0.001 * | 0.27 | 90.67 (84.25, 97.25) | 81.33 (75.92, 86.08) | <0.001 * | 0.24 | 331.60 (298.90, 368.55) | 338.30 (319.30, 364.80) | 0.191 | 0.03 |
| 8 | 82 (72.75, 87) | 94.50 (87.75, 103.50) | <0.001 * | 0.32 | 90.17 (83.75, 94.42) | 83 (78.58, 86.83) | 0.002 * | 0.16 | 320.50 (305.30, 364.50) | 334.70 (307, 357.65) | 0.631 | 0 |
| 9 | 82 (73.75, 89.50) | 94 (88, 100.50) | <0.001 * | 0.32 | 90.83 (84.42, 96.75) | 82.83 (78.58, 87) | 0.001 * | 0.18 | 335.70 (297.25, 370.95) | 346.20 (314.85, 378.40) | 0.133 | 0.04 |
| 10 | 80 (74.75, 90.75) | 94 (87, 104) | 0.002 * | 0.17 | 89.50 (84.58, 95.75) | 84.33 (78.17, 91) | 0.036 * | 0.07 | 325.50 (290.85, 362.20) | 359.90 (319.55, 395.40) | 0.015 * | 0.10 |
Note: Results are reported as medians (interquartile range 25th, 75th percentile). Symbol * denotes significance level at p <0.05.
Table 4.
Subjective indexes’ descriptive statistics and comparison results by sex at different levels.
Table 4.
Subjective indexes’ descriptive statistics and comparison results by sex at different levels.
| Level | Fear | Anxiety | ||||||
|---|---|---|---|---|---|---|---|---|
| Male Teenagers | Female Teenagers | p Value | r2 | Male Teenagers | Female Teenagers | p Value | r2 | |
| 0 | 0 (0, 25) | 10 (0, 34) | 0.097 | 0.05 | 3.50 (0, 21.25) | 2.50 (0, 31.25) | 0.969 | 0 |
| 1 | 0 (0, 0.25) | 0 (0, 10) | 0.518 | 0.01 | 0 (0, 4) | 0 (0, 1.25) | 0.621 | 0 |
| 2 | 0 (0, 4) | 0 (0, 2.50) | 0.635 | 0 | 0 (0, 10) | 0 (0, 1.25) | 0.357 | 0.01 |
| 3 | 0 (0, 4) | 0 (0, 6.25) | 0.842 | 0 | 0 (0, 12.50) | 0 (0, 12.50) | 0.473 | 0.01 |
| 4 | 0 (0, 10) | 0 (0, 6.25) | 0.973 | 0 | 0.05 (0, 10) | 0 (0, 6.25) | 0.423 | 0.01 |
| 5 | 1.50 (0, 10) | 0 (0, 15) | 0.588 | 0 | 1.50 (0, 11.25) | 0 (0, 20) | 0.626 | 0 |
| 6 | 0 (0, 15) | 0 (0, 30) | 0.917 | 0 | 1 (0, 16.25) | 0 (0, 22.50) | 0.861 | 0 |
| 7 | 1.50 (0, 20) | 0 (0, 30) | 0.879 | 0 | 2 (0, 16.25) | 0.25 (0, 22.50) | 0.820 | 0 |
| 8 | 1.50 (0, 20) | 0 (0, 16.25) | 0.653 | 0 | 1.50 (0, 20) | 0 (0, 11.25) | 0.823 | 0 |
| 9 | 5 (0, 21.23) | 5 (0, 30) | 0.765 | 0 | 3 (0, 21.25) | 5 (0, 31.25) | 0.653 | 0 |
| 10 | 2 (0, 21.25) | 6.50 (0, 30) | 0.411 | 0.01 | 0.50 (0, 21.25) | 7 (0, 36.25) | 0.422 | 0.01 |
Note: Results are reported as medians (interquartile range 25th, 75th percentile).
Table 5.
Nonparametric partial correlations among objective indexes across all groups.
| Variable (Unit) | All Teenagers a | Male Teenagers b | Female Teenagers b | |||
|---|---|---|---|---|---|---|
| r | p Value | r | p Value | r | p Value | |
| Heart rate (bpm) and MAP (mmHg) | 0.31 | <0.001 * | 0.37 | <0.001 * | 0.27 | <0.001 * |
| MAP (mmHg) and reaction time (ms) | −0.12 | 0.002 * | −0.05 | 0.371 | −0.14 | 0.012 * |
| reaction time (ms) and heart rate (bpm) | −0.09 | 0.023 * | −0.02 | 0.727 | −0.20 | <0.001 * |
Note: Characters a and b indicate partial correlation results with level and sex adjusted and with level adjusted, respectively. Symbol * denotes significance level at p <0.05.
Table 6.
Nonparametric partial correlations between objective and subjective indexes for all teenagers, male teenagers, and female teenagers.
Table 6.
Nonparametric partial correlations between objective and subjective indexes for all teenagers, male teenagers, and female teenagers.
| Variable (Unit) | All Teenagers a | Male Teenagers b | Female Teenagers b | |||
|---|---|---|---|---|---|---|
| r | p Value | r | p Value | r | p Value | |
| Heart rate (bpm) | ||||||
| Fear (score) | 0.24 | <0.001 * | 0.28 | <0.001 * | 0.22 | <0.001 * |
| Anxiety (score) | 0.25 | <0.001 * | 0.30 | <0.001 * | 0.24 | <0.001 * |
| MAP (mmHg) | ||||||
| Fear (score) | 0.04 | 0.261 | −0.03 | 0.580 | 0.13 | 0.015 * |
| Anxiety (score) | 0.07 | 0.092 | 0 | 0.949 | 0.14 | 0.012 * |
| Reaction time (ms) | ||||||
| Fear (score) | 0.01 | 0.766 | 0.09 | 0.095 | −0.09 | 0.121 |
| Anxiety (score) | −0.01 | 0.760 | 0.04 | 0.516 | −0.09 | 0.120 |
Note: Characters a and b indicate partial correlation results with level and sex adjusted and with level adjusted, respectively. Symbol * denotes significance level at p <0.05.
Disclaimer/Publisher’s Note: The statements, opinions and data contained in all publications are solely those of the individual author(s) and contributor(s) and not of MDPI and/or the editor(s). MDPI and/or the editor(s) disclaim responsibility for any injury to people or property resulting from any ideas, methods, instructions or products referred to in the content. |
© 2023 by the authors. Licensee MDPI, Basel, Switzerland. This article is an open access article distributed under the terms and conditions of the Creative Commons Attribution (CC BY) license (https://creativecommons.org/licenses/by/4.0/).
Share and Cite
MDPI and ACS Style
Wonghempoom, A.; Chuangchai, W.; Selanon, P. Physiological Stress Responses to Fear and Anxiety in a Height Change Experiment among Non-Labor Teenagers. Safety 2023, 9, 19. https://doi.org/10.3390/safety9020019
AMA Style
Wonghempoom A, Chuangchai W, Selanon P. Physiological Stress Responses to Fear and Anxiety in a Height Change Experiment among Non-Labor Teenagers. Safety. 2023; 9(2):19. https://doi.org/10.3390/safety9020019
Chicago/Turabian StyleWonghempoom, Apiruck, Warawoot Chuangchai, and Pattamon Selanon. 2023. "Physiological Stress Responses to Fear and Anxiety in a Height Change Experiment among Non-Labor Teenagers" Safety 9, no. 2: 19. https://doi.org/10.3390/safety9020019
Note that from the first issue of 2016, this journal uses article numbers instead of page numbers. See further details here.