

Assessing Feasibility of Cognitive Impairment Testing Using Social Robotic Technology Augmented with Affective Computing and Emotional State Detection Systems

 , , , , ,
  , , , , and
Abstract
:
1. Introduction
Objectives and Research Questions
2. Materials and Methods
2.1. Experimental Protocol
- At first, we verified that each participant agreed to take part in the study by signing the informed consent for interacting with the Pepper robot and for video recording. A psychologist explained the purpose of the study and introduced the Pepper robot. The psychologist ensured that the patient met the inclusion criteria. As per the approved clinical protocol, patients underwent a set of questionnaires aimed at assessing various dimensions that could arise from their interaction with the Pepper robot in the context of the robotic MMSE administration scenario. The tests included the Activity of Daily Living (ADL) [31], Instrumental Activity of Daily Living (IADL) scale [32], Mini-Mental State Examination (MMSE) [21,22], Exton–Smith Scale (ESS) [33], Mini Nutritional Assessment (MNA) [34], Short Portable Mental Status Questionnaire (SPMSQ) [35], and Cumulative Illness Rating Scale Comorbidity Index (CIRS-CI) [36]. These tests were used to compute the Multidimensional Prognostic Index (MPI) [37], whose values range from 0 to 1, with the following risk classification scale:
- 1.
- 0 to 0.33 low prognostic mortality risk at 1 year (MPI-1);
- 2.
- 0.34 to 0.66 moderate risk (MPI-2);
- 3.
- 0.67 to 1.00 severe risk (MPI-3).
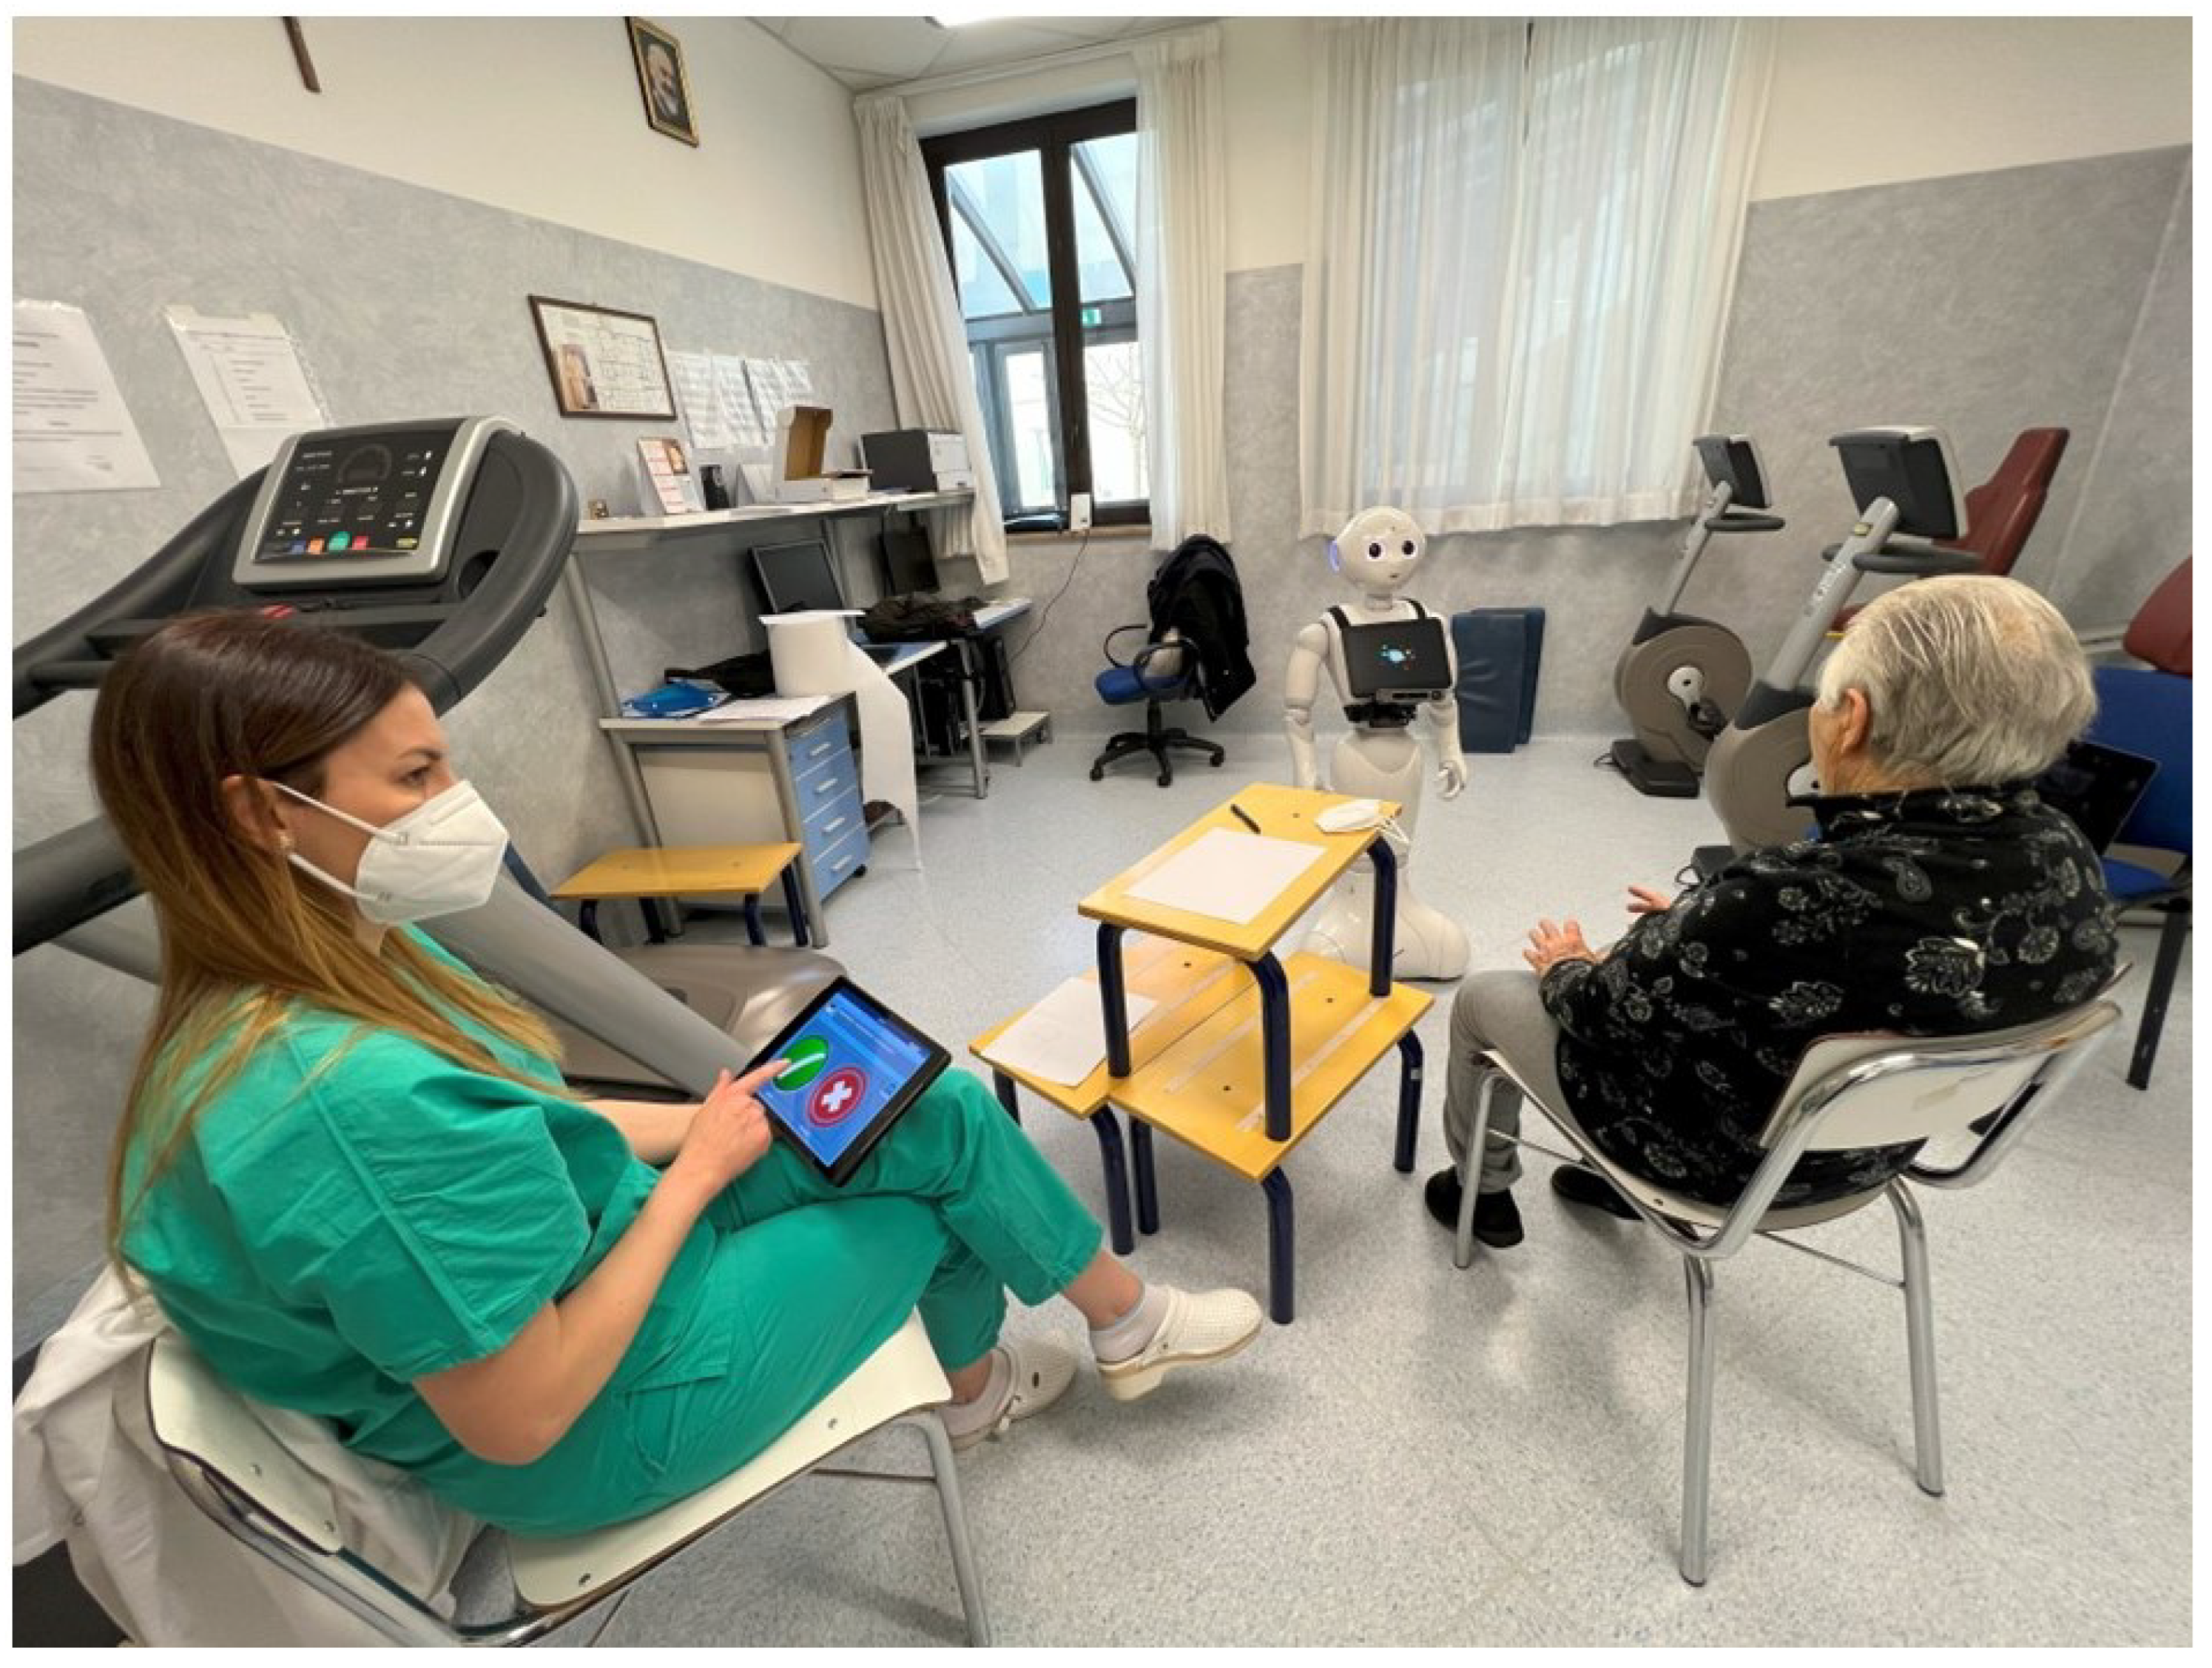
- Then, on a different day from the one on which the administration of the tests took place and in accordance with the needs of the clinical ward, each patient was introduced to the robot. Each participant was led into the room designated for the experiment. Patients with motor difficulties were assisted in reaching the setting in a wheelchair. The psychologist made the participant comfortable. The dialogue then continued with the administration of the MMSE test by the robot.
- The interaction with the robot was evaluated by administering 5 different tests to each participant at the end of the session. The tests were:
- Simplify the use of robots by clinicians, therapists, and educators;
- Realize an easy and intuitive platform for human–machine interactions;
- Handle e-learning content and “edutainment”;
- Manage the delivery of content to the user;
- Track and store results of the executed sessions and patient data;
- Generate reports and statistics on the results of the executed sessions.
- Remotely control the movements and voice of the robot;
- Trigger predefined animations, games, and questions;
- Record answers;
- Tele-present a session using a mic and camera (Telepresence), in Figure 2, on the left;
- Manage patient data (sociodemographic, clinical data, and test session information), in Figure 2, on the right.
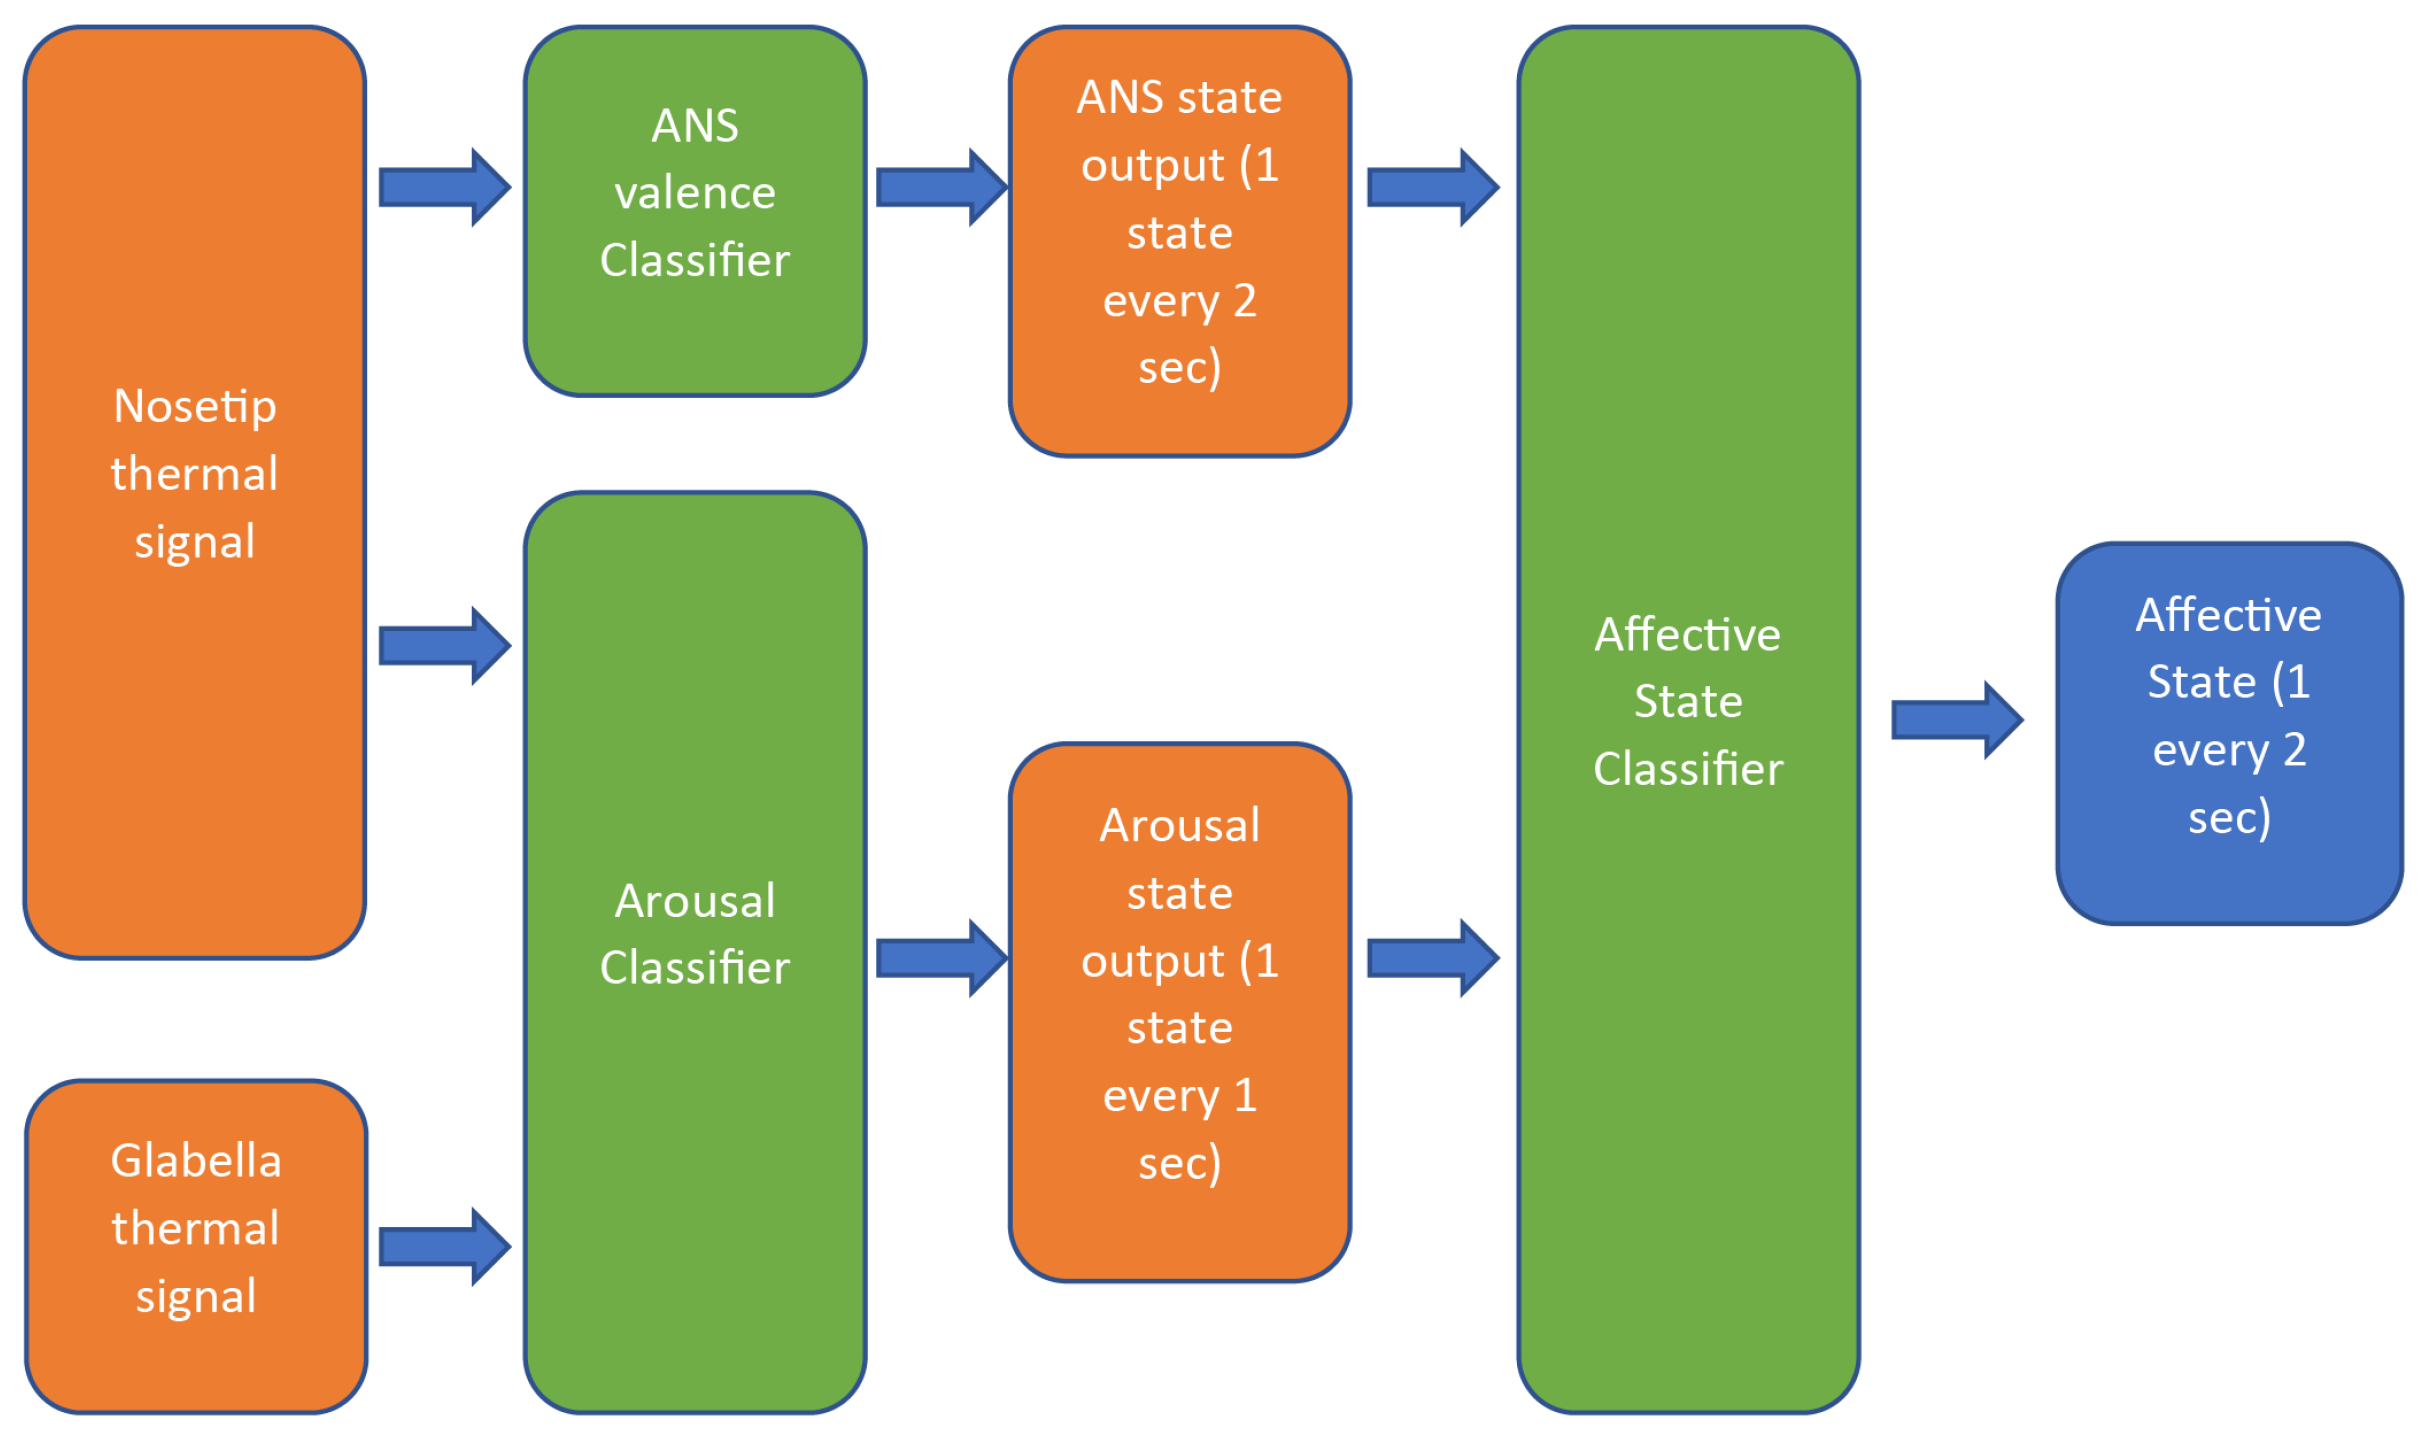
- 1.
- X-Axis (Horizontal): This axis represents the degree of activation or intensity of an emotion or trait. Emotions and traits can vary from low activation (calm, relaxed) to high activation (excited, anxious).
- 2.
- Y-Axis (Vertical): This axis represents the valence or emotional tone of the emotion or trait. Emotions and traits can vary from positive valence (pleasant, happy) to negative valence (unpleasant, sad).
- Signal mean from the 1st third of the window;
- Signal mean from the last third of the window;
- Difference between the mean of the 1st and 2nd thirds of the window;
- Signal entropy;
- Ratio of the 95th percentile to the 5th percentile;
- First-order polynomial fit coefficients of the fit curve over the 2nd and 3rd thirds of the window;
- Second-order polynomial fit coefficients of the fit curve over the window;
- Ratio between the spectral power of the signal in the bands 0.04 Hz–0.15 Hz and 0.15 Hz–0.4 Hz.
- High arousal—positive valence (excited state);
- High arousal—negative valence (tense state);
- Medium arousal—positive valence (focused state);
- Medium arousal—negative valence (cautious state);
- Low arousal—positive valence (calm state);
- Low arousal—negative valence (bored state).
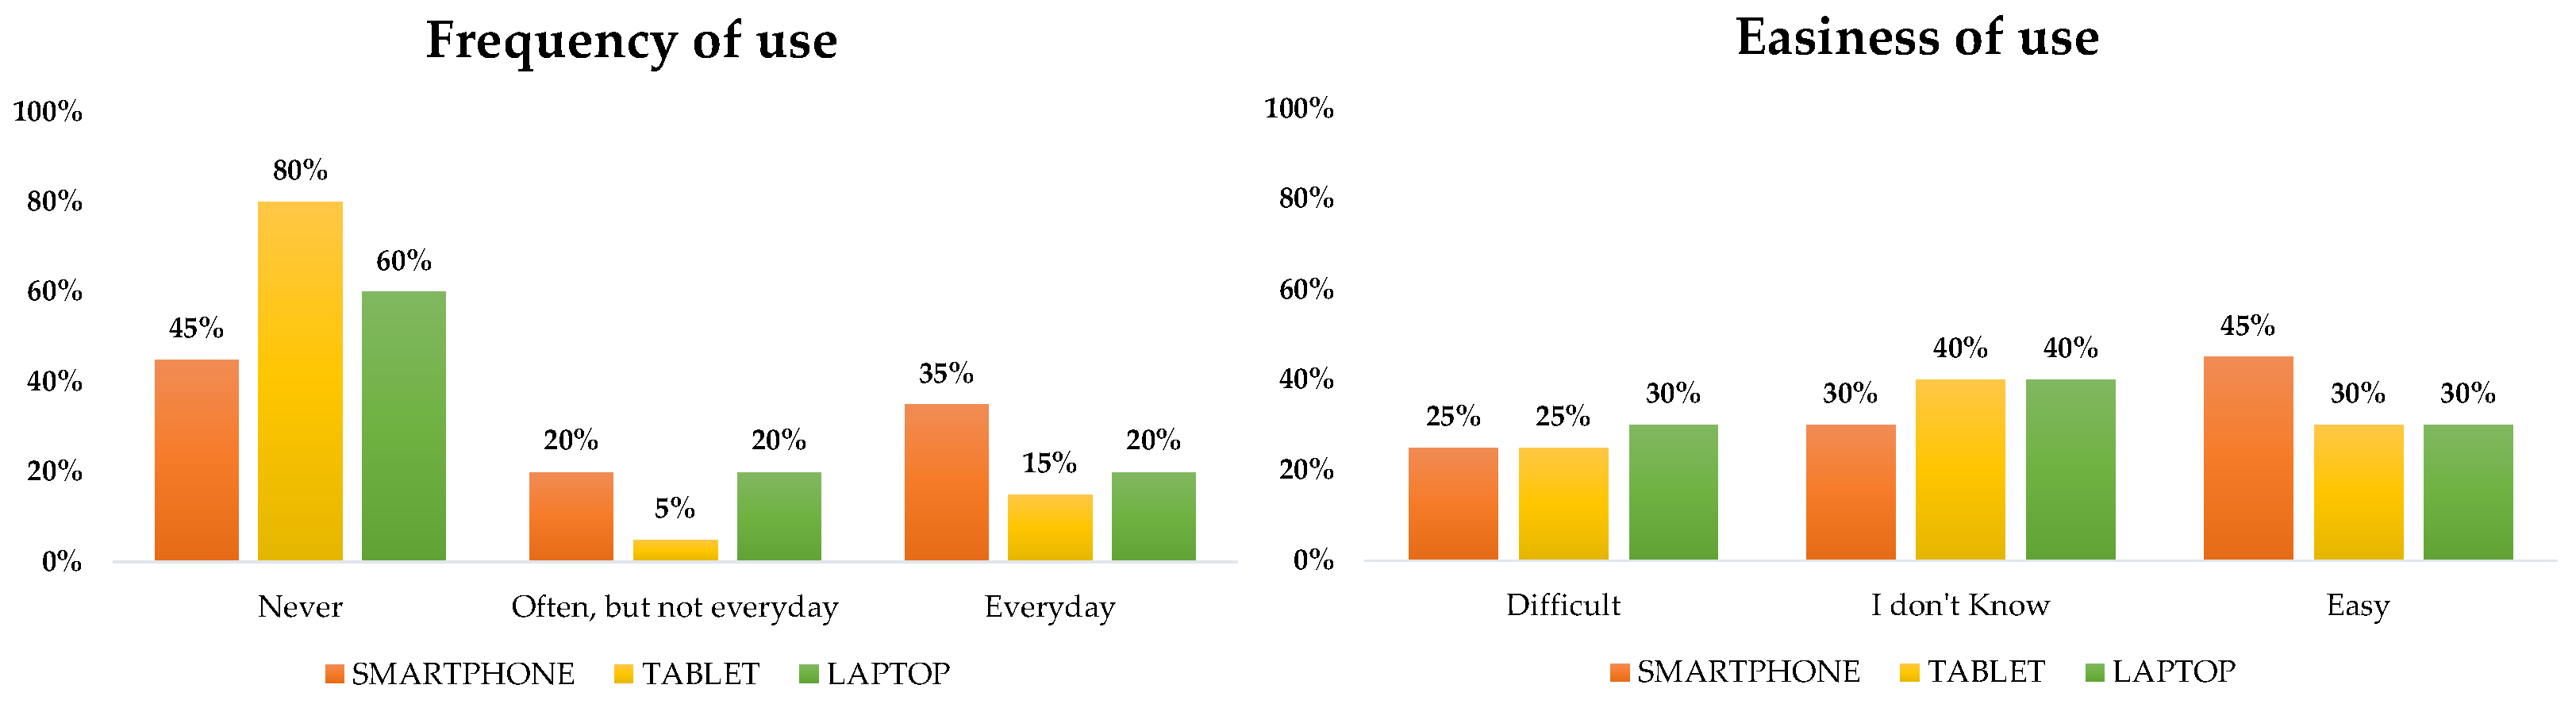
2.2. Descriptive Data Analysis for Usability Test Score
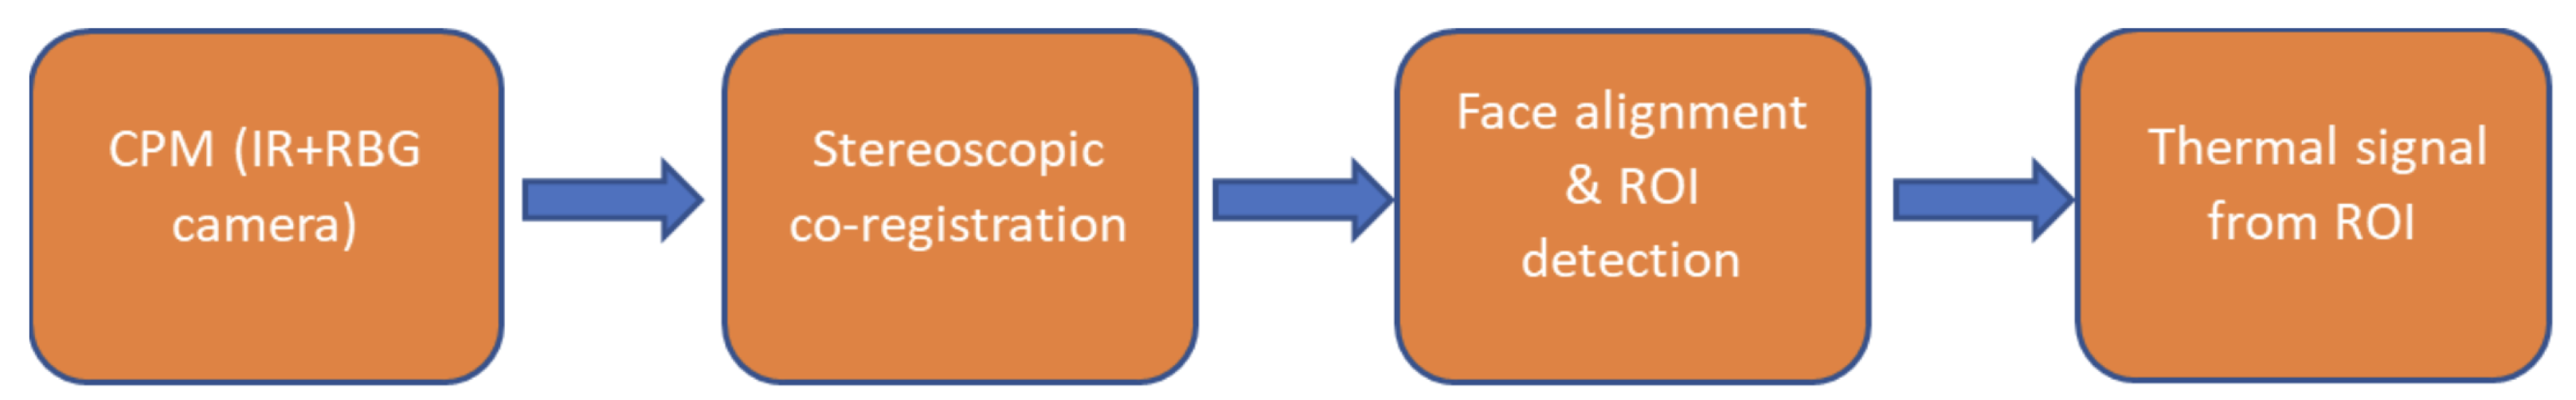
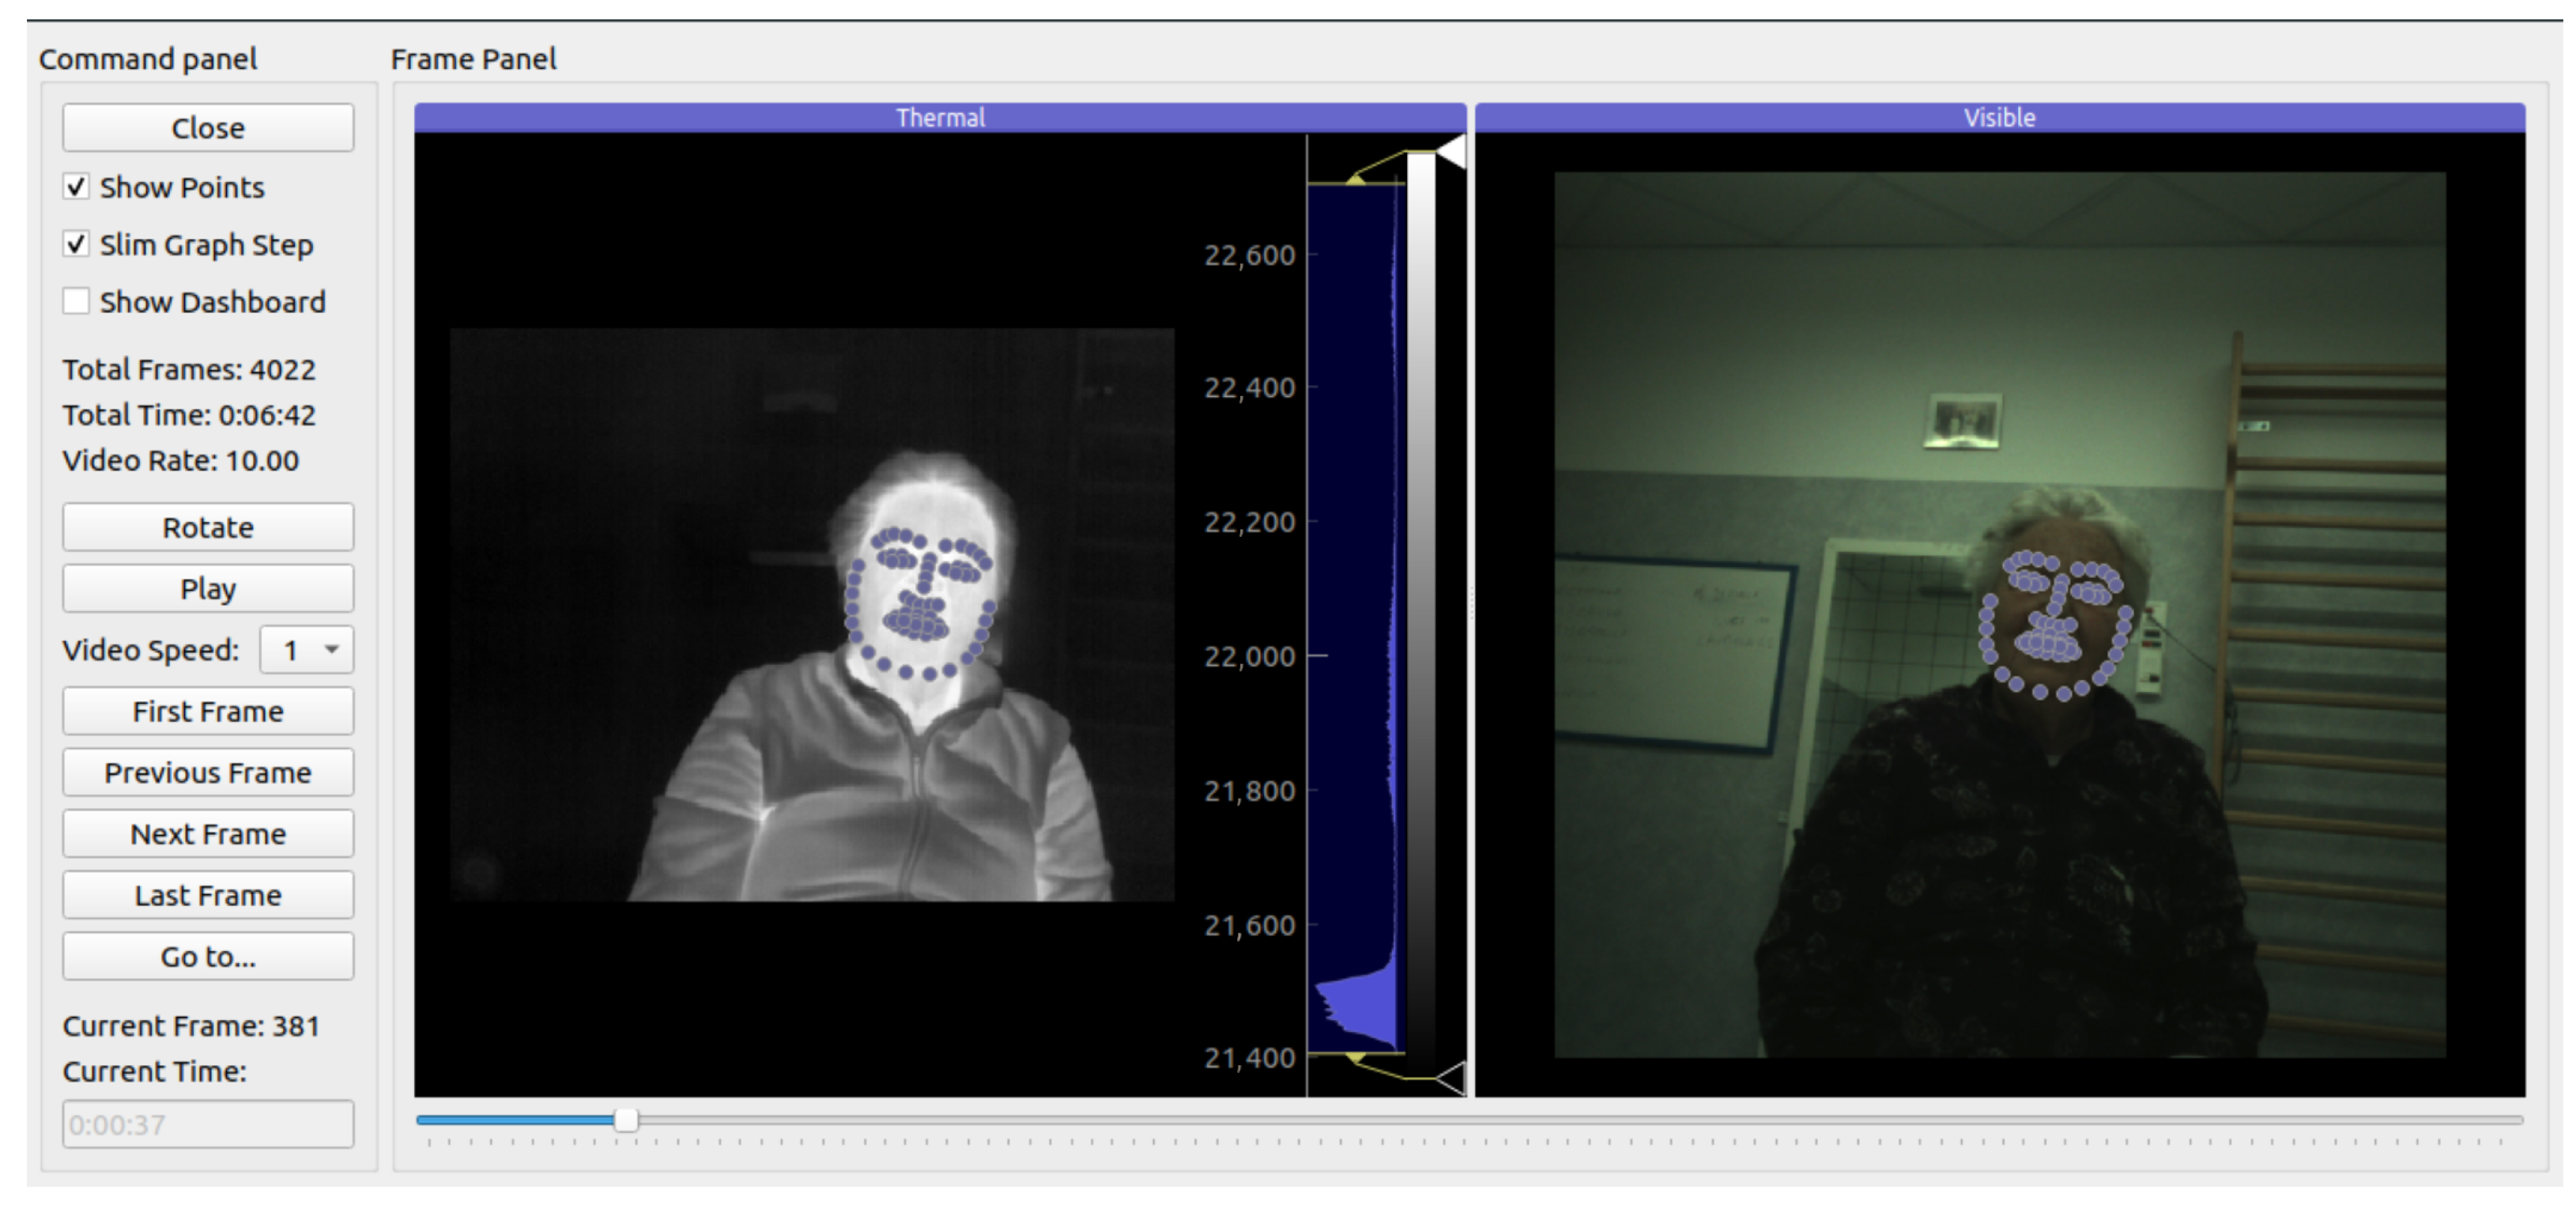
2.3. Data Analysis Processing for the CPM
3. Results
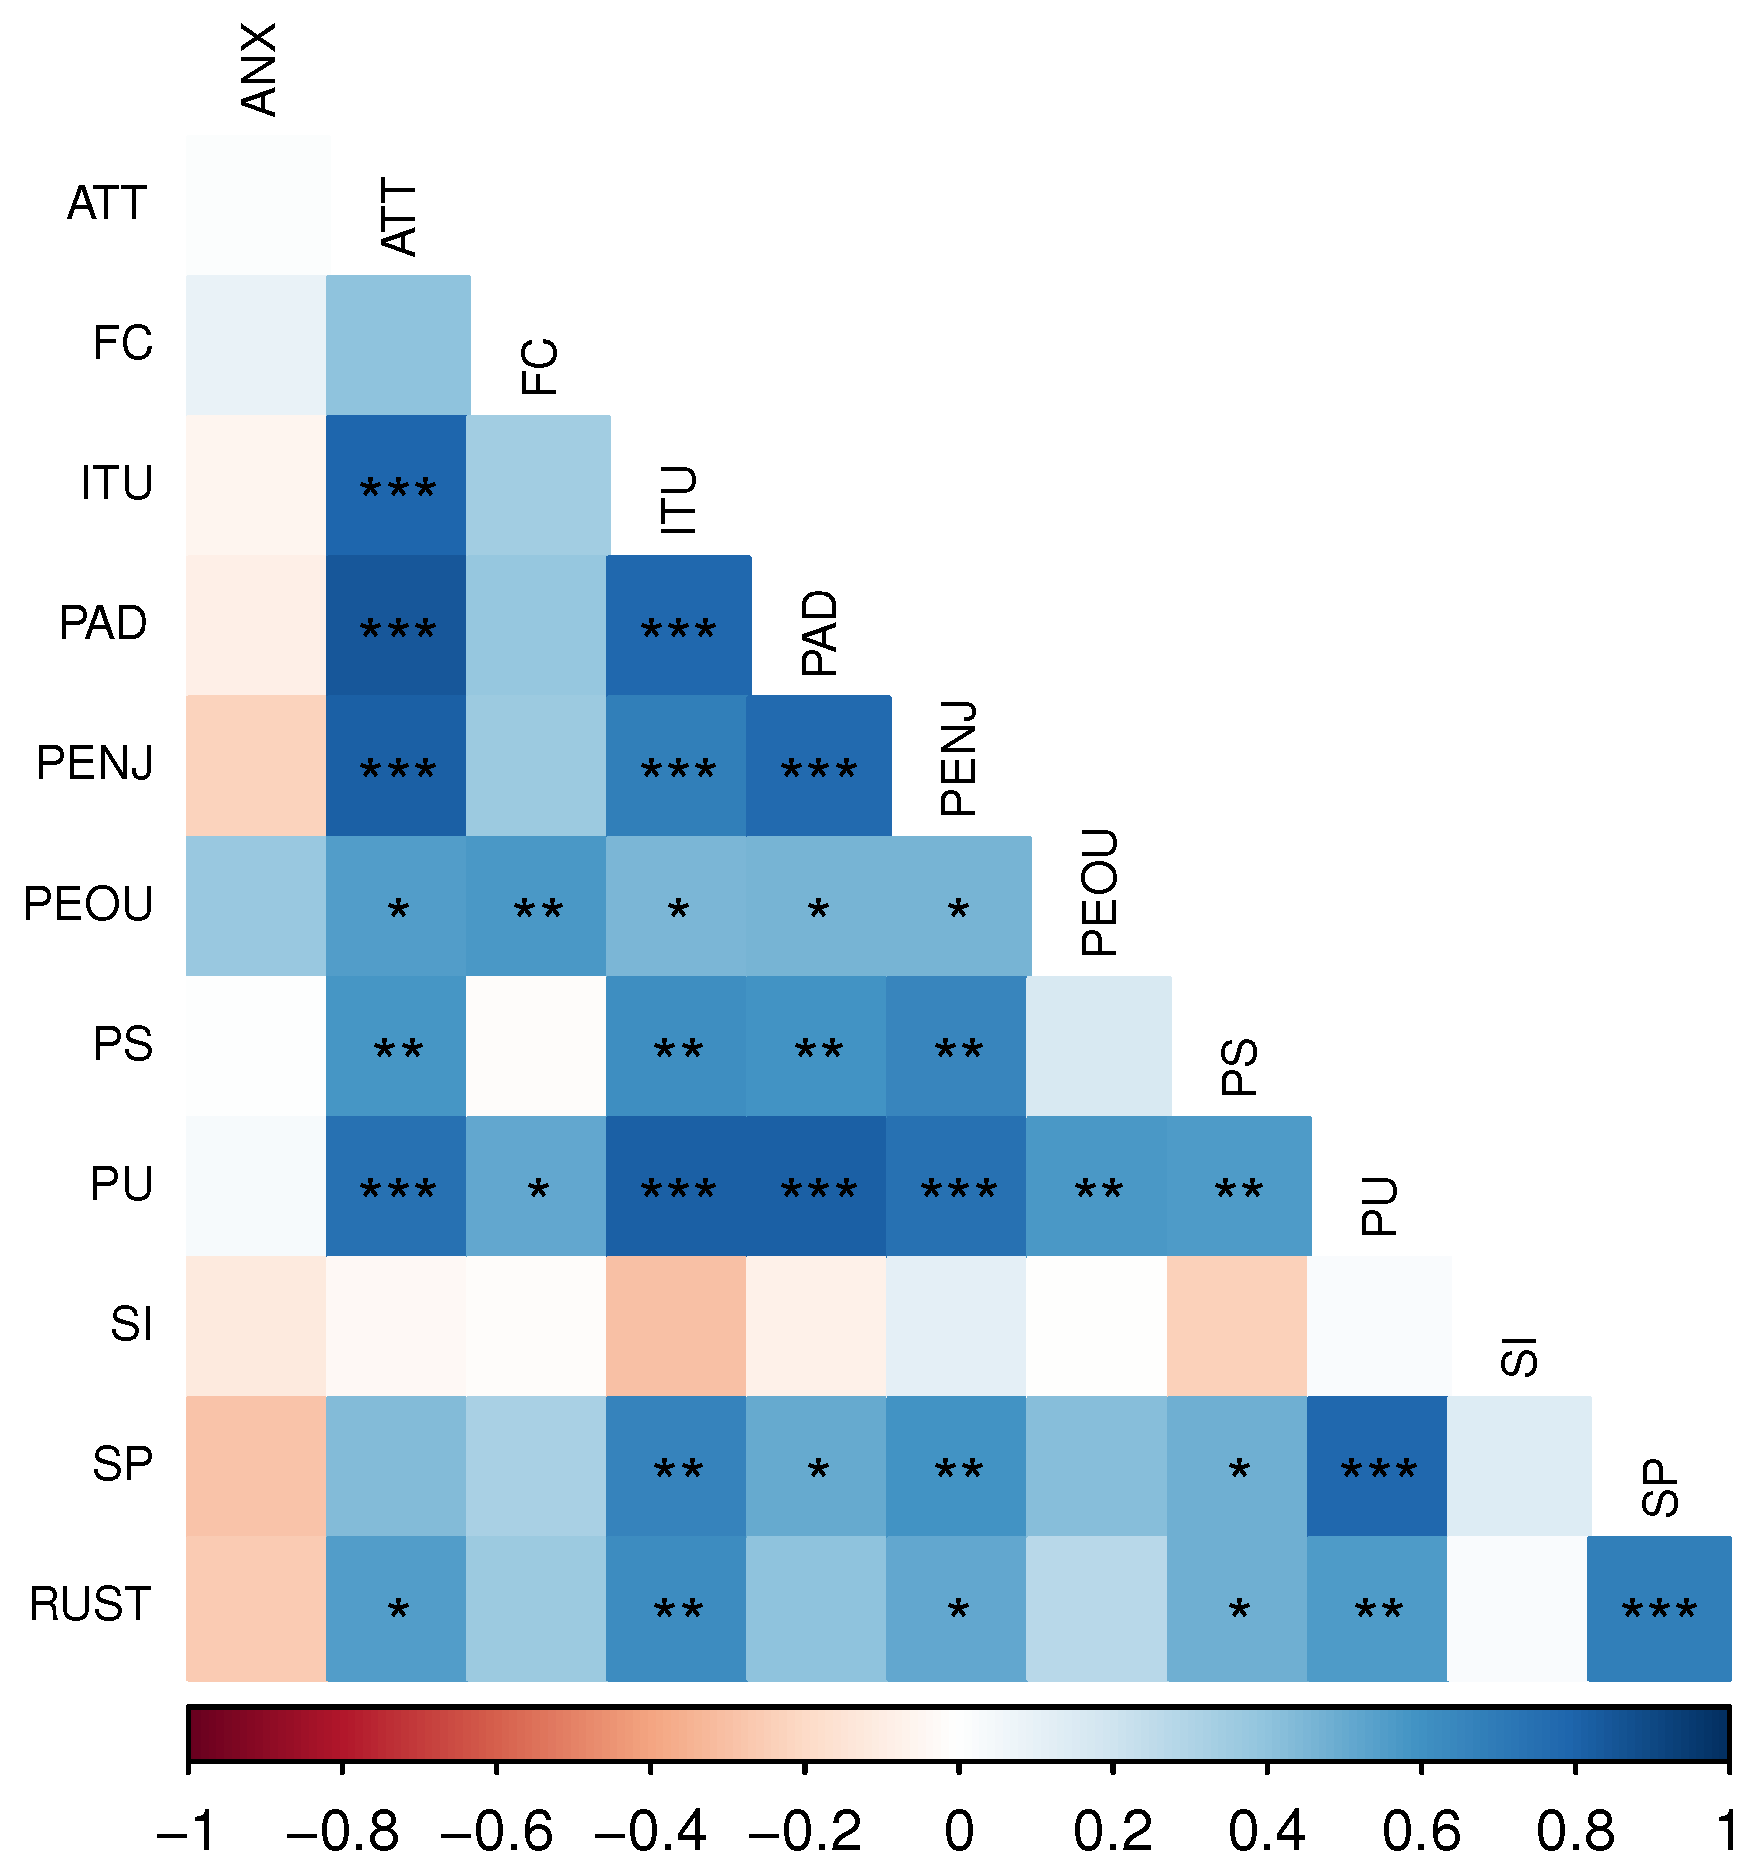
3.1. Almere Model Questionnaire
3.2. Godspeed
3.3. Robot Acceptance Questionnaire
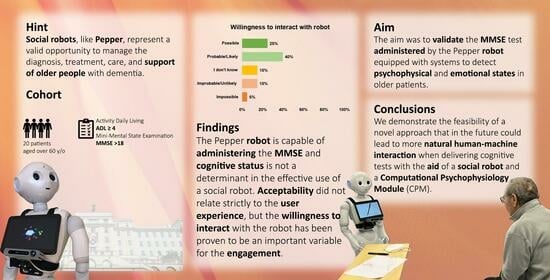
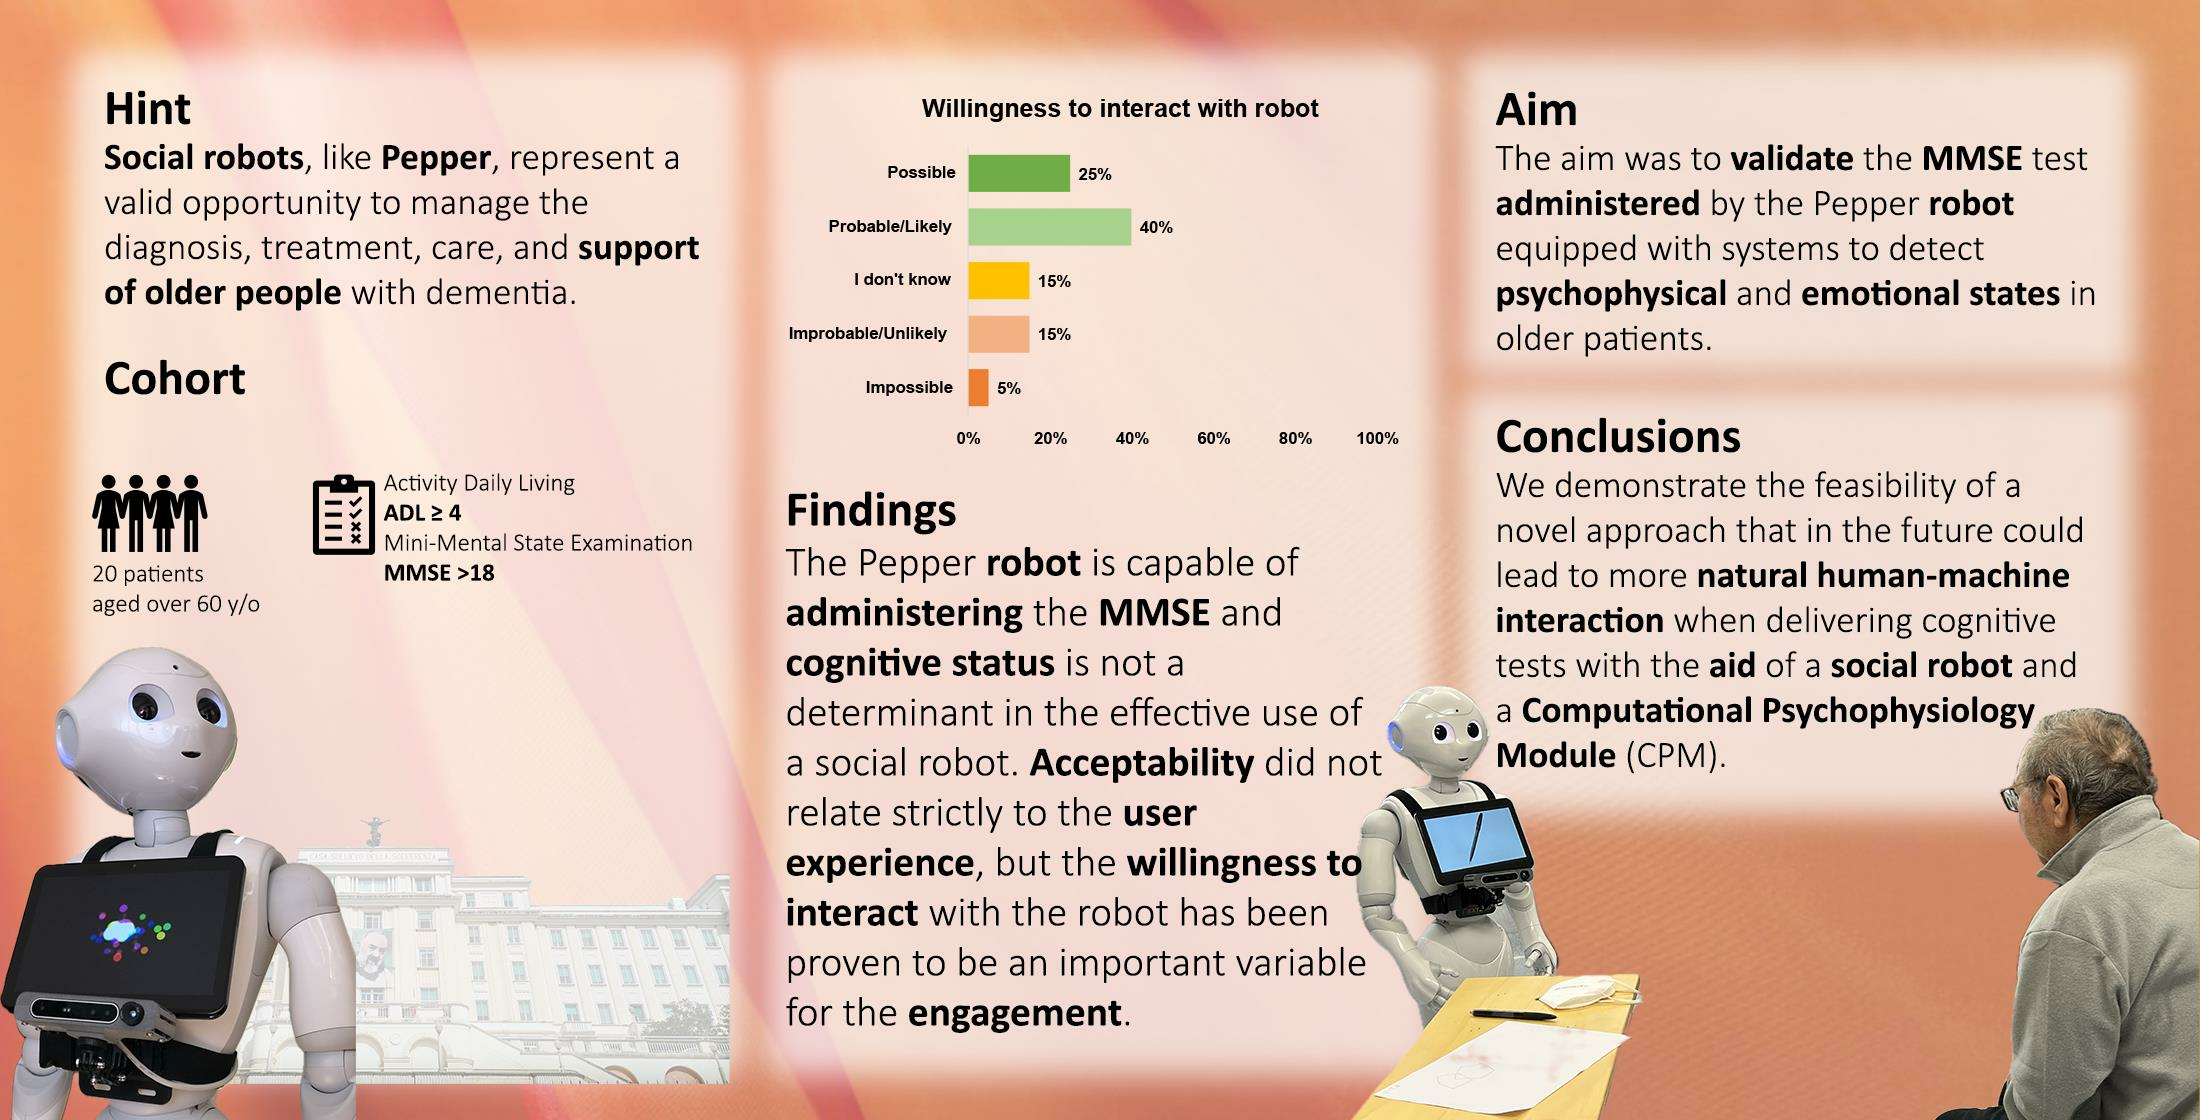
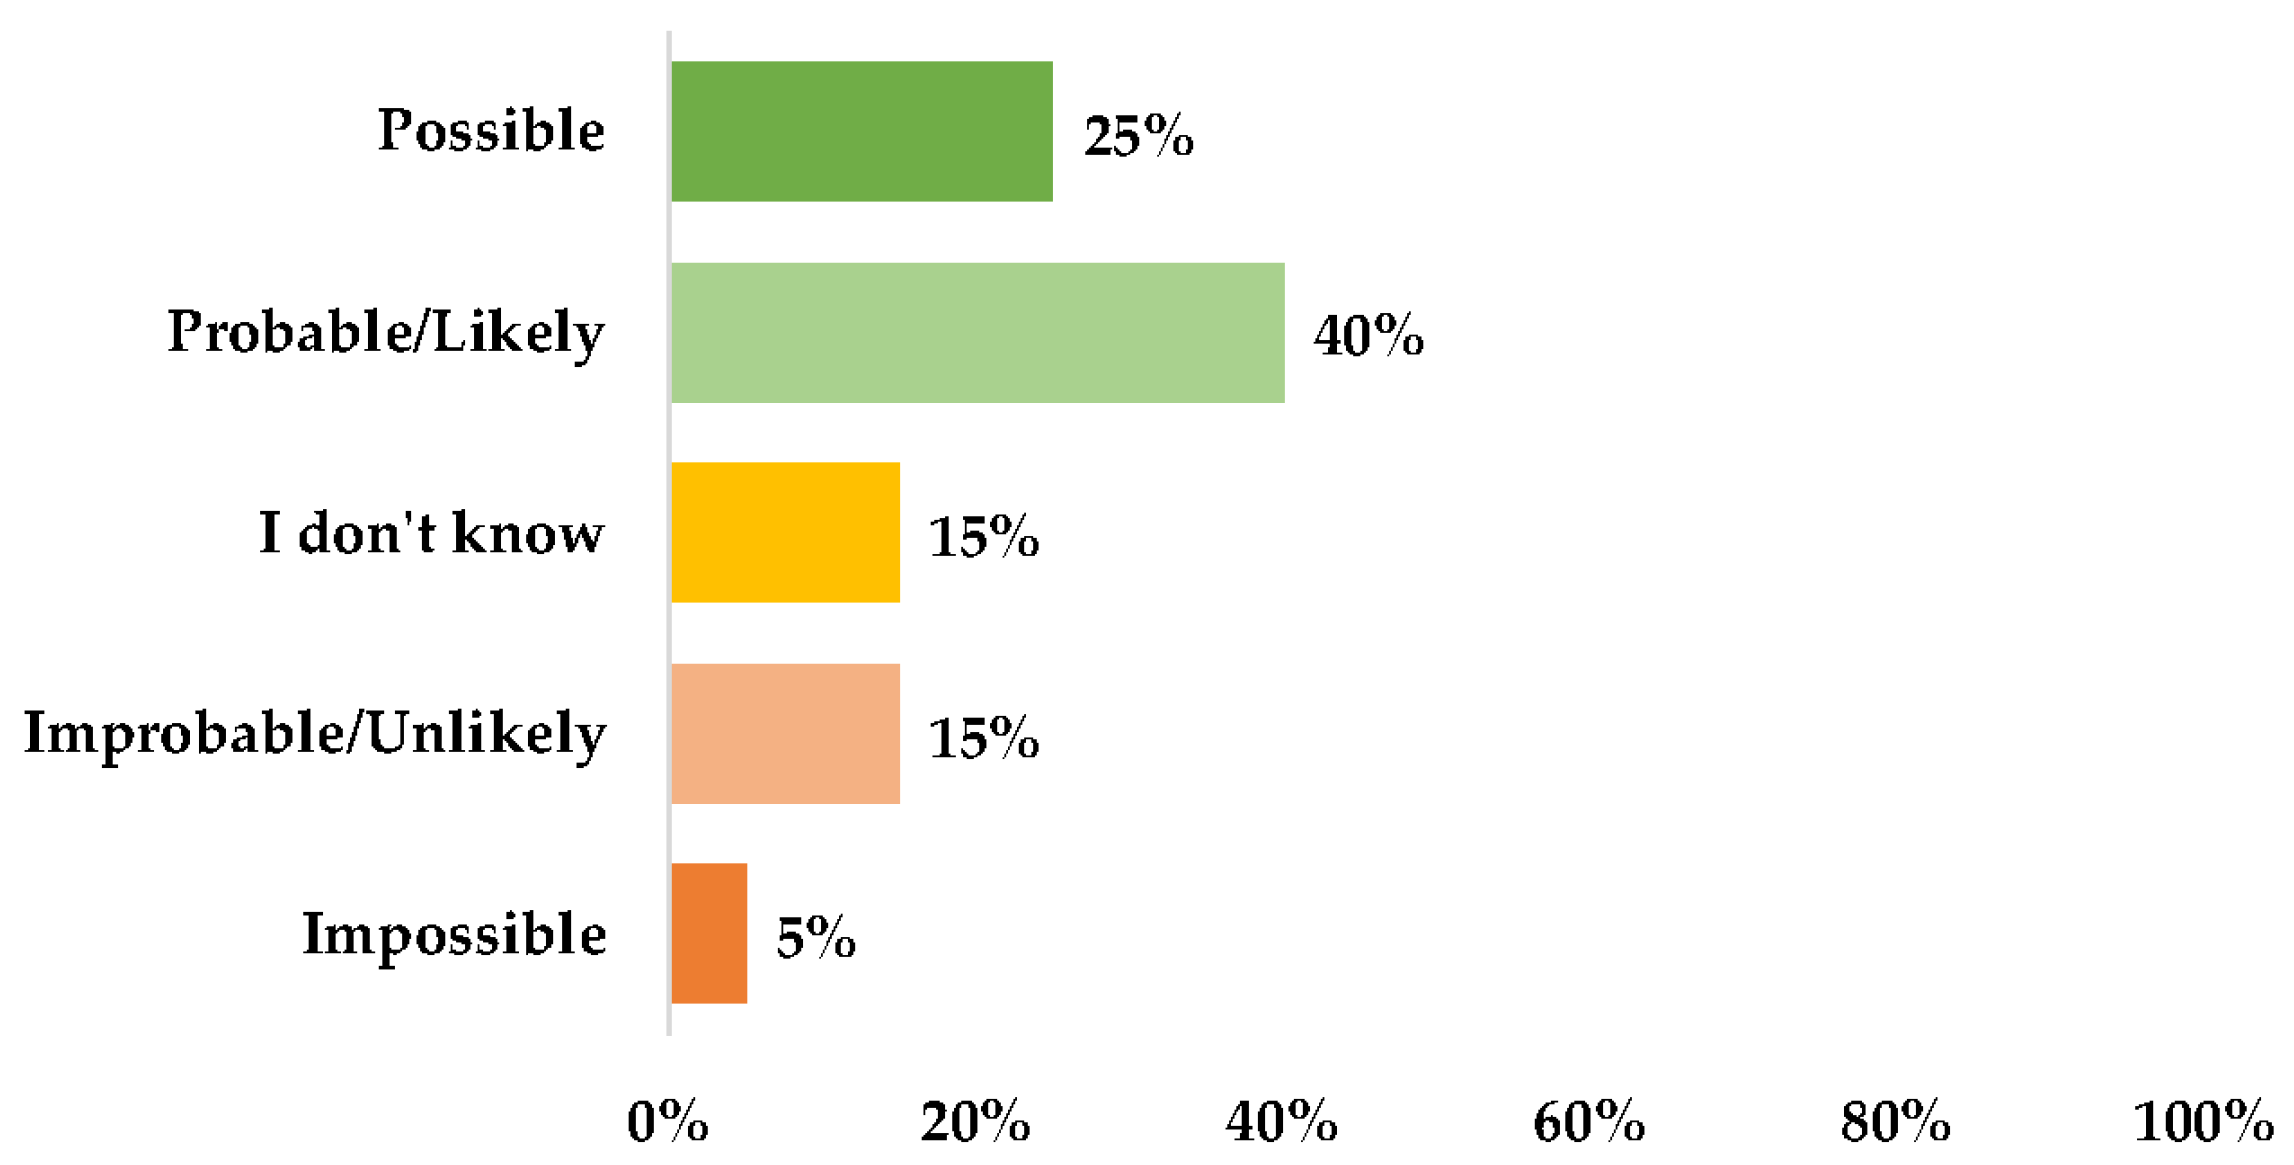
- There was a high number of patients who expressed a positive attitude toward the use of the robot and a willingness to interact with it (Figure 9);
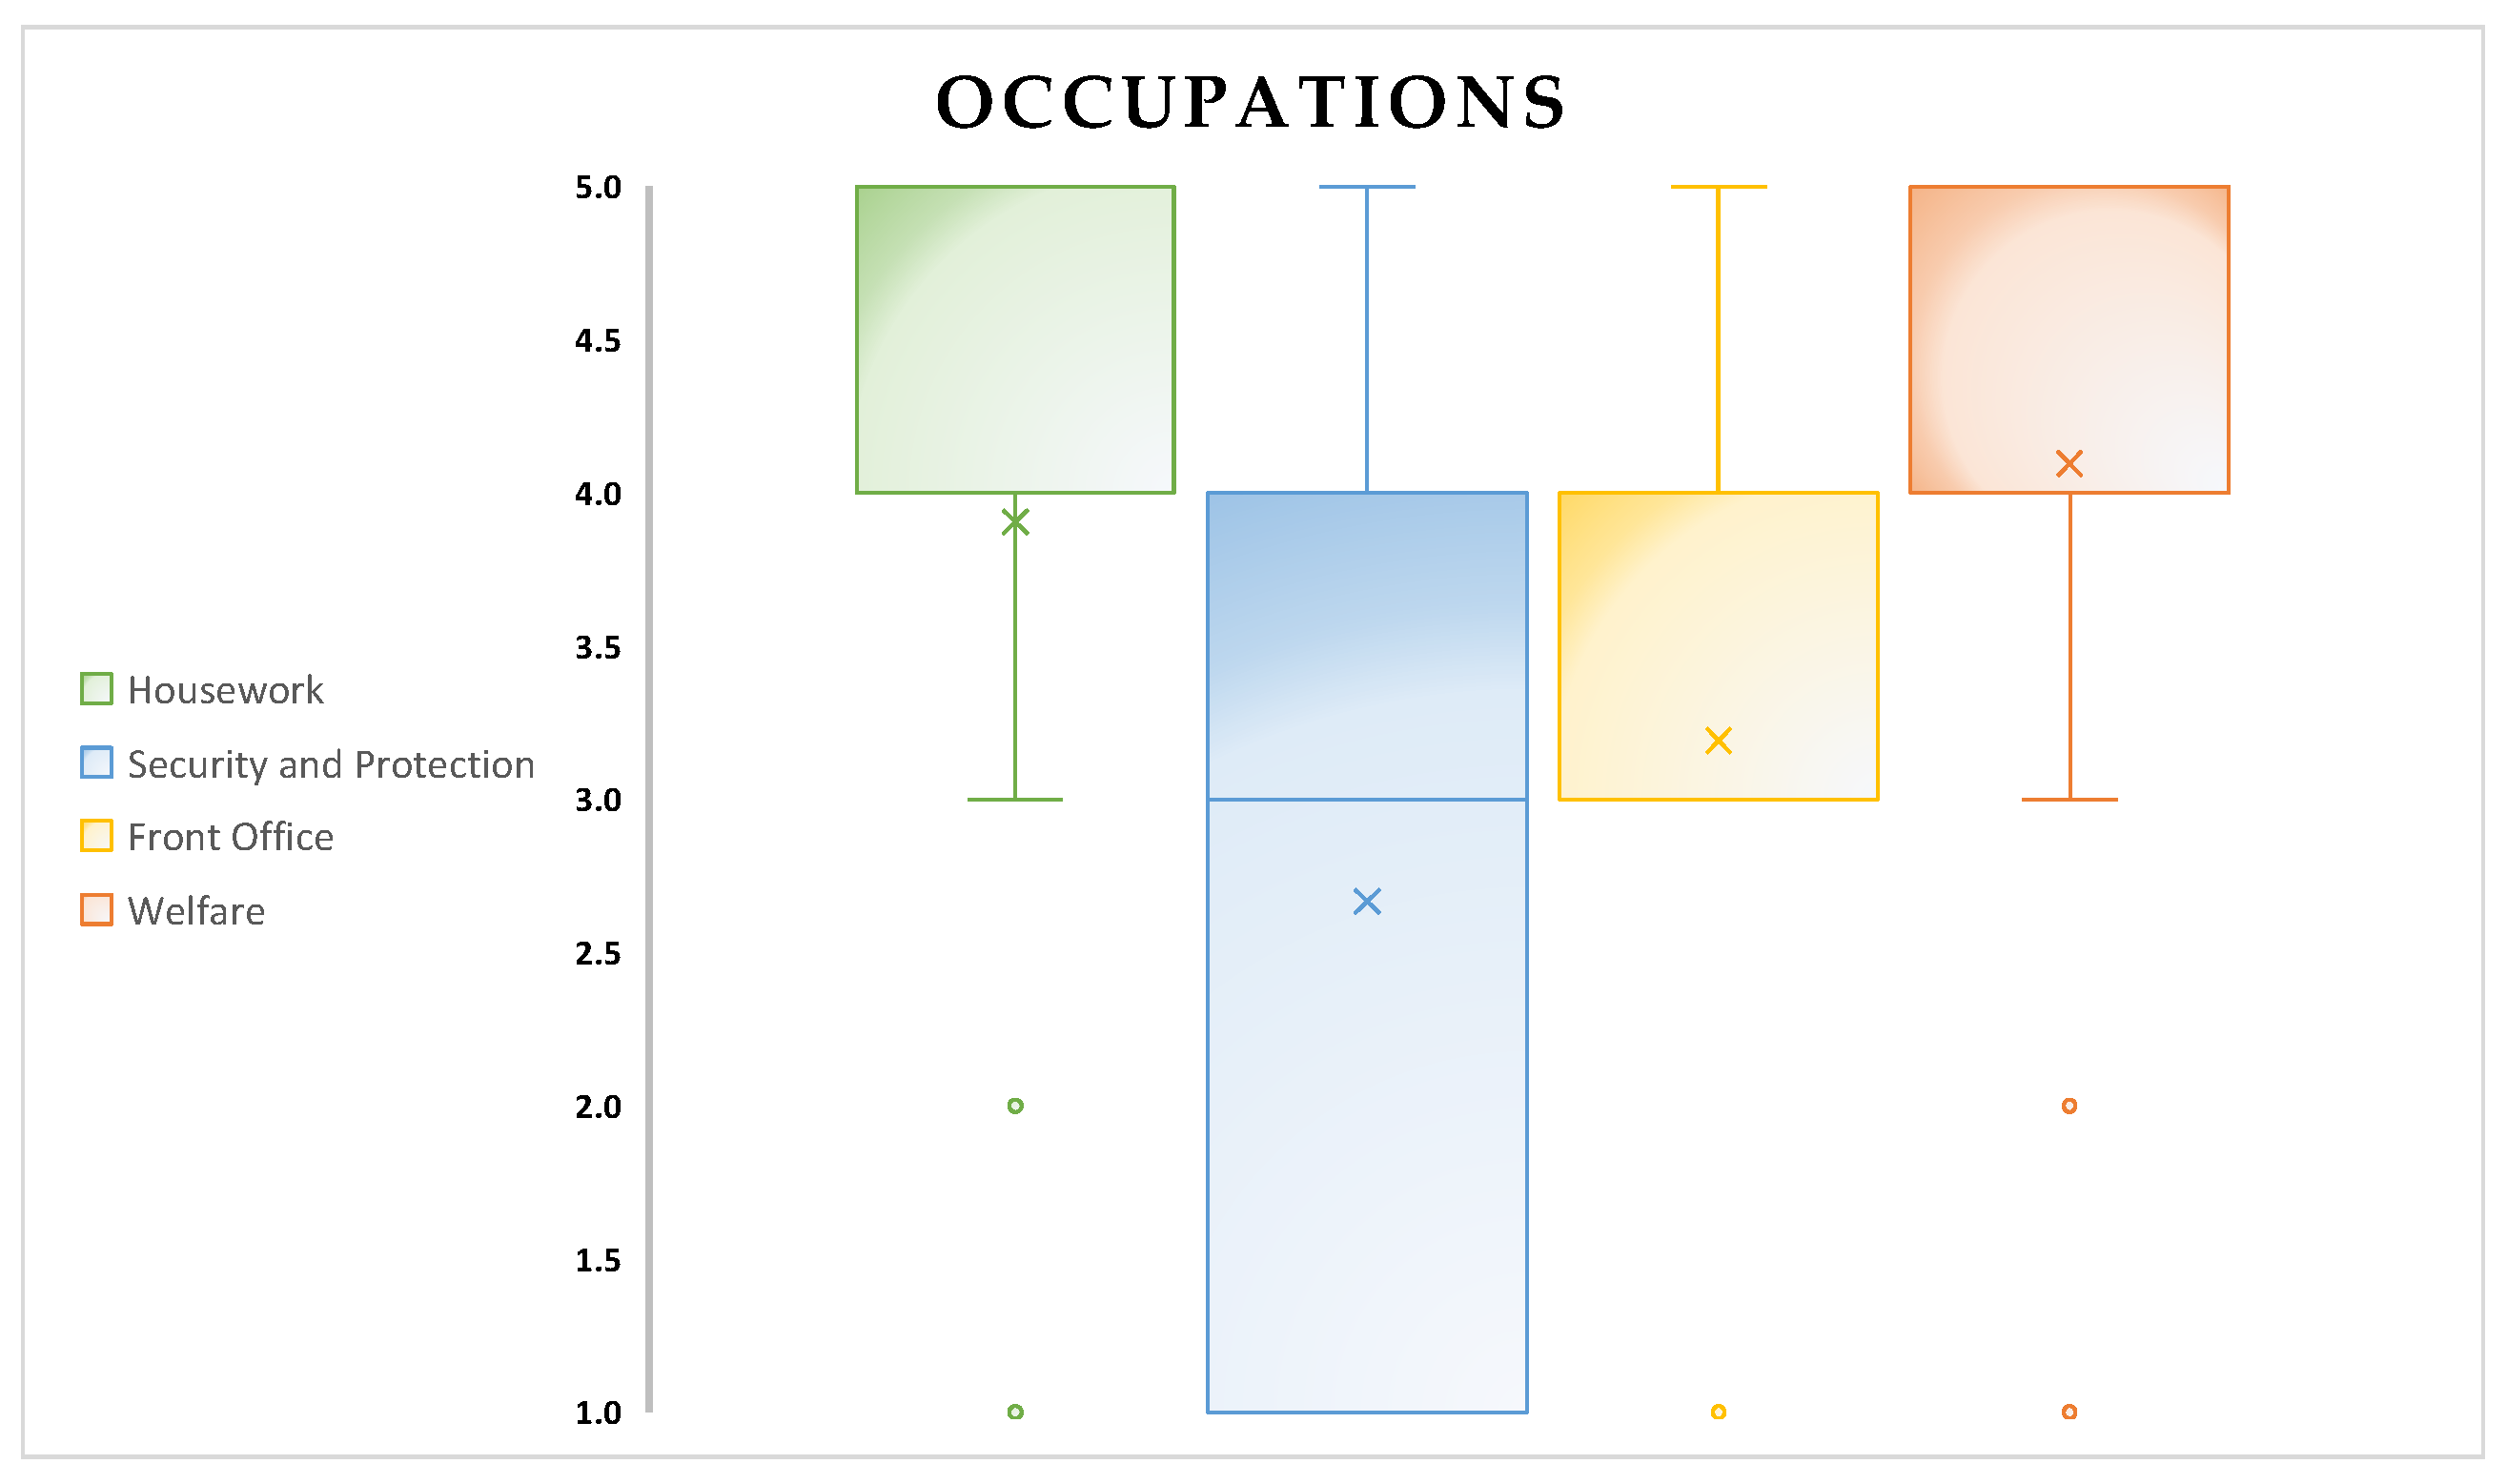
- The robot’s occupations appear to be an interesting aspect: housework and welfare were the most quoted occupations for Pepper (Figure 10). The target population appears to have had difficulty in identifying a unique occupation for the robot.
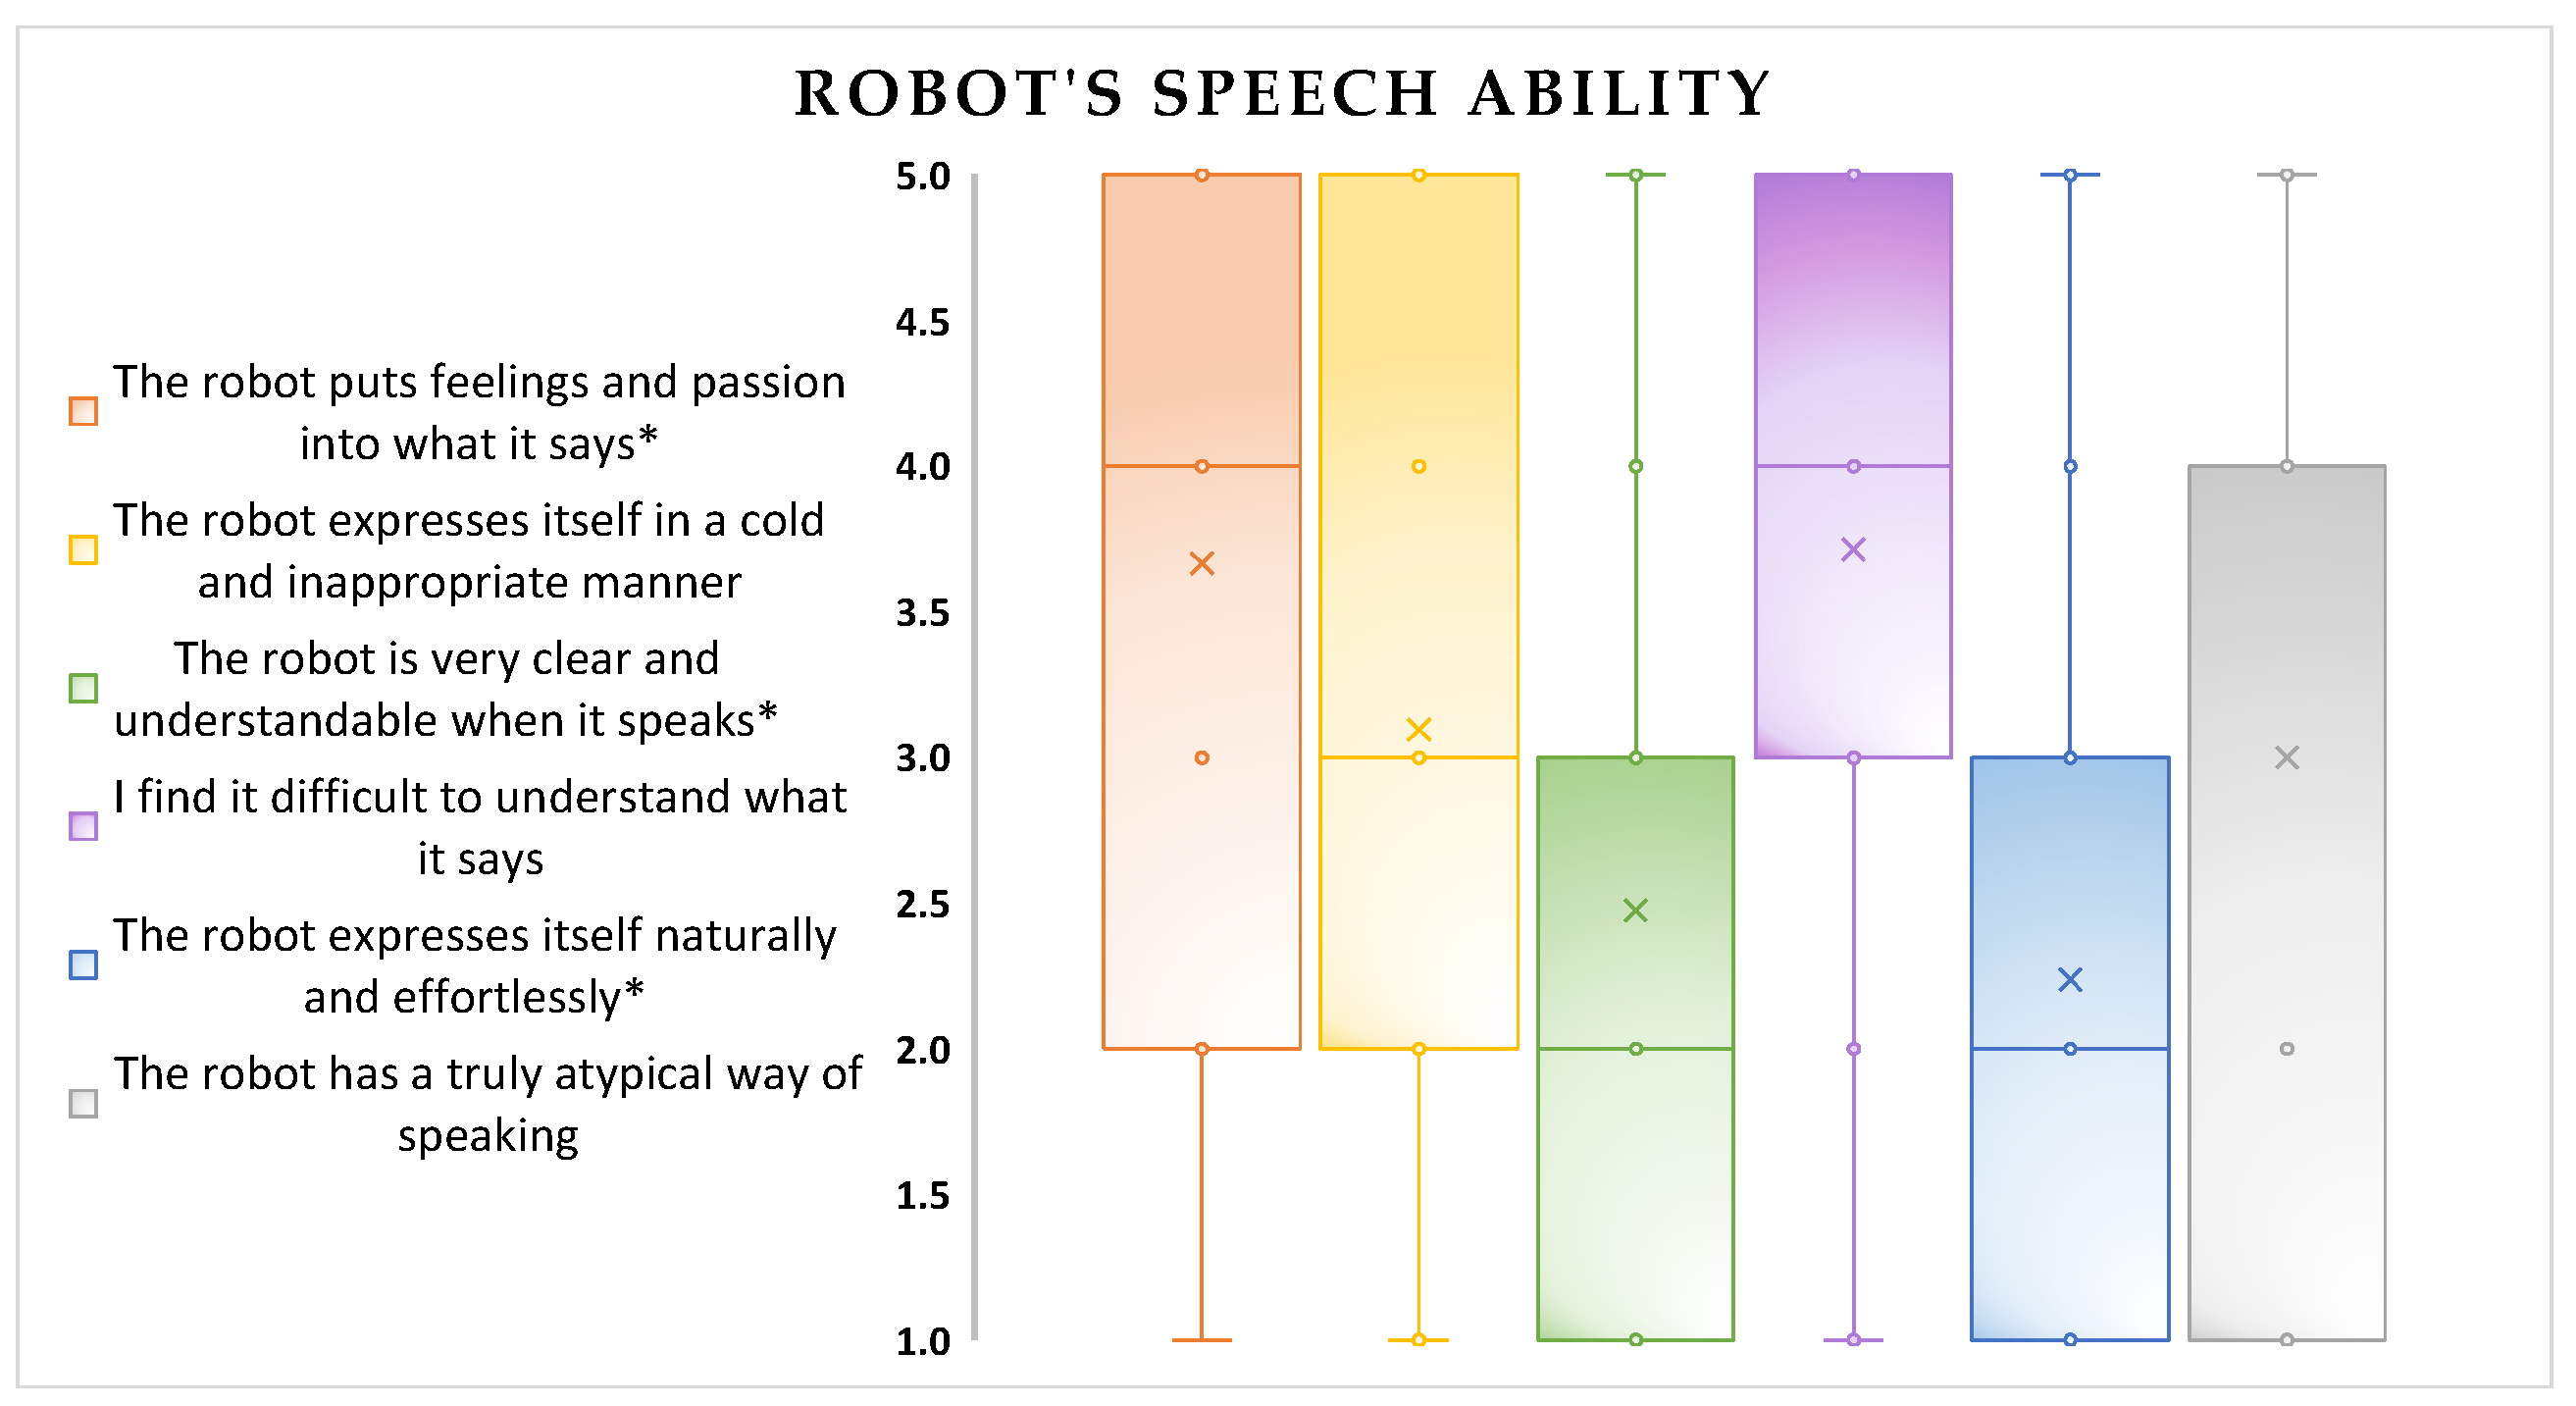
- The robot’s speech abilities appear to be a critical aspect (Figure 11);
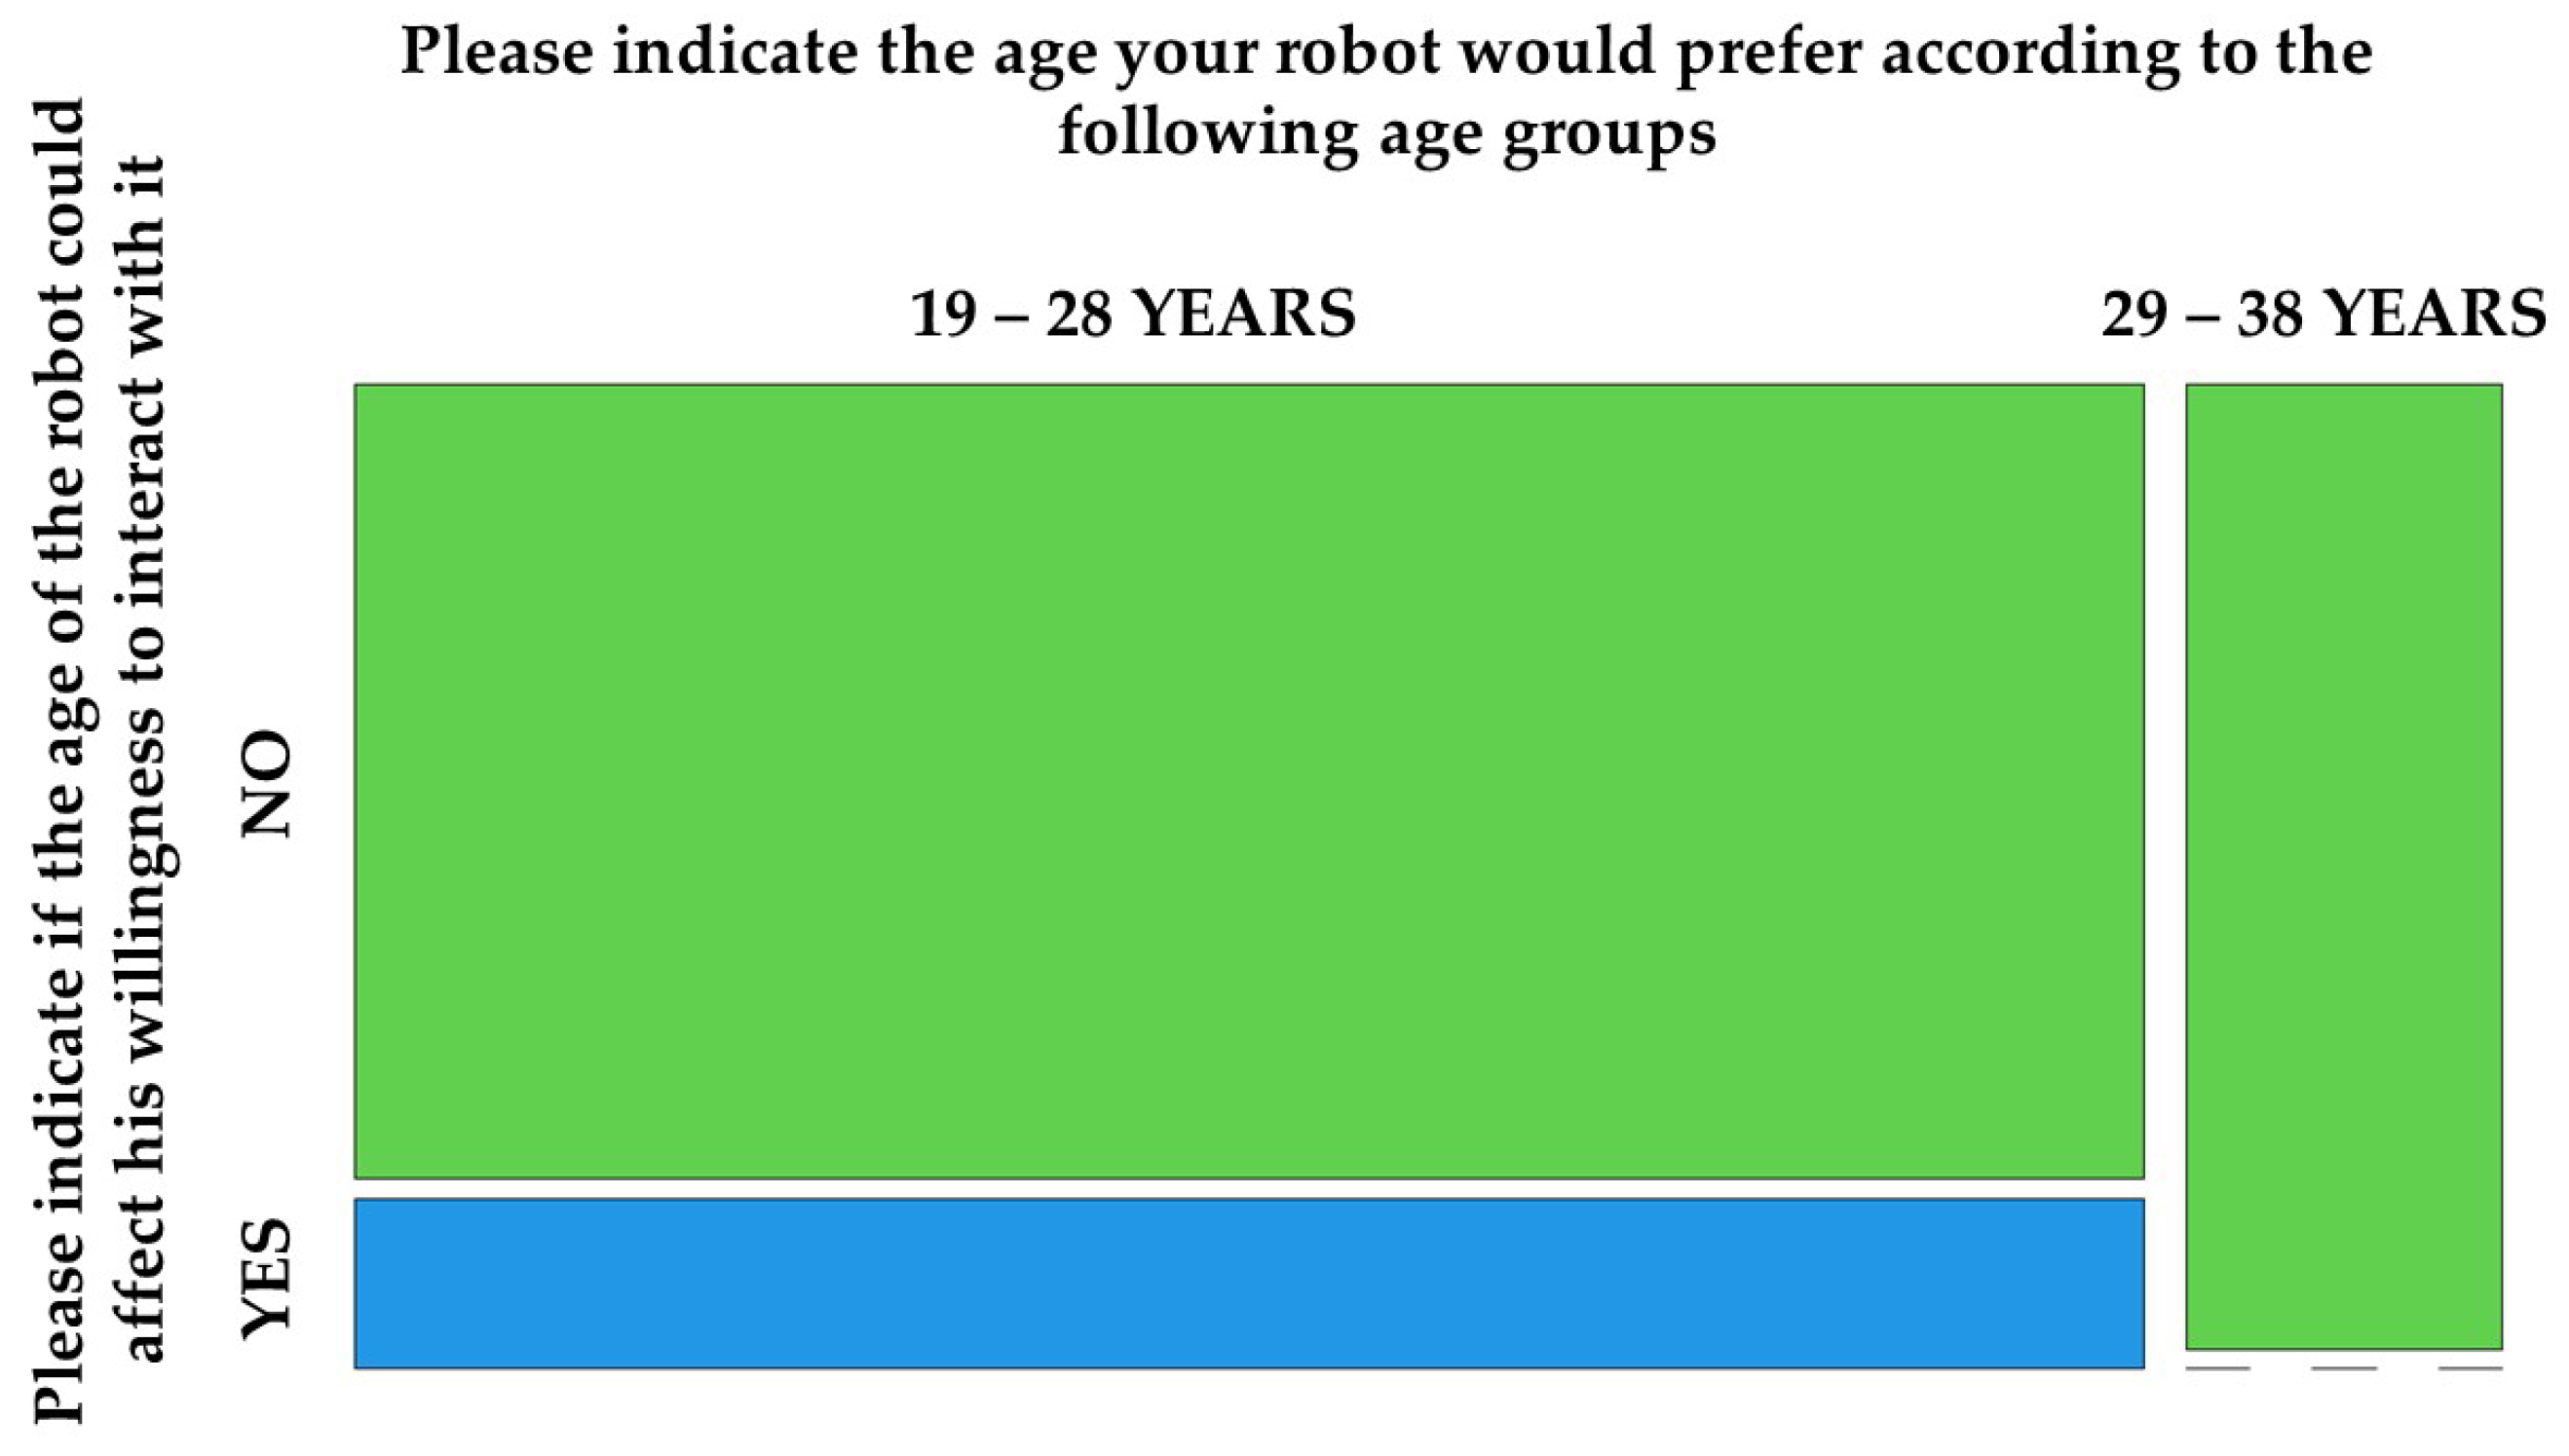
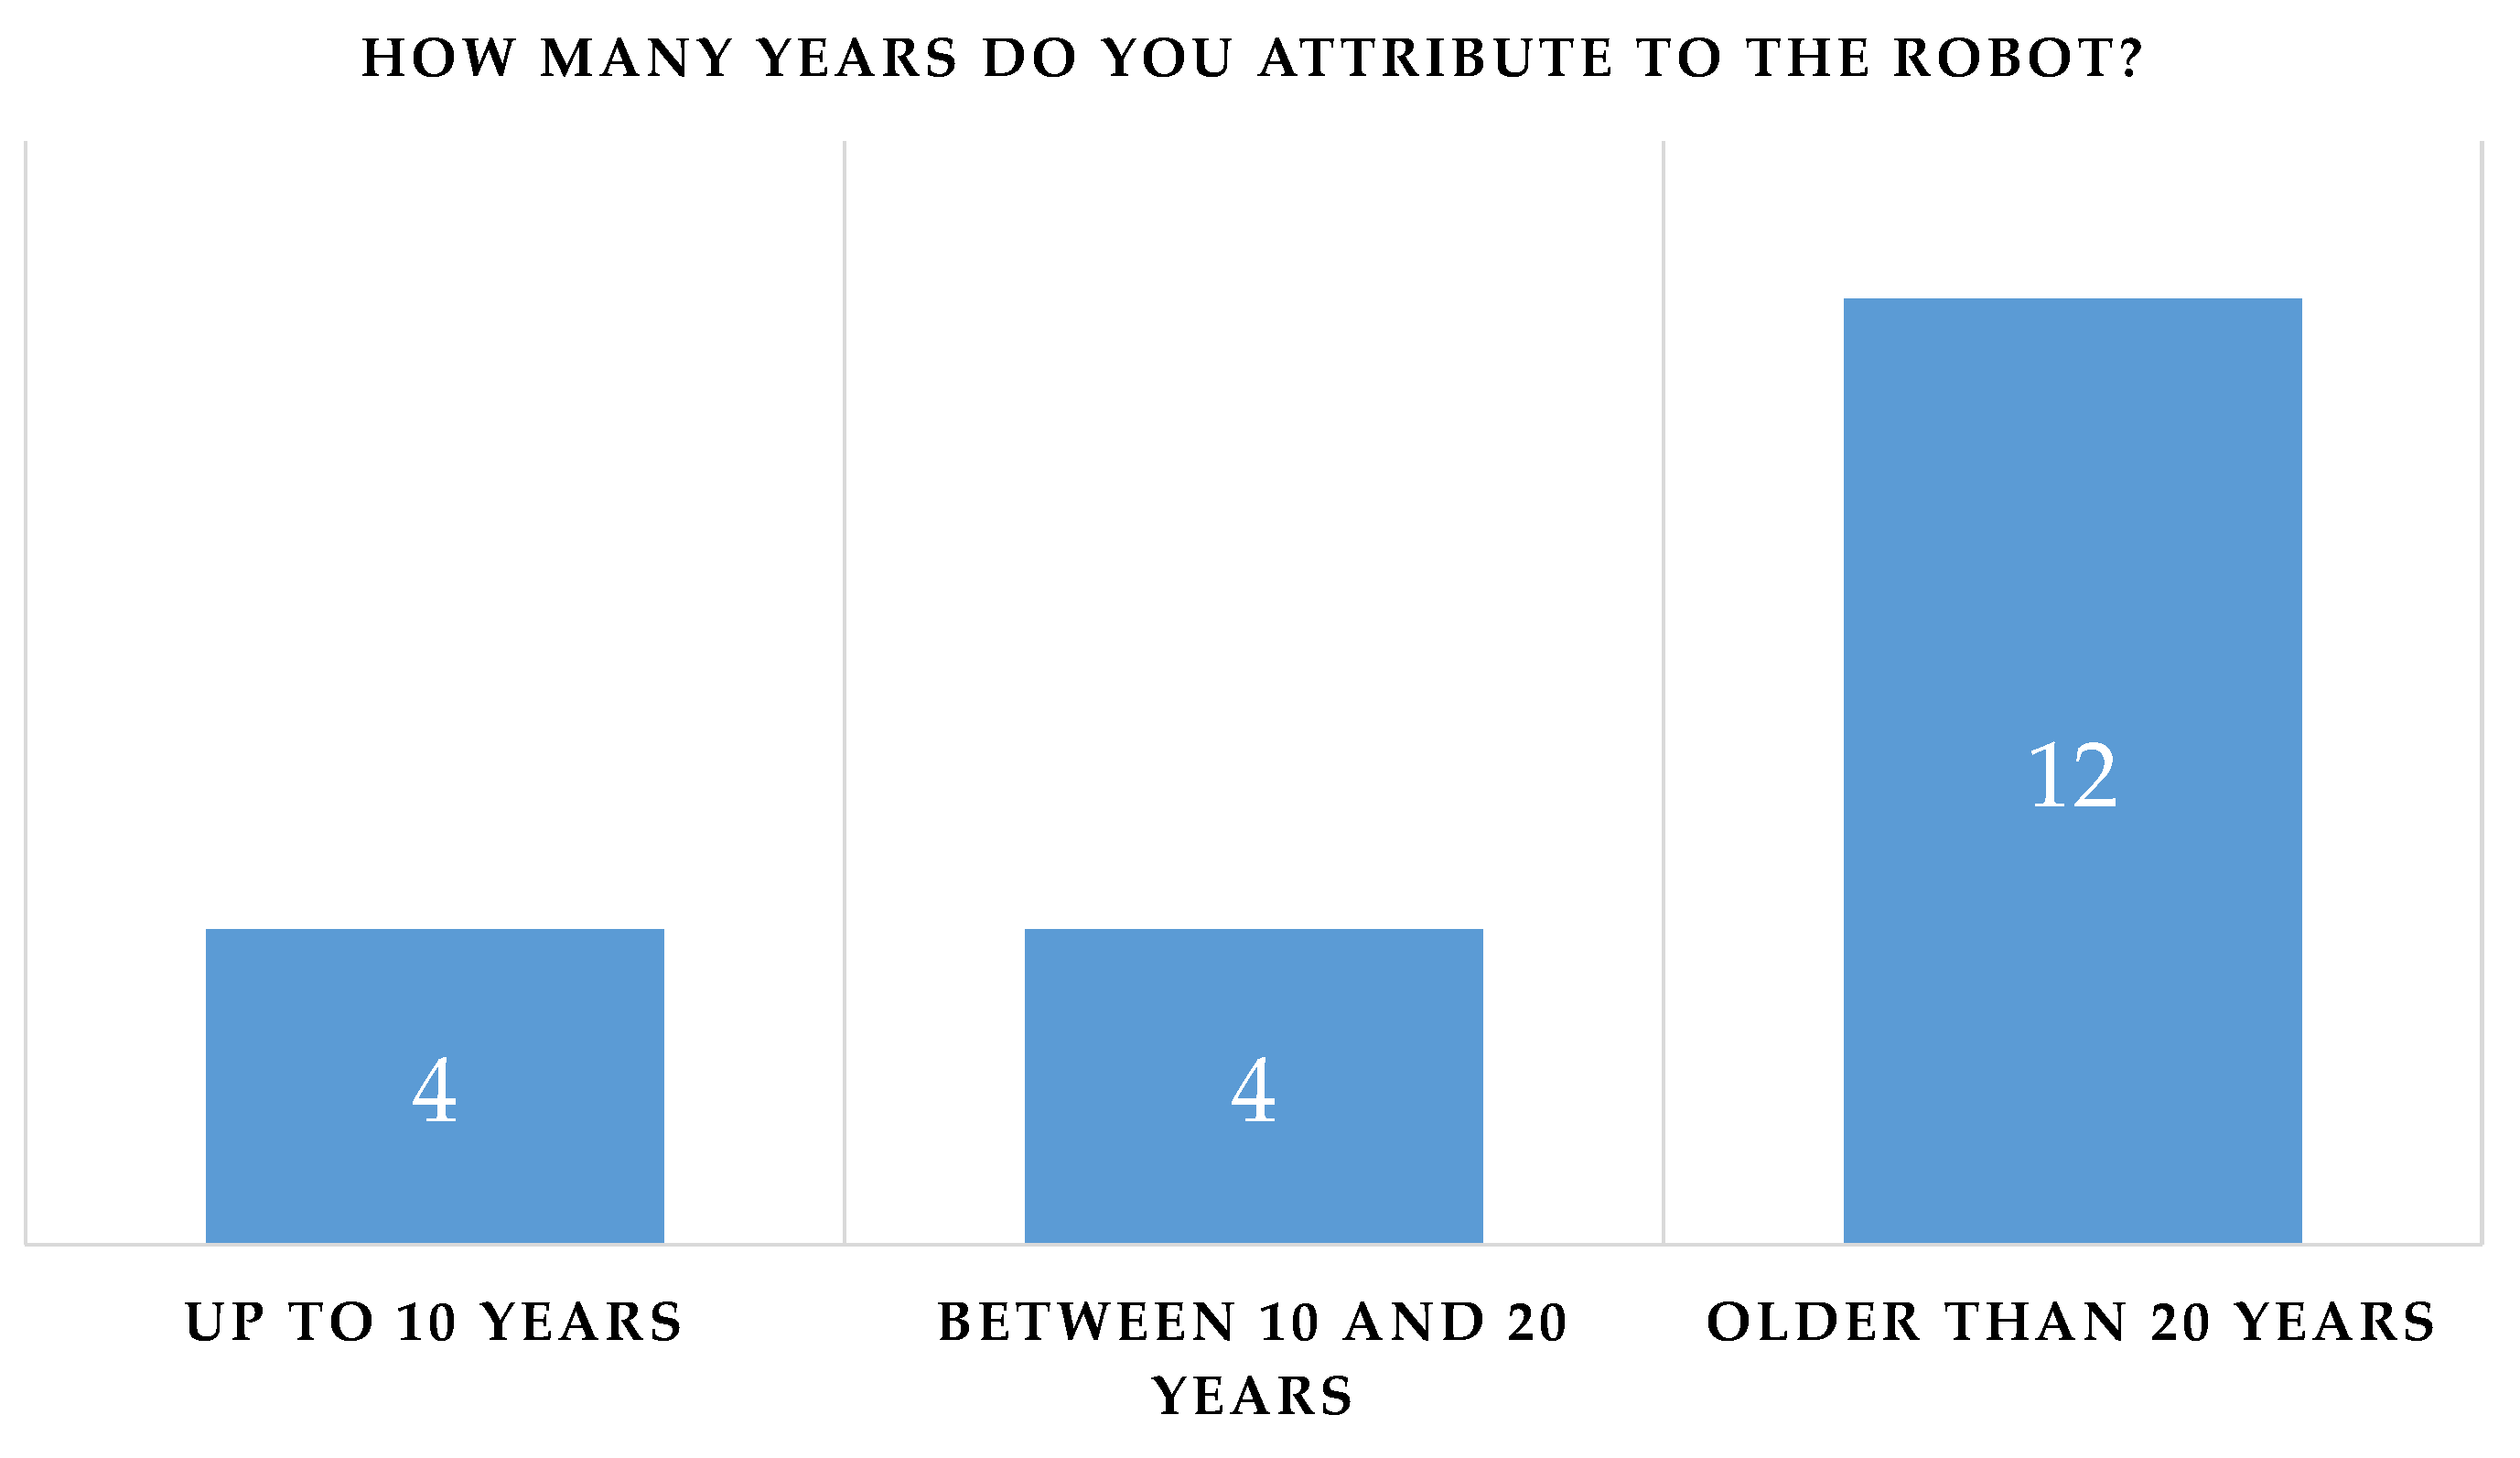
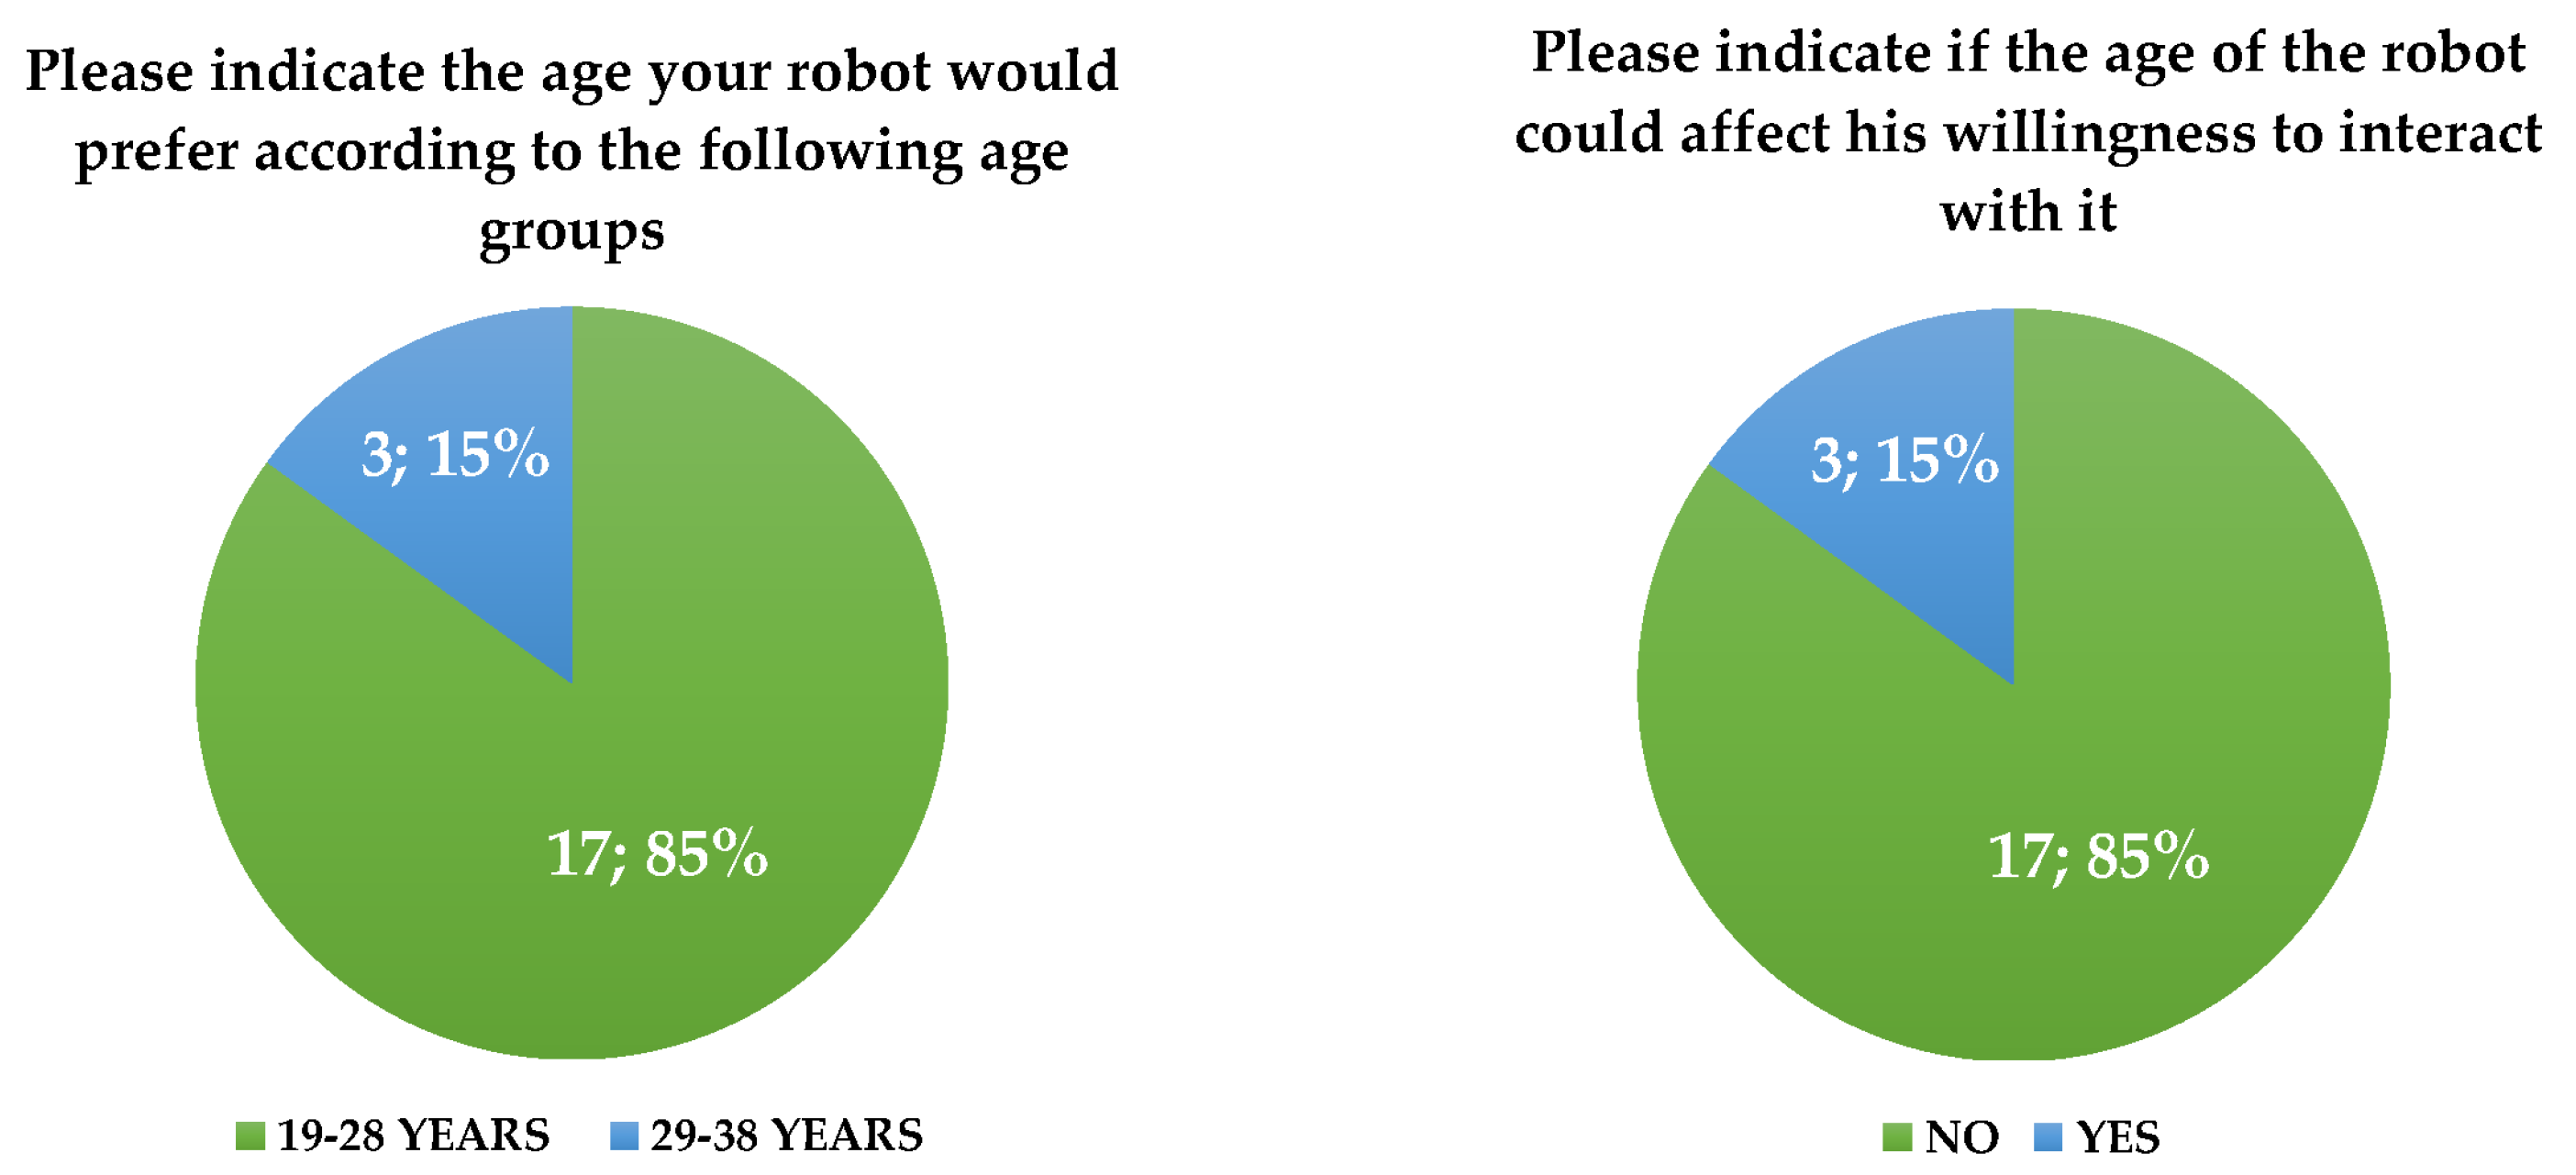
- Although the willingness to interact with the robot was not influenced by the age attributed to it (p-value = 0.655), Pepper conveyed the idea of an anthropomorphic robot with a “youthful” appearance: four of the participants perceived it as a child and four of them perceived it as being aged between 10 and 20 years (Figure 14). There were also no significant differences between the perceived age and the impact on the willingness to interact.


3.4. User Experience Questionnaire
3.5. Differences in Usability among Patients’ Categories
- Patients’ levels of experience with technology;
- Patients’ genders;
- Cognitive status of the patients.
- 1.
- Cognitive impairment (CI; MMSE < 24.0);
- 2.
- Mild cognitive impairment (MILD CI; MMSE < 27.0 and ≥ 24.0);
- 3.
- No cognitive impairment (NO CI; MMSE ≥ 27.0).
3.6. Differences in the Willingness to Interact with the Robot
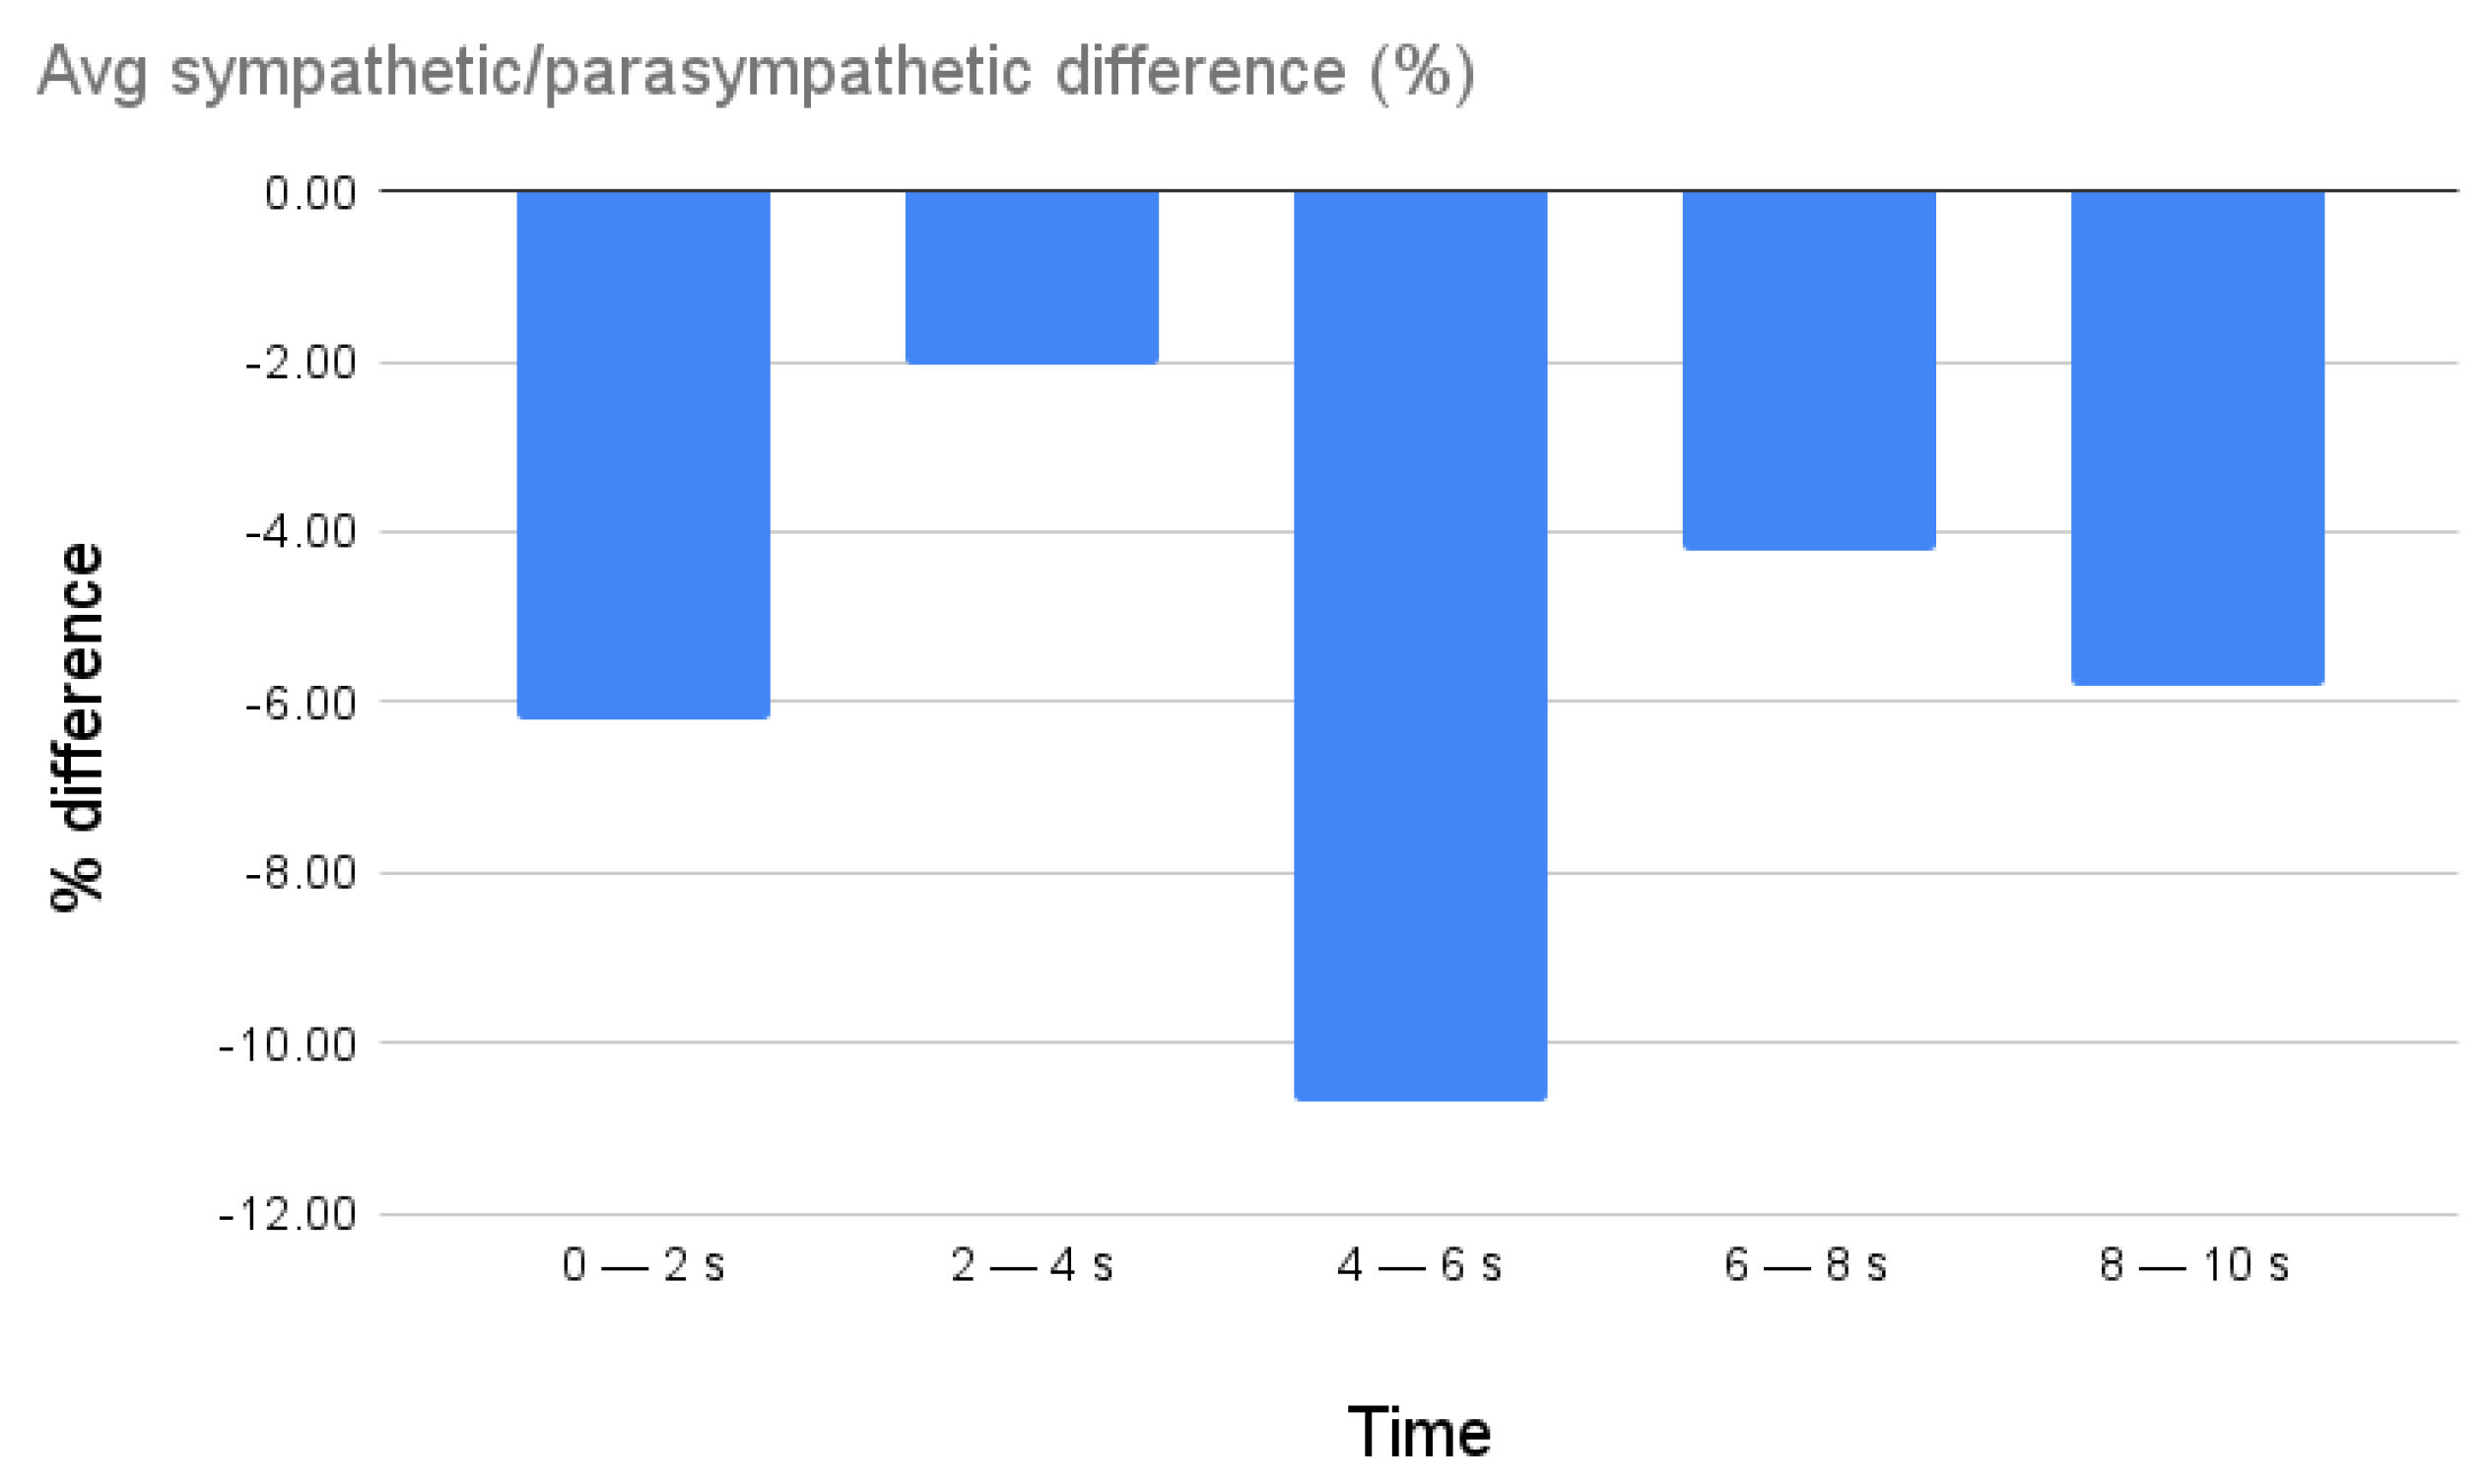
3.7. CPM Results
4. Discussion
4.1. Limitations
4.2. Costs and Effectiveness
4.3. Future Perspectives
5. Conclusions
Author Contributions
Funding
Institutional Review Board Statement
Informed Consent Statement
Data Availability Statement
Acknowledgments
Conflicts of Interest
Abbreviations
| ADL | Activity of Daily Living |
| AMQ | Almere Model Questionnaire |
| ANM | Animacy |
| ANS | Autonomic Neural System |
| ANTP | Anthropomorphism |
| ANX | Anxiety |
| ArS | Arousal State |
| AS | Affective State |
| ATT | Attitude |
| ATTr | Attractiveness |
| CI | Cognitive Impairment |
| CIRS-CI | Cumulative Illness Rating Scale Comorbidity Index |
| CPM | Computational Psychophysiology Module |
| ESS | EXton-Smith Scale |
| FC | Facilitating Conditions |
| GUI | Graphical User Interface |
| HQ-F | Hedonic Quality—Feeling |
| HQ-I | Hedonic Quality—Identity |
| HRI | Human–Robot Interaction |
| IADL | Instrumental Activity of Daily Living |
| IR | Infrared |
| ITU | Intention to Use |
| LIKE | Likeability |
| MILD CI | Mild Cognitive Impairment |
| MMSE | Mini-Mental State Examination |
| MNA | Mini Nutritional Assessment |
| MPI | Multidimensional Prognostic Index |
| NO CI | No Cognitive Impairment |
| PAD | Perceived Adaptability |
| PENJ | Perceived Enjoyment |
| PEOU | Perceived Ease of Use |
| PI | Perceived Intelligence |
| PQ | Pragmatic Quality |
| PSa | Perceived Safety |
| PS | Perceived Sociability |
| PU | Perceived Utility |
| RAQ | Robot Acceptance Questionnaire |
| ROIs | Regions Of Interest |
| SI | Social Influence |
| SI-Robotics | SocIal ROBOTics for active and healthy aging |
| SP | Social Presence |
| SPMSQ | Short Portable Mental Status Questionnaire |
| SUS | System Usability Scale |
| SVM | Support Vector Machine |
| UEQ | User Experience Questionnaire |
| VIS | Visible |
Appendix A

| Variables | CI N. 6 | MILD CI N. 5 | NO CI N. 9 | p-Value |
|---|---|---|---|---|
| Age | ||||
| Mean ± SD | 73.7 ± 7.1 | 76.0 ± 8.5 | 76.1 ± 8.7 | 0.768 |
| Range (Min–Max) | 63–84 | 64–88 | 64–88 | |
| Sex | ||||
| Female/Male | 1/5 | 1/4 | 1/8 | 0.902 |
| % Male | 83% | 80% | 89% | |
| Education (years) | ||||
| Mean ± SD | 11.3 ± 4.2 | 9.8 ± 4.1 | 9.1 ± 5.4 | 0.654 |
| Range (Min–Max) | 5–16 | 5–15 | 2–18 | |
| Variables | CI N. 6 | MILD CI N. 5 | NO CI N. 9 | p-Value |
|---|---|---|---|---|
| ADL | ||||
| Median (IQR) | 6.00 [0.00] | 6.00 [1.00] | 6.00 [0.00] | 0.173 |
| IADL | ||||
| Median (IQR) | 6.50 [5.25] | 8.00 [5.00] | 8.00 [0.00] | 0.073 |
| SPMSQ | ||||
| Median (IQR) | 2.00 [0.75] | 2.00 [1.00] | 1.00 [0.00] | 0.161 |
| CIRS–CI | ||||
| Median (IQR) | 3.00 [1.50] | 2.00 [1.00] | 2.00 [1.00] | 0.811 |
| MNA | ||||
| Mean ± SD | 22.2 ± 2.7 | 17.5 - 25.0 | 21.6 ± 2.4 | 0.898 |
| Range (Min–Max) | 18.0–24.0 | 22.1 ± 1.8 | 20.0–25.0 | |
| MPI | ||||
| Median (IQR) | 0.21 [0.27] | 0.25 [0.16] | 0.17 [0.08] | 0.323 |
| ESS | ||||
| Median (IQR) | 17.50 [2.50] | 18.00 [0.00] | 18.00 [0.00] | 0.021 |
| Domains of the AMQ | CI N. 6 | MILD CI N. 5 | NO CI N. 9 | p-Value |
|---|---|---|---|---|
| Anxious (ANX) | ||||
| Median (IQR) | 4.25 [0.75] | 5.00 [0.50] | 4.75 [1.25] | 0.640 |
| Attitude (ATT) | ||||
| Mean ± SD | 3.22 ± 1.19 | 3.07 ± 1.52 | 3.3 ± 1.3 | 0.876 |
| Range (Min–Max) | 1.0–4.33 | 1–5 | 1.33–4.67 | |
| Facilitating Condition (FC) | ||||
| Mean ± SD | 2.5 ± 0.89 | 1.8 ± 0.45 | 2.44 ± 1.07 | 0.275 |
| Range (Min–Max) | 1.0–3.5 | 1.0–2.0 | 1.0–4.0 | |
| Intention to Use (ITU) | ||||
| Median (IQR) | 2.83 [2.33] | 3.00 [3.00] | 2.67 [2.67] | 0.983 |
| Perceived Adaptivity (PAD) | ||||
| Median (IQR) | 3.50 [2.83] | 3.67 [2.33] | 3.33 [2.00] | 0.973 |
| Perceived Enjoyment (PENJ) | ||||
| Mean ± SD | 3.8 ± 1.21 | 2.64 ± 1.40 | 3.56 ± 1.18 | 0.195 |
| Range (Min–Max) | 2.2–5.0 | 1.0–4.2 | 2.2–5.0 | |
| Perceived Ease of Use (PEOU) | ||||
| Mean ± SD | 3.8 ± 0.82 | 2.6 ± 0.91 | 2.98 ± 1.02 | 0.096 |
| Range (Min–Max) | 2.4–4.8 | 1.2–3.4 | 1.6–4.8 | |
| Perceived Sociability (PS) | ||||
| Mean ± SD | 3.33 ± 1.28 | 3.50 ± 1.02 | 4.08 ± 0.98 | 0.375 |
| Range (Min–Max) | 1.75–5.0 | 2.5–5.0 | 2.0–5.0 | |
| Perceived Utility (PU) | ||||
| Mean ± SD | 3.11 ± 1.29 | 2.87 ± 0.51 | 3.07 ± 1.35 | 0.850 |
| Range (Min–Max) | 1.0–4.67 | 2.33–3.33 | 1.0–5.0 | |
| Social Influence (SI) | ||||
| Median (IQR) | 3.00 [1.50] | 3.00 [3.00] | 3.50 [3.00] | 0.688 |
| Social Presence (SP) | ||||
| Median (IQR) | 1.90 [1.85] | 1.00 [0.80] | 2.40 [1.60] | 0.421 |
| Trust | ||||
| Median (IQR) | 2.50 [3.75] | 1.00 [2.00] | 4.00 [1.00] | 0.222 |
| Domains of the RAQ | CI N. 6 | MILD CI N. 5 | NO CI N. 9 | p-Value |
|---|---|---|---|---|
| Pragmatic Quality (PQ) | ||||
| Median (IQR) | 1.90 [0.88] | 2.30 [1.10] | 2.60 [2.00] | 0.675 |
| Hedonic Quality–Identity (HQ-I) | ||||
| Mean ± SD | 2.78 ± 1.15 | 2.32 ± 0.76 | 2.41 ± 0.95 | 0.842 |
| Range (Min–Max) | 1.4–4.5 | 1.7–3.6 | 1.4–3.8 | |
| Hedonic Quality–Feeling (HQ-F) | ||||
| Median (IQR) | 2.40 [1.88] | 1.90 [0.60] | 2.50 [1.30] | 0.952 |
| Attractiveness (ATTr) | ||||
| Mean ± SD | 2.70 ± 1.27 | 2.60 ± 0.63 | 2.50 ± 1.01 | 0.927 |
| Range (Min–Max) | 1.3–4.6 | 2.1–3.7 | 1.4–4.2 | |
| Domains of Godspeed | CI N. 6 | MILD CI N. 5 | NO CI N. 9 | p-Value |
|---|---|---|---|---|
| Antropomorphism (ANTP) | ||||
| Median (IQR) | 2.30 [2.20] | 1.80 [1.20] | 2.60 [1.20] | 0.474 |
| Animacy (ANM) | ||||
| Mean ± SD | 3.11 ± 1.06 | 2.37 ± 1.30 | 2.83 ± 1.09 | 0.524 |
| Range (Min–Max) | 1.83–4.5 | 1.0–3.6 | 1.0–4.17 | |
| Likeability (LIKE) | ||||
| Median (IQR) | 4.00 [2.30] | 4.60 [0.00] | 4.80 [0.80] | 0.810 |
| Perceived Intelligence (PI) | ||||
| Median (IQR) | 4.00 [1.70] | 4.60 [1.20] | 3.80 [1.60] | 0.849 |
| Perceived Safety (PSa) | ||||
| Median (IQR) | 3.33 [1.17] | 3.67 [0.67] | 3.67 [0.33] | 0.434 |
| Domains of the UEQ | CI N. 6 | MILD CI N. 5 | NO CI N. 9 | p-Value |
|---|---|---|---|---|
| Attractiveness | ||||
| Median (IQR) | 1.60 [2.30] | 2.00 [1.00] | 1.30 [2.30] | 0.827 |
| Perspicuity | ||||
| Median (IQR) | 2.10 [0.80] | 2.20 [3.30] | 1.75 [2.00] | 0.860 |
| Efficiency | ||||
| Mean ± SD | 1.08 ± 1.80 | 0.80 ± 1.53 | 1.55 ± 1.03 | 0.817 |
| Range (Min–Max) | −2.25–2.75 | −1.50–2.25 | 0.00–3.00 | |
| Dependability | ||||
| Median (IQR) | 1.50 [1.30] | 1.50 [1.30] | 1.50 [1.30] | 0.929 |
| Stimulation | ||||
| Mean ± SD | 0.75 ± 2.00 | 0.45 ± 2.40 | 0.67 ± 2.00 | 0.973 |
| Range (Min–Max) | −2.00–3.00 | −3.00–3.00 | −2.00–3.00 | |
| Novelty | ||||
| Median (IQR) | 1.50 [1.10] | 1.50 [2.00] | 0.50 [1.30] | 0.511 |
| Willingness to Interact with the Robot | ||||
|---|---|---|---|---|
| Probable | I Don’t Know | Improbable | p-Value | |
| N. 13 | N. 3 | N. 4 | ||
| System Usability Scale (SUS) | ||||
| Median (IQR) | 70.00 [17.50] | 55.00 [17.50] | 51.25 [26.87] | 0.033 |
| Willingness to Interact with the Robot | ||||
|---|---|---|---|---|
| Domains of the UEQ | Probable | I Don’t Know | Improbable | p-Value |
| N. 13 | N. 3 | N. 4 | ||
| Attractiveness | ||||
| Median (IQR) | 2.50 [1.17] | −1.67 [1.41] | 0.75 [1.79] | 0.018 |
| Perspicuity | ||||
| Median (IQR) | 2.25 [1.00] | −1.25 [1.75] | 2.25 [2.63] | 0.115 |
| Efficiency | ||||
| Mean ± SD | 1.96 ± 0.69 | -0.58 ± 1.46 | 0.19 ± 1.28 | 0.004 |
| Range (Min–Max) | 0.75–3.00 | −2.25–0.50 | −1.50–1.50 | |
| Dependability | ||||
| Median (IQR) | 2.00 [0.75] | 0.25 [0.50] | 0.75 [1.00] | 0.005 |
| Stimulation | ||||
| Mean ± SD | 1.48 ± 1.54 | −1.58 ± 0.72 | −0.44 ± 2.18 | 0.027 |
| Range (Min–Max) | −1.50–3.00 | −2.00–0.75 | −3.00–1.50 | |
| Novelty | ||||
| Median (IQR) | 1.50 [0.75] | 0.50 [0.25] | 0.38 [0.63] | 0.111 |
| Willingness to Interact with the Robot | ||||
|---|---|---|---|---|
| Domains of Godspeed | Probable | I Don’t Know | Improbable | p-Value |
| N. 13 | N. 3 | N. 4 | ||
| Antropomorphism (ANTP) | ||||
| Median (IQR) | 3.00 [1.80] | 1.40 [0.40] | 1.50 [0.35] | 0.016 |
| Animacy (ANM) | ||||
| Mean ± SD | 3.23 ± 1.04 | 2.17 ± 0.44 | 1.88 ± 1.02 | 0.025 |
| Range (Min–Max) | 63–84 | 63–84 | 63–84 | |
| Likeability (LIKE) | ||||
| Median (IQR) | 4.80 [0.40] | 1.20 [0.70] | 4.60 [0.35] | 0.016 |
| Perceived Intelligence (PI) | ||||
| Median (IQR) | 4.60 [1.00] | 2.40 [1.20] | 2.90 [2.05] | 0.021 |
| Perceived Safety (PSa) | ||||
| Median (IQR) | 3.67 [0.00] | 3.00 [0.83] | 2.67 [0.83] | 0.171 |
| Willingness to Interact with the Robot | ||||
|---|---|---|---|---|
| Domains of the RAQ | Probable | I Don’t Know | Improbable | p-Value |
| N. 13 | N. 3 | N. 4 | ||
| Pragmatic Quality (PQ) | ||||
| Median (IQR) | 2.00 [0.90] | 3.60 [1.20] | 4.00 [0.53] | 0.011 |
| Hedonic Quality—Identity (HQ-I) | ||||
| Mean ± SD | 2.00 ± 0.61 | 3.83 ± 0.65 | 3.10 ± 0.74 | 0.007 |
| Range (Min–Max) | 1.40–3.20 | 3.20–4.50 | 2.20–3.80 | |
| Hedonic Quality—Feeling (HQ-F) | ||||
| Median (IQR) | 1.40 [1.00] | 4.10 [0.90] | 3.30 [1.38] | 0.006 |
| Attractiveness (ATTr) | ||||
| Mean ± SD | 2.13 ± 0.66 | 3.80 ± 1.06 | 3.15 ± 0.82 | 0.016 |
| Range (Min–Max) | 1.30–3.60 | 2.60–4.60 | 2.40–4.00 | |
References
- Empowerment through Digital Health. Available online: https://www.who.int/europe/initiatives/empowerment-through-digital-health (accessed on 23 August 2023).
- Liu, J.X.; Goryakin, Y.; Maeda, A.; Bruckner, T.; Scheffler, R. Global health workforce labor market projections for 2030. Hum. Resour. Health 2017, 15, 11. [Google Scholar] [CrossRef] [PubMed]
- World Health Organization (WHO). Available online: https://www.who.int (accessed on 25 August 2023).
- Luperto, M.; Romeo, M.; Lunardini, F.; Basilico, N.; Abbate, C.; Jones, R.; Cangelosi, A.; Ferrante, S.; Borghese, N.A. Evaluating the acceptability of assistive robots for early detection of mild cognitive impairment. In Proceedings of the 2019 IEEE/RSJ International Conference on Intelligent Robots and Systems (IROS), Macau, China, 3–8 November 2019; pp. 1257–1264. [Google Scholar] [CrossRef]
- Lunardini, F.; Luperto, M.; Romeo, M.; Basilico, N.; Daniele, K.; Azzolino, D.; Damanti, S.; Abbate, C.; Mari, D.; Cesari, M.; et al. Supervised digital neuropsychological tests for cognitive decline in older adults: Usability and clinical validity study. JMIR mHealth uHealth 2020, 8, e17963. [Google Scholar] [CrossRef] [PubMed]
- Sorrentino, A.; Mancioppi, G.; Coviello, L.; Cavallo, F.; Fiorini, L. Feasibility study on the role of personality, emotion, and engagement in socially assistive robotics: A cognitive assessment scenario. Informatics 2021, 8, 23. [Google Scholar] [CrossRef]
- World Health Organization. Global Action Plan on the Public Health Response to Dementia 2017–2025; World Health Organization: Geneva, Switzerland, 2017.
- Yoshii, K.; Kimura, D.; Kosugi, A.; Shinkawa, K.; Takase, T.; Kobayashi, M.; Yamada, Y.; Nemoto, M.; Watanabe, R.; Ota, M.; et al. Screening of mild cognitive impairment through conversations with humanoid robots: Exploratory pilot study. JMIR Form. Res. 2023, 7, e42792. [Google Scholar] [CrossRef]
- Sorrentino, A.; Fiorini, L.; Mancioppi, G.; Cavallo, F.; Umbrico, A.; Cesta, A.; Orlandini, A. Personalizing care through robotic assistance and clinical supervision. Front. Robot. AI 2022, 9, 883814. [Google Scholar] [CrossRef]
- Pepper the Humanoid and Programmable Robot |Aldebaran. Available online: https://www.aldebaran.com/en/pepper (accessed on 25 August 2023).
- D’Onofrio, G.; Fiorini, L.; Sorrentino, A.; Russo, S.; Ciccone, F.; Giuliani, F.; Sancarlo, D.; Cavallo, F. Emotion recognizing by a robotic solution initiative (Emotive project). Sensors 2022, 22, 2861. [Google Scholar] [CrossRef]
- Asl, A.M.; Toribio-Guzmán, J.M.; van der Roest, H.; Castro-González, Á.; Malfaz, M.; Salichs, M.A.; Martin, M.F. The usability and feasibility validation of the social robot MINI in people with dementia and mild cognitive impairment; a study protocol. BMC Psychiatry 2022, 22, 760. [Google Scholar] [CrossRef]
- Cobo Hurtado, L.; Viñas, P.F.; Zalama, E.; Gómez-García-Bermejo, J.; Delgado, J.M.; Vielba García, B. Development and usability validation of a social robot platform for physical and cognitive stimulation in elder care facilities. Healthcare 2021, 9, 1067. [Google Scholar] [CrossRef]
- Heerink, M.; Kröse, B.; Evers, V.; Wielinga, B. Assessing acceptance of assistive social agent technology by older adults: The almere model. Int. J. Soc. Robot. 2010, 2, 361–375. [Google Scholar] [CrossRef]
- Song, Y.; Tao, D.; Luximon, Y. In robot we trust? The effect of emotional expressions and contextual cues on anthropomorphic trustworthiness. Appl. Ergon. 2023, 109, 103967. [Google Scholar] [CrossRef]
- Castilla, D.; Suso-Ribera, C.; Zaragoza, I.; Garcia-Palacios, A.; Botella, C. Designing icts for users with mild cognitive impairment: A usability study. Int. J. Environ. Res. Public Health 2020, 17, 5153. [Google Scholar] [CrossRef] [PubMed]
- Holthe, T.; Halvorsrud, L.; Karterud, D.; Hoel, K.A.; Lund, A. Usability and acceptability of technology for community-dwelling older adults with mild cognitive impairment and dementia: A systematic literature review. Clin. Interv. Aging 2018, 13, 863–886. [Google Scholar] [CrossRef] [PubMed]
- Guemghar, I.; Pires De Oliveira Padilha, P.; Abdel-Baki, A.; Jutras-Aswad, D.; Paquette, J.; Pomey, M.P. Social robot interventions in mental health care and their outcomes, barriers, and facilitators: Scoping review. JMIR Ment. Health 2022, 9, e36094. [Google Scholar] [CrossRef] [PubMed]
- Martín Rico, F.; Rodríguez-Lera, F.J.; Ginés Clavero, J.; Guerrero-Higueras, Á.M.; Matellán Olivera, V. An acceptance test for assistive robots. Sensors 2020, 20, 3912. [Google Scholar] [CrossRef]
- Schüssler, S.; Zuschnegg, J.; Paletta, L.; Fellner, M.; Lodron, G.; Steiner, J.; Pansy-Resch, S.; Lammer, L.; Prodromou, D.; Brunsch, S.; et al. The effects of a humanoid socially assistive robot versus tablet training on psychosocial and physical outcomes of persons with dementia: Protocol for a mixed methods study. JMIR Res. Protoc. 2020, 9, e14927. [Google Scholar] [CrossRef]
- Tombaugh, T.N.; McIntyre, N.J. The mini-mental state examination: A comprehensive review. J. Am. Geriatr. Soc. 1992, 40, 922–935. [Google Scholar] [CrossRef]
- Folstein, M.F.; Folstein, S.E.; McHugh, P.R. “Mini-mental state”. A practical method for grading the cognitive state of patients for the clinician. J. Psychiatr. Res. 1975, 12, 189–198. [Google Scholar] [CrossRef]
- Podpora, M.; Gardecki, A.; Beniak, R.; Klin, B.; Vicario, J.L.; Kawala-Sterniuk, A. Human interaction smart subsystem—Extending speech-based human-robot interaction systems with an implementation of external smart sensors. Sensors 2020, 20, 2376. [Google Scholar] [CrossRef]
- Bandi per Assegni di Ricerca. Available online: https://bandi.miur.it/bandi.php/public/fellowship/id_fellow/174310 (accessed on 31 August 2023).
- Filippini, C.; Spadolini, E.; Cardone, D.; Bianchi, D.; Preziuso, M.; Sciarretta, C.; del Cimmuto, V.; Lisciani, D.; Merla, A. Facilitating the child–robot interaction by endowing the robot with the capability of understanding the child engagement: The case of mio amico robot. Int. J. Soc. Robot. 2021, 13, 677–689. [Google Scholar] [CrossRef]
- Beckerle, P.; Salvietti, G.; Unal, R.; Prattichizzo, D.; Rossi, S.; Castellini, C.; Hirche, S.; Endo, S.; Amor, H.B.; Ciocarlie, M.; et al. A uman–robot interaction perspective on assistive and rehabilitation robotics. Front. Neurorobotics 2017, 11, 24. [Google Scholar]
- Filippini, C.; di Crosta, A.; Palumbo, R.; Perpetuini, D.; Cardone, D.; Ceccato, I.; di Domenico, A.; Merla, A. Automated affective computing based on bio-signals analysis and deep learning approach. Sensors 2022, 22, 1789. [Google Scholar] [CrossRef] [PubMed]
- Leong, S.C.; Tang, Y.M.; Lai, C.H.; Lee, C. Facial expression and body gesture emotion recognition: A systematic review on the use of visual data in affective computing. Comput. Sci. Rev. 2023, 48, 100545. [Google Scholar] [CrossRef]
- Saganowski, S.; Perz, B.; Polak, A.; Kazienko, P. Emotion Recognition for Everyday Life Using Physiological Signals From Wearables: A Systematic Literature Review. IEEE Trans. Affect. Comput. 2022, 14, 1876–1897. [Google Scholar] [CrossRef]
- Di Credico, A.; Perpetuini, D.; Izzicupo, P.; Gaggi, G.; Cardone, D.; Filippini, C.; Merla, A.; Ghinassi, B.; di Baldassarre, A. Estimation of Heart Rate Variability Parameters by Machine Learning Approaches Applied to Facial Infrared Thermal Imaging. Front. Cardiovasc. Med. 2022, 9, 893374. [Google Scholar] [CrossRef] [PubMed]
- Katz, S.; Downs, T.D.; Cash, H.R.; Grotz, R.C. Progress in development of the index of adl. Gerontol. 1970, 10, 20–30. [Google Scholar] [CrossRef] [PubMed]
- Lawton, M.P.; Brody, E.M. Assessment of older people: Self-maintaining and instrumental activities of daily living. Gerontologist 1969, 9, 179–186. [Google Scholar] [CrossRef]
- Bliss, M.R.; McLaren, R.; Exton-Smith, A.N. Mattresses for preventing pressure sores in geriatric patients. Mon. Bull. Minist. Health Public Health Lab. Serv. 1966, 25, 238–268. [Google Scholar]
- Guigoz, Y.; Vellas, B. The mini nutritional assessment (Mna) for grading the nutritional state of elderly patients: Presentation of the mna, history and validation. In Nestle Nutrition Workshop Series: Clinical & Performance Program; Vellas, B., Garry, P., Guigoz, Y., Eds.; Karger: Basel, Switzerland, 1999; Volume 1, pp. 3–12. [Google Scholar] [CrossRef]
- Pfeiffer, E. A short portable mental status questionnaire for the assessment of organic brain deficit in elderly patients. J. Am. Geriatr. Soc. 1975, 23, 433–441. [Google Scholar] [CrossRef]
- Linn, B.S.; Linn, M.W.; Gurel, L. Cumulative illness rating scale. J. Am. Geriatr. Soc. 1968, 16, 622–626. [Google Scholar] [CrossRef]
- Pilotto, A.; Ferrucci, L.; Franceschi, M.; D’Ambrosio, L.P.; Scarcelli, C.; Cascavilla, L.; Paris, F.; Placentino, G.; Seripa, D.; Dallapiccola, B.; et al. Development and validation of a multidimensional prognostic index for one-year mortality from comprehensive geriatric assessment in hospitalized older patients. Rejuvenation Res. 2008, 11, 151–161. [Google Scholar] [CrossRef]
- Brooke, J.B. SUS: A ’Quick and Dirty’ Usability Scale; CRC Press: Boca Raton, FL, USA, 1996. [Google Scholar]
- Esposito, A.; Amorese, T.; Cuciniello, M.; Pica, I.; Riviello, M.T.; Troncone, A.; Cordasco, G.; Esposito, A.M. Elders prefer female robots with a high degree of human likeness. In Proceedings of the 2019 IEEE 23rd International Symposium on Consumer Technologies (ISCT), Ancona, Italy, 19–21 June 2019; pp. 243–246. [Google Scholar] [CrossRef]
- Esposito, A.; Cuciniello, M.; Amorese, T.; Esposito, A.M.; Troncone, A.; Maldonato, M.N.; Vogel, C.; Bourbakis, N.; Cordasco, G. Seniors’ appreciation of humanoid robots. In Neural Approaches to Dynamics of Signal Exchanges; Esposito, A., Faundez-Zanuy, M., Morabito, F.C., Pasero, E., Eds.; Springer: Singapore, 2020; Volume 151, pp. 331–345. [Google Scholar] [CrossRef]
- Esposito, A.; Amorese, T.; Cuciniello, M.; Riviello, M.T.; Esposito, A.M.; Troncone, A.; Torres, M.I.; Schlögl, S.; Cordasco, G. Elder user’s attitude toward assistive virtual agents: The role of voice and gender. J. Ambient Intell. Humaniz. Comput. 2021, 12, 4429–4436. [Google Scholar] [CrossRef]
- Schulz, T.; Holthaus, P.; Amirabdollahian, F.; Koay, K.L.; Torresen, J.; Herstad, J. Differences of human perceptions of a robot moving using linear or slow in, slow out velocity profiles when performing a cleaning task. In Proceedings of the 2019 28th IEEE International Conference on Robot and Human Interactive Communication (RO-MAN), New Delhi, India, 14–18 October 2019; pp. 1–8. [Google Scholar] [CrossRef]
- Bartneck, C.; Kulić, D.; Croft, E.; Zoghbi, S. Measurement instruments for the anthropomorphism, animacy, likeability, perceived intelligence, and perceived safety of robots. Int. J. Soc. Robot. 2009, 1, 71–81. [Google Scholar] [CrossRef]
- Schrepp, M. User Experience Questionnaire Handbook; Springer: Berlin/Heidelberg, Germany, 2015. [Google Scholar] [CrossRef]
- Laugwitz, B.; Held, T.; Schrepp, M. Construction and evaluation of a user experience questionnaire. In Proceedings of the HCI and Usability for Education and Work, Graz, Austria, 20–21 November 2008; Holzinger, A., Ed.; Lecture Notes in Computer Science. Springer: Berlin/Heidelberg, Germany, 2008; pp. 63–76. [Google Scholar] [CrossRef]
- RoboMate System from Behaviour Labs. Available online: https://blabs.eu/robomate (accessed on 1 September 2023).
- Behavior Labs—Robotica e Realtà Virtuale. Available online: https://blabs.eu/ (accessed on 1 September 2023).
- Perpetuini, D.; Russo, E.F.; Cardone, D.; Palmieri, R.; Filippini, C.; Tritto, M.; Pellicano, F.; de Santis, G.P.; Pellegrino, R.; Calabrò, R.S.; et al. Psychophysiological assessment of children with cerebral palsy during robotic-assisted gait training through infrared imaging. Int. J. Environ. Res. Public Health 2022, 19, 15224. [Google Scholar] [CrossRef]
- Cardone, D.; Perpetuini, D.; Filippini, C.; Mancini, L.; Nocco, S.; Tritto, M.; Rinella, S.; Giacobbe, A.; Fallica, G.; Ricci, F.; et al. Classification of drivers’ mental workload levels: Comparison of machine learning methods based on ecg and infrared thermal signals. Sensors 2022, 22, 7300. [Google Scholar] [CrossRef] [PubMed]
- Cardone, D.; Spadolini, E.; Perpetuini, D.; Filippini, C.; Chiarelli, A.M.; Merla, A. Automated warping procedure for facial thermal imaging based on features identification in the visible domain. Infrared Phys. Technol. 2021, 112, 103595. [Google Scholar] [CrossRef]
- Shastri, D.; Merla, A.; Tsiamyrtzis, P.; Pavlidis, I. Imaging facial signs of neurophysiological responses. IEEE Trans. Biomed. Eng. 2009, 56, 477–484. [Google Scholar] [CrossRef]
- Russell, J.A. A circumplex model of affect. J. Personal. Soc. Psychol. 1980, 39, 1161–1178. [Google Scholar] [CrossRef]
- Neumann, S.A.; Waldstein, S.R. Similar patterns of cardiovascular response during emotional activation as a function of affective valence and arousal and gender. J. Psychosom. Res. 2001, 50, 245–253. [Google Scholar] [CrossRef]
- Patlar Akbulut, F. Evaluating the Effects of The Autonomic Nervous System and Sympathetic Activity on Emotional States. İstanbul Ticaret Üniv. Fen Bilim. Derg. 2022, 21, 156–169. [Google Scholar] [CrossRef]
- Kosonogov, V.; de Zorzi, L.; Honoré, J.; Martínez-Velázquez, E.S.; Nandrino, J.L.; Martinez-Selva, J.M.; Sequeira, H. Facial thermal variations: A new marker of emotional arousal. PLoS ONE 2017, 12, e0183592. [Google Scholar] [CrossRef]
- Filippini, C.; Perpetuini, D.; Cardone, D.; Merla, A. Improving human–robot interaction by enhancing nao robot awareness of human facial expression. Sensors 2021, 21, 6438. [Google Scholar] [CrossRef] [PubMed]
- Posner, J.; Russell, J.A.; Peterson, B.S. The circumplex model of affect: An integrative approach to affective neuroscience, cognitive development, and psychopathology. Dev. Psychopathol. 2005, 17, 715–734. [Google Scholar] [CrossRef] [PubMed]
- R: The R Project for Statistical Computing. Available online: https://www.r-project.org/ (accessed on 1 September 2023).
- Rossi, S.; Santangelo, G.; Staffa, M.; Varrasi, S.; Conti, D.; di Nuovo, A. Psychometric evaluation supported by a social robot: Personality factors and technology acceptance. In Proceedings of the 2018 27th IEEE International Symposium on Robot and Human Interactive Communication (RO-MAN), Nanjing, China, 27–31 August 2018; pp. 802–807. [Google Scholar] [CrossRef]
- Empathic Project. Available online: http://www.empathic-project.eu/ (accessed on 4 September 2023).
- Perpetuini, D.; Chiarelli, A.M.; Cardone, D.; Filippini, C.; Rinella, S.; Massimino, S.; Bianco, F.; Bucciarelli, V.; Vinciguerra, V.; Fallica, P.; et al. Prediction of state anxiety by machine learning applied to photoplethysmography data. PeerJ 2021, 9, e10448. [Google Scholar] [CrossRef] [PubMed]
- Szczepanowski, R.; Cichoń, E.; Arent, K.; Sobecki, J.; Styrkowiec, P.; Florkowski, M.; Gakis, M. Education biases perception of social robots. Eur. Rev. Appl. Psychol. 2020, 70, 100521. [Google Scholar] [CrossRef]
- D’Onofrio, G.; Sancarlo, D.; Raciti, M.; Burke, M.; Teare, A.; Kovacic, T.; Cortis, K.; Murphy, K.; Barrett, E.; Whelan, S.; et al. Mario project: Validation and evidence of service robots for older people with dementia. J. Alzheimer’s Dis. JAD 2019, 68, 1587–1601. [Google Scholar] [CrossRef]
- Fuentetaja, R.; García-Olaya, A.; García, J.; González, J.C.; Fernández, F. An automated planning model for hri: Use cases on social assistive robotics. Sensors 2020, 20, 6520. [Google Scholar] [CrossRef]


| Questionnaire | Description |
|---|---|
| Almere Model Questionnaire (AMQ) | The questionnaire assesses the intention of use, anxiety, trust, enjoyment, and ease of use. The responses are measured on a Likert scale, with values ranging from 1 to 5, and then an average value for each domain is calculated [14]. |
| Godspeed | The questionnaire evaluates the appearance and design of the robot in terms of anthropomorphism, animacy, likability, perceived intelligence, and perceived safety. The responses consist of opposing adjectives as items, per domain, and are measured on a Likert scale from 1 to 7 [43]. |
| Robot Acceptance Questionnaire (RAQ) | This questionnaire evaluates the acceptance of the robot based on its pragmatic, hedonic, and attractiveness qualities, the attributed and perceived age of the robot, and the tasks it can perform. It is divided into different sections (at least 6) and scored on a Likert scale from 1 to 5 [39]. |
| User Experience Questionnaire (UEQ) | The questionnaire aims to assess the pragmatic and hedonic quality of a specific product. Similar to Godspeed, it is designed with opposing adjectives as items, per domain, and is measured on a Likert scale from 1 to 7 [44]. |
| System Usability Scale (SUS) | The SUS test is a ten-item questionnaire. The scores vary from 0 to 100 and are measured on a Likert scale (from 1 to 5). The SUS questionnaire is capable of acquiring a subjective assessment of usability. A value above 68 is considered acceptable [38]. |
| VIS Device | IR Device | |
|---|---|---|
| Technical Data | Intel RealSense D415 | FLIR Boson 320 LWIR |
| Weight | 4.54 g | 7.5 g w/o lens |
| Dimensions | 99 × 20 × 23 mm | 21 × 21 × 11 mm w/o lens |
| Spatial Resolution | 720 × 720 px | 320 × 256 px |
| Framerate | 10 Hz | 10 Hz |
| Variables (Min–Max) | N. 20 |
|---|---|
| Traditional MMSE (0–30) | 26.35 [23.56–28.78] |
| Robotic MMSE (0–30) | 26.20 [23.00–27.15] |
| ADL (4–6) | 6 [6–6] |
| IADL (0–8) | 8 [7.25–8.00] |
| SPMSQ (0–10) | 1.00 [2.00–1.00] |
| CIRS-CI (0–3) | 2.00 [1.75–3.00] |
| MNA (<17–≥24) | 22.01 ± 2.13 |
| ESS (5–20) | 18.00 [18.00–18.00] |
| MPI (0–1) | 0.17 [0.17–0.25] |
| AMQ Items (Min–Max) | N. 20 |
|---|---|
| Anxiety (ANX) | 4.63 [3.94–5.00] |
| Attitude (ATT) | 3.22 ± 1.25 |
| Facilitating Conditions (FC) | 2.30 ± 0.91 |
| Intention to Use (ITU) | 2.83 [1.00–4.00] |
| Perceived Adaptability (PAD) | 3.50 [1.58–4.17] |
| Perceived Enjoyment (PENJ) | 3.40 ± 1.27 |
| Perceived Ease of Use (PEOU) | 3.13 ± 1.01 |
| Perceived Sociability (PS) | 3.71 ± 1.08 |
| Perceived Utility (PU) | 3.03 ± 1.13 |
| Social Influence (SI) | 3.00 [1.38–4.00] |
| Social Presence (SP) | 1.80 [1.00–2.80] |
| Trust | 3.50 [1.00–4.00] |
| Godspeed’s Domains | N. 20 |
|---|---|
| Anthropomorphism (ANTP) | 2.10 [1.55–3.25] |
| Animation (ANM) | 2.80 ± 1.11 |
| Likeability (LIKE) | 4.60 [3.40–4.85] |
| Perceived Intelligence (PI) | 4.00 [3.40–5.00] |
| Perceived Safety (PSa) | 3.66 [2.83–3.66] |
| RAQ’s Domains | N. 20 |
|---|---|
| Pragmatic Quality (PQ) | 2.35 [1.75–3.38] |
| Hedonic Quality—Identity (HQ-I) | 2.50 ± 0.94 |
| Hedonic Quality—Feeling (HQ-F) | 2.15 [1.35–2.90] |
| Attractiveness (ATTr) | 2.59 ± 0.97 |
| UEQ’s Domains | N. 20 | Cronbach’s | SUS’s Spearman | p-Value |
|---|---|---|---|---|
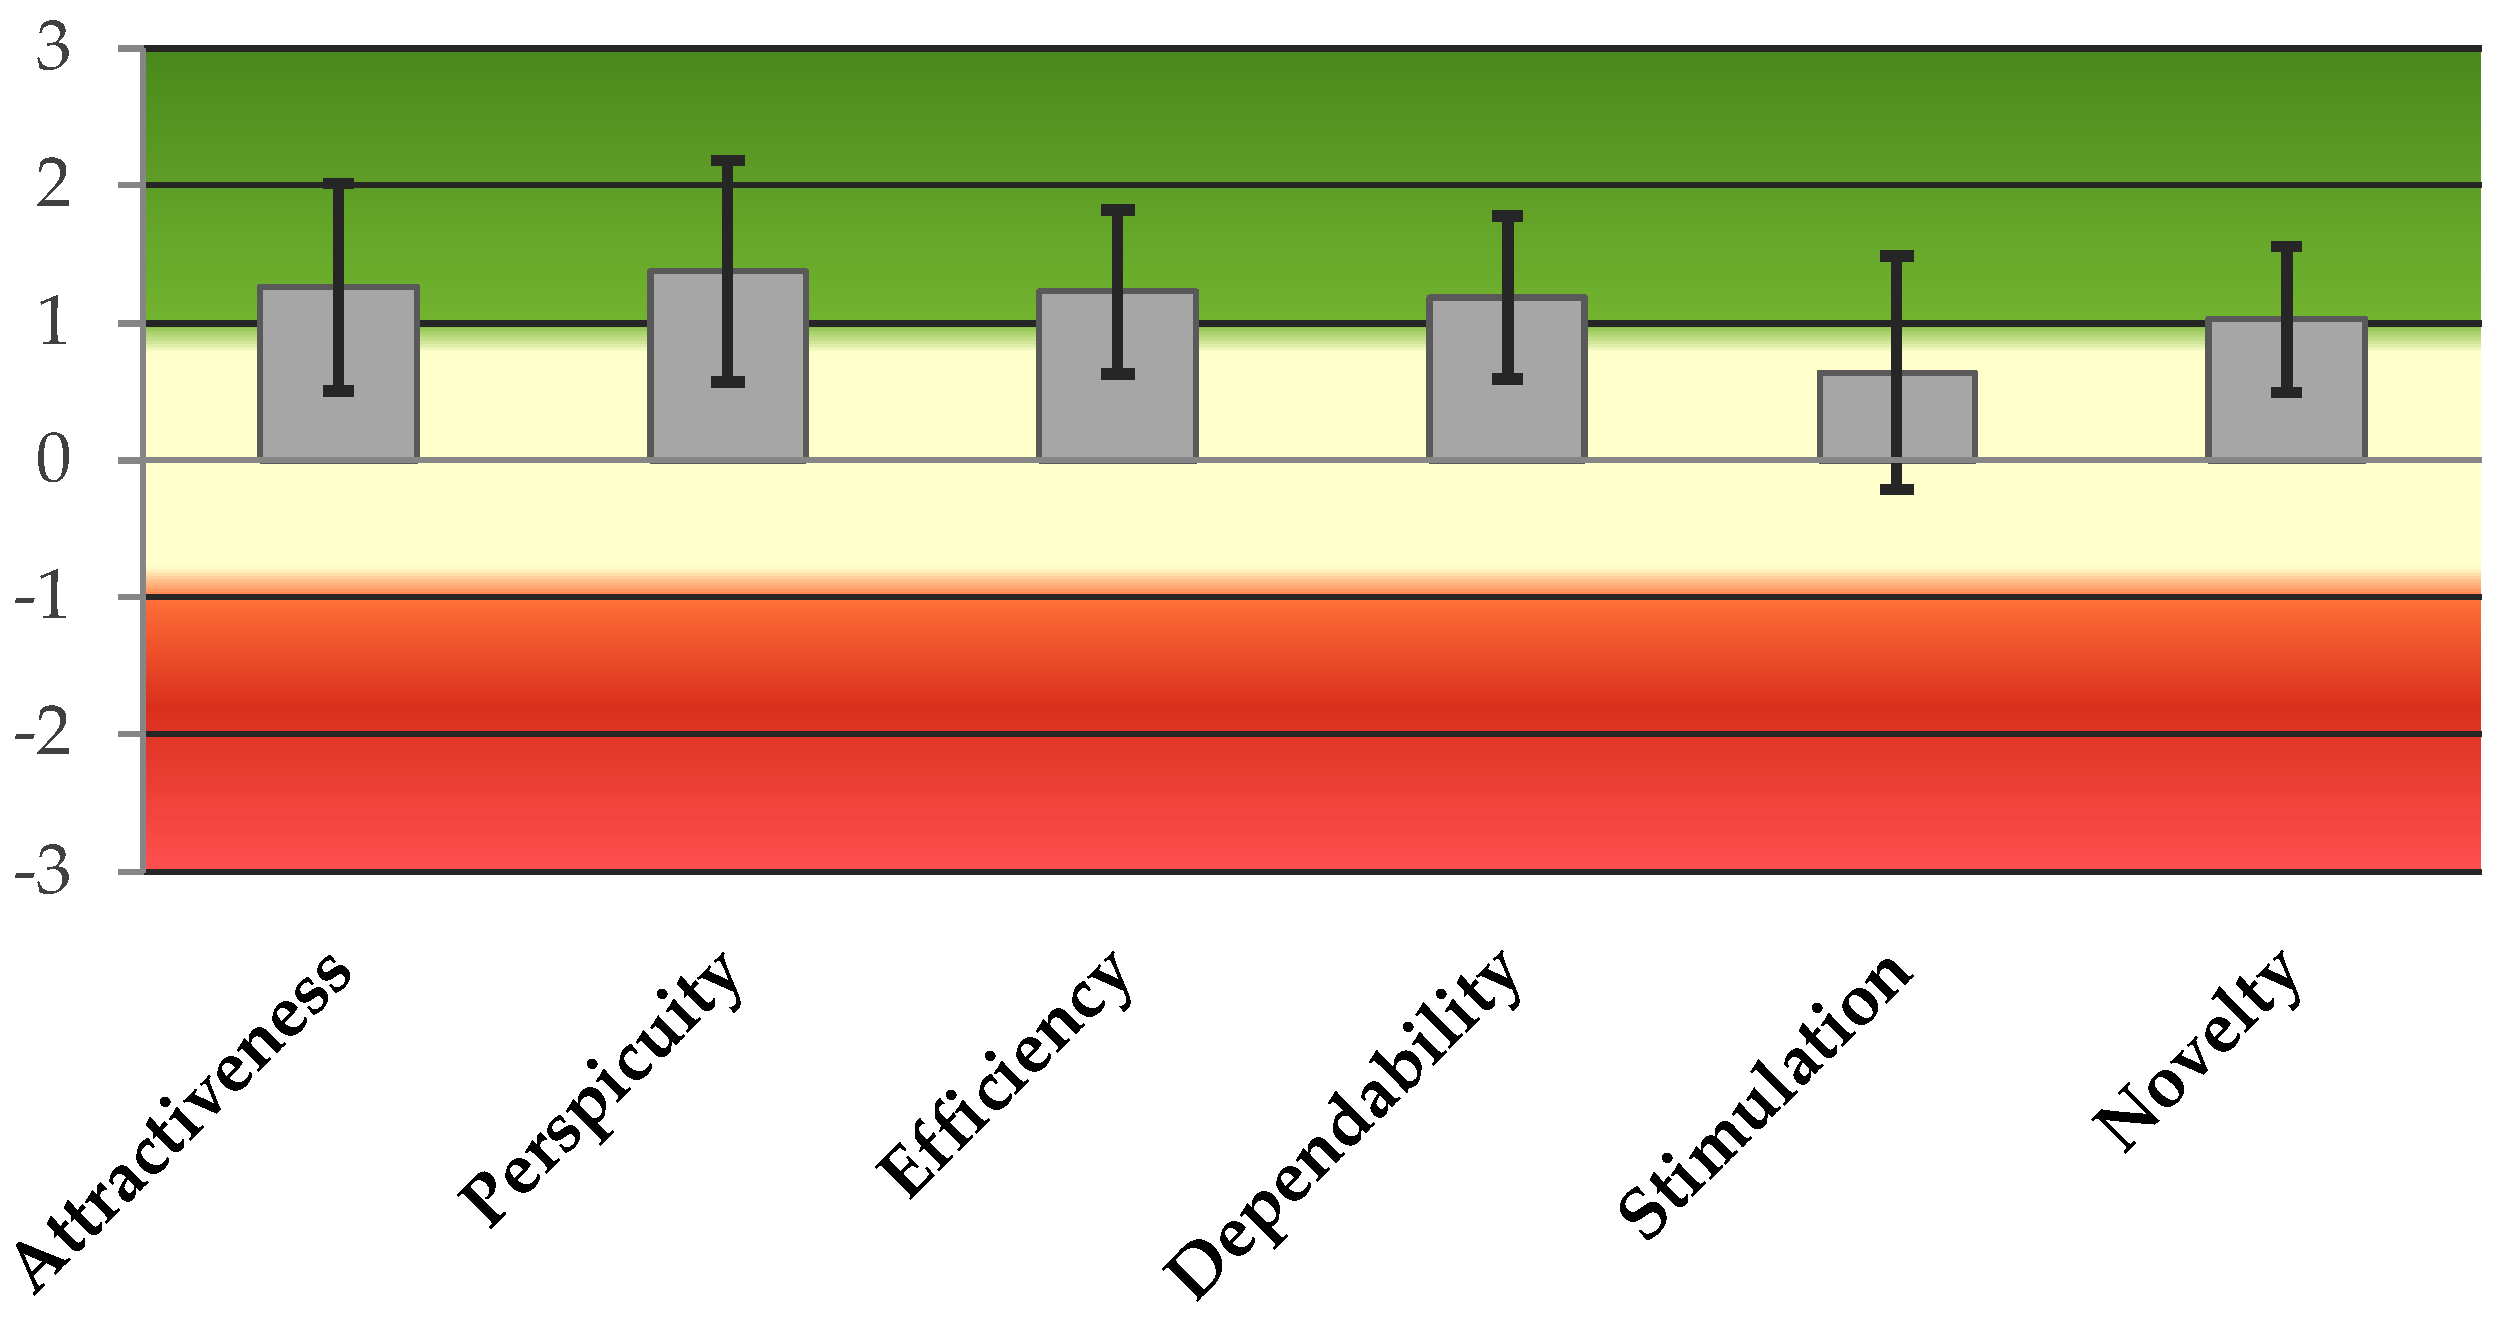
| Attractiveness | 1.92 [0.13–2.58] | 0.853 | 0.490 | * |
| Perspicuity | 2.12 [0.75–2.75] | 0.829 | 0.540 | * |
| Efficiency | 1.23 ± 1.38 | 0.542 | 0.700 | *** |
| Dependability | 1.50 [0.63–2.00] | 0.423 | 0.720 | *** |
| Stimulation | 0.64 ± 1.95 | 0.827 | 0.600 | ** |
| Novelty | 1.03 ± 1.21 | 0.159 | 0.290 |
| Domains of the AMQ | Spearman | p-Value |
|---|---|---|
| Attitude (ATT) | −0.580 | 0.008 ** |
| Intention to use (ITU) | −0.560 | 0.011 * |
| Perceived Adaptability (PAD) | −0.570 | 0.009 ** |
| Perceived Enjoyment (PENJ) | −0.590 | 0.006 ** |
| Perceived Utility (PU) | −0.500 | 0.026 * |
| Negative Valence | Positive Valence |
|---|---|
| High Arousal and Negative Valence (Tense) = 7.92% | High Arousal and Positive Valence (Excited) = 9.57% |
| Medium Arousal and Negative Valence (Cautious) = 35.60% | Medium Arousal and Positive Valence (Focused) = 40.91% |
| Low Arousal and Negative Valence (Bored) = 6.01% | Low Arousal and Positive Valence (Calm) = 0.00% |
Disclaimer/Publisher’s Note: The statements, opinions and data contained in all publications are solely those of the individual author(s) and contributor(s) and not of MDPI and/or the editor(s). MDPI and/or the editor(s) disclaim responsibility for any injury to people or property resulting from any ideas, methods, instructions or products referred to in the content. |
© 2023 by the authors. Licensee MDPI, Basel, Switzerland. This article is an open access article distributed under the terms and conditions of the Creative Commons Attribution (CC BY) license (https://creativecommons.org/licenses/by/4.0/).
Share and Cite
Russo, S.; Lorusso, L.; D’Onofrio, G.; Ciccone, F.; Tritto, M.; Nocco, S.; Cardone, D.; Perpetuini, D.; Lombardo, M.; Lombardo, D.; et al. Assessing Feasibility of Cognitive Impairment Testing Using Social Robotic Technology Augmented with Affective Computing and Emotional State Detection Systems. Biomimetics 2023, 8, 475. https://doi.org/10.3390/biomimetics8060475
Russo S, Lorusso L, D’Onofrio G, Ciccone F, Tritto M, Nocco S, Cardone D, Perpetuini D, Lombardo M, Lombardo D, et al. Assessing Feasibility of Cognitive Impairment Testing Using Social Robotic Technology Augmented with Affective Computing and Emotional State Detection Systems. Biomimetics. 2023; 8(6):475. https://doi.org/10.3390/biomimetics8060475
Chicago/Turabian StyleRusso, Sergio, Letizia Lorusso, Grazia D’Onofrio, Filomena Ciccone, Michele Tritto, Sergio Nocco, Daniela Cardone, David Perpetuini, Marco Lombardo, Daniele Lombardo, and et al. 2023. "Assessing Feasibility of Cognitive Impairment Testing Using Social Robotic Technology Augmented with Affective Computing and Emotional State Detection Systems" Biomimetics 8, no. 6: 475. https://doi.org/10.3390/biomimetics8060475