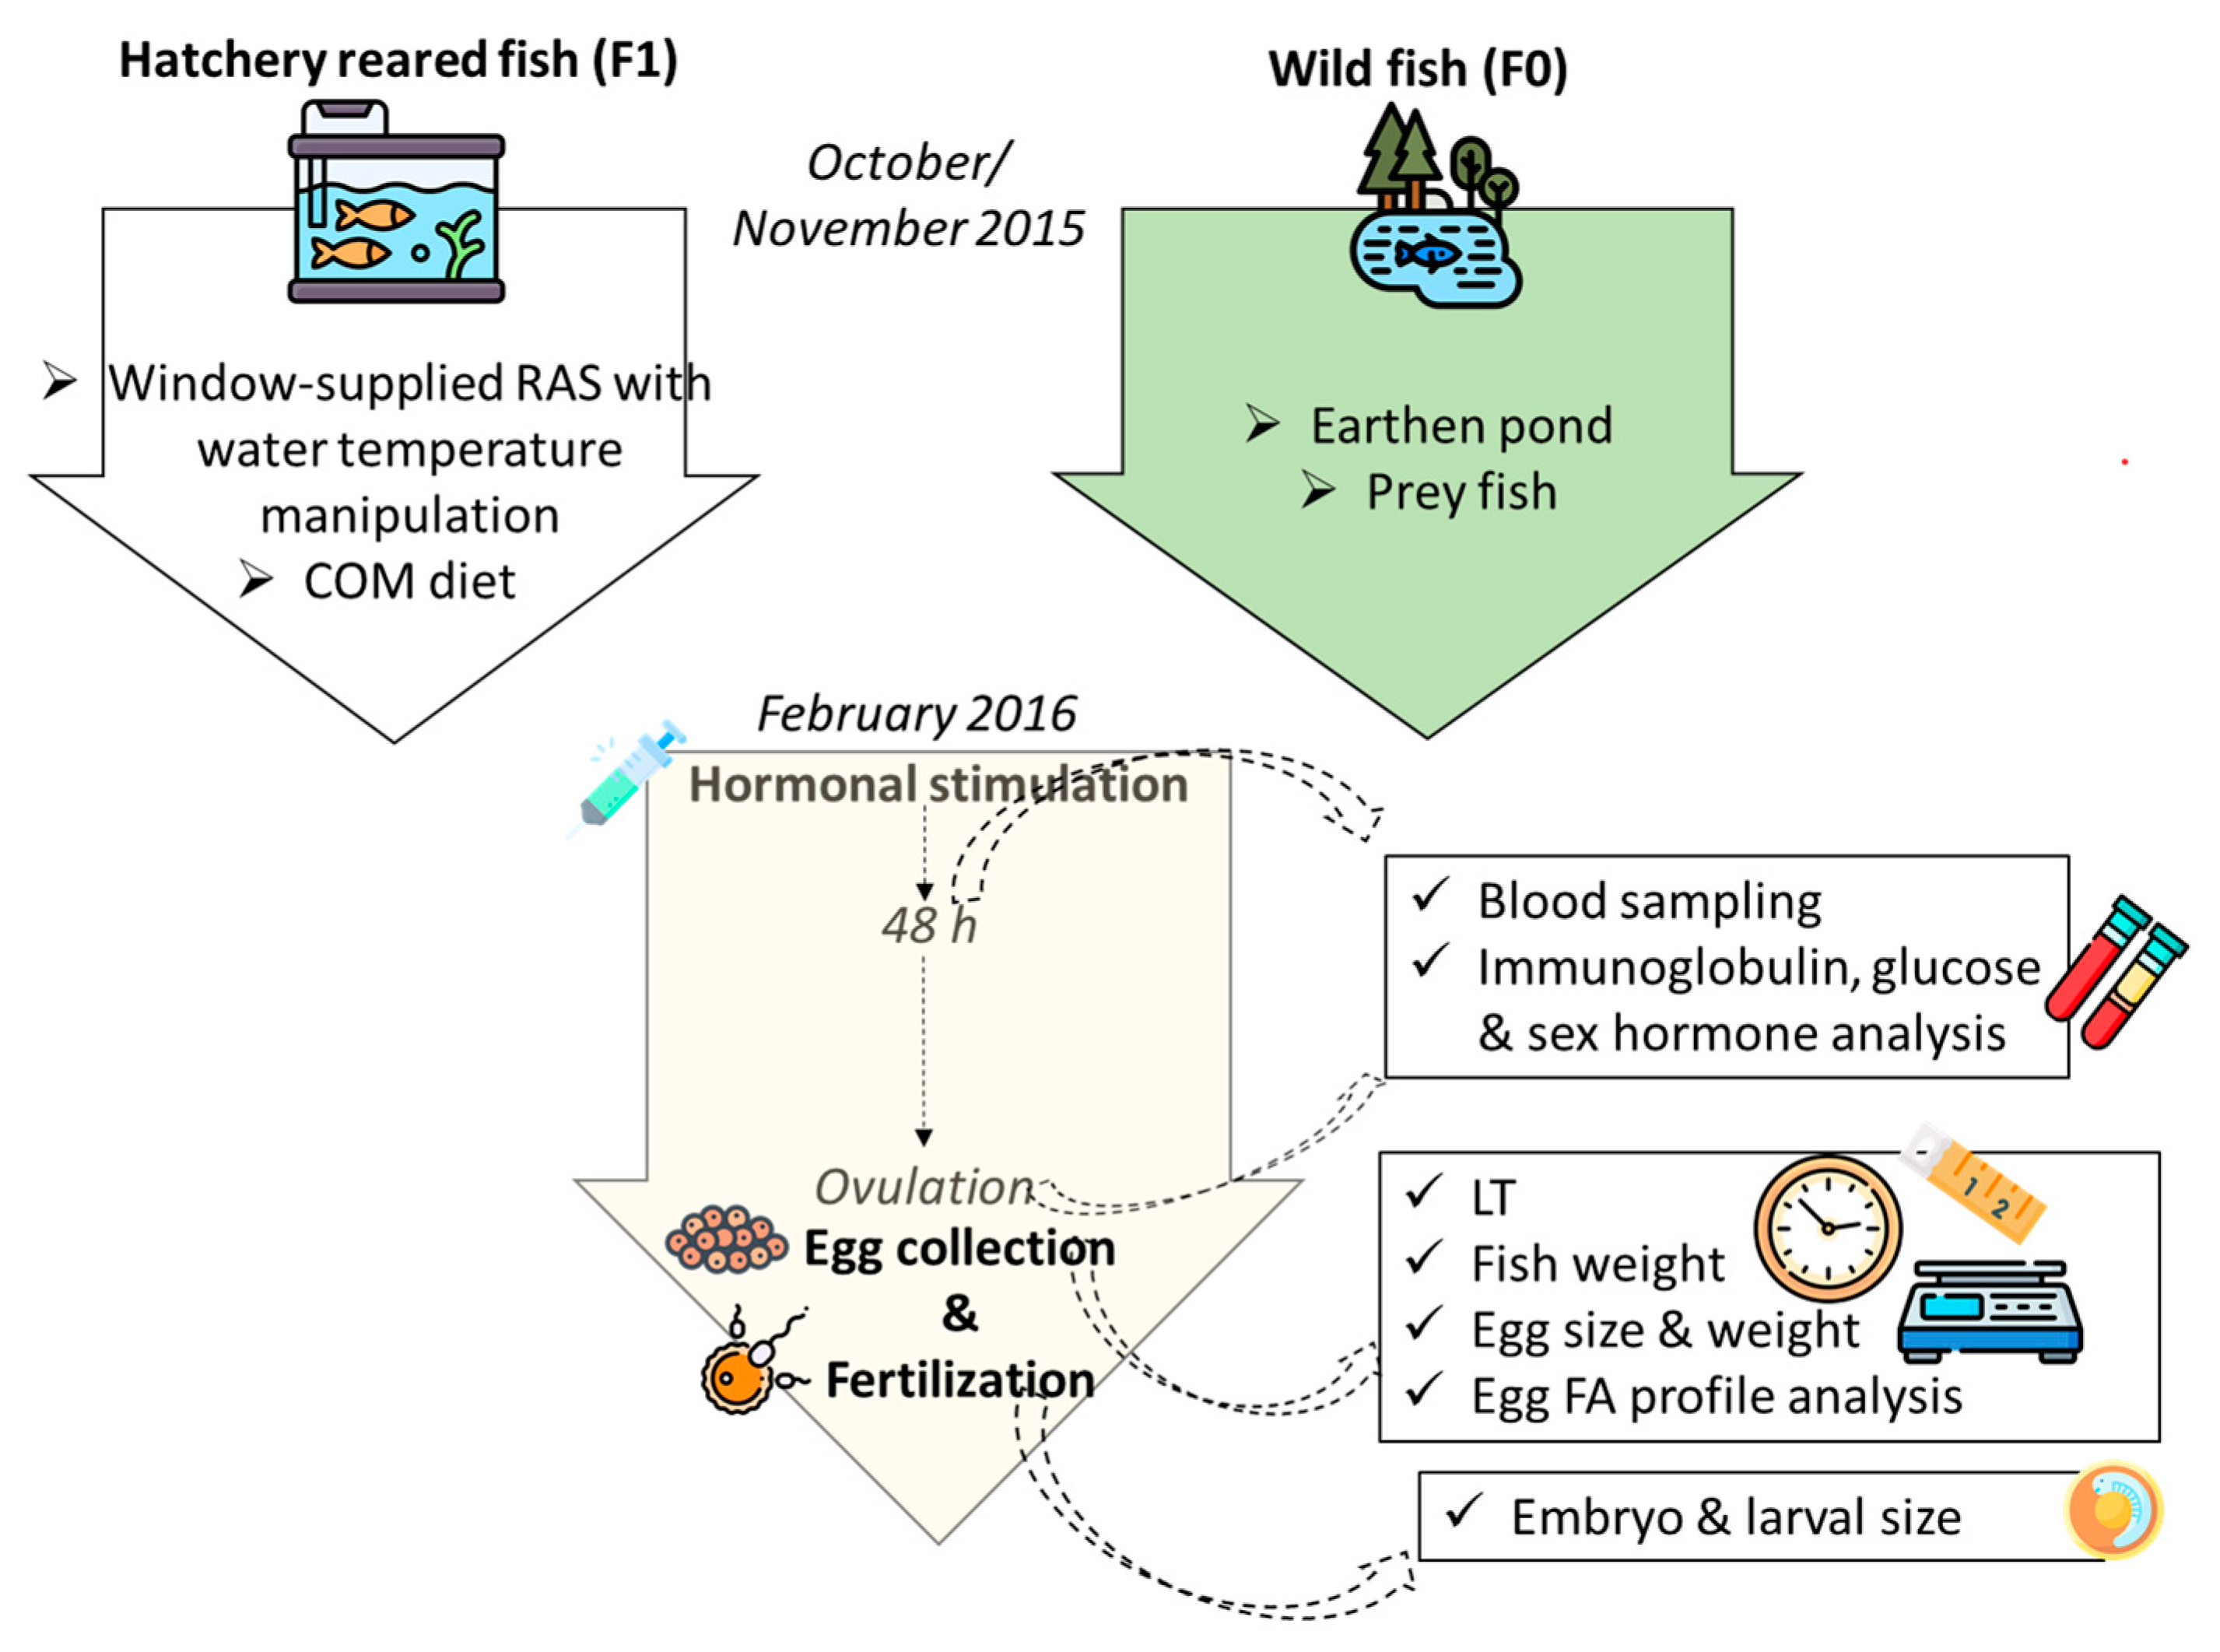
Article

Reproduction of Hatchery-Reared Pike-Perch (Sander lucioperca) Fed Diet with Low-Marine-Ingredients: Role of Dietary Fatty Acids

1
Research Centre for Aquaculture and Fisheries, Institute of Aquaculture and Environmental Safety, Hungarian University of Agriculture and Life Sciences, Anna-Liget Str. 35, H-5540 Szarvas, Hungary
2
Laboratory for Molecular Microbiology (LMM), Institute of Molecular Genetics and Genetic Engineering (IMGGE), University of Belgrade, Vojvode Stepe 444a, 11042 Belgrade, Serbia
3
UR AFPA, USC INRAE 340, Université de Lorraine, Boulevard des Aiguillettes, 54500 Vandoeuvre-lès-Nancy, France
*
Author to whom correspondence should be addressed.
Fishes 2023, 8(5), 219; https://doi.org/10.3390/fishes8050219
Submission received: 19 March 2023 / Revised: 13 April 2023 / Accepted: 20 April 2023 / Published: 22 April 2023
(This article belongs to the Section Nutrition and Feeding)

Abstract

:
This research aimed to evaluate the reproductive potential of hatchery-reared (F1) pike-perch (Sander lucioperca) broodstock fed a commercial diet with low levels of long-chain polyunsaturated fatty acids (Lc-PUFA) and wild (F0) pike-perch broodstock fed forage fish. Reproductive parameters, including pseudogonadosomatic index (PGSI), egg size, latency time, hatching rate, embryo survival, and eggs’ fatty acid (FA) composition, as well as plasma sex hormone, glucose and immunoglobulin levels after hormone injection, were analyzed. The results showed low PGSI (10% in F1 vs. 14% in F0) and embryo survival (24% in F1 vs. 61% in F0) in F1 broodstock, but a satisfactory hatching rate (63% in F1 vs. 78% in F0) and larval size (4.6 mm in F1 vs. 4.7 mm in F0). A low arachidonic acid (ARA) percentage in F1 fish eggs (1.32%), along with increased immunoglobulin levels (17.31 g/L), suggests that immune system activation might have depleted the reserves of ARA in F1 fish, which is the key fatty acid for successful oocyte maturation. We assumed that the administration of more sustainable diets, based on terrestrial plant ingredients, is not inferior to higher-quality diets based on marine ingredients.
Key Contribution: This research demonstrated that docosahexaenoic (DHA) and eicosapentaeonic acid (EPA) in broodstock diets may not be critical for the reproductive performance of hatchery-reared pike-perch broodstock. It further showed intense immunological reaction to external stimuli of hatchery-reared pike-perch. Strategies to improve F1 broodstock’s reproductive potential through diet and fish’s immunological status corrections are proposed.

1. Introduction

Rising interest in percid cultivation across Europe has urged the need for complete control of the life cycle of these species. Due to their great adaptability to indoor farming, which is mainstream in resource-sparing fish production, percids—and particularly pike-perch (Sander lucioperca)—have been identified as key fish species for the diversification of European aquaculture [1]. Pike-perch has reached level four of domestication, but wild broodstock are still used as the source of reproductive material [2]. The reasons behind the inferior reproductive performance of farmed pike-perch and other fish species have not been elucidated so far, though nutritional factors are suspected to play a critical role in oocyte growth and larval survival [3,4].
Oocytes’ lipid content is one of the main predictors of fish fertility. Lipids and fatty acids (FA) are the most important nutrients from the aspect of fish reproduction [5]. Deposition of FA in finfish oocytes occurs during the previtellogenesis state when neutral lipids (NL) are deposited, and during the vitellogenesis state, when phospholipid (PL) accumulation occurs [6]. Arachidonic acid (ARA) is the most important FA linked to gamete quality, and a deficit in this FA in cultured broodstock’s oocytes has been demonstrated in numerous fish species [4,7]. ARA is synthesized through desaturation and elongation reactions from linoleic acid (LA). It serves as a substrate for cyclooxygenase (COX) and 5-lipooxigenase (LOX), giving rise to prostaglandins (PG) and leukotrienes (LT), respectively. Aside from both pro- and anti-inflammatory activities, products of COX activity play a significant role in fish reproduction, though the exact mechanisms have not been elucidated yet [8].
Fatty acids (FA) in oocytes come from dietary sources and de novo synthesis [8]. In general, feed supplied to hatchery-reared fish throughout the on-growing and maturation periods is deficient in polyunsaturated fatty acids (PUFA), particularly ARA [9]. Hence, deficiency in the feed may be one of the reasons for lower ARA accumulation reported in hatchery-reared broodstock’s oocytes [7]. However, in a study performed in 2017, the reproductive potential of wild and hatchery pike-perch broodstock fed forage fish high in ARA [10] was assessed. Although this study can have substantial implications in evaluating the role of fish physiology and/or feeding history in reproductive efficiency, it does not account for the lower feeding efficacy of F1 broodstock in comparison to F0 fish, due to different cognition and preying capacities between the two fish populations [11,12] Anyway, it indicated the potentially lower intrinsic capacity of F1 fish to accumulate ARA in oocytes. This finding was further confirmed when hatchery fish were fed with feed enriched with ARA at the same percentage as was present in live feed [13].
Aside from ARA, docosahexaenoic (DHA) and eicosapentaenoic acid (EPA) have been considered to affect oocyte quality in maturing fish, which is the reason why broodstock diets are supplemented with DHA- and EPA-rich ingredients, predominantly fish oil [14]. However, even formulated diets rich in DHA and EPA fail to provide satisfactory reproductive performance of hatchery-reared pike-perch broodstock, as shown in the previous study [13]. Moreover, due to competition between DHA, EPA, and ARA for incorporation into membrane phospholipids and/or enzymes involved in eicosanoid synthesis [15,16], DHA/EPA/ARA ratios in diets may be more important than their absolute levels, both for fish growth and reproductive success [17,18]. Ratio 3:2:2 was found to be optimal for satisfactory egg and larval quality in Eurasian perch [19], and diets high in marine ingredients do not necessarily meet this requirement [13]. Hence, the application of high-cost diets may unduly increase farming costs, without any advantage to lower-cost, more sustainable diets with a lower inclusion of marine ingredients. The present study therefore aimed to assess the reproductive performance of hatchery pike-perch broodstock fed locally produced commercial feed with a significant substitution of fishmeal with vegetable protein sources, and to compare it to the performance of wild fish fed forage fish. It further aimed to estimate the potential influence of FA content in diet on the FA profile in oocytes after ovulation and to interpret the obtained results in the light of present and recent findings on fish adaptation to the farming environment.

2. Materials and Methods

Fish manipulation was carried out as written in the regulations of the Animal Ethical Panel of the Research Center of Fisheries and Aquaculture (HAKI), Hungarian University of Agriculture and Life Sciences (MATE), established according to Hungarian State law (10/1999.I.27.).

2.1. Diet Analysis

Two diets were used in this research: forage fish and locally purchased commercial feed having low levels of marine ingredients (COM diet). Formulation of this feed is not presented here due to intellectual property issues; nevertheless, the ingredients are in descending order as follows: wheat, rice bran, soybean meal (C.P. 46), extruded soymeal, fish meal (C.P. 60%), poultry meal, poultry hydrolyzed protein, blood meal, corn gluten (C.P. 60%), animal fat, CARGILL premix. The premix composition (quantity/kg) used is as follows: vitamin A—1,000,000 IU; vitamin D3—80,000 IU; vitamin E—5000 mg; vitamin K3—334 mg; vitamin B6—200 mg; vitamin C (ascorbic acid monophosphate)—11,300 mg; Ca—114 g; P—78 g; Na—1 g; Fe—670 mg; Zn—1070 mg; Mn—160 mg; Cu (CuSO4*5H2O)—200 mg; Se—20 mg; lysine—70 g; methionine—198 g.
Proximate compositions of the diets were analyzed by standard methods of the AOAC [20] and are presented in Table 1. Forage fish (n = 10) were homogenized, and four aliquots were involved in the analysis. In the case of formulated feed, measurements were performed in duplicate. The FA compositions of the diets were analyzed using the gas chromatography method. Lipids were extracted from the samples using a 2:1 mixture of chloroform and methanol. The extracts were purified according to the method of Folch et al., 1957 [21]. Aliquots of total lipid samples were transesterified using a methanolic solution of HCl [22]. Fatty acid methyl esters (FAME) were separated on fused silica capillary columns (DB-225) in an AGILENT (HP) gas chromatograph system (type ‘6890N’) equipped with a flame ionization detector (FID) and a mass spectrometer (MS) detector (MSD, type ‘5973N’). FAMEs were identified using authentic primary (SUPELCO, Bellefonte, NJ, USA) or secondary standards (e.g., linseed oil, cod liver oil) and employing the relationship between the logarithms of relative retention times and the carbon number (Cn) of fatty acids. Fatty acid concentrations are expressed as a weight percentage of the FA sample, as assessed by the retention factor and molar concentration of FAME [23,24]. Data on fatty acid composition of forage fish and COM diet are presented in Table 2.

2.2. Fish Origin

Two stocks were used in the present research (Figure 1): wild breeders (F0), harvested from the oxbow of the river Körös; and F1 stock, originating from artificially reproduced wild breeders harvested earlier from the same location. While being reared in flow-through tank from three months old (mo), these fish (F1) were transferred to RAS in October 2015 (30 mo). The age of the F1 group at the time of artificial reproduction was 36 mo, while the age of wild breeders was unknown. Considering the common thermal regime that these groups of fish experienced and also their similar size, an age disagreement between the groups is less likely; nevertheless, it cannot be fully excluded. RAS was composed of three 4 m3 tanks and supplied with a window of 0.5 × 1.2 m in order to maintain natural photoperiod, while the water temperature was manipulated as shown in Figure 2. The range of the light intensity on the tanks’ water surface was 1–40 lux. From July 2015, F1 fish were fed the COM diet. During the autumn (cooling), breeders were fed 2–5 times per week with 0.7% biomass daily rate, depending on the temperature. Wild breeders (F0) were harvested in mid-November of 2015 and transported to a 700 m2 earthen pond supplied with 25 % of total pike-perch biomass, with prey fish harvested at the same occasion. This kind of broodstock maintenance, where the breeders can hunt live prey during autumn and winter, presents a traditional strategy in this region. In early February 2016, six males and females were transported to the indoor facility of MATE HAKI for one week of slow water equilibration at 13 °C. Afterwards, fish were stocked in the separated 4 m3 tank of the same broodstock’s RAS where the F1 group was maintained, and kept at a stable 13 °C for the next two weeks.

2.3. Artificial Reproduction Procedure

On 23 February 2016, hormonal stimulation of final oocyte maturation (FOM) and ovulation took place. In total, six females and six males were treated with 500 IU/kg and 250 IU/kg, respectively, of human chorionic gonadotropin (hCG) (Choragon, Ferring International Center S.A., Saint-Prex, Switzerland). At the moment of the hormonal stimulation, the sample of oocytes was taken using a catheter (size CH06, infant feeding tube), and upon clarification in Serra solution (96% alcohol, 35% formalin, and glacial acetic acid in a ratio of 6:3:1 v/v, respectively), the FOM stage was evaluated as described in Zarski et al., 2012 [26]. Once the oocytes were found in stage VI (germinal vesicle breakdown), the genital papilla of the respective female was sutured to prevent the spontaneous discarding of eggs in the tank following ovulation [27]. Upon suture, the fish was evaluated for ovulation every four hours. Once the ovulation was noticed by a flow of the eggs from the genital papilla upon the gentle massage of the fish’s abdomen, the eggs were stripped. Upon collection of the eggs, both weights of the eggs and females were assessed. Accordingly, pseudogonadosomatic index (PGSI) was calculated as the ratio of total egg mass to individual fish weight. Further on, the fresh sperm of the two males from the respective group were stripped via a catheter. The sperm of two males were used per each female; nevertheless, the sperm of all males were used during reproduction to fertilize the eggs of all females in the respective group. In a timeframe of up to 15 min from stripping, the gametes were mixed at the ratio of 1 mL of sperm per 100 g of eggs, and further activated using the hatchery freshwater. To prevent egg clumping in the incubation jar, egg de-adhesion was performed using the milk + kaolin method, as explained by Ljubobratovic et al., 2019 [28]. Upon de-adhesion, the eggs of each female were placed in a separate Zug jar, and their volume was assessed. During incubation, dead eggs were regularly siphoned from the incubator, and 72 h postfertilization, eggs were left to settle, and their volume was assessed, as well as the percentage of alive eggs, via two samples of about 100 eggs per jar. Using these data, the fertilization rate was calculated as follows:
Embryo   survival = volume   of   eggs   72   h   after   fertilization volume   of   eggs   at   the   time   of   stocking   into   Zug   jar mean   percentage   of   live   eggs
Once the hatching was noticed in the jar, a sample of 100 live eggs per jar was taken into the bowl filled with incubation water and maintained at an ambient temperature of 15 °C for the next 48 h when the hatching rate was assessed by counting the number of hatched larvae every 12 h. Upon swelling, and before the kaolin treatment, a sample of 30 eggs was washed from milk solution and photographed for the evaluation of egg size. Likewise, upon hatching, a sample of 30 larvae was taken from each jar and photographed for the evaluation of the length of the newly hatched larvae. Pictures were made under the Nikon ShuttlePix P-400R microscope (Nikon Corporation, Tokyo, Japan) at 20× magnification, while images of eggs and larvae were later processed using Nikon ShuttlePix Editor Ver3.4.0. Water temperature during the incubation was kept at 16.5 ± 1.0 °C, while the water oxygen saturation was in the range of 80–100%.

2.4. Eggs’ FA Profile Analysis

For eggs analysis, freshly stripped dry eggs were taken from 4–6 females per group, (5 g per female) placed into separate vials (one vial per female), and stored at −80 °C. Extraction of total lipids was performed as described above. After extraction, lipids were separated into polar (mainly phospholipids—PL) and neutral lipids (mainly triglycerides—NL) using a silica cartridge packed with aminopropyl bonded phases (500 mg/3 mL SIGMA Supelclean SPE-NH 2 cartridge), according to the method described by Kaluzny et al., 1985 [29]. A thin-layer chromatography (TLC) purity check was also conducted. The percentage of FAs in polar and neutral lipid fractions was assessed after transesterification and the same gas chromatography system as above.
Indirect desaturase indices in eggs were evaluated as described in Pérez-Torres et al., 2021 [30], with the exception that calibration to the ratios of relevant fatty acids in the total lipid of feeds was performed. Delta5 desaturase indices were calculated as ARA/DGLA (a) and EPA/ETA (b) ratios and delta6 desaturase index was calculated as GLA/LA ratio, while delta9 desaturase indices were calculated as POA/PA (a) and OA/SA (b) ratios.

2.5. Plasma Glucose and Immunoglobulin (Ig) Analysis

Plasma samples of fish were collected 48 h post-hormone injection and at the moment of ovulation. Fish were anesthetized using clove oil, and 0.5 mL of blood from the caudal veins was drawn using heparinized needles. After centrifugation at 1375× g, +4 °C for 20 min, supernatants were transferred to 1.5 mL tubes and stored at −20 °C until further analyses.
Quantities of glucose and Ig in plasma samples were analyzed at 48 h after hormone injection and at the moment of ovulation. Four to six samples per group were analyzed at each time point. For total Ig measurement, Ig was precipitated by mixing 50 µL of plasma with 50 µL of polyethylene glycol (PEG) [31]. After 2 h at RT, samples were centrifuged to pellet Ig and protein concentration in the supernatant was analyzed using FLUITEST Total Protein Kits (Analyticon Biotechnologies AG, Lichtenfels, Germany). This value was subtracted from the initial amount of proteins before Ig precipitation. Glucose concentrations were estimated using a commercially available assay based on enzymatic colorimetric reaction (FLUITEST Glucose Kit, Analyticon Biotechnologies AG, Lichtenfels, Germany), using the protocol described by the manufacturer. Glucose levels were expressed as nmol/L, while Ig levels were expressed as g/L of plasma volume.

2.6. Plasma Sex Hormone Analysis

The sex hormones estradiol (E2) and testosterone (T) were analyzed in plasma samples obtained from blood collected at 48 h post-hormone injection and at the moment of ovulation. Six samples per group at each time point were analyzed using E2 levels expressed as pg/mL, while T levels were analyzed as ng/mL of plasma volume. Estradiol (E2, ng/mL) was assayed on 50 μL of plasma using the DIAsource E2-ELISA kit (DIAsource, KAP0621). A dilution of 1:20 of the plasma samples was applied. Sensitivity was 5 pg/mL. Intra-assay coefficients of variation (CV) ranged from 2.6% to 3.1% and interassay CV ranged from 2.4% to 4.7% for low and high E2 levels, respectively. Testosterone (T, ng/mL) was assayed on 25 μL of plasma using the DIAsource Testosterone ELISA kit (DIAsource, KAPD1559). When necessary, a 1:2 or 1:8 dilution of the plasma samples was applied. Sensitivity was 83 pg/mL. Intra-assay CV ranged from 1.5% to 9.5% and interassay CV ranged from 7.6% to 8.7% for low and high testosterone levels, respectively.

2.7. Data Presentation and Analysis

Data are presented in tables as means ± standard deviations (SD). Nonparametric Mann–Whitney test was used for analysis of eggs’ FA profiles and desaturase indexes. Similar to the FA profiles, the Mann–Whitney test was used to analyze differences in sex hormone, glucose, and Ig levels, as well as basic reproductive parameters between F0 and F1 fish. Results were considered to be statistically significant if p < 0.05. Statistical analysis was performed using SPSS 21, IBM Corp. 2012 [32].

3. Results

3.1. FA Content of Eggs

Analysis of the polar lipid fraction of eggs revealed higher OA, dihomo-gammalinolenic acid (DGLA, 20:3 ω6), and eicosadenoic acid (EA) levels in F1 fish, but lower percentages of vaccenic acid (VA, 18:1 ω7), arachidic acid (AA), ARA, EPA, adrenic acid (ADA), n-3 docosapentaenoic acid (DPA, 22:5 ω3), n-6 DPA (22:5 ω6), and docosahexaenoic acid (DHA, 22:6 ω3) in comparison to F0 fish (Table 3). This was associated with lower indirect delta5 and higher delta9 desaturase indices in the F1 group (Table 4). In addition to ALA, myristic acid (MyA, 14:0), margaric acid (MA, 17:0), and VA, the neutral lipid fraction of F1 fish’s eggs had lower levels of all analyzed polyunsaturated 20C acids, in comparison to F0 fish. Only LA percent was higher in the neutral lipid fraction of F1 fish’s eggs (Table 3). Although indirect delta5 desaturase indices in the F1 fish’s neutral lipid fraction seemed to be higher in comparison to the F0 group, statistical significance was reached only with the ARA/DGLA ratio. No significant differences between the groups were reached for delta9 desaturase indices (Table 4).

3.2. Reproductive Performance

The pseudogonadosomatic index (PGSI) and embryo survival were higher in F0 fish. Other reproductive performance indicators assessed in this research were not different between the groups (Table 5).

3.3. Sex Steroid Level, Stress, and Immune Response

Significantly higher E2 levels in F1 fish were seen at the moment of ovulation. Hormone injection significantly increased E2 levels in F1 fish, while T levels were decreased (Table 6).
Analysis of plasma glucose and total immunoglobulin (Ig) levels, as an indicator of fish stress and immune response to external stimuli (here hormonal injection), respectively, revealed higher levels of both glucose and Ig at the later time-point (ovulation) in comparison to 48 h postinjection in both F0 and F1 fish. F1 fish displayed higher glycemia and Ig response to hormonal stimulation, but the statistical significance for Ig was evident only at 48 h postinjection, while for glucose, it was achieved at the moment of ovulation (Table 6).

4. Discussion

The present study corroborates the results of existing studies, demonstrating the inferior reproductive capacity of F1 pike-perch broodstock in comparison to wild breeders. However, the use of commercial feed, containing more plant products and low DHA and EPA levels (~1.1. and 0.5%), did not substantially reduce F1 fish’s reproductive performance, both in comparison to F1 fish administered a high-quality broodstock diet in the research from 2020 (~4.2 and 3.1% DHA and EPA) and breeders administered forage fish during the prespawn wintering in the research from 2017 (~6.5 and 3.9% DHA and EPA) (embryo survival of 36 ± 17% in F1 broodstock fed a high-quality broodstock diet vs. 42 ± 34% in F1 broodstock fed forage fish during wintering vs. 24 ± 23% in F1 broodstock fed a COM diet in the current study) [10,13]. DHA and EPA accumulation in oocytes seems to be directly affected by the levels of FAs in the diets (33.7 and 5.2% in F1 broodstock fed a high-quality broodstock diet vs. 31.7 and 5.7% in F1 broodstock fed forage fish vs. 18.0 and 1.55% in F1 fish fed the diet in the present study, in the polar lipid fraction) (Supplementary Material) [10]. Since F1 fish fed forage fish in the study from 2017 [10] were not inferior in terms of DHA and EPA accumulation in comparison to F0 fish, there is possibly no physiological predisposition of F1 fish for lower DHA and EPA accumulation, nor any effects of feeding history during juvenile on-growth and maturation. There is, however, the possibility that some ingredients in formulated feed, may have contributed to the poor incorporation of DHA and EPA in oocytes’ lipids in the F1 fish, along with the lower levels of these FA in respective diets. Commercial feeds in general are rich sources of linoleic acid (LA), coming mostly from LA-rich vegetable oils incorporated in the diets [33]. In the diet used in this research, levels of LA in the total lipid fraction were higher (~35%) in comparison to the high-quality broodstock diet (~15.6%) and forage fish (~10.4%) [13]. LA may negatively affect DHA and EPA deposition through competition with alpha-linolenic acid (ALA) for desaturases needed for DHA and EPA synthesis [34]. High levels of ALA, regardless of LA levels, have been demonstrated to restore the synthesis of HUFA [35], so the replacement of LA-rich vegetable oils, e.g., sunflower oil, with ALA-rich oils, such as flaxseed oil, may potentially improve EPA and DHA deposition in hatchery-reared broodstock oocytes [33].
Lower levels of DHA and EPA in the diet of F1 fish in this research did not appear to significantly affect ARA incorporation in oocytes’ lipids (~0.5% in F1 breeders fed a high-quality broodstock diet vs. ~2.8% in F1 breeders fed forage fish during prespawning vs. ~1.3% in F1 fish fed the diet from the current study, in the polar lipid fraction of eggs), with ARA levels in the total lipid fractions of respective diets being ~0.4%, ~3.4%, and ~0.6%. Since F1 fish were shown to be inferior in ARA deposition in comparison to F0 fish fed the same diet (forage fish), as stated above (~2.8% in F1 vs. ~5.6% in F0 fish in the polar lipid fraction), there may be a possibility that aside of the levels of ARA in the diet, some physiological factors specific to F1 fish may interfere with ARA deposition. In line with this, hCG injection, which was reported to act as both an immune and stress stimulator in fish [36], caused a significantly higher immunoglobulin response in the plasma of F1 fish in comparison to wild breeders, implying an increased immunological response to external stimuli. This substantiates the results of previous research (Péter et al., under review), showing that higher stress and immunological response could be potential adaptive mechanisms of pike-perch to the farming environment due to their highly cannibalistic nature, though this contradicts the lower stress response generally observed in fish throughout the domestication process [37]. Although glucose levels in F1 fish in the current research were also increased, potentially indicating a higher stress response, a firm conclusion on the difference in stress response between F0 and F1 breeders cannot be made. Hence, investigation of cortisol levels is needed to confirm this finding [38].
Immune system activation can be linked to a higher use of ARA for the production of proinflammatory molecules, which can deploy ARA reserves. In support of this, a decline in the incorporation of ARA into membranes was observed after infection of rabbit cornea with the herpes virus [39]. The alternative scenario is that due to intense stress and immunological reactions, F1 fish developed a protective mechanism to prevent the overproduction of proinflammatory molecules from ARA through the inhibition of ARA synthesis, as the enzymes involved in ARA synthesis have been attributed with potent inflammation-resolving capabilities [40]. Indeed, in support of this assumption, the ARA to di-homo-gamma-linolenic acid (DGLA) ratio in eggs’ polar (PL) and neutral lipids (NL), standardized to the same ratio in food, was lower in hatchery-reared fish in comparison to wild fish. Nevertheless, additional investigation on the role of the inflammatory status of fish on oocytes’ ARA levels is needed.
Though intrinsic factors described above may potentially be involved in F1 broodstock’s inferior performance, both the diet administered during prespawn wintering and dietary history (feed provided to fish during both juvenile and maturation periods) may be important as well. In this sense, aside from the lower ARA percentage in commercial feed in comparison to live food, we identified two additional dietary factors that may have caused an ARA deficiency in hatchery broodstock’s oocytes:
1. Commercial feed is rich in oleic acid (OA), coming from plant oils or lard [41], which can compete with ARA for binding sites in PL or can additionally inhibit the activities of desaturases and/or elongases involved in ARA synthesis [42]. Hence, strategies to reduce OA accumulation throughout oocyte growth could potentially increase ARA levels. However, it seems that the different physiology of F1 fish may contribute to increased OA deposition as well. Eggs from F1 fish exhibited a higher OA:SA ratio (calibrated to OA:SA ratio in feed) in the PL fraction in comparison to wild fish. It is uncommon for OA to be accumulated in PL, as it rather accumulates in NL [43]. Therefore, its high presence in PL seen in this study is probably the result of de novo synthesis in oocytes, which is believed to be the major means of deposition of FA in fish oocytes’ PL fraction [6]. Interestingly, the synthesis of OA from SA may be aggravated by lower levels of DHA and EPA in the oocytes of F1 fish fed formulated feed during prespawn wintering, as reported by Bellenger et al., 2004 [44].
2. LA, which is present in copious amounts in commercial feed, may be an additional reason for poor ARA incorporation in fish oocytes. LA is the precursor of ARA, and it can indirectly reduce ARA levels through stimulation of OA synthesis, which may be aggravated in the state of DHA and EPA deficiency present in F1 fish fed commercial feed, as stated above [35]. Aside from indirectly reducing ARA accumulation, LA was reported to directly compete with ARA for acylation and incorporation in membrane PL [45,46]. Hence, the occupation of PL binding sites by LA may inhibit the accumulation of ARA, even after the replacement of LA-rich commercial feed with live food before spawning, as was the case in the study from 2017 [10]. Since—as stated in the above text—DHA and EPA may suppress the conversion of SA to OA, and since ALA may restore the synthesis of DHA and EPA, the replacement of LA-rich plant sources with ALA-rich oils in formulated aqua feeds may be one of the solutions to potential interference of LA with ARA deposition.
OA accumulation in F1 fish, as noted in present study, may potentially lead to adverse effects of ARA, especially when externally supplied in larger amounts. OA has been described as an efficient competitive substrate for cyclooxygenase (COX), which is involved in the production of prostaglandins (PG), attributed with numerous pro- and anti-inflammatory activities, as well as hormone-like effects [47]. This is because the occupation of COX by OA may leave more ARA substrate for 5-lipooxigenase (LOX), which produces leukotrienes (LT), predominantly proinflammatory molecules, commonly associated with various pathological processes [48,49]. This might have caused the observed detrimental effects of ARA supplementation in previous research, when hatchery fish administered commercial feed enriched with ARA had poorer performance in comparison to fish without ARA enrichment [13]. This effect might have additionally been amplified by low levels of EPA and DHA, which are the sources of anti-inflammatory resolvins, in the diet of F1 fish [50].
Lower pseudogonadosomatic index (PGSI) and embryo survival rate in F1 fish were, surprisingly, associated with higher estrogen (E2) levels after human chorionic gonadotropin (hCG) injection. Though levels of E2 were not evaluated throughout the reproductive season, previous studies have reported lower estrogen and estrogen-releasing hormone levels in farmed fish [4,51]. Given the importance of E2 in vitellogenesis, gonad development, and FA deposition in oocytes, it can be assumed that the rise in E2 levels observed in F1 fish after hCG injection does not reflect the real hormonal status of F1 fish [8]. So, the difference in E2 secretion between the groups may rather be the consequence of slight desensitization of hCG receptors in wild broodstock, which otherwise has higher endogenous gonadotropins levels in a nonstimulated state, as mentioned above [52]. However, the observed elevation of E2 after hCG injection was probably too late to positively regulate the PGSI and other major FAs such as ARA, EPA, or DHA.
We note here that, although we failed to link DHA and EPA levels in the diets with the reproductive performance of the fish, there is a possibility that the DHA:EPA:ARA ratio, which was close to optimal in the COM (~2:1:1) and forage fish (~2:1:1) diets but far from the ratio present in the high-quality broodstock diet (~11:8:1), may have counterbalanced potential detrimental effects of low DHA and EPA availabilities from COM feed [16]. Anyway, additional research is needed to clarify the roles of dietary DHA, EPA, and DHA: EPA:ARA ratios in the reproductive performance of pike-perch.
An illustration of the above-provided assumptions on the effects of FA composition of the diets, as well as intrinsic factors, on ARA levels in eggs is given in Figure 3.
The present study emphasized the role of FAs in pike-perch reproduction efficacy. It did not evaluate the potential effects of other nutrients that may affect the reproduction, which are mostly vitamins, including vitamin A, C, and E [53]. The COM diet was optimized to meet the requirement of predatory fish in intensive rearing conditions for micronutrients, including vitamins, minerals, and amino acids. The forage fish utilized may similarly contain the required microelement, but this unfortunately was not determined from our samples. According to the data provided by the COM feed manufacturer, the contents of vitamin A, C, and E per 100 g of feed are 475 μg retinol equivalents (RE), 10 mg, and 7.7 mg per dry weight, respectively (Table 1). Forage fish commonly preyed by pike-perch in the oxbow from which the breeders were harvested include common bleak (Alburnus alburnus), roach (Rutilus rutilus), rudd (Scardinius erythrophthalmus), and bream (Abramis brama). Though data on the nutritive values of the above fish are not available in the literature, according to the studies that evaluated the nutritive values of various fish species, mostly in fillets, the approximate levels of vitamin A and E per 100 g of wet weight are 50 μg and 2 mg, respectively, while vitamin C is present in trace amounts [54,55,56]. Given the conversion factor of four to account for the difference in dry matter content between the COM and forage fish diets (Table 1), the approximate levels of the above vitamins per 100 g of dry weight of forage fish are expected to be 200 μg and 8 mg, which is lower than or close to the levels present in the COM diet. Nevertheless, a separate study to evaluate the effects of proteins and vitamins should be set up, particularly because the protein content is higher in forage fish than in COM diet (~52% vs. ~41% per dry weight).
A major drawback of the present research is the failure to address the role of physiology in fish reproductive performance, though putative roles of different immunological and stress responses in F0 and F1 fish have been assumed. There are two reasons why clear differentiation between the roles of diet and physiology cannot be made: 1—the impossibility to eliminate dietary history, which is different for wild and F1 fish and which can significantly impact the deposition of FA in oocytes, particularly during the maturation period; and 2—the impossibility to equalize nutrient intake between the two fish populations during the prespawn wintering because of the potentially lower preying capacity of farmed fish, as stated above, and indigestibility issues related to use of dry diets by large wild fish. To the best of our knowledge and experience, the oldest wild fish to be habituated on a dry diet is a summer-old juvenile, and even so, with largely reduced success compared to the month-old pond-nursed fry. This goes along with different rearing conditions (indoor vs. pond) in two fish populations, since different systems are more suitable for different feeds (RAS for dry feed and pond for live food). Setting up the study with a two-way interaction design, where the major and simple main effects of diets and fish physiology are evaluated, would more closely reveal the effects of the two factors in fish reproductive performance.

5. Conclusions

This research has shown that the use of a commercial diet for carnivorous fish grow-out that is poor in marine ingredients leads to the low reproductive performance of intensively reared pike-perch. Compared to wild breeders, these fish showed impeded egg quality, lower PGSI, and a stronger immune response, while the postinjection plasma E2 levels were higher. Nevertheless, in the light of the previous studies, it appears that low ARA accumulation in the oocytes of hatchery-reared pike-perch is not necessarily affected by the levels of DHA and EPA in the broodstock diet. Therefore, considering the outcome of the present study, we recommend future studies to consider the effects of LA, ALA, and OA as possible modifiers of HUFA metabolism, finally not leading to improved egg quality, as it would be foreseen solely based on the DHA, EPA, and ARA levels and its ratios.

Supplementary Materials

The following supporting information can be downloaded at: https://www.mdpi.com/article/10.3390/fishes8050219/s1.

Author Contributions

G.P.: conceptualization, investigation, methodology; J.L.: formal analysis, visualization, writing—original draft; S.M.: conceptualization, investigation, methodology; writing—review and editing; Z.J.S.: conceptualization, investigation, methodology, review and editing; Z.B.-M.: investigation, methodology; E.B.: investigation, methodology; L.A.: conceptualization, investigation, methodology; U.L.: conceptualization, formal analysis, funding acquisition, investigation, methodology, writing—original draft. All authors have read and agreed to the published version of the manuscript.

Funding

This research was supported by the European Regional and Development Fund and the Government of Hungary within the project GINOP-2.3.2-15-2016-00025, and by the Ministry of Education, Science and Technological Development of the Republic of Serbia under Contract No. 451-03-68/2022-14/200042. National Research, Development and Innovation Fund of Hungary—grants ID: PD-139053.

Institutional Review Board Statement

The animal study protocol was approved by the Institutional Review Board (or Ethics Committee) of Research Institute for Fisheries and Aquaculture NAIK HAKI (Approval Code: 126-1/2016; Approval Date: 2016/12/21).

Data Availability Statement

Raw data from this study are available at ResearchGate next to the Abstract of this publication.

Acknowledgments

The authors are thankful to the technical staff of MATE for their support in fish husbandry (Csaba Weber, Tijana Ristovic) and laboratory sample analyses (Vanda Percze, Judit Molnár).

Conflicts of Interest

The authors declare no conflict of interest.

References

  1. Policar, T.; Schaefer, F.J.; Panana, E.; Meyer, S.; Teerlinck, S.; Toner, D.; Żarski, D. Recent progress in European percid fish culture production technology—Tackling bottlenecks. Aquacult. Int. 2019, 27, 1151–1174. [Google Scholar] [CrossRef]
  2. Zakęś, Z. Sander lucioperca. Cultured Aquatic Species Information Programme. In Fisheries and Aquaculture Division [Online]; Updated 2012-03-16; FAO: Rome, Italy, 2023. [Google Scholar]
  3. Křišťan, J.; Stejskal, V.; Policar, T. Comparison of reproduction characteristics and broodstock mortality in farmed and wild Eurasian perch (Perca fluviatilis L.) females during spawning season under controlled conditions. Turk. J. Fish. Aquat. Sci. 2012, 12, 191–197. [Google Scholar] [CrossRef]
  4. Zupa, R.; Rodríguez, C.; Mylonas, C.C.; Rosenfeld, H.; Fakriadis, I.; Papadaki, M.; Pérez, J.A.; Pousis, C.; Basilone, G.; Corriero, A. Comparative study of reproductive development in wild and captive-reared greater amberjack Seriola dumerili (Risso, 1810). PLoS ONE 2017, 12, e0169645. [Google Scholar] [CrossRef] [PubMed]
  5. Izquierdo, M.S.; Fernández-Palacios, H.; Tacon, A.G.J. Effect of broodstock nutrition on reproductive performance of fish. Aquaculture 2001, 197, 25–42. [Google Scholar] [CrossRef]
  6. Reading, B.J.; Andersen, L.K.; Ryu, Y.-W.; Mushirobira, Y.; Todo, T.; Hiramatsu, N. Oogenesis and egg quality in finfish: Yolk formation and other factors influencing female fertility. Fishes 2018, 3, 45. [Google Scholar] [CrossRef]
  7. Salze, G.; Tocher, D.R.; Roy, W.J.; Robertson, D.A. Egg quality determinants in cod (Gadus morhua L.): Egg performance and lipids in eggs from farmed and wild broodstock. Aquac. Res. 2005, 36, 1488–1499. [Google Scholar] [CrossRef]
  8. Johnson, R.B. Lipid deposition in oocytes of teleost fish during secondary oocyte growth. Rev. Fish. Sci. 2009, 17, 78–89. [Google Scholar] [CrossRef]
  9. Bell, J.G.; Sargent, J.R. Arachidonic acid in aquaculture feeds: Current status and future opportunities. Aquaculture 2003, 218, 491–499. [Google Scholar] [CrossRef]
  10. Ljubobratović, U.; Péter, G.; Horváth, Z.; Żarski, D.; Ristović, T.; Percze, V.; Sándor, Z.; Lengyel, S.; Rónyai, A. Reproductive performance of indoor-reared pikeperch (Sander lucioperca) females after wintering in outdoor earthen ponds. Aquac. Res. 2017, 48, 4851–4863. [Google Scholar] [CrossRef]
  11. Näslund, J. Reared to become wild-like: Addressing behavioral and cognitive deficits in cultured aquatic animals destined for stocking into natural environments—A critical review. Bull. Mar. Sci. 2021, 97, 489–538. [Google Scholar] [CrossRef]
  12. Benedek, I.; Molnár, T. Size Preference of Live Fish Prey in the Pellet-Consuming Pikeperch. Appl. Sci. 2023, 13, 2259. [Google Scholar] [CrossRef]
  13. Ljubobratović, U.; Péter, G.; Demény, F.; Kugyela, N.; Horváth, A.; Pataki, B.; Horváth, Z.; Sándor, Z.J.; Rónyai, A. Reproductive performance in virgin pikeperch (Sander lucioperca L.) females fed different dietary levels of arachidonic acid with respect to the duration of spawning induction. Aquac. Rep. 2020, 18, 100430. [Google Scholar] [CrossRef]
  14. Simon, C. Effect of Maturation Diets on the Reproductive Quality of Pikeperch, Sander lucioperca (Linnaeus, 1758). MsC Thesis, Faculty of Bioscience Engineering, University Gent, Ghent, Belgium, 2015. Available online: https://libstore.ugent.be/fulltxt/RUG01/002/216/945/RUG01-002216945_2015_0001_AC.pdf (accessed on 19 March 2023).
  15. Pal, A.; Metherel, A.H.; Fiabane, L.; Buddenbaum, N.; Bazinet, R.P.; Shaikh, S.R. Do Eicosapentaenoic Acid and Docosahexaenoic Acid Have the Potential to Compete against Each Other? Nutrients 2020, 12, 3718. [Google Scholar] [CrossRef] [PubMed]
  16. Tian, J.J.; Lei, C.X.; Ji, H.; Kaneko, G.; Zhou, J.S.; Yu, H.B.; Li, Y.; Yu, E.M.; Xie, J. Comparative analysis of effects of dietary arachidonic acid and EPA on growth, tissue fatty acid composition, antioxidant response and lipid metabolism in juvenile grass carp, Ctenopharyngodon idellus. Br. J. Nutr. 2017, 118, 411–422. [Google Scholar] [CrossRef] [PubMed]
  17. Xu, H.; Cao, L.; Wei, Y.; Zhang, Y.; Liang, M. Effects of different dietary DHA:EPA ratios on gonadal steroidogenesis in the marine teleost, tongue sole (Cynoglossus semilaevis). Br. J. Nutr. 2017, 118, 179–188. [Google Scholar] [CrossRef]
  18. Bruce, M.; Oyen, F.; Bell, G.; Asturiano, J.F.; Farndale, B.; Carrillo, M.; Zanuy, S.; Ramos, J.; Bromage, N. Development of broodstock diets for the European Sea Bass (Dicentrarchus labrax) with special emphasis on the importance of n−3 and n−6 highly unsaturated fatty acid to reproductive performance. Aquaculture 1999, 177, 85–97. [Google Scholar] [CrossRef]
  19. Henrotte, E.; Mandiki, R.S.N.M.; Prudencio, A.T.; Vandecan, M.; Mélard, C.; Kestemont, P. Egg and larval quality, and egg fatty acid composition of Eurasian perch breeders (Perca fluviatilis) fed different dietary DHA/EPA/AA ratios. Aquac. Res. 2010, 41, e53–e61. [Google Scholar] [CrossRef]
  20. AOAC Official Methods of Analysis of AOAC International, 17th ed.; Association of Official Analytical Chemists: Gaithersburg, MD, USA, 2000.
  21. Folch, J.; Lees, M.; Sloane Stanley, G.H. A simple method for the isolation and purification of total lipids from animal tissues. J. Biol. Chem. 1957, 226, 497–509. [Google Scholar] [CrossRef]
  22. Stoffel, W.; Chu, F.; Ahrens, E.H. Analysis of long-chain fatty acids by gas-liquid chromatography. Anal. Chem. 1959, 31, 307–308. [Google Scholar] [CrossRef]
  23. Ackman, R.G.; Sipos, J.C. Application of specific response factors in the gas chromatographic analysis of methyl esters of fatty acids with flame ionization detectors. J. Am. Oil Chem. Soc. 1964, 41, 377–378. [Google Scholar] [CrossRef]
  24. Ackman, R.G.; Sipos, J.C. Flame ionization detector response for the carbonyl carbon atom in the carboxyl group of fatty acids and esters. J. Chromatogr. A 1964, 16, 298–305. [Google Scholar] [CrossRef] [PubMed]
  25. Halver, J.E.; Hardy, R.W. Fish Nutrition, 3rd ed.; Academic Press Inc.: San Diego, CA, USA, 2002; pp. 259–308. [Google Scholar] [CrossRef]
  26. Żarski, D.; Kucharczyk, D.; Targońska, K.; Palińska, K.; Kupren, K.; Pascal Fontaine, P.; Kestemont, P. A new classification of pre-ovulatory oocyte maturation stages in pikeperch, (Sander lucioperca L.), and its application during artificial reproduction. Aquac. Res. 2012, 43, 713–721. [Google Scholar] [CrossRef]
  27. Żarski, D.; Horváth, Á.; Bernáth, G.; Krejszeff, S.; Radóczi, J.; Palińska-Żarska, K.; Bokor, Z.; Kupren, K.; Urbányi, B. Collection of gametes. In Controlled Reproduction of Wild Eurasian Perch. SpringerBriefs in Environmental Science; Springer: Cham, Switzerland, 2017. [Google Scholar] [CrossRef]
  28. Ljubobratović, U.; Péter, G.; Alvestad, R.; Horváth, Z.; Rónyai, A. Alcalase enzyme treatment affects egg incubation and larval quality in pikeperch (Sander lucioperca). Aquacult. Int. 2019, 27, 917–929. [Google Scholar] [CrossRef]
  29. Kaluzny, M.A.; Duncan, L.A.; Merritt, M.V.; Epps, D.E. Rapid separation of lipid classes in high yield and purity using bonded phase columns. J. Lipid Res. 1985, 26, 135–140. [Google Scholar] [CrossRef]
  30. Page, M.; Thorpe, R. Purification of IgG by Precipitation with Polyethylene Glycol (PEG). In The Protein Protocols Handbook. Springer Protocols Handbooks; Walker, J.M., Ed.; Humana Press: Totowa, NJ, USA, 2002. [Google Scholar] [CrossRef]
  31. Pérez-Torres, I.; Guarner-Lans, V.; Soria-Castro, E.; Manzano-Pech, L.; Palacios-Chavarría, A.; Valdez-Vázquez, R.R.; Domínguez-Cherit, J.G.; Herrera-Bello, H.; Castillejos-Suastegu, H.; Moreno-Castañeda, L.; et al. Alteration in the lipid profile and the desaturases activity in patients with severe pneumonia by SARS-CoV-2. Front. Physiol. 2021, 12, 624. [Google Scholar] [CrossRef]
  32. IBM Corp. IBM SPSS Statistics for Windows, Version 21.0; IBM Corp.: Armonk, NY, USA, 2012. [Google Scholar]
  33. Visentainer, J.V.; de Souza, N.E.; Makoto, M.; Hayashi, C.; Franco, M.R.B. Influence of diets enriched with flaxseed oil on the α-linolenic, eicosapentaenoic and docosahexaenoic fatty acid in Nile tilapia (Oreochromis niloticus). Food Chem. 2005, 90, 557–560. [Google Scholar] [CrossRef]
  34. Gibson, R.A.; Muhlhausler, B.; Makrides, M. Conversion of linoleic acid and alpha-linolenic acid to long-chain polyunsaturated fatty acids (LCPUFAs), with a focus on pregnancy, lactation and the first 2 years of life. Matern. Child Nutr. 2011, 7, 17–26. [Google Scholar] [CrossRef] [PubMed]
  35. Goyens, P.L.L.; Spilker, M.E.; Zock, P.L.; Katan, M.B.; Mensink, R.P. Conversion of α-linolenic acid in humans is influenced by the absolute amounts of α-linolenic acid and linoleic acid in the diet and not by their ratio. Am. J. Clin. Nutr. 2006, 84, 44–53. [Google Scholar] [CrossRef]
  36. Falahatkar, B.; Poursaeid, S. Effects of hormonal manipulation on stress responses in male and female broodstocks of pikeperch Sander lucioperca. Aquacult. Int. 2014, 22, 235–244. [Google Scholar] [CrossRef]
  37. Milla, S.; Pasquet, A.; El Mohajer, L.; Fontaine, P. How domestication alters fish phenotypes. Rev. Aquac. 2021, 13, 388–405. [Google Scholar] [CrossRef]
  38. Martínez-Porchas, M.; Martínez-Córdova, L.R.; Ramos-Enriquez, R. Cortisol and glucose: Reliable indicators of fish stress? Pan-Am. J. Aquat. Sci. 2009, 4, 158–178. [Google Scholar]
  39. Birkle, D.L.; Sanitato, J.J.; Kaufman, H.E.; Bazan, N.G. Arachidonic acid metabolism to eicosanoids in herpes virus-infected rabbit cornea. Invest. Ophthalmol. Vis. Sci. 1986, 27, 1443–1446. [Google Scholar]
  40. Gromovsky, A.D.; Schugar, R.C.; Brown, A.L.; Helsley, R.N.; Burrows, A.C.; Ferguson, D.; Zhang, R.; Sansbury, B.E.; Lee, R.G.; Morton, R.E.; et al. Δ-5 fatty acid desaturase fads1 impacts metabolic disease by balancing proinflammatory and proresolving lipid mediators. Arterioscler. Thromb. Vasc. Biol. 2018, 38, 218–231. [Google Scholar] [CrossRef] [PubMed]
  41. Sankian, Z.; Khosravi, S.; Kim, Y.O.; Lee, S.M. Total replacement of dietary fish oil with alternative lipid sources in a practical diet for mandarin fish, Siniperca scherzeri, juveniles. Fish Aquat. Sci. 2019, 22, 8. [Google Scholar] [CrossRef]
  42. Høstmark, A.T.; Haug, A. Percentages of oleic acid and arachidonic acid are inversely related in phospholipids of human sera. Lipids Health Dis. 2013, 12, 106. [Google Scholar] [CrossRef]
  43. Listenberger, L.L.; Han, X.; Lewis, S.E.; Cases, S.; Farese, R.V., Jr.; Ory, D.S.; Schaffer, J.E. Triglyceride accumulation protects against fatty acid-induced lipotoxicity. Proc. Natl. Acad. Sci. USA 2003, 100, 3077–3082. [Google Scholar] [CrossRef]
  44. Bellenger, J.; Bellenger, S.; Clément, L.; Mandard, S.; Diot, C.; Poisson, J.P.; Narce, M. A new hypotensive polyunsaturated fatty acid dietary combination regulates oleic acid accumulation by suppression of stearoyl CoA desaturase 1 gene expression in the SHR model of genetic hypertension. FASEB J. 2004, 18, 773–775. [Google Scholar] [CrossRef]
  45. Friesen, R.W.; Innis, S.M. Linoleic acid is associated with lower long-chain n–6 and n–3 fatty acids in red blood cell lipids of Canadian pregnant women. Am. J. Clin. Nutr. 2010, 91, 23–31. [Google Scholar] [CrossRef]
  46. Rett, B.S.; Whelan, J. Increasing dietary linoleic acid does not increase tissue arachidonic acid content in adults consuming Western-type diets: A systematic review. Nutr. Metab. 2011, 8, 36. [Google Scholar] [CrossRef]
  47. Zou, H.; Yuan, C.; Dong, L.; Sidhu, R.S.; Hong, Y.H.; Kuklev, D.V.; Smith, W.L. Human cyclooxygenase-1 activity and its responses to COX inhibitors are allosterically regulated by nonsubstrate fatty acids. J. Lipids 2012, 53, 1336–1347. [Google Scholar] [CrossRef]
  48. Ricciotti, E.; FitzGerald, G.A. Prostaglandins and inflammation. Arterioscler. Thromb. Vasc. Biol. 2011, 31, 986–1000. [Google Scholar] [CrossRef]
  49. Jo-Watanabe, A.; Okuno, T.; Yokomizo, T. The role of leukotrienes as potential therapeutic targets in allergic disorders. Int. J. Mol. Sci. 2019, 20, 3580. [Google Scholar] [CrossRef] [PubMed]
  50. Calder, P.C. Omega-3 fatty acids and inflammatory processes. Nutrients 2010, 2, 355–374. [Google Scholar] [CrossRef] [PubMed]
  51. Khendek, A.; Chakraborty, A.; Roche, J.; Ledoré, Y.; Personne, A.; Policar, T.; Żarski, D.; Mandiki, R.; Kestemont, P.; Milla, S.; et al. Rearing conditions and life history influence the progress of gametogenesis and reproduction performances in pikeperch males and females. Animal 2018, 12, 2335–2346. [Google Scholar] [CrossRef] [PubMed]
  52. Salmon, C.; Marchelidon, J.; Fontaine-Bertrand, E.; Fontaine, Y.A. Human chorionic gonadotrophin and immature fish ovary: Characterization and mechanism of the in vitro stimulation of cyclic adenosine monophosphate accumulation. Gen. Comp. Endocrinol. 1985, 58, 101–108. [Google Scholar] [CrossRef] [PubMed]
  53. Volkoff, H.; London, S. Nutrition and Reproduction in Fish. In Encyclopedia of Reproduction, 2nd ed.; Skinner, M.K., Ed.; Elsevier: Oxford, UK, 2018; imprint Academic Press; pp. 743–748. ISBN 9780128151457. [Google Scholar] [CrossRef]
  54. Available online: https://www.livsmedelsverket.se/globalassets/publikationsdatabas/rapporter/2012/fish-shellfish-and-fish-products---analysis-of-nutrients-rapport-1-2012.pdf (accessed on 19 March 2023).
  55. Available online: https://assets.publishing.service.gov.uk/government/uploads/system/uploads/attachment_data/file/167921/Nutrient_analysis_of_fish_and_fish_products_-_Summary_Report.pdf (accessed on 7 April 2023).
  56. FAO/INFOODS Global Food Composition Database for Fish and Shellfish—Version 1.0 (uFiSh1.0); FAO: Rome, Italy, 2016.
Figure 1. Graphical abstract showing the design of the study, starting from pre-spawn wintering of wild (F0) and hatchery-reared (F1) fish; COM = commercial diet, LT = oocyte latency time, FA = fatty acid. Designed using images from Flaticon.com, https://www.flaticom.com.
Fishes 08 00219 g001
Figure 2. Weekly water temperature manipulation conducted from mid-October 2015 in a recirculation facility (RAS) where F1 broodstock was maintained and temperature measured in the outdoor wild F0 broodstock POND until hormonal stimulation and ovulation in early March of 2016, while both groups were under the natural photothermal regime. On 11 February 2016, wild pike-perch breeders were stocked in one separate identical tank in the recirculation system.
Fishes 08 00219 g002
Figure 3. Illustration showing assumed interactions between dietary fatty acid (FA) profile and intrinsic factors in determination of arachidonic acid (ARA) levels in broodstock’s eggs. OA = oleic acid, LA = linoleic acid, DHA = docosahexaenoic acid, EPA = eicosapentaenoic acid. Designed using images from Flaticon.com, https://www.flaticom.com.
Fishes 08 00219 g003
Table 1. Proximate composition (% wet weight basis) and gross energy (KJ g−1 wet weight basis) of the feeds utilized during wintering.
Nutrient/FeedForage Fish (n = 4)COM Diet (n = 2)
dry matter22.26 ± 0.0292.18 ± 0.10
crude protein13.92 ± 0.1240.63 ± 1.09
crude fat13.18 ± 0.0210.66 ± 0.04
crude fiber02.57 ± 0.36
crude ash3.87 ± 0.168.42 ± 0.11
gross energy (GE) *4.7519.43
Lysine **nd2.618
Methionine **nd1.062
Ca **nd1.883
P **nd1.229
* The diets’ gross energy (GE) values were calculated by using formula GE = 39.5 × crude fat + 23.6× total carbohydrates + 17.2 × crude protein ((KJ g−1), [25] total carbohydrate = 100 − (crude protein + crude fat + crude fiber + ash). ** Calculated values published by the feed producer.
Table 2. Fatty acid composition (% of total fatty acids) of the feed offered to F0 fish (forage fish) and F1 fish (COM diet) during wintering.
Fatty AcidForage Fish (n = 4)COM Diet (n = 2)
14:01.57 ± 0.100.84 ± 0.02
16:0 (PA)15.39 ± 0.5618.82 ± 0.16
16:1ω90.83 ± 0.050.29 ± 0.0
16:1ω7 (POA)8.47 ± 0.293.34 ± 0.03
17:00.60 ± 0.040.23 ± 0.0
18:0 (SA)3.75 ± 0.396.28 ± 0.09
18:1ω9 (OA)22.7 ± 0.1225.41 ± 0.24
18:1ω73.49 ± 0.171.67 ± 0.16
18:2ω6 (LA)10.4 ± 1.0834.9 ± 0.08
18:3ω6 (GLA)0.51 ± 0.030.0 ± 0.0
18:3ω3 (ALA)4.20 ± 0.423.01 ± 0.03
20:00.22 ± 0.020.17 ± 0.00
20:1ω91.02 ± 0.180.49 ± 0.05
20:2ω60.61 ± 0.100.20 ± 0.0
20:3ω6 (DGLA)0.61 ± 0.080.10 ± 0.01
20:4ω6 (ARA)3.41 ± 0.310.61 ± 0.0
20:3ω30.42 ± 0.010.0 ± 0.0
20:4ω3 (ETA)0.57 ± 0.020.06 ± 0.0
20:5ω3 (EPA)3.88 ± 0.150.47 ± 0.01
22:4ω60.33 ± 0.060.09 ± 0.13
22:5ω60.70 ± 0.070.05 ± 0.08
22:5ω31.48 ± 0.120.19 ± 0.01
22:6ω3 (DHA)6.47 ± 0.481.09 ± 0.0
DHA:EPA:ARA1.9:1.1:12.3:1:1.3
PA = palmitic acid, POA = palmitoleic acid, SA = stearic acid, OA = oleic acid, LA = linoleic acid, GLA = gamma-linolenic acid, ALA = alpha-linolenic acid, DGLA = dihomo-gamma-linolenic acid, ARA = arachidonic acid, ETA = eicosatetraenoic acid, EPA = eicosapentaenoic acid, DHA = docosahexaenoic acid.
Table 3. Fatty acid composition (w %) of polar (PL) and neutral (NL) lipid fraction of eggs of fish with different origin (F0 and F1); n =number of fish.
Lipid FractionPLNL
Fatty AcidsF0 (n = 4)F1 (n = 6)F0 (n = 4)F1 (n = 6)
14:0 (MyA)1.09 ± 0.141.18 ± 0.21* 0.37 ± 0.040.20 ± 0.04
16:0 (PA)22.3 ± 0.5824.1 ± 3.756.16 ± 2.663.91 ± 1.58
16:1ω92.04 ± 0.492.26 ± 0.363.46 ± 2.631.93 ± 1.23
16:1ω7 (POA)1.35 ± 0.901.97 ± 0.4312.2 ± 6.709.29 ± 6.52
17:0 (MA)0.21 ± 0.170.10 ± 0.11* 0.63 ± 0.210.01 ± 0.03
18:0 PL (SA)5.93 ± 0.567.22 ± 1.271.78 ± 1.171.33 ± 0.64
18:1ω9 (OA)* 7.88 ± 0.7712.73 ± 2.0113.07 ± 3.9415.3 ± 1.14
18:1ω7 (VA)* 1.99 ± 0.071.74 ± 0.13* 2.16 ± 0.300.97 ± 0.09
18:2ω6 (LA)* 5.23 ± 0.6711.26 ± 5.92* 14.98 ± 1.0224.4 ± 5.34
18:3ω6 (GLA)* 0.13 ± 0.120.48 ± 0.444.72 ± 3.3110.34 ± 7.2
18:3ω3 (ALA)1.01 ± 0.171.28 ± 0.36* 3.33 ± 0.331.76 ± 0.2
20:0 (AA)* 0.24 ± 0.210.12 ± 0.160.13 ± 0.150.05 ± 0.05
20:1ω90.29 ± 0.340.05 ± 0.130.14 ± 0.170.04 ± 0.07
20:2ω6 (EA)* 0.53 ± 0.050.66 ± 0.21* 0.36 ± 0.080.15 ± 0.05
20:3ω6 (DGLA)* 0.93 ± 0.142.07 ± 0.66* 0.97 ± 0.080.65 ± 0.09
20:4ω6 (ARA)* 5.7 ± 0.351.32 ±1.00* 1.71 ± 0.160.17 ± 0.06
20:3ω30.13 ± 0.150 ±0* 0.27 ± 0.060.00 ± 0.01
20:4ω3 (ETA)0.29 ± 0.110.32 ± 0.19* 0.46 ± 0.070.10 ± 0.04
20:5ω3 (EPA)* 3.87 ± 0.311.55 ± 0.60* 1.82 ± 0.160.28 ± 0.12
22:4ω6 (ADA)* 0.85 ± 0.330.38 ± 0.33* 0.37 ± 0.010.04 ± 0.06
22:5ω6* 1.85 ± 0.240.95 ± 0.55* 0.72 ± 0.060.11 ± 0.08
22:5ω3* 2.25 ± 0.141.05 ± 0.23* 1.36 ± 0.170.26 ± 0.1
22:6ω3 (DHA)* 26.2 ± 1.6318.01 ± 2.19* 7.58 ± 1.053.22 ± 0.63
* significant differences between fish of different origin (F0 and F1); MyA = myristic acid, PA = palmitic acid, POA = palmitoleic acid, MA = margaric acid, SA = stearic acid, OA = oleic acid, VA = vaccenic acid, LA = linoleic acid, GLA = gamma-linolenic acid, ALA = alpha-linolenic acid, AA = arachidic acid, EA = eicosadenoic acid, DGLA = dihomo-gamma-linolenic acid, ARA = arachidonic acid, ETA = eicosatetraenoic acid, EPA = eicosapentaenoic acid, ADA = adrenic acid, DHA = docosahexaenoic acid.
Table 4. Indirect desaturase indices in polar (PL) and neutral (NL) lipid fractions of eggs of fish of different origin (F0 and F1), calibrated to the ratio of relevant fatty acids (FA) in feed.
Lipid FractionPLNL
Desaturase indicesF0F1F0F1
Delta5a (ARA/DGLA)* 1.11 ± 0.130.11 ± 0.09* 0.31 ± 0.010.05 ± 0.02
Delta5b (EPA/ETA)* 2.26 ± 0.940.47 ± 0.330.58 ± 0.050.38 ± 0.19
Delta6 (GLA/LA)0.52 ± 0.48**6.50 ± 4.78**
Delta9a (POA/PA)* 0.11 ± 0.070.47 ± 0.115.25 ± 5.216.1 ± 13.6
Delta9b (OA/SA)* 0.22 ± 0.020.46 ± 0.142.15 ± 2.023.55 ± 1.9
* Significant differences between fish of different origin (F0 and F1); ARA = arachidonic acid, DGLA = dihommo-gamma-linolenic acid, EPA = eicosapentaenoic acid, ETA = eicosatetraenoic acid, GLA = gamma-linolenic acid, LA = linoleic acid, POA = palmitoleic acid, PA = palmitic acid, OA = oleic acid, SA = stearic acid. ** delta6 desaturase index could not be calculated because of total absence of GLA in feed for F1 fish.
Table 5. Reproductive parameters of fish of different origin (F0 and F1).
ParametersF0 (n = 6)F1 (n = 6)
LT (h)113.33 ± 20.2124.67 ± 8.71
Fish weight (g)880 ± 206.4843.33 ± 199.32
PGSI *14 ± 210 ± 0.3
Egg size (mm)1.21 ± 0.051.21 ± 0.08
Hatching rate (%)78 ± 1163 ± 35
Embryo survival (%) *61 ± 1824 ± 23
Size of larvae (mm)4.7 ± 0.084.6 ± 0.12
* significant differences between fish of different origin; LT = oocyte latency time, PGSI = pseudogonadosomatic index.
Table 6. Plasma glucose, immunoglobulin, and sex steroid levels after hCG injection in fish of different origin (F0 and F1) at different time points after hormone injection (48 h and ovulation).
Parameters48 h PostinjectionOvulation
F0 (n = 6)F1 (n = 6)F0 (n = 6)F1 (n = 6)
Glucose (nmol/L)2.77 ± 0.423.41 ± 0.228.9 ± 1.2122.13 ± 4.72 *
Ig (g/L)9.03 ± 1.817.31 ± 5.02 *25.15 ± 5.2629.26 ± 4.12
E2 (ng/mL)5.30 ± 4.509.08 ± 2.46178 ± 35228 ± 45 *
T (ng/mL)62.24 ± 24.6443.14 ±1 9.362.28 ± 0.922.22 ± 0.63
* significant difference in comparison to F0 fish.
Disclaimer/Publisher’s Note: The statements, opinions and data contained in all publications are solely those of the individual author(s) and contributor(s) and not of MDPI and/or the editor(s). MDPI and/or the editor(s) disclaim responsibility for any injury to people or property resulting from any ideas, methods, instructions or products referred to in the content.

