Complex Dielectric and Impedance Spectroscopic Studies in a Multiferroic Composite of Bi2Fe4O9-BiFeO3

Materials Science Group, HBNI, Indira Gandhi Centre for Atomic Research, Kalpakkam 603102, Tamil Nadu, India
*
Author to whom correspondence should be addressed.
Condens. Matter 2018, 3(4), 44; https://doi.org/10.3390/condmat3040044
Submission received: 4 November 2018
/
Revised: 24 November 2018
/
Accepted: 28 November 2018
/
Published: 2 December 2018
Abstract
:Complex dielectric and impedance spectroscopic studies have been carried out in a detailed manner on the system comprising of Bi2Fe4O9-BiFeO3 composite particles dispersed in a α-Fe2O3 matrix as prepared using ball milling and controlled annealing treatments. This multiferroic composite is observed to exhibit a giant dielectric constant associated with a low tangent loss. A non-Debye type of relaxation has been deduced based on complex modulus analysis. Based on these studies, the important role played by bismuth ferrite nanoshell in the core-shell composite of Bi2Fe4O9-BiFeO3 is elucidated for the observed complex impedance spectroscopic properties of the system. Electron hopping across Fe2+/Fe3+ and oxygen vacancies are deduced to be playing an important role in conduction mechanisms based on activation energy analysis of the complex impedance spectroscopy results.
1. Introduction
Coexistence of ferroelectric (paraelectric), ferromagnetic (antiferromagnetic), and ferroelastic properties in certain materials result in wide applications, such as sensors, actuators, and multistate memory and spintronic devices [1,2]. Yet, very few single-phase materials, such as BiFeO3, show this property at or near room temperature [3]. A thin film of BiFeO3 has been demonstrated to show very large polarization [1], but it is deduced that the grain boundaries in a polycrystalline film and defect structures could result in degradation of ferroelectric polarization effects and leakage characteristics. Thus, the need for studies of multiphase or composite oxides based on bismuth iron oxides exhibiting multiferroic properties is very important [4,5,6,7]. To be considered as important, the composite material concerned should exhibit strong coupling effects, for example, between ferroelectric and antiferromagnetic properties [8,9]. Systems consisting of oxides, such as BiMnO3, BiFeO3 and Bi2Fe4O9 [10] are reported to exhibit strong coupling of ferroelectric and antiferromagnetic properties. To look for efficient ways to improve significantly the dielectric response of materials, such as BiFeO3, by composite oxides based on the former, which exhibit multiferroic properties at room temperature, is very important with respect to developing multifunctional devices.
This paper reports the results of detailed complex impedance spectroscopic studies on Bi2Fe4O9-BiFeO3 composite and explores its suitability for making charge storage devices based on high frequency applications. BiFeO3 exhibits antiferromagnetic ordering (TN = 643 K) and is also ferroelectric (TC ~ 1103 K) at room temperature. On the other hand, another bismuth iron oxide based Bi2Fe4O9 is also multiferroic (TC ~ 260 K, TN ~ 250 K). With respect to dielectric studies, single phased Bi2Fe4O9 is observed to possess a low value of dielectric constant (~30–40) whereas BiFeO3 single phase exhibits a high value of dielectric constant of the order of ~40–50 [11] Posed by the limitations of the usage of BiFeO3 based systems for electrical applications mainly due to leaky behavior, this work aims to study the complex impedance behavior of BiFeO3-Bi2Fe4O9 composite.
This paper reports the bulk structural characterization of BiFeO3-Bi2Fe4O9 composite as prepared by ball milling and local structural and magnetic properties using Mossbauer spectroscopy. Electrical properties of the BiFeO3-Bi2Fe4O9 composite system have been studied in a detailed manner using complex impedance spectroscopic techniques to understand different relaxations, and are discussed.
2. Results and Discussion
2.1. Structural Analysis
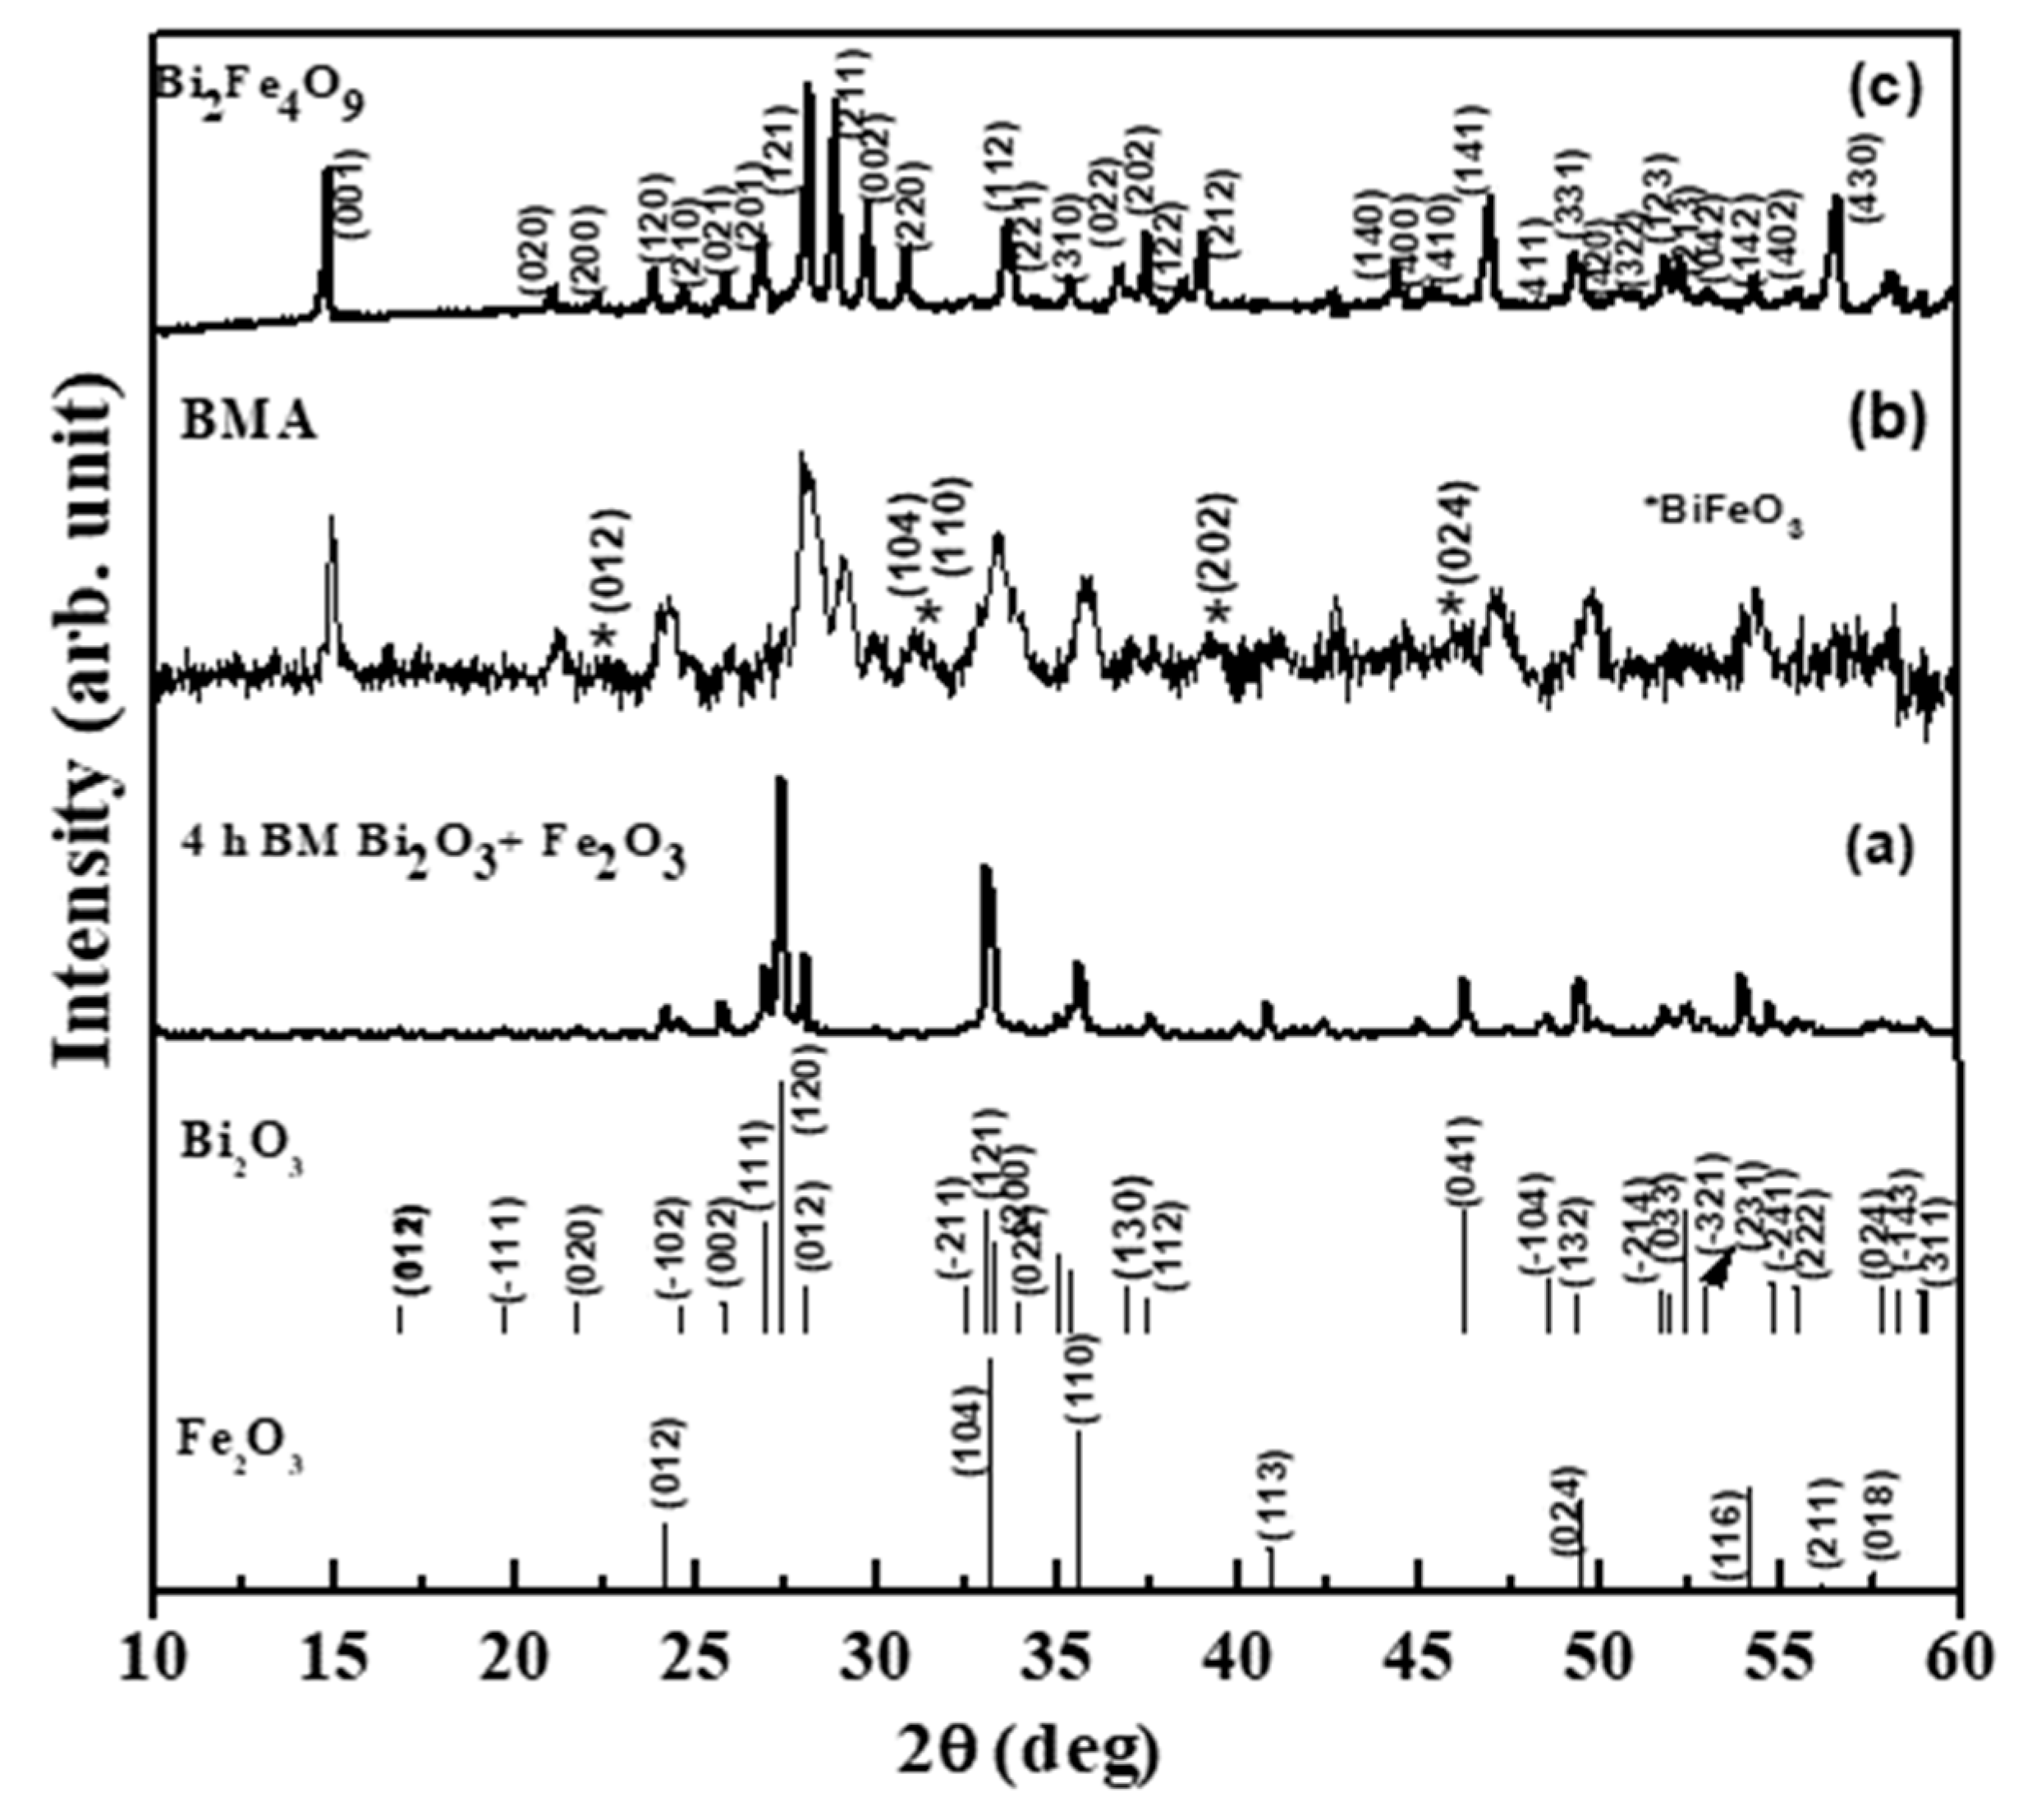
X-ray diffraction pattern obtained in the ball milled and annealed sample shows mainly the presence of α-Fe2O3 and α-Bi2O3 (Cf. Figure 1). This can be deduced based on the stick patterns provided corresponding to α-Fe2O3 and α-Bi2O3. XRD pattern corresponding to the case of ball milled and annealed (BMA) sample confirms the formation of Bi2Fe4O9 and BiFeO3 phases as expected along with Fe2O3. This implies a significant interaction of Bi2O3 along with α-Fe2O3, resulting in the formation of Bi2Fe4O9 as well as BiFeO3 phases. A significant presence of Bi2Fe4O9 has been observed in the ball milled and annealed sample, hence Bi2Fe4O9 has been prepared through solid state reaction and the resulting XRD pattern (Figure 1c) shows that the sample contains a single phase of Bi2Fe4O9.
2.2. TEM Studies
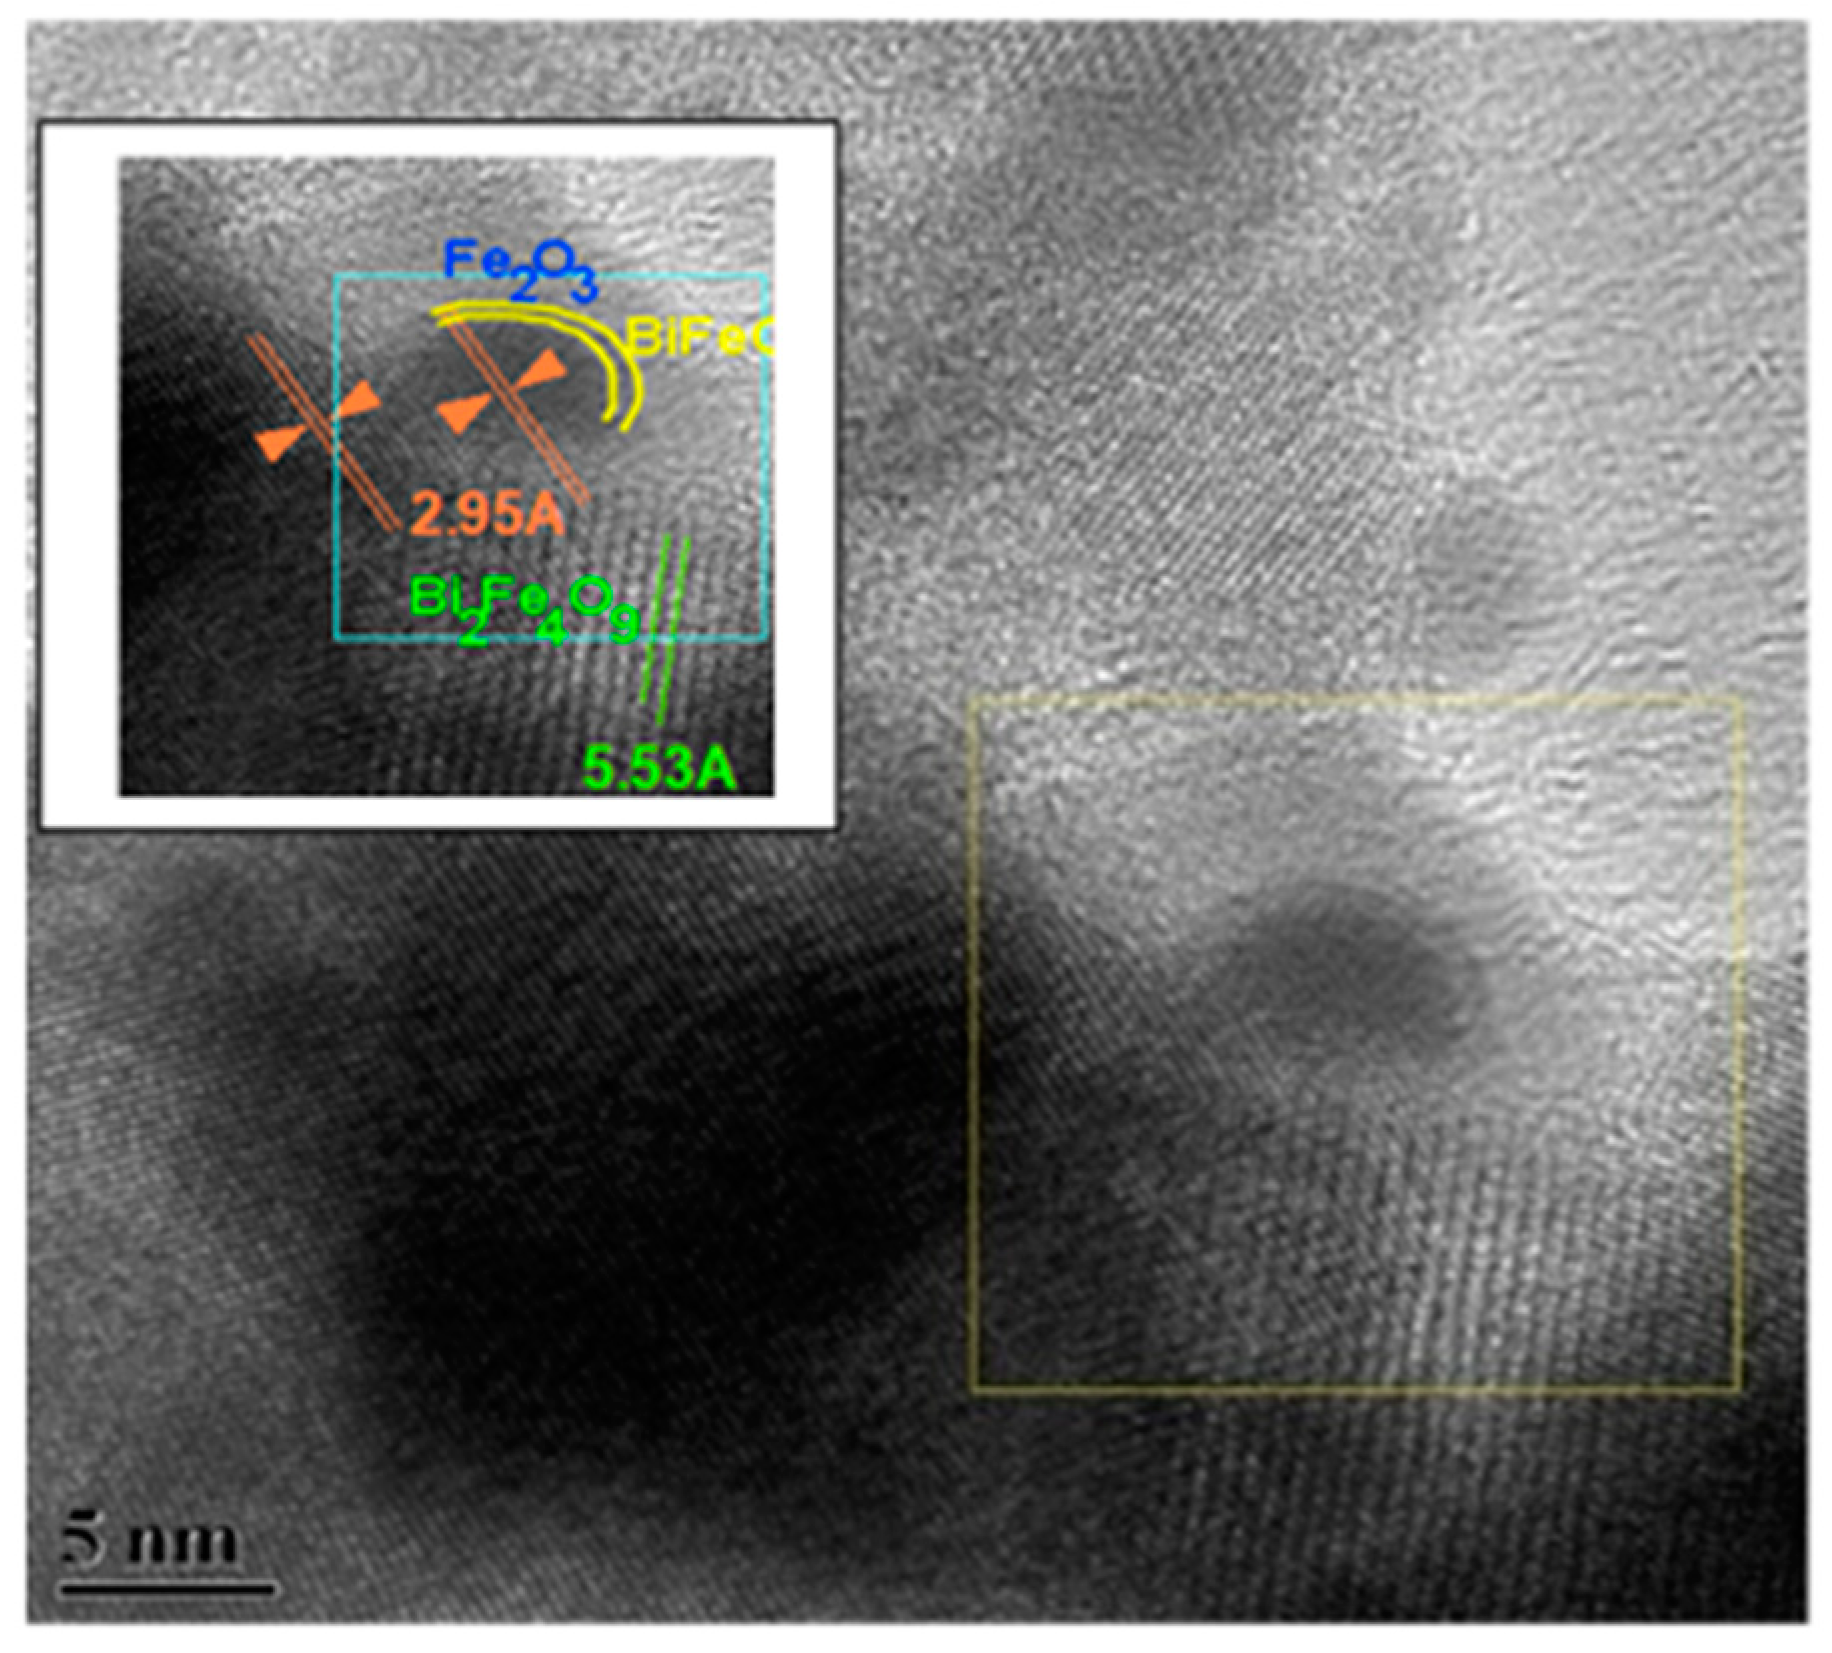
Transmission electron microscopy studies reveal that there are core-shell structured particles occurring in the ball milled and subsequently annealed sample (Cf. Figure 2). Based on the analysis of the selected area electron diffraction (SAED) pattern corresponding to the core, it is deduced that the core is basically composed of Bi2Fe4O9. Based on the FFT analysis, it is deduced that the shells are amorphous in nature, thus these particles are deduced as having Bi2Fe4O9 as the core and a shell of amorphous bismuth ferrite and alpha-Fe2O3. The presence of BiFeO3 and alpha-Fe2O3 have been deduced based on the results of XRD and Mössbauer studies.
2.3. Mössbauer Studies
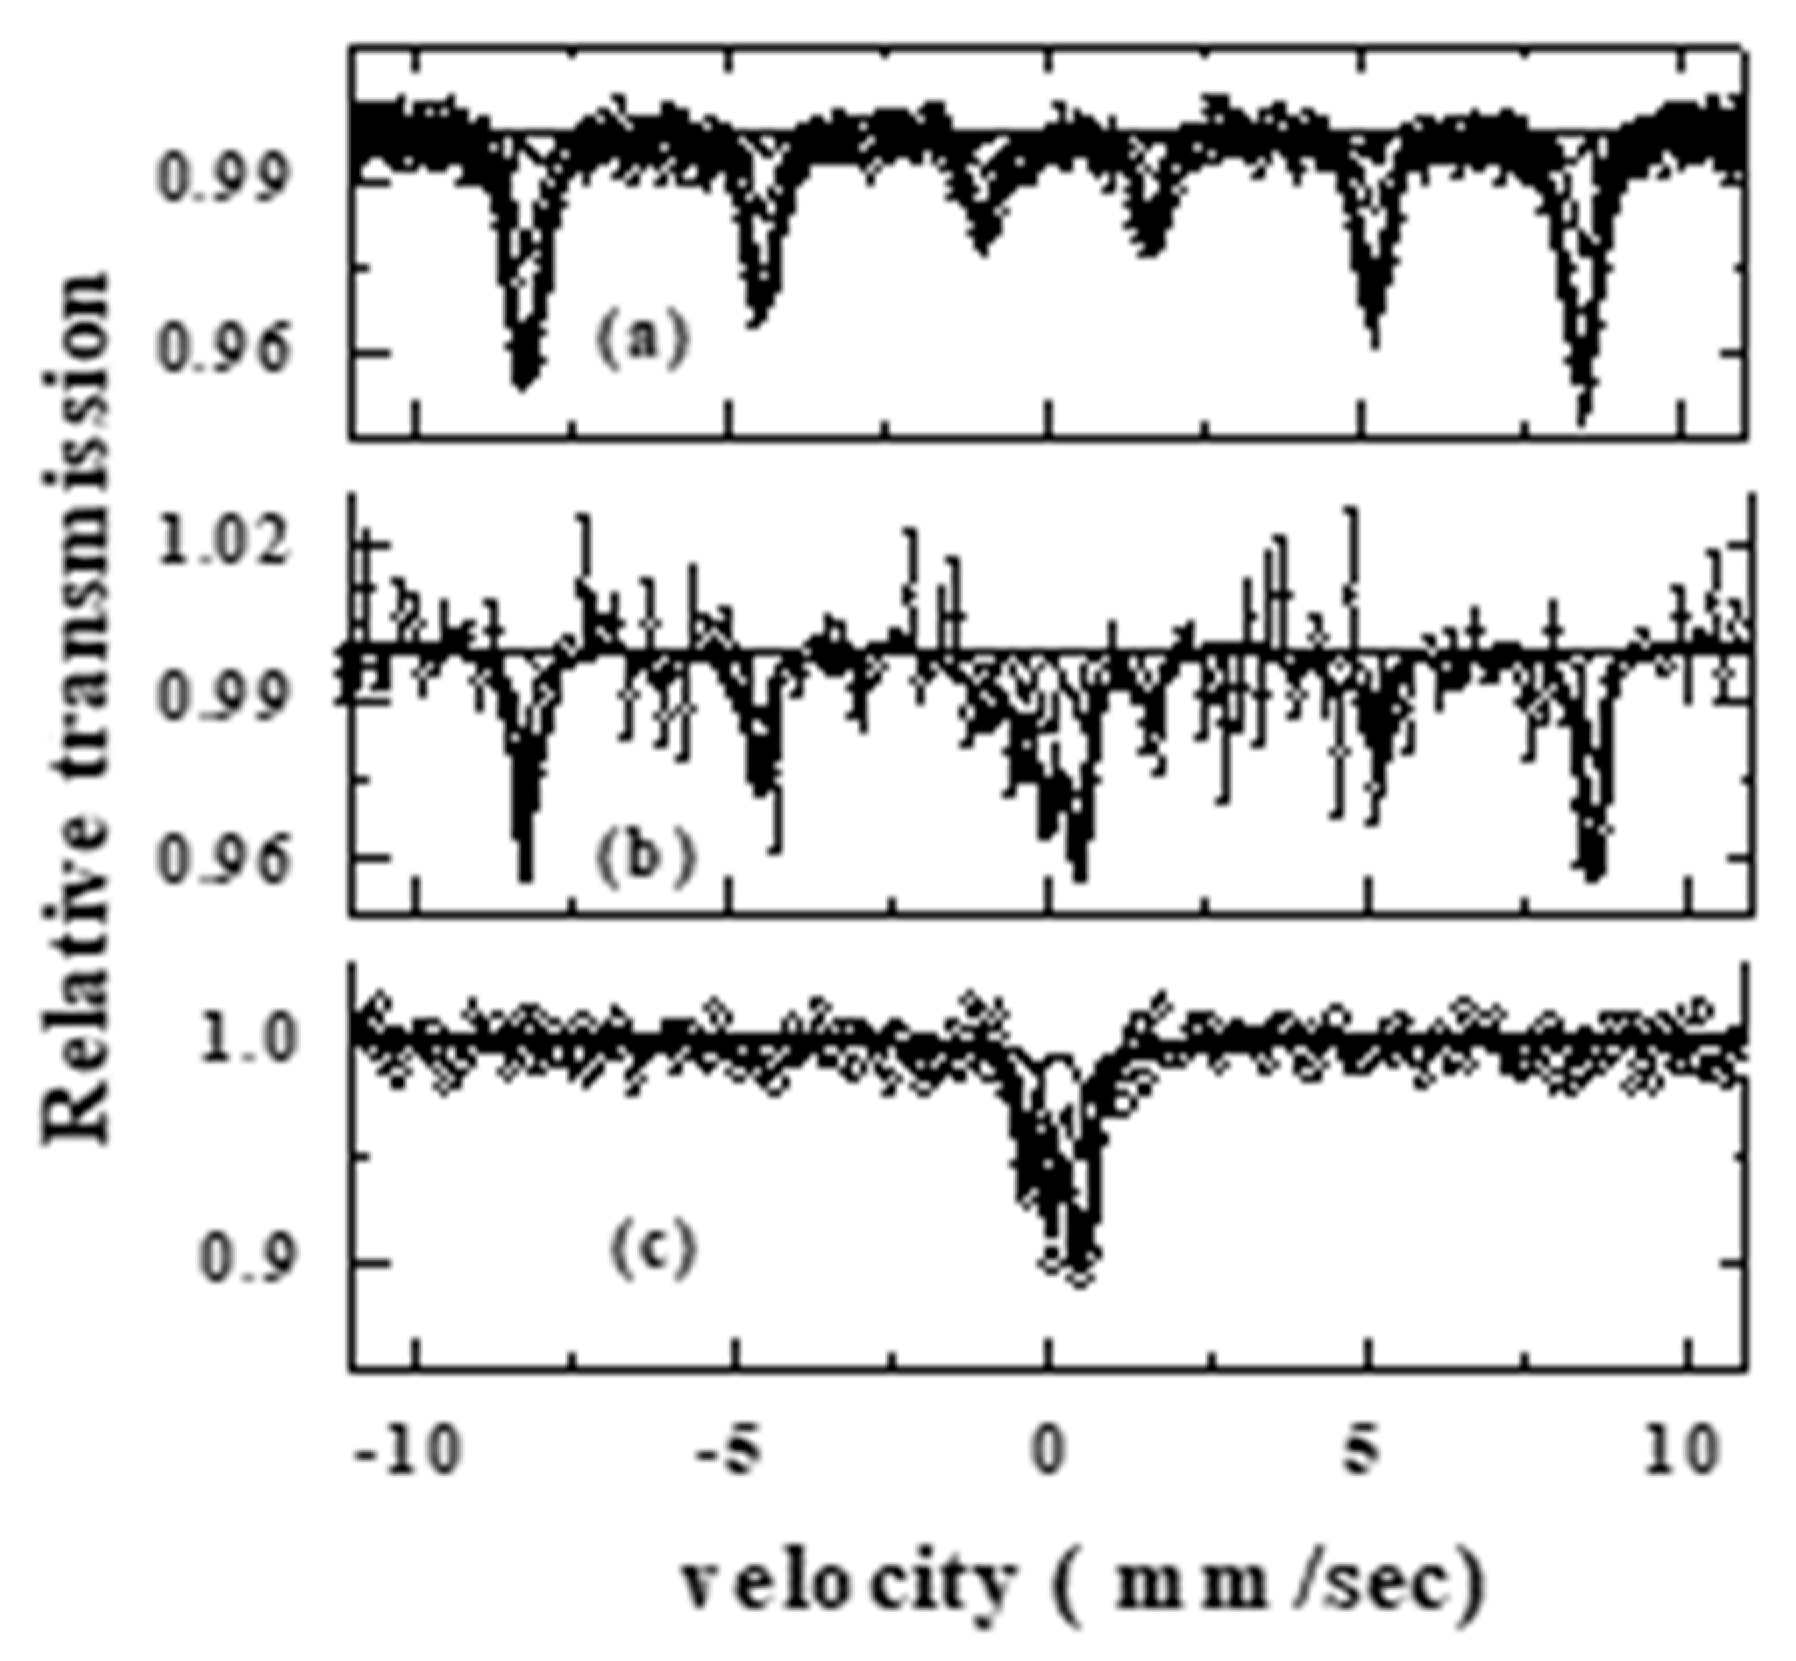
Mössbauer studies have been carried out in transmission geometry in order to mainly understand the local structure and magnetic properties of the phases existing in the samples. Resultant Mossbauer spectra (Cf. Figure 3) and analyzed hyperfine parameters (Cf. Table 1) are shown. In the ball milled sample, it is observed that almost all Fe atoms are associated with only α-Fe2O3, implying that most α-Fe2O3 particles exist as a single phase. Only about 4% of Fe atoms are observed to be associated with BiFeO3. While in the Bi2Fe4O9 sample prepared through the solid state route, it is observed that Mössbauer spectrum could be de convoluted into two doublets characteristic of Bi2Fe4O9, with Fe atoms occupying octahedral and tetrahedral sites. It is observed that in addition to the doublet corresponding to Bi2Fe4O9, there occurs broad modified sextets related to BiFeO3 evolved in the studied BMA sample, and the corresponding hyperfine parameters are presented in Table 1.
Mössbauer results presented in Table 1 show the presence of phases, such as α-Fe2O3, BiFeO3-x, and Bi2Fe4O9, indicated as 1, 2, and 3, respectively. Here, 1a,1b,1c corresponds to α-Fe2O3, while 2 and 3 are due to Fe atoms associated with phases, such as BiFeO3 and Bi2Fe4O9, respectively.
Hyperfine parameters deduced in the ball milled sample show mostly alpha-Fe2O3 commensurate with XRD results. Mössbauer studies carried out in Bi2Fe4O9 prepared through the solid state route (Cf. Figure 3 and Table 1) show Fe atoms occupying tetrahedral and octahedral sites. In the case of BMA, it could be deduced that about 46% of Fe atoms are associated with alpha-Fe2O3, and the remaining fractions associated with magnetic interactions are due to BiFeO3.
Importantly, it is seen from the hyperfine components corresponding to BiFeO3 that the presence of oxygen vacancies in this phase could be deduced as indicated by higher values of isomer shift compared to 0.3 mm/s corresponding to Fe3+. Hence, based on the XRD and Mössbauer results, it can be deduced that the system of the present study BMA is characterized to be a composite of Bi2Fe4O9, BiFeO3 and α-Fe2O3.
In the following section, we will mainly discuss the results of complex impedance spectroscopic studies in this composite.
2.4. Complex Modulous Spectroscopic Studies
Complex modulous spectroscopy is an important tool for determination, analysis, and interpretation of dynamical aspects of electrical transport properties in materials, such as carrier/ion hopping rate and conductivity relaxation. Modulous spectroscopy results are mainly useful for distinguishing spectral components of materials having similar values of resistances, but different capacitances. These results are mainly used for suppressing electrode effects and to get the intrinsic effects corresponding to the sample.
2.4.1. Dielectric and Impedance Studies
Dielectric response of a system represents the variation of resistive and capacitive behavior with frequency and temperature as well distinguishing any anomaly around the transition temperature giving information about the possible magnetodielctric, magnetocapacitive, or magnetoelectric coupling.
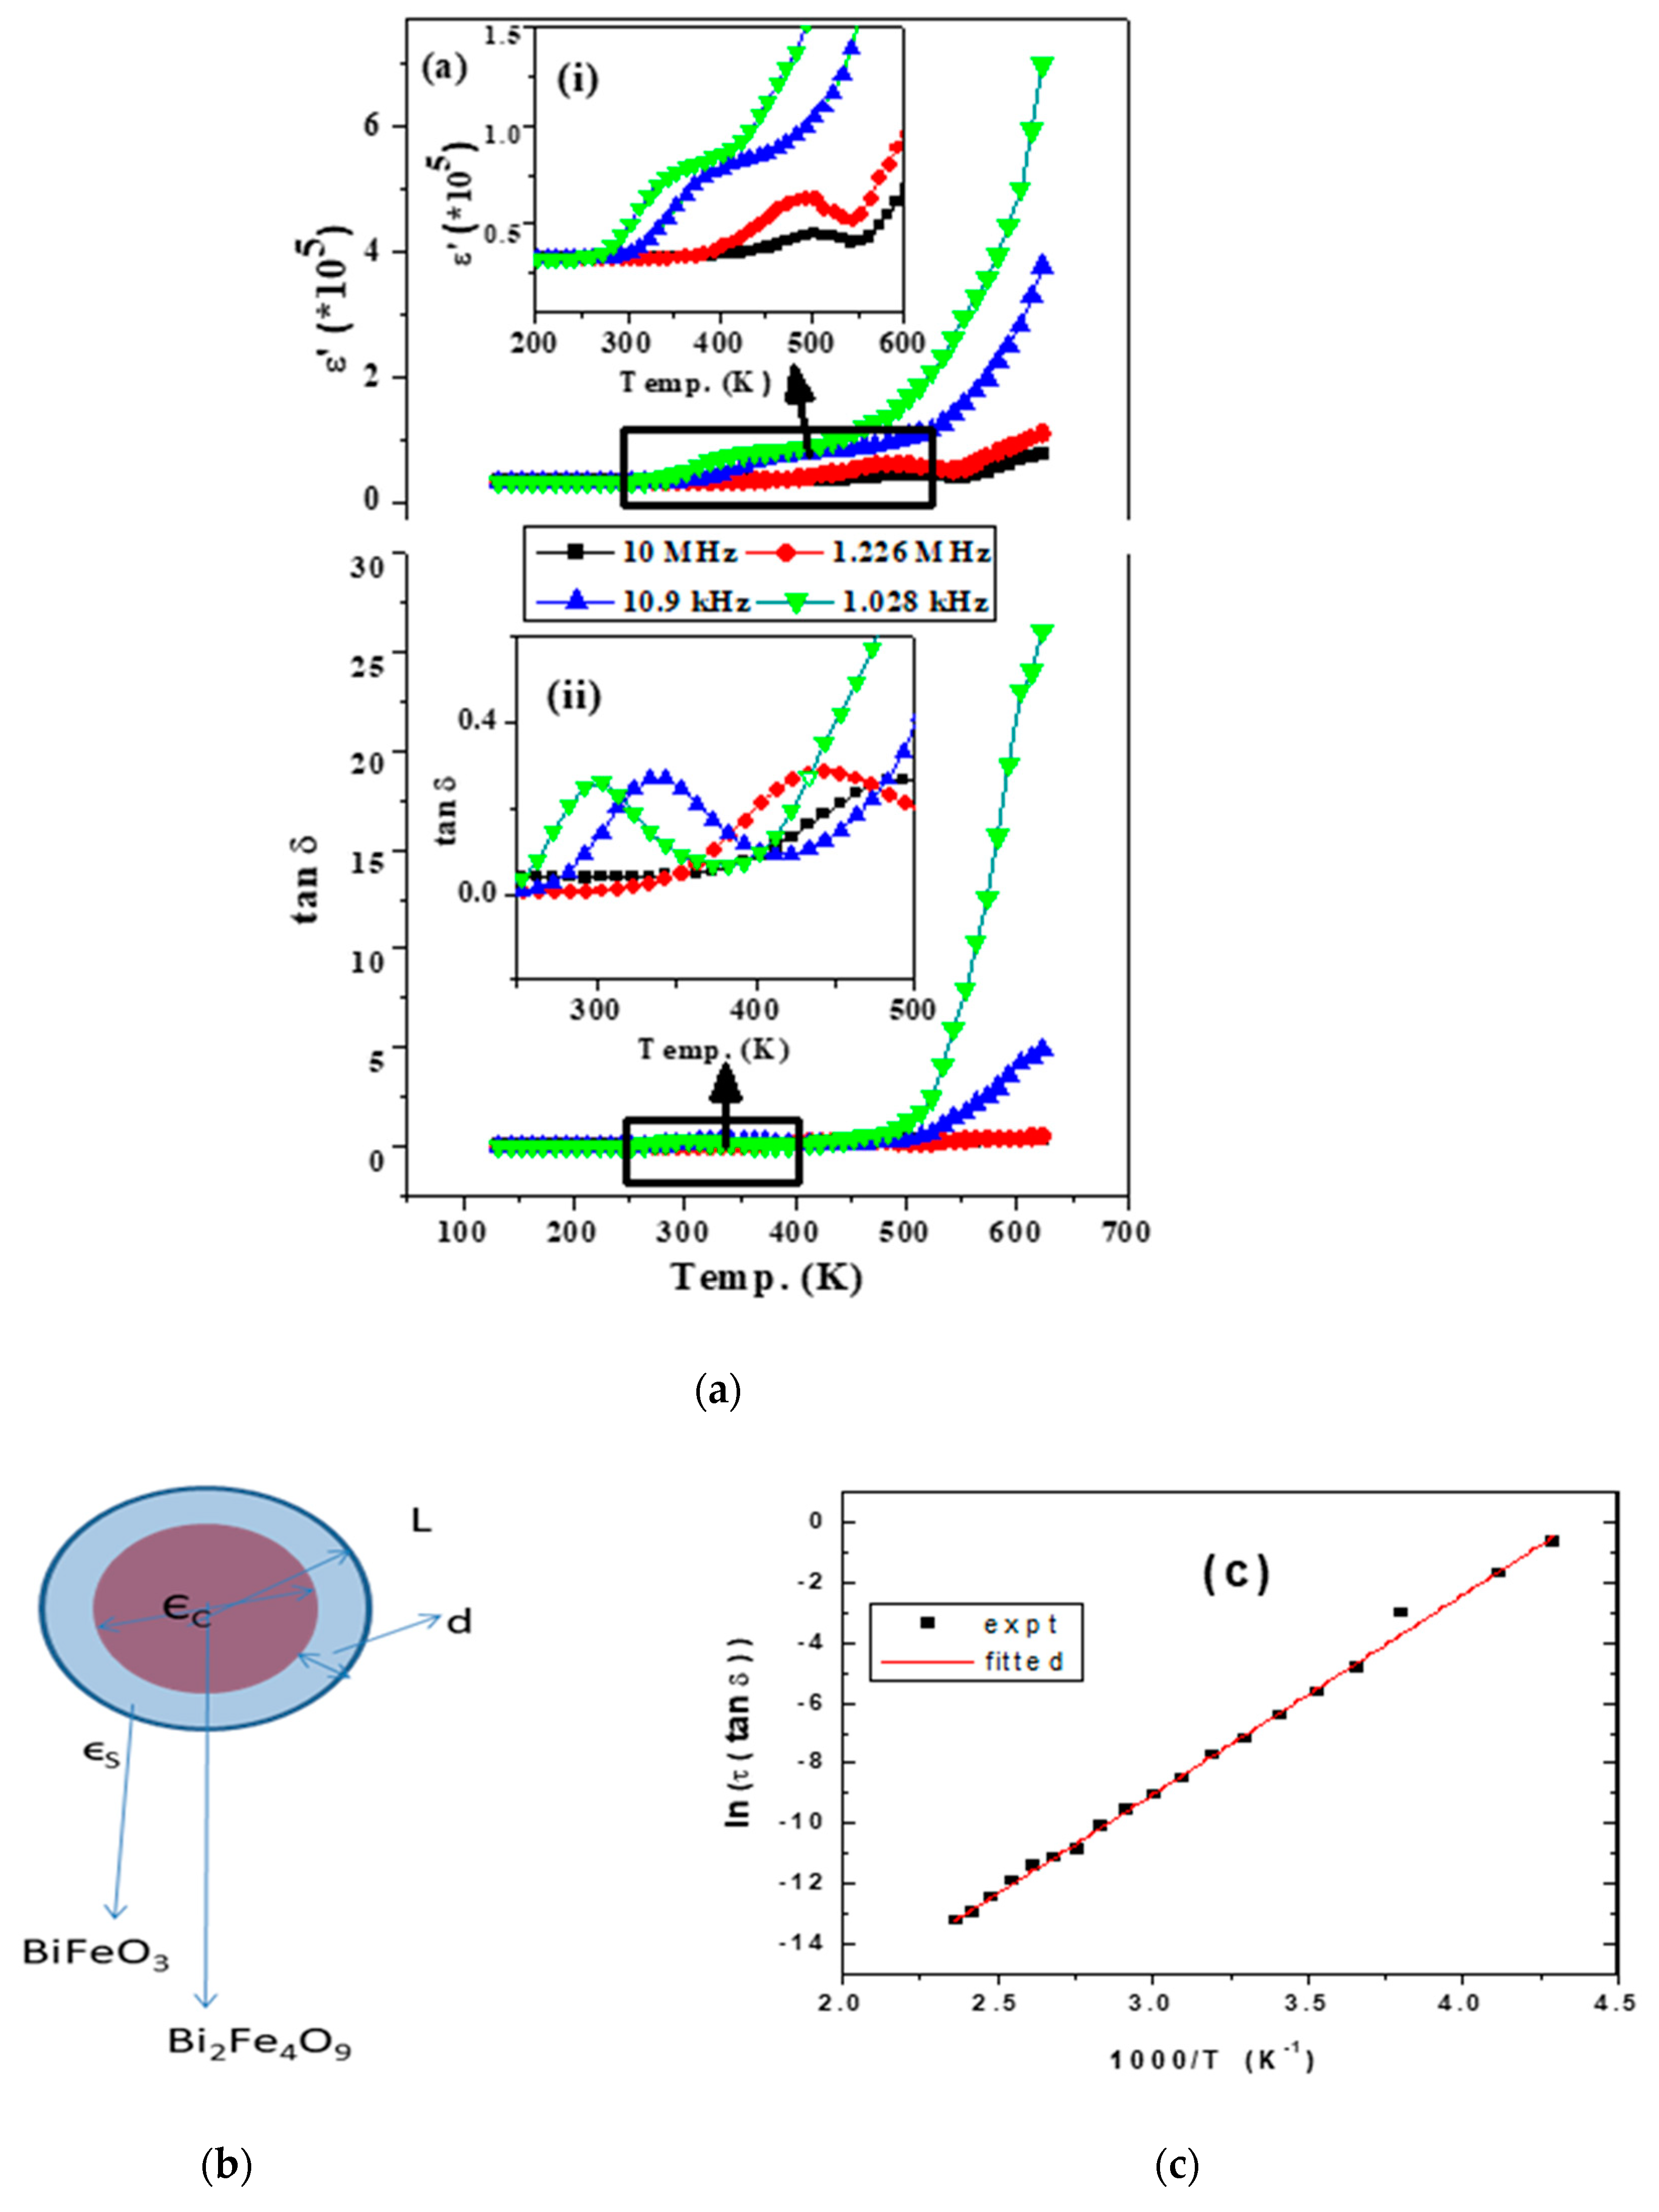
Dielectric properties of the BMA sample are measured and compared in terms of frequency dependence of real part of the dielectric constant (ε1) at different temperatures of the samples (Cf. Figure 4). As shown in Figure 4a, a sharp decrease in the dielectric constant with an increase in frequency is indicative of a Maxwell-Wagner type relaxation due to space charge release, creating a high impedance barrier at the sample electrode interface and thus a high value of the dielectric constant. With an increase in the frequency of the applied electric field, the dipoles are unable to follow the applied field and thus the dielectric constant (ε) decreases and becomes independent of temperature in a high frequency region. A significantly large value of the dielectric constant has been observed in the sample. The step like dielectric relaxation is observed at low frequencies for low measurement temperatures. While the trend according to Koop theory is followed in both the cases, there is a plateau region in the low frequency region as seen in the ε1 vs. f plot, and correspondingly there occurs a peak in the tangent loss shown as the inset in the case of the ball milled and annealed sample (BMA). This plateau region is further observed to shift to a high frequency region with increasing temperature. This can be attributed to a new relaxation phenomena appearing in the case of the BMA sample due to the presence of off stoichiometric BiFeO3 as deduced from the Mössbauer results.
The frequency value at which the step like behavior occurs is observed to increase with an increasing temperature of the sample. The step like dielectric relaxation as observed at low temperatures in the case of BMA is understood to be due to polaron relaxation, which results from the carrier hopping process between Fe2+ and Fe3+. Such a polaron hopping includes a dielectric relaxation process roughly explained by Debye theory. At low temperatures, electric dipoles freeze due to the relaxation process. The relaxation process is mainly dictated by the rate at which the polarization occurs and the frequency of the applied electric field.
The dielectric relaxation is, in general, represented as:
where ω is the angular frequency, and εo and ε∞ are the static dielectric constant (ω → 0) and permanent dielectric constant (ω → ∞). Where τ is the relaxation time and ε1(ω) and ε2(ω) are the real and imaginary parts of the dielectric response, respectively. The loss factor is given as tanδ = ε2(ω)/ε1(ω), while δ is the phase difference between the applied electric field and induced current. While ε2(ω) can be obtained from the above equation as ε2(ω) = ω∙τ/1 + (ω∙τ)2 and the maximum of ε2(ω) lies around ω∙τ ≈ 1.
ε (ω) = ε∞ + (εo − εω)/(1 − iωτ) = ε1(ω) + i∙ε2(ω)
A close observation of the plots (cf inset 4(a) show that a dielectric peak corresponding to a dielectric loss peak (cf Figure 4a(i),(ii)) is observed, which shifts to a high frequency with an increase in temperature. The presence of such a peak is indicative of conductive losses due to relaxing dipoles in the sample [12]. This occurs in a transition temperature range of Bi2Fe4O9 (~300 K) and shifts towards the magnetic transition temperature of BiFeO3 (~500 K). Being a sum property, εeff’ is expected to include ε values from the phases in the composite that is from Bi2Fe4O9, BiFeO3, and Fe2O3 as well. An observation of a similar anomaly in the dielectric constant has been previously observed and discussed for BiFeO3 [13]. The shifting of the loss peak implies that it is a thermally activated process [13].
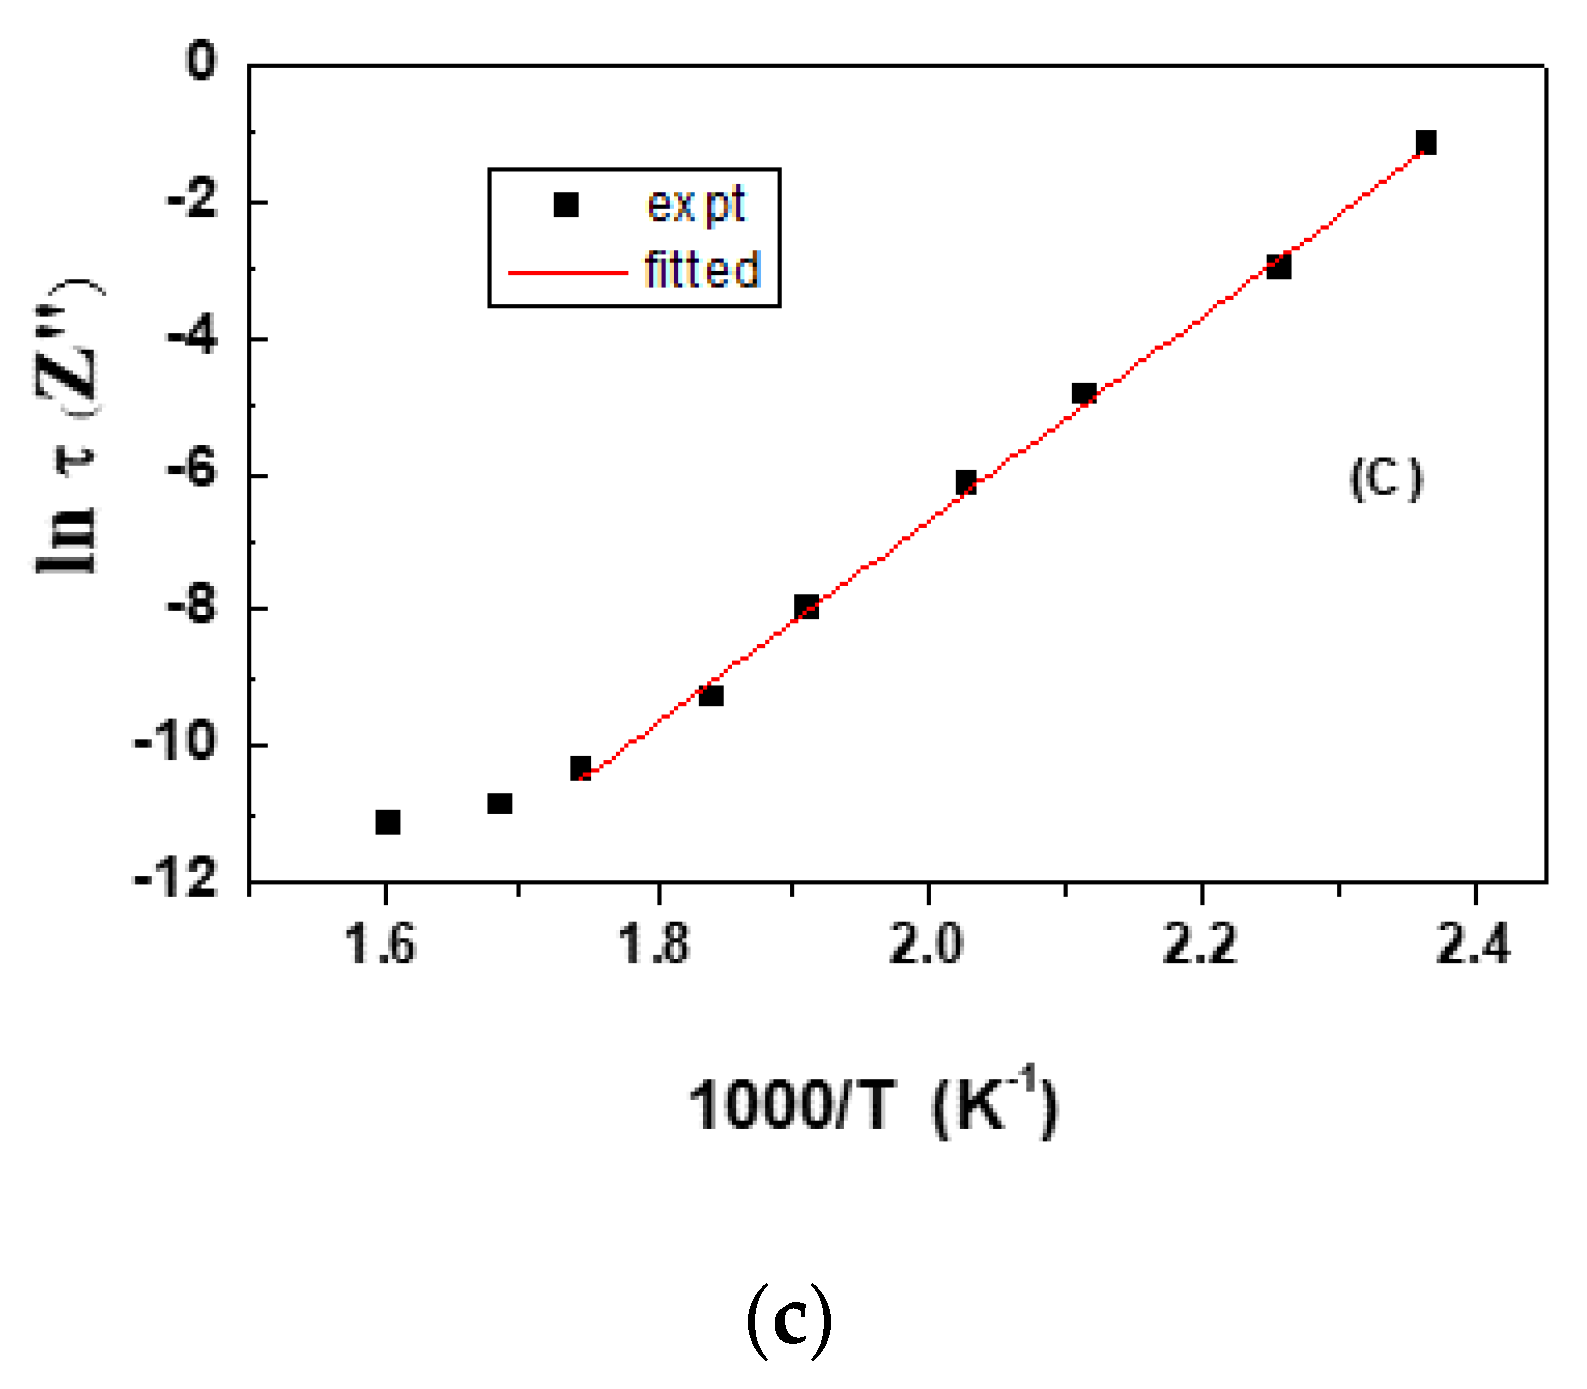
The dielectric relaxation time, τ, is given as τ−1 = τ0−1 exp(−Ea/kBT), with Ea as the activation energy required for relaxation and kBT as the thermal energy. As the maximum of ε2(ω) lies around ω∙τ ≈ 1, from the tangent loss curve corresponding to different temperatures, the values of the dielectric relaxation time have been obtained. Plotted in Figure 4c is the variation of the natural logarithm of dielectric relaxation time with inverse temperature. From the slope of the linear graph, the value of the activation energy for relaxation could be obtained as around 0.6 eV, matching well with the thermally activated mechanism of charge carrier transport across the interface of the grain/grain boundary. The loss peak could be fitted with the Arrhenius equation and fitted with a straight line [14]. The activation energy obtained is 0.6 eV (cf Figure 4c), which is close to that of the energy corresponding to Fe2+/Fe3+ electron hopping due to the oxygen vacancies present in the constituting phases [15]. The insets in Figure 4a show the discontinuity around the transition temperature region of both the phases.
The high dielectric response is mainly contributed by the shell and interfacial polarization i.e., Maxwell–Wagner polarization. In a core-shell structure, which is present in a medium with a dielectric constant, ε, with the core having a dielectric constant, εC, and thickness, L, while if these values corresponding to the shell are εS and d, the effective dielectric constant at low frequencies is given, ω, as:
where in the above equation δ is given as d/L. In the present case, taking the value of the dielectric constant (of εS) of BiFeO3−x as around 50 and d as typically of the order of a few nm (≈1 nm) and L as a few micron, we could get the value of ε* typically of the order of 0.5 × 10⁵ , typically matching with the results around low frequencies obtained in this study, and thus elucidating the giant dielectric response of Bi2Fe4O9 and bismuth iron oxide in a core-shell structure. Further, the presence of insulating α-Fe2O3 in the outer shell significantly enhances the effect of polarization of charges at the bismuth ferrite interface. In the present case, it is important to note that both the basic value of the intrinsic dielectric constant (εS) and the interface effect in terms of the thickness of the shell and interface effects contribute for the enhanced value of the giant dielectric relaxation.
ε* ≈ (εC/ε) + (εS/(ε δ [1 + iωτ])) ≈ LεS/d
Thus, the strong polarization effects are understood to be due to between electron trapped oxygen vacancies of BiFeO3 and that in any other cation (Bi3+), thus inducing space charges between the insulating core (Bi2Fe4O9) and inner surface of the shell of α-Fe2O3. High values of permittivity associated with a strong maximum in the dielectric losses have been reported in bismuth iron oxide based thin films and core-shell structures.
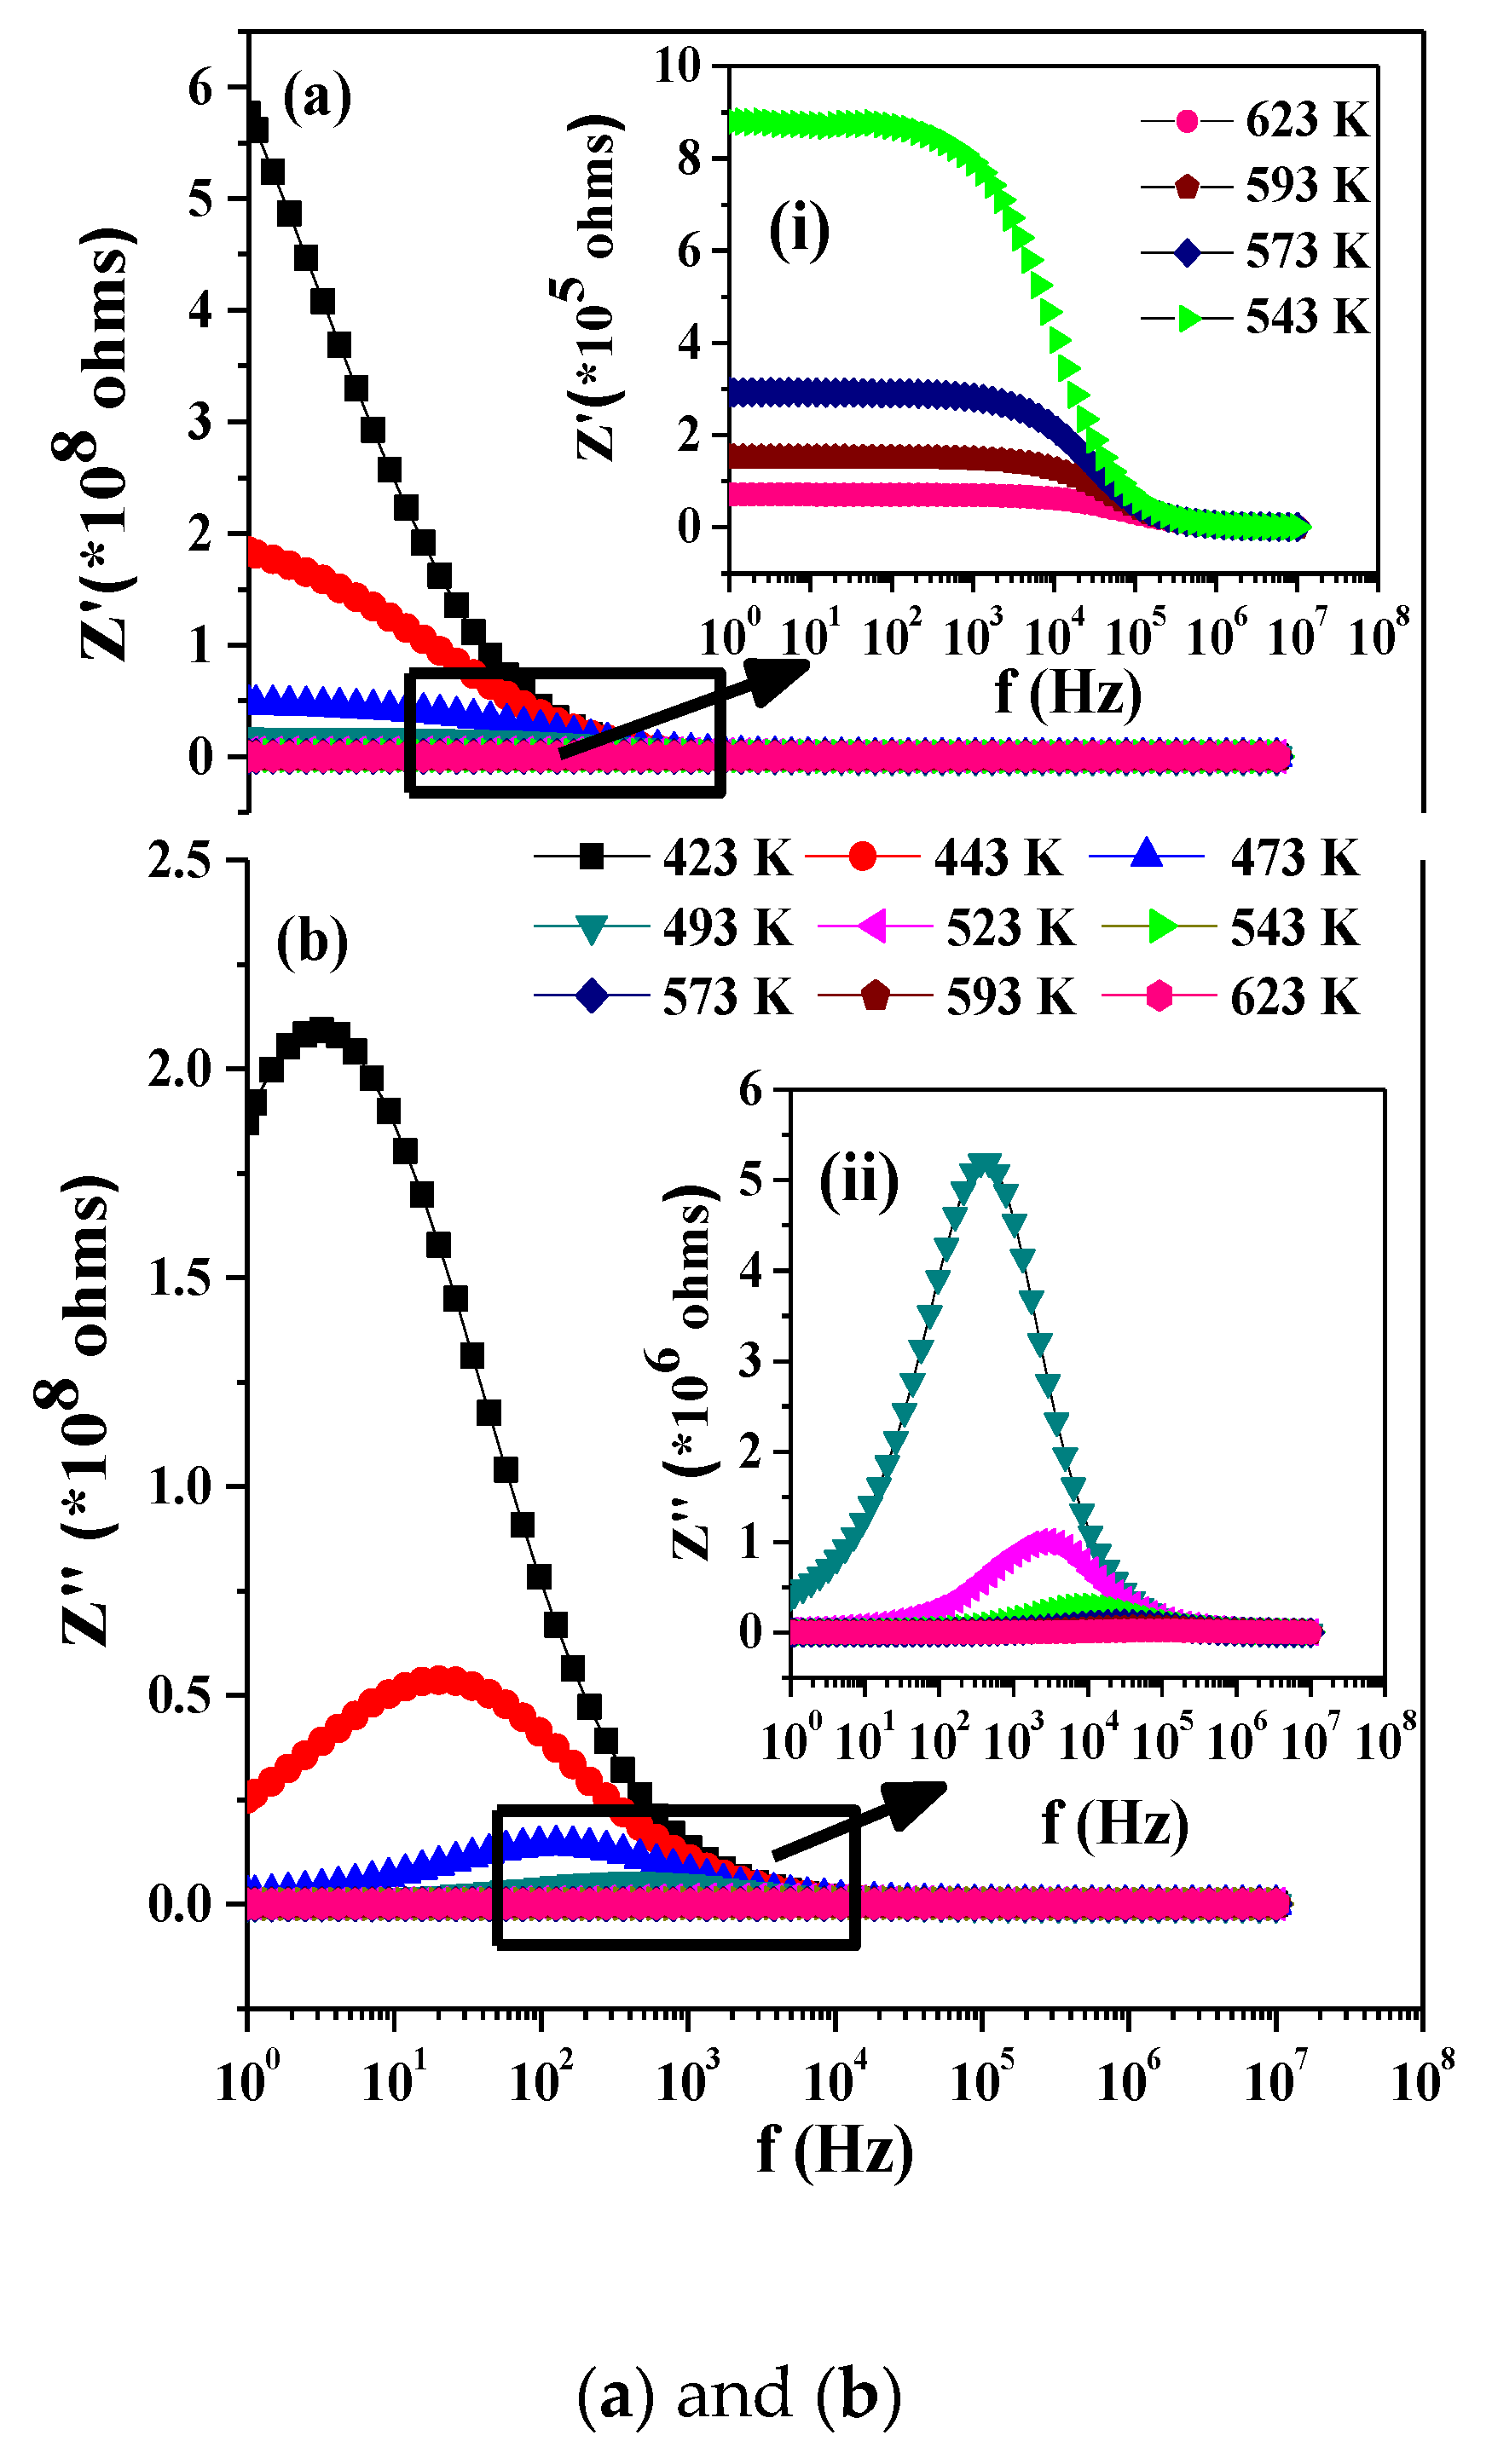
Variation of the real part of impedance with frequency at different temperatures are shown in Figure 5. The Z’ value decreases with increase in T and merges at a higher frequency and becomes constant. This implies space charge release in the material [16]. The zoomed in region in Figure 5a shown as arrow depicting the constancy of the modulus value at the low frequency region, which decreases with frequency and becomes zero. A corresponding peak is observed in the Z” vs. f plot (Cf Figure 5b), which shows broad and asymmetric peaks shifting towards a high frequency and indicative of the non-Debye type due to the distribution of relaxation as the width of the peak varies for different temperatures [17]. The Arrhenius fitting of the peak frequency versus the inverse of temperature (Figure 5c) could be fitted with a straight line with a high value of activation energy possibly due to the inhomogeneous grain boundary effects due to the occurrence of multiple multiferroic phases.
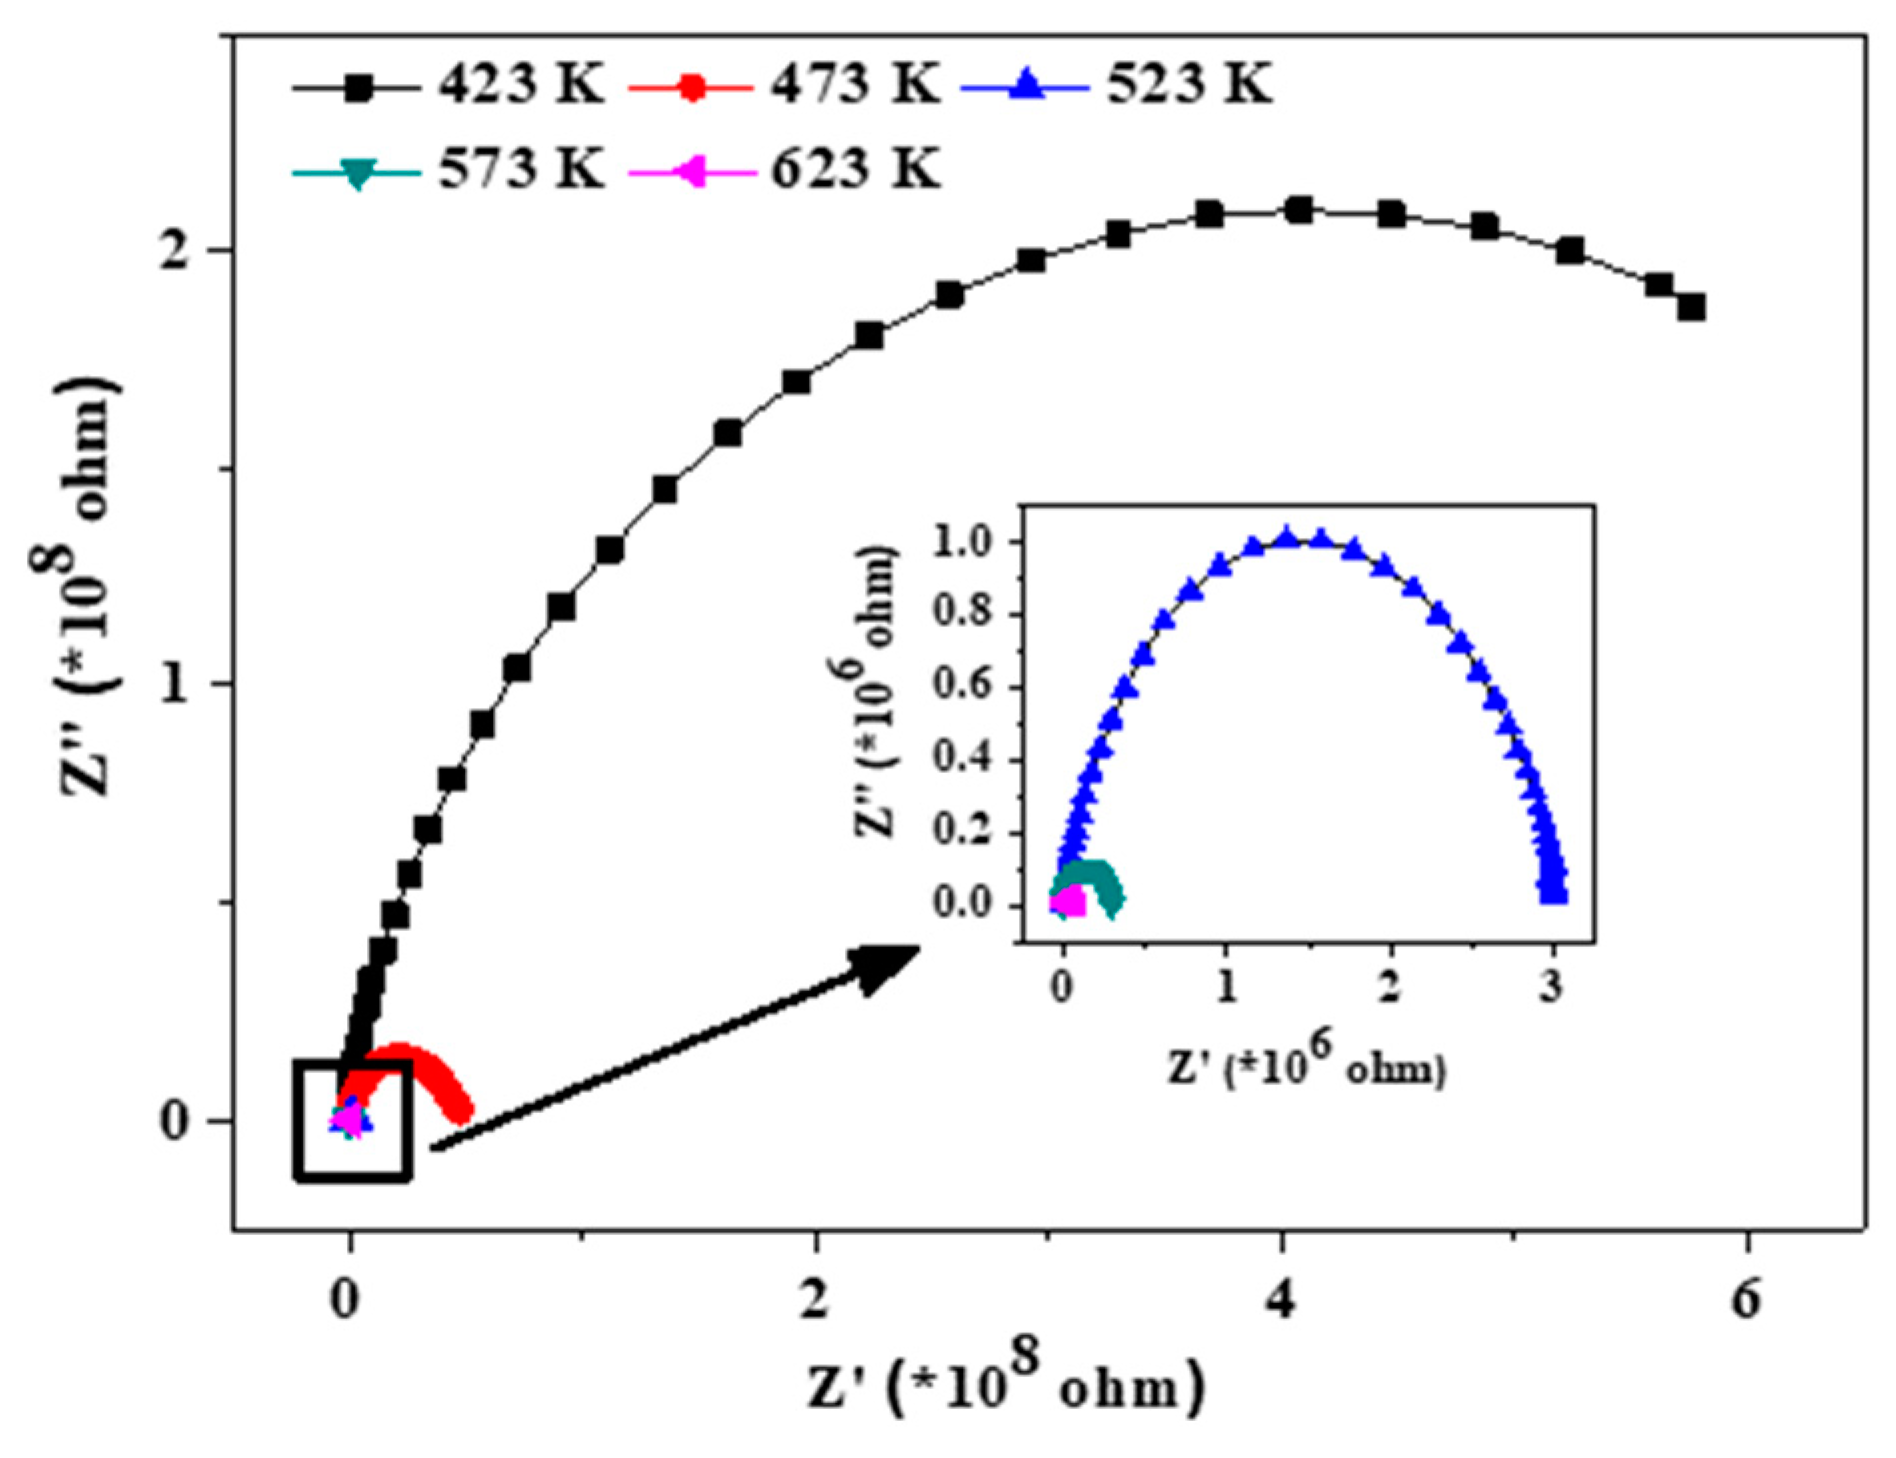
The imaginary and real part of impedance values plotted (Cf Figure 6) showing semicircles known as a Cole-Cole plot is effective in separating out the spectral component contribution of resistance from the grain, grain boundary, and electrodes. The shifting of the intercept on abscissa corresponds to the total resistance contribution and is observed to shift with an increase in temperature indicative of the resistive property that is the bulk resistance, Rb [18]. This implies that, with increasing temperatures, the conductivity of the sample increases as more electrons are free to contribute to conduction due to available thermal energy. The observation of a semicircle may indicate that the constituent phases must be existing in a compact manner, like the core-shell type of particles, due to which the overall contribution is coming as a single semicircle even though three phases are present. As the grain and grain boundary are distinctively different in their order of magnitude, it is difficult to get two semicircles corresponding to the grain and grain boundary on one scale [19]. Thus, modulus analysis is an effective plot to observe this effect prominently as, instead of resistance, it is characterized by capacitive effects in the sample, which comes close for the grain and grain boundary. This is discussed in detail subsequently.
2.4.2. Modulus Analysis
Modulus analysis is an impressive technique to rule out completely or suppress the electrode effect and deal with the electrical conduction mechanisms (hopping) occurring in the sample in terms of the grain and grain boundary only. This helps in separating the region with similar resistances and different capacitances, and thus suppress the electrode effect to understand the relaxation properties of ionic conductors and polycrystalline materials [20]. The Argand plot of modulus can get rid of the ambiguity that comes from the grain and grain boundary effect and is shown in Figure 6.
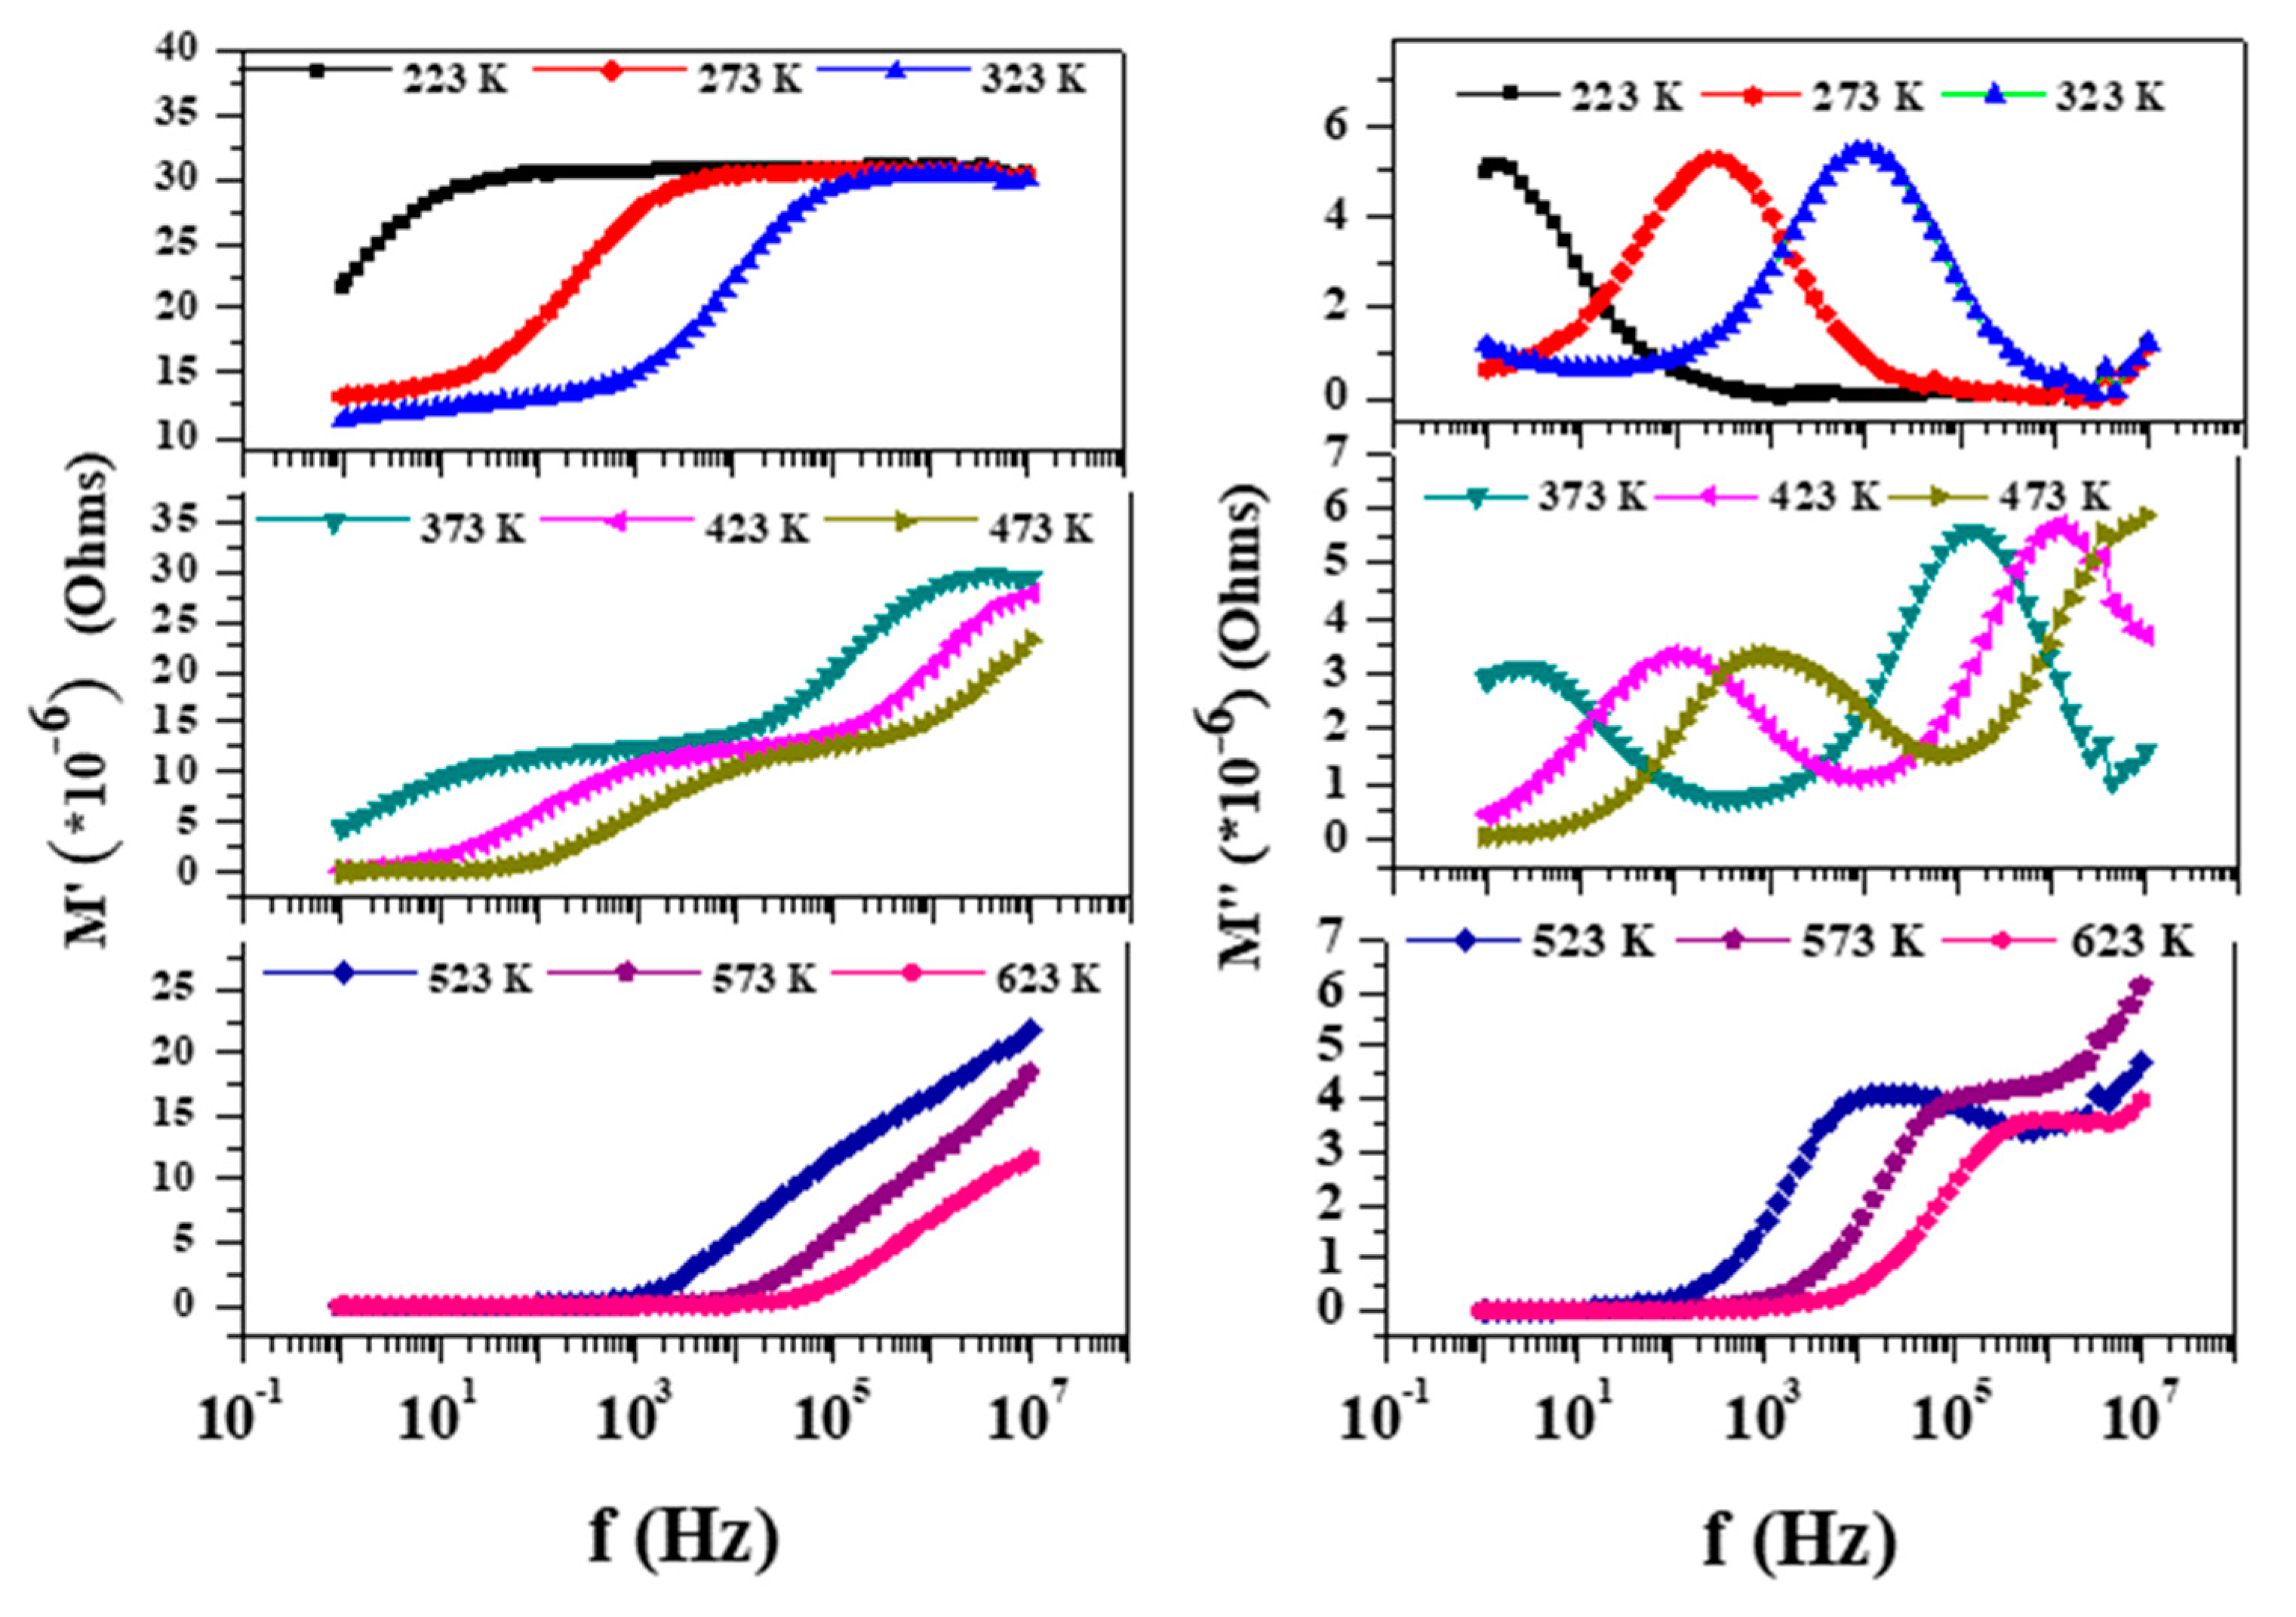
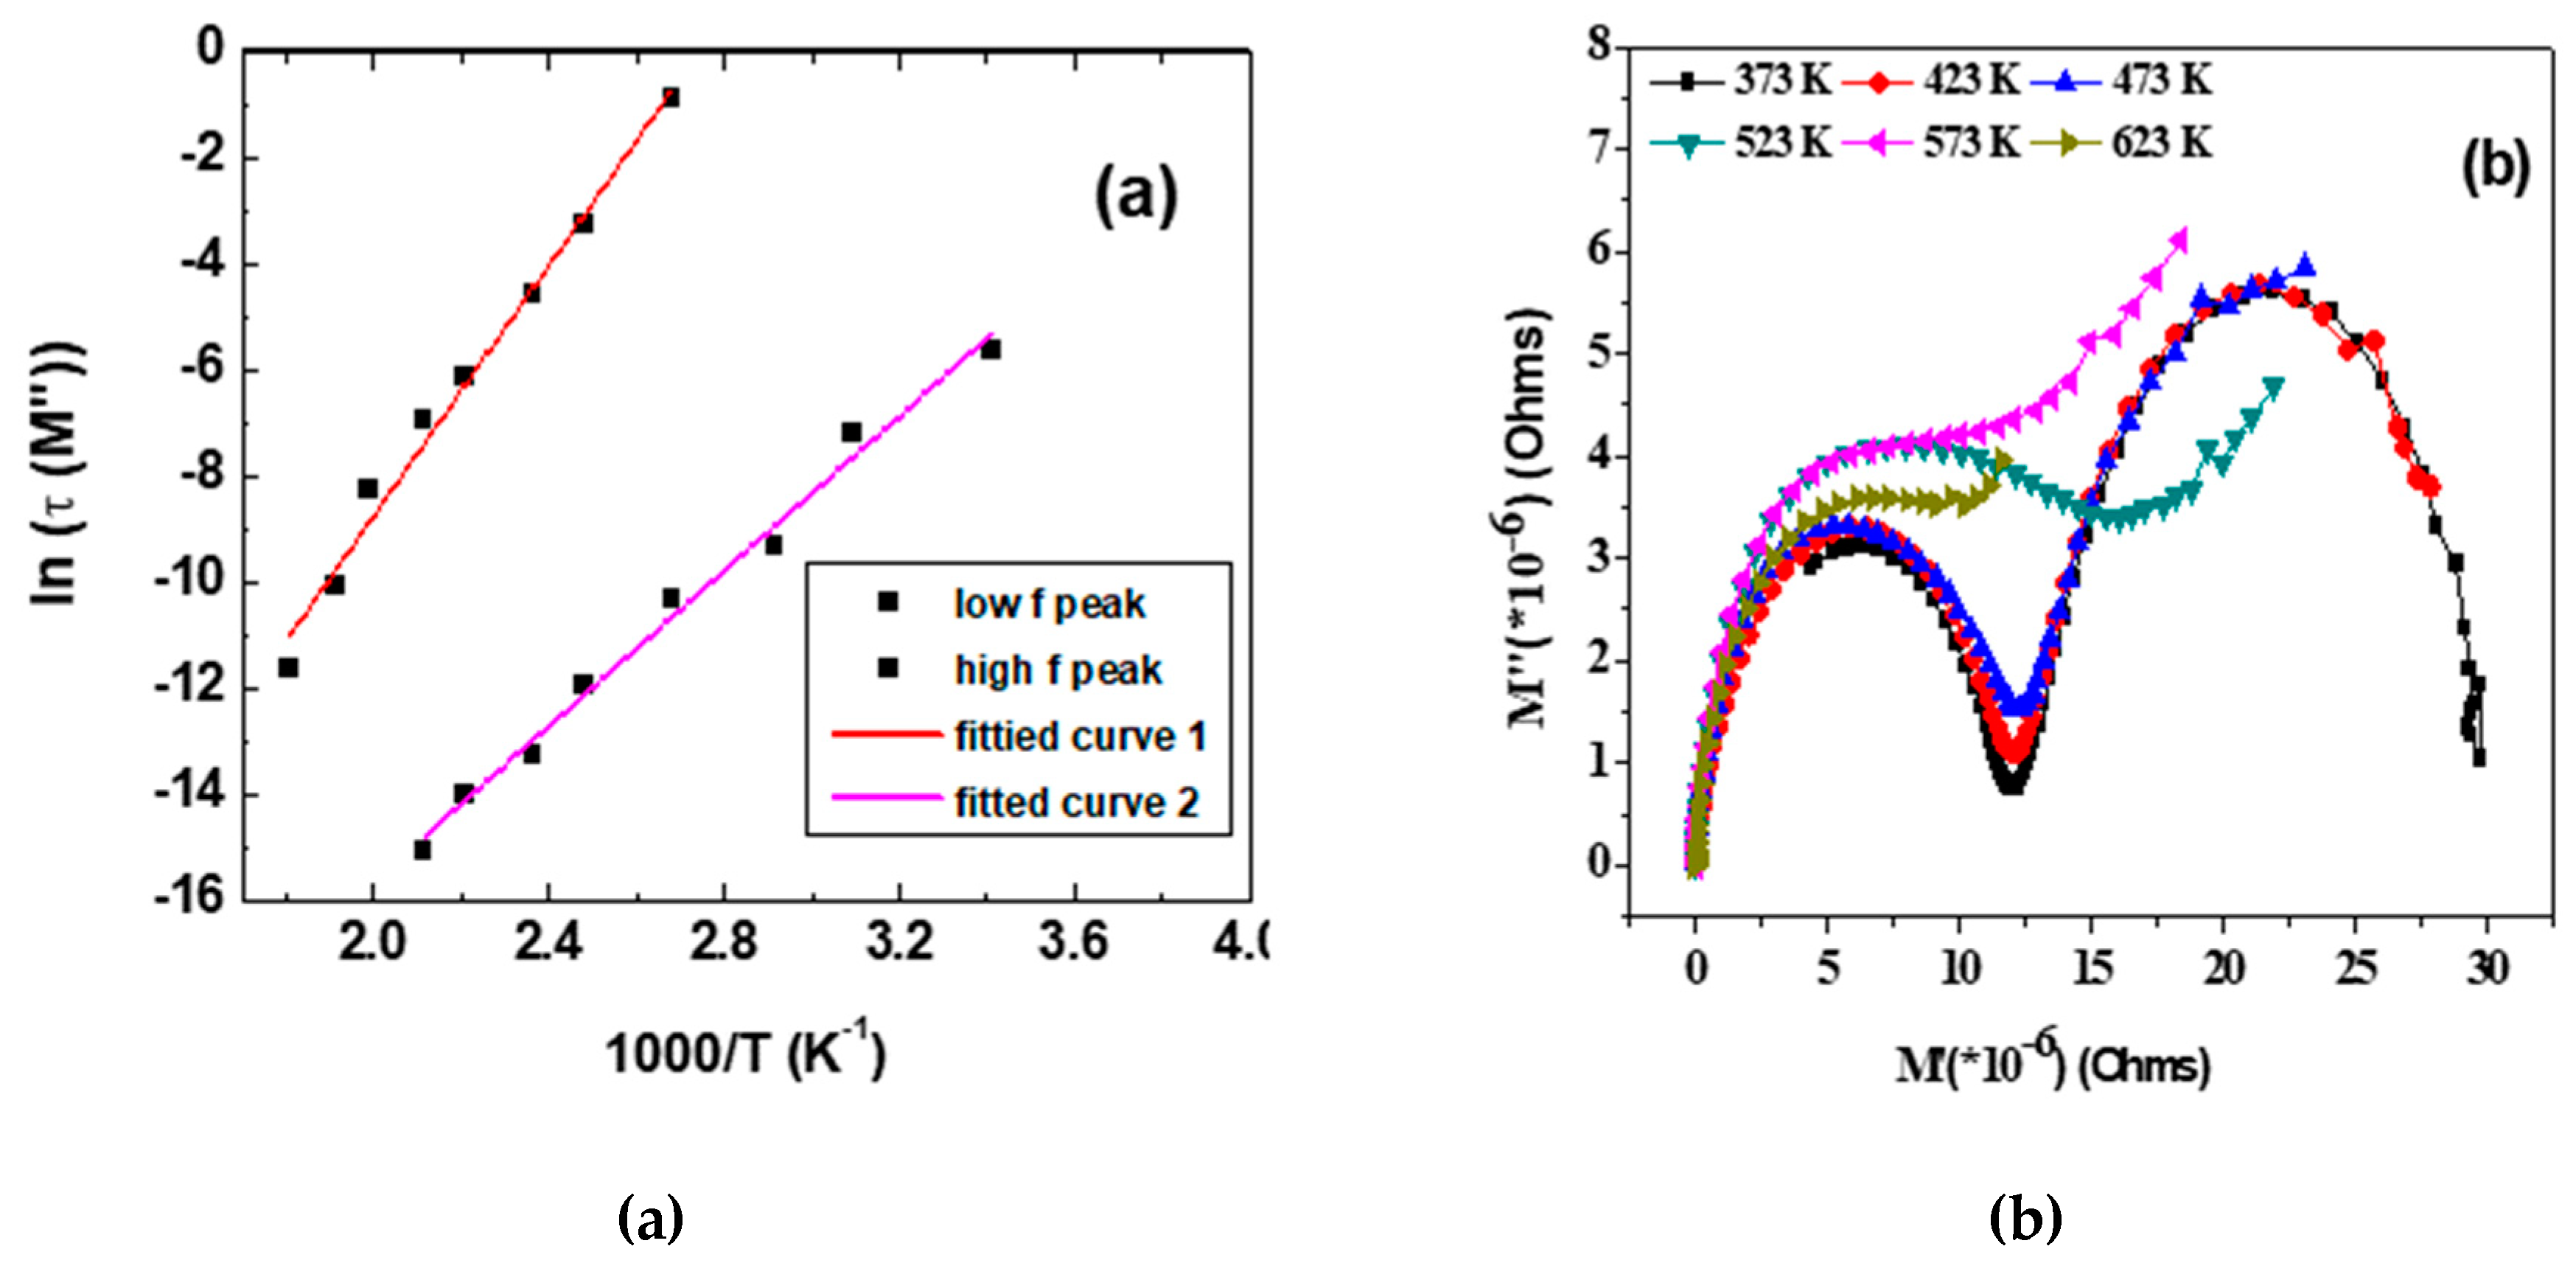
The modulus represents the relaxation of the electric field in the material when electric displacement remains constant so that the electric modulus represents the real dielectric relaxation process [21]. For all the temperature ranges, to start with the M’ value is small, which implies the negligible/zero electrode effect [22]. M’ measures the ability of the material to store energy and M” is effective to understand the ionic conduction mechanism [23]. The plot of M’ and M” (Cf. Figure 7) shows continuous dispersion with frequency, implying short range mobility of the charge carriers. The observation of a plateau in the mid frequency region shifts, which implies the existence of frequency relaxation in the material [24]. The increase in M’ with frequency shows that the relaxation distribution is spreading over the range of frequency and is accompanied by a peak in M” plots. The broad and asymmetric peak in M” is again indicative of the non-Debye type relaxation with a distribution of relaxation time. The ions that interact in its surrounding will introduce a perturbed potential and affect the motion of neighboring ions. Thus, this cooperative motion will give rise to a distribution of the relaxation time [25]. In general, the region to the left of the M”peak implies a range in which charge carriers are mobile over long distances, and that to the right is the range in which the carriers are confined to potential wells over a short range [13,26]. Shown in Figure 8 is also the Arrhenius fitting of M’’ peaks in terms of the variation of ln (M(τ)) with 1000/T. The variation shows the occurrence of two distinct slopes. Similar observation on ZrTiO4 is discussed by Victor et al. [19], wherein they got two peaks with an activation energy 0.52 eV for the high frequency and 1.32 eV for the low frequency. The low frequency peak with higher activation energy is attributed to the grain boundary barrier formation against electron conduction where the ionic motion is more easily compared to the tightly packed grains. The low frequency grain with lower activation energy is understood as if the electron is trapped in shallow potential wells or oxygen vacancies. In this case, the observation of two peaks in M” can be understood as governed by the inhomogenities due to the presence of different phases of the composite system. Shifting of the M” peak toward the high frequency with an increase in temperature is similar to that of ionic conductors and semiconductor [19]. The activation energy and relaxation time corresponding to the two peaks of the M” plot are given in Table 2. The presence of two activation energies is indicative of the two conductive mechanisms viz., conduction through the grain and grain boundary that is occurring in the sample, which could be deduced from modulus plots more clearly.
The Argand plot M” vs. M’ (Cf. Figure 8) shows two semicircles corresponding to the grain boundary and grain, respectively, with no sign of a third semicircle (due to electrode effect). The intercept of the first semicircle is the inverse of the grain boundary capacitance and that of the second is the inverse of the total capacitance in series [19].
The relaxation time is the time required for the recombination of charges till the capacitor is fully discharged during which the field is no longer applied. As can be seen from Table 2, the activation energy and correspondingly the time required for dielectric relaxation is higher for oxygen vacancy defects and thus the hopping from Fe2+/Fe3+. While the dielectric relaxation time for the composite is 10 times higher as compared to single phase Bi2Fe4O9, implying that the composite shows better capacitive effect and hence charge storage effects [27].
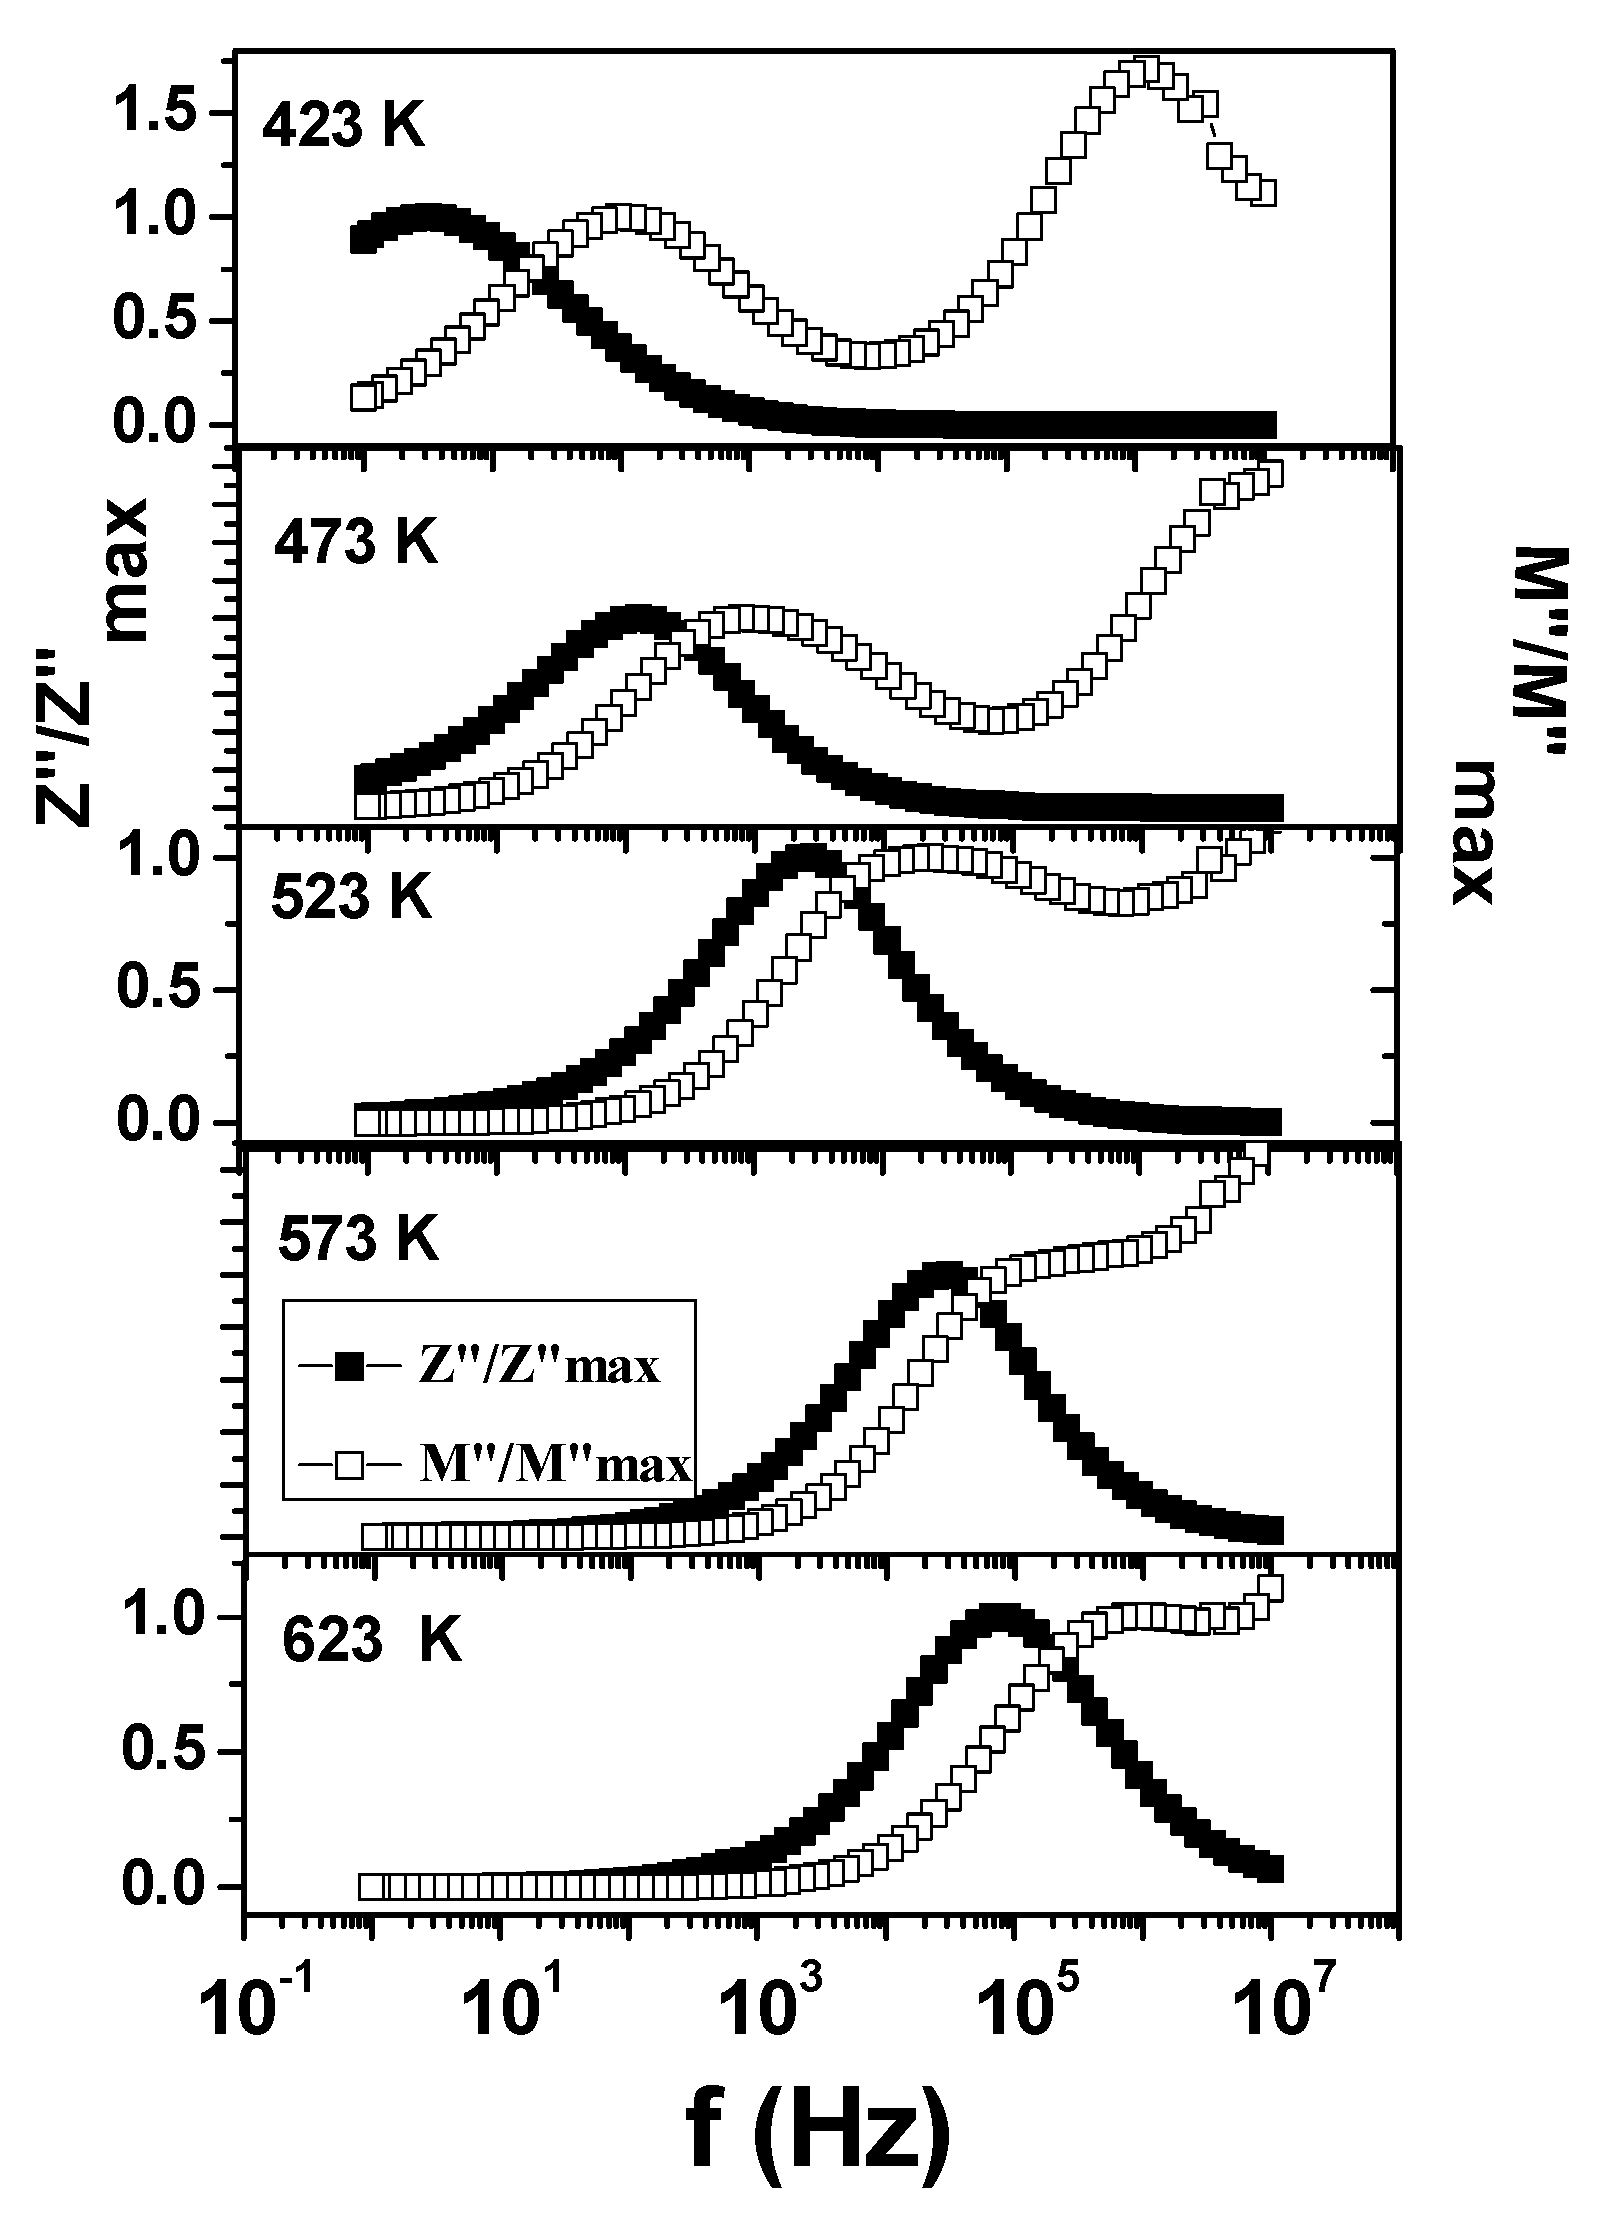
The normalized plot of M” as well as Z” is shown in Figure 9, which shows a non-coincident of frequency of occurrence of maxima, which implies two different phenomena contributing for the relaxation in the modulus and impedance, respectively. This indicates the non-Debye type behavior of the system in the temperature range of 423 K–623 K [28].
2.4.3. Conductivity Analysis
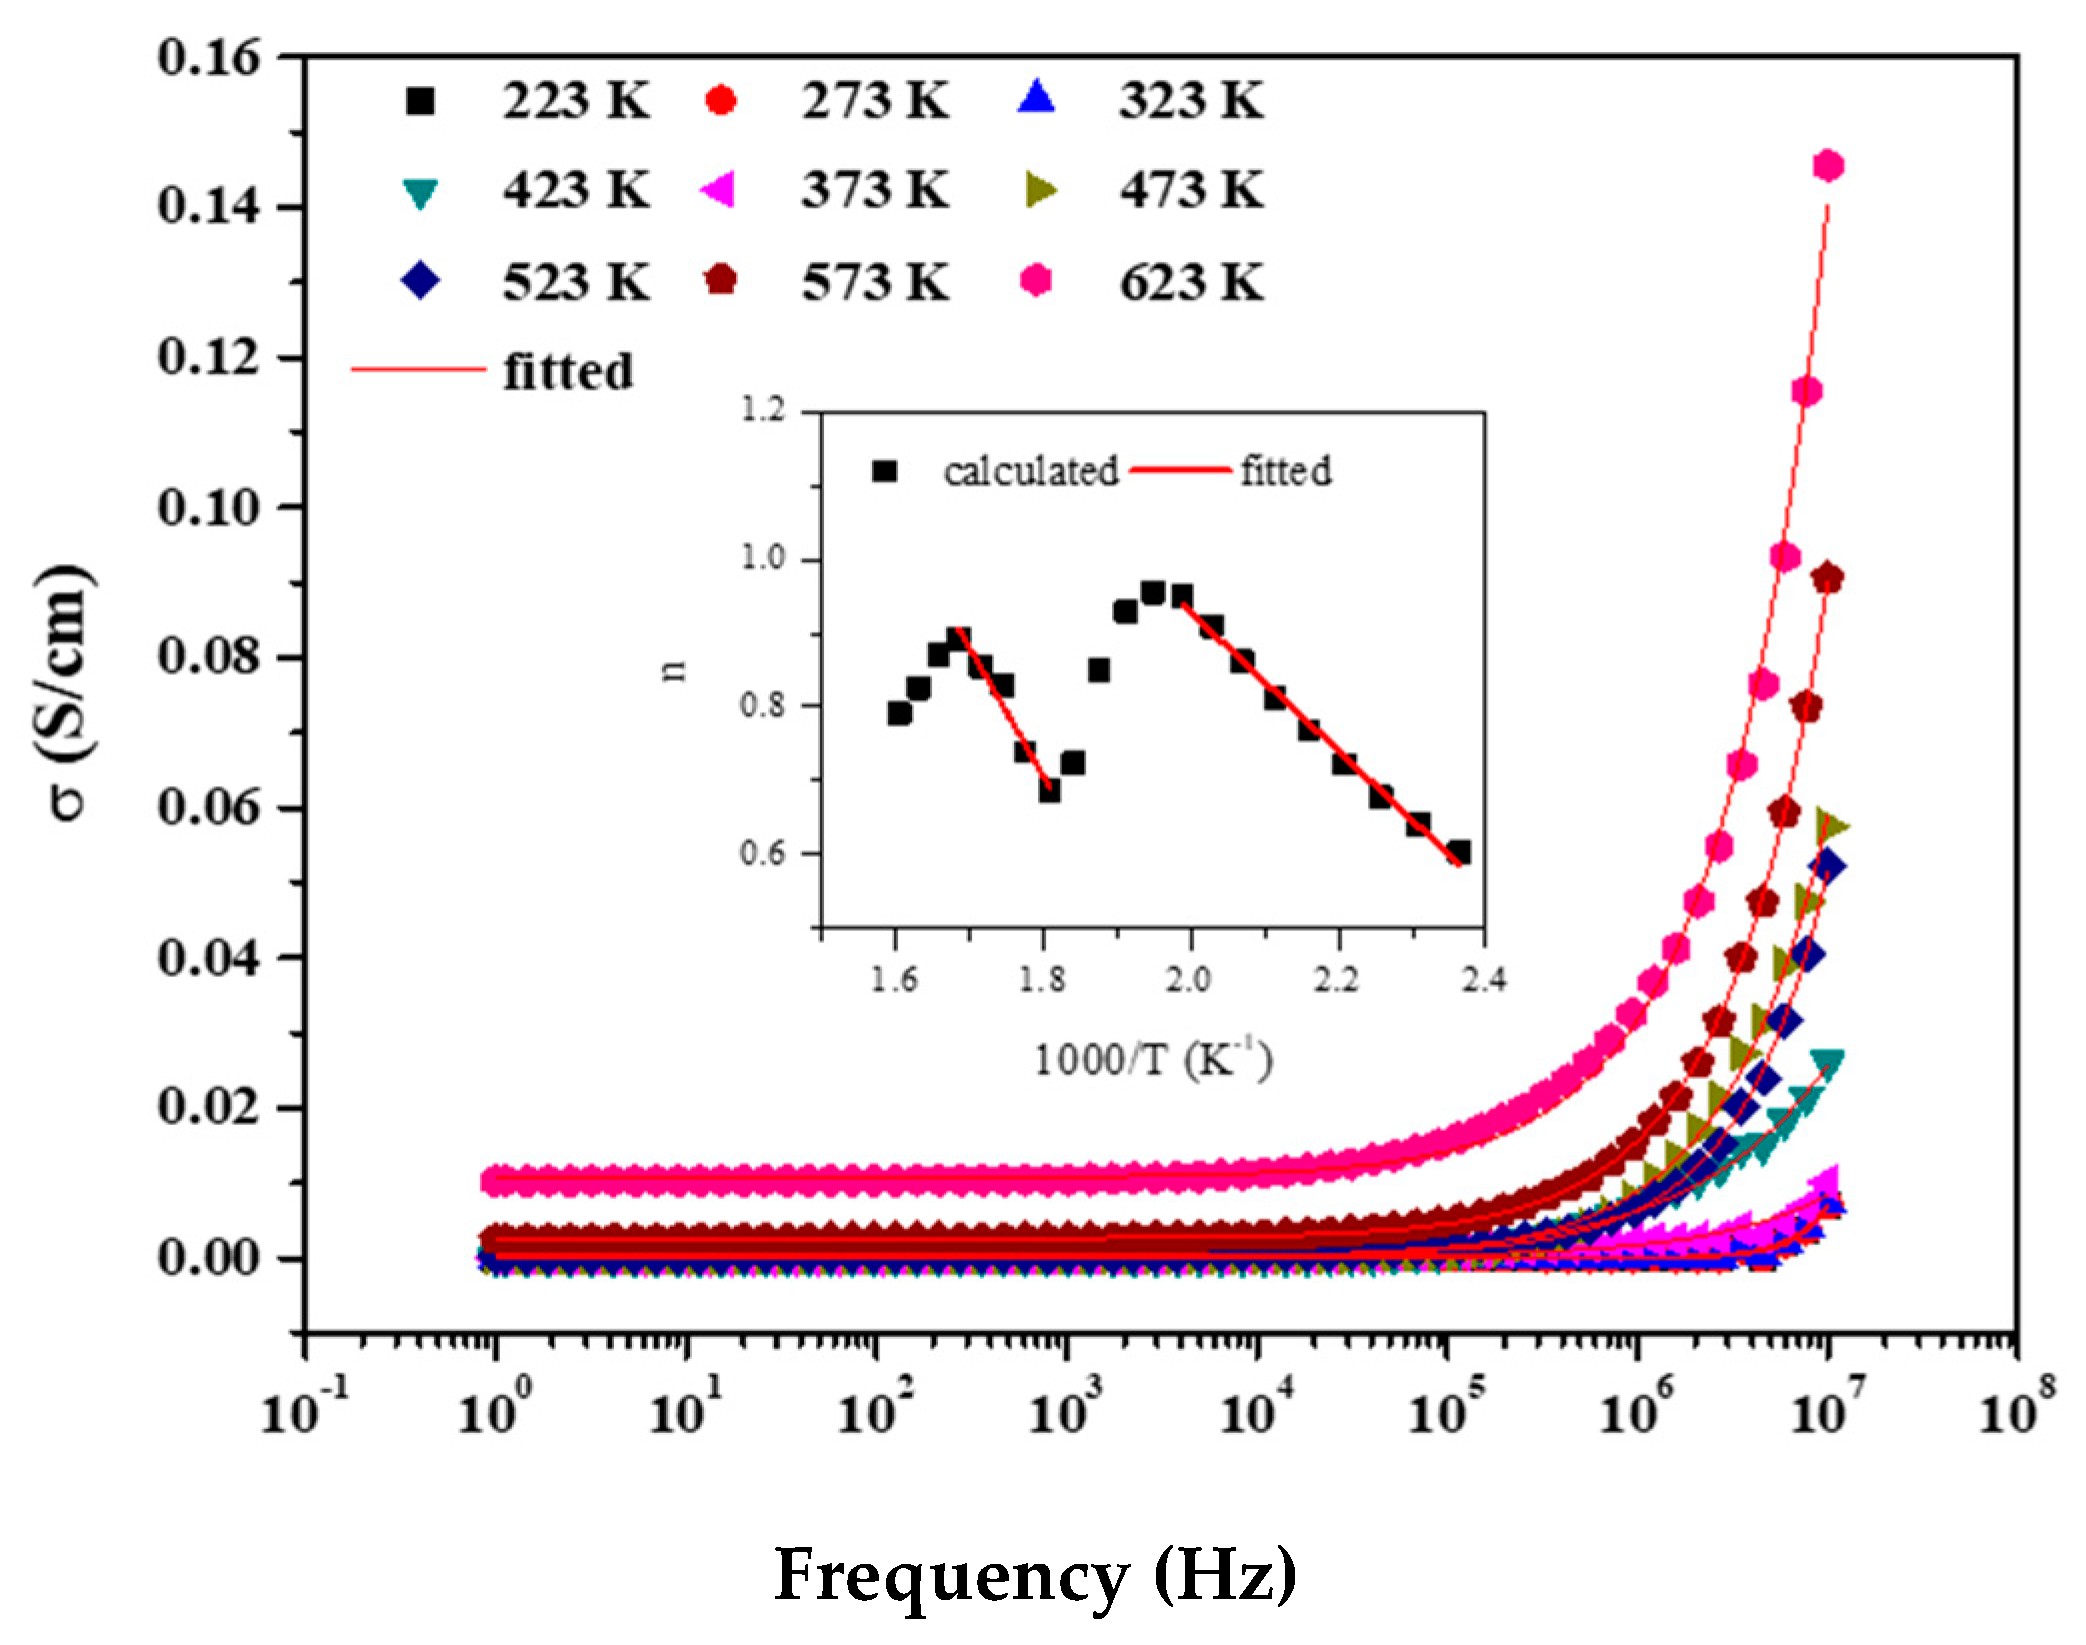
Conductivity of ferroelectric material is an important phenomenon to understand for its piezo and pyroelectric behavior as well as the conductivity which in turn depends upon the dielectric behavior of the sample. Further, there is a strong coupling between the temperature and frequency dependent behavior of the conductivity. The ac conductivity (σac) study signifies the presence of single or multiple relaxation in the material. In this case, the ac conductivity plot with respect to frequency at different temperatures (cf Figure 10) can be divided into a low frequency plateau governed by random hopping of electrons contributing to dc conductivity and a high frequency dispersive region dependent upon ωn (where ω is the angular frequency and n is a constant dependent upon frequency and temperature) and defines the type of conductivity [28] related to the hopping of electrons between trap levels situated in the bandgap [25].
Conductivity plots are fitted well with Joanscher’s power law, σac = σdc + Aωn [29]. In general, the term, Aωn, is defined by any of the following two mechanisms as dictated by the values of exponent n viz.: (i) Quantum mechanical tunneling (QMT) through barriers separately localized sites and (ii) Correlated Barrier Hopping (CBH) over the same barrier [30]. n has two different trends with respect to frequency and time. If n is T independent and decreases with ω then σac originates from QMT while n decreases with increasing T for CBH. Funke et al. reported for n ≤ 1 that hopping involves translational motion and for n > 1 there occurs localized hopping of charges without the charges leaving the neighborhood [31]. Hopping conduction is consistent with the fact that high density of states (DOS) in the material having a bandgap similar to that of a semiconductor, which can be understood as an increase in temperature of the delocalization of charge carrier support polaron formation and hopping occurs between neighboring sites [32].
The n values throughout the T range from 373 K onwards is observed to be < 1, implying that our results are correlating with the CBH model in the mentioned T range and the hopping involves translational motion with sudden jumps. The variation is shown in the plot. The significance of the plot further confirms the sum property of the conductive behavior due to which there are two slopes corresponding to the constituent phases of the composite. From the fitted parameter in the given temperature range, the height of the potential well can be calculated using the formula, n = 1 − 6kBT/Wm, where kB and T are the Boltzmann constant and absolute temperature respectively, and Wm is the depth of the potential well [33].
The non-dispersive dc conductivity with respect to 1000/T is plotted as shown in Figure 10 and could be fitted with a straight line of an Arrhenius type with two slopes very close by. The dc conductivity increases with T, which in turn implies the decrease in Rb, and thus the material exhibits a negative temperature coefficient of resistance (NTCR) similar to a semiconductor [34,35].
The presence of two multiferroic phases in this case is understood to be contributing to the total dielectric properties. In addition, the resistance of the composite particles is observed to be much higher than the typical value of resistance corresponding to individual multiferroic phases, which implies that the dielectric properties of the combined phases is enhanced. Two different mechanisms are understood to be involved in the relaxation of dielectric and impedance behavior of BiFeO3-Bi2Fe4O9-α-Fe2O3 composite particles (Cf. Table 2).
3. Materials and Methods
Laboratory grade starting oxides, Bi2O3 and Fe2O3, in the ratio of 1:3 are taken towards the formation of required composite in the Fe2O3 matrix. The oxides are taken for high energy ball milling using stainless steel balls of different sizes in isopropanol medium for efficient milling for 4 h with 30 min heating and subsequent cooling process. Prior to ball milling, only Fe2O3 was milled for 3 h to reduce its grain size as well as to improve the surface for reaction to form the required composite. The obtained milled powder was converted into pellets of 10 mm diameter and ~2 mm thickness using hydraulic press and sintered for 12 h at 1073 K and 10 h at 1123 K with intermittent grindings and further sintered at 1073 K for 24 h and will be henceforth referred to as ball milled and annealed (BMA) sample. The resulting mixture was powdered and characterized by means of XRD (Inel 2000 X-Ray Diffractometer with Cu kα source in Bragg-Brentano geometry) for phase analysis.
57Fe Mössbauer spectroscopy studies have been done in constant acceleration mode and in transmission geometry of the spectrometer (Wissel make) using 57Co dispersed in the Rh matrix for phase and magnetic analysis. Mossbauer studies have also been carried out in pure Bi2Fe4O9 in order to delineate the defect components associated with composite of BiFeO3 and Bi2Fe4O9. Dielectric studies have been carried out in a detailed manner on the composite sample using a high resolution Alpha Analyzer (Novocontrol GmbH make). Since the main component of the composite of the present study is Bi2Fe4O9 (which is the most stable oxide of bismuth and iron based oxides), structural and Mossbauer results on Bi2Fe4O9 prepared by the solid state reaction route are also discussed.
4. Conclusions
This work discusses in a detailed manner the results of complex impedance spectroscopic studies carried out in a composite of Bi2Fe4O9-BiFeO3 particles as separated by Fe2O3. Impedance spectroscopic results showing the occurrence of a single semicircle corresponding to that of the composite system consisting of Bi2Fe4O9-BiFeO3 might be occurring in core-shell configurations, which is consistent with TEM results. The dielectric properties of the composite system are understood in a detailed manner. Temperature dependence of dielectric properties of the composite has been observed to be superior as compared to a single system of either Bi2Fe4O9 or BiFeO3. The composite material exhibits a transition temperature around room temperature (≈300 to 500 K), which is much higher than the ferroelectric transition temperature of Bi2Fe4O9 and lower as compared to that of BiFeO3. This result provides the scope for its enhanced and superior applications in the electronic industry as compared to individual phases by discarding the issues related to cryogenic or the need of high temperatures for exhibiting multiferroicity behavior. Further, a much higher value of the dielectric constant with a low loss factor of the composite as compared to pure BiFeO3. In addition, this value of the giant dielectric constant is stable over a wide temperature and frequency ranges. This establishes that the composite could be extensively used as a high temperature capacitor (in the interval ≈ 300 to 500 K, wireless communications, and microwave and RF applications in electrical systems [36,37,38]. Electron hopping across Fe2+/Fe3+ and oxygen vacancies are deduced to be playing an important role in conduction mechanisms based on activation energy analysis of the complex impedance spectroscopy results.
Author Contributions
Conceptualization—R.G.; Methodology, Validation, Formal Analysis, Investigation, Writing-Original Draft Preparation, Writing-Review & Editing—R.G. and A.P.
Funding
This research received no external funding.
Acknowledgments
Authors are thankful to G. Amarendra, Director, MSG for his support and encouragement. Alaka acknowledges DAE for support of her fellowship. Also we thank P. Magudapathy for XRD measurements and broadband dielectric spectrometer central facility in IITB for dielectric measurements.
Conflicts of Interest
The authors declare no conflict of interest.
References
- Wang, J.; Neaton, J.; Zheng, H.; Nagarajan, V.; Ogale, S.; Liu, B.; Viehland, D.; Vaithyanathan, V.; Schlom, D.; Waghmare, U. Epitaxial BiFeO3 mutliferroic thinfim heterostructures. Science 2003, 299, 1719–1722. [Google Scholar] [CrossRef] [PubMed]
- Erenstein, W.; Mathur, N.; Scott, J. Multiferroic and magnetoelectric materials. Nature 2006, 442, 759–765. [Google Scholar] [CrossRef] [PubMed]
- Hill, N.A. Why are there so few magnetic ferroelectrics? J. Phys. Chem. B 2000, 104, 6694–6709. [Google Scholar] [CrossRef]
- Singh, K.; Negi, N.S.; Kotnala, R.K.; Singh, M. Dielectric and magnetic properties of (BiFeO3)1−x(PbTiO3)x ferromagnetoelectric system. Solid State Commun. 2008, 148, 18–21. [Google Scholar] [CrossRef]
- Uniyal, P.; Yadav, K.L. Synthesis and study of multiferroic properties of ZnFe2O4-BiFeO3 nanocomposites. J. Alloy. Compd. 2010, 492, 406–410. [Google Scholar] [CrossRef]
- Sahu, T.; Behera, B. Investigation on structural, dielectric and ferroelectric properties of samarium-substituted BiFeo3-PbTiO3 composites. Adv. Dielectr. 2017, 1, 1750001–1750006. [Google Scholar] [CrossRef]
- Bajpai, O.P.; Kamdi, J.B.; Selvakumar, M.; Ram, S.; Khastgir, D.; Chattopadhyay, S. Effect of surface modification of BiFeO3 on the dielectric, ferroelectric, magneto-dielectric properties of polyvinylacetate/BiFeO3 nanocomposites. Express Polym. Lett. 2014, 8, 669–681. [Google Scholar] [CrossRef]
- Adhlakha, N.; Yadav, K.L. Structural, magnetic, and optical properties of Ni0.75Zn0.25Fe2O4-BiFeO3 composites. J. Mater. Sci. 2014, 49, 4423–4438. [Google Scholar] [CrossRef]
- Ryu, J.; Priya, S.; Uchino, K.; Kim, H. Magnetoeelctric effect in composites of magnetostrictive and piezoelectric materials. J. Electroceram. 2002, 8, 107–119. [Google Scholar] [CrossRef]
- Rao, C.N.R.; Sundaresan, A.; Saha, R. Multiferroic and magnetoelectric oxides. J. Phys. Chem. Lett. 2012, 3, 2237–2246. [Google Scholar] [CrossRef]
- Varshney, D.; Kumar, A.; Verma, K. Effect of A site and B site doping on structure, thermal and dielectric properties of BiFeO3 ceramics. J. Alloy. Compd. 2011, 509, 8421–8426. [Google Scholar] [CrossRef]
- Pélaiz-Barranco, A.; Gutierrez-Amadon, M.P.; Huanosta, A.; Valenzuela, R. Phase transition in ferromagnetic and ferroelectric ceramics by ac measurement. Appl. Phys. Lett. 1998, 73, 2039–2041. [Google Scholar] [CrossRef]
- ELmezayyen, A.S.; Reicha, F.M. Preparation of Chitosan Copper Complexes: Molecular Dynamic Studies of Chitosan Copper Complexes. Open J. Appl. Sci. 2015, 5, 415–421. [Google Scholar] [CrossRef]
- Arrhenius, S. Über die Reaktionsgeschwindigkeit bei der Inversion von Rohrzucker durch Säuren. Z. Phys. Chem. 1889, 4, 226–248. [Google Scholar] [CrossRef]
- Gheorghiu, F.; Calugaru, M.; Ianculescu, A.; Mustcate, V.; Mitoseriu, L. Preparation and functional characterization of BiFeO3 ceramics: A comparative study of the dielectric properties. Solid State Sci. 2013, 23, 79–87. [Google Scholar] [CrossRef]
- PŁcharski, J.; Weiczorek, W. PEO based composite solid electrolyte containing nasicon. Solid State Ion. 1988, 28–30, 979–982. [Google Scholar] [CrossRef]
- Singh, H.; Kumar, A.; Yadav, K.L. Structural, dielectric, magnetic, magnetodielectric and impedance spectroscopic studies of BiFeO3-BaTiO3 ceramics. Mater. Sci. Eng. B 2011, 176, 540–547. [Google Scholar] [CrossRef]
- Satpathy, S.; Mohanty, N.; Behera, A.; Behera, B. Dielectric and electrical properties of 0.5(BiGd0.05Fe0.95O3)-0.5 (PbZrO3) composite. Mater. Sci. 2014, 32, 59–65. [Google Scholar] [CrossRef]
- Victor, P.; Bhattacharrya, S.; Krupanidhi, S.B. Dielctric relaxation in laser ablated polycrystalline ZrTiO4 thin films. J. Appl. Phys. 2003, 94, 5135–5142. [Google Scholar] [CrossRef]
- Kolte, J.; Daryapurkar, A.S.; Gulwade, D.D.; Gopalan, P. Microwave sintered Bi0.90La0.10Fe0.95Mn0.05O3 nanocrstal ceramics: Impedance and modulus spectroscopy. Ceram Int. 2016, 42, 12914–12921. [Google Scholar] [CrossRef]
- Pradhan, D.K.; Choudhary, R.N.P.; Samantaray, B.K. Studies of structural, thermal and electrical behavior of polymer nanocomposite electrolytes. Express Polym. Lett. 2008, 2, 630–638. [Google Scholar] [CrossRef]
- Yakuphanoglu, F.; Senkal, B.F. Electronic and thermoelectric properties of polyaniline organic semiconductor and electrical characterization of Al/PANI MIS diode. J. Phys. Chem. C 2007, 111, 1840–1846. [Google Scholar] [CrossRef]
- Angell, C.A. Dynamic processes in ionic glasses. Chem. Rev. 1990, 90, 523–542. [Google Scholar] [CrossRef]
- Pribosic, I.; Makovec, D.; Drofenic, M. Electrical properties of donor and acceptor doped BaBi4Ti4O15. Eur. Ceram. Soc. 2001, 21, 1327–1331. [Google Scholar] [CrossRef]
- Anand, K.; Ramamurthy, B.; Veeraiah, V.; Vijaya Babu, K. Effect of Magnesium substitution on structural and dielectric properties of LiNiPO4. Mater. Sci. 2017, 35, 66–80. [Google Scholar] [CrossRef]
- Dutta, A.; Sinha, T.P.; Jena, P.; Adak, S. AC conductivity and dielectric relaxation in ionically conducting sodalime-silicate glasses. J. Non-Cryst. Solids 2008, 354, 3952–3957. [Google Scholar] [CrossRef]
- Baral, A.; Meher, K.R.S.P.; Varma, K.B.R. Dielectric behavior of Sr2SBMnO6 ceramics fabricated from nanocrystalline powders prepared by molten salt synthesis. Mater. Sci. Bull. 2011, 34, 53–60. [Google Scholar] [CrossRef]
- Mohapatra, S.R.; Sahu, B.; Badapanda, T.; Pattanaik, M.S.; Kaushik, S.D.; Singh, A.K. Optical, dielectric relaxation and conductivity study of Bi2Fe4O9 ceramic. J. Mater. Sci. Mater. Electron. 2016, 27, 3645–3652. [Google Scholar] [CrossRef]
- Mariyappan, C.R.; Govindaraj, G.; Ramya, L.; Hariharan, S. Synthesis, Characterizationand electrical conductivity studies on A3Bi2P3O12 (A-Na.K) materials. Mater. Res. Bull. 2005, 40, 610–618. [Google Scholar] [CrossRef]
- Joanscher, A.K. A new understanding of the dielectric relaxation of solids. J. Mater. Sci. 1981, 16, 2037–2060. [Google Scholar] [CrossRef]
- Behera, A.K.; Mohanty, N.K.; Satpathy, S.K.; Behera, B.; Nayak, P. Effect of rare earth doping in impedance modulus and conductivity properties of multiferroic composites: 0.5 BiLaxFe1−xO3−0.5 PbTiO3. Acta Metall. Sin. 2015, 28, 841–857. [Google Scholar] [CrossRef]
- Funke, K. Jump Relaxation in Solid Electrolytes. Prog. Solid State Chem. 1993, 22, 111–195. [Google Scholar] [CrossRef]
- Behera, B.; Nayak, P.; Choudhary, R.N.P. Impedance spectroscopy study of NaBa2V5O15 ceramic. J. Alloy. Compd. 2007, 436, 226–232. [Google Scholar] [CrossRef]
- Dridi, R.; Saafi, I.; Mhandi, A.; Matri, A.; Yumak, A.; Lakhdar, M.H.; Amlouk, A.; Boubaker, K.; Amlouk, M. Structural, optical and AC conductivity studies on alloy ZnO-Zn2SnO4(ZnO-ZTO) thin films. J. Alloy. Compd. 2015, 634, 179. [Google Scholar] [CrossRef]
- Ranjan, R.; Kumar, P.; Kumar, N.; Behera, B.; Choudhary, R.N.P. Impedance and electrical modulus analysis of Sm modified Pb(Zr0.55Ti0.45)1−x/4O4 ceramics. J. Alloy. Compd. 2011, 509, 6388–6394. [Google Scholar] [CrossRef]
- Jia, W.; Hou, Y.; Zheng, M.; Xu, Y.; Zhu, M.; Yang, K.; Cheng, H.; Sun, S.; Xing, J. Advances in lead free high-temperature dielectric materials for ceramic capacitor application. JET Nanodielectr. 2018, 1, 3–16. [Google Scholar] [CrossRef]
- Lanbing, F.; Danping, S.; Yanming, H.; Laijung, L. Low dielectric loss and good thermal stability of Eu and Ti codoped K0.5Na0.5NbO3 ceramics. J. Mater. Sci. Mater. Electron. 2015, 26, 7159–7164. [Google Scholar] [CrossRef]
- Sebastian, M.T.; Ubic, R.; Jantunen, H. Low loss dielectric ceramic material and their properties. Int. Mater. Rev. 2015, 60, 392–412. [Google Scholar] [CrossRef]
Figure 1.
XRD patterns corresponding to (a) ball milled, (b) ball milled and annealed ball milled and annealed (BMA) sample with broadened peaks indicative of composite structure as compared to (c) Bi2Fe4O9 prepared through solid state reaction. Also shown are the stick patterns corresponding to α-Bi2O3 and α-Fe2O3.

Figure 2.
Transmission electron micrograph showing the presence of core-shell particles.

Figure 3.
Mössbauer spectra corresponding to (a) ball milled mixture of Bi2O3 and Fe2O3, (b) BMA, and (c) Bi2Fe4O9 sample.
Figure 3.
Mössbauer spectra corresponding to (a) ball milled mixture of Bi2O3 and Fe2O3, (b) BMA, and (c) Bi2Fe4O9 sample.

Figure 4.
Temperature dependence of (a) dielectric permittivity. Corresponding variations marked inside rectangular panels are magnified and shown in insets as (i) and (ii), respectively. (b) shows the core-shell structured particle having dielectric constants, εC and εs, for the core and shell, respectively. While (c) shows the variation of ln(τ∙tan δ) with 1000/T.

Figure 5.
(a) and (b) show the frequency dependence of the real (top) and imaginary (bottom) part of the impedance, respectively. Shown in the insets are magnification of rectangular panels showing the variation of Z’ and Z’’ with frequency. While (c) shows Arrhenius fitting of the peak frequency of the variation of Z’’.


Figure 6.
Cole-Cole plot of the composite (inset zoomed in region shown in box).

Figure 7.
Variation of real and imaginary part of the electric modulus (top left and right) with frequency at different temperatures.
Figure 7.
Variation of real and imaginary part of the electric modulus (top left and right) with frequency at different temperatures.

Figure 8.
(a) shows the variation of ln(τ(M’’)) with 1000/T argand plot of M’’ vs. M’ is shown in (b).
Figure 8.
(a) shows the variation of ln(τ(M’’)) with 1000/T argand plot of M’’ vs. M’ is shown in (b).

Figure 9.
Variations of Z’’ and M’’ normalized with respect to their maximum values with the frequency at different temperatures are shown.
Figure 9.
Variations of Z’’ and M’’ normalized with respect to their maximum values with the frequency at different temperatures are shown.

Figure 10.
Conductivity fitted plots (inset shows the variation of n with respect to 1000/T (K−1).


Table 1.
Hyperfine parameters obtained through Mössbauer spectroscopy of samples subjected to different annealing treatments.
Table 1.
Hyperfine parameters obtained through Mössbauer spectroscopy of samples subjected to different annealing treatments.
| Sample Details | i | Γi mm/sec | δi mm/sec | Δi mm/sec | Bhf Tesla | fi |
|---|---|---|---|---|---|---|
| BM-α-Fe2O3-Bi2O3 | 1a | 0.48 | 0.38 | -0.21 | 51.8 | 0.75 |
| 1b | 0.45 | 0.36 | -0.15 | 50.3 | 0.18 | |
| 1c | 0.18 | 0.33 | -0.14 | 53.4 | 0.04 | |
| 2a | 0.22 | 0.30 | 0.38 | 40.4 | 0.03 | |
| BMA | 1a | 0.22 | 0.34 | -0.18 | 51 | 0.34 |
| 1b | 0.26 | 0.33 | -0.15 | 52 | 0.12 | |
| 2d | 0.28 | 0.48 | 0.24 | 47.3 | 0.06 | |
| 2b | 0.26 | 0.44 | 1.09 | 46 | 0.05 | |
| 2c | 0.24 | 0.50 | 0.23 | 35.5 | 0.07 | |
| 3a | 0.25 | 0.24 | 0.82 | 0 | 0.14 | |
| 3b | 0.3 | 0.38 | 0.53 | 0 | 0.22 | |
| Bi2Fe4O9 (SSR) | 3a | 0.32 | 0.29 | 0.86 | 0 | 0.51 |
| 3b | 0.32 | 0.39 | 0.33 | 0 | 0.49 |
Table 2.
Arrhenius fitting of tangent loss and impedance for the ball milled and annealed (BMA) sample with two peaks corresponding to two peaks in M’’ (upper inset) for Bi2Fe4O9 prepared through solid state route (SSR) corresponding to one peak.
Table 2.
Arrhenius fitting of tangent loss and impedance for the ball milled and annealed (BMA) sample with two peaks corresponding to two peaks in M’’ (upper inset) for Bi2Fe4O9 prepared through solid state route (SSR) corresponding to one peak.
| Plot | Sample | Ea (eV) | τ0 (s) | Possible Mechanism Involved |
|---|---|---|---|---|
| Tan δ vs. f | BM 3 step | 0.6 | 2.853 × 10⁻¹³ | Fe2+/Fe3+ electron hopping |
| Z” vs. f | BM 3 step | 1.5 | 1.28 × 10⁻¹⁶ | Grain boundary barrier |
| M” vs. f | BM 3 step low f peak | 1.13 | 2.97 × 10⁻¹⁵ | Grain boundary barrier |
| M” vs. f | BM 3 step high f peak | 1.01 | 8.77 × 10⁻¹⁵ | Oxygen vacancies |
| M” vs. f | Bi2Fe4O9 SSR | 0.6 | 7.02 × 10⁻¹⁴ | Fe2+/Fe3+ electron hopping |
© 2018 by the authors. Licensee MDPI, Basel, Switzerland. This article is an open access article distributed under the terms and conditions of the Creative Commons Attribution (CC BY) license (http://creativecommons.org/licenses/by/4.0/).
Share and Cite
MDPI and ACS Style
Alaka, P.; Govindaraj, R. Complex Dielectric and Impedance Spectroscopic Studies in a Multiferroic Composite of Bi2Fe4O9-BiFeO3. Condens. Matter 2018, 3, 44. https://doi.org/10.3390/condmat3040044
AMA Style
Alaka P, Govindaraj R. Complex Dielectric and Impedance Spectroscopic Studies in a Multiferroic Composite of Bi2Fe4O9-BiFeO3. Condensed Matter. 2018; 3(4):44. https://doi.org/10.3390/condmat3040044
Chicago/Turabian StyleAlaka, Panda, and Ramanujan Govindaraj. 2018. "Complex Dielectric and Impedance Spectroscopic Studies in a Multiferroic Composite of Bi2Fe4O9-BiFeO3" Condensed Matter 3, no. 4: 44. https://doi.org/10.3390/condmat3040044