Article

Longitudinal Tension and Mechanical Stability of a Pressurized Straw Tube

Joint Institute for Nuclear Research, 141980 Dubna, Russia
*
Author to whom correspondence should be addressed.
Instruments 2018, 2(4), 27; https://doi.org/10.3390/instruments2040027
Submission received: 23 October 2018 / Revised: 20 November 2018 / Accepted: 21 November 2018 / Published: 22 November 2018

Abstract

:
For the development of charged particle detectors based on straw tubes operating in vacuum, a special measurement technique is required for the evaluation of their mechanical properties. A summary of the known equations that govern straw behavior under internal pressure is provided, and a new experimental method of a strained pressurized straw tube study is presented in this paper. The Poisson’s ratio of the straw wall, which defines the stability conditions of a built-in tube, was measured for the NA62 spectrometer straw, and its minimum pre-tension was estimated.

1. Introduction

During the past few decades, a series of experiments in high-energy physics have been designed to investigate very rare decay modes of kaon (see, for example, [1,2]). In particular, the purpose of NA62 experiment at CERN SPS [1] is to measure K + π + ν ν ¯ decay branching ratio of the order of 10 10 with an uncertainty of 10%. It will be a test of the Standard Model and a probe to possible new physics. This is a challenging task, requiring an unprecedented precision of π + momentum measurement to reject the dominating background using the evaluation of event missing mass. This require a precise measurement of the momentum and position of the charged particle.
Another example of a physical problem that requires very accurate tracking of charged particles is Mu2e experiment, which will measure the conversion of a negative muon into an electron in the field of a nucleus [3].
A minimal material budget requirement in such experiments stimulates the development of gaseous particle detectors based on straw tubes containing gas under atmospheric pressure and operating in vacuum. These tubes maintain an internal overpressure of 1 atm, but higher overpressure may be desirable for a slower drift of electrons in the gas.
If pressurized straw tubes are close-packed and glued together to planar multi-layers, they form a stable structure. This approach is implemented, for example, for PANDA experiment trackers [4,5]. However, a very small material budget can lead to a detector design with separate straws [1,2,3]. In this case, the problem of lateral stability of straws is important, and the minimum required tension applied to the straw should be evaluated. In particular, straws in the NA62 spectrometer are separated in space and strained [1]. They are fixed in one lateral direction by means of thin wires and light spacers.
From the mechanics of a column, it is known that, if a compressive axial load is applied to a clamped thin-walled tube without overpressure, the load critical value F c r i t for buckling is [6,7]
F c r i t = 4 π 2 E J / L 2 .
where L is the straw length, and h is the thickness of the tube wall. Further, E is the Young’s modulus and J = y 2 d x d y = π R 3 h is a second moment of the cross-section of the tube wall (R is the straw radius). E J is known as the object flexural rigidity. For an NA62 straw tube, F c r i t 0.5 N , which is a small value.
It should be considered that a large straw deviation may appear when this limit is approached [7]. A shift of a few millimeters of the tube axis with respect to the anode wire may cause an electric discharge and detector malfunction. Only axial tension guarantees the buckling prevention for a long straw tube, and it has been demonstrated earlier [7,8] that an internal overpressure changes this necessary minimum tension.
Moreover, pre-tension is required to maintain the curvature caused by gravity to be small for a straw placed horizontally. For the given straw geometry and overpressure, the only parameter for the curvature control is the preliminary stretching force applied to the straw.
Therefore, estimation of the minimum pre-tension of the straw is necessary for any design of a straw tracker based on separated straws operating in vacuum. However, the calculations based on the published material properties of the straw wall are not sufficiently precise, because these properties depend on the batch of material. Therefore, an experimental procedure for the evaluation of material properties of a straw under operating conditions may be very useful.
The main purpose of this article is to present a new experimental method to estimate the minimum preliminary stretching force required to prevent the pressurized straw buckling and to limit its gravitational curvature. The equations used, which determine the behavior of straw under internal pressure, are given in the Appendix A.

2. Poisson’s Ratio Measurement

It can be observed from Equation (A7) that the straw buckling limit for a given overpressure is defined by the tube radius R and the axial Poisson’s ratio μ . The Poisson’s ratio is typically not provided in the PET film specifications. The published independent measurements of μ are not related to the specific batch of material used in the straw tubes production for the given detector. Moreover, the straw production process may change some foil properties. Therefore, a μ measurement procedure applicable to a welded straw is required to evaluate the minimum straw pre-tension for the specific detector design.

2.1. Straw Specimens

Two straw specimens were tested (see Table 1). The tubes were made of PET Hostaphan® foils using longitudinal welding [9]. The parameters of the foils can be found in the manufacturer specifications [10].
The first specimen (9.8-mm straw) was obtained from a party of approximately 7000 straws produced at the Joint Institute for Nuclear Research (Dubna) for NA62 spectrometer [9]. This 9.8-mm straw was coated inside the tube with two thin metal layers ( 0.05 μ m of Cu and 0.02 μ m of Au) to provide electrical conductivity on the cathode and to improve the impermeability of the straw tube. The wall material volume density [10] was used to estimate the linear density of the 9.8-mm straw. The contributions of metal layers and the air mass inside the tube to linear density were negligible.
The second specimen (18-mm straw) was made of a thicker Hostaphan® film. In this case, the linear density of the tube was measured by weighing, since the wall thickness was not strictly defined in the manufacturer specifications.

2.2. Test Bench for Studies of a Strained Straw under Pressure

A special test bench (see Figure 1) was manufactured to study the properties of a built-in straw with an initial pre-tension and an inner overpressure applied subsequently. The longitudinal force applied to the straw end T P = T P π R 2 was measured using a tensometer T m based on a single-point aluminum load cell (Tedea-Huntleigh, model 1022) [11].
A straw specimen was closed on the tensometer side by the end plug e 1 with the end cap C using glue TRA-BOND 2115 [12] for rigid sealing. A longitudinal straw seam was located on a side to reproduce the conditions of the NA62 spectrometer for horizontal straws. The seam can change the measured values, but the violation of axial symmetry was considered insignificant when long straw is strained. The end cap C was connected to the tensometer T m using two flexible joints and a rigid rod. The other straw end contained a plug e 2 with a gas supply channel. This straw end was glued into the solid support, which may be moved along the rigid basement B and fixed at a specific place to create a preliminary straw tension prior to the test. Subsequently, the pressure supply was opened, and the changing pressure values P were recorded together with the corresponding results of the tensometer measurement T P (see points in Figure 2 and Figure 3A).
Straw oscillations were studied using the optical coupler O [9], which emits constant intensity infrared radiation and registers the radiation reflected from the straw wall. When the straw oscillations were mechanically excited, the registered radiation intensity was modulated by the changing distance to the straw wall. The obtained signal was amplified and sent to the oscilloscope with a fast Fourier transform function. The lowest frequency peak position was registered as the lowest frequency of the straw (points in Figure 3B).
The end cap C was slightly shifted down owing to its weight of 10–20 gf. However, for the horizontal force T P > 300 gf (assuming the cap weight of 25 gf), the vertical shift of the cup was less than 4 mm. It led to the relative elongation of 2-m straw of 10 4 , which is much less than the minimum straw elongation caused by the tested preliminary tension ( 10 3 ). Thus, the straw ends could be considered to be fixed during the test.

2.3. Effective Tension and Poisson’s Ratio Measurement

It is known that any material becomes nonlinear for a large stress, whereas the linear properties of the material are defined for zero-stress limit. However, on the built test bench, precision measurement becomes problematic for a low effective tension T P . Therefore, we must consider the possible nonlinearity in such a way that the resulting μ could be easily extracted for T 0 .
Accordingly, we postulated a weak linear dependence of Poisson’s ratio as a function of axial stress. For the fits of our experimental results, we used the tension-dependent value
ν = μ k T 2 π R h
instead of only μ . Apart from the material nonlinearity, the coefficient k also absorbs the effect of the set-up deformation under tension and the next-order effects ignored in the formulae. Equation (2) provides a physically motivated interpolation and extrapolation of the measurement results, whereas to compare the resulting Poisson’s ratio with the other measurements, we could consider the measured μ and ignore the stress-dependent term.
T and R variables in Equation (2) depend on the Poisson’s ratio value. Therefore, we implemented an iterative procedure starting with a tension T = T 0 , nominal straw radius R = R 0 , and the starting Poisson’s ratio value of ν = μ . In each iteration, new T , ν , R values were calculated, and three iterations were sufficient for the precise calculation.
Two free parameters ( μ and k) describe the measured tensions and pressures satisfactorily. Figure 2 and Figure 3A show the measured effective tensions for the NA62 straw along with the result of their fit with the formula
T P = T 0 ( 1 2 ν ) P π R 2 .
The units of technical atmosphere a t were used for the overpressure values P. The MINUIT [13] package and ROOT [14] interface were used to obtain the resulting parameter values and their fit errors.
The fit to all the measured T P values for the given straw was performed with a common set of free parameters and the same assumed measurement error. The error ( ± 3.6 gf for the 9.8-mm straw and ± 20.47 gf for the 18-mm straw) was defined in such a way that the resulting χ 2 / n d f = 1 , to estimate the parameter statistical uncertainties.
The fit results and systematic uncertainty contributions are shown in Table 2. For the second specimen, the uncertainty of the nonlinearity coefficient k was so large that its measured value was consistent with both zero and the result for the first sample.
The radius correction (Equation (A12)) was considered, but its effect was also completely included in the systematic errors as a “radius correction” contribution. The Gaussian width of the NA62 straw diameter distribution was approximately 0.03 mm, and the systematic shift of its central value from the nominal number was the same size [9]. Thus, considering a conservative value of the radius systematic uncertainty of 0.05 mm for the tested specimens, we obtained the “radius value” contribution to the systematic error shown in Table 2. Moreover, the effects of scale change by the factor of 1.05 for both the measured effective tension T P and measured overpressure P were considered as independent contributions (“ T P scale” and “P scale”) to the systematic errors.
Considering the manufacturer’s information about Young’s moduli (see Table 1), the μ central values shown in Table 2 were extracted as μ = μ E E . Their uncertainties depend on the error of the modules ratio, which may be approximately estimated from the significant digits of the provided values as δ E E 0.1 .
Typically, the reported Poisson’s ratio values for the oriented PET films are 0.37–0.44 [15], and thus, the obtained μ values are consistent with them, given the uncertainties of our measurements. However, the resulting μ was approximately 0.3 , which may be a specific property of Hostaphan® foil or the consequence of the production of straw tube using longitudinal welding [9].

3. Oscillation Frequency Measurements

The oscillation frequency measurement was the last test of the straw tensions performed on the assembled NA62 spectrometer modules [9]. The same test was repeated on the present test bench for a qualitative verification of the pressure effect.
The length of the tube on the test bench was defined by the position of the movable support and the end cup C position. Unfortunately, when a straw tension was applied to the end cup fixed on the short rod with flexible joints, an effective oscillator was formed with a frequency close to the measured frequency of straw. Therefore, using this test bench, only a qualitative understanding of straw oscillations could be obtained using the simple frequency Equation (A11).
The results of the lowest frequency measurements are shown in Figure 3B along with the corresponding calculation results based on Equation (A11). The error bars show the frequency uncertainty of 1 Hz defined by the width of the observed spectrum peaks.
The prediction using Equation (A11) of the 9.8-mm straw satisfactorily described the measurement results in the vicinity of NA62 design parameters ( T 0 = 1500 gf, P = 1 at). However, the overall discrepancy reached 2 Hz, which is more than the measurement precision. Nevertheless, the obtained qualitative description of the straw vibration confirms that the lowest frequency of the straw was significantly diminished by the internal overpressure despite the increase in straw wall stress according to Equation (A5).

4. Minimum Straw Pre-Tension Evaluation

We could use the obtained Poisson’s ratio to evaluate the minimum straw pre-tension T 0 in the straw-based NA62 spectrometer operating in vacuum [9].
There are two requirements for T 0 . The buckling limit T P > 0 (where T P is calculated from Equation (3) for P = 1 at) is defined by the Poisson’s ratio and the straw radius. The flexural rigidity contribution (Equation (1)) to the buckling prevention is small for the long NA62 straw and may be included into the safety margin. Moreover, the experimental design requirements define the gravitational deviation (sagitta) limit for a horizontal straw. Sagitta S a g = y s ( 0 ) calculated from Equation (A9) depends on the effective tension, flexural rigidity, and straw length.
The sagitta requirement S a g < 100 μ m of NA62 [9] could not be satisfied using a reasonable pre-tension for the complete 2.1-m straw. Hence, special supporting spacers dividing each straw into three equal parts were implemented in the NA62 spectrometer [9]. These spacers fixed the straw only in one of the lateral directions, and thus, they did not change the small buckling critical load value (Equation (1)) ignored in this study.
Straw symmetry near each spacer ensured that the boundary conditions of Equation (A9) are satisfied. Hence, we used this solution with L = 0.7 m in order to calculate the sagitta.
The results of the sagitta calculation and buckling limit estimations are shown in Figure 4A for the 9.8-mm straw in the NA62 spectrometer. The corresponding results for the 18-mm straw, assuming the same straw length of 70 cm, are shown in Figure 4B for comparison.
Apart from the most probable sagitta values and buckling limits, the worst cases are also shown in Figure 4. The worst case for each straw corresponds to ν (Equation (2)) central value diminished by the tripled total uncertainty evaluated for each T 0 from the measured μ and k considering their correlation. All other parameters for this worst-case scenario were considered at their uncertainty limits leading to the largest sagitta and the easiest buckling.
Figure 4 shows that, for the NA62 spectrometer, a straw pre-tension value above 900 gf guarantees S a g < 100 μ m (NA62 requirement), whereas the worst case of the buckling limit is below 400 gf. Thus, both the NA62 nominal straw pre-tension of 1.5 kgf and the factual minimum pre-tension ( 1.2 kgf) [9] have a good safety margin.
However, if the 18-mm straw were used in the same detector design, the minimum T 0 would be defined by the increased buckling limit above 1.15 kgf with a small safety margin, whereas the gravitational sagitta would always be below 100 μ m for the pre-tension above the buckling limit.

5. Conclusions

A new technique for the study of mechanical properties of straw tubes subjected to inner pressure and longitudinal tension was tested using a specially built test bench. It included the measurement of Poisson’s ratio of a straw wall, which defines the buckling limit of a straw with a given radius under a definite inner overpressure.
The axial Poisson’s ratio μ for Hostaphan® foil was measured for two specimens under the conditions close to those of a detector operating in vacuum. The lateral Poisson’s ratio μ was evaluated using the elasticity moduli in two directions provided by the foil producer. The spectra measurements of straw oscillations qualitatively confirm the effective tension predictions based on the measured μ .
The minimum pre-tension requirement for the NA62 spectrometer was re-evaluated based on the measurement results. The obtained limit confirms the detector design pre-tension with a safety margin of approximately 600 gf. The tested technique can be used for the development of future straw trackers.

Funding

This research received no external funding.

Conflicts of Interest

The authors declare no conflict of interest.

Appendix A. Mechanics of a Pressurized Straw Tube

The pressurized tube problem is not new in the industry, but it is not well-known in high-energy physics instrumentation. Therefore, we provide a summary of the known equations driving the behavior of straw tubes under internal pressure.
Only two stress directions are essential for the problem of a strained straw under internal pressure: the axial direction along the straw axis (‖) and the circumferential direction (⊥) tangent to the cylindrical surface of the straw in the plane normal to the axis. For a thin-walled tube ( h R ), it can be demonstrated that straw circumferential (hoop) stress caused by the inner overpressure P is always σ = P R h [16]. The axial stress σ depends on the conditions at the straw ends.

Appendix A.1. Pressurized Tube with Free Closed Ends

We begin with the simple formulae derived in the isotropy approximation, when the material properties do not depend on the considered direction. If the internal pressure acts not only on the cylindrical shell of the tube but also on the free ends closed by airtight end plugs, a simple relation can be derived between the hoop stress σ and the free closed tube axial stress σ f r e e = P π R 2 2 π R h = P R 2 h = σ / 2 (see [16] for cylindrical pressure vessel).
Hoop stress leads to the transverse strain of the material of the straw wall defining the direct contribution to the relative radius increasing ϵ d = σ / E = P R E h . For the typical straw tube, ϵ d 1 ; thus, this value may be used as a small parameter to determine the order of the considered contribution to a strain. The direct contribution to the axial relative elongation ϵ = Δ L L for the free closed tube has the same first order: ϵ d = σ f r e e / E = P R 2 E h .
The Poisson effect leads to the shortening of the straw wall in the direction perpendicular to the corresponding direct strain. The Poisson ratio μ is defined as the ratio of the perpendicular relative shortening to the corresponding direct relative elongation. Thus, we have the first approximation for a free closed tube.
Δ L L = ϵ = ϵ d μ ϵ d = P R 2 h E ( 1 2 μ )
Δ R R = ϵ = ϵ d μ ϵ d = P R 2 h E ( 2 μ ) .
In [17], Equation (A1) has been observed to be sufficiently precise to the best of our knowledge of the material properties. The hoop strain Equation (A2) has been derived for the pressure vessel in [18].
In an experimental set-up employing straws in vacuum, straw ends are usually built into the rigid frame (built-in tube) [9]. For this case, the Equations (A1) and (A2) in general are incorrect, since the pressure force applied to the built-in end is balanced by the rigid frame rather than by the axial tension of the wall.
However, there is a special case wherein a built-in tube and a free closed tube are equivalent. Further, it can be used to obtain the simplest estimation of the minimum preliminary tension required to prevent straw buckling in vacuum [19]. If a free closed pressurized straw is glued into a rigid frame that exactly fits the straw length enlarged by the overpressure in Equation (A1), the frame does not apply any axial load to the built-in straw. If the frame requires a longer straw, an overall axial tension is applied to the straw ends ensuring the stability of the tube against buckling. Furthermore, no change occurs in the state of the straw wall if we connect the inner straw volume with the gas supply mounted in the frame.
Therefore, to prevent buckling, we require a minimum straw pre-tension ensuring the elongation in Equation (A1) prior to the vacuum creation around the tube. The stress caused by straw preliminary tension T 0 m i n should be at least T 0 m i n 2 π R h = E ϵ = P R 2 h ( 1 2 μ ) , and the minimum pre-tension for buckling prevention is
T 0 m i n = P π R 2 ( 1 2 μ ) .

Appendix A.2. Pressurized Tube with Built-In Ends

We assume different material properties in the axial and circumferential directions (orthotropic approximation), which is quite usual for a straw wall material. For example, NA62 straws are made of Hostaphan® polyethylene terephthalate (PET) film. The film manufacturer reports the different values of transverse (transverse direction, TD) and longitudinal (machine direction, MD) Young’s moduli [10] (see Table 1). Therefore, the direct contribution to the relative radius change of straw becomes ϵ d = σ / E = P R / ( E h ) .
Owing to the Poisson effect, the hoop strain causes an axial strain of the opposite sign, and, thus, the straw becomes shorter if the ends are not built-in. This imaginary relative change of the length is ϵ μ = μ ϵ d , where μ is the transverse (circumferential for the tube) Poisson’s ratio. However, the straw ends are fixed, which indicates an appearance of the compensatory tension force Δ T and the corresponding axial stress Δ T / ( 2 π R h ) , which returns the straw to its initial length:
Δ T 2 π R h = E ϵ μ = μ P R h E E .
From Maxwell’s reciprocity theorem, the known relation μ = μ E E can be derived, where μ is the axial Poisson’s ratio [7]. Thus, the wall axial tension is
T = T 0 + Δ T = T 0 + 2 μ P π R 2 .
The total force applied by a gas-filled straw in vacuum on the detector frame can be considered as an “effective tension” T P = T P π R 2 , if the effect of external atmospheric pressure applied to the frame is calculated by ignoring all holes made for the gas supply into the straws. For this effective tension, we obtain
T P = T 0 ( 1 2 μ ) P π R 2 .
Poisson’s ratio μ for plastics is usually less than 0.5. Thus, the vacuum around a straw leading to its inner overpressure diminishes T P with respect to the straw pre-tension T 0 despite the increase in true straw tension T (A5).

Appendix A.3. Lateral Effect of Internal Pressure

Figure A1. Forces applied to the curved tube element without flexural rigidity subject to internal pressure and axial tension.
Instruments 02 00027 g0a1
We evaluate the summary force applied by internal pressure to the wall of a curved tube. Ignoring the flexural rigidity, consider a short element of a slightly curved tube (Figure A1), limited by its two cross-sections normal to the curved axis. The absolute longitudinal tension force | T A B | = | T C D | = | T | is a constant in this approximation, but the directions of T A B and T C D forces are defined by different slopes at the element ends.
The area of the arched side of the wall (upper side in Figure A1) is larger than the area of the concave part. Consequently, a non-zero summary pressure force F W applied to the wall appears, which is directed toward the arched side of the wall. Thus, the internal overpressure always attempts to increase the existing curvature of the tube.
The evaluation of summary pressure effect has been performed earlier in a few ways: an imaginary ideal piston at the boundary of the pressurized tube segment [20], the consideration of the forces applied to separated fluid contained within a tube element [21], and a direct integration of the pressure forces [7].
However, we can directly evaluate the pressure effect F W without integration. For the given P, the summary force F W depends only on the shape of the tube segment. Imagine an absolutely rigid shell consisting of a curved tube wall with additional transverse plugs closing the cross sections AB and CD tightly. A resultant force applied by inner overpressure to a closed rigid shell is always zero. Therefore, the total pressure force applied to the curved wall is equal, but with the opposite sign, to the vector sum of the pressure forces P π R 2 applied to the end plugs, which are perpendicular to the curved axis of the tube at the ends (see Figure A1). One of these forces is directed against T A B , and the other against T C D , which effectively diminishes the straw tension by the pressure-related force P π R 2 .
Thus, the lateral dynamics of a curved tube element are defined by the effective tension T P = T P π R 2 = T 0 ( 1 2 μ ) P π R 2 , which replaces the true tension T in all the formulae describing a straw bending [7,8,21].
It is important to understand the physical difference between the effective tension T P defining the straw bending phenomena and the tube wall tension T in the tensile strength formulae. Straw wall stress is normally increased owing to the internal overpressure, whereas the pressurized straw as an elastic body is effectively relaxed under the same conditions, and this relaxation is described by the pressure-dependent effective tension T P behavior.
For T P < 0 , a summary transverse force pushes a curved straw element toward its arched side, and without flexural rigidity, the curvature increases until the tension (increased owing to the curved tube elongation) becomes equal to the pressure force everywhere along the tube: T = P π R 2 .
From T P > 0 and Equation (A6), we obtain the minimum longitudinal straw pre-tension T 0 to prevent buckling [7]
T 0 m i n = ( 1 2 μ ) P π R 2 .
The same limit is defined by Equation (A3) derived in a different way.

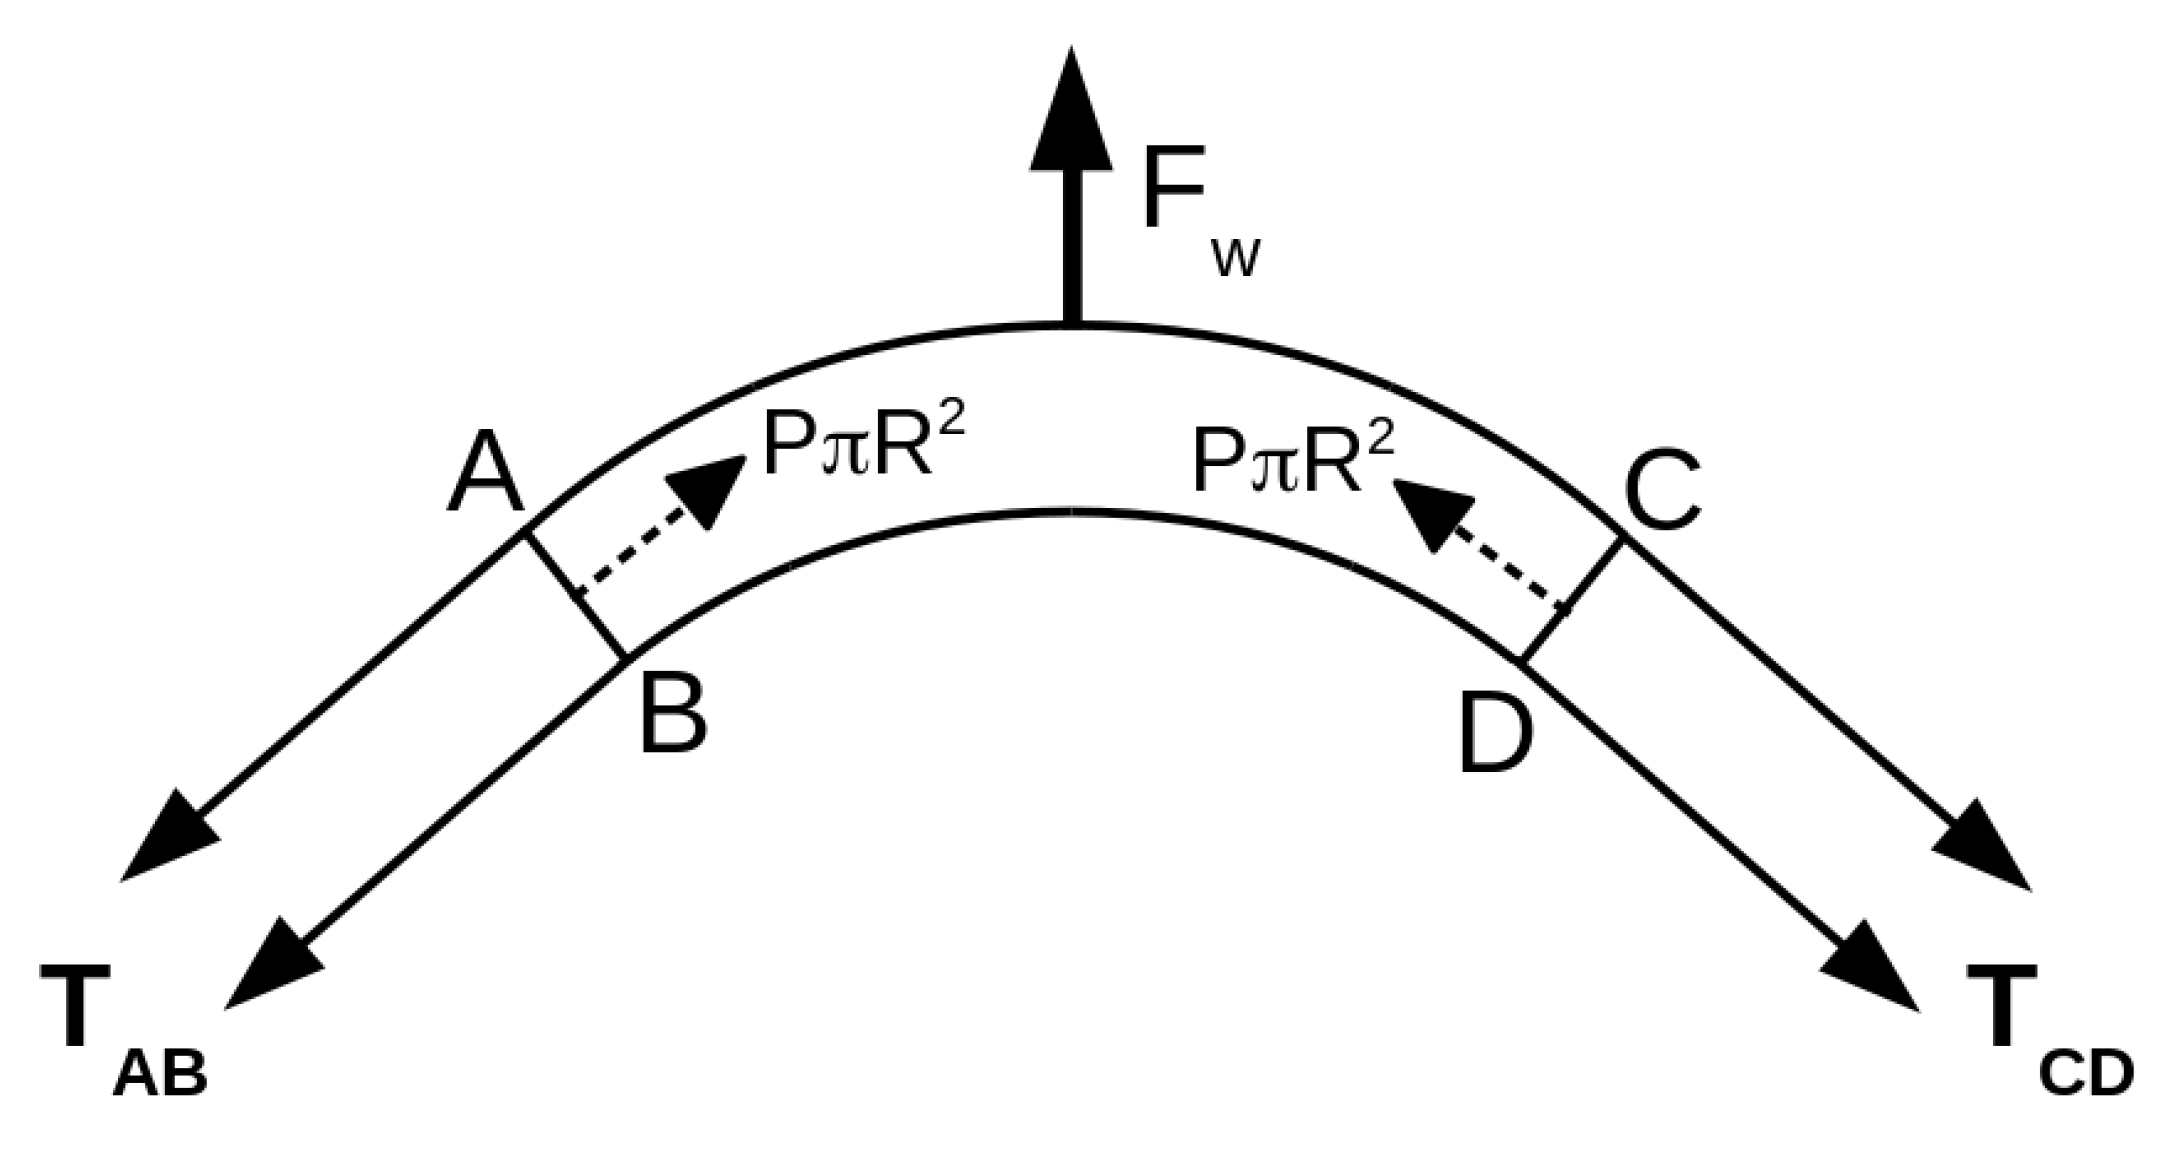
Appendix A.4. Equilibrium of a Horizontal Straw

For a horizontally placed straw, we should ensure that the maximum vertical deviation (sagitta S a g ) caused by gravitation is small enough. Consider a horizontal straw with built-in ends subject to vertically distributed gravitational load q and an internal overpressure P. We choose the origin of the axial coordinate x at the center of the straw. The axis of a straw lateral deviation y is directed downwards, thus y ( 0 ) = S a g . The linear gravitational load is q = g ρ , where ρ is the linear density of the straw and g is the gravitational acceleration.
The straw equilibrium equation for this case is derived in [7,8]:
d F d x = E J d 4 y d x 4 + T P d 2 y d x 2 + q = 0 ,
where d F d x is a resulting force per unit of length, which is zero for the case of static equilibrium.
Straw ends in the NA62 spectrometer are glued into the frame (clamped). Therefore, the boundary conditions are d y d x ( ± L 2 ) = 0 and y ( ± L 2 ) = 0 . The symmetric solution ( y ( x ) = y ( x ) ) for this static case is
y s ( x ) = q 2 T P ( L 2 4 x 2 + L k · c o s h ( k x ) c o s h ( k L / 2 ) s i n h ( k L / 2 ) ) ,
where k = T P E J (see [8]). Sagitta y s ( 0 ) is increased by the internal overpressure owing to the decrease in T P (Equation (A6)).

Appendix A.5. Low-Frequency Oscillations

The interesting consequence of the pressure lateral effect is a straw vibration pressure dependence caused by the behavior of T P used instead of string tension for straw transverse dynamics. For the case of oscillations, we should set d F d x = ρ d 2 y d t 2 instead of zero in Equation (A8). We determine the solution in the form of y ( x , t ) = y s ( x ) + y f ( x , t ) , where y s ( x ) is a solution of the static Equation (A8). It leads to the wave equation
ρ d 2 y f d t 2 = E J d 4 y f d x 4 + T P d 2 y f d x 2
set up by Lord Rayleigh [22].
We determine the symmetric solution with fixed ends ( y f ( ± L 2 ) = 0 ) and with “pinned” boundary conditions ( d 2 y f d x 2 ( ± L 2 ) = 0 ). Such a simple solution is sufficient for the qualitative understanding of straw oscillations. These boundary conditions are satisfied for y f ( x , t ) = c o s ( ( 1 + 2 n ) π x / L ) e i 2 π f t with any integer n. For n = 0 , Equation (A10) results in ( 2 π f ) 2 ρ = ( π / L ) 2 ( E J ( π / L ) 2 + T P ) , and thus the lowest frequency of the straw vibration is [23]
f = 1 2 L E J ( π / L ) 2 + T P ρ .
Notably, the flexural rigidity of the straw results in an addition of E J ( π / L ) 2 to the effective tension in Equation (A11). The frequency is decreased by the overpressure owing to the behavior of T P (Equation (A6)).

Appendix A.6. Radius Correction

T P depends on the straw radius R considered thus far as a constant value. However, R depends on P, whereas the radius of the built-in end plug remains unchanged. It leads to the formation of a radius transition zone on the tube wall near the straw end. However, the axial component of the pressure force applied to the transition zone is subtracted from the axial wall tension applied to the end plug. Therefore, for T P calculation, we can consider the radius of the end plug to be equal to the pressure-dependent straw radius R.
The direct contribution of overpressure to the relative change of radius is σ E = P R E h , but if we consider the additional tension applied to the built-in ends, this term becomes ( 1 μ μ ) P R E h . Moreover, the applied pre-tension T 0 diminishes the straw radius owing to the Poisson’s effect. Therefore, we have
R = R 0 ( 1 + ( 1 μ μ ) P R 0 E h μ T 0 E 2 π R 0 h ) ,
where R 0 is the initial radius of the straw. For T P calculations, if T 0 1 kgf, the radius change in Equation (A12) leads to the next-order correction in terms of the small parameter P R E h .

References

  1. NA62 Collaboration. The Beam and detector of the NA62 experiment at CERN. JINST 2017, 12, P05025. [Google Scholar] [CrossRef]
  2. SHiP Collaboration. SHiP: A new facility with a dedicated detector for studying ντ properties and nucleon structure functions. arXiv, 2016; arXiv:1609.04860. [Google Scholar]
  3. Mu2e Collaboration. Mu2e Technical Design Report. arXiv, 2014; arXiv:1501.05241. [Google Scholar] [Green Version]
  4. Costanza, S.; Benussi, L.; Braghieri, A.; Boca, G.; Genova, P.; Gianotti, P.; Lavezzi, L.; Lucherini, V.; Montagna, P.; Orecchini, D.; et al. The straw tube tracker of the PANDA experiment. Nucl. Instrum. Meth. A 2010, 617, 148–150. [Google Scholar] [CrossRef]
  5. Gianotti, P.; Lucherini, V.; Pace, E.; Boca, G.L.; Costanza, S.; Genova, P.; Lavezzi, L.; Montanga, P.; Rotondi, A.; Bragadireanu, M.; et al. The Straw Tube Trackers of the PANDA Experiment. arXiv, 2013; arXiv:1307.4537. [Google Scholar]
  6. Timoshenko, S.; Gere, J. Theory of Elastic Stability; McGraw-Hill: New York, NY, USA, 1961. [Google Scholar]
  7. Catinaccio, A. Pipes under Internal Pressure and Bending; Technical Report; CERN: Geneva, Switzerland, 2010. [Google Scholar]
  8. Wertelaers, P. Static Behaviour of a 2-metre Straw Tracker; Technical Report; CERN: Geneva, Switzerland, 2010. [Google Scholar]
  9. NA62 Collaboration. NA62: Technical Design Document; Technical Report; CERN: Geneva, Switzerland, 2010. [Google Scholar]
  10. MITSUBISHI POLYESTER FILM GmbH. Hostaphan RNK 2600. Available online: https://www.m-petfilm.de/wp-content/uploads/RNK_2600e.pdf (accessed on 23 October 2018).
  11. Vishay Precision Group, Inc. Single-Point Aluminum Load Cell, Model 1022, Tedea-Huntleigh. Available online: http://www.vishaypg.com/docs/12007/1022.pdf (accessed on 23 October 2018).
  12. MatWeb, LLC. MatWeb material property data. Tra-Con Tra-Bond 2115 Clear High Strength Epoxy Adhesive. Available online: http://www.matweb.com/search/datasheet.aspx?matguid=5c72cf41e8a946c09b793f358ebbc0d2&ckck=1 (accessed on 23 October 2018).
  13. James, F.; Roos, M. Minuit: A System for Function Minimization and Analysis of the Parameter Errors and Correlations. Comput. Phys. Commun. 1975, 10, 343–367. [Google Scholar] [CrossRef]
  14. Brun, R.; Rademakers, F. ROOT: An object oriented data analysis framework. Nucl. Instrum. Meth. 1997, A389, 81–86. [Google Scholar] [CrossRef]
  15. Goodfellow Group of companies. Polyethylene Terephthalate. Available online: http://www.goodfellow.com/E/Polyethylene-terephthalate.html (accessed on 23 October 2018).
  16. Gere, J.M. Mechanics of Materials, 6th ed.; Brooks/Cole-Tompson Learning: Belmont, CA, USA, 2004. [Google Scholar]
  17. Davkov, V.; Davkov, K.; Myalkovskiy, V.V.; Peshekhonov, V. High pressure thin-wall drift tubes. Instrum. Exp. Tech. 2008, 51, 787–791. [Google Scholar] [CrossRef]
  18. Timoshenko, S.; Woinowsky-Krieger, S. Theory of Plate and Shells, 2nd ed.; McGraw-Hill Book Co.: New York, NY, USA, 1959. [Google Scholar]
  19. Livio, D.C. Qualification of the Longitudinal Weld of Thin Wall Pet Tubes of the Straw Tracker of the NA62 Experiment. Master’s Thesis, Haute Ecole Libre Mosane, Liege, Belgium, 2011. [Google Scholar]
  20. Haringx, J. Instability of thin-walled cylinders subjected to internal pressure. Philips Res. Rep. 1952, 7, 112–118. [Google Scholar]
  21. Palmer, A.; Baldry, J. Lateral buckling of axially constrained pipelines. J. Pet. Technol. 1974, 26, 1283–1284. [Google Scholar] [CrossRef]
  22. Rayleigh, L. The Theory of Sound; MacMillan and Co, Inc.: London, UK, 1894. [Google Scholar]
  23. Fletcher, H. Normal vibration frequencies of a stiff piano string. J. Acoust. Soc. Am. 1964, 36, 203–209. [Google Scholar] [CrossRef]
Figure 1. The test bench scheme: B, rigid basement; Tm, tensometer; e1, closed end plug; e2, end plug with a gas supply channel; C, end cap with a seal; P, pressure supply; S, straw; O, optical coupler; A, amplifier.
Instruments 02 00027 g001
Figure 2. The 9.8-mm straw effective tension T P versus the overpressure P for different initial tensions T P ( 0 ) . Circles, measurements; solid lines, fit by Equation (3).
Instruments 02 00027 g002
Figure 3. (A) Effective tensions T P versus P for different initial tensions T P ( 0 ) . (B) Lowest frequency for the corresponding P and T P . Filled circles, 9.8-mm straw; open circles, 18-mm straw. Curves: Equation (3) for the plot A and (A11) for B; solid lines, 9.8-mm straw; dashed lines, 18-mm straw.
Instruments 02 00027 g003
Figure 4. Sagitta in vacuum S a g versus pre-tension T 0 of 70-cm-long straw segment for: 9.8-mm straw (A); and 18-mm straw (B). Vertical lines mark the buckling limit T P = 0 . Solid line is calculated for the central values for all parameters. Dashed lines show the worst case (see text).
Instruments 02 00027 g004
Table 1. Properties of the tested straws.
Property9.8-mm Straw18-mm Straw
Diameter, mm 9.8 ± 0.1 18.0 ± 0.1
Length, m 2.10 ± 0.01 1.90 ± 0.01
Material density, g/cm 3 1.4 ± 0.1 1.4 ± 0.1
Wall thickness, μ m 36 ± 1 54.4 ± 0.8
Tube linear density, g/m 1.55 ± 0.12 4.31 ± 0.06
E , N/mm 2 4500 ± 500 4000 ± 500
E , N/mm 2 5000 ± 500 5500 ± 500
Table 2. Poisson’s ratio measurement results.
9.8 mm Straw18 mm Straw
k, μ m 2 g f μ μ k, μ m 2 g f μ μ
Central value3.980.30550.3394−2.890.29600.4070
Radius correction0.430.00050.00060.920.00050.0007
Radius value0.140.00830.00920.590.00390.0054
T P scale0.060.00990.01101.240.00880.0121
P scale0.270.00940.01041.030.00840.0116
δ E E 000.0306000.0296
Systematic error0.530.01600.03531.950.01280.0344
Statistical error0.180.00050.000614.350.01500.0206
Total error0.560.01600.035314.480.01970.0401

