Article

Commissioning Results and Electron Beam Characterization with the S-Band Photoinjector at SINBAD-ARES

1
Deutsches Elektronen-Synchrotron DESY, Notkestraße 85, 22607 Hamburg, Germany
2
SCK CEN, Boeretang 262, 2400 Mol, Belgium
3
European XFEL GmbH, Holzkoppel 4, 22869 Schenefeld, Germany
4
Brookhaven National Laboratory, 2 Center St., Upton, NY 11973, USA
*
Author to whom correspondence should be addressed.
Instruments 2021, 5(3), 28; https://doi.org/10.3390/instruments5030028
Submission received: 14 July 2021 / Revised: 8 August 2021 / Accepted: 17 August 2021 / Published: 25 August 2021

Abstract

:
Over the years, the generation and acceleration of ultra-short, high quality electron beams has attracted more and more interest in accelerator science. Electron bunches with these properties are necessary to operate and test novel diagnostics and advanced high-gradient accelerating schemes, such as plasma accelerators and dielectric laser accelerators. Furthermore, several medical and industrial applications require high-brightness electron beams. The dedicated R&D facility ARES at DESY (Deutsches Elektronen-Synchrotron) will provide such probe beams in the upcoming years. After the setup of the normal-conducting, radio-frequency (RF) photoinjector and linear accelerating structures, ARES successfully started the beam commissioning of the RF gun. This paper gives an overview of the ARES photoinjector setup and summarizes the results of the gun commissioning process. The quality of the first electron beams is characterized in terms of charge, momentum, momentum spread and beam size. Additionally, the dependencies of the beam parameters on RF settings are described. All measurement results of the characterized beams fulfill the requirements for operating the ARES linac with this RF photoinjector.

1. Introduction

SINBAD (Short INnovative Bunches and Accelerators at DESY) [1] is an accelerator R&D platform in the former DORIS accelerator tunnel at DESY, Hamburg. Its goals are to demonstrate the generation and acceleration of ultrashort electron bunches, and to test advanced acceleration techniques such as laser driven plasma wake-field acceleration (LWFA), dielectric laser acceleration (DLA) and THz-driven acceleration, in multiple independent experiments.
ARES (Accelerator Research Experiment at SINBAD) [2,3] at SINBAD represents one of these experiments. The linear RF accelerator with a target energy of 100–155 MeV is currently in the construction and commissioning phase. The facility will provide low-charge, remarkably short electron probe bunches with excellent arrival-time stability [4]. The design parameters of the electron beam are summarized in Table 1.
The SINBAD-ARES setup hosts a normal conducting RF photoinjector generating a low charge electron beam, which is afterwards accelerated by an S-band linac section. The linac, together with a magnetic chicane including a slit collimator, will allow the generation of ultra-short bunches in the fs to the sub-fs regime based on the techniques of velocity bunching and magnetic bunch compression [5]. The high brightness beam will then serve as a test bench for novel diagnostic devices such as the PolariX TDS, an advanced modular X-band transverse deflecting structure (TDS) system having the new feature of providing variable polarization of the deflecting force [6,7,8]. Furthermore, the ARES accelerator has the potential to provide a test beam for next-generation compact acceleration schemes in the future [9,10,11]. ARES will also contribute as a test facility for machine learning for autonomous accelerators, a project of the Helmholtz Artificial Intelligence Cooperation Unit (Helmholtz AI) [12].
While SINBAD-ARES is a DESY project, access will be possible to external researchers via the ARIES (Accelerator Research and Innovation for European Science and Society) transnational access program free of charge [13]. This EU-funded Integrating Activity project aims to develop European particle accelerator infrastructures and includes the task of opening research facilities to external users.
It is noteworthy that the ARES linac shares several diagnostic components, the control architecture and beam physics challenges of ultra-short, high density electron beams, with AXSIS (Attosecond X-ray Science, Imaging and Spectroscopy), an ERC (European Research Council) Synergy Grant project at DESY [14]. The AXSIS construction is nearing completion in a neighboring space in the same SINBAD facility where ARES is located. Part of the work reported here will be therefore used for training beam instrumentation and procedures that will also be relied on in the upcoming AXSIS beam commissioning, thereby minimizing the time required for development.
Figure 1 illustrates the planned layout of the ARES linac at SINBAD.
The setup of the SINBAD-ARES facility is proceeding in stages. In a first step, the RF photoinjector, including a diagnostic line, was completely installed in the ARES tunnel area. The photocathode drive laser system was prepared as well. After RF conditioning of the gun cavity, a first electron beam was generated and detected at the end of October 2019. This important milestone in the ARES project marked the beginning of the RF photoinjector commissioning and the first electron beam’s characterization.
This publication gives a detailed overview of the accelerator setup in the ARES gun area followed by the results of the RF gun conditioning (Section 2 and Section 3). Afterwards, the systematic characterization of the electron beam is presented in Section 4. The following section introduces a beam-based alignment tool for the gun solenoid magnet. Finally, the dark current is described in Section 6.

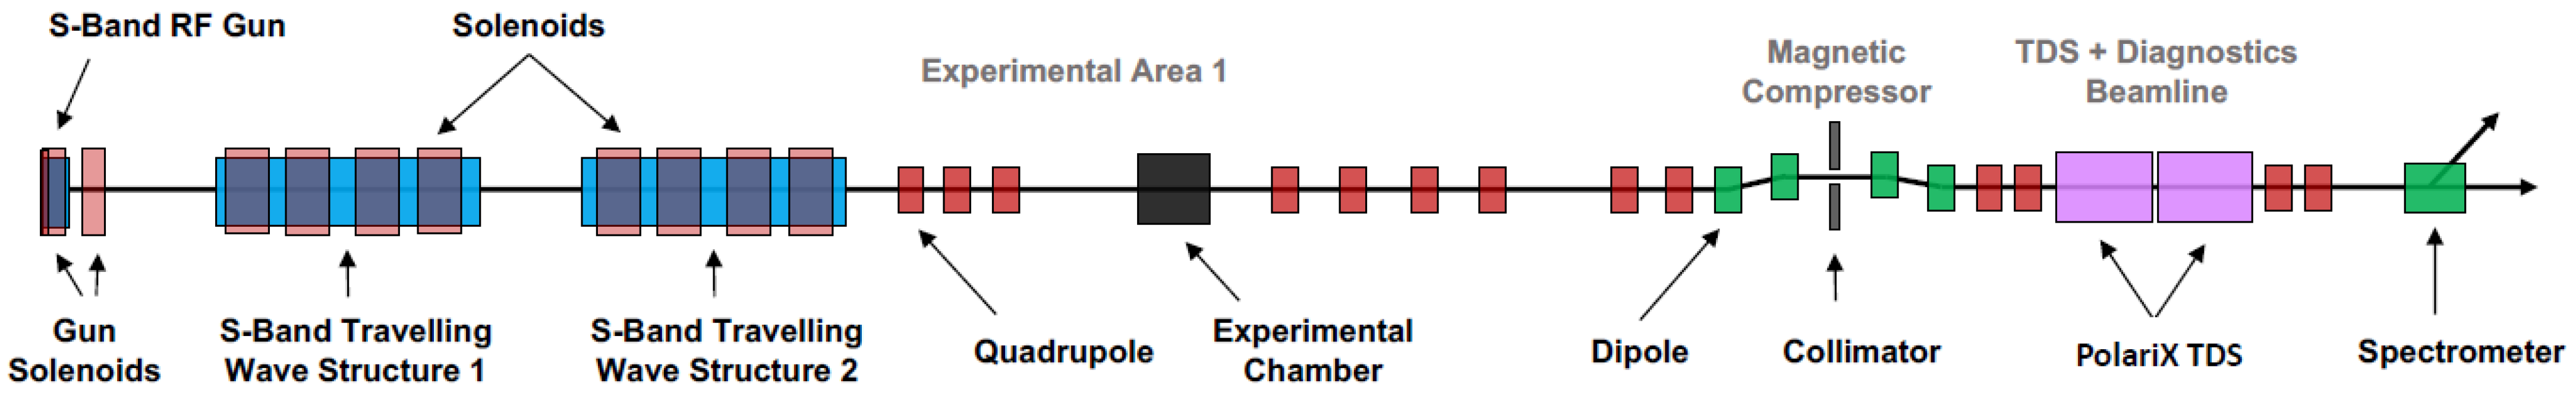
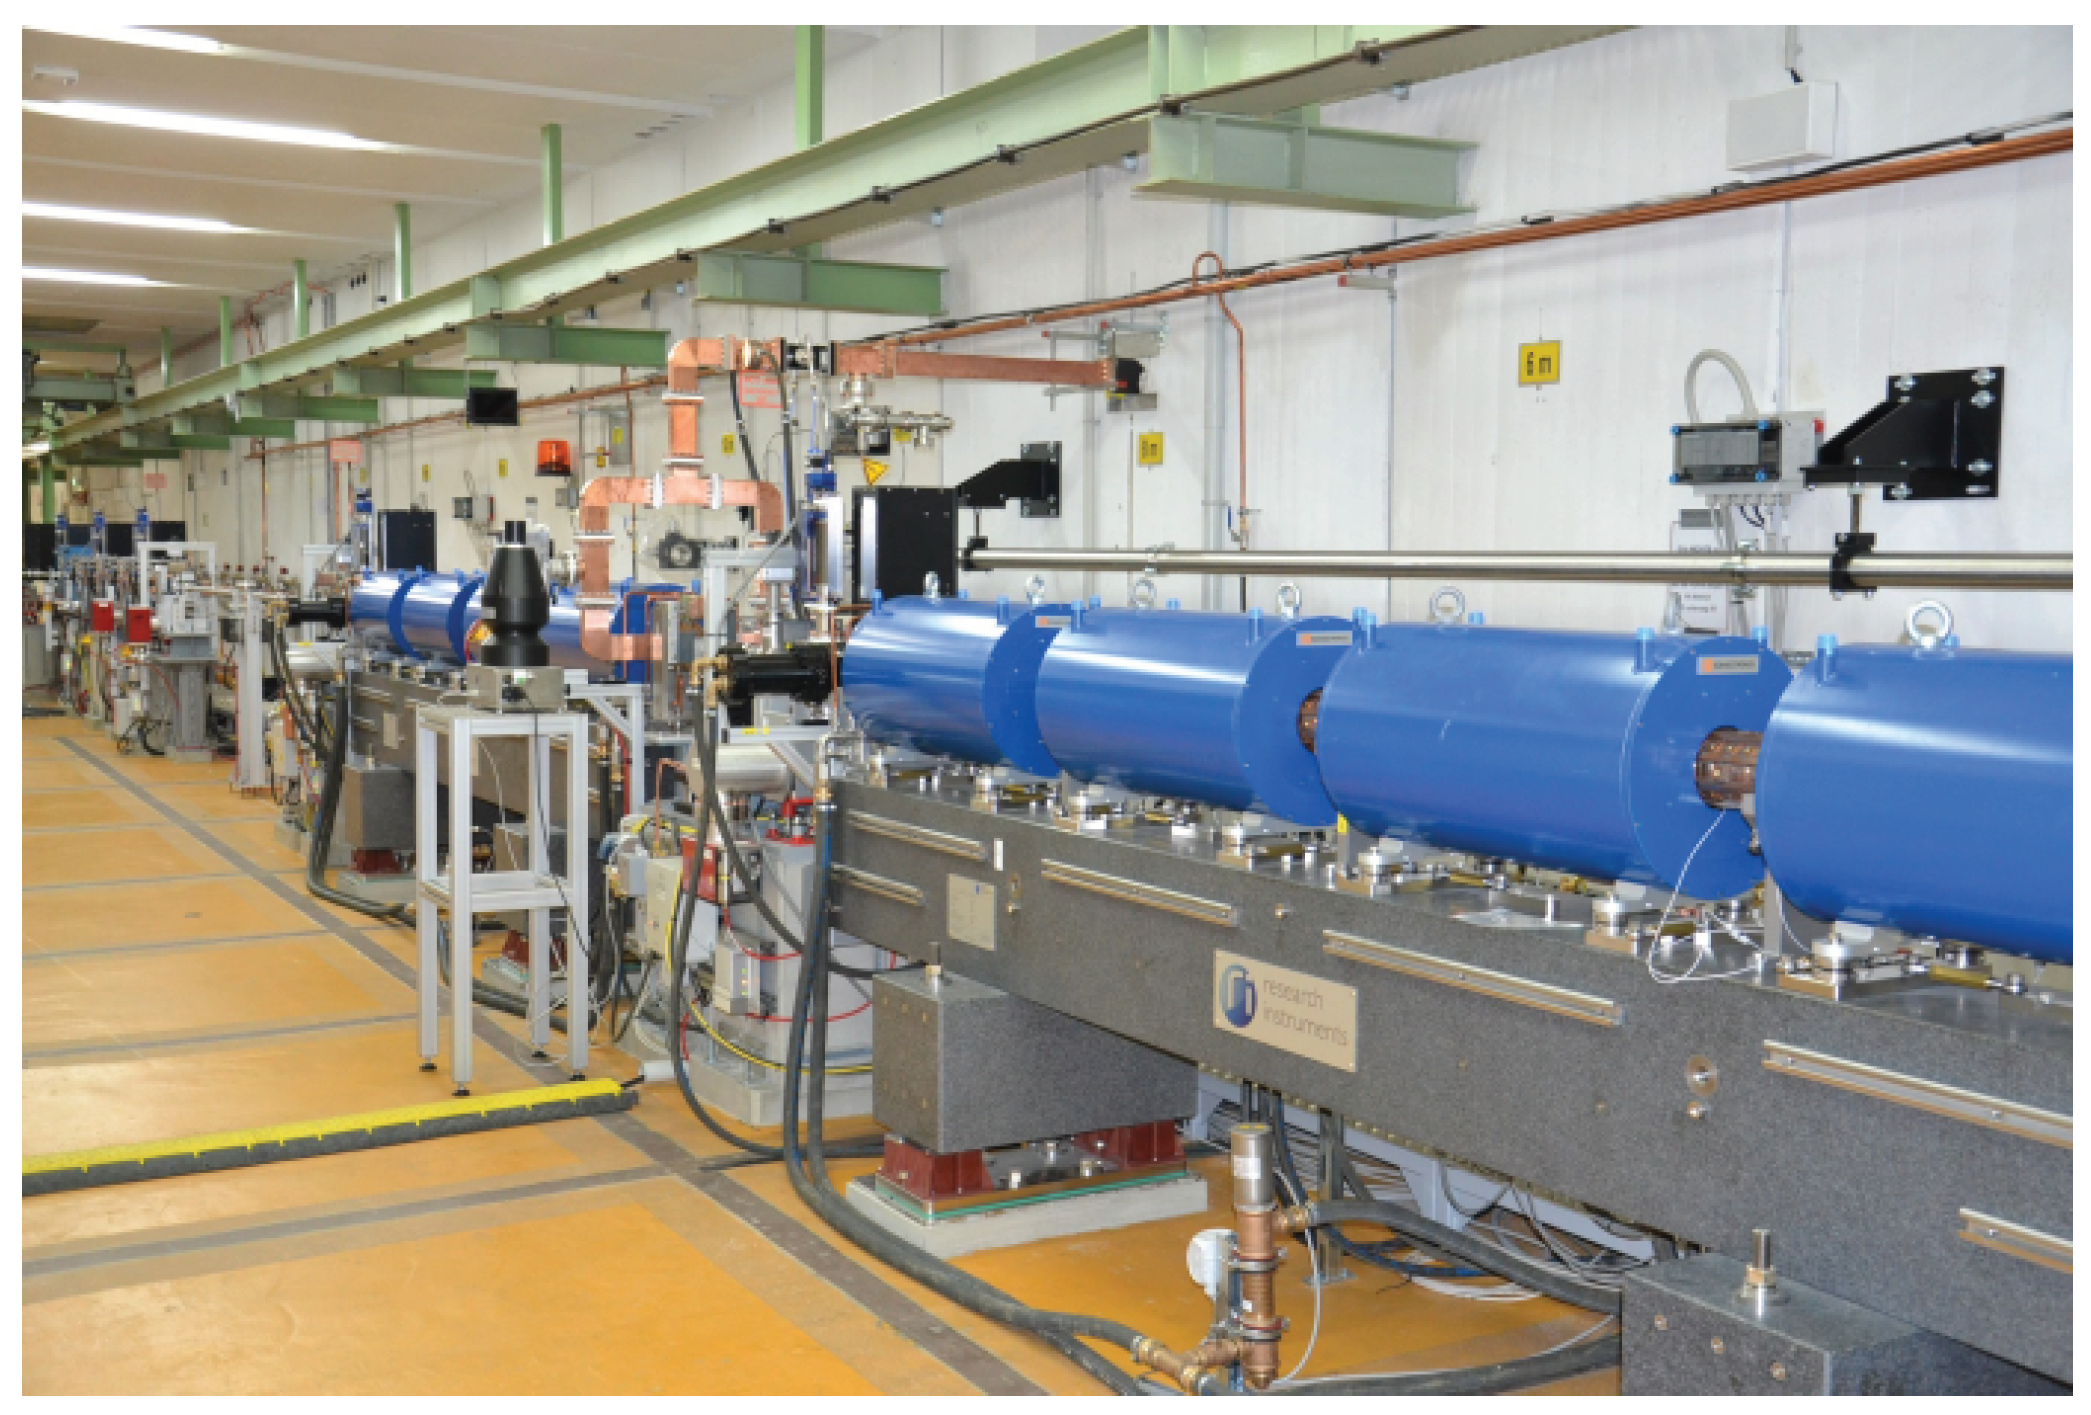
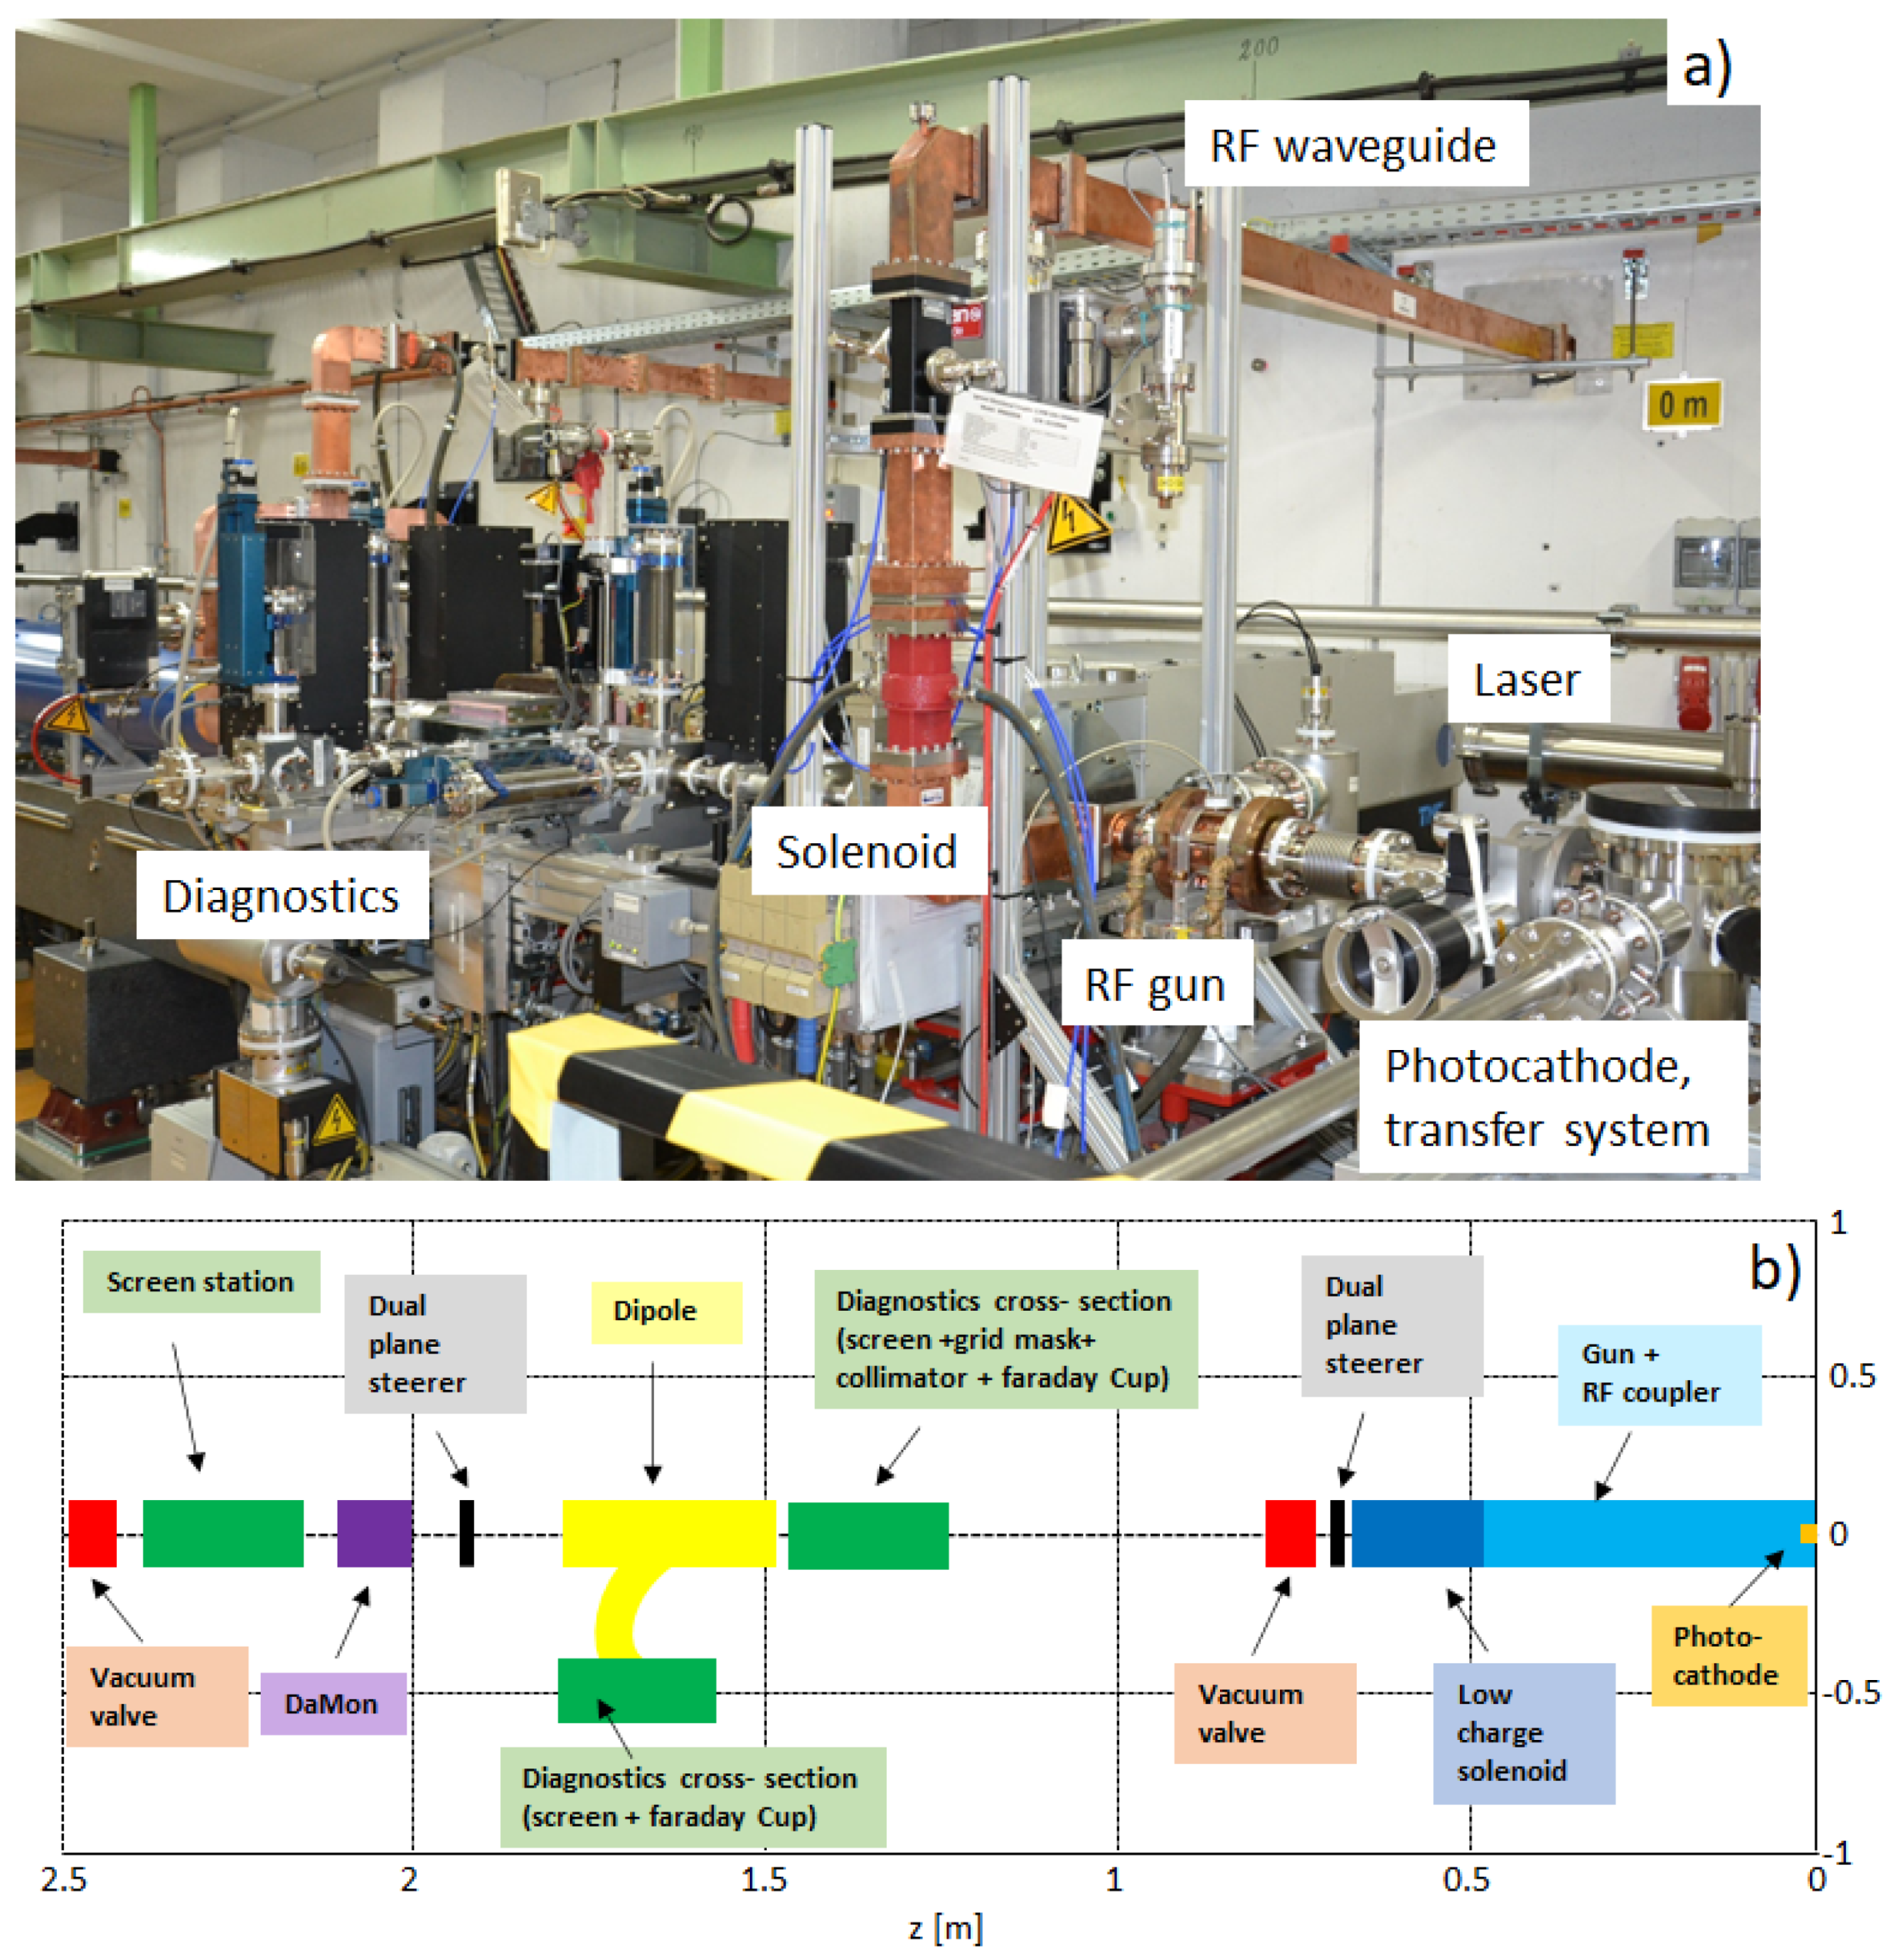
2. Overview of the ARES Photoinjector

Figure 2 shows the setup of the ARES gun area in the SINBAD tunnel in January 2020, including infrastructure and hardware [4].
The 1.5 cell, normal-conducting, S-band RF cavity made of copper represents the central part of the setup. Commissioning has been started with a 1.5 cell, spare REGAE RF cavity [15]. The cavity was tuned at DESY, CO 2 cleaned and afterwards, installed at the ARES beamline. This RF gun will be replaced at a later date with a modified version featuring a longer antenna connecting the RF coupler to allow for a second gun solenoid, bucking coil and improved water cooling system.
The RF station comprises a Toshiba E37326A klystron and a Scandinova K1 modulator. A main RF oscillator (MO) provides the operation frequency of 2.998 GHz. This MO signal is distributed to various systems, such as the low-level RF (LLRF) and the laser-synchronization system. The LLRF system controls the amplitude and phase of the cavity RF signal, and the laser-synchronization system sets the arrival time of the laser-beam on the photocathode. Laser to RF synchronization will ensure timing synchronization of the RF reference and laser pulse. With direct synchronization, long-term stability (24/7) of 18 fs was measured in the frequency range from 10 to 185 kHz, which can be improved with a synchronization scheme based on a Mach–Zehnder modulator (MZM) [16]. The synchronization at femtosecond level allows one to fully exploit the potential of ultra-short electron bunches while probing the novel acceleration techniques. The RF is transferred from the klystron to the cavity via a waveguide system that is separated from the cavity itself by a double-coated vacuum window. The peak input power in the cavity is 6 MW, which corresponds to an accelerating gradient of 117 MV/m.
The electron beam is generated at the photocathode. We intend to implement metallic and semiconductor cathodes (Cs2Te) in the gun, depending on the desired bunch charge and bunch length. The photocathode transfer system allows the insertion of the cathode plug from a cathode box in the back plane of the gun cavity without breaking the vacuum. Electrons are produced via the photoelectric effect [17]; therefore, the photocathode is illuminated by the drive laser. At ARES, the laser laboratory is located outside of the tunnel. The laser is guided through a beampipe under vacuum conditions to the cathode. The chosen cathode materials, molybdenum Mo for the first beam and cesium-telluride Cs 2 Te for the beam commissioning (higher bunch charge), require UV laser light (257 nm) for electron generation with maximum efficiency [18]. Automated harmonic generators which are integrated in the commercial Pharos laser (model PHAROS-SP-200) produce the UV light using the 4th harmonic of the near-infrared, Yb-doped photocathode laser [19]. The laser produces pulses with a pulse energy of 1 mJ, providing a transverse flattop and a longitudinal Gaussian profile. The transverse flattop shape allows one to minimize the nonlinearity of the longitudinal phase space and the transverse emittance [3]. The rms beam size can be varied down to 80 μm. The Gaussian longitudinal laser pulse is tunable between 180 fs and 10 ps (FWHM) [3]. The laser is coupled with a mirror downstream of the gun cavity and hits the photocathode under a small angle from normal incidence. The laser spot size on the cathode can be visualized by a second mirror placed at the same longitudinal position as the incoupling mirror. The generated electron beam is immediately accelerated in the RF gun cavity up to 5 MeV in order to counteract space charge effects.
Several magnets are available to control the electron beam. A dual-coil solenoid magnet right after the gun cavity exit focuses the beam in both transverse directions simultaneously. Two dual plane steerer pairs serve for trajectory corrections in the vertical and horizontal directions. A spectrometer dipole guides the electron beam to the dispersive section, allowing momentum spectrum measurements. The accelerator is supplemented with hardware diagnostics. Beam position and beam size measurements can be done at two screen stations in the forward direction and one in the dispersive arm [20]. Besides GAGG (gadolinium aluminium gallium garnet) and LYSO (Lutetium-based scintillator) screens [21], two grids are available in the first screening station after the gun cavity for the evaluation of the transverse emittance [22,23]. Two Faraday cups and one cavity based cup, and hence a non-destructive charge monitor (DaMon), enable bunch charge and dark current measurements [24,25]. The Faraday cup after the spectrometer dipole is also used as a beam dump.
The hardware and diagnostics at ARES are operated by a control system based on DOOCS (Distributed Object-Oriented Control System) [26]. A magnet middle layer server enables a desired magnetic field or transverse kick angle to be specified in addition to adjusting the input current [27]. Furthermore, proper machine settings for different applications can be saved with the Sequencer program. Long-term data acquisition, even for parameters following the repetition rate of up to 50 Hz, is done with a DAQ (Data Acquisition) server used throughout DESY [28]. By leveraging the numerous possibilities to interface with the control system (MATLAB, Python, Java, C/C++), the operators contributed software both for commissioning purposes and for day-to-day operation of the machine.

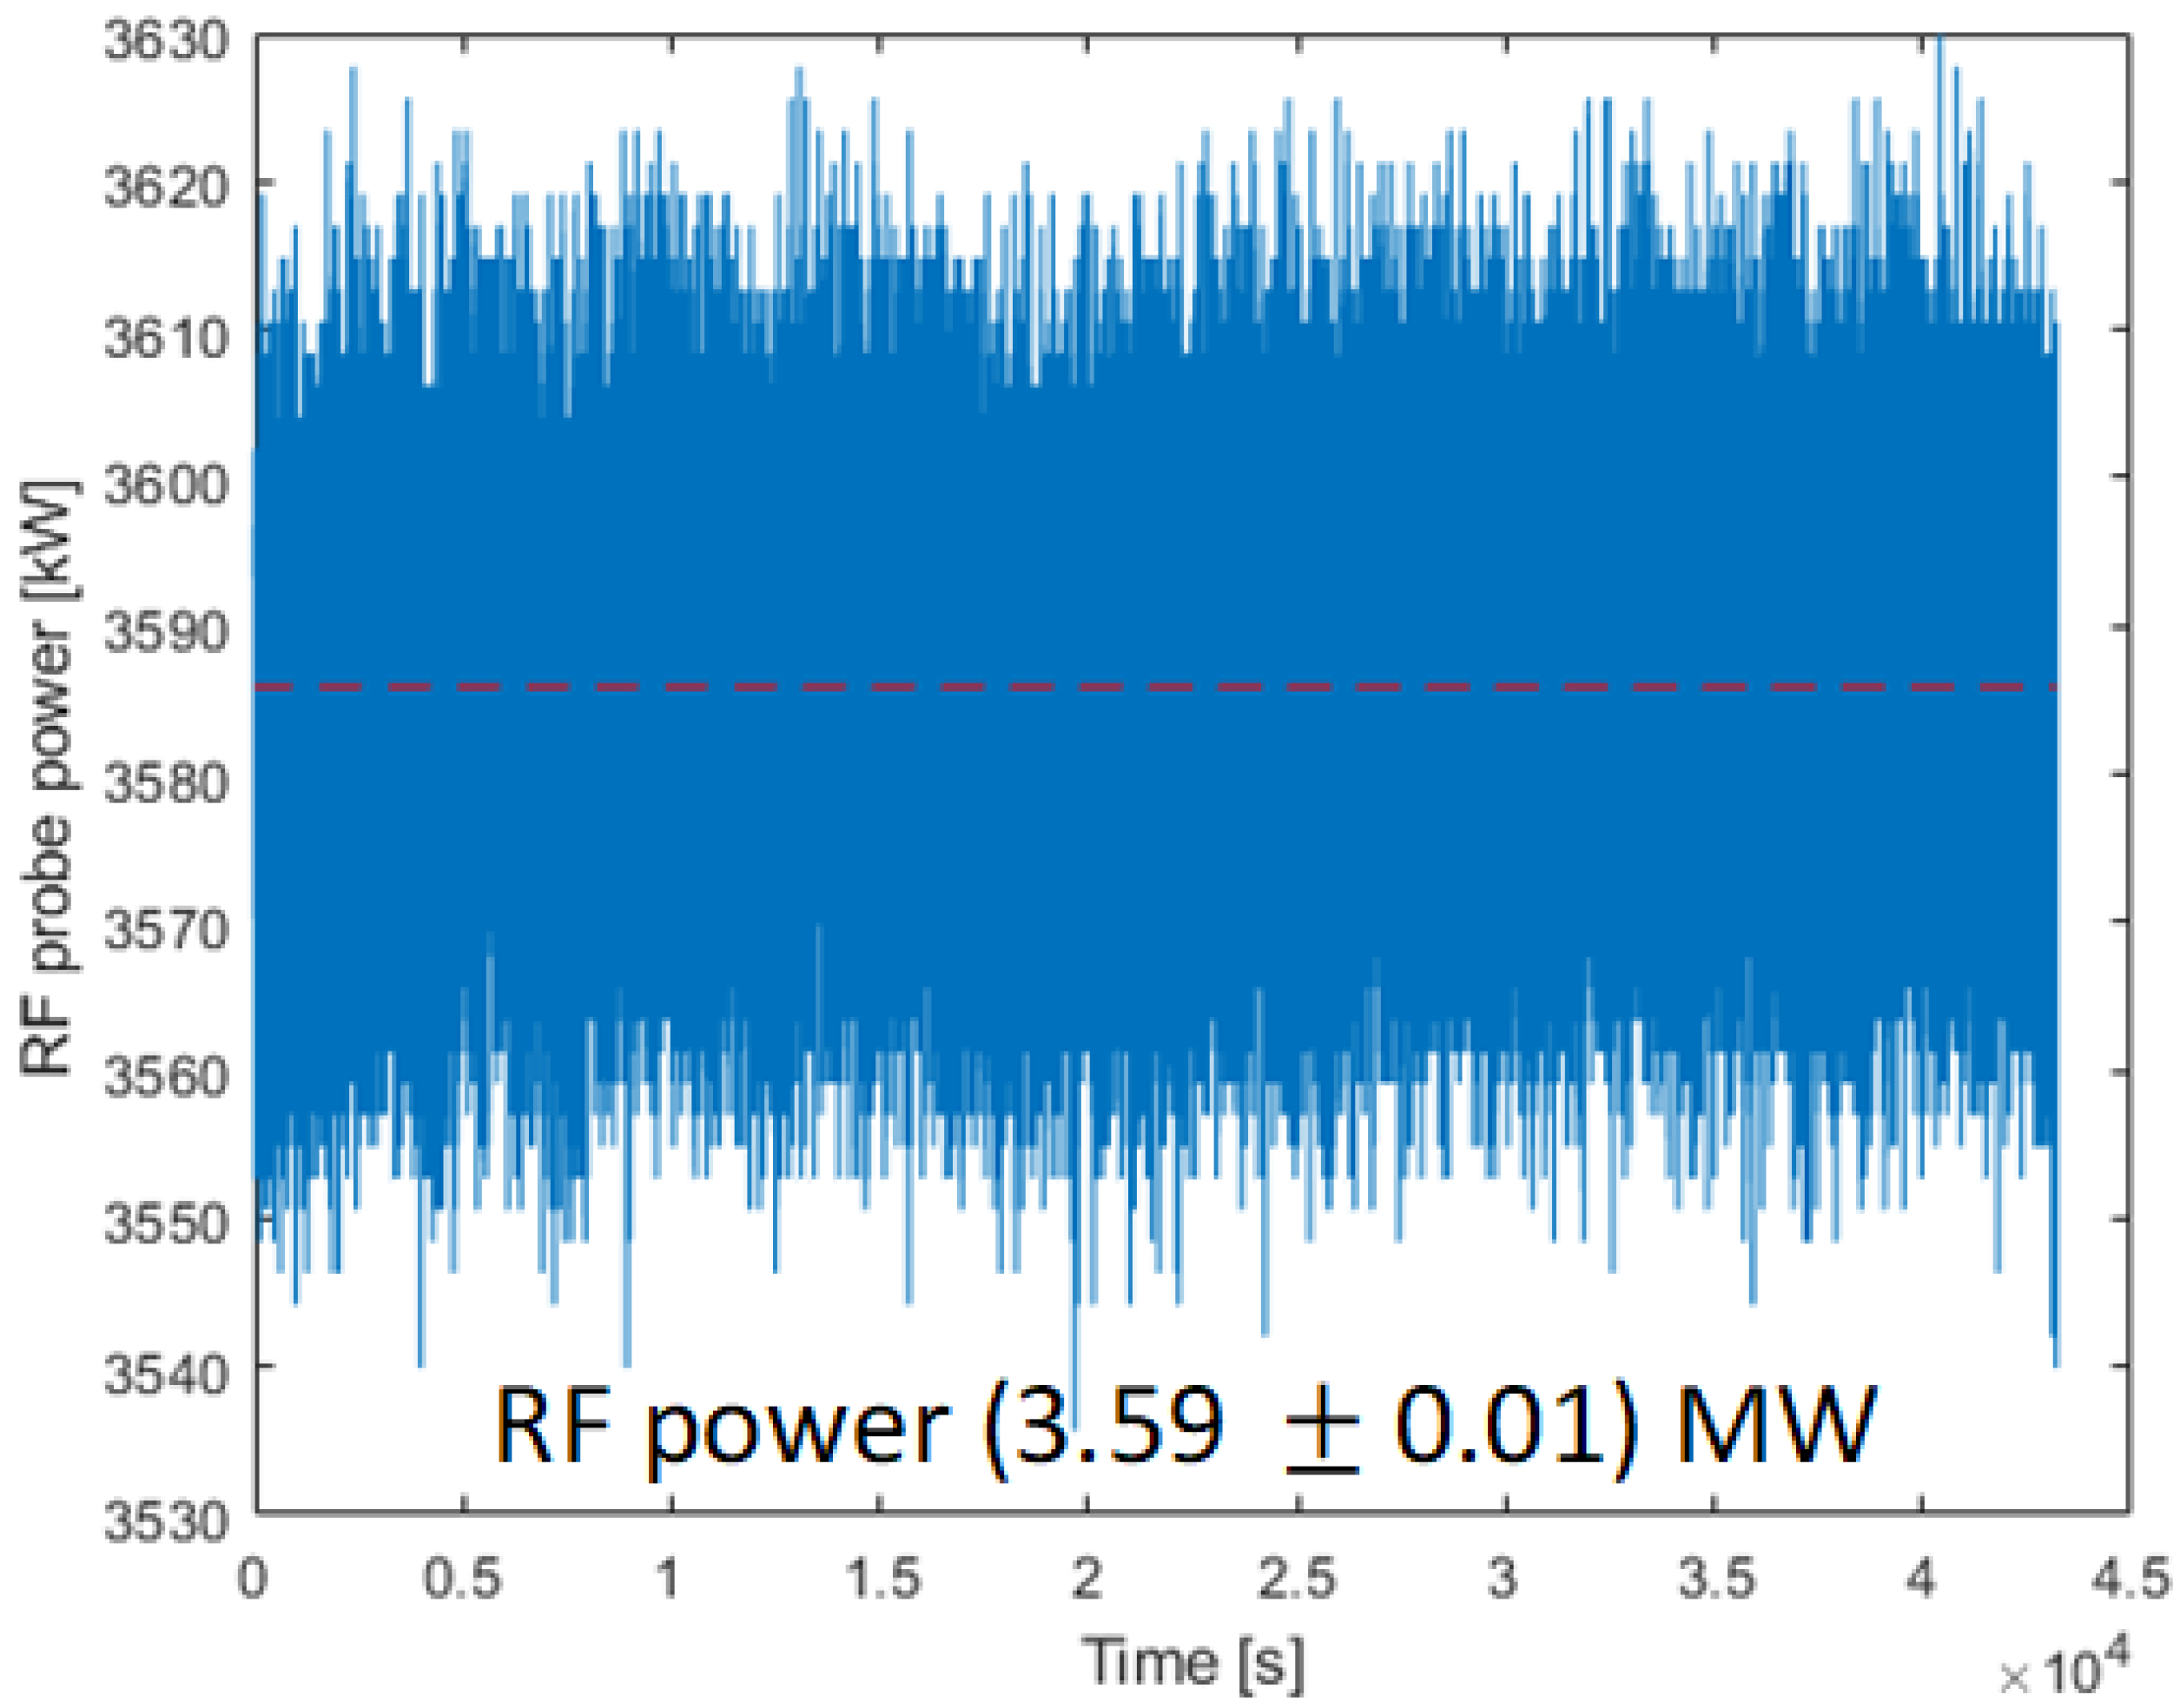
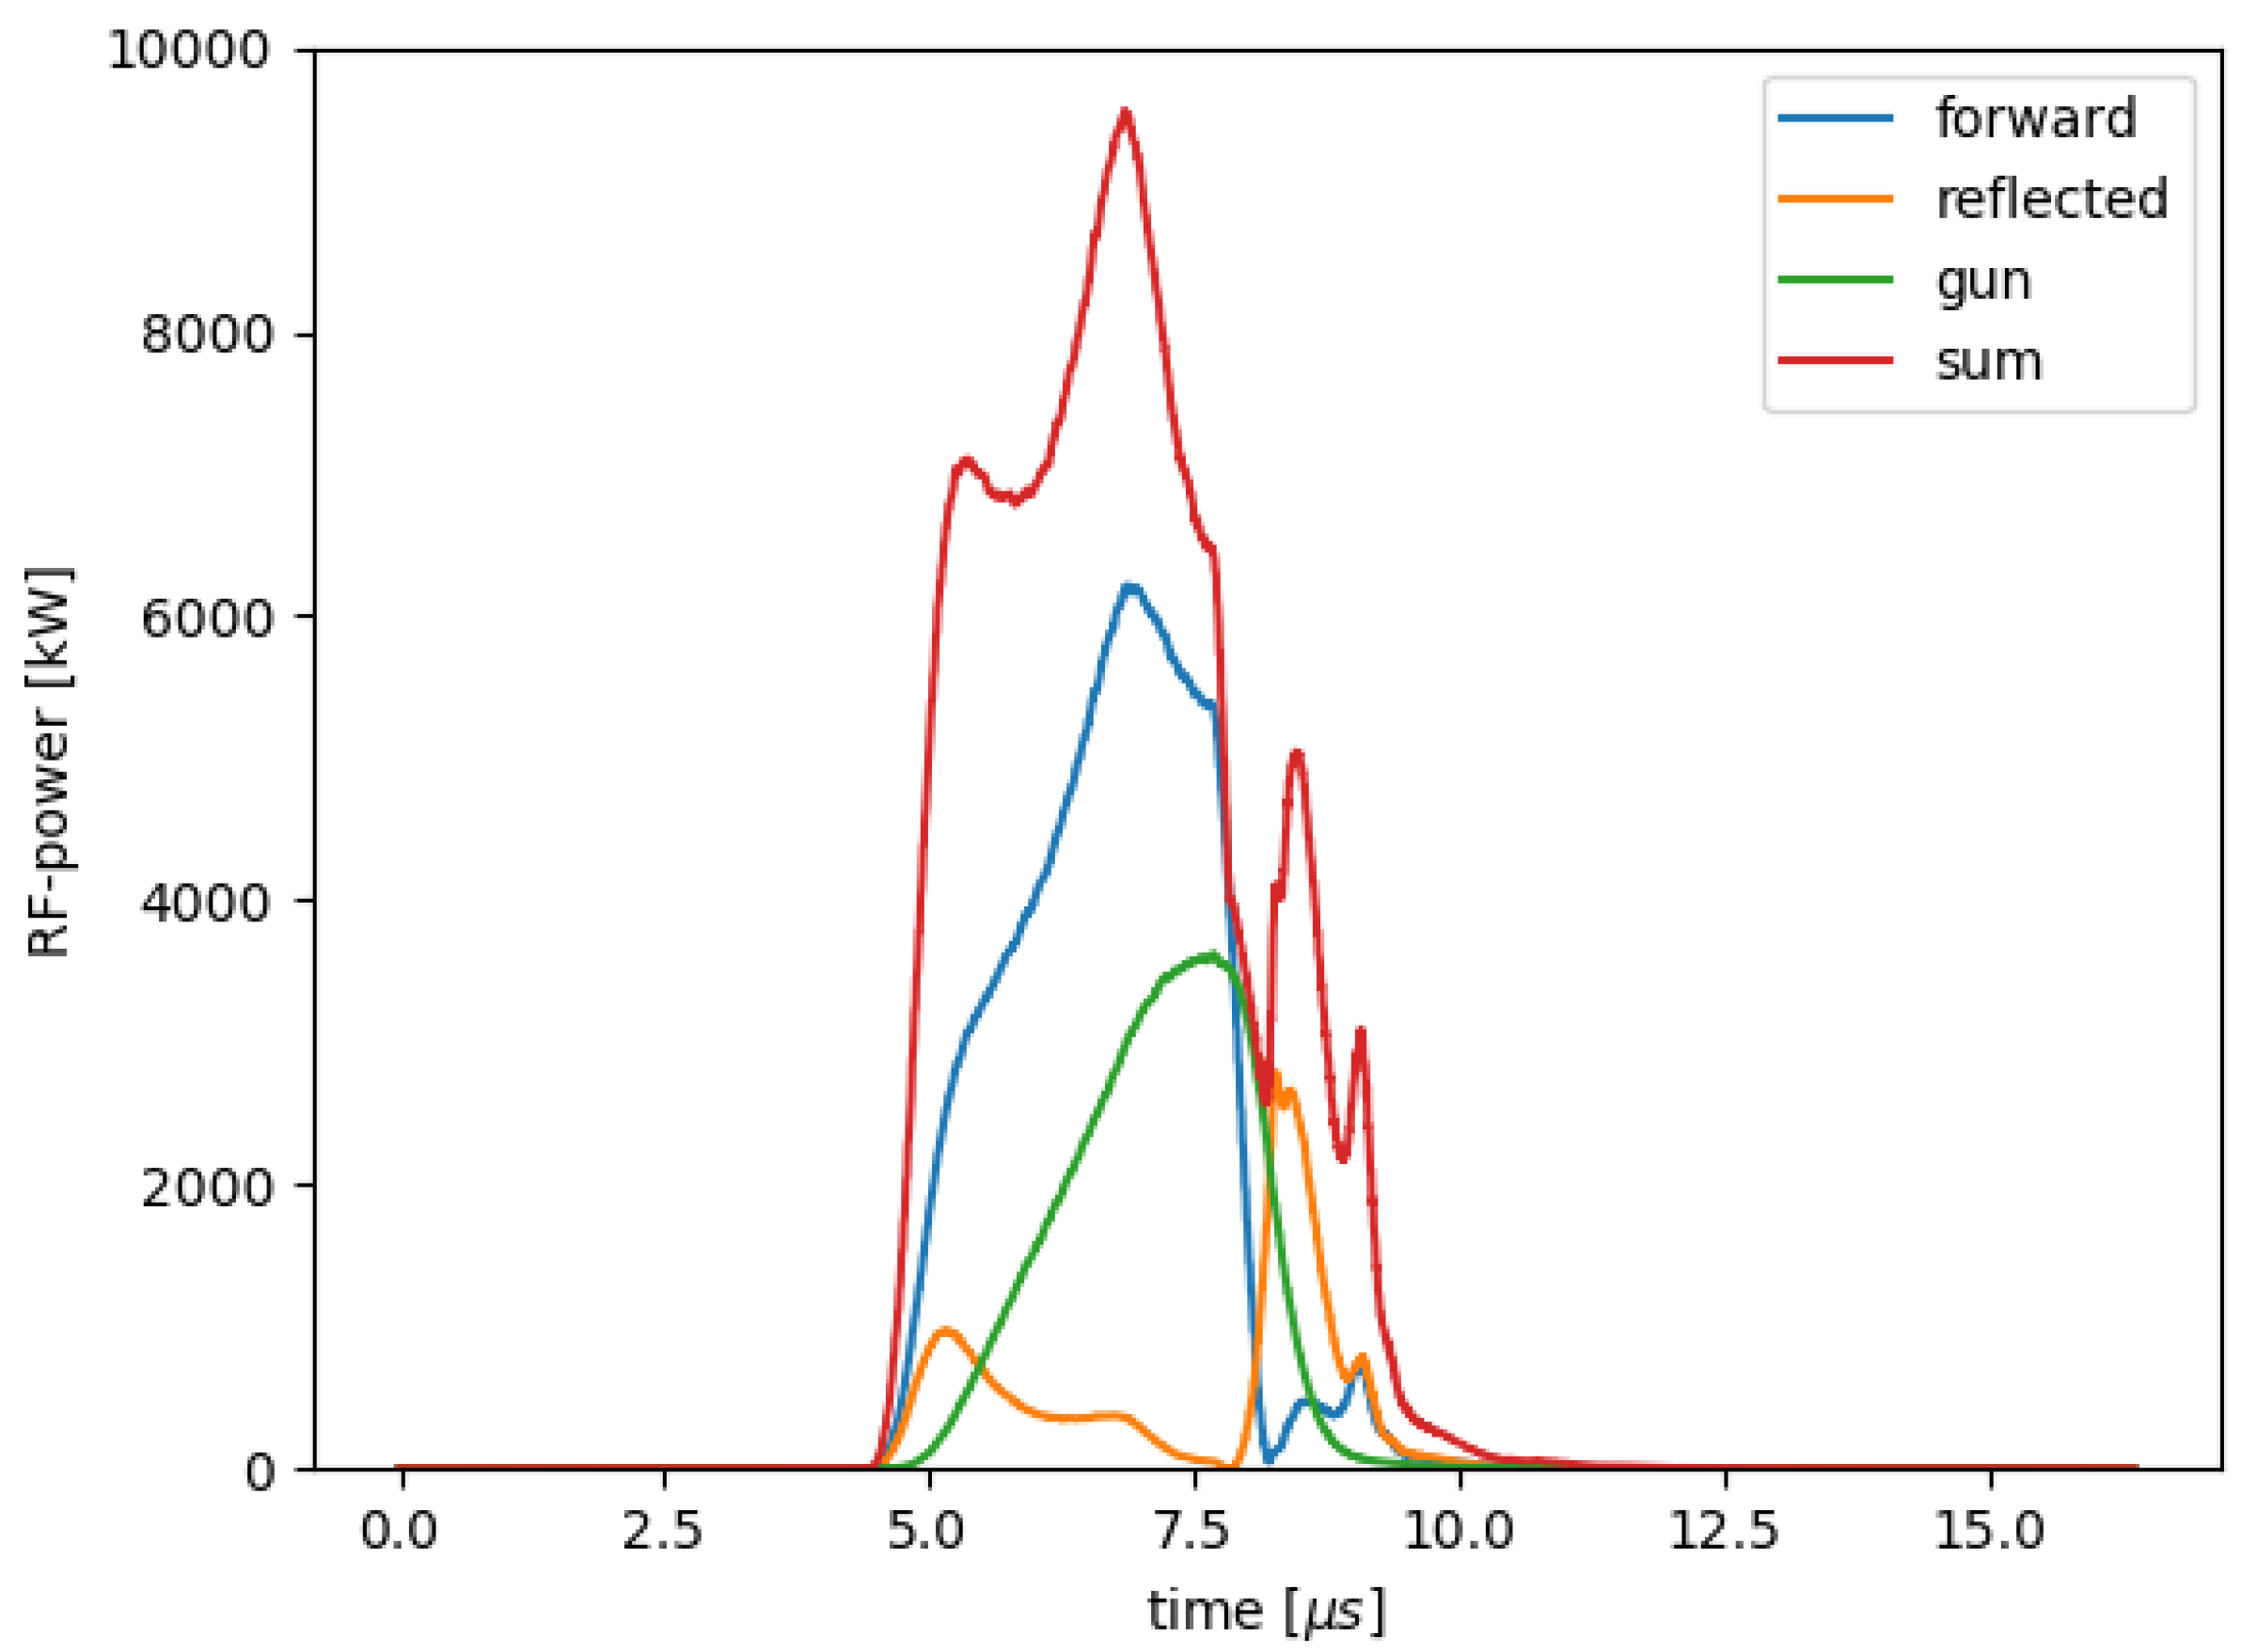
3. RF Conditioning of the Gun Cavity and RF Stability

As a first step during the accelerator commissioning, the gun cavity was fully conditioned. The final goal is to run the ARES gun at an RF probe power of 6 MW at a vacuum level of 10 10 mbar. Currently, a maximum RF power of 3.7 MW with an RF pulse length of 4.0 μs has been achieved during operation. The measured vacuum in the gun cavity of 8 × 10 11 mbar fulfills the requirements. In the commissioning phase, the machine normally runs 8 to 12 h per day. Measurements over 12 h confirmed stable RF power in the gun cavity with fluctuations of less than 10 kW (see Figure 3). A significant change in the RF stability after 12 h is not expected.
The final RF probe power of 6 MW will allow acceleration of the electron beam to more than 5 MeV. A higher beam energy at the RF gun exit always helps to better control space charge effects, since the transversely defocusing space charge force in a drift scales with 1/ γ , with γ being the Lorentz factor [29]. We assume that an RF stability of around 10 3 or better can be achieved at 6 MW with the same RF system using feedforward and orbit vector corrections in addition.
The current limit to the maximum RF power coupled to the gun cavity is mainly defined by the maximum power limit of the klystron, which is given by the quadratic sum of the forward and reflected power that can theoretically reach the modulator. Due to a high amount of reflection, the sum power comes close to the hard limit of the modulator of 11 MW. Consequently, the forward and therefore the probe power in the gun cavity cannot be further increased. Figure 4 illustrates this fact by showing the forward (blue curve), reflected (yellow curve) and resulting probe power signal (green curve) measured in the RF gun. The red curve gives the sum power that nearly reaches the 11 MW limit of the klystron window. In the future, an RF, in-vacuum circulator will be installed in the waveguide section between klystron and gun cavity. The device provides four ports, two of them with loads, and allows one to control the RF signal direction and flow. The RF signal entering one port is only circulated to its clockwise adjacent port, and all other ports of the device are isolated (specification of isolation ≥ 25 dB). The circulator will filter out the reflected part of the power signal instead of directing it back to the klystron where the reflections can cause damages. This concept provides a way toward an increased maximum RF field at shorter RF pulses in the gun and will enable the intended operation at ARES at an RF probe power of 6 MW.

4. Electron Beam Characterization
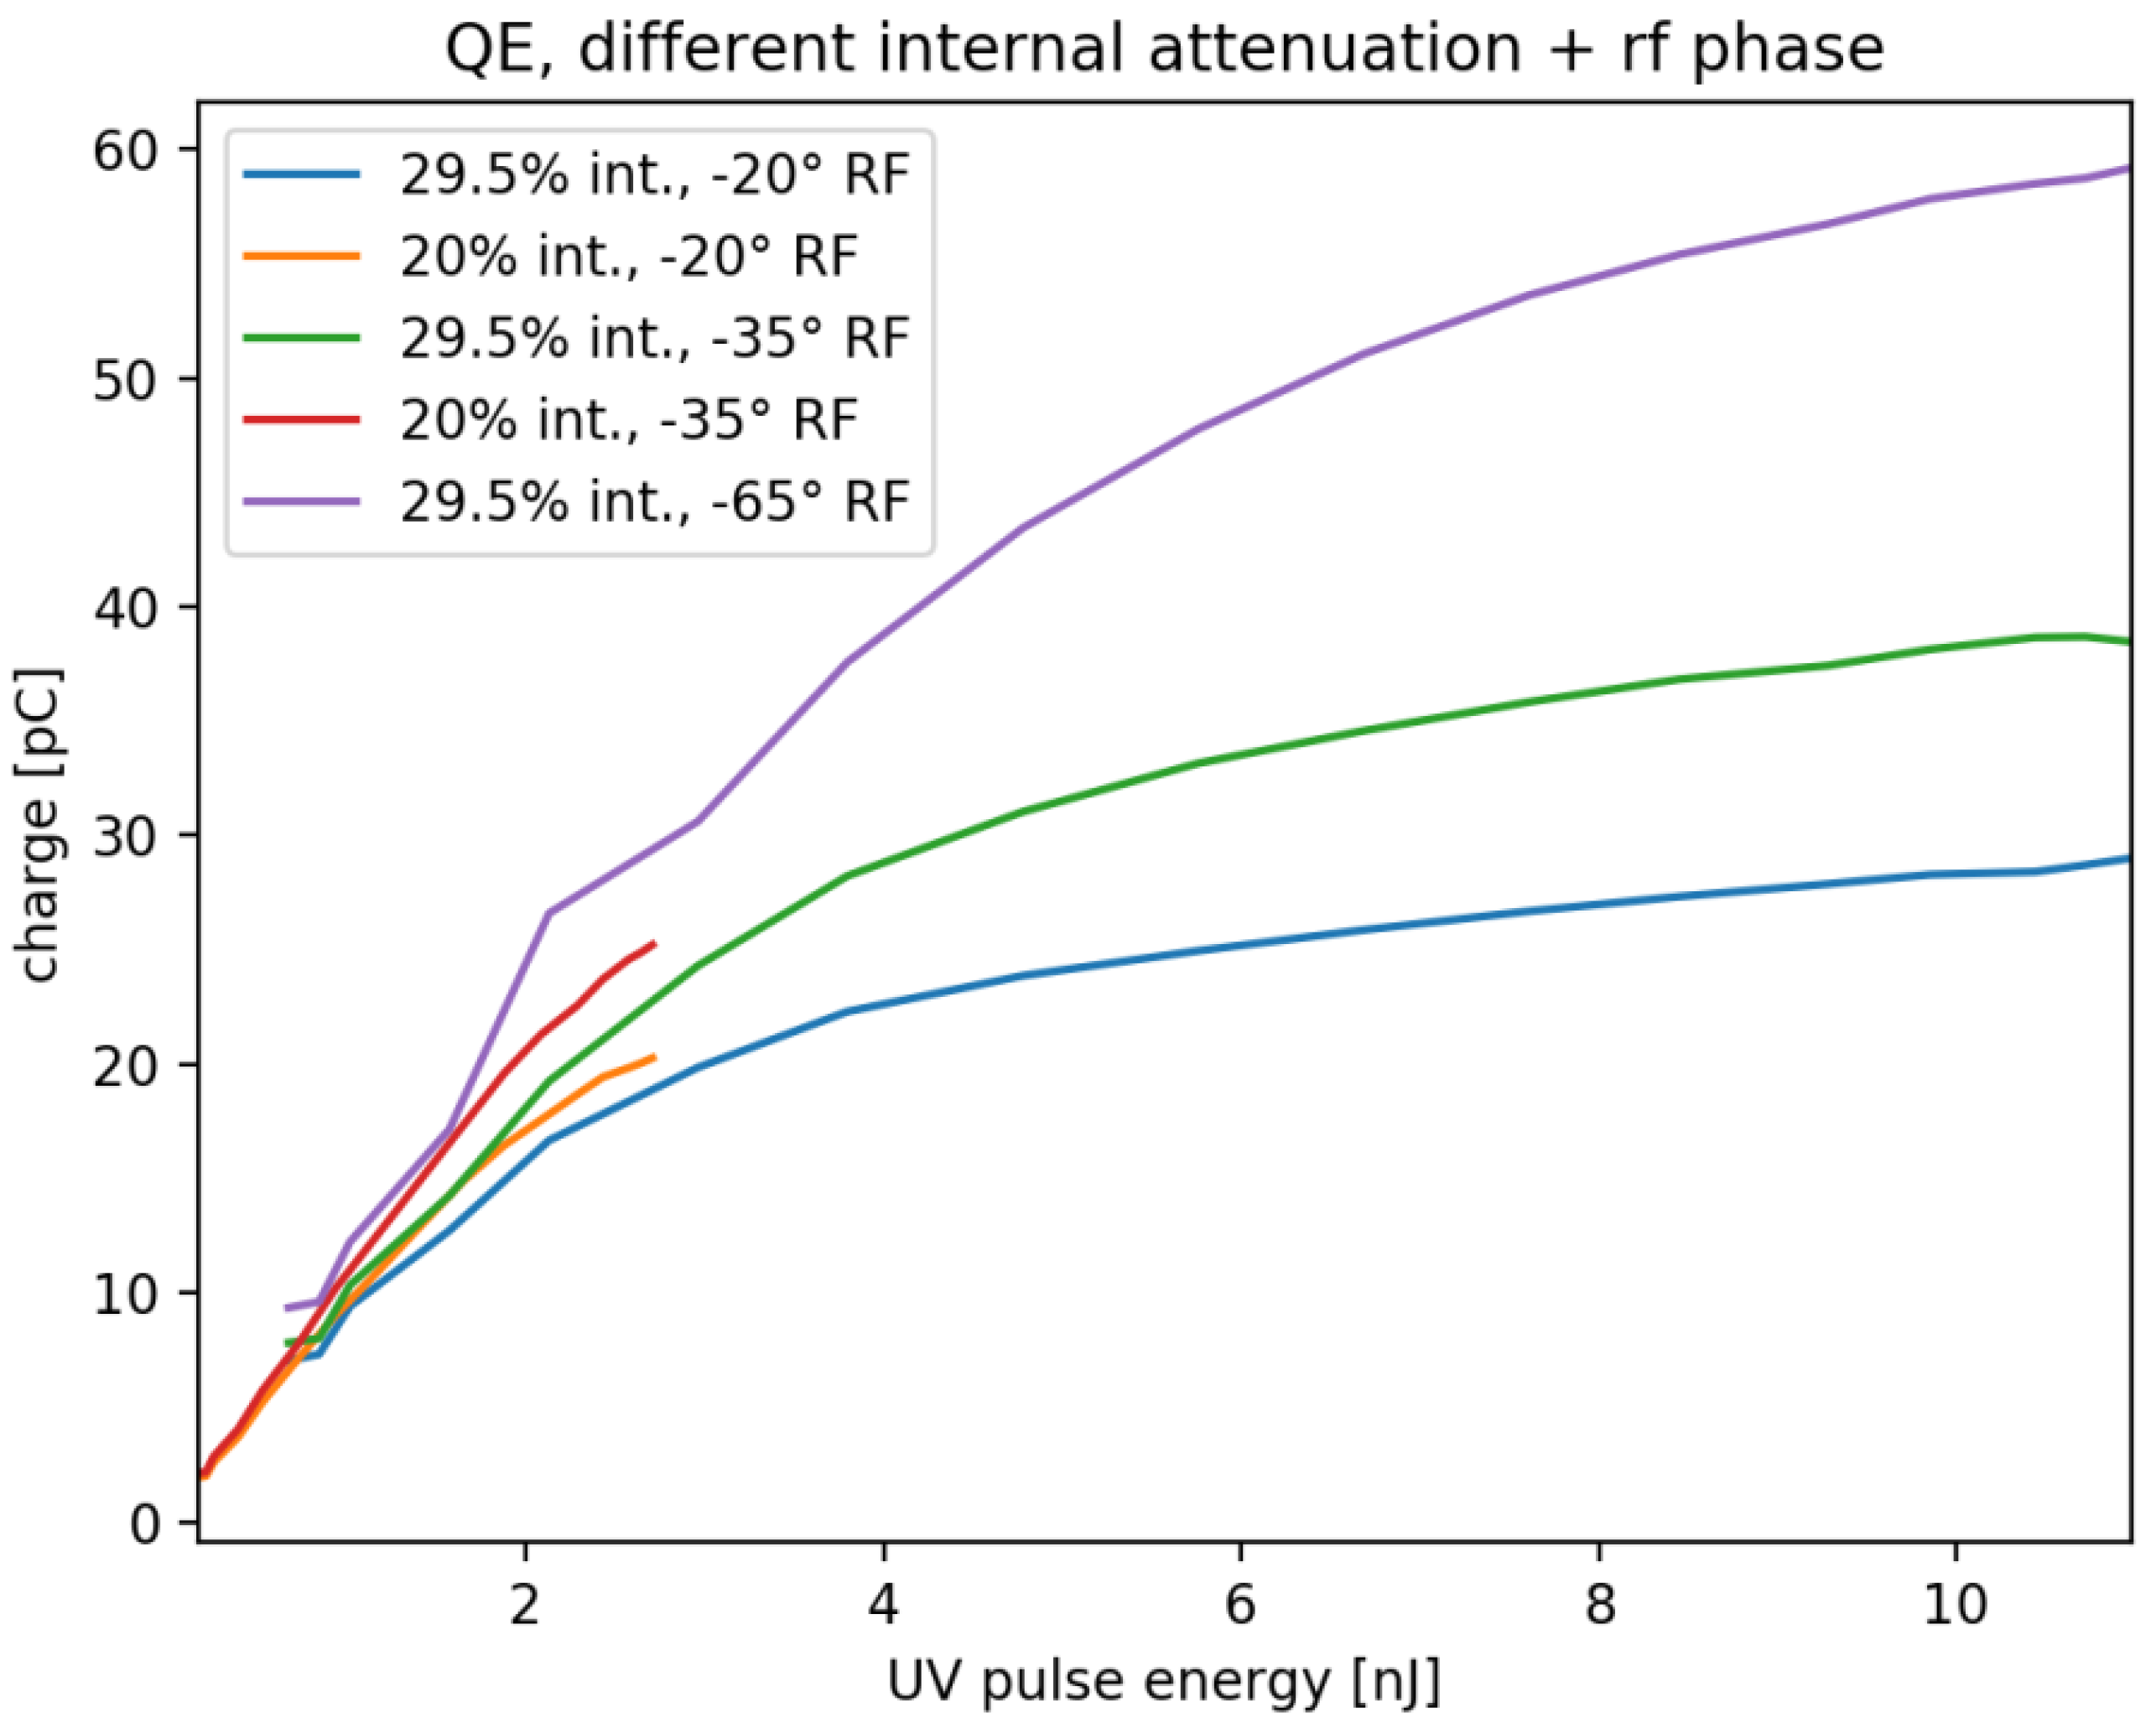
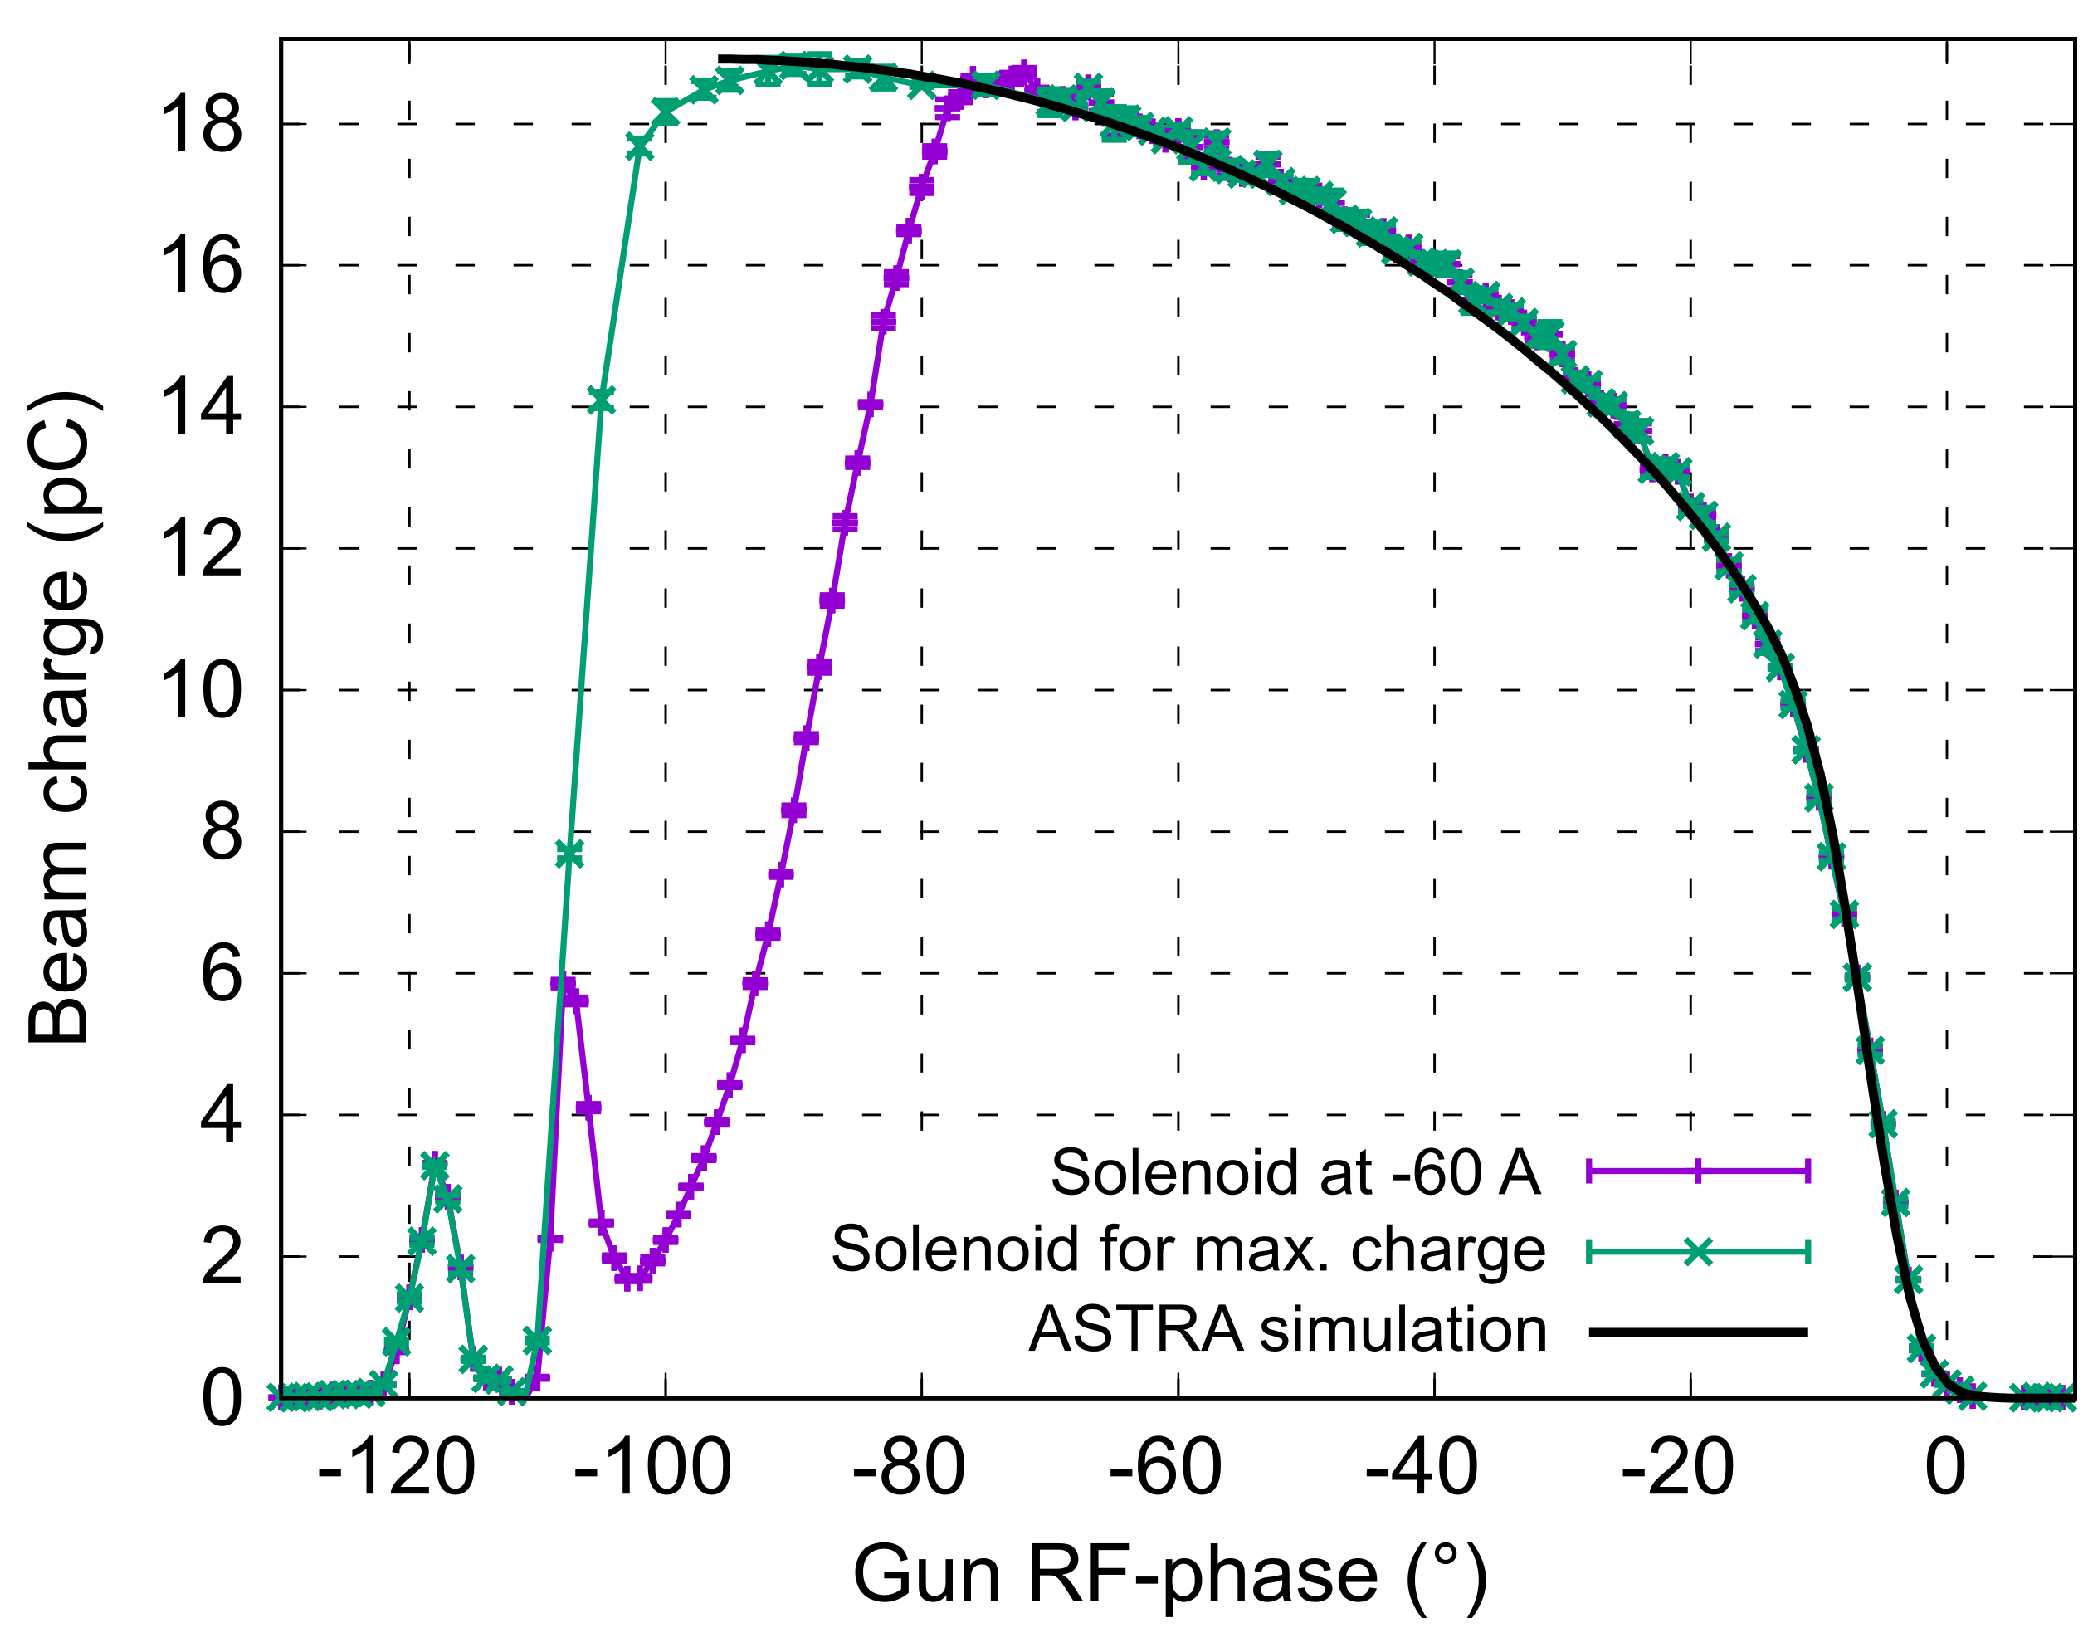
After the first electrons were detected at the end of October 2019, the electron beam was systematically characterized.

4.1. Bunch Charge

We started with bunch charge measurements and the dependency of the generated charge on laser pulse energy and RF parameters. At ARES, the charge can be detected using a Faraday cup and a DaMon in the forward direction of the beamline, and an additional Faraday cup in the dispersive section. A bunch charge of (16.20 ± 0.03) pC at the Faraday cups and (16.70 ± 0.04) pC at the DaMon were measured at the current maximum RF power (3.7 MW) and an RF phase −20 deg. The RF phase is always defined relative to zero-crossing (total RF phase +2 deg) where no net acceleration occurs, and hence, no bunch charge is detected. The charge values that are achieved with the two different measurement techniques agree well. The error bars represent the statistical error due to the combination of jitter sources. It is assumed that the remaining small discrepancy between the two measurement values is due to a systematic error in the instrumentation, such as a small miscalibration of one or both devices.
Following the theory of the photoelectric effect, the parameters which mainly impact the number of electrons extracted from the cathode, i.e., the bunch charge q b , are: the pulse energy of the drive laser E l a s e r and thus the number of incoming photons; and the quality of the photocathode, i.e., the quantum efficiency Q E . The latter is mainly defined by the cathode material itself (metal or semiconductor), the surface roughness and the quality of coating of the cathode plug. The number describes the ratio of emitted electrons to incoming laser photons.
q b = e E l a s e r E p h Q E .
In Formula (1), E p h describes the photon energy determined by the laser wavelength. In addition, the bunch charge can be increased with a higher RF field at the cathode. Due to this so-called Schottky effect, the RF field lowers the effective surface potential of the cathode and more electrons can escape the photocathode material [30].
While the quantum efficiency of the photocathode cannot be varied in a controlled way during a measurement without a cathode exchange, the laser pulse energy and the RF field at the cathode can be modified. Figure 5 shows the bunch charge that was measured with the Faraday cup, and the laser pulse energy was continuously changed by using an attenuator on the laser table. An additional internal attenuator reduced the outcoming laser energies to 20% and 29.5% in order to limit the emitted bunch charge to tens of pC (see legend in Figure 5). The measurement was repeated for three different RF phases, −20 deg relative to zero-crossing, a −35 deg RF phase that corresponds to a maximum beam momentum and a −65 deg RF phase that gives maximum charge output. By increasing the laser energy, the bunch charge grows linearly up to a laser energy of about 2 nJ. The electron emission is limited by the amount of incoming laser photons and can be described with Formula (1). For laser energies above 2 nJ, the charge emission is increasingly space-charge dominated and runs into the space-charge limit (plateau). The electrons experience their own image charge at the cathode surface, which produces a field opposing the applied RF field. The electron emission saturates when the electric field that is triggered by space charge equals the RF field at the surface of the cathode [31].
At ARES, a Cs 2 Te photocathode was used for the beam characterization measurements. Based on the charge measurement data illustrated in Figure 5 and the theory of photon limited emission (see Formula 1), the quantum efficiency was calculated as (4.5 ± 0.2)% for an RF phase of −20 deg and (5.1 ± 0.2)% for an RF phase of −35 deg. The difference between these two numbers was due to the Schottky effect, which increases the amount of extracted electrons from the photocathode at the lower RF phase (here −35 deg). The calculated quantum efficiencies are realistic compared to measurements from other electron sources [32]. The combination of quantum efficiency and available laser pulse energy is sufficient to operate the linac in the charge range of a few pC to several hundreds of pC, extrapolating the data from the measurements shown in Figure 5. During the commissioning phase, the charge was limited to tens of pC in order to control the dark current and to protect diagnostics.
The dependency of the emitted charge on the RF field at the cathode can be illustrated with a Schottky scan. In the experiment, the RF phase has been continuously varied during the charge measurement. Figure 6 shows the result of two Schottky scans done with the DaMon in the gun area of ARES. A constant RF power of 3.6 MW was used for a rapid acceleration of the electrons starting from the cathode.
The purple colored curve in Figure 6 displays the Schottky scan at a constant solenoid current of −60 A. The selected solenoid field allows the full amount of charge to be focused to the DaMon in an RF phase range from 0 deg to around −70 deg. For smaller RF phases, it becomes necessary to adjust the solenoid focusing. This was done in a second measurement run that corresponds to the green data in Figure 6.
In general, the Schottky curve that displays the measured bunch charge against the RF phase and therefore the RF field at the surface of the photocathode can be explained as follows: Starting from an RF-phase above 0 deg, the entire cathode laser pulse impacted the cathode when the gun field was decelerating. Hence, no electrons were accelerated and no charge was detected at the DaMon. Below 0 deg down to approximately −15 deg, an increasingly large part of the laser pulse hits the cathode when the gun field is accelerating. More and more photo-emitted electrons are extracted and the Schottky curve rises. The bunch reaches its target bunch length defined by the laser pulse duration at around −15 deg. Instead of a constant beam current at RF phases below −15 deg (plateau), an additional increase could be detected in Figure 6. Further electrons escape from the photocathode due to the external RF field, lowering the potential barrier. A lowered surface barrier enables non-excited electrons to tunnel into the vacuum and favors the extraction of excited electrons. At around −70 deg, the beam momentum becomes too low. Consequently, the beam is over-focused at the DaMon by a constant solenoid current of −60 A and the measured bunch charge drops in Figure 6 (purple curve). In the case of a variable solenoid current (green curve) that is adjusted to achieve a maximum charge at the DaMon, a further increase of the bunch charge due to Schottky effect up to 14 pC at −90 deg can be observed. Afterwards, the momentum spectrum became too wide to be fully transported to the detector, which led to a decrease in the measured charge in the case of variable solenoid currents (green curve). The two peaks visible on the left side of the scan (purple curve) were due to electrons traveling back and forth in the gun before exiting and to secondary electrons emitted through cathode back-bombardment. These electrons can have high enough energies (namely, close enough to the maximum momentum) to be focused by the gun solenoid and collected by the Faraday cup. Another potential contribution is from very low energy electrons undergoing multiple foci in the gun solenoid field before exiting it.
The phase range from 0 deg to −15 deg in the Schottky curve, where the fraction of the laser pulse hitting the cathode at accelerating field varies, can be used to estimate the duration of the electron bunch emission from the photocathode. Besides the linear slope and the non-linear tails between 0 deg and −15 deg, the Schottky effect is taken into account, even if the effect is small due to the small RF field. The curve in Figure 6 is calibrated with an ASTRA (A Space Charge Tracking Algorithm) simulation using a Gaussian laser pulse as input to simulate the photoelectric effect, and assuming an instantaneous response from the photocathode [33]. As a result, an emission duration of (2.5 ± 0.5) ps (RMS) is estimated.

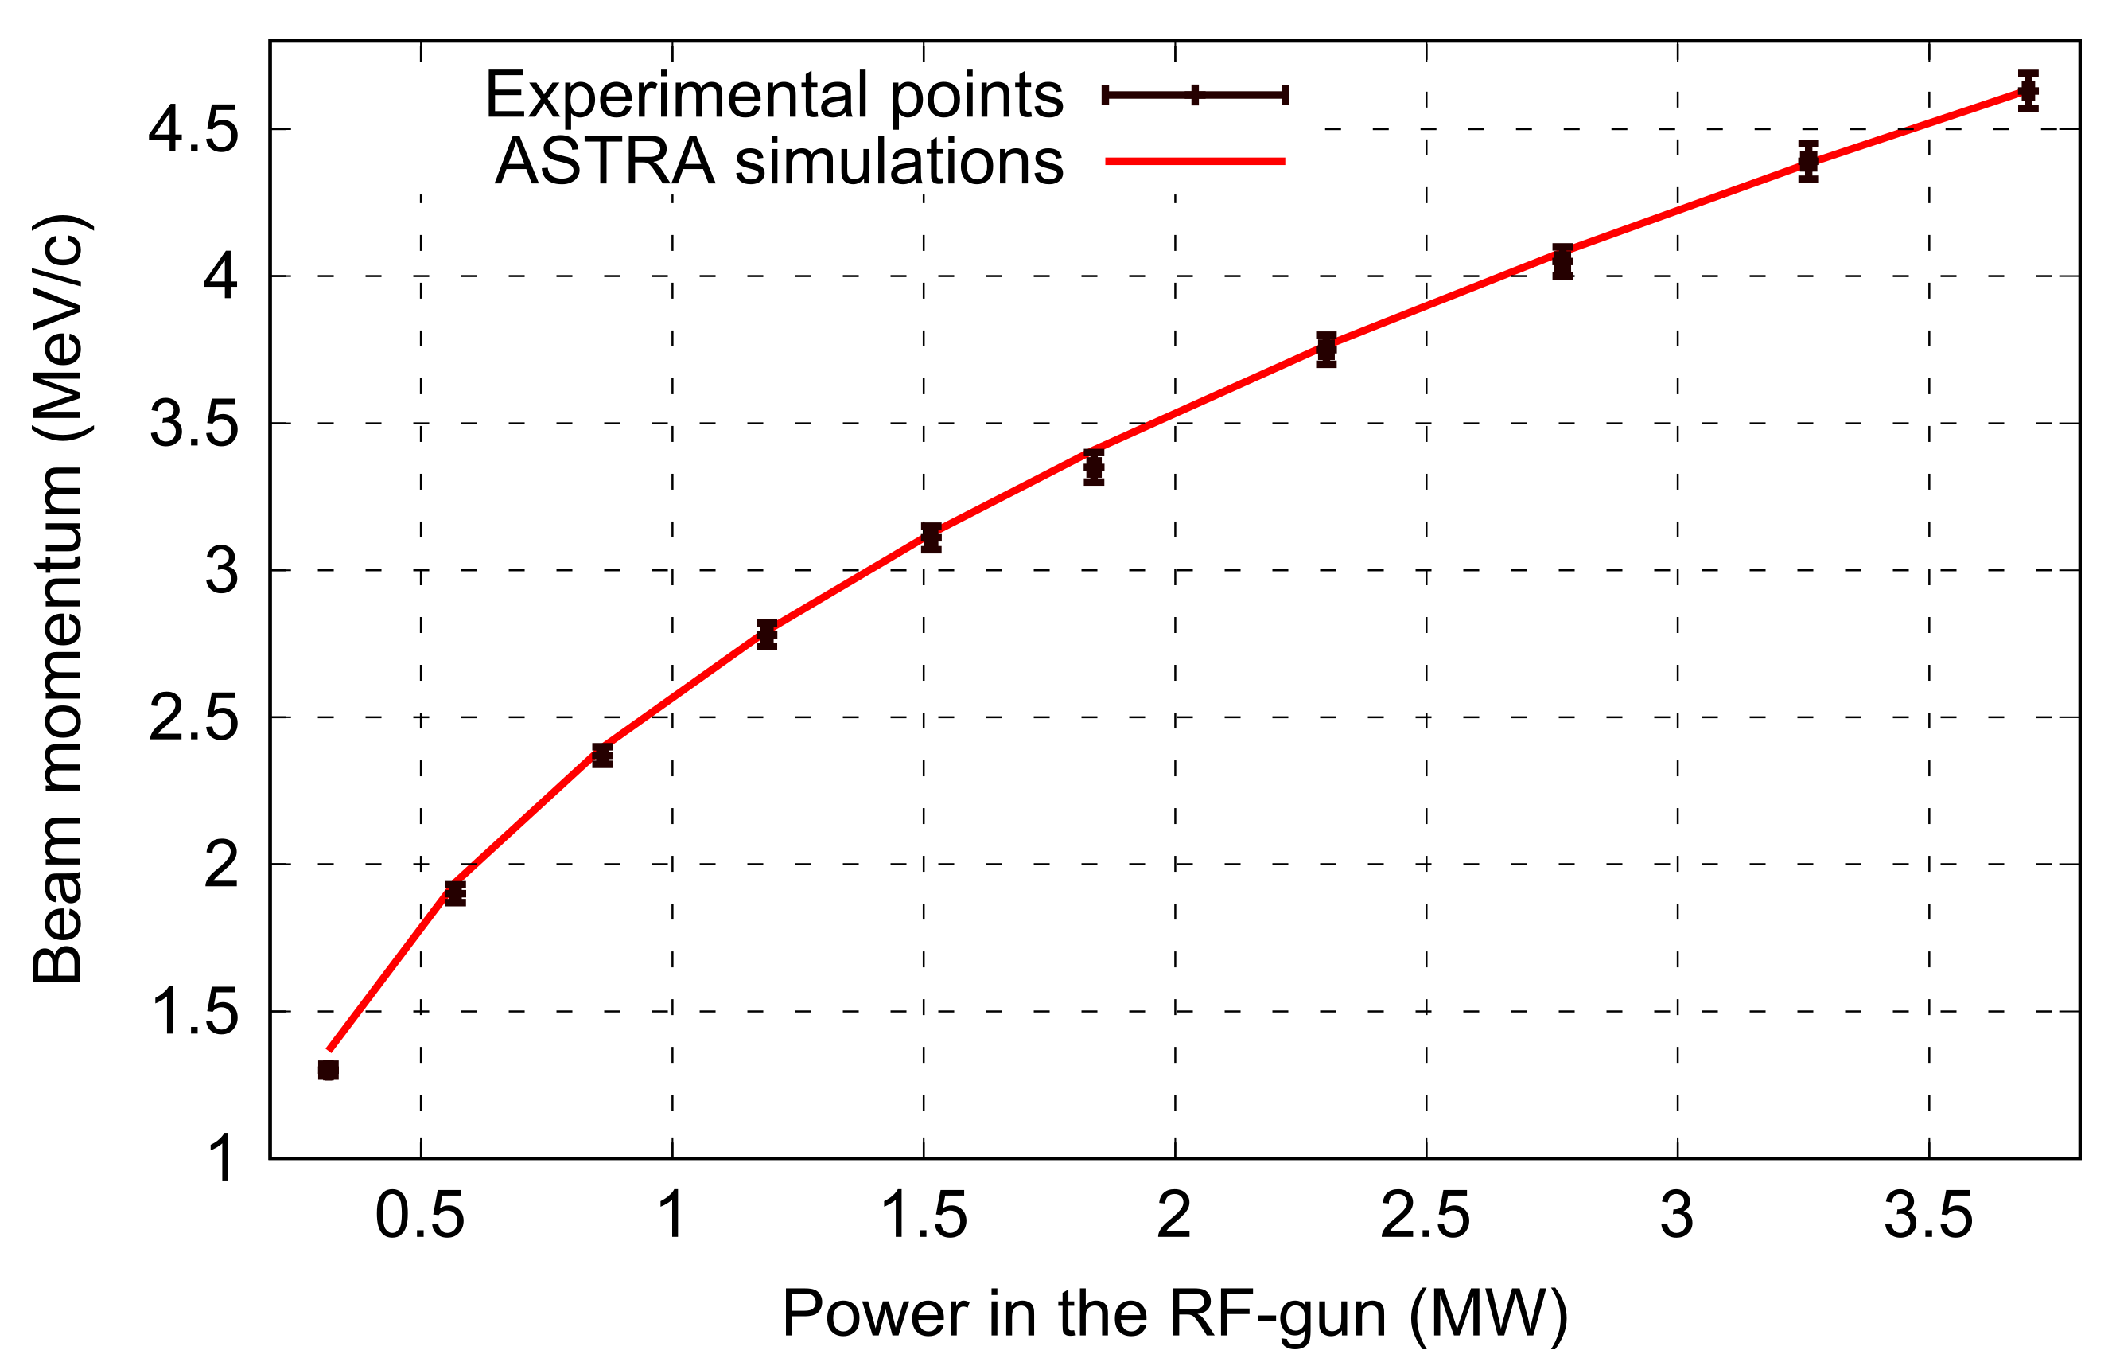
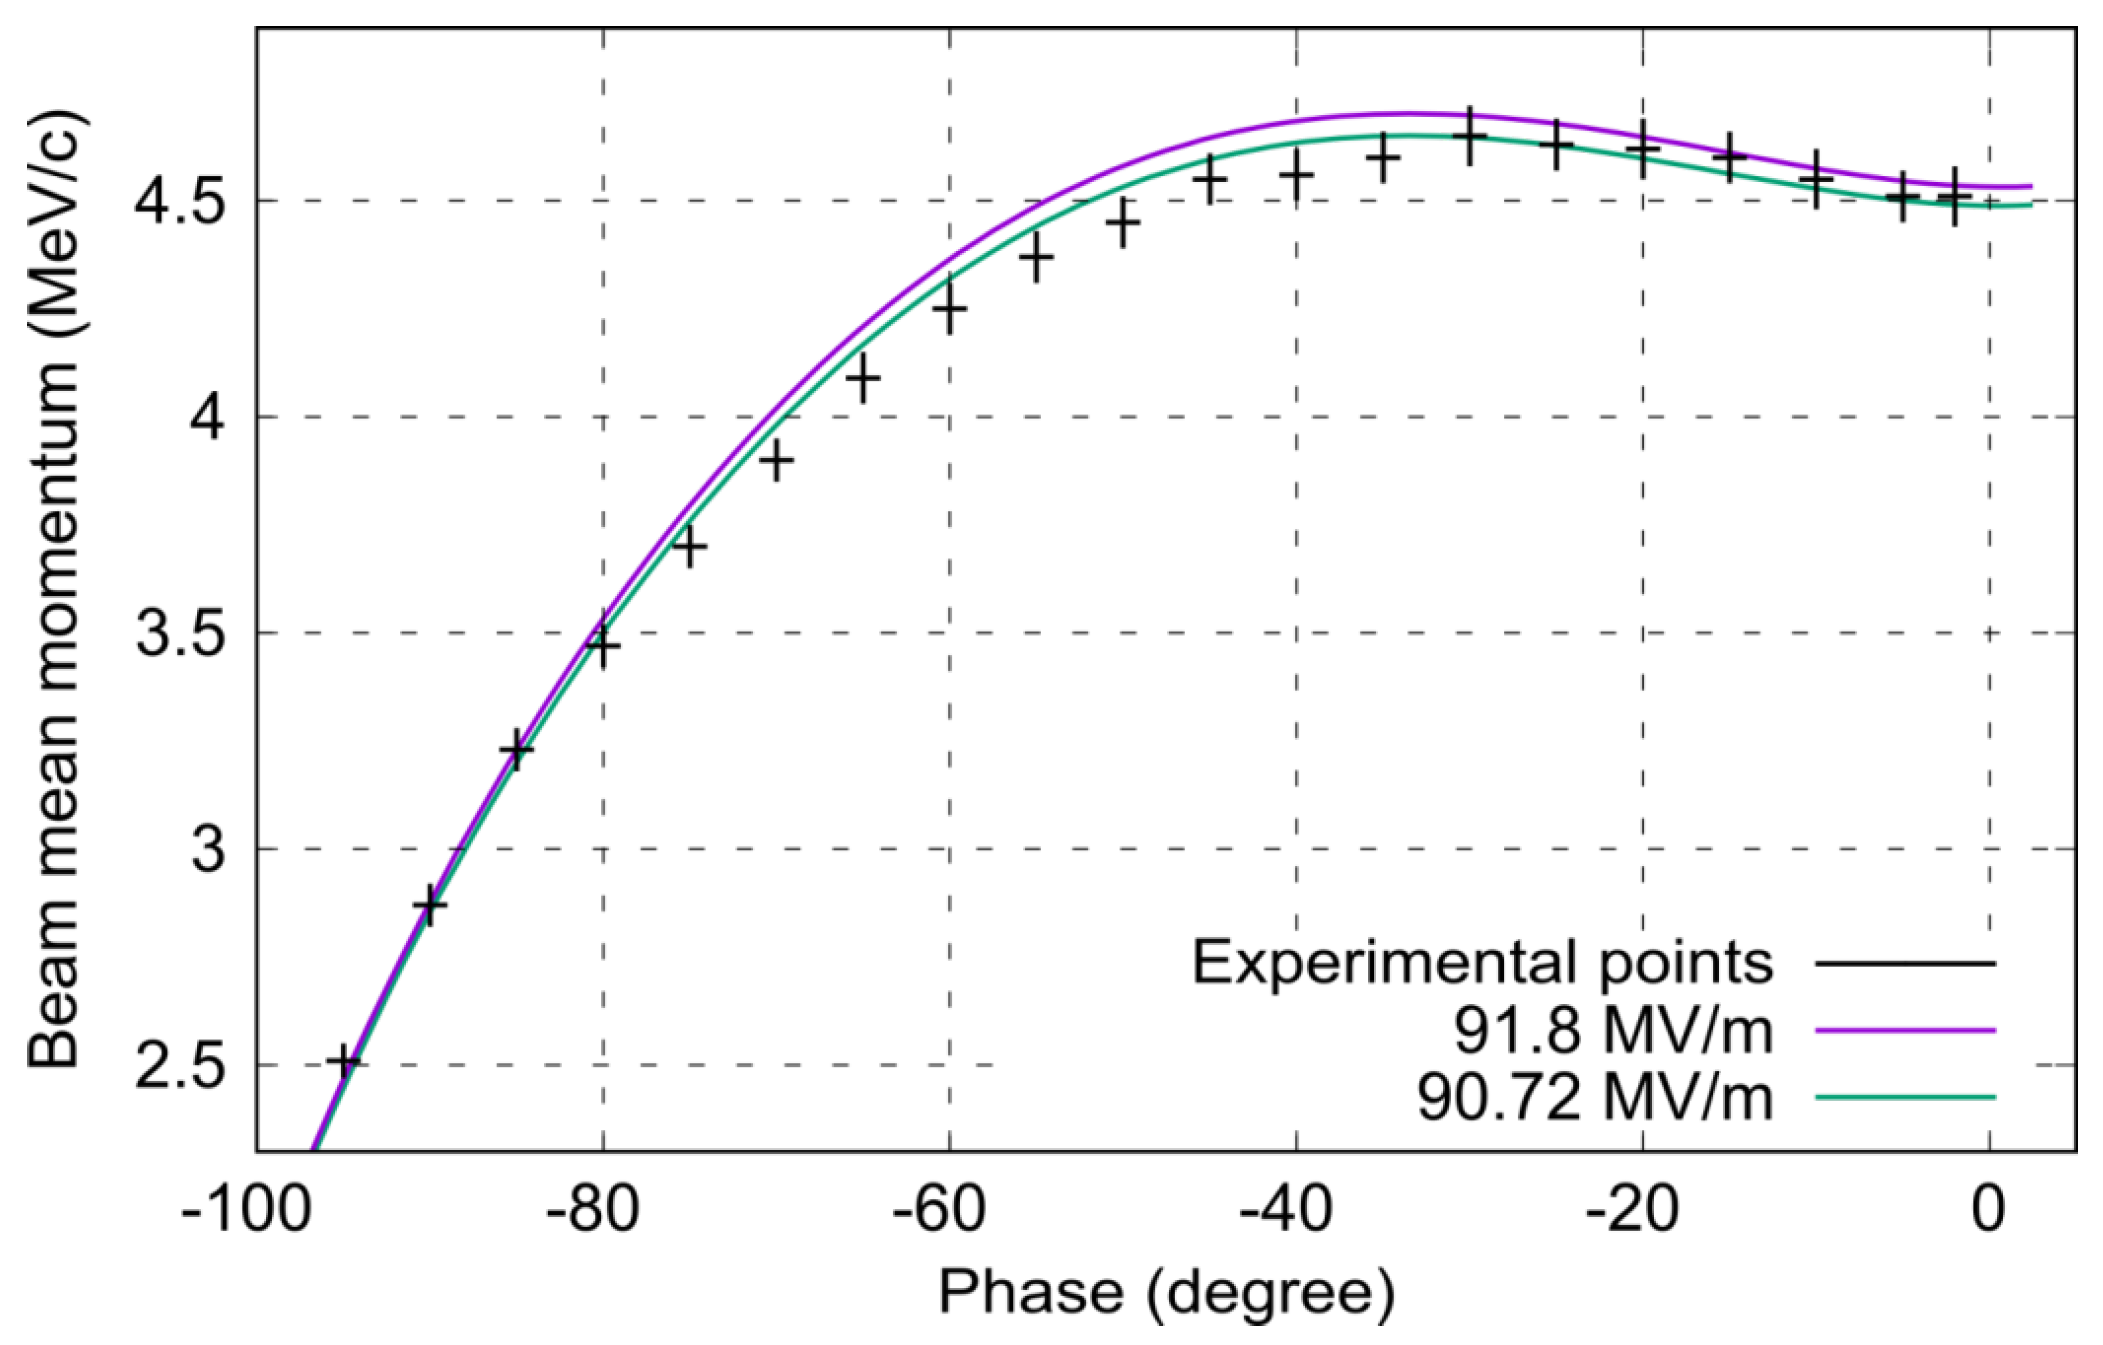
4.2. Beam Momentum and Momentum Spread

The momentum of the electron beam after acceleration in the ARES gun was evaluated using two different methods. The spectrometer dipole in the gun section allowed the beam momentum to be determined based on the dipole current that deflects the beam by 90 deg. The spectrometer dipole was previously calibrated for this measurement.
As an alternative, the first steerer magnet together with a screen can be used for a momentum measurement. In this case the momentum can be calculated using the following formula:
p c = e l L c Δ B Δ x = e l c Δ B Δ θ ,
where e represents the elementary charge and c is the speed of light. l is the steerer magnetic length, L gives the distance between the steerer and imaging screen, Δ x is the displacement of the beam on the screen, Δ B describes the variation of the steerer magnetic field and Δ θ represents the corresponding kick induced by the steerer. Knowing the calibration of the steerer, i.e., the magnetic length and the relation between steerer current and steerer magnetic field, the beam momentum p c can be retrieved from the measurement of Δ x . This technique of determining the momentum is valid as long as L ≫ l and no element is placed between the steerer and screen, which could induce a steerer-dependent kick. These assumptions are valid in the ARES gun setup. Hence, the steerer-based momentum measurement is routinely used as a fast alternative to the spectrometer measurement.
Since the orbit correction at ARES is done with dual-plane steerers, the momentum can be determined using a horizontal and a vertical deflection. The average of the results from both planes is calculated and afterwards compared with the momentum values obtained from spectrometer measurements. The momentum measurement has been done for three different RF power values and a constant RF phase of −20 deg relative to zero-crossing using both techniques. Table 2 summarizes the obtained results.
The results in Table 2 have been determined by acquiring several shots on the screen after the spectrometer dipole and steerer, respectively. The average momentum value was computed as the average of these shots. The error bars in Table 2 represent the standard deviations of the measurements on the screens, and thus, reflect the statistical error, including all jitter sources. No systematic error, such as magnet miscalibration or beam misalignment, has been included. The measurement data from both methods are very well comparable. Differences are within the error bars.
Table 2 also displays the expected dependency of the beam momentum on the RF power. A higher RF power increases the strength of the accelerating field that allows higher electron beam momenta after the gun cavity.
A measurement of the beam momentum during an RF power scan was done. Figure 7 shows the measurement data and the corresponding ASTRA simulation at a constant RF phase of −20 deg from the zero-crossing. The accelerating field used in the ATSRA simulations is based on the shunt impedance of the gun and has been determined via the LLRF law
E ( M V / m ) = 47.67 P ( M W ) .
Formula (3) calculates the accelerating gradient E from the RF probe power P in the gun. The measurement results fit well with the simulation data from ASTRA and verify the LLRF law simultaneously.
Besides the RF power, the injection phase of the electron beam in the RF wave impacts the final beam momentum. An additional scan of the RF phase between −100 deg and 0 deg illustrates this fact (see Figure 8). Maximum acceleration at this RF power in the gun (3.7 MW), and therefore maximum beam momentum, is obtained at around −30 deg, the so called “on-crest” phase. An acceleration gradient between 90.7 and 91.8 MV/m can be estimated from the ASTRA simulations that fit the measurement data best. An acceleration gradient of 91.7 MV/m can be estimated from the LLRF law.
Furthermore, the spectrometer dipole was used to determine the momentum spread of the electron beam. The bunch was deflected by 90 deg (only particles with target momentum) in the dipole and afterwards projected on a screen. Particles with deviating momenta are deflected by angles different from 90 deg. As a consequence, the horizontal beam width that is recorded on the screen gives a measure of the momentum spread. At a maximum RF power of 3.7 MW and an RF phase of −20 deg from the zero-crossing, an RMS momentum spread of (8.84 ± 0.09) keV/c is determined. This value corresponds to 0.19% of the beam average momentum at these RF settings. The momentum spread which is obtained in an ASTRA simulation is slightly different at 11.9 keV/c. However, the ASTRA simulation is based on the emission duration of (2.5 ± 0.5) ps estimated from the Schottky scan as input parameter. The discrepancy in the measured and simulated momentum spread numbers can well be explained with the large error on the emission duration of the beam.

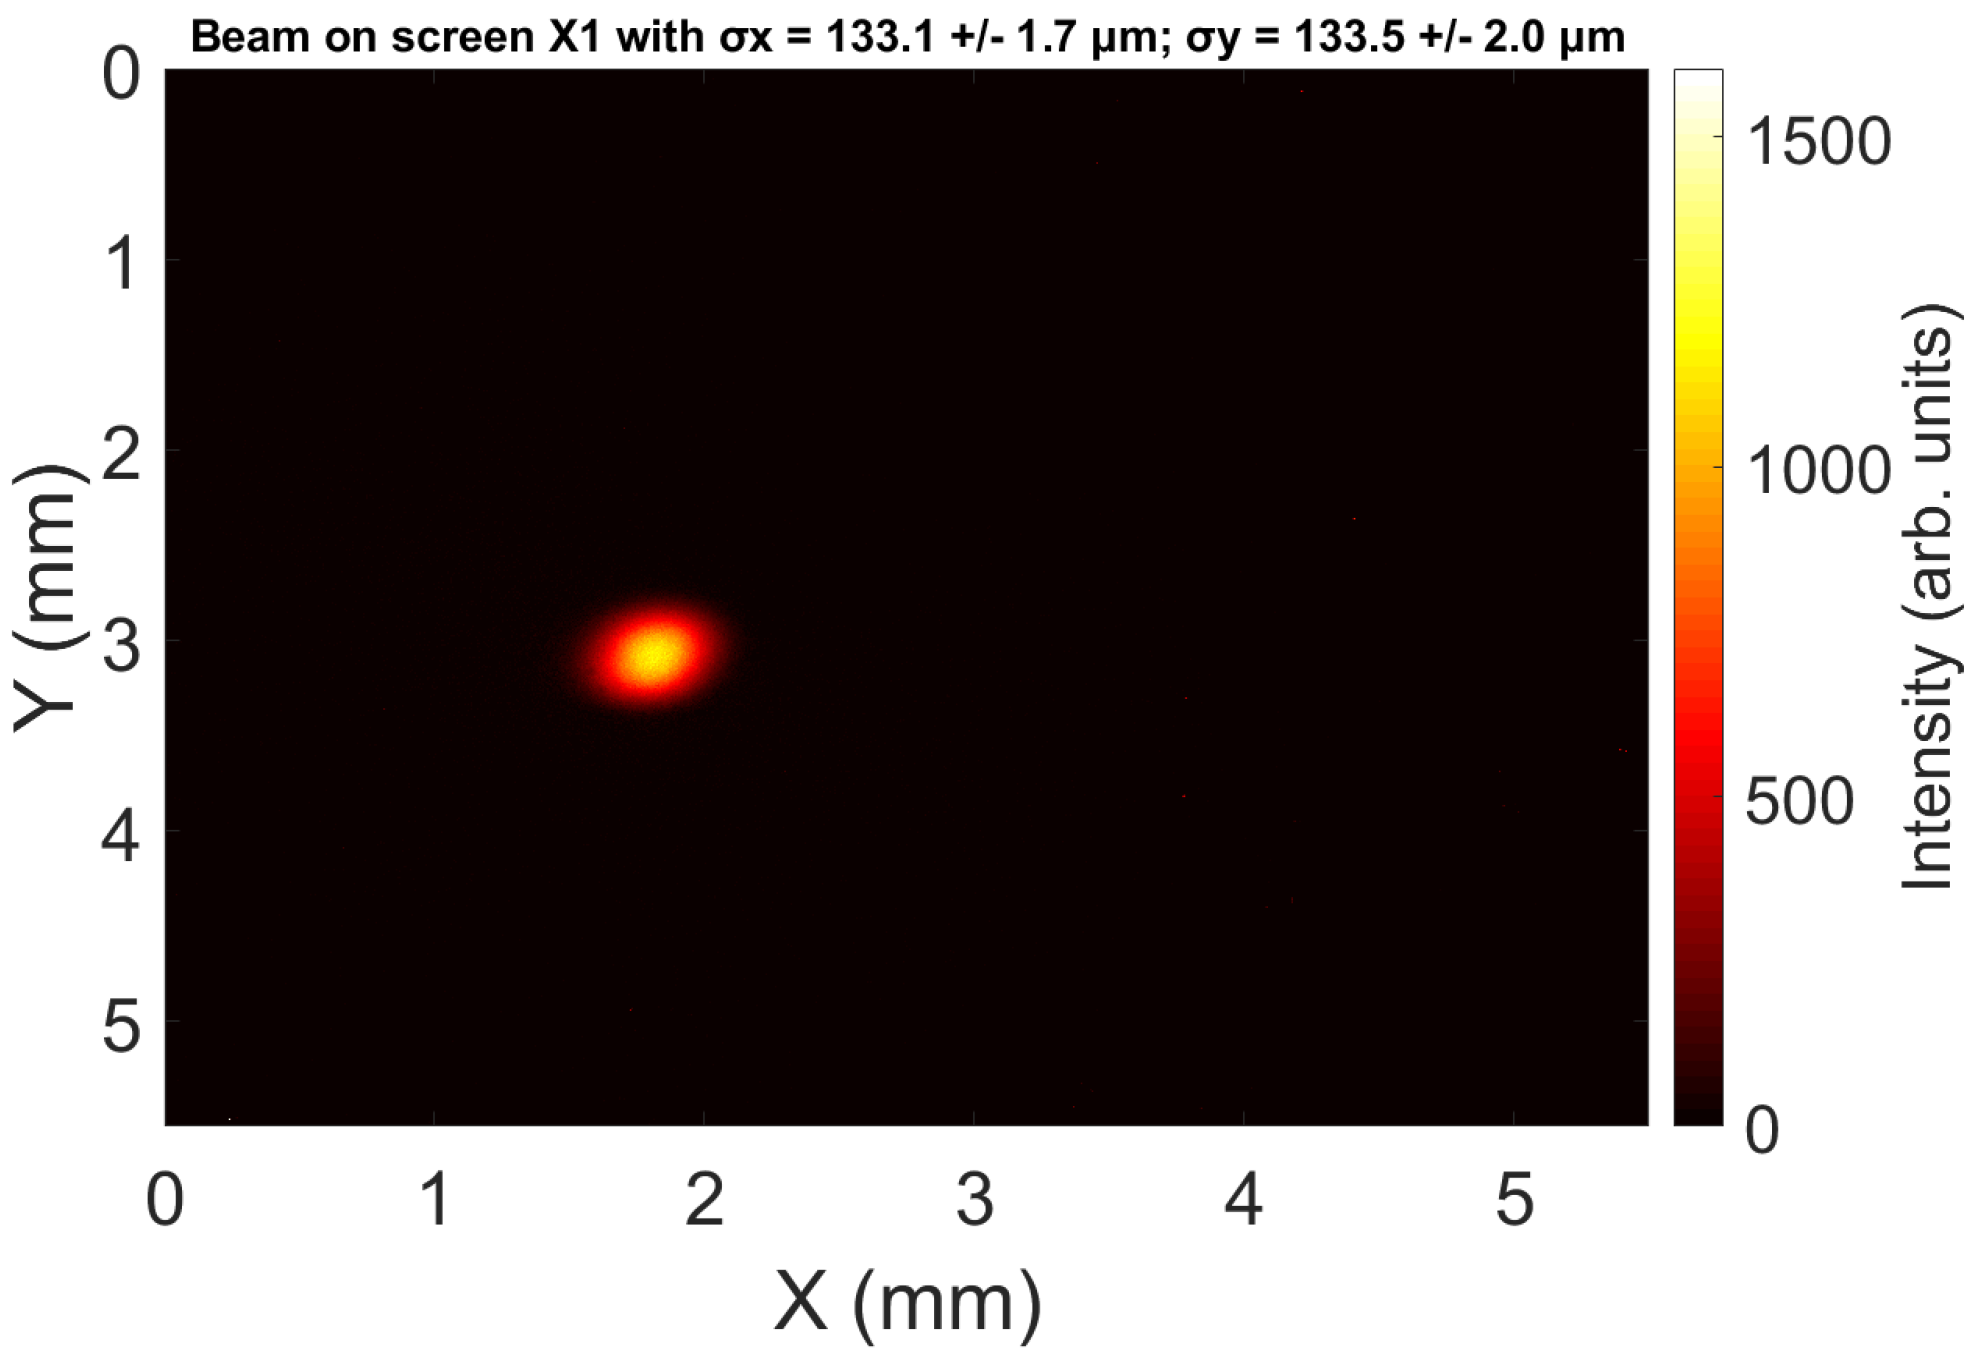
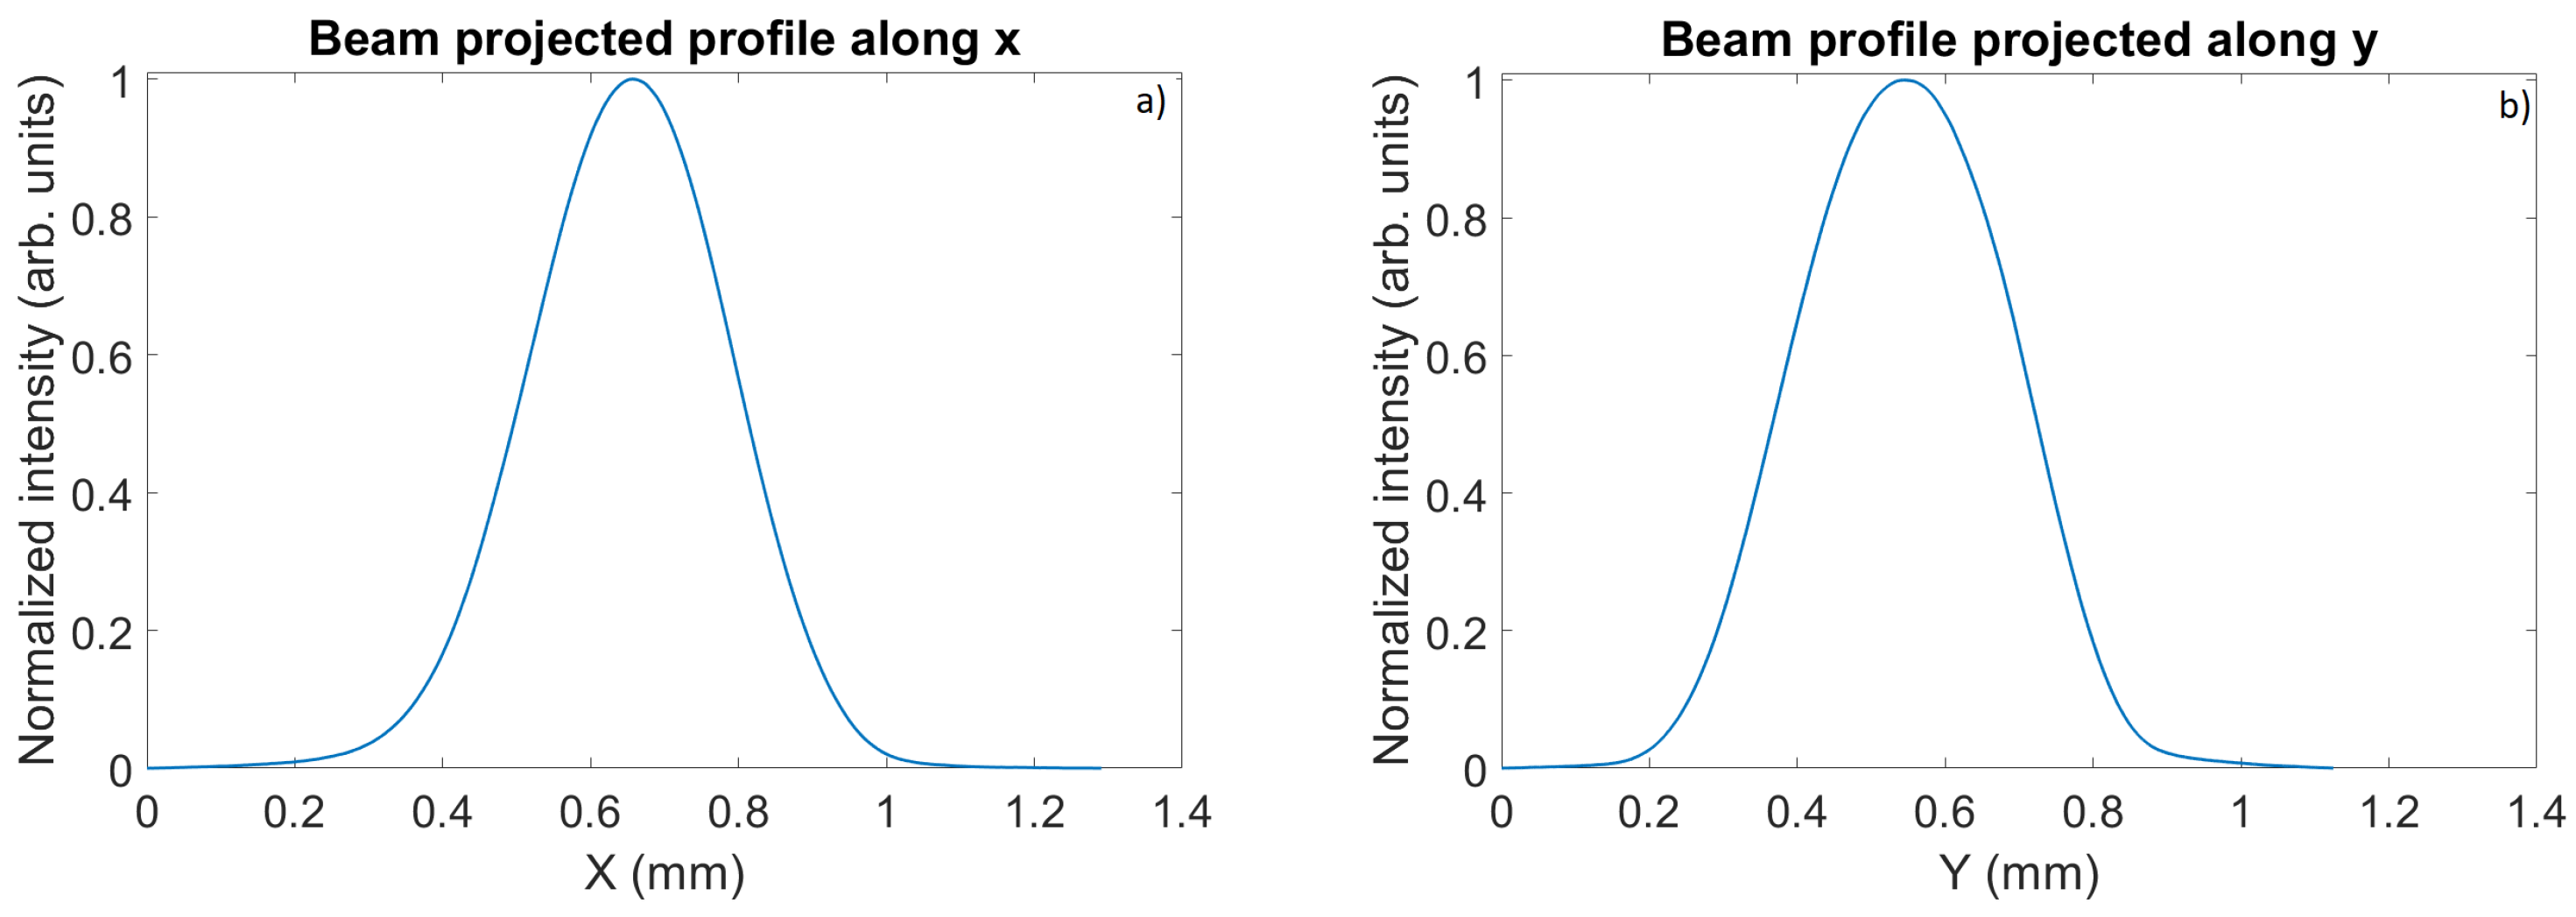
4.3. Transverse Spot Size

The electron beam was projected on the first screen in the ARES beamline, around 1.3 m behind the photocathode. Figure 9 displays the corresponding camera image. The RF gun accelerated the (7.5 ± 0.1) pC beam to a momentum of (4.76 ± 0.07) MeV/c before the solenoid focused it on the screen. An RMS beam size of around 133 μm was measured. The focus of this measurement was on a perfectly symmetric beam. RMS beam widths of σ x = (133.1 ± 1.7) μm and σ y =(133.5 ± 2.0) μm in x and y directions were obtained with a round laser pulse and focused by the pre-aligned solenoid magnet. The symmetry can be also seen in the beam profiles along x and y that are plotted in Figure 10a,b.
Several different measurement techniques may be used to characterize the transverse emittance, including metal grids, a pepper-pot mask and focusing magnets. At the ARES photoinjector, the emittance can be evaluated by scanning the magnetic strength of the gun solenoid and measuring the beam size on one of the screens downstream. Since the solenoid magnet was not completely aligned at this point of commissioning, not enough measurement data of good quality could be taken. As an alternative, a pepper pot and several metal grids are available in the ARES gun section, which allows not only an emittance measurement but the full reconstruction of the 4D phase space. A pepper pot cuts small beamlets out of the electron beam that are afterwards imaged on a screen downstream. The moments can be calculated from the envelope of the beamlet peaks, the beamlet widths and their mean positions on the screen [23]. Similarly, when using metal grids, which are better suited for low-charge bunches, the shadow image of the bars on the screen may be analyzed to calculate the moments. However, due to the initial solenoid misalignment, the pointing of the electron beam must be compensated by operating the spectrometer dipole with a small current. As a consequence, the beam was sheared and the image of the beamlets on the last screen could not be analyzed. Further emittance measurements will be taken after the solenoid alignment is fully finished. Measurement tools and analysis software are available. Meanwhile, ASTRA simulations were performed to estimate the transverse emittance for different laser settings. An emittance below 0.5 mm mrad is expected for a 10 pC electron beam.

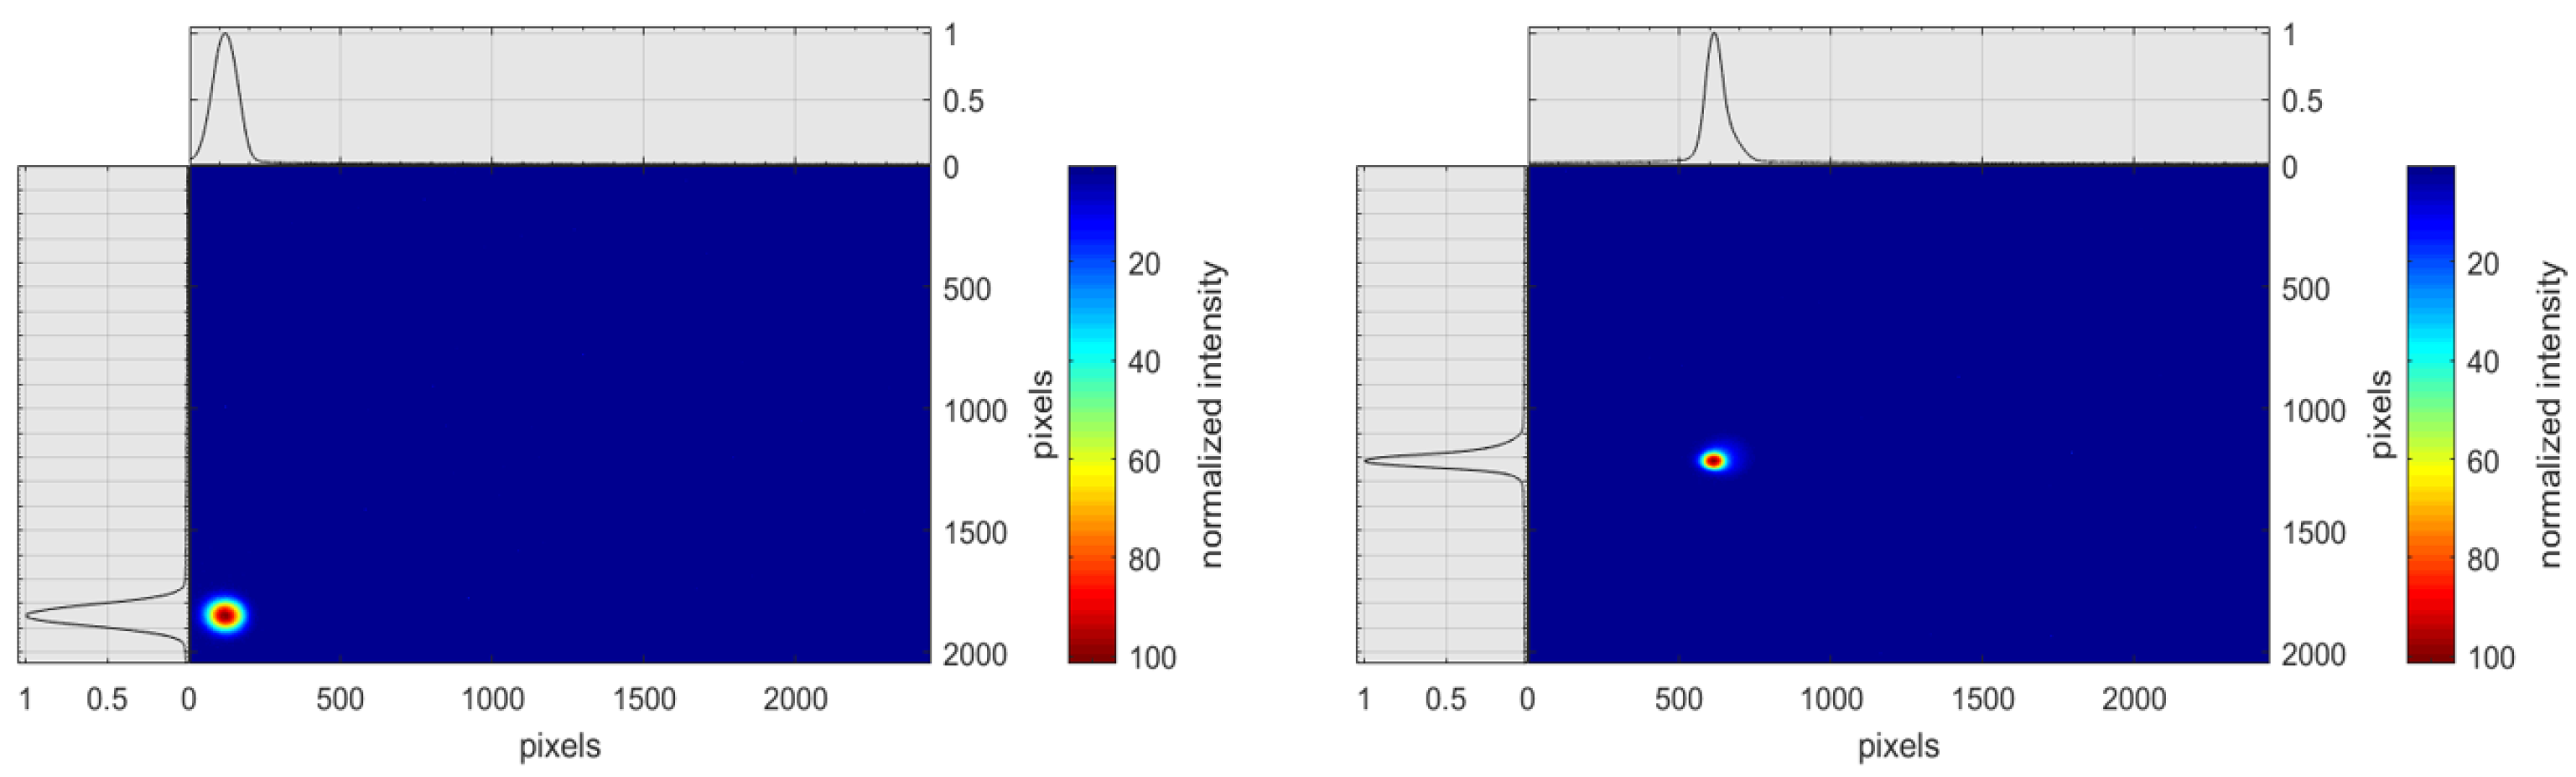
5. Beam-Based Alignment of the Gun Solenoid

The beam-based alignment of the gun solenoid represents an essential step during the RF gun commissioning [34]. In order to preserve the low emittance of an electron beam, a good alignment of the axis of the focusing element with the beam trajectory is mandatory.
During our alignment process, the solenoid current was scanned and the corresponding beam centroid position was recorded on the first screen downstream in the beamline. The obtained data were fit using an algorithm based on linear transfer matrices to compute the solenoid misalignment both in terms of offsets and angles [35]. The script is implemented in a Matlab tool. A Matlab GUI visualizes the movement of the beam spot on the screen with changing solenoid current. In addition, the misalignment in the solenoid position, calculated by the Matlab script, is displayed.
In the first iteration of the solenoid alignment process, data were taken and analyzed for two different power levels (3.6 MW and 2.6 MW) with ++ and +− polarity settings of the double coil gun solenoid, respectively. Table 3 gives an overview of the calculated solenoid offset in x |dX| and y directions |dY|, and its rotation around the x |dX r o t | and y axes |dY r o t | averaged over multiple data sets.
In order to check the validity of the results from the alignment script, a correction to the x offset was experimentally applied. The solenoid was moved by 0.8 mm in the horizontal direction. Figure 11 shows a clear improvement in the beam position on the first screen after the beam-based alignment correction. However, it must be noticed that the beam position changed not only in the horizontal but also slightly in the vertical position. It was observed that the movers of the solenoid are not fully decoupled in their horizontal and vertical motion. Furthermore, since the beam position still changes during a solenoid current scan, further iterations are required in the alignment process. We intend to repeat the procedure in order to perfectly align the ARES gun setup.

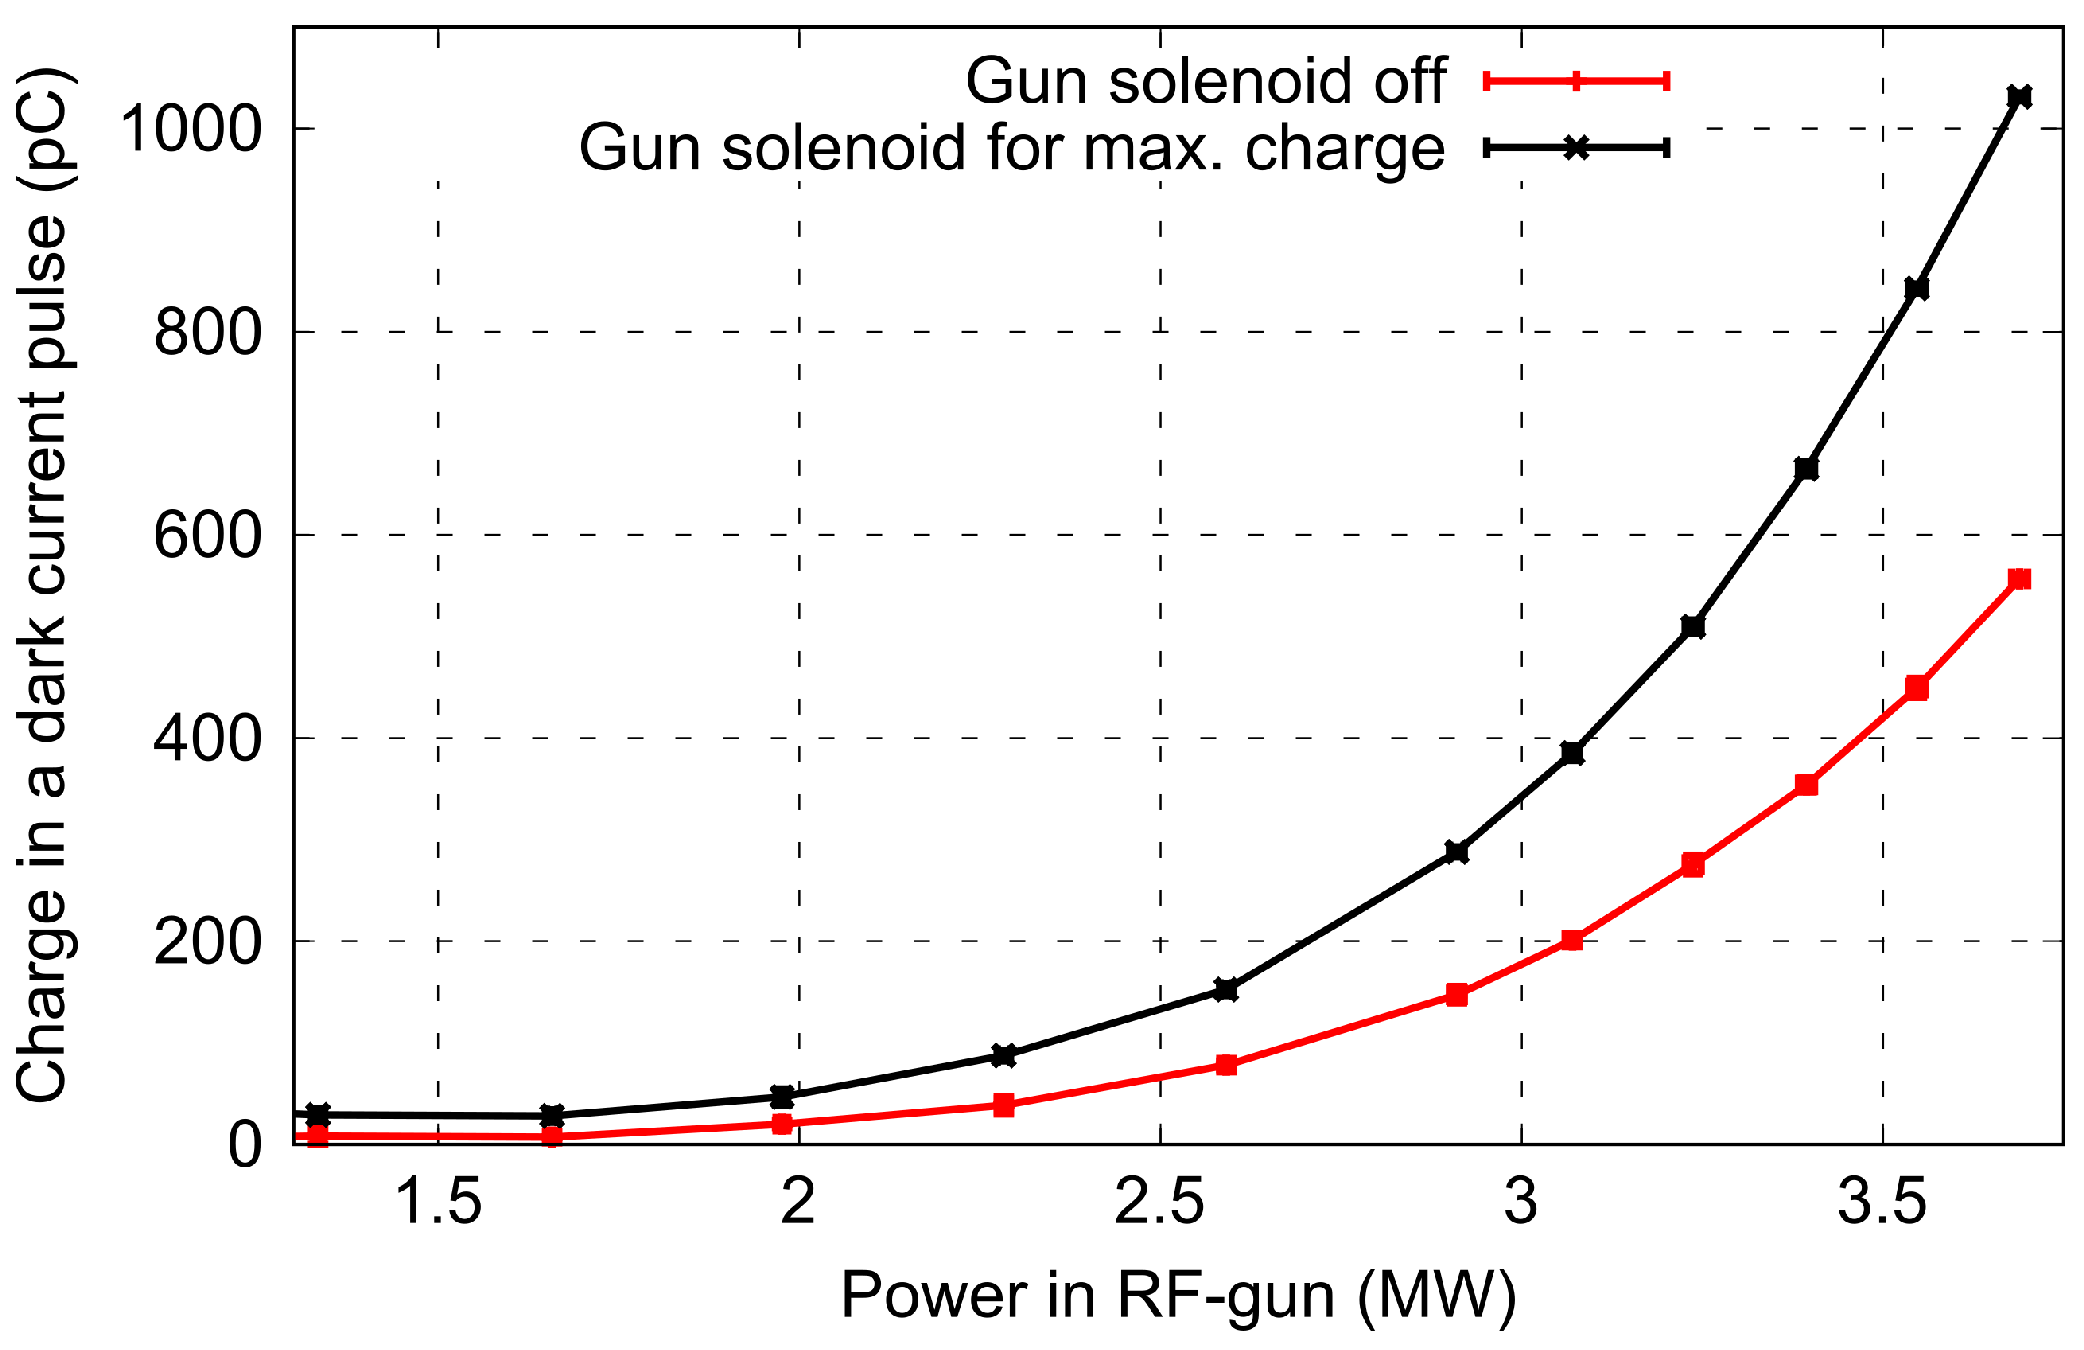
6. Dark Current Characterization

Besides the photo-emitted electrons that form the electron bunch, a significant number of dark current electrons was observed. The intensity of the most prominent dark current spot exceeds that of the photo-electron beam. Therefore, subtraction of the background (including dark current) is required for the analysis of screen images and charge measurement data.
The dependency of the dark current on the RF power is illustrated in Figure 12. A Faraday cup measured the dark current charge (integrated dark current over the RF pulse) while the RF power in the gun cavity was increased. In order to focus the dark current electrons on the Faraday cup and cover the charge of most of the dark current spots, a second measurement sequence was performed with the ARES gun solenoid switched on (see Figure 12 black colored data). The solenoid current was varied to maximize the measured dark current charge at each RF power. Figure 12 confirms that the currently installed RF gun cavity with a Cs 2 Te photocathode delivers a dark charge level of around 1 nC at a maximum RF power of 3.7 MW and an RF pulse length of 4 μs.
The dark current was further characterized by a momentum measurement using one steerer magnet. The momentum of the most significant dark current spot is 4.56 ± 0.06 MeV/c, and thus, close to the maximum momentum of the electron beam. Therefore, it is assumed that the source(s) of the dark current electrons can be mostly found at the back plane of the gun cavity. Probably, field emitters generate dark current, which also explains the increase in the charge while the RF power, and therefore the field at the cavity surface is maximized.
Further investigations of the dark current are planned, and strategies to lower the dark current will be tested in order to avoid activation of the machine and to enable high quality, low charge (sub-pC range) user experiments at ARES. The gun was exchanged with an upgraded version of the ARES gun cavity with a different geometry in spring 2020. This new gun was especially designed for SINBAD ARES. An additional solenoid can be installed around the cavity that will allow advanced emittance compensation in a high charge mode. A characterization of the electron beam and of the dark current generated from the new gun is ongoing.

7. Conclusions and Outlook

This paper summarized the RF photoinjector commissioning results for ARES gun 1. The RF conditioning of the first ARES gun cavity was started, and the first iterations of the alignment procedure of the solenoid magnet were finished. Afterwards, we characterized the beam quality in terms of charge, momentum, momentum spread and beam size. Furthermore, we investigated the dependencies of these parameters on RF settings (power, phase). All measured beam parameters fulfill the requirements to operate the ARES linac with this electron source. However, the large amount of dark current generated in the RF photoinjector prompted the exchange of the gun cavity.
After the exchange of the gun with one with an upgraded design and the subsequent RF conditioning, the electron beam properties will be measured at the exit of the RF photoinjector again. As a next step, it is planned to guide the beam through the two traveling wave structures of the ARES linac section. Here, the beam can be accelerated up to 155 MeV. The infrastructure of the linac is well prepared. The two linac cavities were fully RF conditioned during the last months. All magnets, including eight solenoids around the traveling wave structures, several quadrupoles and several steerer magnets, were installed. All diagnostics, such as screen stations and a toroid for charge measurements, are part of the control system and ready for operation. Figure 13 shows the complete setup of the ARES linac section.
In the upcoming months, we aim to continue the commissioning of the ARES linac. The parameters of the high energy electron beam must be determined after the linac. Some first iterations to minimize the bunch length via velocity bunching are foreseen. Furthermore, the experimental area has been commissioned [36]. In this area, we will start the testing of dielectric structures as ultra-compact particle accelerators in the context of the ACHIP (Accelerator on a Chip International Program) collaboration [37,38,39,40]. The setup of the experimental chamber, including the ACHIP experiment, is finished and ready for operation.
In 2021, the installation of a bunch compressor [41] and the Polarix TDS [6] will bring ARES closer to the goal of generating and characterizing fs to sub-fs short electron bunches. New diagnostics, such as the low-charge, beam profile monitor STRIDENAS (Strip Detector for Novel Accelerators at SINBAD) will be tested in the future [42].

Author Contributions

Investigation, E.P., F.B., U.D., L.G., F.J., S.J.-M., M.K., W.K., F.L., B.M., D.M., F.M., T.V. and S.Y.; supervision, R.A.; writing—original draft, E.P.; writing—review and editing, R.A., F.B., U.D., L.G., F.J., S.J.-M., M.K., W.K., F.L., B.M., D.M., F.M., T.V. and S.Y. All authors have read and agreed to the published version of the manuscript.

Funding

Work supported by ATHENA, a project of the Helmholtz Association.

Institutional Review Board Statement

Not applicable.

Informed Consent Statement

Not applicable.

Data Availability Statement

Not applicable.

Acknowledgments

The authors acknowledge the work of all the DESY technical groups involved in planning, construction and operation of the ARES facility. Our special thanks go to Sven Lederer, Jakob Hauser (MVS group), Stefan Baark, Olaf Rasmussen (MEA group), Markus Hüning, Ingo Peperkorn, Jörg Herrmann (MIN group), Sven Pfeiffer, Mikheil Titberidze (MSK group), Lutz Winkelmann, Caterina Vidoli (FSLA group), Gero Kube, Artem Novokshonov, Matthias Werner, Gunnar Priebe (MDI group), Tim Wilksen, Olaf Hensler (MCS group), Christian Helwich, Bastian Belusic (MKK group), Klaus Flöttmann and Reinhard Brinkmann (MPY group). The DESY affiliated authors acknowledge support from DESY (Hamburg, Germany), a member of the Helmholtz Association HGF. In addition, we would like to mention our collaboration partners at ATHENA and ACHIP. The Helmholtz Association funds the ATHENA project. ACHIP related activities are partially funded by the Gordon and Betty Moore foundation (GBMF4744). Access via the ARIES-TNA program will partially be sponsored via the European Unions Horizon 2020 Research and Innovation programme under grant agreement number 730871. The AXSIS project has received funding from the European Research Council under the European Union’s Seventh Framework Programme (FP/2007–2013)/ERC, grant agreement number 609920.

Conflicts of Interest

The authors declare no conflict of interest.

References

  1. Dorda, U.; Marchetti, B.; Zhu, J.; Mayet, F.; Kuropka, W.; Vinatier, T.; Vashchenko, G.; Galaydych, K.; Walker, P.; Marx, D.; et al. Status and objectives of the dedicated accelerator R&D facility “SINBAD” at DESY. Nucl. Instrum. Methods Phys. Res. A 2018, 909, 239–242. [Google Scholar]
  2. Marchetti, B.; Assmann, R.; Brinkmann, R.; Burkart, F.; Dorda, U.; Floettmann, K.; Hartl, I.; Hillert, W.; Huening, M.; Jafarinia, F.; et al. SINBAD-ARES—A Photo-Injector for external Injection Experiments in novel Accelerators at DESY. J. Phys. Conf. Ser. 2020, 1596, 012036. [Google Scholar] [CrossRef]
  3. Marchetti, B.; Assmann, R.; Dorda, U.; Zhu, J. Conceptual and Technical Design Aspects of Accelerators for External Injection in LWFA. Appl. Sci. 2018, 8, 757. [Google Scholar] [CrossRef] [Green Version]
  4. Panofski, E.; Assmann, R.W.; Burkart, F.; Dorda, U.; Floettmann, K.; Huening, M.; Marchetti, B.; Marx, D.; Mayet, F.; Walker, P.A.; et al. Status report of the SINBAD-ARES RF photoinjector and linac commissioning. J. Phys. Conf. Ser. 2019, 1350, 012019. [Google Scholar] [CrossRef]
  5. Zhu, J.; Assmann, R.W.; Dohlus, M.; Dorda, U.; Marchetti, B. Sub-fs electron bunch generation with sub-10-fs bunch arrival-time jitter via bunch slicing in a magnetic chicane. Phys. Rev. Accel. Beams 2016, 19, 054401. [Google Scholar] [CrossRef] [Green Version]
  6. Marx, D.; Assmann, R.; Craievich, P.; Floettmann, K.; Grudiev, A.; Marchetti, B. Simulation studies for characterizing ultrashort bunches using novel polarizable X-band transverse deflection structures. Sci. Rep. 2019, 9, 19912. [Google Scholar] [CrossRef] [PubMed]
  7. Craievich, P.; Bopp, M.; Braun, H.H.; Citterio, A.; Fortunati, R.; Ganter, R.; Kleeb, T.; Marcellini, F.; Pedrozzi, M.; Prat, E.; et al. Novel X-band transverse deflection structure with variable polarization. Phys. Rev. Accel. Beams 2020, 23, 112001. [Google Scholar] [CrossRef]
  8. Marchetti, B.; Grudiev, A.; Craievich, P.; Assmann, R.; Braun, H.H.; Lasheras, N.C.; Christie, F.; D’Arcy, R.; Fortunati, R.; Ganter, R.; et al. Experimental demonstration of novel beam characterization using a polarizable X-band transverse deflection structure. Sci. Rep. 2021, 11, 3560. [Google Scholar] [CrossRef]
  9. Marchetti, B.; Assmann, R.; Behrens, C.; Brinkmann, R.; Dorda, U.; Floettmann, K.; Hartl, I.; Huening, M.; Nie, Y.; Schlarb, H.; et al. Electron-beam manipulation techniques in the SINBAD Linac for external injection in plasma wake-field acceleration. Nucl. Instrum. Methods Phys. Res. A 2016, 829, 278–283. [Google Scholar] [CrossRef] [Green Version]
  10. Zhu, J. Design Study for Generating Sub-Femtosecond to Femtosecond Electron Bunches for Advanced Accelerator Development at SINBAD. Ph.D. Thesis, Hamburg University, Hamburg, Germany, 2017. [Google Scholar]
  11. Mayet, F. Acceleration and Phase Space Manipulation of Relativistic Electron Beams in Nano- and Micrometer-Scale Dielectric Structures. Ph.D. Thesis, Hamburg University, Hamburg, Germany, 2019. [Google Scholar]
  12. Burkart, F. DESY News. Accelerate Smarter with Artifical Intelligence. Available online: https://www.desy.de/news (accessed on 6 November 2020).
  13. Accelerator Research and Innovation for European Science and Society. Available online: https://aries.web.cern.ch (accessed on 30 June 2021).
  14. Matlis, N.; Ahr, F.; Calendron, A.L.; Cankaya, H.; Cirmi, G.; Eichner, T.; Fallahi, A.; Fakhari, M.; Hartin, A.; Hemmer, M.; et al. Acceleration of electrons in THz driven structures for AXSIS. Nucl. Instrum. Methods Phys. Res. A 2018, 909, 27–32. [Google Scholar] [CrossRef]
  15. Hada, M.; Hirscht, J.; Zhang, D.; Manz, S.; Pichugin, K.; Mazurenko, D.; Bayesteh, S.; Delsim-Hashemi, H.; Floettmann, K.; Huening, M.; et al. REGAE: New Source for Atomically Resolved Dynamics. In Research in Optical Sciences; Optical Society of America: Washington, DC, USA, 2012; p. JT2A.47. [Google Scholar]
  16. Titberidze, M.; Felber, M.; Kozak, T.; Lamb, T.; Müller, J.; Schlarb, H.; Schulz, S.; Sydlo, C.; Zummack, F. First results on Femtosecond Level Photocathode Laser Synchronization at the SINBAD Facility. In Proceedings of the 8th International Beam Instrumentation Conferenc (IBIC’19), Malmo, Sweden, 8–12 September 2019; pp. 564–567. [Google Scholar] [CrossRef]
  17. Spicer, W.; Herrera-Gómez, A. Modern Theory and Applications of Photocathodes. In Proceedings of the SPIE’s 1993 Interantional Symposium on Optics, Imaging and Instrumentation, Beijing, China, 20 February 1993. [Google Scholar]
  18. Dowell, D.; Bazarov, I.; Dunham, B.; Harkay, K.; Hernandez-Garcia, C.; Legg, R.; Padmore, H.; Rao, T.; Smedley, J.; Wan, W. Cathode R&D for future light sources. Nucl. Instrum. Methods Phys. Res. A 2010, 622, 685–697. [Google Scholar]
  19. Light Conversion, Pharos SP-06-200-PP. Available online: http://www.lightcon.com/Product/PHAROS.html (accessed on 30 June 2021).
  20. Wiebers, C.; Holz, M.; Kube, G.; Nölle, D.; Priebe, G.; Schröder, H.C. Scintillating Screen Monitors for Transverse Electron Beam Profile Diagnostics at the European XFEL. In Proceedings of the International Beam Instrumentation Conferenc (IBIC’13), Oxford, UK, 16–19 September 2013; pp. 807–810. [Google Scholar]
  21. Kube, G.; Liu, S.; Novokshonov, A.; Scholz, M. Identification and Mitigation of Smoke-Ring Effects in Scintillator-Based Electron Beam Images at the European XFEL. In Proceedings of the Free Electron Laser Conference (FEL’19); Hamburg, Germany, 26–29 August 2019; pp. 301–306. [Google Scholar]
  22. Marx, D.; Giner Navarro, J.; Cesar, D.; Maxson, J.; Marchetti, B.; Assmann, R.; Musumeci, P. Single-shot reconstruction of core 4D phase space of high-brightness electron beams using metal grids. Phys. Rev. Accel. Beams 2018, 21, 102802. [Google Scholar] [CrossRef] [Green Version]
  23. Marx, D. Characterization of Ultrashort Electron Bunches at the SINBAD-ARES Linac. Ph.D. Thesis, Hamburg University, Hamburg, Germany, 2019. [Google Scholar]
  24. Lipka, D.; Kleen, W.; Lund-Nielsen, J.; Nölle, D.; Vilcins, S.; Vogel, V. Dark Current Monitor for the European XFEL. In Proceedings of the 10th European Workshop on Beam Diagnostics and Instrumentation for Particle Accelerators (DIPAC 2011), Hamburg, Germany, 16–18 May 2011; pp. 572–574. [Google Scholar]
  25. Lipka, D.; Lund-Nielsen, J.; Seebach, M. Resonator for Charge Measurement at REGAE. In Proceedings of the 2nd International Beam Instrumentation Conference (IBIC’13), Oxford, UK, 16 September 2013; pp. 872–875. [Google Scholar]
  26. Goloborodko, S.; Grygiel, G.; Hensler, O.; Kocharyan, V.; Rehlich, K.; Shevtsov, P. DOOCS: An Object Oriented Control System as the Integrating Part for the TTF Linac. In Proceedings of the ICALEPCS. 1997 (ICALEPCS’97), Beijing, China, 3–7 November 1997. [Google Scholar]
  27. Fröhlich, L.; Bartkiewicz, P.; Walla, M. Magnet Server and Control System Database Infrastructure for the European XFEL. In Proceedings of the International Conference on Accelerator and Large Experimental Physics Control Systems (ICALEPCS’15), Melbourne, Australia, 17–23 October 2015; pp. 701–704. [Google Scholar]
  28. Agababyan, A.; Asova, A.; Dimitrov, G.; Grygiel, G.; Fominykh, B.; Hensler, O.; Kammering, R.; Petrosyan, L.; Rehlich, K.; Rybnikov, V.; et al. Integrating a Fast Data Acquisition System into the DOOCS Control System. In Proceedings of the International Conference on Accelerator and Large Experimental Physics Control Systems (ICALEPCS’05), Geneva, Switzerland, 10–14 October 2005. [Google Scholar]
  29. Reiser, M. Theory and Design of Charged Particle Beams; John Wiley & Sons: Hoboken, NJ, USA, 2008. [Google Scholar]
  30. Dowell, D.H.; Schmerge, J.F. Quantum efficiency and thermal emittance of metal photocathodes. Phys. Rev. Spec. Top. Accel. Beams 2009, 12, 119901. [Google Scholar] [CrossRef] [Green Version]
  31. Bazarov, I.V.; Dunham, B.M.; Sinclair, C.K. Maximum Achievable Beam Brightness from Photoinjectors. Phys. Rev. Lett. 2009, 102, 104801. [Google Scholar] [CrossRef] [PubMed] [Green Version]
  32. Wisniewski, E. Cs2Te Photocathode Performance in the AWA High-charge High-gradient Drive Gun. In Proceedings of the 6th International Particle Accelerator Conference (IPAC’15), Richmond, VI, USA, 3–8 March 2015; pp. 3283–3285. [Google Scholar]
  33. Floettmann, K. ASTRA—A Space Charge Tracking Algorithm; DESY: Hamburg, Germany, 2011. [Google Scholar]
  34. Krasilnikov, M.; Bahr, J.; Grabosch, H.J.; Han, J.; Miltchev, V.; Oppelt, A.; Petrosyan, B.; Staykov, L.; Stephan, F. Beam-Based Procedures for RF Guns. In Proceedings of the 2005 Particle Accelerator Conference, Knoxville, TN, USA, 16–20 May 2005; pp. 967–969. [Google Scholar]
  35. Yamin, S.; Assmann, R.W.; Marchetti, B. Study for the alignment of focusing solenoid of ARES RF gun and effect of misalignment of solenoid on emittance of space charge dominated electron beam. J. Phys. Conf. Ser. 2019, 1350, 012014. [Google Scholar] [CrossRef]
  36. Burkart, F.; Aßmann, R.; Dorda, U.; Hauser, J.; Lederer, S.; Lemery, F.; Marchetti, B.; Mayet, F.; Panofski, E.; Wiesener, P. The Experimental Area at the ARES LINAC. In Proceedings of the 10th International Particle Accelerator Conference (IPAC’19), Melbourne, Australia, 19–24 May 2019; pp. 867–870. [Google Scholar]
  37. England, R.J.; Noble, R.J.; Bane, K.; Dowell, D.H.; Ng, C.K.; Spencer, J.E.; Tantawi, S.; Wu, Z.; Byer, R.L.; Peralta, E.; et al. Dielectric laser accelerators. Rev. Mod. Phys. 2014, 86, 1337–1389. [Google Scholar] [CrossRef] [Green Version]
  38. Peralta, E.; Soong, K.; England, R.; Colby, E.; Wu, Z.; Montazeri, B.; Mcguinness, C.; Mcneur, J.; Leedle, K.; Walz, D.; et al. Demonstration of electron acceleration in a laser-driven dielectric microstructure. Nature 2013, 503, 91. [Google Scholar] [CrossRef] [PubMed]
  39. Breuer, J.; Hommelhoff, P. Laser-Based Acceleration of Nonrelativistic Electrons at a Dielectric Structure. Phys. Rev. Lett. 2013, 111, 134803. [Google Scholar] [CrossRef] [PubMed] [Green Version]
  40. Mayet, F.; Assmann, R.; Bödewadt, J.; Brinkmann, R.; Dorda, U.; Kuropka, W.; Lechner, C.; Marchetti, B.; Zhu, J. Simulations and plans for possible DLA experiments at SINBAD. Nucl. Instrum. Methods Phys. A 2018, 909, 213–216. [Google Scholar] [CrossRef]
  41. Lemery, F. Overview of the ARES Bunch Compressor at SINBAD. In Proceedings of the 10th International Particle Accelerator Conference (IPAC’19), Melbourne, Australia, 19–24 May 2019; pp. 902–905. [Google Scholar]
  42. Jaster-Merz, S.; Assmann, R.W.; Burkart, F.; Dorda, U.; Dreyling-Eschweiler, J.; Huth, L.; Krämer, U.; Stanitzki, M. Development of a beam profile monitor based on silicon strip sensors for low-charge electron beams. J. Phys. Conf. Ser. 2020, 1596, 012047. [Google Scholar] [CrossRef]
Figure 1. Future layout of the ARES linac at SINBAD.
Instruments 05 00028 g001
Figure 2. Layout of the ARES photoinjector. (a) Setup of the ARES photoinjector in the SINBAD tunnel, including the RF gun with RF waveguides, magnets and a diagnostic line. (b) Schematic overview of the ARES gun section with the gun, magnets and diagnostic tools.
Instruments 05 00028 g002
Figure 3. Stability measurement of the RF probe power in the ARES gun over 12 h.
Instruments 05 00028 g003
Figure 4. RF power signals in the gun cavity: Displayed are the forward (blue), probe (green) and reflected (yellow) power readout. The red curve represents the sum power given by the quadratic sum of forward and reflected power.
Instruments 05 00028 g004
Figure 5. Charge measurement during a scan of the photoinjecor laser pulse energy at the photocathode surface for different laser attenuator positions and RF phases in the gun cavity.
Instruments 05 00028 g005
Figure 6. Bunch charge measurement during an RF phase scan (Schottky scan). Purple colored measurement data were achieved at a constant solenoid current of −60 A. The solenoid current was optimized for a maximum charge at the DaMon for the green curve. A fit with an ASTRA (A Space Charge Tracking Algorithm) simulation allows the duration of bunch emission to be estimated [33].
Instruments 05 00028 g006
Figure 7. Measured beam momentum vs. RF power. The momentum measurement was done using the first vertical corrector magnet. The RF phase was fixed at −20 deg relative to zero-crossing. The measurement points are compared with ASTRA simulations.
Instruments 05 00028 g007
Figure 8. Measured beam momentum vs. RF phase. The acceleration gradient is estimated with around 91 MV/m from fitting ASTRA simulations.
Instruments 05 00028 g008
Figure 9. Beam size measurement on the first screen in the gun section.
Instruments 05 00028 g009
Figure 10. Analysis of the beam profile along x (a) and y directions (b).
Instruments 05 00028 g010
Figure 11. Comparison of the beam position on the first screen before (left) and after (right) the correction of the solenoid position in the horizontal plane. All other conditions (laser, RF settings) are identical.
Instruments 05 00028 g011
Figure 12. Dark charge measurement during an RF power scan. The data were taken with and without solenoid focusing to the Faraday Cup.
Instruments 05 00028 g012
Figure 13. Finished setup of the ARES linac section.
Instruments 05 00028 g013
Table 1. Final electron beam parameters planned for ARES.
Repetition Rate [Hz]1–50
Bunch Charge [pC]0.5–30
Beam Energy [MeV]54–155
Norm. Emittance (rms) [μm rad]0.1–1
Bunch Length (rms) [fs]0.2–10
Arrival time jitter (rms) [fs]<10
Table 2. Comparison of the momentum measurement results for different RF powers using two different measurement techniques (spectrometer dipole and steerer magnets).
Power [MW]Momentum Measured with Steerer pc [MeV]Momentum Measured with Spectrometer Dipole pc [MeV]
3.70 ± 0.194.63 ± 0.064.64 ± 0.04
3.26 ± 0.164.39 ± 0.064.39 ± 0.06
2.77 ± 0.144.05 ± 0.054.09 ± 0.05
Table 3. Results for the solenoid misalignment obtained for both polarity settings (++, +−) and two RF powers (3.6 MW and 2.6 MW) from the beam-based alignment tool.
MisalignmentEstimated Value
|dX| (mm)0.81 ± 0.16
|dX r o t | (mrad)1.33 ± 0.27
|dY| (mm)0.38 ± 0.08
|dY r o t | (mrad)1.98 ± 0.40
Publisher’s Note: MDPI stays neutral with regard to jurisdictional claims in published maps and institutional affiliations.

