
Muography for Inspection of Civil Structures
by
 , , and
Subhendu Das
1,2,*,
Sridhar Tripathy
3,
Priyanka Jagga
1,†,
Purba Bhattacharya
4,
Nayana Majumdar
1,2 and
Supratik Mukhopadhyay
1,2 1
Applied Nuclear Physics Division, Saha Institute of Nuclear Physics, Sector I, AF Block, Bidhannagar, Kolkata 700064, India
2
Homi Bhabha National Institute, Training School Complex, Anushaktinagar, Mumbai 400094, India
3
Department of Physics, University of California, Davis, One Shields Avenue, Davis, CA 95616, USA
4
Department of Physics, School of Basic and Applied Sciences, Adamas University, Barbaria, Jagannathpur, North 24 Parganas, Kolkata 700126, India
*
Author to whom correspondence should be addressed.
†
Project student.
Instruments 2022, 6(4), 77; https://doi.org/10.3390/instruments6040077
Submission received: 30 September 2022
/
Revised: 1 November 2022
/
Accepted: 9 November 2022
/
Published: 18 November 2022
(This article belongs to the Special Issue Muography, Applications in Cosmic-Ray Muon Imaging)
Abstract
:Aging infrastructure is a threatening issue throughout the world. Long exposure to oxygen and moisture causes premature corrosion of reinforced concrete structures leading to the collapse of the structures. As a consequence, real-time monitoring of civil structures for rust becomes critical in avoiding mishaps. Muon scattering tomography is a non-destructive, non-invasive technique which has shown impressive results in 3D imaging of civil structures. This paper explores the application of advanced machine learning techniques in identifying a rusted reinforced concrete rebar using muon scattering tomography. To achieve this, we have simulated the performance of an imaging prototype setup, designed to carry out muon scattering tomography, to precisely measure the rust percentage in a rusted rebar. We have produced a 2D image based on the projected 3D scattering vertices of the muons and used the scattering vertex density and average deviation angle per pixel as the distinguishing parameter for the analysis. A filtering algorithm, namely the Pattern Recognition Method, has been employed to eliminate background noise. Since this problem boils down to whether or not the material being analyzed is rust, i.e., a classification problem, we have adopted the well-known machine learning algorithm Support Vector Machine to identify rust in the rusted reinforced cement concrete structure. It was observed that the trained model could easily identify 30% of rust in the structure with a nominal exposure of 30 days within a small error range of 7.3%.
1. Introduction
Reinforced Cement Concrete (RCC) structures have been the backbone of civil engineering for several decades. Reinforced concrete is an important building material in large-scale infrastructure: roads, bridges, tunnels, and buildings. Conventional concrete, despite having high compressive strength, lacks tensile strength which makes concrete brittle in face of shear and tension forces [1,2]. In the light of making concrete structures resistant to brittle and ductile mode failure, steel is added to the plain concrete. Steel due to its versatile properties can withstand these forces and, thus, is a perfect reinforcement for concrete [3]. It is however liable to damage due to corrosion, carbonation and chloride ingress. In order to avoid structural collapse, non-destructive testing methods are necessary to assess the quality of RCC structures. Additionally, knowledge of the type of defect and its precise location also improves the chances of averting the calamity. There are multiple Non-Destructive Evaluation (NDE) techniques that are typically used for imaging. These are ultrasonic tomography [4], infrared tomography [5,6], Ground Penetrating Radar (GPR) [7], impact-echo [8]. These methods, however, have some limitations, which include the need for a high amount of heat for imaging non-conducting materials (active thermography), interference from environmental parameters, such as sunlight intensity (passive thermography), shadows of other bodies, wind, etc. Alternatively, radiological imaging methods (radiography) using X-rays and gamma-rays are very effective, but are not preferred due to their potential for biological hazards. Cosmic ray muon tomography is thus gaining traction for the imaging and monitoring of RCC structures.
Since the beginning of 1950s, cosmic ray muons have found applications in tomographic studies of large civil structures owing to their highly penetrative and less-interactive nature [9,10,11,12,13]. Other than imaging structures based on the differential flux of absorbed and penetrated muons, multiple scattering suffered by the muons while passing through matter due to their interaction with atomic nuclei, has also been exploited to scan targets, the underlying physics of which is formulated based on their atomic number, weight, and density [14,15,16]. This innovative NDE technique has found applications in scanning nuclear-waste containers, possibly-smuggled special nuclear materials in cargo containers, monitoring gate valve conditions, pipe wall thickness [17,18,19,20], etc. In addition to these, monitoring and imaging defects in large concrete structures have also emerged to be a substantial utilization of muon imaging [14,16,21].
This article showcases MST [22] as an NDE technique to image RCC structure and puts forward a recipe to discriminate rusted portions of steel rebars using the Geant4 simulation toolkit [23]. Subsequently, a classification-based Machine Learning (ML) algorithm has been employed to enhance image reconstruction and improve rust identification among targets involving similar material densities (steel (7.87 g/cc), rust (5.25 g/cc), and concrete (2.3 g/cc)). For training and validation, the ML model has been applied to a scenario with four blocks of materials: aluminium (Z = 13), iron (Z = 26), lead (Z = 82), and uranium (Z = 92) to address different ranges of atomic number and density. The scattering positions and corresponding angles of the muons as they pass through the blocks have been obtained from reconstruction of muon tracks from the muon hits as recorded by the muon trackers in the MST setup. This work has been accomplished by the Geant4 simulation. Based on these parameters, radiographic image production has been carried out. Next, by employing a Pattern Recognition Method (PRM) [24], the materials in focus have been separated from the background (air). The ML technique, mentioned above is a Support Vector Machine (SVM) [25] classifier which has been used to detect rust on a rebar in a RCC unit.
The working principle of MST has been detailed in Section 2 and the simulation model of the system has been described in Section 3. Discussion on image reconstruction of the target can be found in Section 4, followed by its analysis in Section 5. Finally, training the ML model on four blocks: Al, Fe, Pb, and U, and its implementation to segregate rust from the steel rebar have been reported in Section 6 along with its detailed analysis.
2. Principle of MST
Cosmic muons are high-energy (mean ≈ 4 GeV/c) particles with a relatively long lifetime (2.2 µs) and ±e charge. They are produced naturally in the atmosphere and have a flux rate of about 1 per cm2/min at the sea level. Due to their greater mass (105.66 MeV/c2) [26], they can penetrate through large amount of materials without suffering any significant loss of energy. In addition to inelastic collisions with atomic electrons, muons passing through matter also suffer repeated elastic coulomb scattering from atomic nuclei. These collisions are individually governed by Rutherford’s formula. The vast majority of these collisions result in a small angular deflection of the particle. The cumulative effect of these small angle scatterings compounds to a net deflection of the muon from its original trajectory. According to Moliere theory [27], the scattering angles projected on a plane obey the Gaussian distribution [22,28] and the standard deviation of the distribution is given by:
where p is the momentum of the muon, L is the distance traversed by it in the object, and is the ratio of its velocity to the velocity of light. The radiation length, [cm], is a property of the object material which is given by:
where A, Z, and are the atomic weight, number, and density of the material, respectively. Since the speed of muons is very close to the speed of light, the value of can be approximated to 1. The value of in Equation (1) is usually far less than 1. Thus, Equation (1) can be simplified to:
In MST, the deviation angle plays a key role in differentiating materials as it relies on the atomic number, mass number, density, thickness of the material, and momentum of muons.
3. Geant4 Simulation Setup for MST
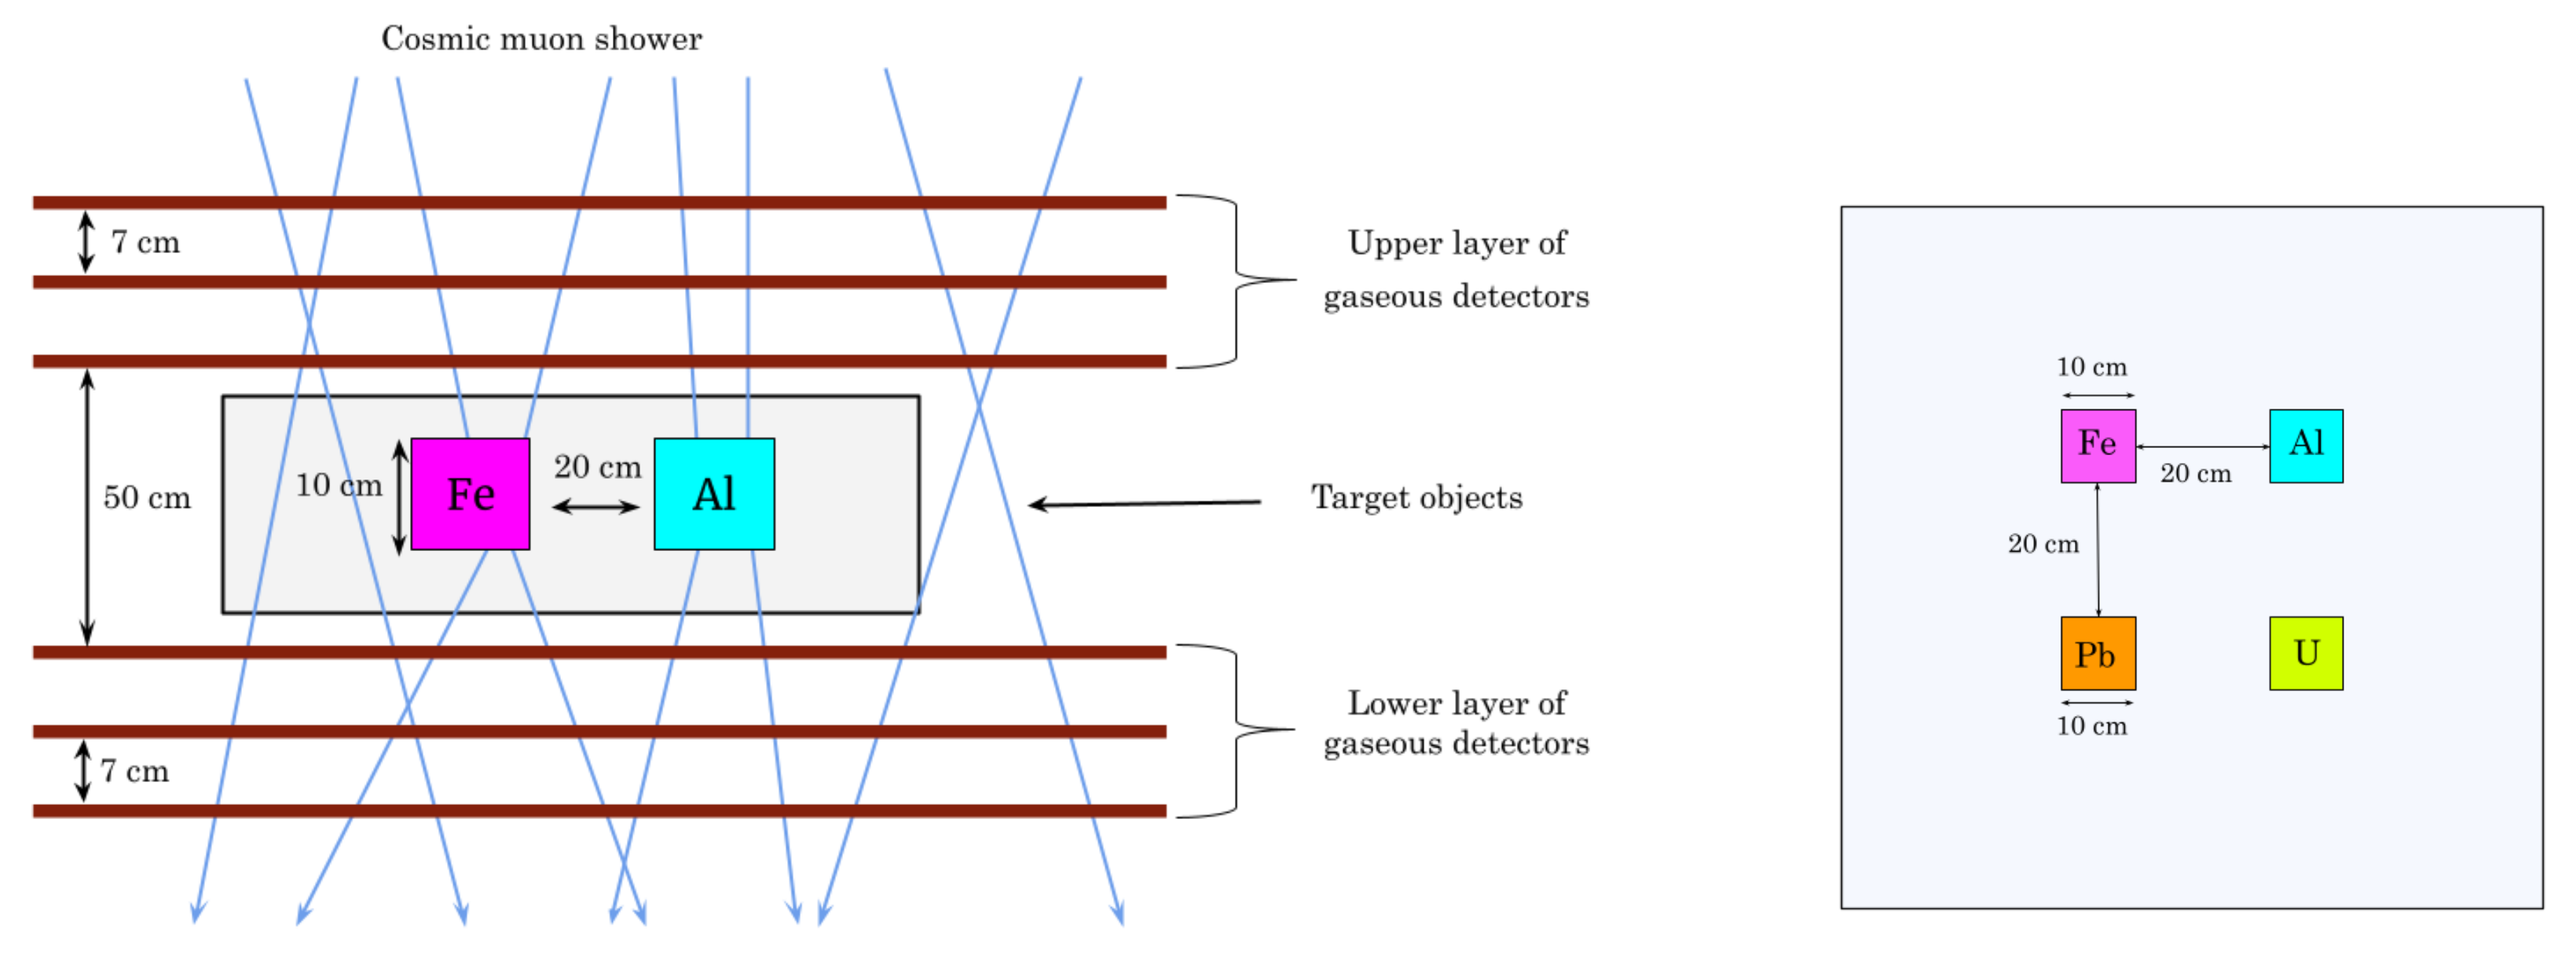
The concerned MST setup consists of six layers of position-sensitive gaseous ionization detectors that have been stacked parallelly, three each on either sides of the Region of Interest (RoI) subject to imaging with dimensions 80 cm × 80 cm × 40 cm. Four cubes of Al, Fe, Pb, and U with dimensions 10 cm × 10 cm × 10 cm have been placed in the central plane of the RoI. The gaseous detectors used in the setup have dimensions 140 cm × 140 cm × 0.2 cm. Detectors with larger active areas have been chosen to maintain uniform muon hits across the lateral span of the RoI. The design parameters of the MST setup have followed from a preceding uniformity study that was carried out in [24]. The detectors have been assumed to have a 100% detection efficiency and a spatial resolution of 200 µm, which has been added as a Gaussian uncertainty to the muon hits obtained from the simulation. Figure 1 shows the schematic representation of the model setup that has been subject to a muon flux to simulate the multiple Coulomb scattering of muons in the RoI. The Cosmic-Ray Shower Library (CRY) [29] has been used to produce muon flux for the latitude (22.57°) and altitude (sea-level) of the experimental laboratory. The FTFP_BERT physics list has been implemented to account for all the electromagnetic processes, weak interactions of charged particles and gamma radiations.
4. Track Reconstruction and Image Production
The incoming and outgoing muon hits on the detectors have been used for track reconstruction. The projection of the track on two orthogonal planes XZ and YZ have been used for determining two sets of least square fitting parameters for X and Y coordinates. Since some of the hits produce statistical noise due to the applied resolution of the detector, several selection criteria have been implemented to choose only the relevant scatter points to reconstruct the tracks:
- The muon track must pass through all the detectors.
- The scattering location must fall inside the RoI.
- Angle between the track-lets constructed from any two pair of detectors in the upper/lower set, must not exceed 10 mrad.
4.1. Point of Closest Approach (PoCA) and Estimation of Angle of Deviation
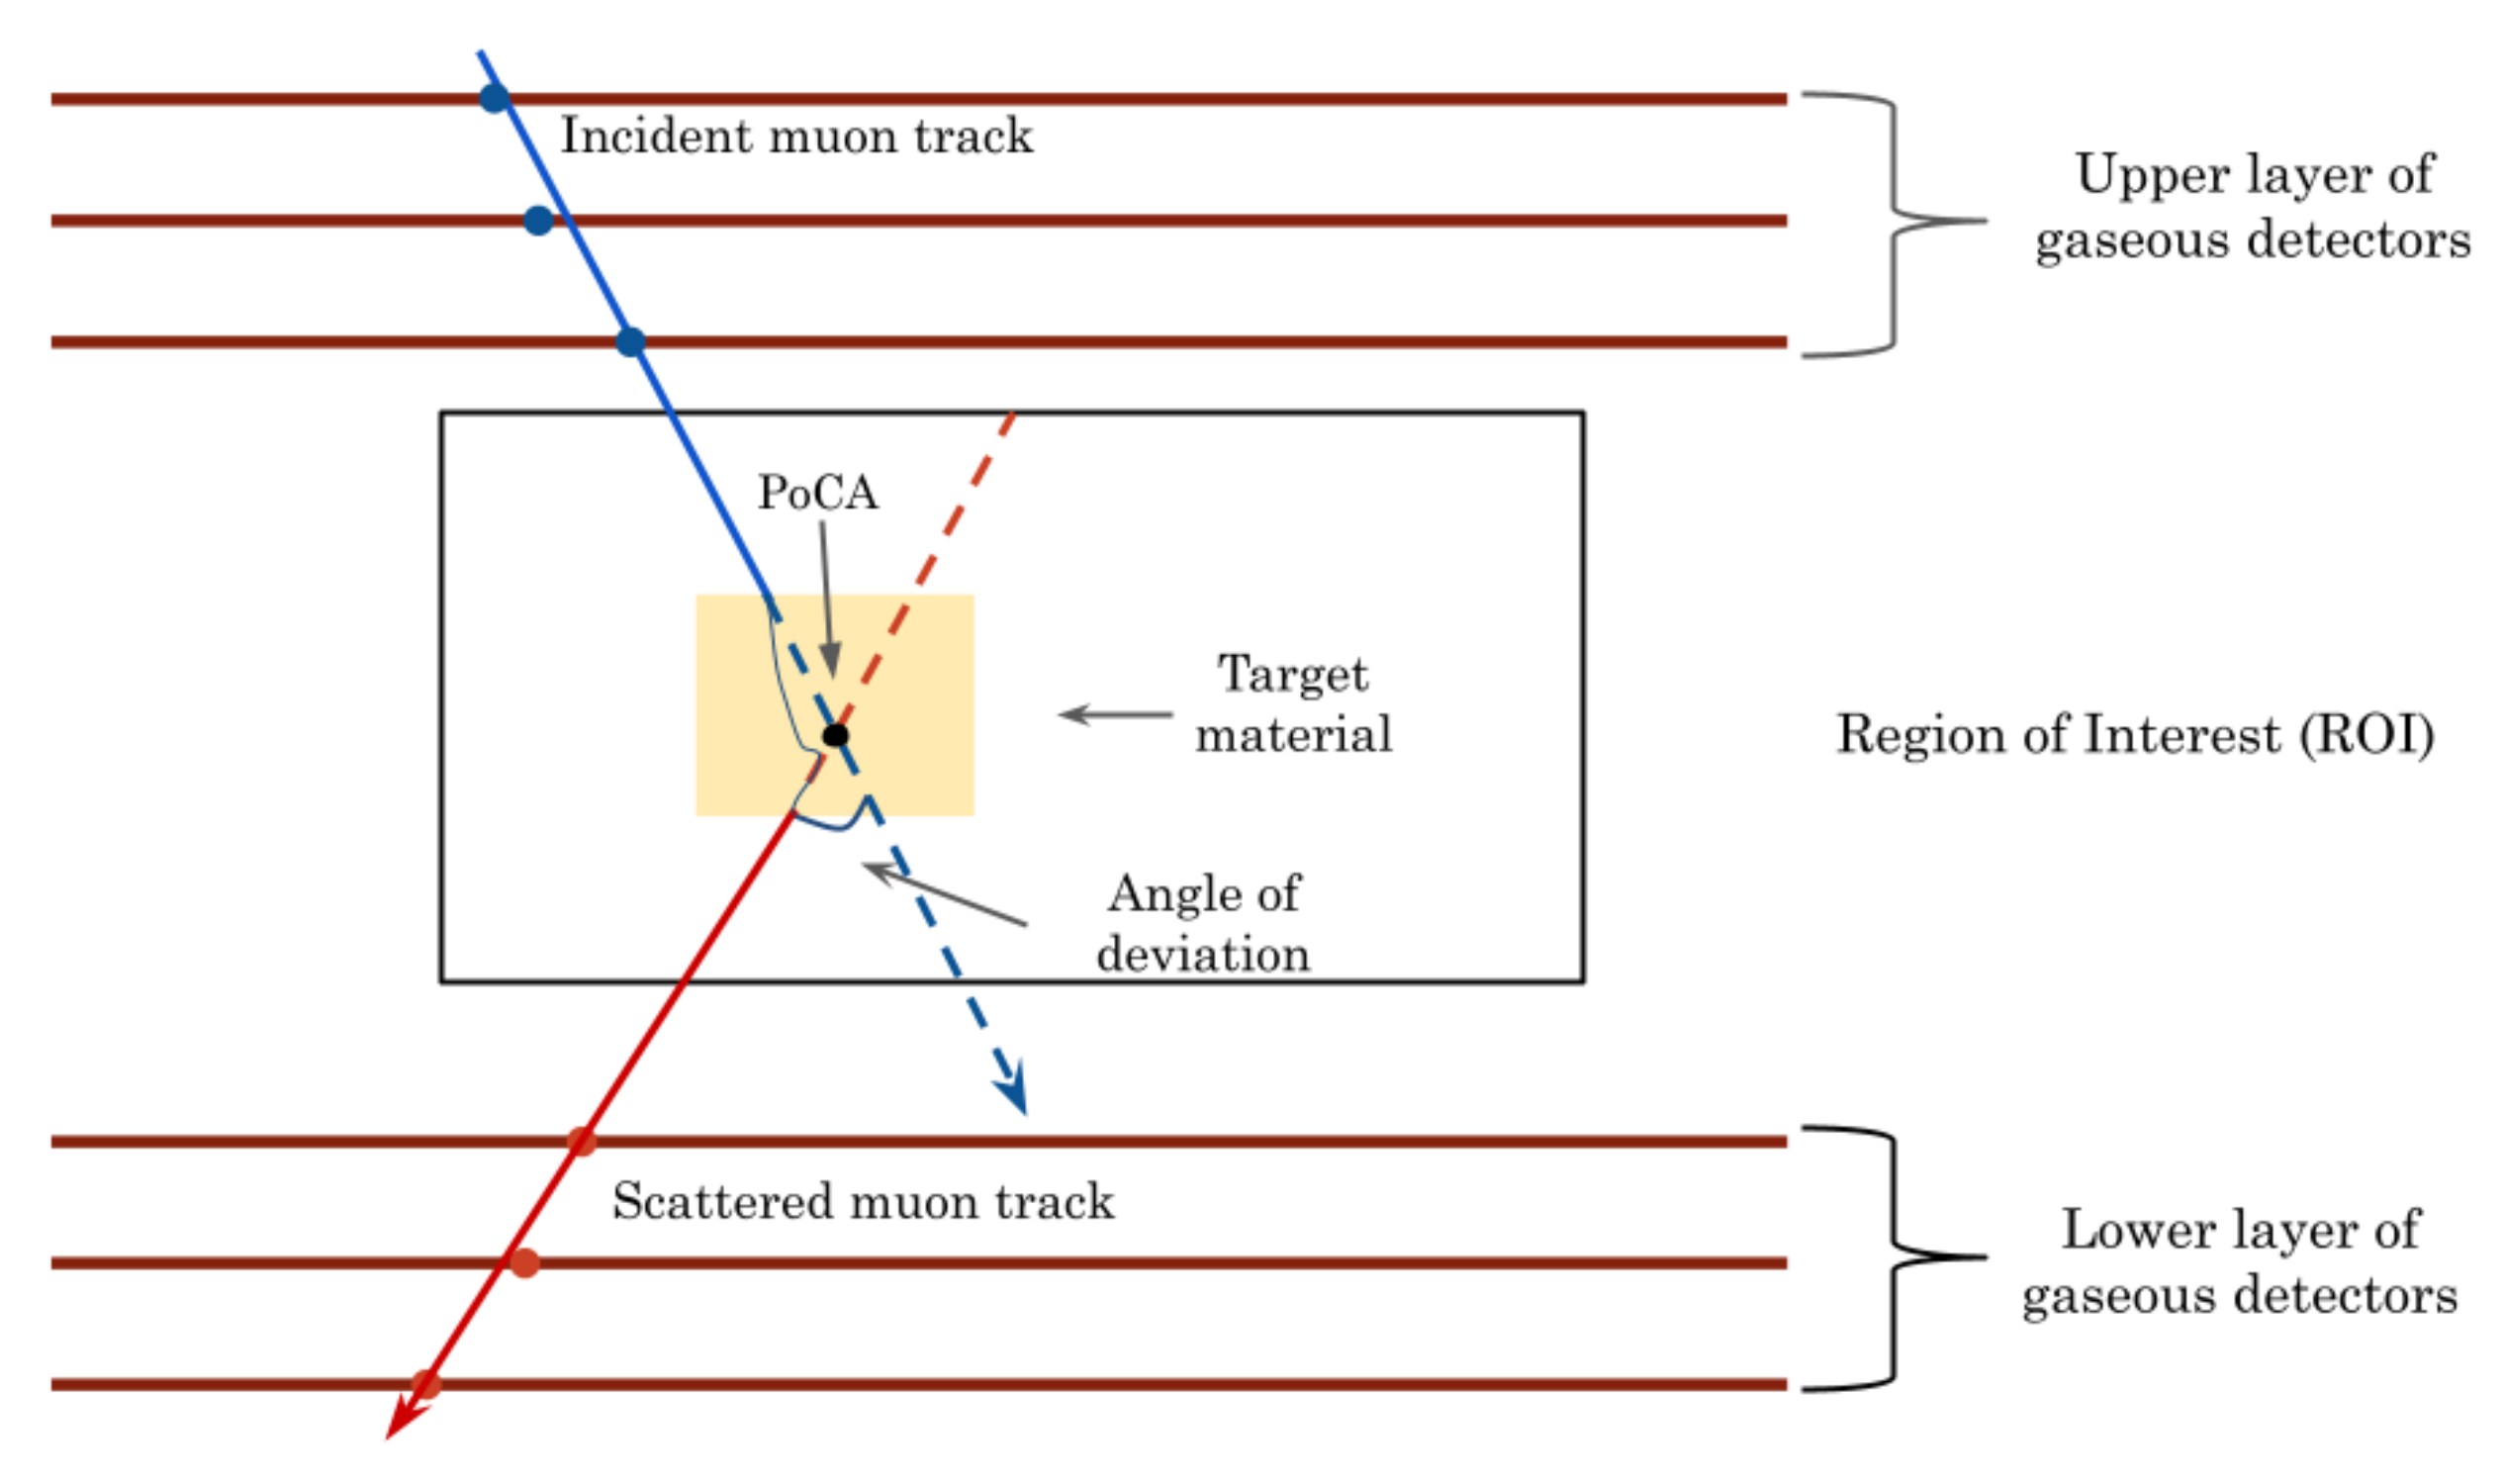
The scattering events for which muon tracks satisfy the selection criteria, have been marked valid. To determine the probable 3D location of scattering vertex, the PoCA algorithm has been used. It is a well-established geometrical algorithm devised by L. Schultz et al. [17] which assumes that the scattering occurs due to a single scattering event in space at a single point. The scattering point obtains its coordinates by extrapolating the incident and scattered muon tracks by minimising the distance between the two tracks. A schematic of the algorithm is shown in Figure 2.
Using PoCA, we have obtained the scattering vertex and estimated the deviation angle for each muon event from the tracks. The events with deviation angle less than 10 mrad have not been considered in the analysis.
4.2. 2D Image Production
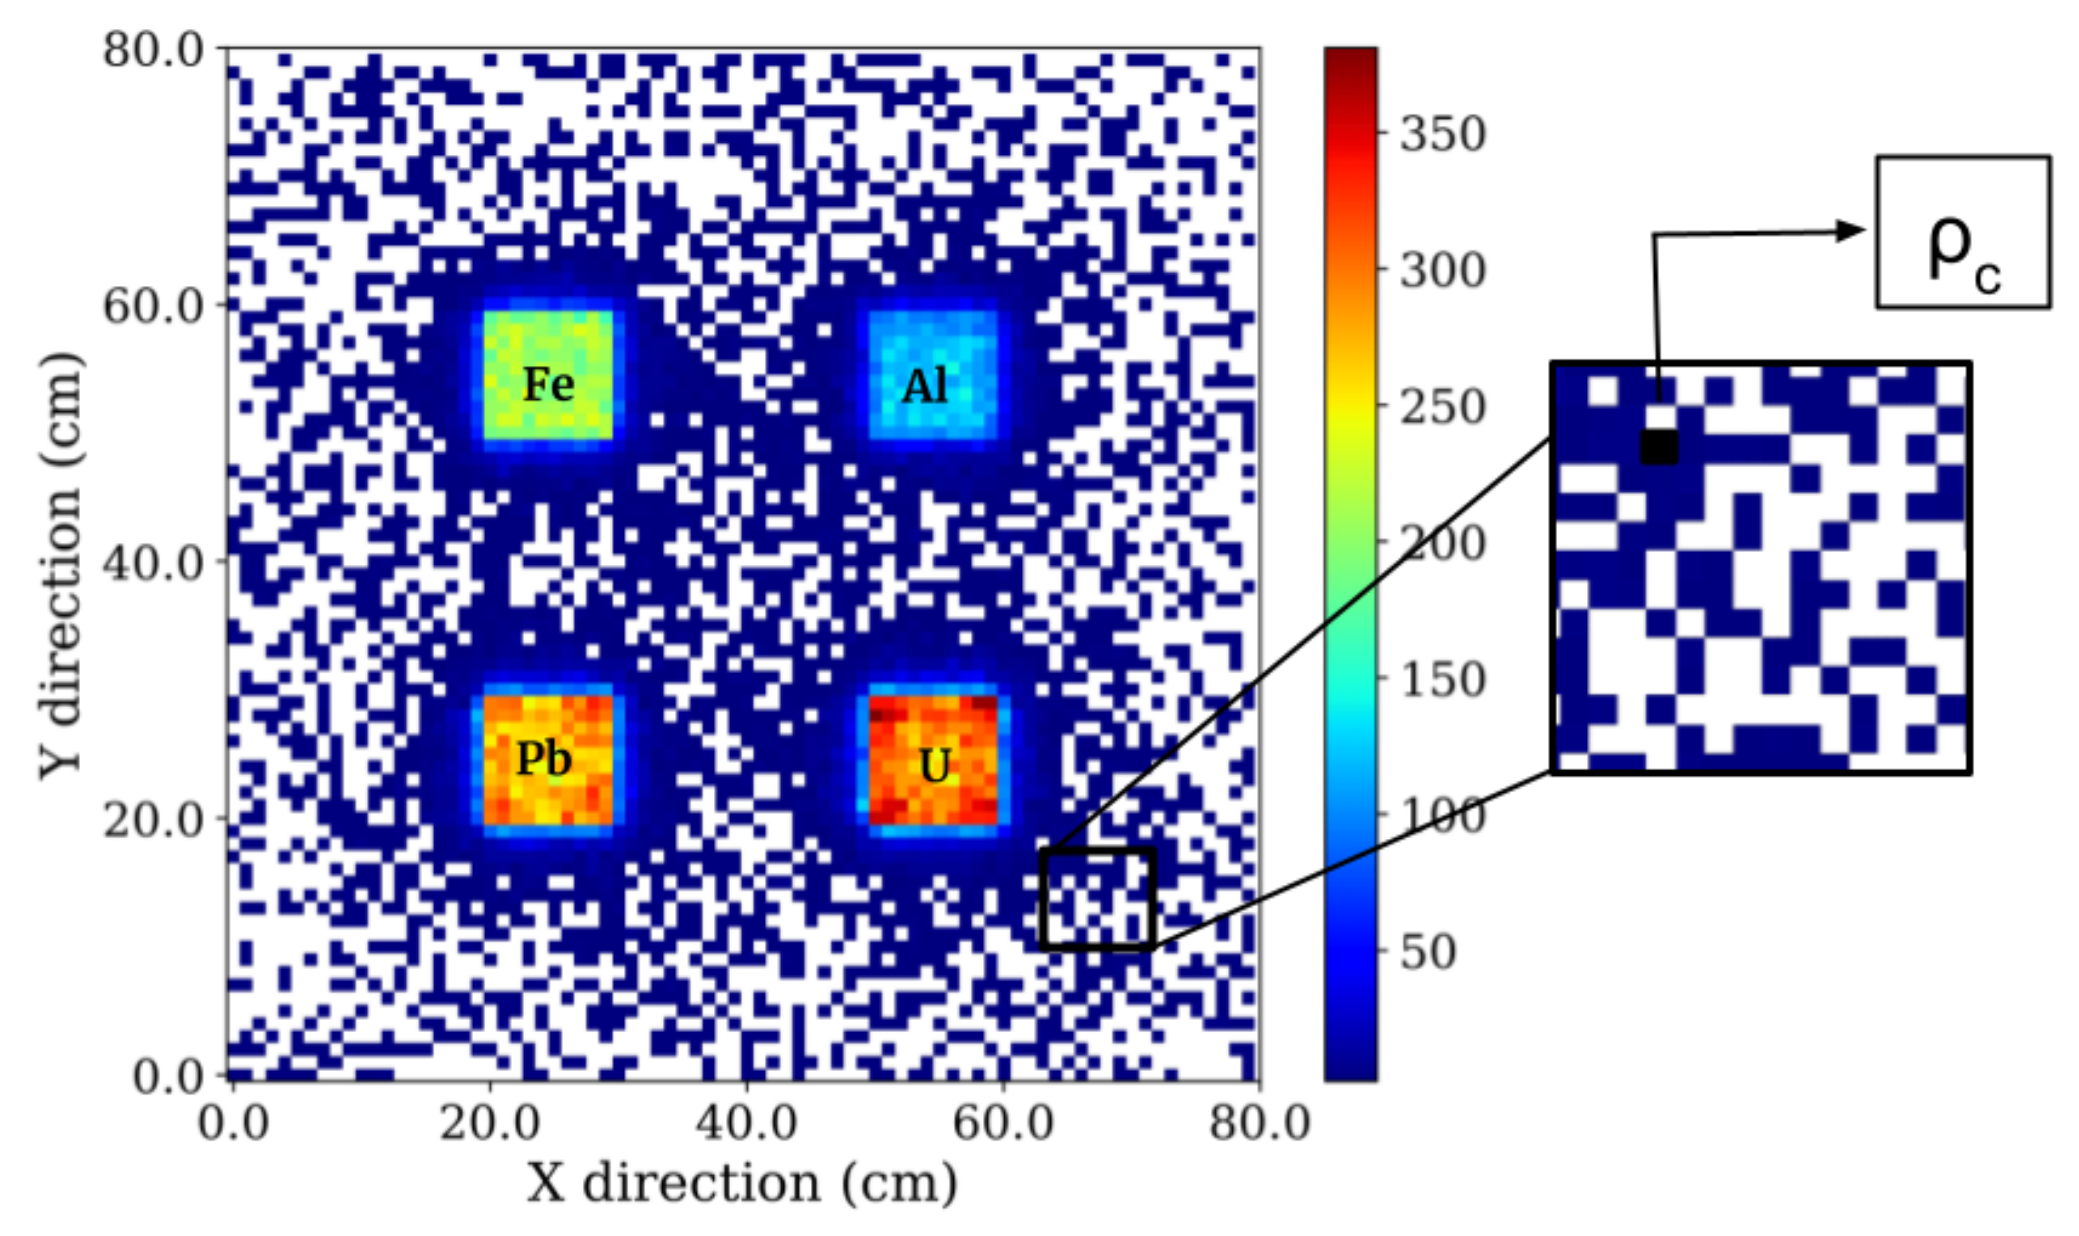
The scattering vertices obtained have been projected on the XY plane to obtain the 2D image or scattering map (S-map) of the target objects. In the case of 2D imaging, it is difficult to distinguish objects with different heights as the information along Z-direction is lost [24]. To address this, in the present work all the test objects have been considered to be of same dimension in all the directions. Thus, for the sake of simplicity we have projected the vertices on only the XY plane. The projected plane has been segmented into pixels, each having an area of 1 × 1 cm. The area of the pixels has been decided based on computation time, required accuracy in shape identification, and amount of data available. The S-map by projecting the scattering vertices in each pixel has been shown in the Figure 3. Important parameters, namely, scattering vertex density (c) and average deviation angle (avg), have been calculated for each pixel for further analysis.
5. Analysis
This section discusses the background noise reduction achieved using PRM and material identification by implementing a SVM classifier.
5.1. Noise Reduction by Pattern Recognition Method
The reduction in background noise from the image plays an important role in identifying the positions of different blocks. Apart from track selection criteria, background noise has been further minimized using PRM [24]. It is a filtering algorithm wherein a specific pattern of a reference image is used to design a filter “K” called kernel. This K is then used to scan the test image to look for similar properties. It performs like a high-pass filter that allows the range of values lying above a certain threshold due to prior training. We have used PRM to eliminate the noisy events in the 2D S-map shown in Figure 3. The c obtained for the Al block has been used as the threshold to train the kernel. Since it increases with Z of the material, c for Al has been kept as the lowest threshold to minimise the noise in the 2D image. Figure 4 illustrates the result of applying the PRM to the image obtained in Section 4.2.
5.2. Machine Learning for Material Identification
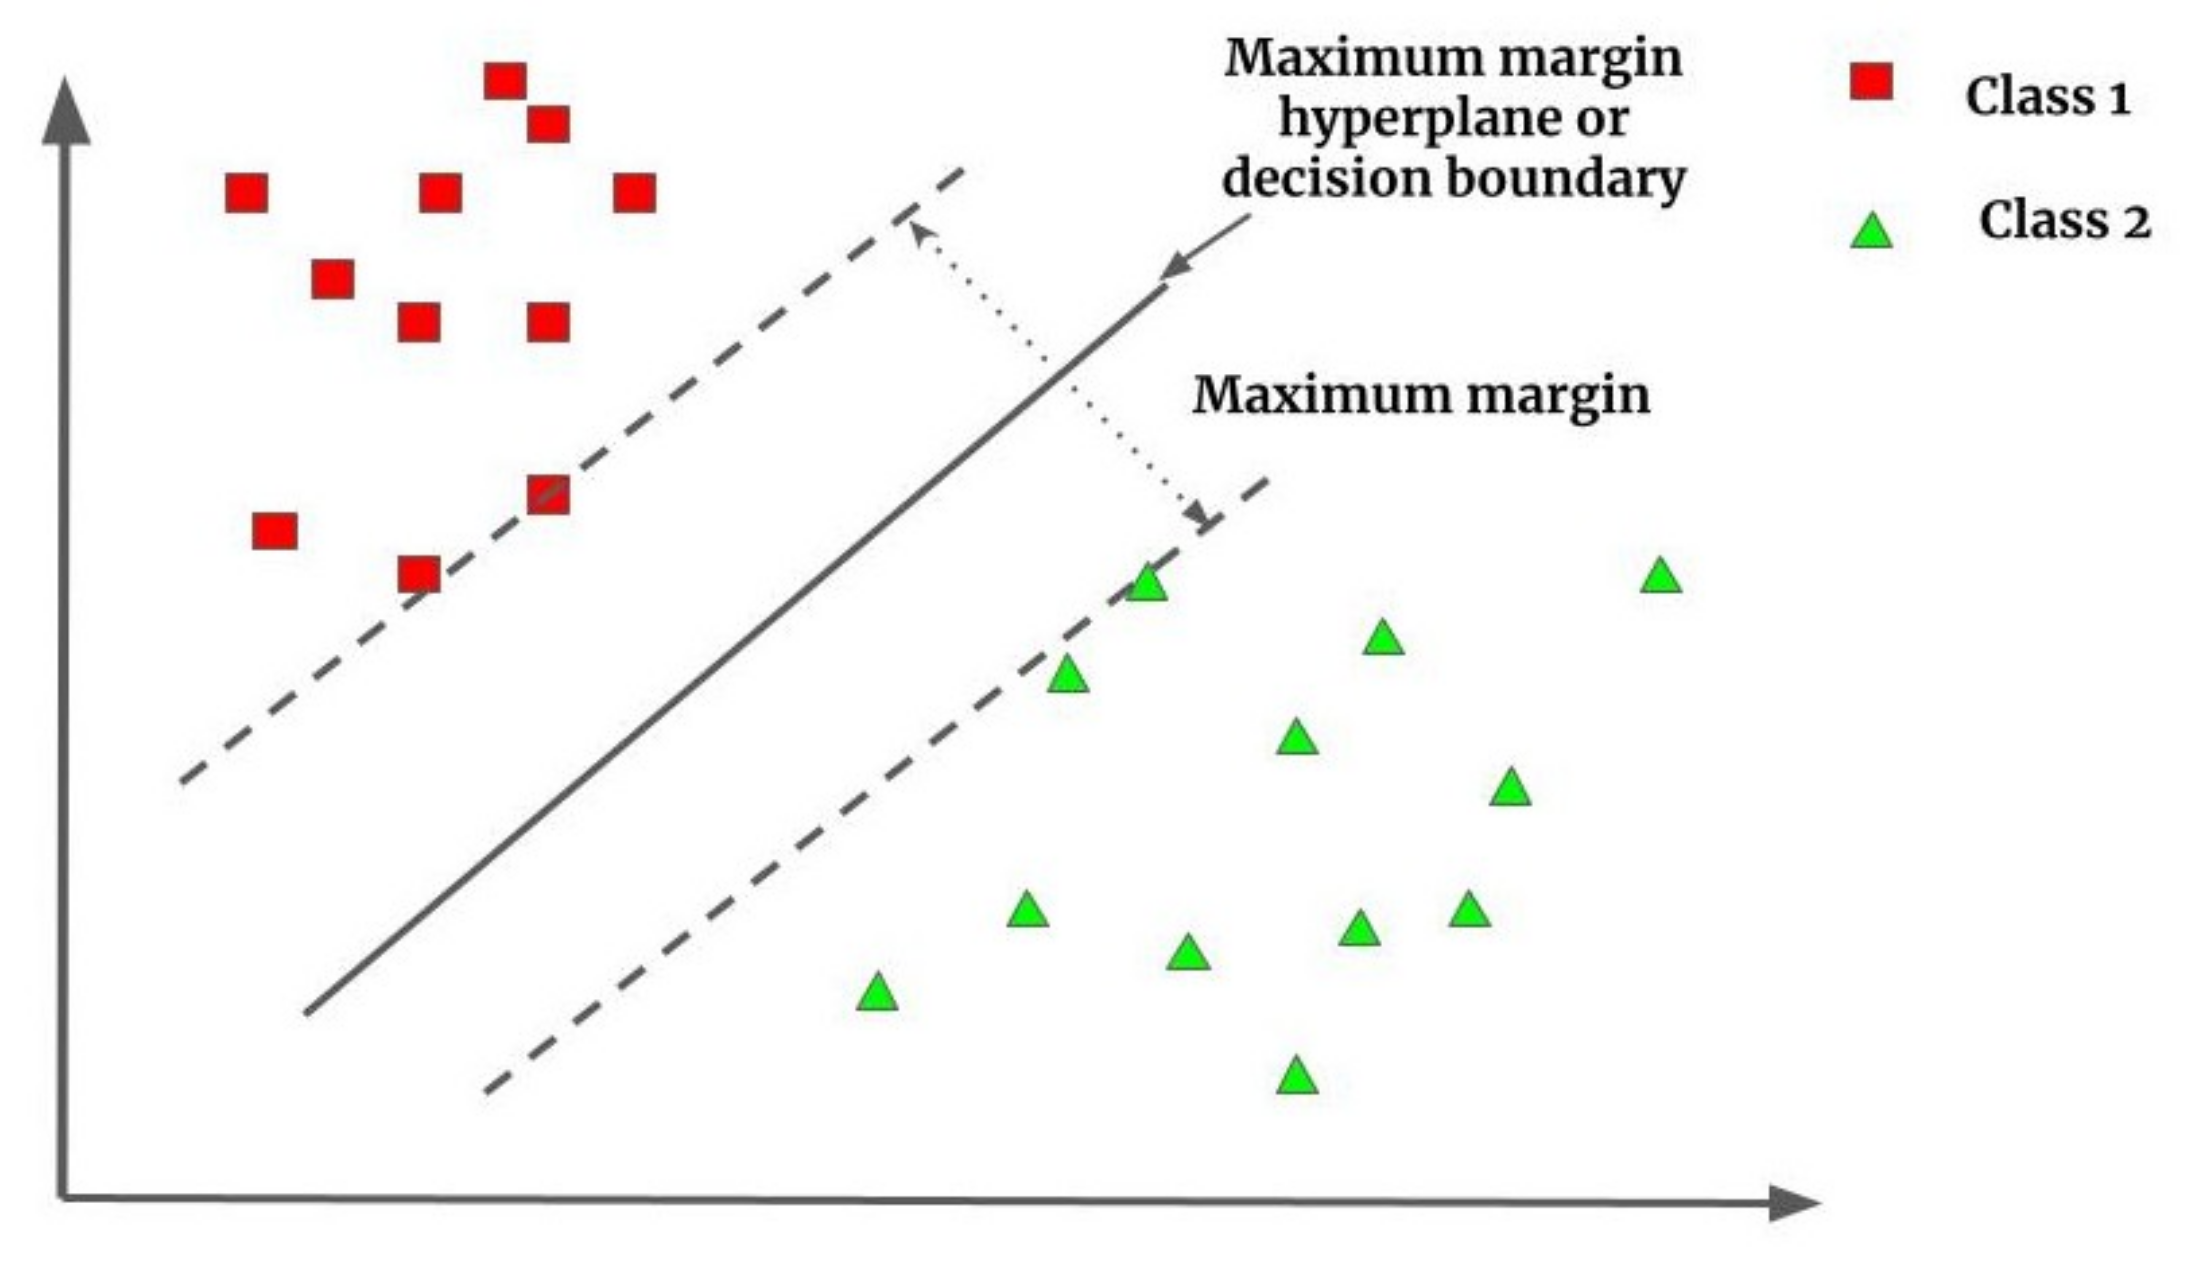
The ML technique used in this project is mainly confined to supervised learning, wherein the computer model based on SVM is trained with manually labelled data. Once trained, it is then used to classify the data according to the trained labels. SVM is a supervised learning method with associated learning algorithms that analyse data for classification. It is one of the most robust classification methods, and is well-known for its simple implementation and fast computation [25]. What sets SVM apart from other classification algorithms, such as Naive Bayes, decision tree, and logistic regression is that it draws a hyperplane instead of a hard-margin to segregate two classes, as shown in Figure 5. It optimizes the decision boundary by finding closest points to the margins and maximizing their distance from the line. This contributes to the generalization of the model and makes it robust to a wide range of outliers in different sample spaces used for analysis. To deal with non-linear data points, as in case of distinction between Pb and U, SVM makes use of the kernel in which the data points are mapped into high-dimensional feature space, thus converting it into a linear classification model. We have employed the polynomial kernel to distinguish between the two materials.
5.3. Training the SVM Classifier
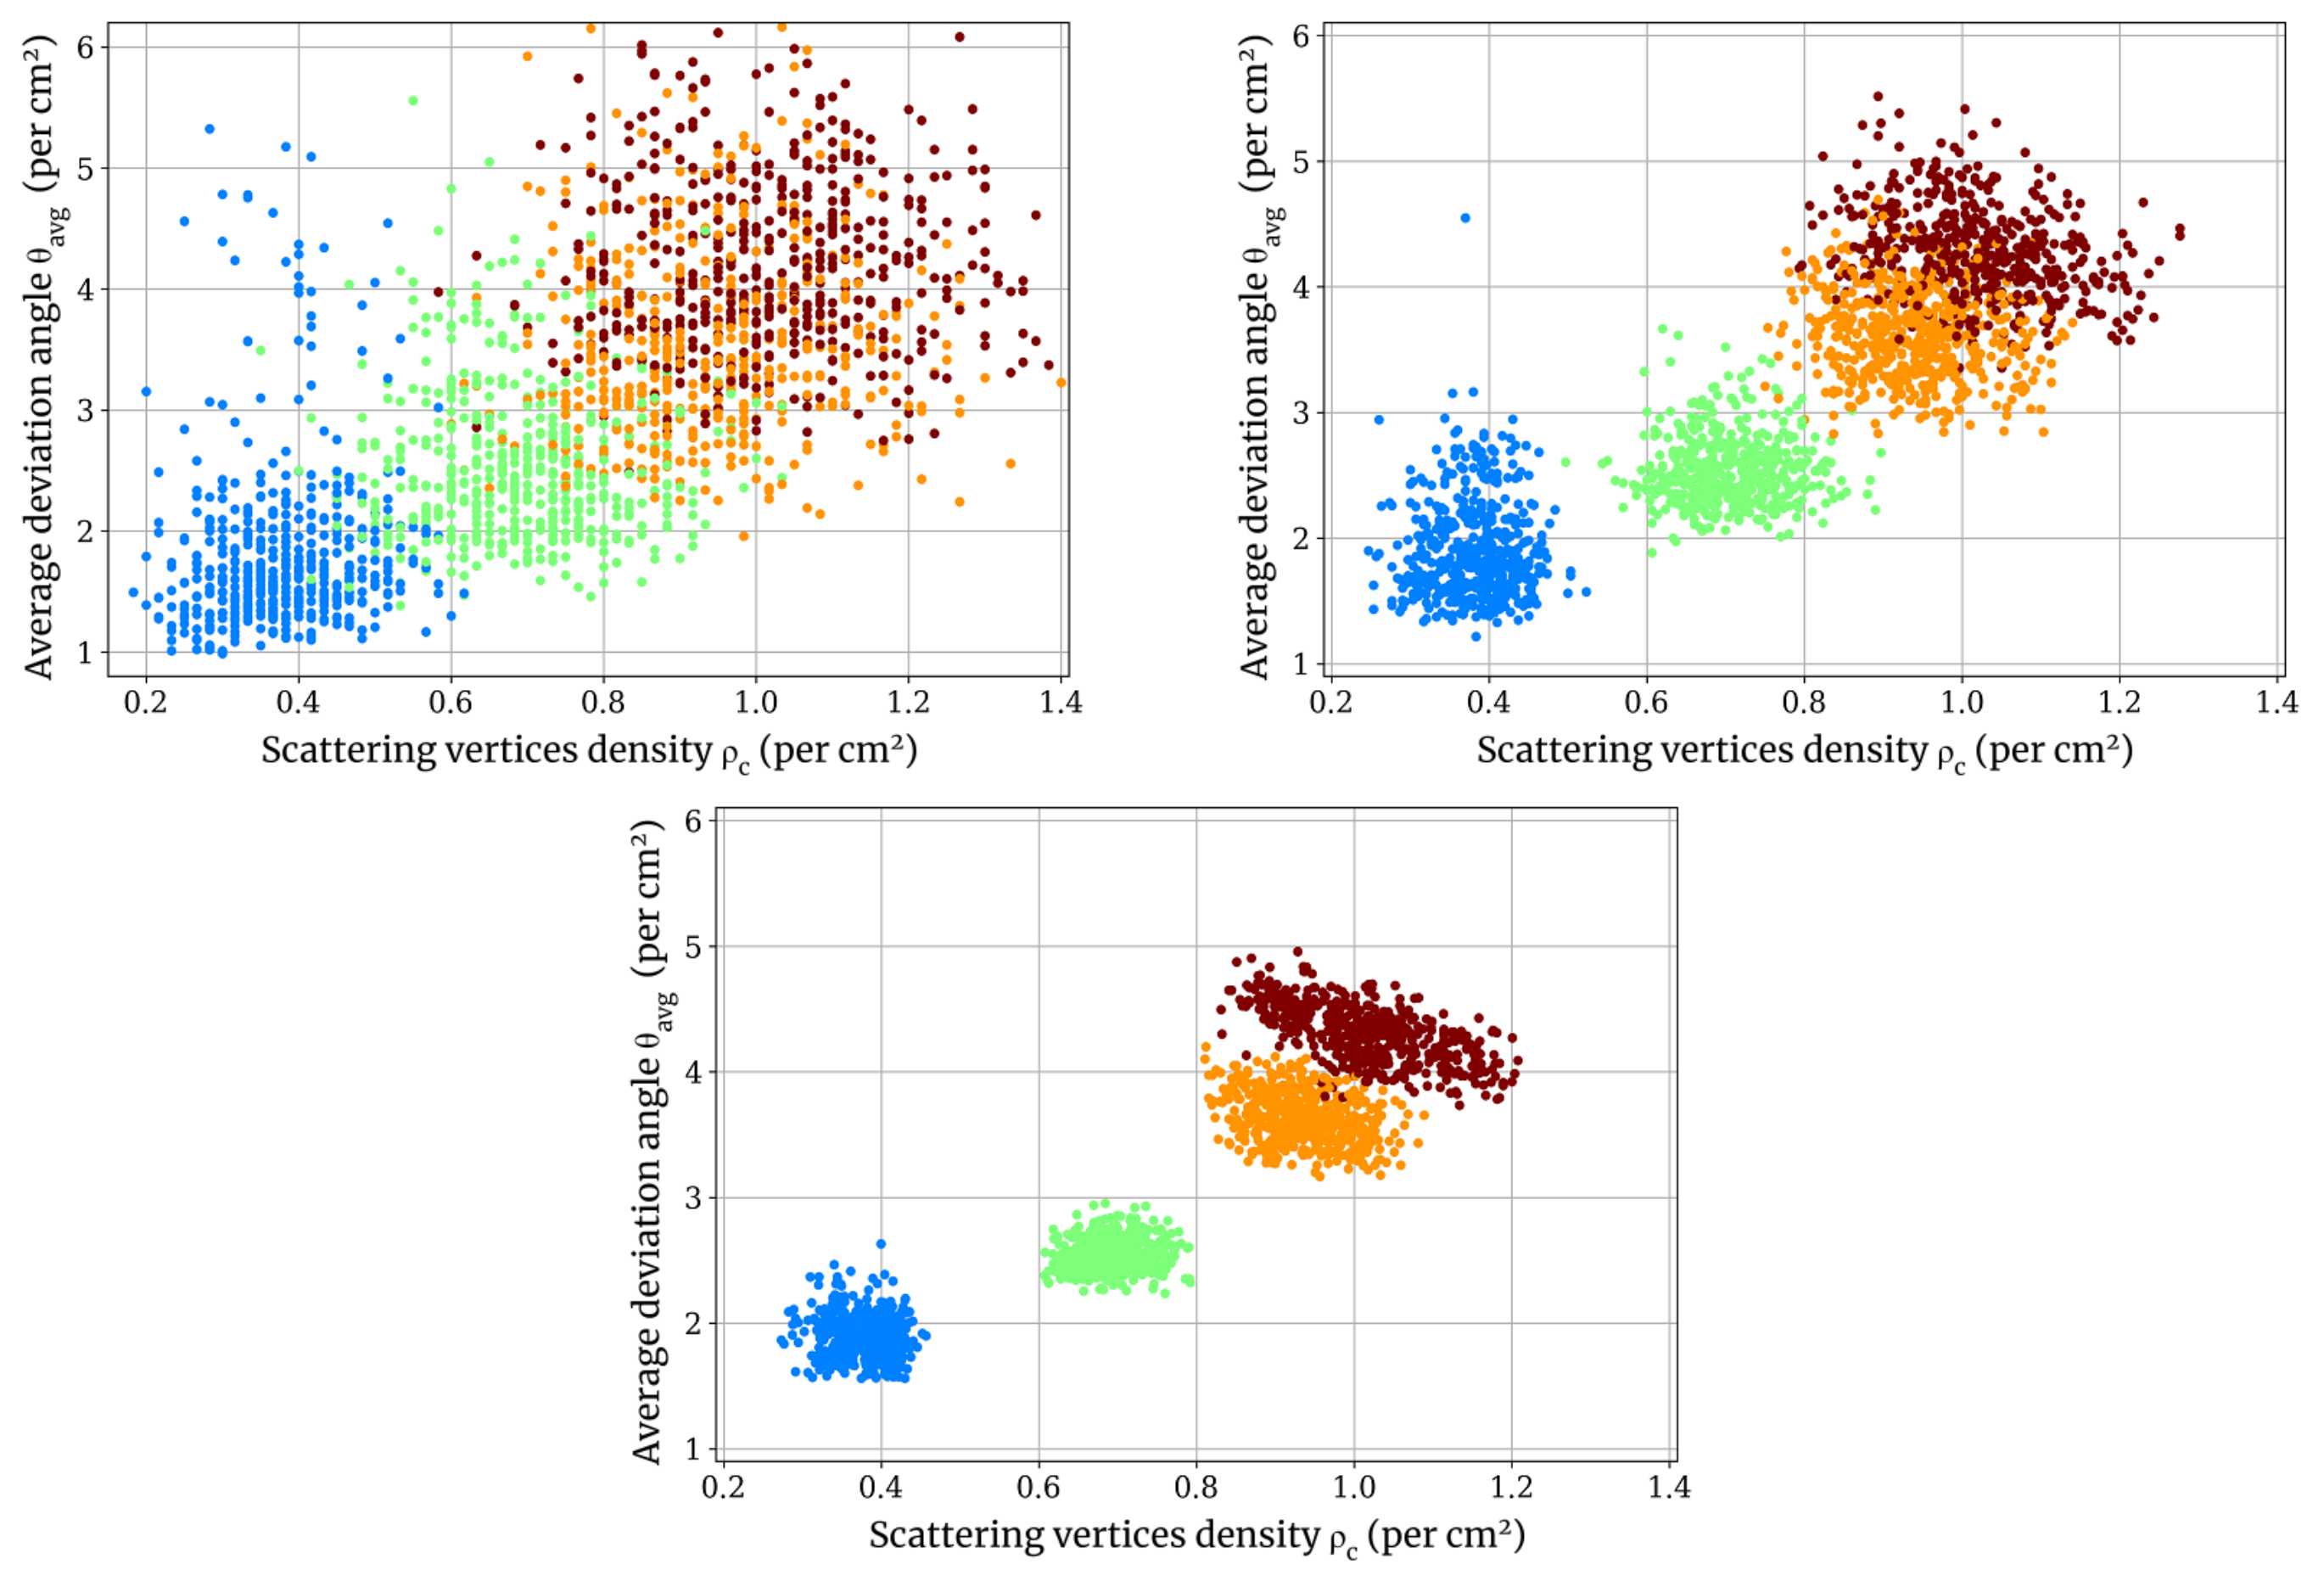
The SVM classifier has been trained on around 100 datasets each corresponding to 24 h of muon exposure. The parameters c and avg, derived from each pixel of the respective region of blocks, have been passed to the One-Vs-One classifier [30], labeling them as Al: 1, Fe: 2, Pb: 3, and U: 4. The dataset has been split into training and testing sets of 75% and 25%, respectively. During training and testing, c has been scaled per minute in order to bring all the points corresponding to different exposure rates, i.e., 1, 5, and 24 h in the same range for better visual comparison. The plots of c versus avg for each material (Al, Fe, Pb, and U) are illustrated in Figure 6 for different exposure rates. It has been observed that in case of high-Z materials Pb and U, classification becomes difficult and there is a significant overlapping of c for these two materials. However, avg for U is still higher than Pb. Therefore, training the classifier using both the parameters brings out a better distinction and can be used for material identification as well. To quantify the performance of the trained SVM classifier, we have calculated the binary misclassification rate (Rm) for each of the materials. It has been observed that for longer exposure hours, i.e., 5 and 24 h, the model has been easily able to classify between low and mid-Z materials. The value of Rm for each combination of material has been given in Table 1.
6. Inspection of the Rusted Rebar
The ML model with c and avg as the training parameters has been further applied to analyse the defects in civil structure. We have chosen a typical defect commonly found in concrete structures, i.e., rusting of the steel bar in the RCC structures [14,16,21].
6.1. Simulation Setup
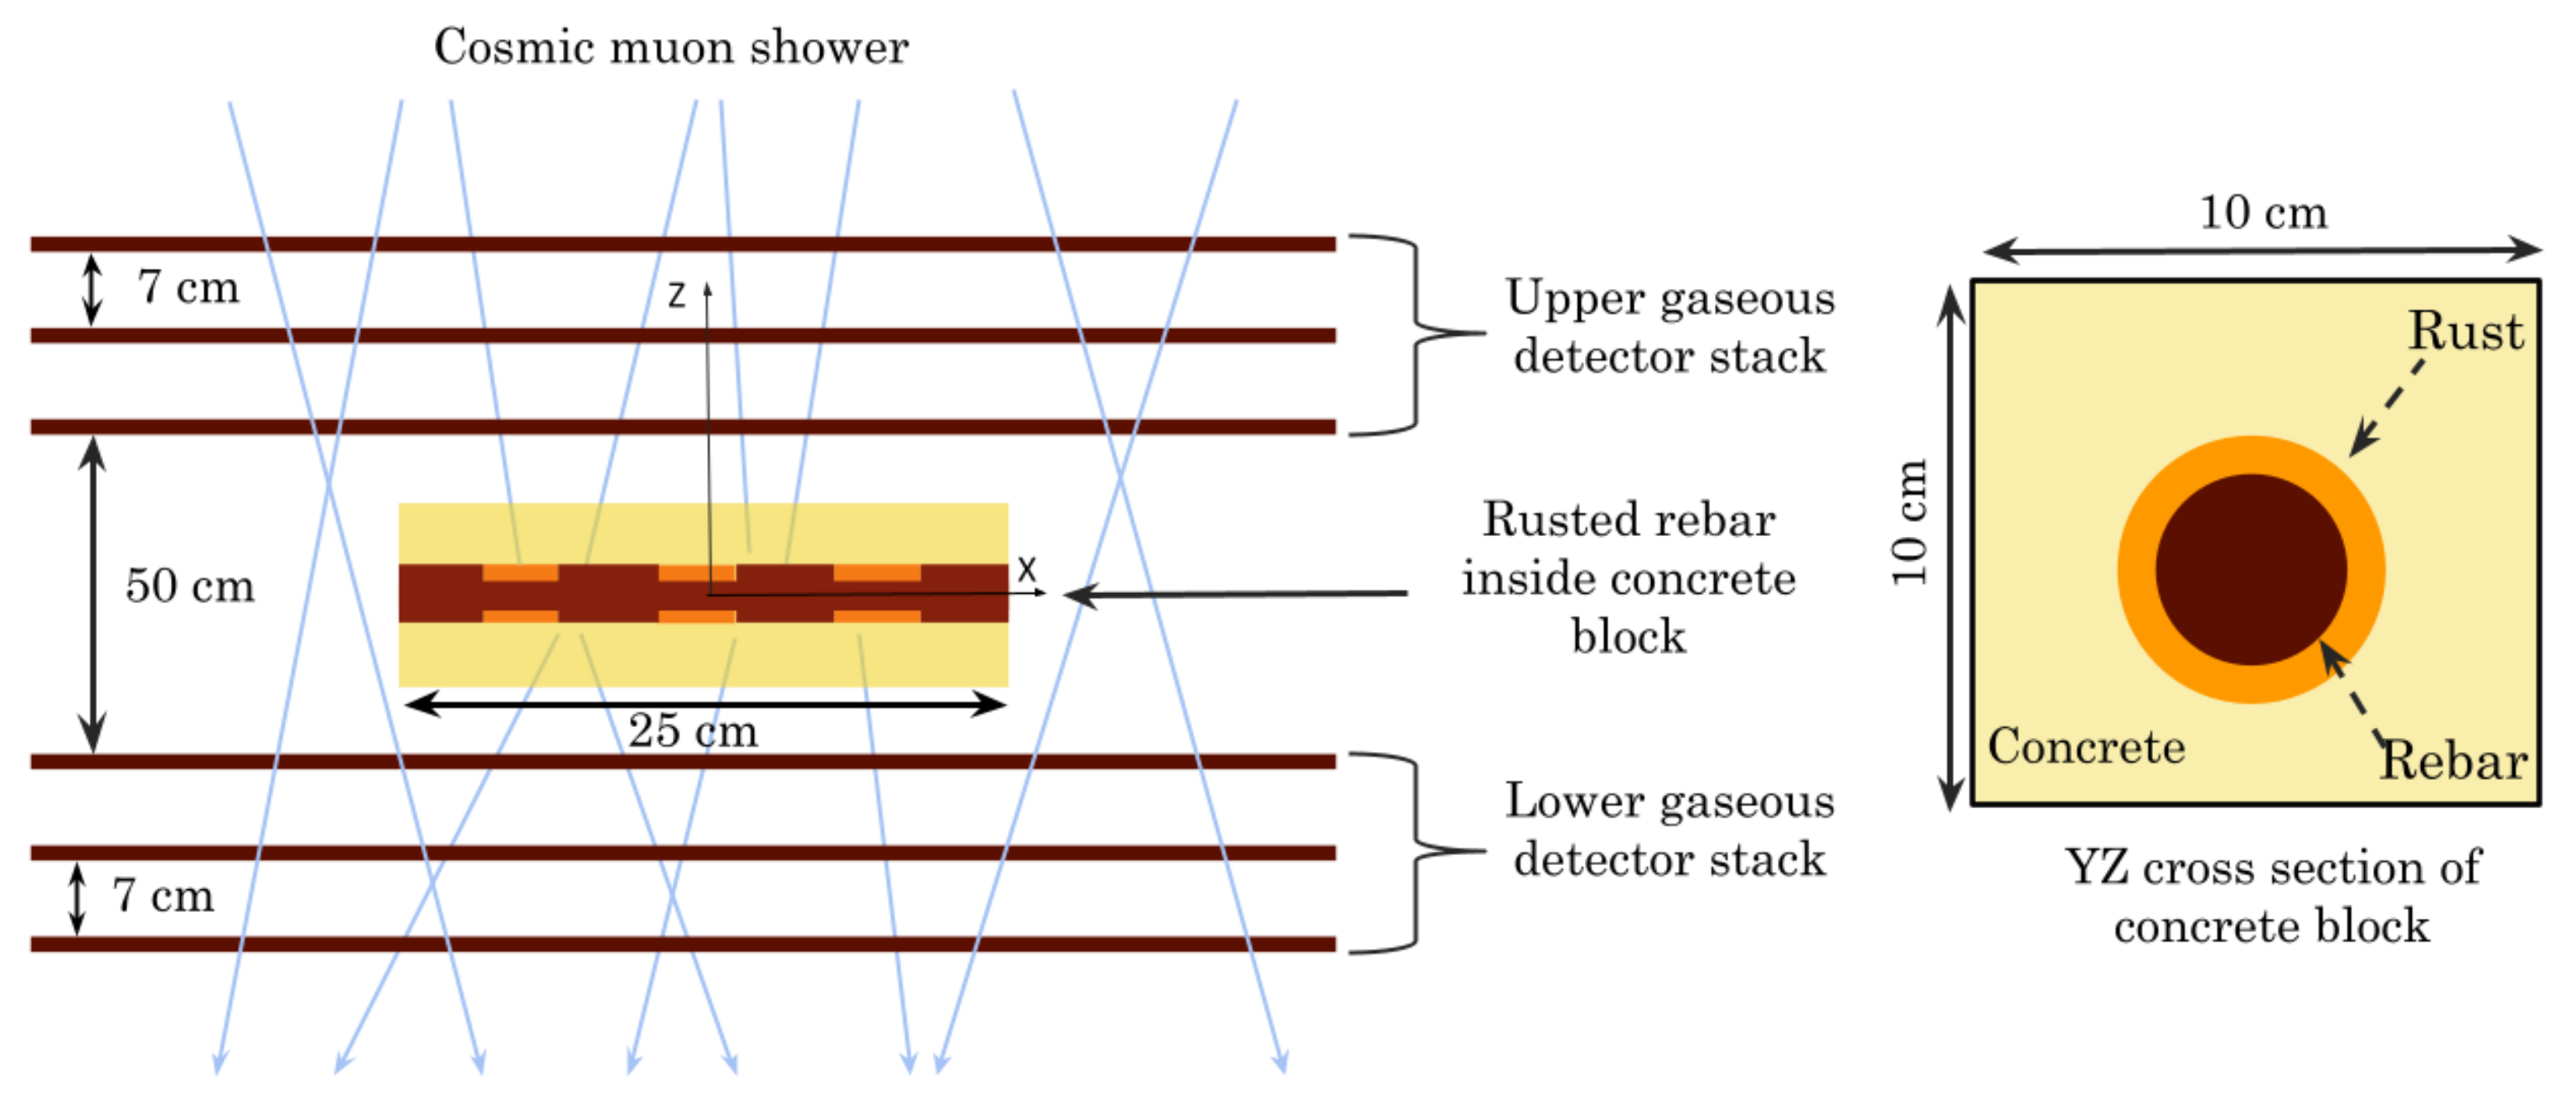
A concrete block with rusted steel rebar embedded at its centre has been modeled in Geant4. The rebar is placed in the middle of the RoI with its central axis lying along the X-axis. FeO composition has been used as rust with density 5.25 gm/cc, while steel and concrete have been simulated with density 7.87 gm/cc and 2.3 gm/cc, respectively. Figure 7 shows the inspection setup for RCC with multiple corroded regions. Two variations of rust percentage (15% and 30% of the cross section of the rebar) have been used for the current work (see Table 2 for more details). In the simulation geometry, the pair of detector layers has been placed at a distance of 50 cm while individual detectors have been separated by 7 cm. To ensure hit uniformity, the XY dimension of the detectors has been chosen as 60 cm × 60 cm and a spatial resolution of 200 µm has been assumed.
6.2. Analysis
Following the methods discussed in the above sections, the defective rebar has been analysed for quality assessment. The ROI has been divided into 160 × 80 pixels of area 2.5 mm × 2.5 mm. For each pixel, scattering vertex and deviation angle have been calculated for constructing projected S-maps. Next, PRM is applied to remove the background noise. The noise minimised images for different cases (perfect, 15% and 30% rust) have been shown in Figure 8. We used SVM classifier to inspect the rebar health with respect to a perfect (without rust) target. The classifier has been trained using two parameters, i.e., scattering vertex density (c) and average deviation angle (avg) extracted from the perfect rebar. The trained model is further used to test the different test cases (perfect, 15% and 30% rusted region) for three different muon exposure. The rebar pixels which were identified as concrete and vice versa are calculated as the Misclassification Rate (Rm). From Figure 8, we can assume that the rusted portion of the rebar will be identified as concrete. Hence, Rm for perfect rebar is considered as the training error and for other cases, it signifies as the measure of rust present in the defective rebar. Therefore, a 7.3% Rm for the 30% rust test case indicates that amount of rust present in this case is greater than the perfect and 15% rusted test case wherein Rm corresponds to 1.1% and 1.4%, respectively. The Rm values for different exposure have been shown in Table 3.
7. Conclusions
MST as an NDE to image rusted rebars has been investigated based on a numerical simulation. This article also emphasizes the use of a pattern recognition technique for high-quality discrimination of the concrete structure from the background for a lesser cosmic muon exposure. Furthermore, the produced radiographs have been analyzed using an SVM classifier not only for better defect recognition but also to estimate the degradation status. The classifier has been trained and validated using a simple configuration of blocks of pure materials before being used for the identification of contrast in a complex structure, namely RCC. The images obtained for defective cases have been compared to the perfect case and the efficacy of identification has been expressed in terms of misclassification rate (Rm). The present MST system has been found to be able to discriminate between low-Z and mid-Z materials, with 100% accuracy for a nominal exposure (24 h). In the same manner, for rebars with 15% and 30% thickness rusted, the (Rm) has been found to be increasing for a higher percentage of rust with the increased exposure. On the whole, the authors conclude that using the SVM classification model on MST data with nominal exposure (30 days) can be used to identify critical defects in civil structures. In spite of the natural smearing of muons, low radiation rate, and vast momentum distribution, muography can be a potential NDE candidate for monitoring degrading concrete infrastructure. Moreover, environmental parameters, detector efficiencies, resolutions, and setup orientation are several criteria that can impact the imaging. Although, unlike other imaging techniques, muography requires a longer duration of exposure, it has several suitabilities, such as availability of source at no cost, high penetration power, and non-hazardous nature.
Author Contributions
Conceptualization, S.D., S.T. and N.M.; methodology, S.D., S.T. and P.J.; software, S.D., S.T. and P.J.; validation, S.D., S.T., P.B., N.M. and S.M.; formal analysis, S.D. and S.T.; investigation, S.D., S.T., P.J., P.B., N.M. and S.M.; resources, N.M. and S.M.; data curation, S.D., P.J. and S.T.; writing—original draft preparation, S.D. and P.J.; writing—review and editing, S.T., P.B., N.M. and S.M.; visualization, S.D., S.T., P.J., P.B., N.M. and S.M.; supervision, N.M.; project administration, N.M. and S.M.; funding acquisition, N.M. and S.M. All authors have read and agreed to the published version of the manuscript.
Funding
This research was funded by Department of Atomic Energy, University Grants Commission and Government of India.
Institutional Review Board Statement
Not applicable.
Informed Consent Statement
Not applicable.
Data Availability Statement
Not applicable.
Conflicts of Interest
The authors declare no conflict of interest.
References
- Mattock, A.H.; Chen, K.; Soongswang, K. The behavior of reinforced concrete corbels. PCI J. 1976, 21, 52–77. [Google Scholar] [CrossRef] [Green Version]
- Shubin, A.A.; Tulin, P.K.; Potseshkovskaya, I.V. Research of the effect of the concrete reinforcement structure on the stress-strain state of structures. Int. J. Appl. Eng. Res. 2017, 12, 1742–1751. [Google Scholar]
- McGurn, J. Stainless steel reinforcing bars in concrete. In Proceedings of the International Conference of Corrosion and Rehabilitation of Reinforced Concrete Structures, Orlando, FL, USA, 8–11 December 1998; FHWA: Orlando, FL, USA, 1998. [Google Scholar]
- Dong, W.; Wu, Z.; Zhou, X.; Tan, Y. Experimental studies on void detection in concrete-filled steel tubes using ultrasound. Constr. Build. Mater. 2016, 128, 154–162. [Google Scholar] [CrossRef] [Green Version]
- Abdel-Qader, I.; Yohali, S.; Abudayyeh, O.; Yehia, S. Segmentation of thermal images for non-destructive evaluation of bridge decks. Ndt E Int. 2008, 41, 395–405. [Google Scholar] [CrossRef]
- Maierhofer, C.; Röllig, M.; Schlichting, J. Active thermography for evaluation of reinforced concrete structures. In Non-Destructive Evaluation of Reinforced Concrete Structures; Elsevier: Amsterdam, The Netherlands, 2010; pp. 370–402. [Google Scholar]
- Bungey, J. Sub-surface radar testing of concrete: A review. Constr. Build. Mater. 2004, 18, 1–8. [Google Scholar] [CrossRef]
- Sansalone, M.J.; Streett, W.B. Impact-Echo. Nondestructive Evaluation of Concrete and Masonry. The Book: Bullbrier Press, PA, United States. 1997. Available online: http://impact-echo.com/book/ (accessed on 30 September 2022).
- George, E.P. Cosmic rays measure overburden of tunnel. Commonw. Eng. 1955, 455. [Google Scholar]
- Alvarez, L.W.; Anderson, J.A.; Bedwei, F.E.; Burkhard, J.; Fakhry, A.; Girgis, A.; Goneid, A.; Hassan, F.; Iverson, D.; Lynch, G.; et al. Search for Hidden Chambers in the Pyramids: The structure of the Second Pyramid of Giza is determined by cosmic-ray absorption. Science 1970, 167, 832–839. [Google Scholar] [CrossRef] [Green Version]
- Nagamine, K. Geo-tomographic observation of inner-structure of volcano with cosmic-ray muons. J. Geogr. Chigaku Zasshi 1995, 104, 998–1007. [Google Scholar] [CrossRef] [Green Version]
- Saracino, G.; Amato, L.; Ambrosino, F.; Antonucci, G.; Bonechi, L.; Cimmino, L.; Consiglio, L.; Alessandro, R.; Luzio, E.D.; Minin, G.; et al. Imaging of underground cavities with cosmic-ray muons from observations at Mt. Echia (Naples). Sci. Rep. 2017, 7, 1181. [Google Scholar] [CrossRef] [Green Version]
- Yang, G.; Ireland, D.; Kaiser, R.; Mahon, D. Machine Learning for Muon Imaging. In Proceedings of the International Conference on Brain Inspired Cognitive Systems; Springer: Berlin/Heidelberg, Germany, 2018; pp. 808–817. [Google Scholar]
- Dobrowolska, M.; Velthuis, J.; Kopp, A.; Perry, M.; Pearson, P. Towards an application of muon scattering tomography as a technique for detecting rebars in concrete. Smart Mater. Struct. 2020, 29, 055015. [Google Scholar] [CrossRef]
- Niederleithinger, E.; Gardner, S.; Kind, T.; Kaiser, R.; Grunwald, M.; Yang, G.; Redmer, B.; Waske, A.; Mielentz, F.; Effner, U.; et al. Muon Tomography of the Interior of a Reinforced Concrete Block: First Experimental Proof of Concept. J. Nondestruct. Eval. 2021, 40, 1–14. [Google Scholar] [CrossRef]
- Tripathy, S.; Datta, J.; Majumdar, N.; Mukhopadhyay, S. Numerical evaluation of a muon tomography system for imaging defects in concrete structures. Eur. Phys. J. Plus 2021, 136, 824. [Google Scholar] [CrossRef]
- Schultz, L.J.; Borozdin, K.N.; Gomez, J.J.; Hogan, G.E.; McGill, J.A.; Morris, C.L.; Priedhorsky, W.C.; Saunders, A.; Teasdale, M.E. Image reconstruction and material Z discrimination via cosmic ray muon radiography. Nucl. Instrum. Meth. A 2004, 519, 687–694. [Google Scholar] [CrossRef]
- Clarkson, A.; Hamilton, D.J.; Hoek, M.; Ireland, D.G.; Johnstone, J.; Kaiser, R.; Keri, T.; Lumsden, S.; Mahon, D.F.; McKinnon, B.; et al. The design and performance of a scintillating-fibre tracker for the cosmic-ray muon tomography of legacy nuclear waste containers. Nucl. Instrum. Methods Phys. Res. Sect. Accel. Spectr. Detect. Assoc. Equip. 2014, 745, 138–149. [Google Scholar] [CrossRef] [Green Version]
- Jonkmans, G.; Anghel, V.; Jewett, C.; Thompson, M. Nuclear waste imaging and spent fuel verification by muon tomography. Ann. Nucl. Energy 2013, 53, 267–273. [Google Scholar] [CrossRef] [Green Version]
- Martínez Ruiz del Arbol, P.; Gomez Garcia, P.; Diez Gonzalez, C.; OrioAlonso, A. Non-destructive testing of industrial equipment using muon radiography. Philos. Trans. R. Soc. 2019, 377, 20180054. [Google Scholar] [CrossRef] [PubMed] [Green Version]
- Dobrowolska, M.; Velthuis, J.; Kopp, A.; De Sio, C.; Milne, R.; Pearson, P. Development of muon scattering tomography for a detection of reinforcement in concrete. Eng. Res. Express 2021, 3, 035037. [Google Scholar] [CrossRef]
- Highland, V.L. Some Practical Remarks on Multiple Scattering. Nucl. Instrum. Meth. 1975, 129, 497. [Google Scholar] [CrossRef]
- Allison, J.; Amako, K.; Apostolakis, J.; Araujo, H.; Arce Dubois, P.; Asai, M.; Barrand, G.; Capra, R.; Chauvie, S.; Chytracek, R.; et al. Geant4 developments and applications. IEEE Trans. Nucl. Sci. 2006, 53, 270–278. [Google Scholar] [CrossRef] [Green Version]
- Tripathy, S.; Datta, J.; Majumdar, N.; Mukhopadhyay, S. Material Discrimination in Cosmic Muon Imaging using Pattern Recognition Method. JINST 2020, 15, P06029. [Google Scholar] [CrossRef]
- Support Vectpr Machines. Available online: https://scikit-learn.org/stable/modules/svm.html (accessed on 30 September 2022).
- Cosmic Rays. Available online: https://pdg.lbl.gov/2020/reviews/rpp2020-rev-cosmic-rays.pdf (accessed on 30 September 2022).
- Moliere, G. Theory of scattering of fast charged particles ii multiple and multiple scattering. J. Nat. Res. 1948, 3, 78–97. [Google Scholar]
- Lynch, G.R.; Dahl, O.I. Approximations to multiple Coulomb scattering. Nucl. Instrum. Methods Phys. Res. Sect. Beam Interact. Mater. Atoms 1991, 58, 6–10. [Google Scholar] [CrossRef]
- Hagmann, C.; Lange, D.; Wright, D. Cosmic-ray shower generator (CRY) for Monte Carlo transport codes. In Proceedings of the 2007 IEEE Nuclear Science Symposium Conference Record, Honolulu, HI, USA, 26 October–3 November 2007; Volume 2, pp. 1143–1146. [Google Scholar]
- One-Vs-One Classifier. Available online: https://scikit-learn.org/stable/modules/generated/sklearn.multiclass.OneVsOneClassifier.html (accessed on 30 September 2022).
Figure 1.
XZ projection (left) and XY projection (right) of simulation setup.

Figure 2.
The incident muon hits have been marked by blue circles, and the incident track by solid blue line. The dotted blue line represents the extended incoming muon track vector. The muon hits on the lower set of detectors have been marked using red circles and the outgoing track using a solid red line. The extended outgoing track vector is marked using dotted red line. The PoCA reconstructed point has been marked using a black circle.

Figure 3.
The figure showing the XY projection of scattering vertices (S-map) demonstrates the image analysis technique. Each pixel is attributed the analysis parameter: scattering vertex density (c). The magnified section of the S-map displays the parameter (c) of the highlighted pixel.
Figure 3.
The figure showing the XY projection of scattering vertices (S-map) demonstrates the image analysis technique. Each pixel is attributed the analysis parameter: scattering vertex density (c). The magnified section of the S-map displays the parameter (c) of the highlighted pixel.

Figure 4.
S-maps of scattering vertices after applying PRM.

Figure 5.
Working principle of an SVM classifier algorithm. The two classes are represented by green triangles and red squares. A decision boundary separating the two classes is defined and optimized by maximizing the distance between extreme vector points.
Figure 5.
Working principle of an SVM classifier algorithm. The two classes are represented by green triangles and red squares. A decision boundary separating the two classes is defined and optimized by maximizing the distance between extreme vector points.

Figure 6.
c (per minute) vs. avg (degree) plot for 1 h, 5 h, and 24 h data.

Figure 7.
Simulation setup for a rusted rebar. The rusted region (orange) of the steel rebar (brown) is enclosed within the concrete block (yellow).
Figure 7.
Simulation setup for a rusted rebar. The rusted region (orange) of the steel rebar (brown) is enclosed within the concrete block (yellow).

Figure 8.
Scattering vertices density (c) plots for (a) Whole rod without rust, (b) 15% rust, and (c) 30% rust. PRM has been used to eliminate the noisy background. The concrete mixture has been clearly distinguished from the steel rod in all three images. The rusted part has been shown to be distinguished from steel rod in (b,c). The increasing defects involving the rusted parts are reflected in the reconstructed images too.


Table 1.
Misclassification rate (Rm) for different combination of material blocks.
| Exposure Time (h) | Al-Fe | Fe-Pb | Pb-U |
|---|---|---|---|
| 1 | 4.5 | 7.3 | 25.7 |
| 5 | 0.0 | 0.3 | 1.9 |
| 24 | 0.0 | 0.0 | 0.5 |
Table 2.
Specifications of the rusted rebar for different cases.
| Rust Type | Rebar Diameter (mm) | Rust Thickness (mm) |
|---|---|---|
| Without rust | 30.0 | 0.0 |
| 15% rust | 25.5 | 2.25 |
| 30% rust | 21.0 | 4.5 |
Table 3.
Misclassification rate (Rm) for different percentage of rust.
| Exposure Time (Days) | Without Rust | 15% Rust | 30% Rust |
|---|---|---|---|
| 3 | 22.3 | 23.0 | 27.8 |
| 15 | 4.5 | 10.9 | 14.7 |
| 30 | 1.1 | 1.4 | 7.3 |
Publisher’s Note: MDPI stays neutral with regard to jurisdictional claims in published maps and institutional affiliations. |
© 2022 by the authors. Licensee MDPI, Basel, Switzerland. This article is an open access article distributed under the terms and conditions of the Creative Commons Attribution (CC BY) license (https://creativecommons.org/licenses/by/4.0/).
Share and Cite
MDPI and ACS Style
Das, S.; Tripathy, S.; Jagga, P.; Bhattacharya, P.; Majumdar, N.; Mukhopadhyay, S. Muography for Inspection of Civil Structures. Instruments 2022, 6, 77. https://doi.org/10.3390/instruments6040077
AMA Style
Das S, Tripathy S, Jagga P, Bhattacharya P, Majumdar N, Mukhopadhyay S. Muography for Inspection of Civil Structures. Instruments. 2022; 6(4):77. https://doi.org/10.3390/instruments6040077
Chicago/Turabian StyleDas, Subhendu, Sridhar Tripathy, Priyanka Jagga, Purba Bhattacharya, Nayana Majumdar, and Supratik Mukhopadhyay. 2022. "Muography for Inspection of Civil Structures" Instruments 6, no. 4: 77. https://doi.org/10.3390/instruments6040077