
Low-Cost Hyperspectral Imaging Device for Portable Remote Sensing
by
 , , , and
Eleftheria Maria Pechlivani
* ,
,
Athanasios Papadimitriou
 ,
,
Sotirios Pemas
,
Nikolaos Giakoumoglou
 and
and
Dimitrios Tzovaras
Center for Research and Technology Hellas, Information Technologies Institute, 6th km Charilaou-Thermi Road, 57001 Thessaloniki, Greece
*
Author to whom correspondence should be addressed.
Instruments 2023, 7(4), 32; https://doi.org/10.3390/instruments7040032
Submission received: 11 September 2023
/
Revised: 6 October 2023
/
Accepted: 17 October 2023
/
Published: 19 October 2023
Abstract
:Hyperspectral imaging has revolutionized various scientific fields by enabling a detailed analysis of objects and materials based on their spectral signatures. However, the high cost and complexity of commercial hyperspectral camera systems limit their accessibility to researchers and professionals. In this paper, a do-it-yourself (DIY) hyperspectral camera device that offers a cost-effective and user-friendly alternative to hyperspectral imaging is presented. The proposed device leverages off-the-shelf components, commercially available hardware parts, open-source software, and novel calibration techniques to capture and process hyperspectral imaging data. The design considerations, hardware components, and construction process are discussed, providing a comprehensive guide for building the device. Furthermore, the performance of the DIY hyperspectral camera is investigated through experimental evaluations with a multi-color 3D-printed box in order to validate its sensitivities to red, green, blue, orange and white colors.
1. Introduction
In recent years, hyperspectral (HS) imaging has emerged as a pioneering technique within the field of remote sensing and spectral analysis [1], playing a crucial role in gathering intricate and comprehensive data about the surrounding environment. HS imaging includes the capture and subsequent processing of images encompassing an extensive range of wavelengths (or spectral bands), often extending beyond the limits of the visible spectrum. This capability enables the identification and examination of subtle variations in the spectral characteristics of materials, offering valuable insights into the composition, structure, and attributes of the object or scene under observation [2].
HS imaging has a wide range of applications, including remote sensing [3], agriculture [4], food quality control [5], biomedical imaging [6], and environmental monitoring [7]. HS imaging can be used to monitor crop health and identify areas of stress or disease [8]. Furthermore, recent studies have explored the integration of artificial intelligence (AI) with HS imaging for the identification of plant diseases [9]. By analyzing the spectral signature of plants [10], subtle changes in chlorophyll levels, water content, and nutrient uptake can be detected, allowing farmers to optimize crop management strategies. In addition, HS imaging can also be used to analyze soil properties [11], such as organic matter content, moisture levels, and nutrient availability. This information can help in optimizing fertilizer applications and improve soil health.
However, while HS imaging has many advantages over conventional imaging techniques, the cost of HS imagers can be prohibitive. While it is feasible to obtain commercially available HS imaging systems, the cost of such systems varies from USD 10,000 to USD 100,000 [12], which is a significant barrier for many potential users and applications. As a result, there is a need for the development of low-cost HS systems. This cost barrier has motivated researchers to develop low-cost HS imaging systems that can be used in portable and field-based applications. One area of interest in HS imaging is the development of do-it-yourself (DIY) HS cameras, which are low-cost and easy-to-build alternatives to commercial HS cameras. DIY HS cameras are typically built using off-the-shelf components, such as a monochrome or RGB camera and a diffraction grating. The wavebands covered by HS imagers can vary depending on the specific application and the design of the instrument [13]. Some imagers cover the visible spectrum (400–700 nm), while others extend into the near-infrared (NIR, 700–2500 nm) or short-wave infrared (SWIR, 1000–2500 nm) regions. Some HS imagers can even cover the thermal infrared (TIR, 8000–15,000 nm) region. For visible and near-infrared (NIR) wavebands, HS imagers can have a wide FOV [14], typically ranging from a few degrees to over 100 degrees.
In this study, a low-cost DIY HS device housed in a 3D-printed case is introduced. The device is constructed using off-the-shelf components, resulting in a significant reduction in the system’s cost compared to commercial parts for the hardware system. The remarkable feature of this HS imaging device lies in its cost-effectiveness, with a total expenditure of EUR 194.56. Designed for portability and ease of use in the field, the case is a versatile tool suitable for various applications. This enables the capture of HS images in remote locations without the necessity for bulky and expensive equipment. The case has been constructed using polyethylene terephthalate glycol (PETG) due to its waterproof [15] and heat resistant [16] properties, rendering the device suitable for high-moisture and intense-sunlight environments. Furthermore, it is highly customizable, allowing for modifications to meet the specific needs of each user. At the core of this HS camera is a Raspberry Pi, utilized for the capture of HS data, with the aid of a diffraction grating and a commercial camera lens. The total weight of the HS device has been designed to fall within the range typically required for most HS applications, such as unmanned aerial vehicle (UAV) HS systems, which necessitate a maximum weight of approximately 3–5 kg [17,18] depending on the circumstances of the application.
The paper is structured as follows: Section 2 provides a literature review with examples of related works. Section 3 includes the methodology of this device, such as hardware components specifications, usage software, additive manufacturing, and the assembly of the HS device. Section 4 presents the experimental framework with the calibration process, experimental setup, and the results and discussion for the proposed device. The study concludes with Section 5.
2. Related Works
This section examines various methodologies and combinations documented in the literature for DIY HS or spectral devices.
Botero-Valencia et al. [19] presented a low-cost HS acquisition device that is portable, can be used both indoors and outdoors, and has wireless communication to send data to the cloud or perform calculations directly within the device. The device has a low cost in relation to other DIY HS devices, of USD 271.95 or EUR 251.83. The spectral range is 410–940 nm and the material used is acrylonitrile butadiene styrene (ABS), which has similar properties to PETG.
Salazar-Vazquez et al. [20] presented a HS imaging device that operates from 400 nm to 1052 nm, can extract up to 315 wavebands, and is developed using consumer equipment, commercial 3D printers, and open-source software. The device has a total cost of USD 500 or EUR 462.74. The total weight of the HS device is 300 g, although there is no weight analysis for every part. The material used is polylactic acid (PLA), which has low waterproof [15] and heat-resistant [16] properties, compared to PETG.
Riihiaho et al. [21] designed a DIY push-broom HS imager with 3D-printed parts. The total cost of this imager is approximately EUR 2000 and the spectral value varies within the range of 400–600 nm. The 3D-printed parts are made of PLA. Even though the device is called DIY, most of the used parts are commercial, with a high cost.
Mao et al. [22] developed OpenHSI, which aimed to make compact push-broom HS imaging spectrometers more accessible to a wider audience by providing an open-source optical design and software platform. Two printing methods were used, the first using fused deposition of ABS and the second using an SLA printer with photosensitive resin. The spectral range is 400–830 nm and the total weight is 119 g.
Sigernes et al. [23] presented a study that demonstrates the construction of a push-broom HS camera using off-the-shelf components, low-cost camera heads, and a 3D printing mount. The total cost of this device is approximately USD 700 or EUR 647.84 and the total weight is around 200 g. The useful spectral range is 400 to 800 nm. The 3D-printed mount is made of PLA.
The proposed DIY HS device was compared with related devices across various parameters, including total building cost, total weight, spectral range, and the material used for the case. A summary of the specifications for all the presented devices can be found in Table 1, allowing for a comprehensive comparison of the DIY HS device with other devices in the same domain. A commercial hyperspectral camera has been included to provide a clearer comparison between commercial and DIY hyperspectral devices.
The comparative analysis presented in Table 1 highlights the distinct advantages of the proposed DIY HS device. With its low building cost of EUR 194.56, portability due to its lightweight design, and the ability to cover a broad spectral range, this device emerges as a cost-effective and accessible solution for HS imaging. Furthermore, the utilization of a polyethylene terephthalate glycol (PETG) case enhances its durability and suitability for various environmental conditions. These findings underscore the potential of the DIY HS device to popularize HS imaging, making it accessible to a wider range of researchers and professionals across diverse fields, from agriculture to environmental monitoring and beyond.
3. Methodology
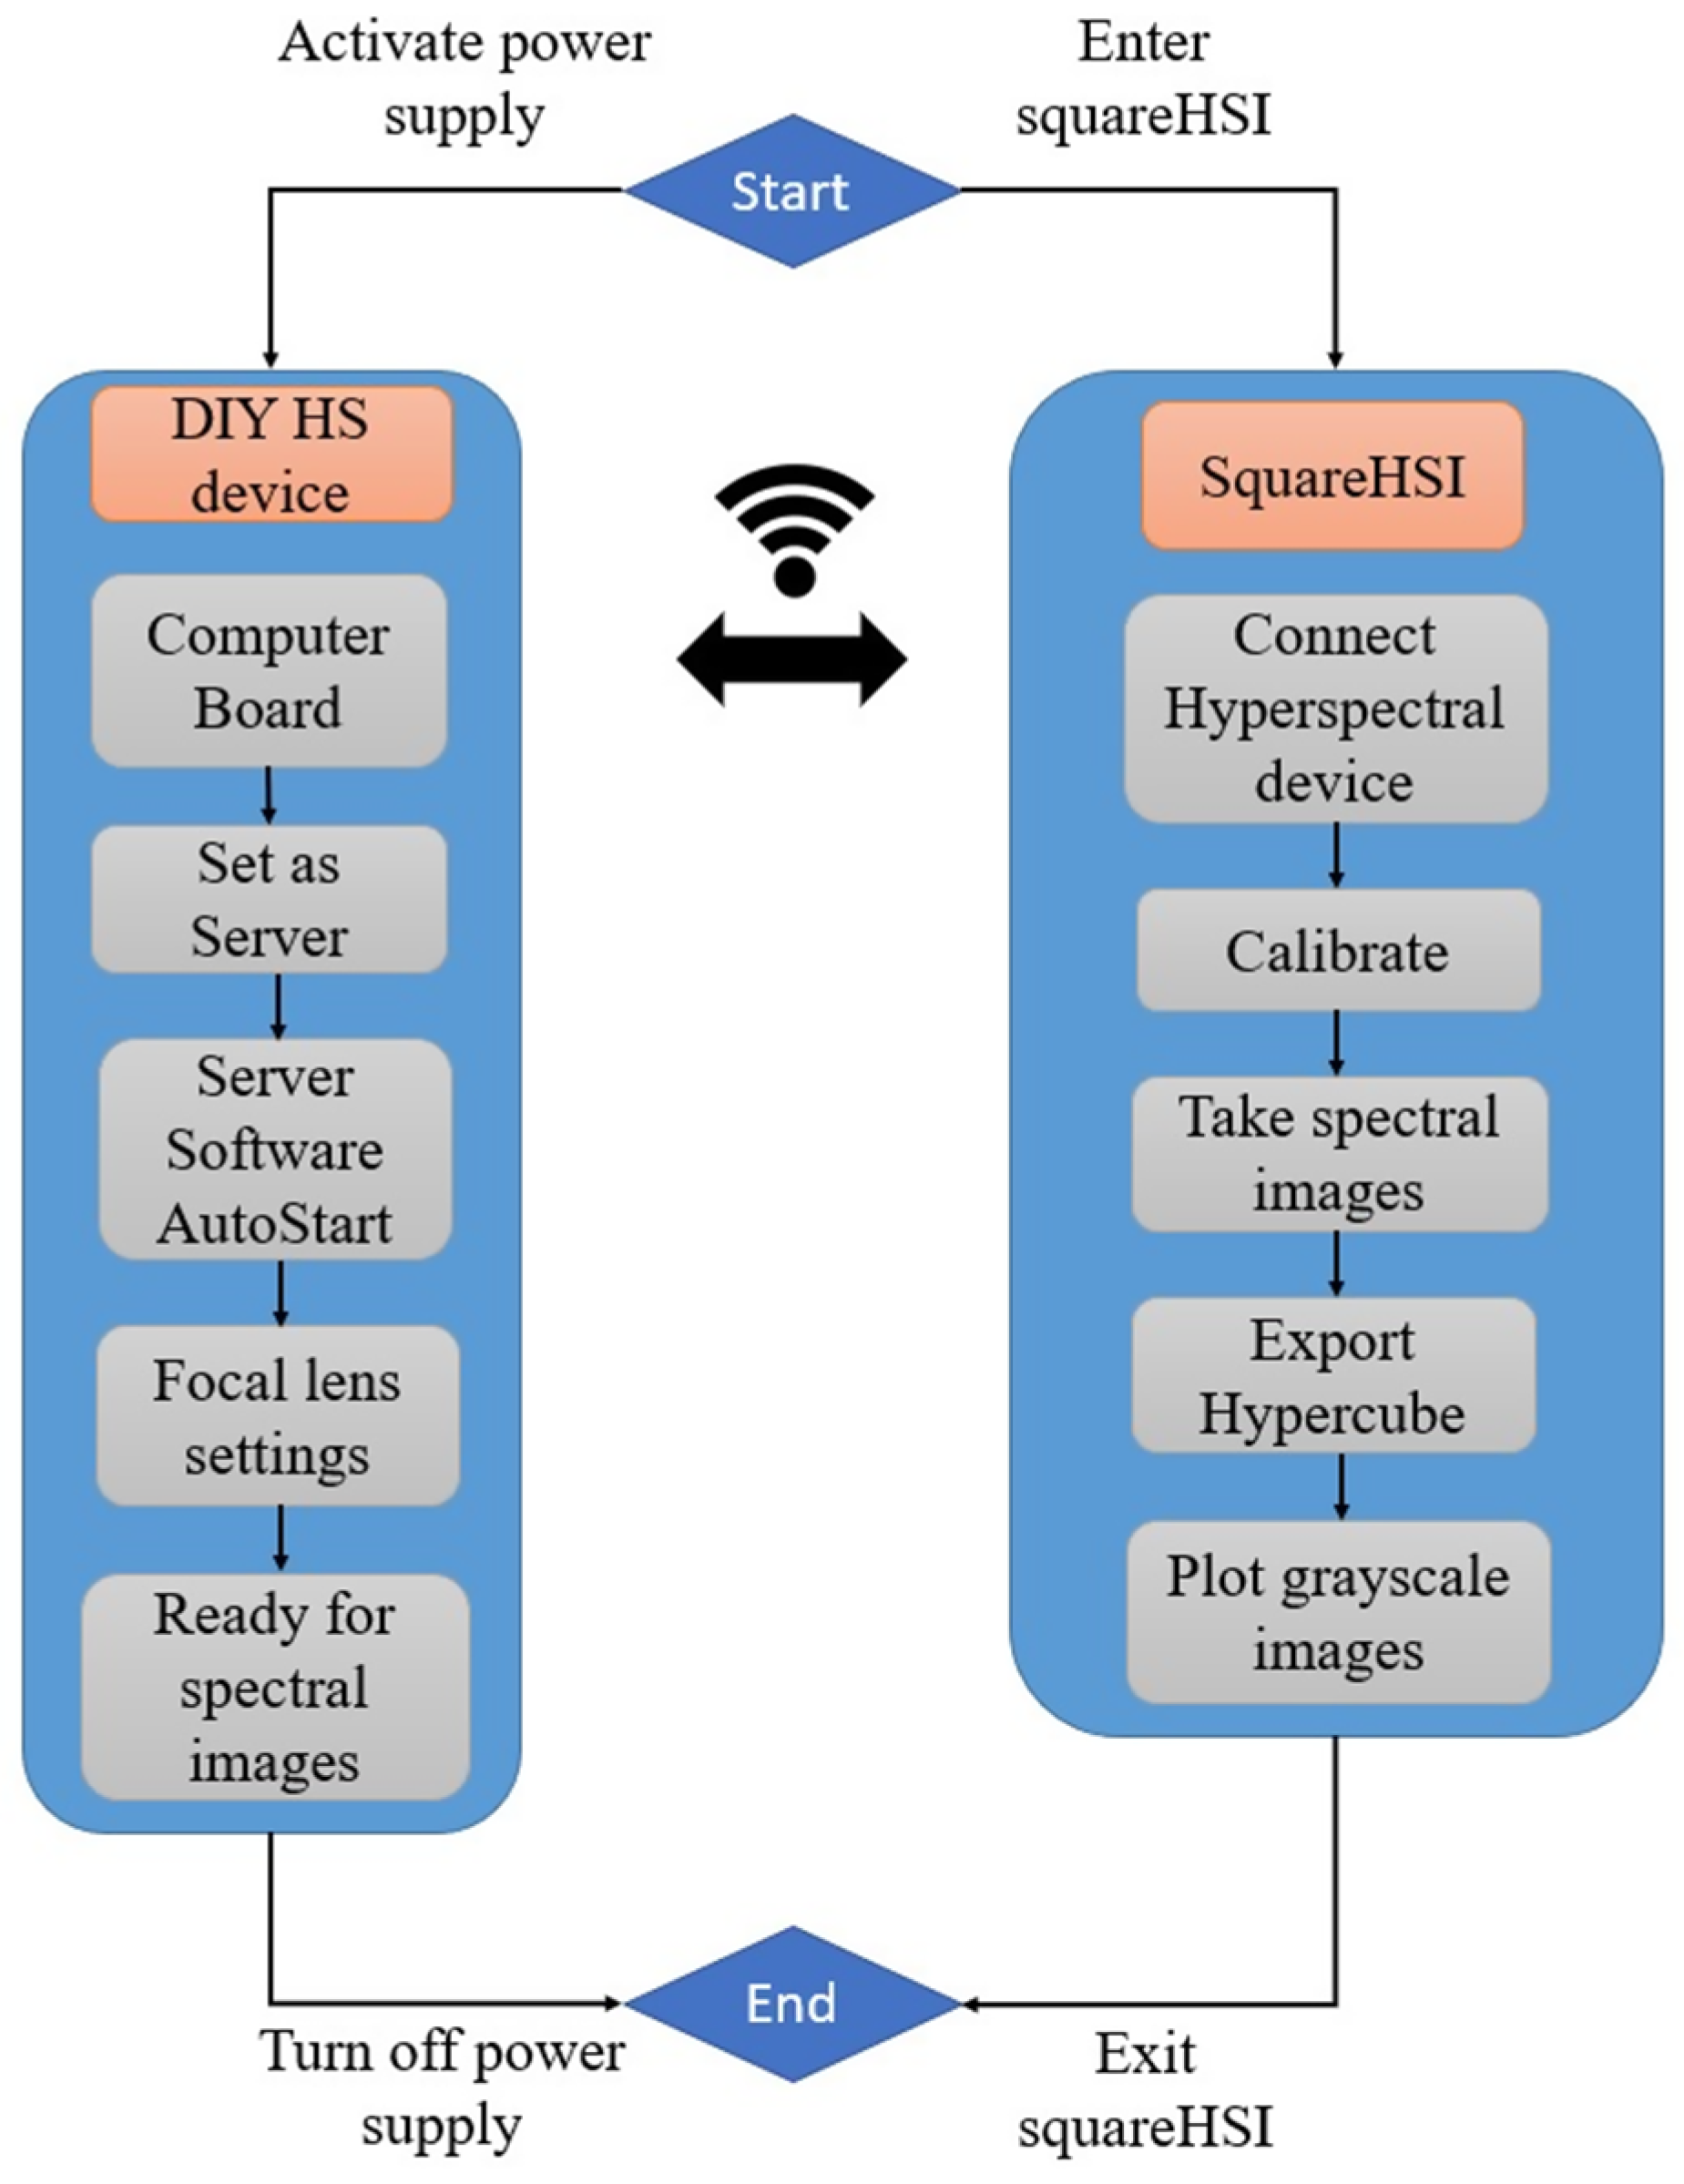
The architectural illustration of the proposed DIY HS device is presented in Figure 1. The operation of the device commences with the activation of the power supply and the launch of the client software, squareHSI (BetaV1). Subsequently, the computer board is configured as a server, and the server software is initiated automatically. Following this, the camera is calibrated using squareHSI, and the settings of the focal lens are customized, after which spectral images are captured by the device.
The overall construction steps can be delineated as follows. The initial step involves the selection of optical components in accordance with the device’s specific requirements. Subsequently, electronic component specifications are determined to align with the device’s needs, encompassing factors such as computational power, camera sensor resolution, and power consumption. To facilitate the export of HS images, a Linux-based server–client software is employed. Moreover, the device comprises numerous components that are constructed through additive manufacturing methods, like 3D printing. After that, all the components and 3D-printed parts are assembled. Finally, the calibration of the HS device is imperative before it can be utilized for the testing of a sample and the validation of the exported results.
3.1. Hardware Design
Table 2 offers an overview of commercially available hardware components, categorizing them into optical and electronic components.
3.1.1. Hardware Components
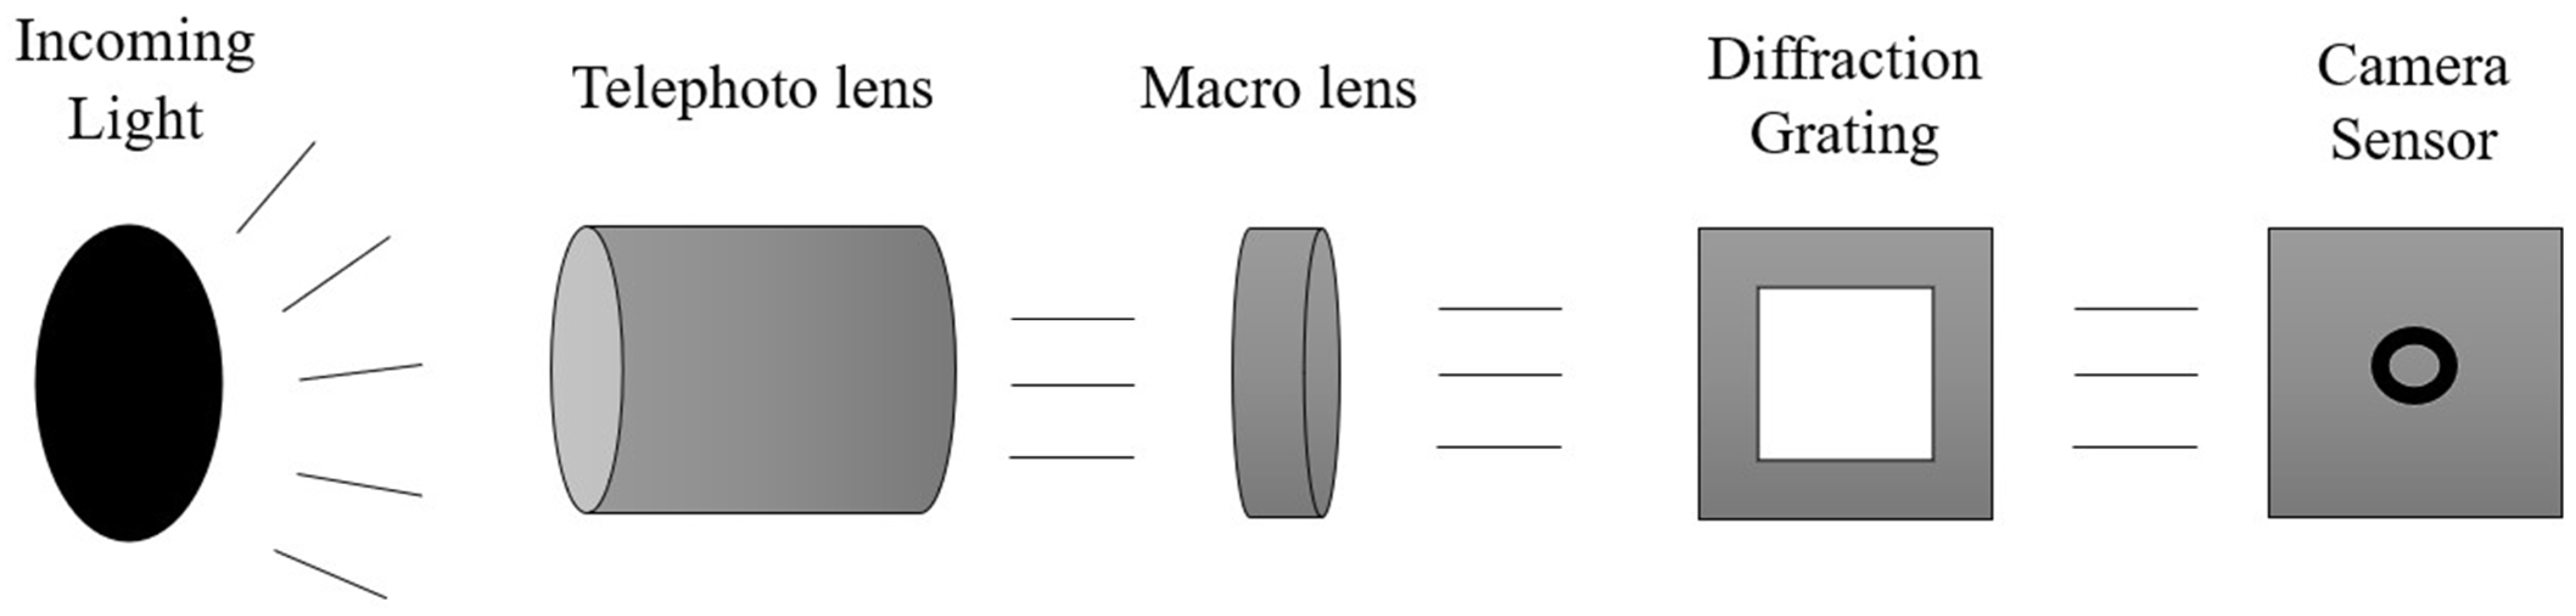
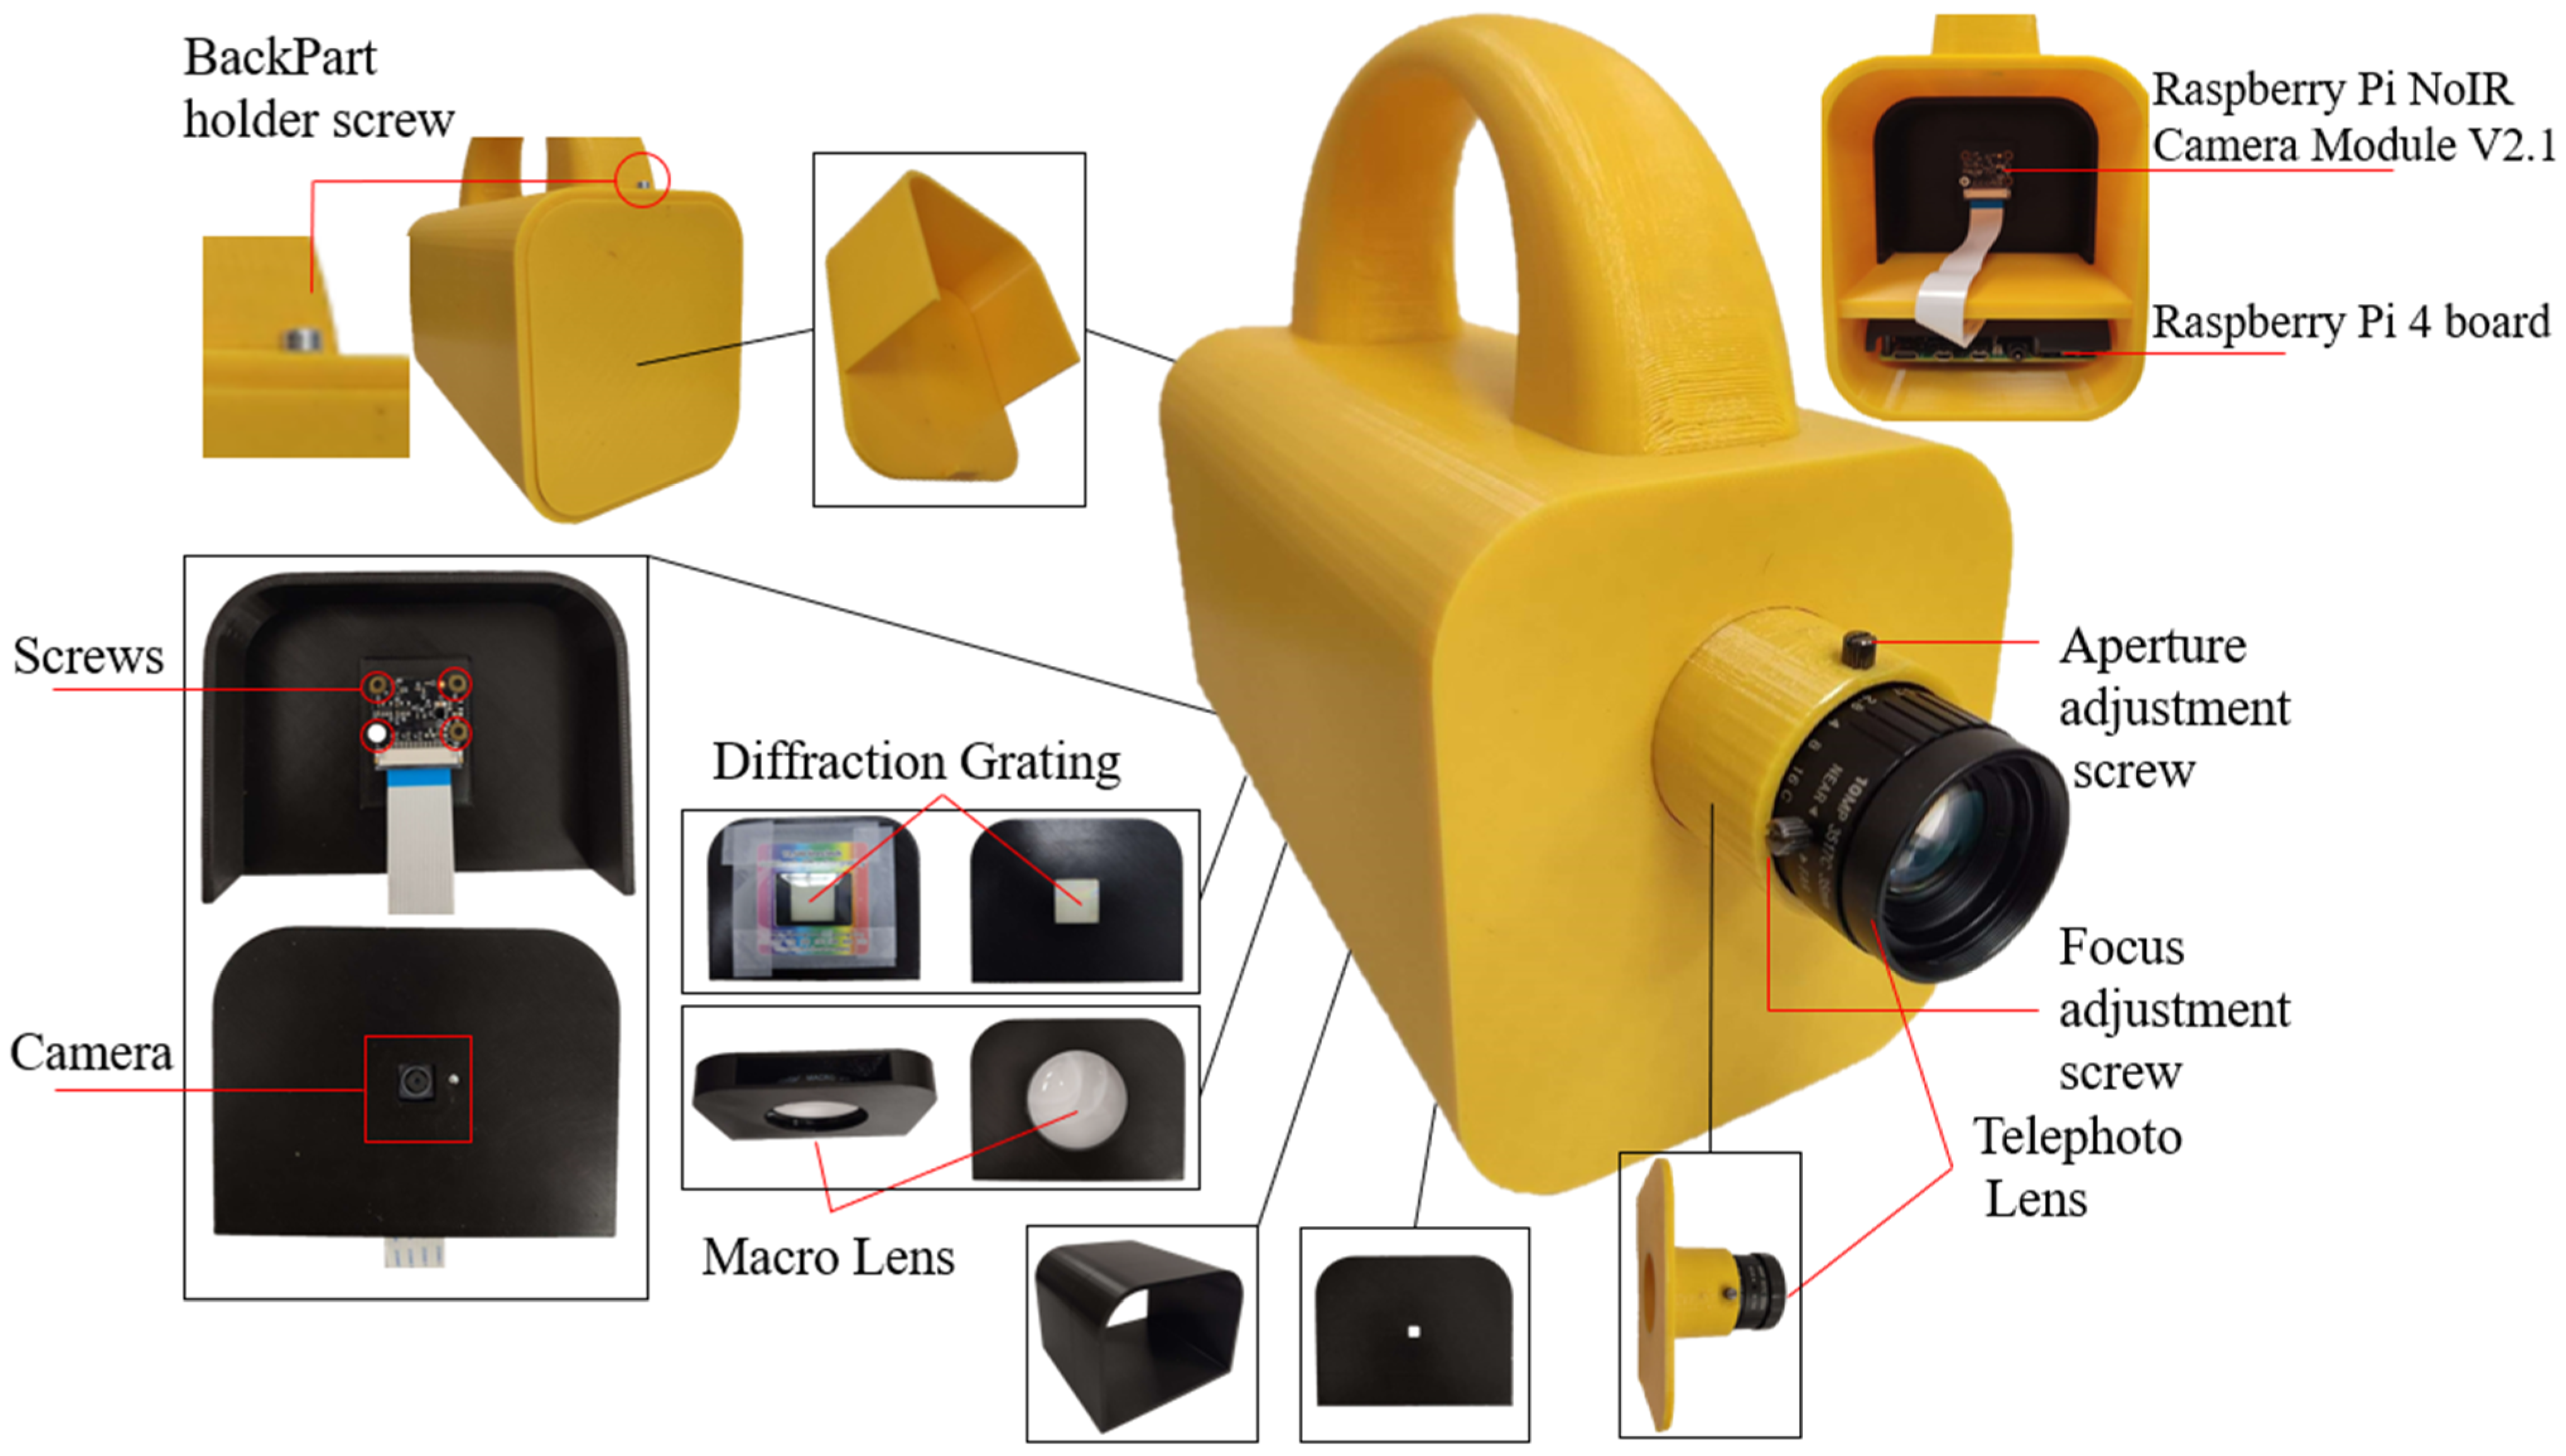
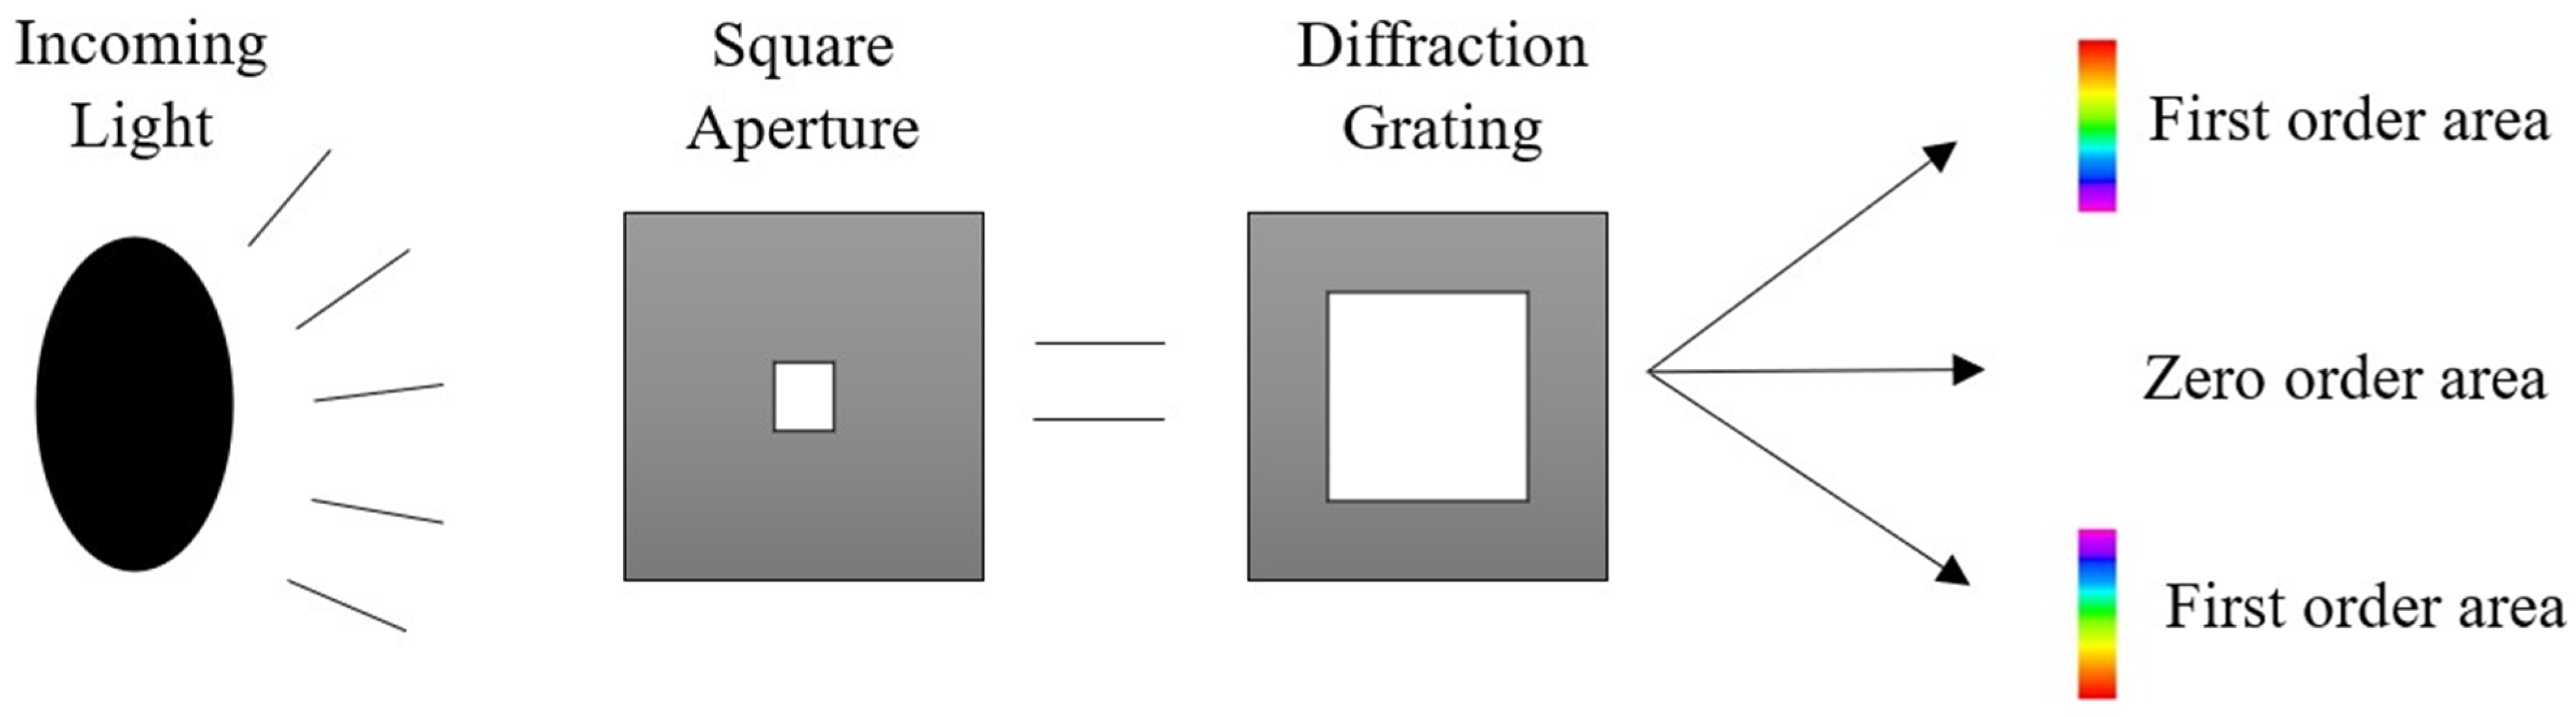
In the proposed HS device, light is gathered by the front telephoto lens through a narrow beam, with a 3D-printed square aperture that is required in order to control the amount of light admitted through the optical system. Subsequently, this light is diffracted using a grating featuring 5319 lines/cm across the camera’s sensor. The optical elements are securely positioned relative to each other, and any stray light attempting to enter the sensor is effectively blocked by the 3D-printed enclosure [25]. The alignment of the camera sensor and grating with the slit [26] is critical for acquiring accurate spectral data. Misalignment can result in slanted emission lines in the captured images [21]. To maintain the stability of the aforementioned optical components, additional interior parts were designed and constructed. To ensure the safe separation of the front lens from the diffraction grating, maintaining the requisite distance for a HS device, a 3D-printed extension part was introduced. Following this, a macro lens is installed to achieve higher magnification on the tested surface. The combination of the front camera and macro lens facilitates the capture of detailed images in the test sample. To obtain the desired images with the necessary field of view [14], a telephoto lens is affixed to the front of the HS device. This telephoto lens boasts a 10 MP resolution, carefully selected to match the camera sensor’s resolution, along with a focal length of 32 mm. It features an adjustable aperture ring (ranging from F1.7 to F16) and a focus ring for precise adjustments. This front lens provides powerful zoom capabilities, allowing for accurate focusing on distant subjects.
The 3D-printed mount for the front lens was attentively designed to ensure the lens’s stability while effectively blocking unwanted light beams. Simultaneously, it permits the adjustment of both aperture and focal length. The chosen macro lens offers +10 magnification, the maximum achievable value for macro lenses of its size, and features a diameter of 52 mm to maintain the compact dimensions of the device. Additionally, the diffraction grating boasts double-axis spectral analysis capabilities and a resolution of 5319 lines/cm. The camera sensor selected for this setup is the Raspberry Pi NoIR camera module, known for its efficiency and cost-effectiveness in capturing high-quality images. Specifically, the Raspberry Pi NoIR camera module V2.1 utilized here is equipped with an 8 MP Sony IMX219 CMOS sensor, offering an image area of 3.68 × 2.76 mm, a diagonal measurement of 4.6 mm, and pixel dimensions of 1.12 µm × 1.12 µm. The NoIR camera lacks an infrared (NoIR) filter on the lens, rendering it particularly well-suited for infrared photography and low-light (twilight) environments.
HS imaging typically includes the processing and analysis of substantial volumes of spectral data, necessitating the use of specialized software tools and programming languages. Therefore, a Raspberry Pi 4 [22] single-board computer is employed for this purpose. The Raspberry pi 4 board that is used comes with 8 GB of RAM and 16 GB of internal storage with MicroSD. This particular single-board computer (SBC), due to its Broadcom BCM2711, quad-core Cortex-A72 (ARM v8) 64-bit SoC @ 1.5 GHz processor, is suitable for tasks that require a significant computing power, as well as the management of multiple live data in projects like computer vision, machine learning [27], etc. The operational wireless connectivity range for the DIY HS device according to Raspberry’s 2.4 GHz and 5.0 GHz IEEE 802.11ac specifications [28] is 30–35 m indoors [29].
This DIY HS device in combination with the open-source software squareHSI can extract HS cubes with a 127 × 125-pixel spatial resolution up to 290 wavebands from 379 to 937 nm, which is a very approximate spectral value to that of a professional HS camera. The resulting spectral resolution is 1.9241 nm per waveband and can be calculated from the wavelength range divided by the number of wavebands (290) of the proposed device.
3.1.2. Bill of Material
The proposed DIY device offers advantages in terms of both weight and cost compared to a professional HS camera available in the commercial market. Table 3 and Table 4 provide the detailed specifications, costs, and part numbers of the optical and electronic components. These specifications and costs were sourced directly from the manufacturers or the authorized Greek reseller’s official websites as of March 2023, and they are presented exclusive of VAT.
The power supply for the DIY HS device is contingent upon the combined maximum power consumption of the Raspberry Pi 4 and Raspberry Pi NoIR camera module, which totals approximately 10 Watts. Considering the intended usage of the HS device for a few hours each day, the power supply’s stored energy capacity needs to be approximately 20,000 mAh to ensure a substantial operational lifespan. To fulfill this requirement, a Veger power bank with a capacity of 20,000 mAh has been selected. This power bank also offers Quick Charge 3.0 compatibility, providing the added convenience of easy replacement in the event of any malfunction or issues with functionality.
3.2. Hardware Assembly
In this section, the assembly of both the optical and electronic components is presented, outlining the steps followed in the construction of the DIY HS device.
3.2.1. Optical Assembly
For the DIY HS device to operate effectively and generate the desired HS data cubes, precise placement of the hardware components is crucial, particularly the optical elements. The front lens, which functions as a telephoto lens akin to those found in conventional cameras, plays a pivotal role in providing the requisite field of view. Its robust zoom capabilities enable enhanced focusing on distant objects. Following this, the inclusion of a +10-macro lens becomes imperative, further improving zoom capabilities for both small and distant samples. The critical component that transforms the device into a spectral imaging system is the diffraction grating, strategically positioned in front of the camera sensor. A visual representation of the final optical configuration of the device is depicted in Figure 2.
3.2.2. Electronic Assembly
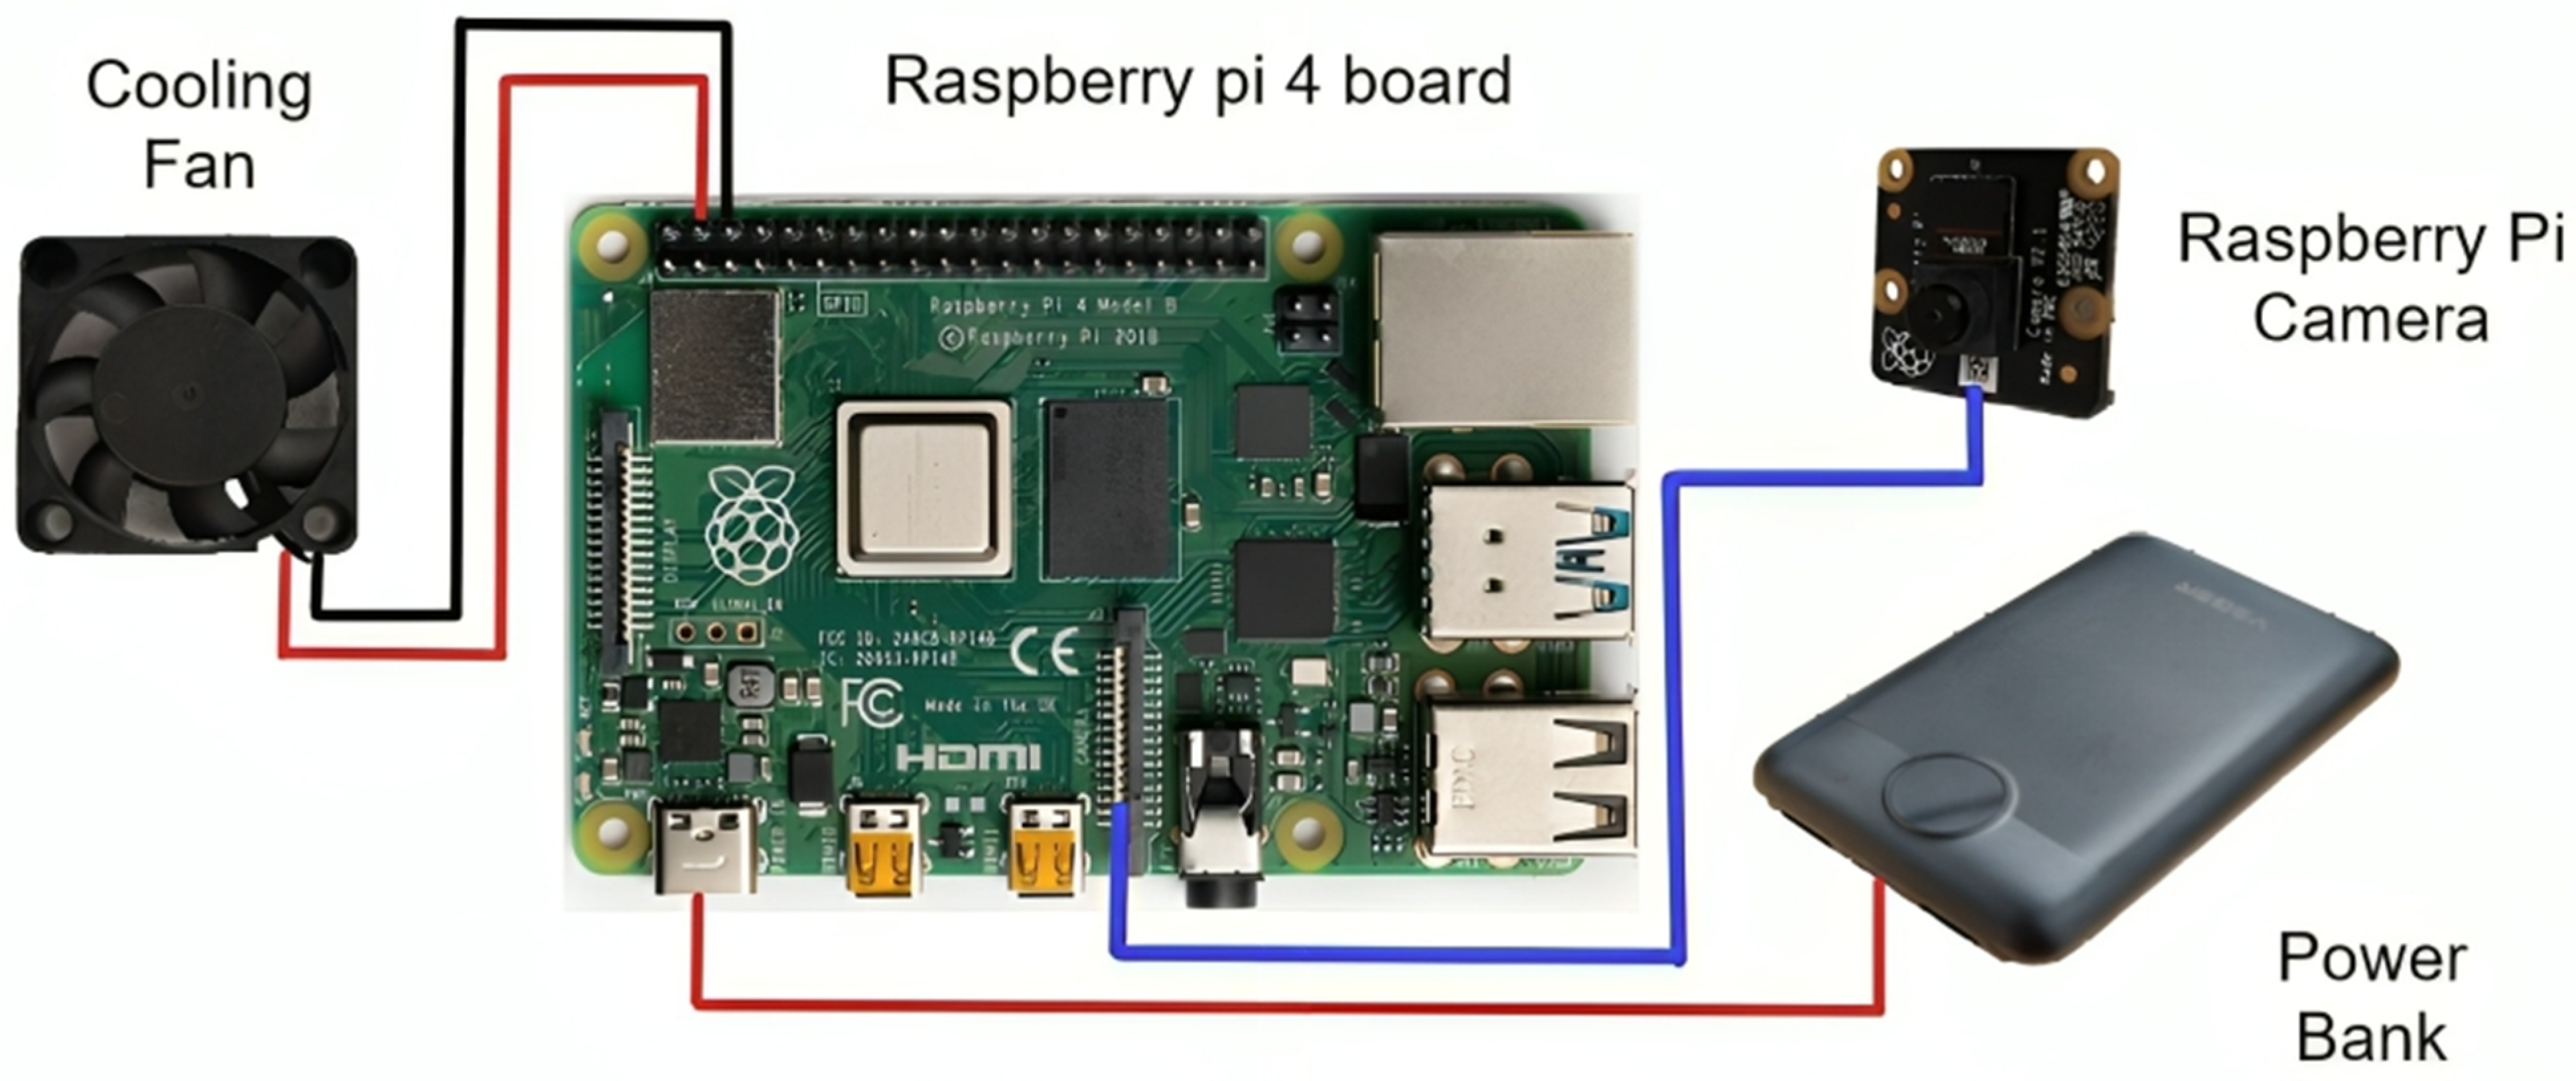
Following the optical configuration, the electronic components are connected, as illustrated in Figure 3. The camera sensor is linked to the two-lane MIPI CSI camera port of the Raspberry Pi 4 board. Power is provided to the Raspberry Pi 4 via the USB-C port, sourced from the power bank. Additionally, the cooling fan is connected to the Raspberry Pi’s pins 4 and 6 for effective temperature management.
3.3. Software Overview
The HS device operates in the capacity of an image acquisition server. Upon activation, it establishes a Wi-Fi network and remains operational as long as it is powered on. It runs the HypRaspCam (version 1.0) [20] program, which enables it to receive and process image requests originating from the client software. The client, a Linux-based device, becomes active once the image acquisition software, squareHSI, is installed on it. This open-source and freely available squareHSI software harnesses the services provided by the HS device server to capture images.
After image acquisition, the client software is responsible for constructing and exporting hypercubes. Hypercubes represent a specific data structure comprising a collection of images captured at various wavelengths or spectral bands. These hypercubes serve as valuable resources for the analysis and extraction of information from the acquired images. Subsequently, wavelength peaks can be extracted from the hypercubes and create spectral images for further processing and analysis.
3.4. Additive Manufacturing
The design of the 3D-printed parts was thoroughly designed, with careful attention given to the dimensions and characteristics of the hardware components. To ensure optimal functionality, specific hardware elements were designed to be exposed, as some hardware parts needed to be uncovered for better performance. Utmost precision was employed in the creation of the 3D-printed cases, ensuring a perfect fit that eliminated any potential gaps that could affect proper operation. The primary objective of the design process revolved around developing a user-friendly final prototype, enabling potential users to effortlessly handle and assemble the components with ease and simplicity.
3.4.1. 3D Printed Parts of the DIY HS Device
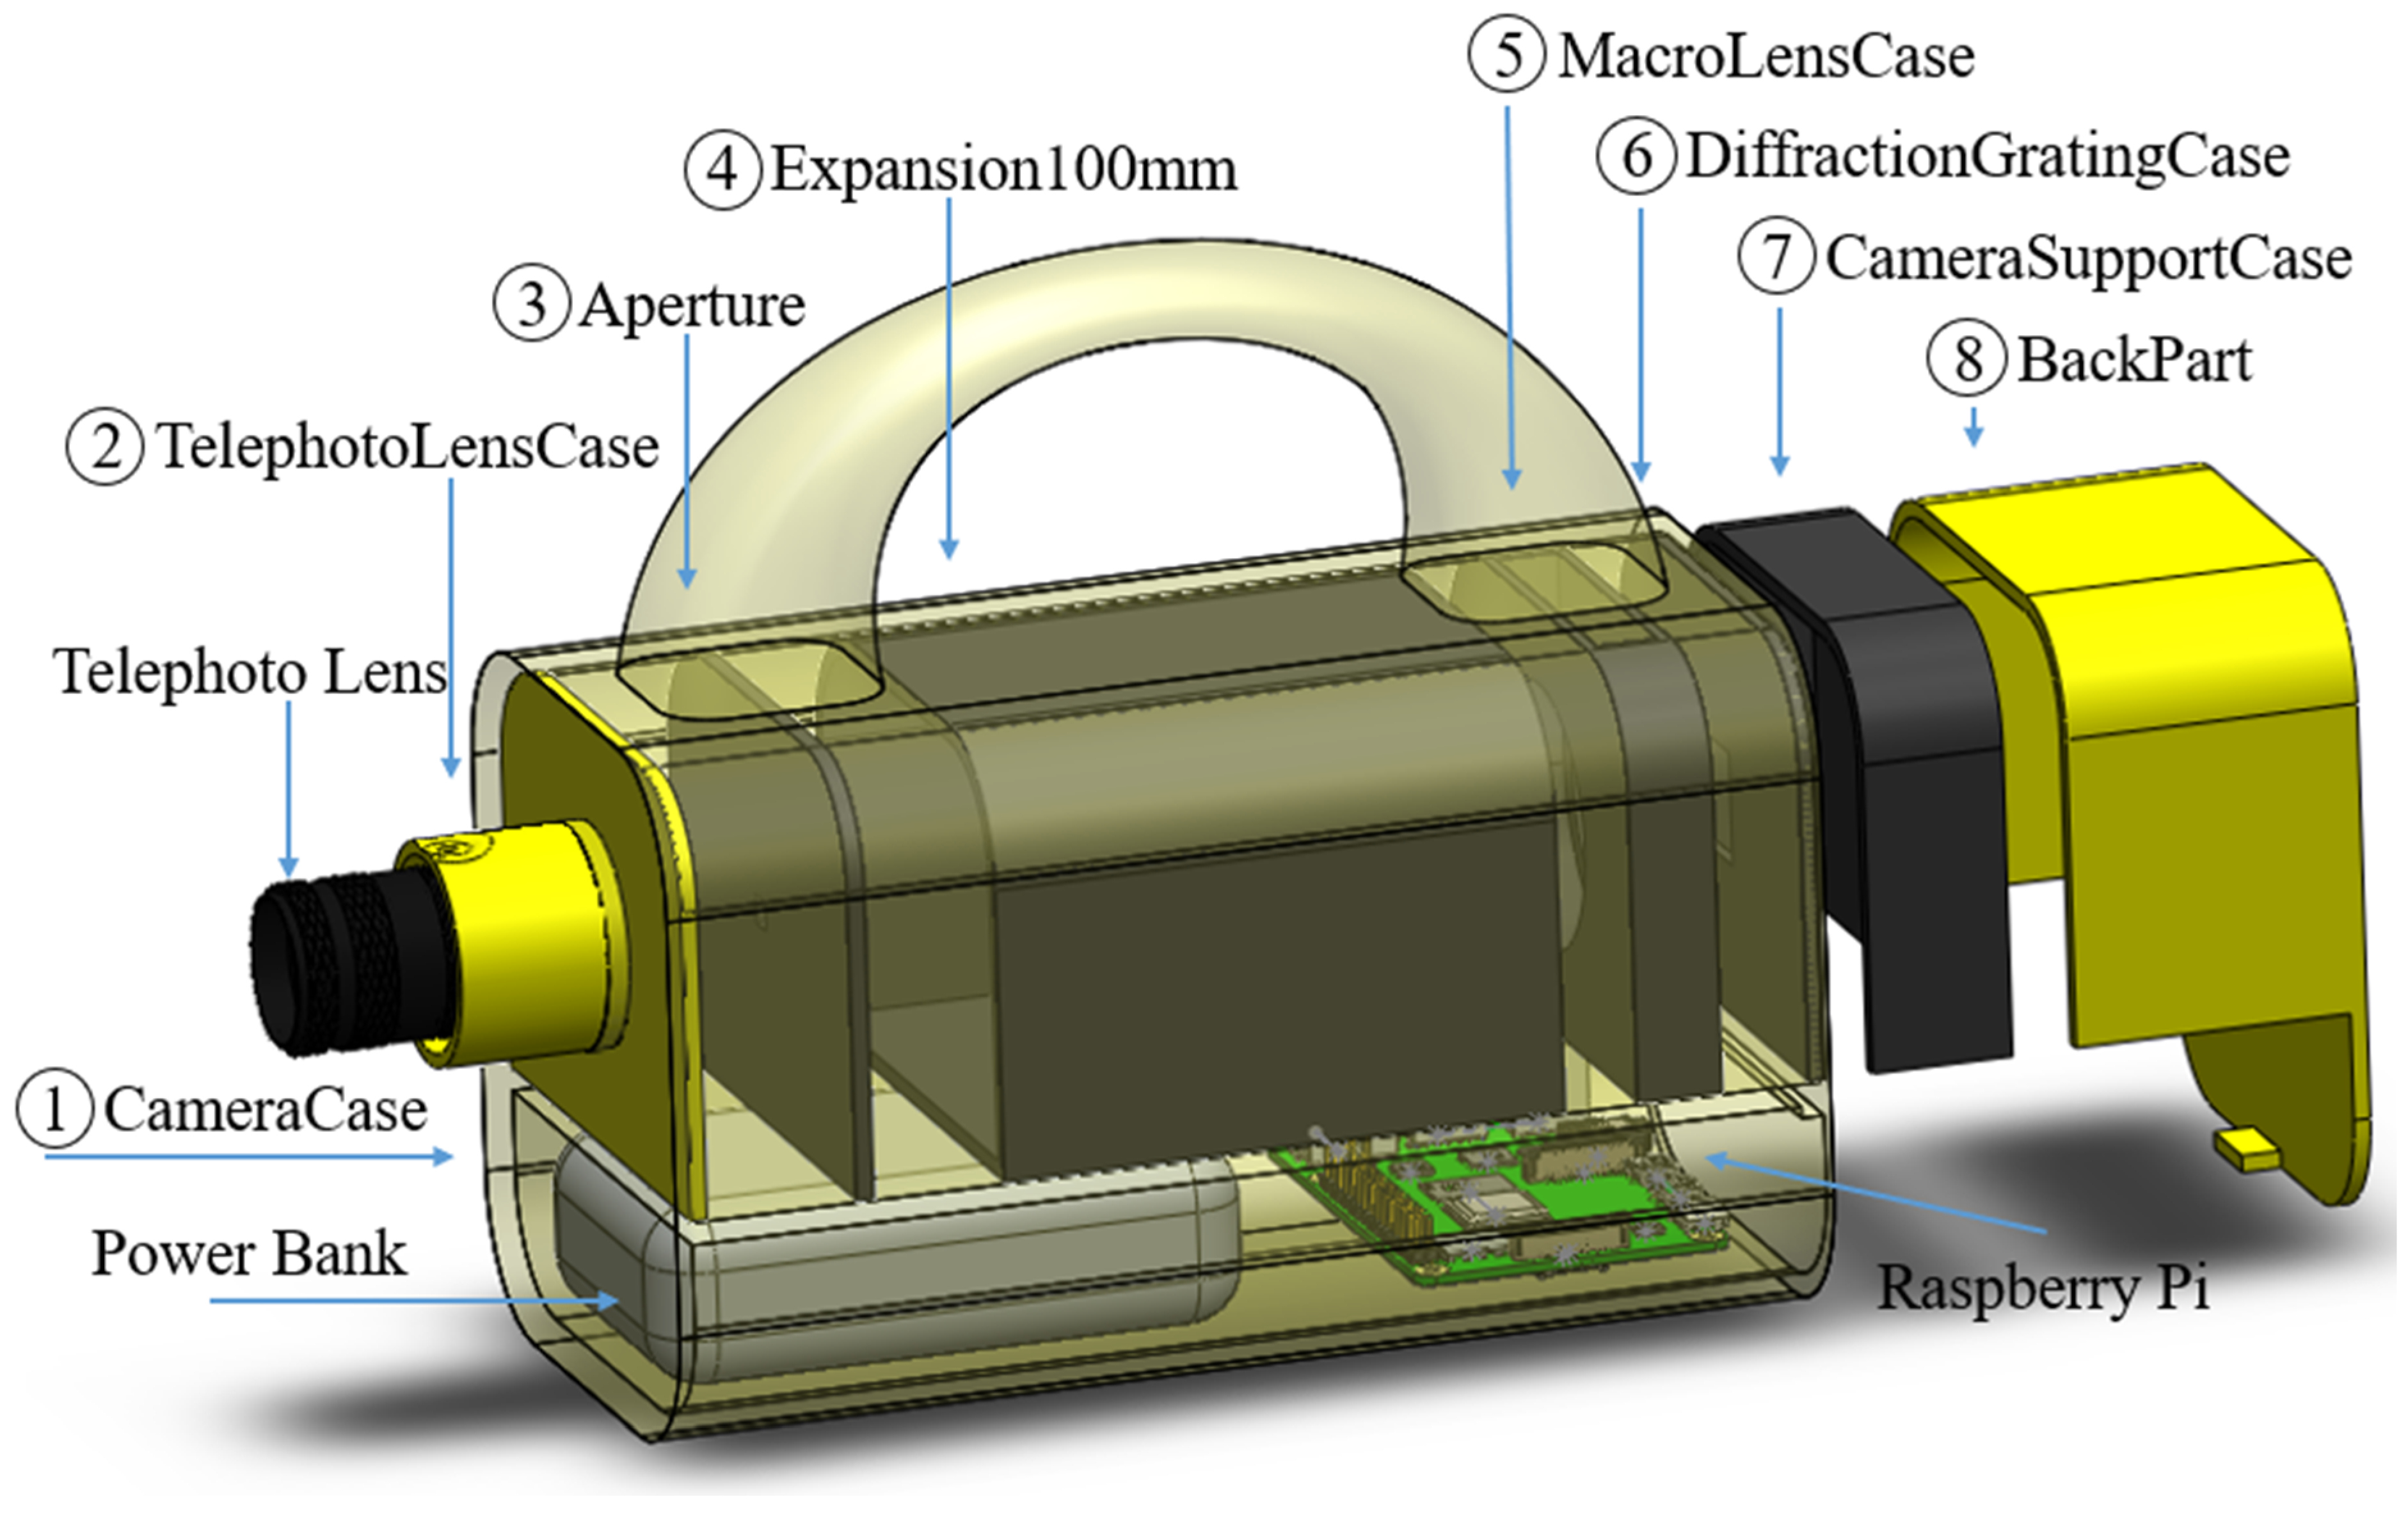
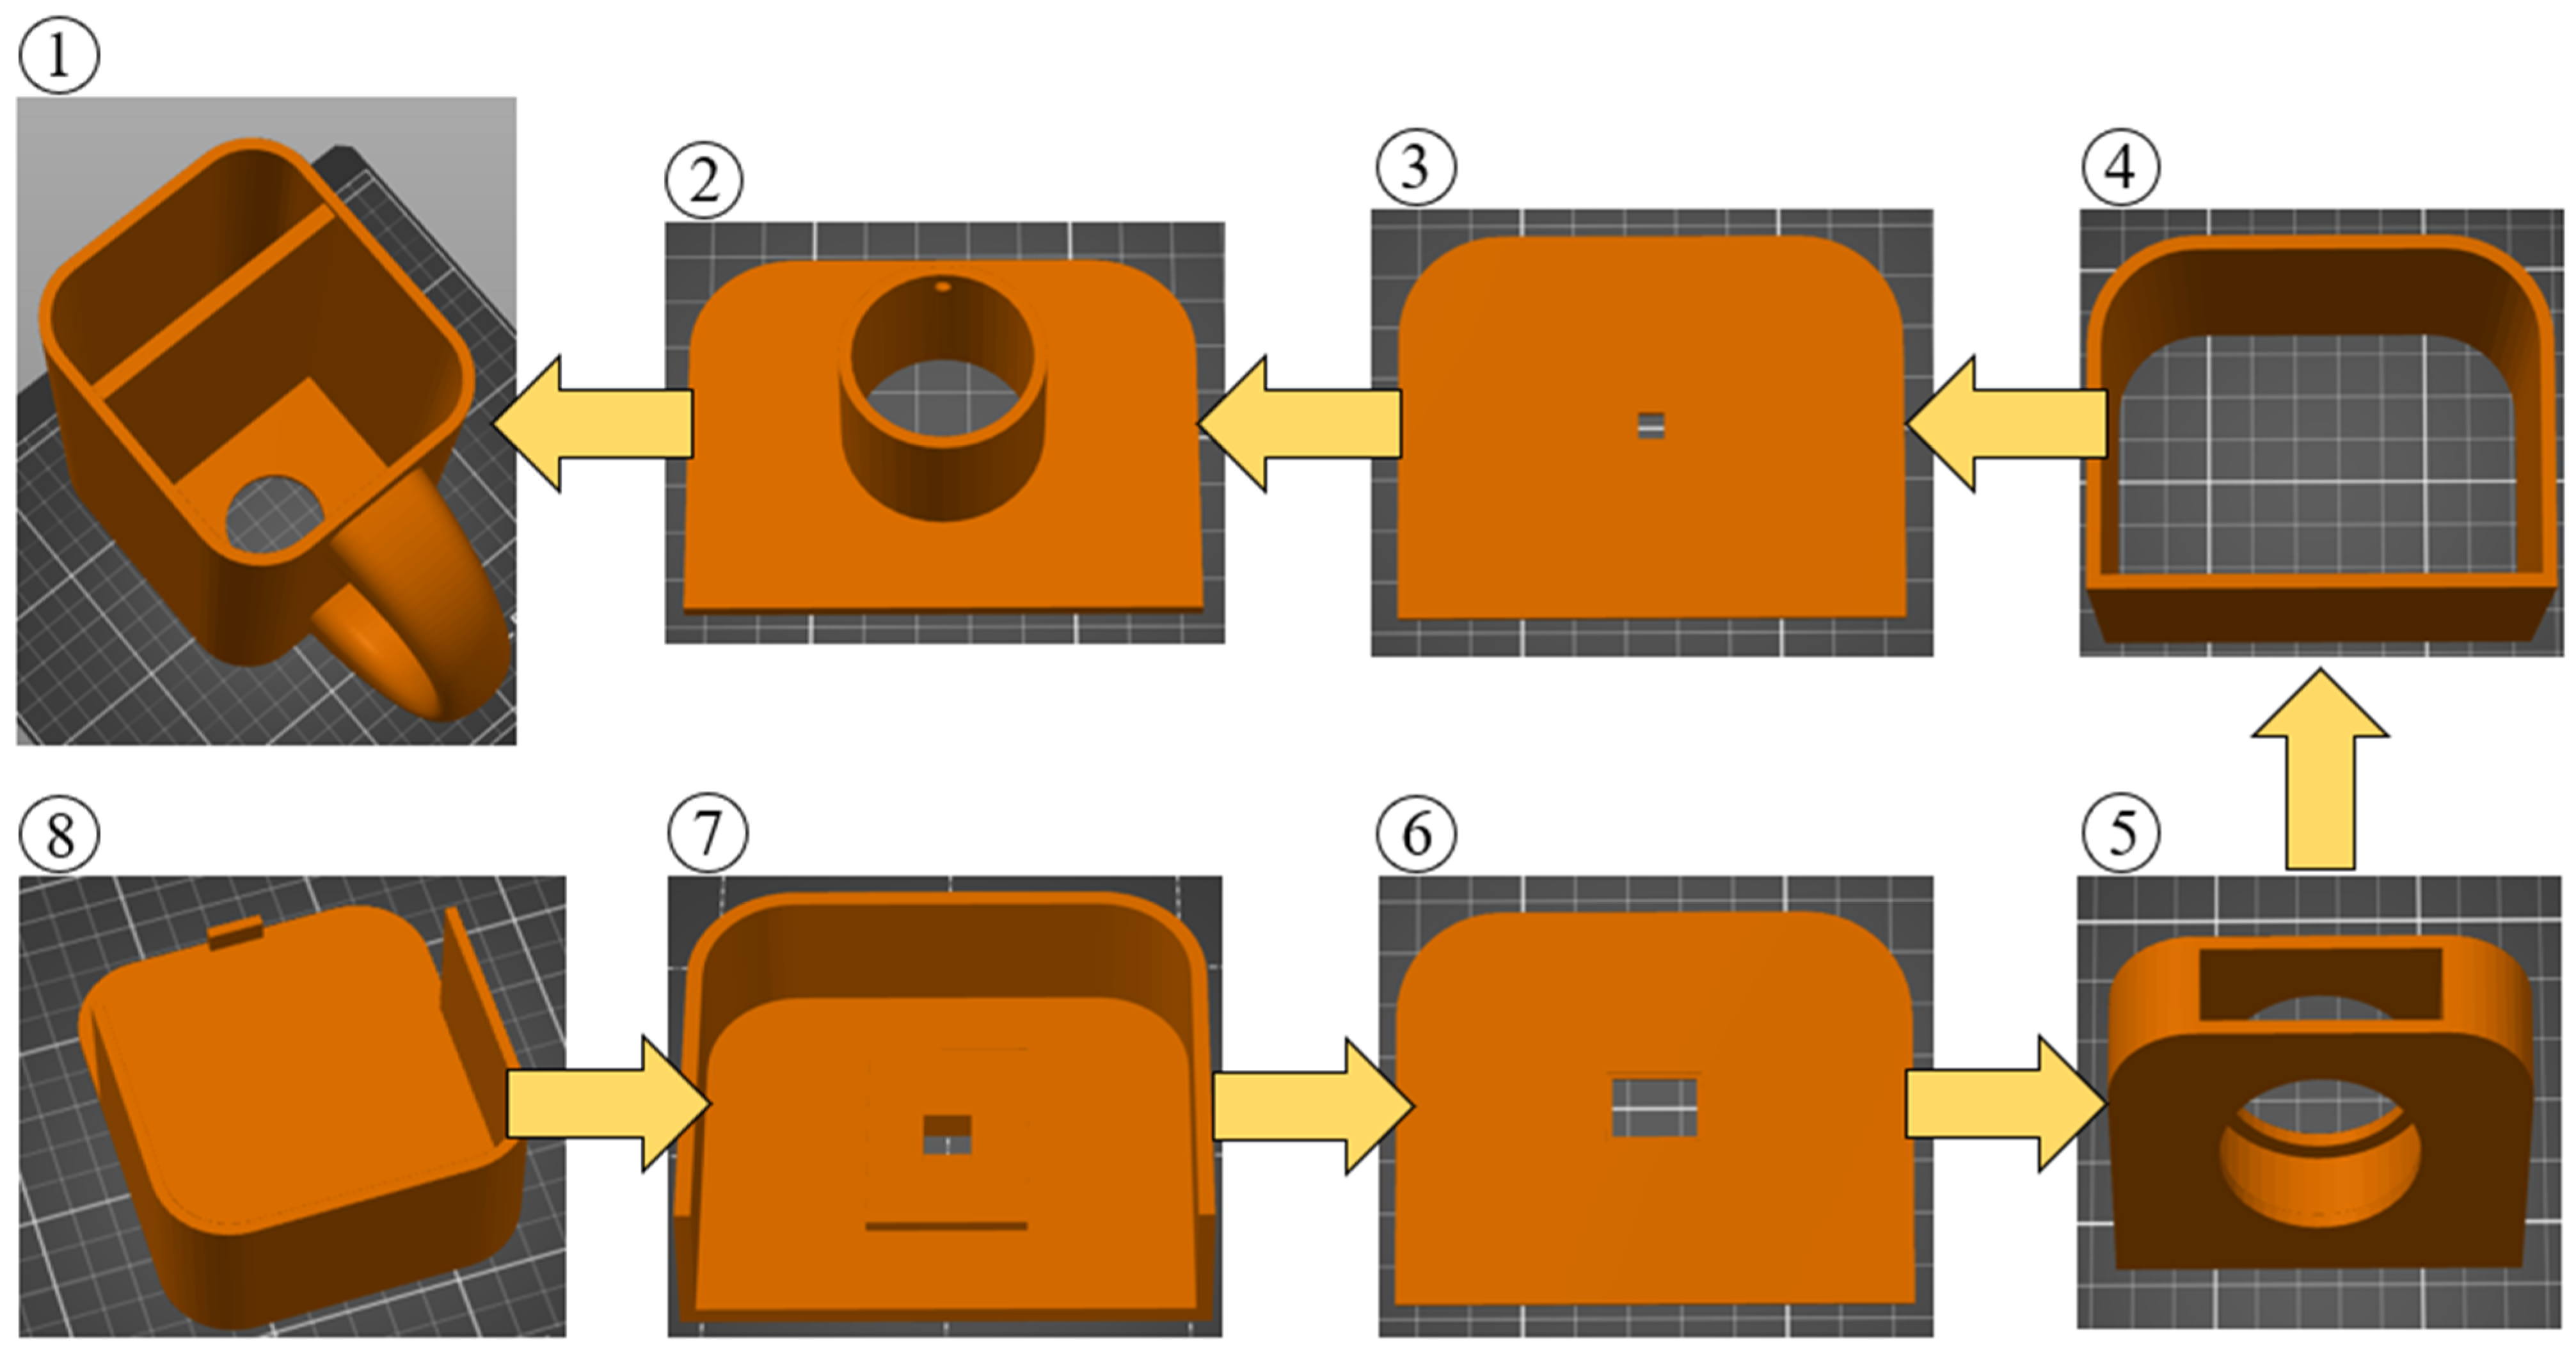
The HS camera is comprised of eight distinct parts, as shown in Figure 4; some were designed to play an important role in the architecture of the camera and others to house electronic components. The first component, the camera case (1), serves as the external camera case, offering protective housing for the camera’s internal components. Additionally, it features a designated space in the bottom part for housing the power bank and Raspberry Pi. The second component is the telephoto lens case (2), which houses the telephoto lens and ensures that it is aligned correctly with the camera’s image sensor. The third component is the aperture (3), which controls the amount of light that enters the camera and regulates the depth of field. The fourth component is the Expansion 100 mm (4), which is a movable component that provides distance between telephoto lens and the camera. The fifth component is the macro lens case (5), which is designed to hold the macro lens securely in place. The sixth component is the diffraction grating case (6), which contains the diffraction grating that splits the light into its component colors. The seventh component is the camera support case (7), which provides stability to the camera during use. The final component is the back part (8), which is also the lid that opens and closes to provide access to the inside of the camera. Complementary to the external case of the camera (camera case), it ensures that the electronic parts are protected from external factors such as weather and dust.
3.4.2. Design and 3D Printing
The components of the HS camera were designed using SOLID-WORKS® CAD Software (2022 SP2.0 Professional version) and manufactured under specific parameters via the fused filament fabrication (FFF) technique using an Original Prusa i3 MK3S+ 3D printer. Each part’s 3D printing parameters were set using the Prusa Slicer 2.5.0 software. The selection of the FFF technique was based on its extensive usage, affordability, and the availability of a wide range of materials [30].
To ensure proper camera functionality and protect its electronic components from external factors (such as weather conditions, exposure to insects and animals, etc.), two different materials were utilized to provide adequate coverage. The materials used were PETG (poly ethylene terephthalate glycol) and PLA (polylactic acid) in filament form with a diameter of 1.75 mm. PETG was chosen for the external parts because it is a durable material and is also recyclable and reusable [31,32]. PLA was selected because it is an environmentally friendly material and has biodegradable properties [33,34].
The nozzle temperature was set at 245 °C for PETG and 210 °C for PLA, while the 3D printer bed temperature was set at 80 °C and 60 °C, respectively. A 0.4 mm diameter nozzle was used for all parts, and a layer height of 0.2 mm was set for optimal print quality. The specific parts of the camera were printed with a fill density of 30%. These parts are robust and rigid, fully satisfying the requirements of the camera’s intended use. It was determined that a higher fill density percentage was unnecessary as it would not provide any additional benefits and would increase the amount of printing material consumed.
Figure 5 presents the designs of the camera’s components in a standard triangle language (STL) file format, in order of placement. The external parts (1, 2, and 8) were 3D printed using PETG, while all other parts (internal) were 3D printed using PLA, as previously mentioned. The orientation of the parts on the printing bed was determined to minimize the need for support structures. The only parts that required support structures were the camera case (1) and macro lens case (5).
3.4.3. Bill of 3D Printed Materials
Considering the calculation of the final cost of each part as well as the total cost of the entire HS camera system, the average power consumption at 26 °C room temperature for PLA is 80 W; for PETG, the power consumption was considered to be 120 watts (the same as the consumption given by the manufacturer when the printer is used with ABS material [35]). This value is not provided by the manufacturer and is used as an approximation for the purpose of calculating the total cost of the camera and its parts. Finally, it was assumed that the cost of one kilowatt-hour (1 kWh) was equivalent to EUR 0.39 in the month of March 2023 in Greece. Table A1 in Appendix A presents the cost calculation factor for the 3D printer and the materials used, excluding VAT.
Table A2 in Appendix A provides essential information concerning the dimensions of each part, the material utilized in its fabrication, and specific insights into the 3D printing process. This data encompasses essential details such as the printing time required for the production of each part, the corresponding weight of the material essential for its manufacture, and the associated cost for each component. These particulars hold particular significance for individuals seeking to integrate HS imaging technologies into their research projects and necessitate a swift and cost-efficient prototype of a HS camera. The cost of materials and cost of energy were calculated by Equations (A1)–(A4) in Appendix B.
As depicted in Table A2 in Appendix A, the total cost associated with 3D printing a DIY HS device can be derived by aggregating the costs of individual components. The data presented indicates that the total cost of one HS device amounts to EUR 17.63, excluding VAT. Notably, the total weight of the HS device consists solely of the 3D-printed parts, which collectively weigh 791.45 g. It is crucial to emphasize that this cost estimate serves as an approximation and is subject to variations influenced by several factors. Variables such as the price of one kilowatt-hour, the average power consumption of the 3D printer, the cost of filament, and printing parameters like infill and support structures can exert a significant influence on the final expenditure associated with manufacturing a DIY HS device. Therefore, it is imperative to account for all these variables when making estimations regarding the total cost of producing such a device.
3.5. Prototyping and Assembly
The fully assembled prototype boasts a weight of 2 kg and offers an exceptionally straightforward assembly process for users. To complete the assembly, users need only place the parts within the frame of the HS device and secure specific electronic components using screws. Precisely, four screws are utilized to fasten the Raspberry Pi Camera, one screw is employed to secure the telephoto lens, and an additional screw is used to stabilize internal objects within the back part of the camera during operation. Furthermore, the diffraction grating glass is firmly attached with silicone for added stability. These observations affirm that the camera is remarkably user-friendly, enabling virtually anyone to effortlessly assemble it in a matter of minutes. A visual representation of the prototyping process for the proposed DIY HS device is depicted in Figure 6.
4. Experimental Framework
4.1. Device Calibration
4.1.1. Calibration Setup
Prior to capturing spectral images, it is imperative to calibrate the device. Calibration is achieved through the utilization of the squareHSI software, a resource made available by Salazar-Vazquez et al. [20]. Spectral images typically encompass two distinct areas: the zero-order and the first-order mode regions. The zero-order area pertains to instances when light is not subjected to diffraction, while the first-order area, or the region of interest, is relevant when light undergoes diffraction, as visually depicted in Figure 7.
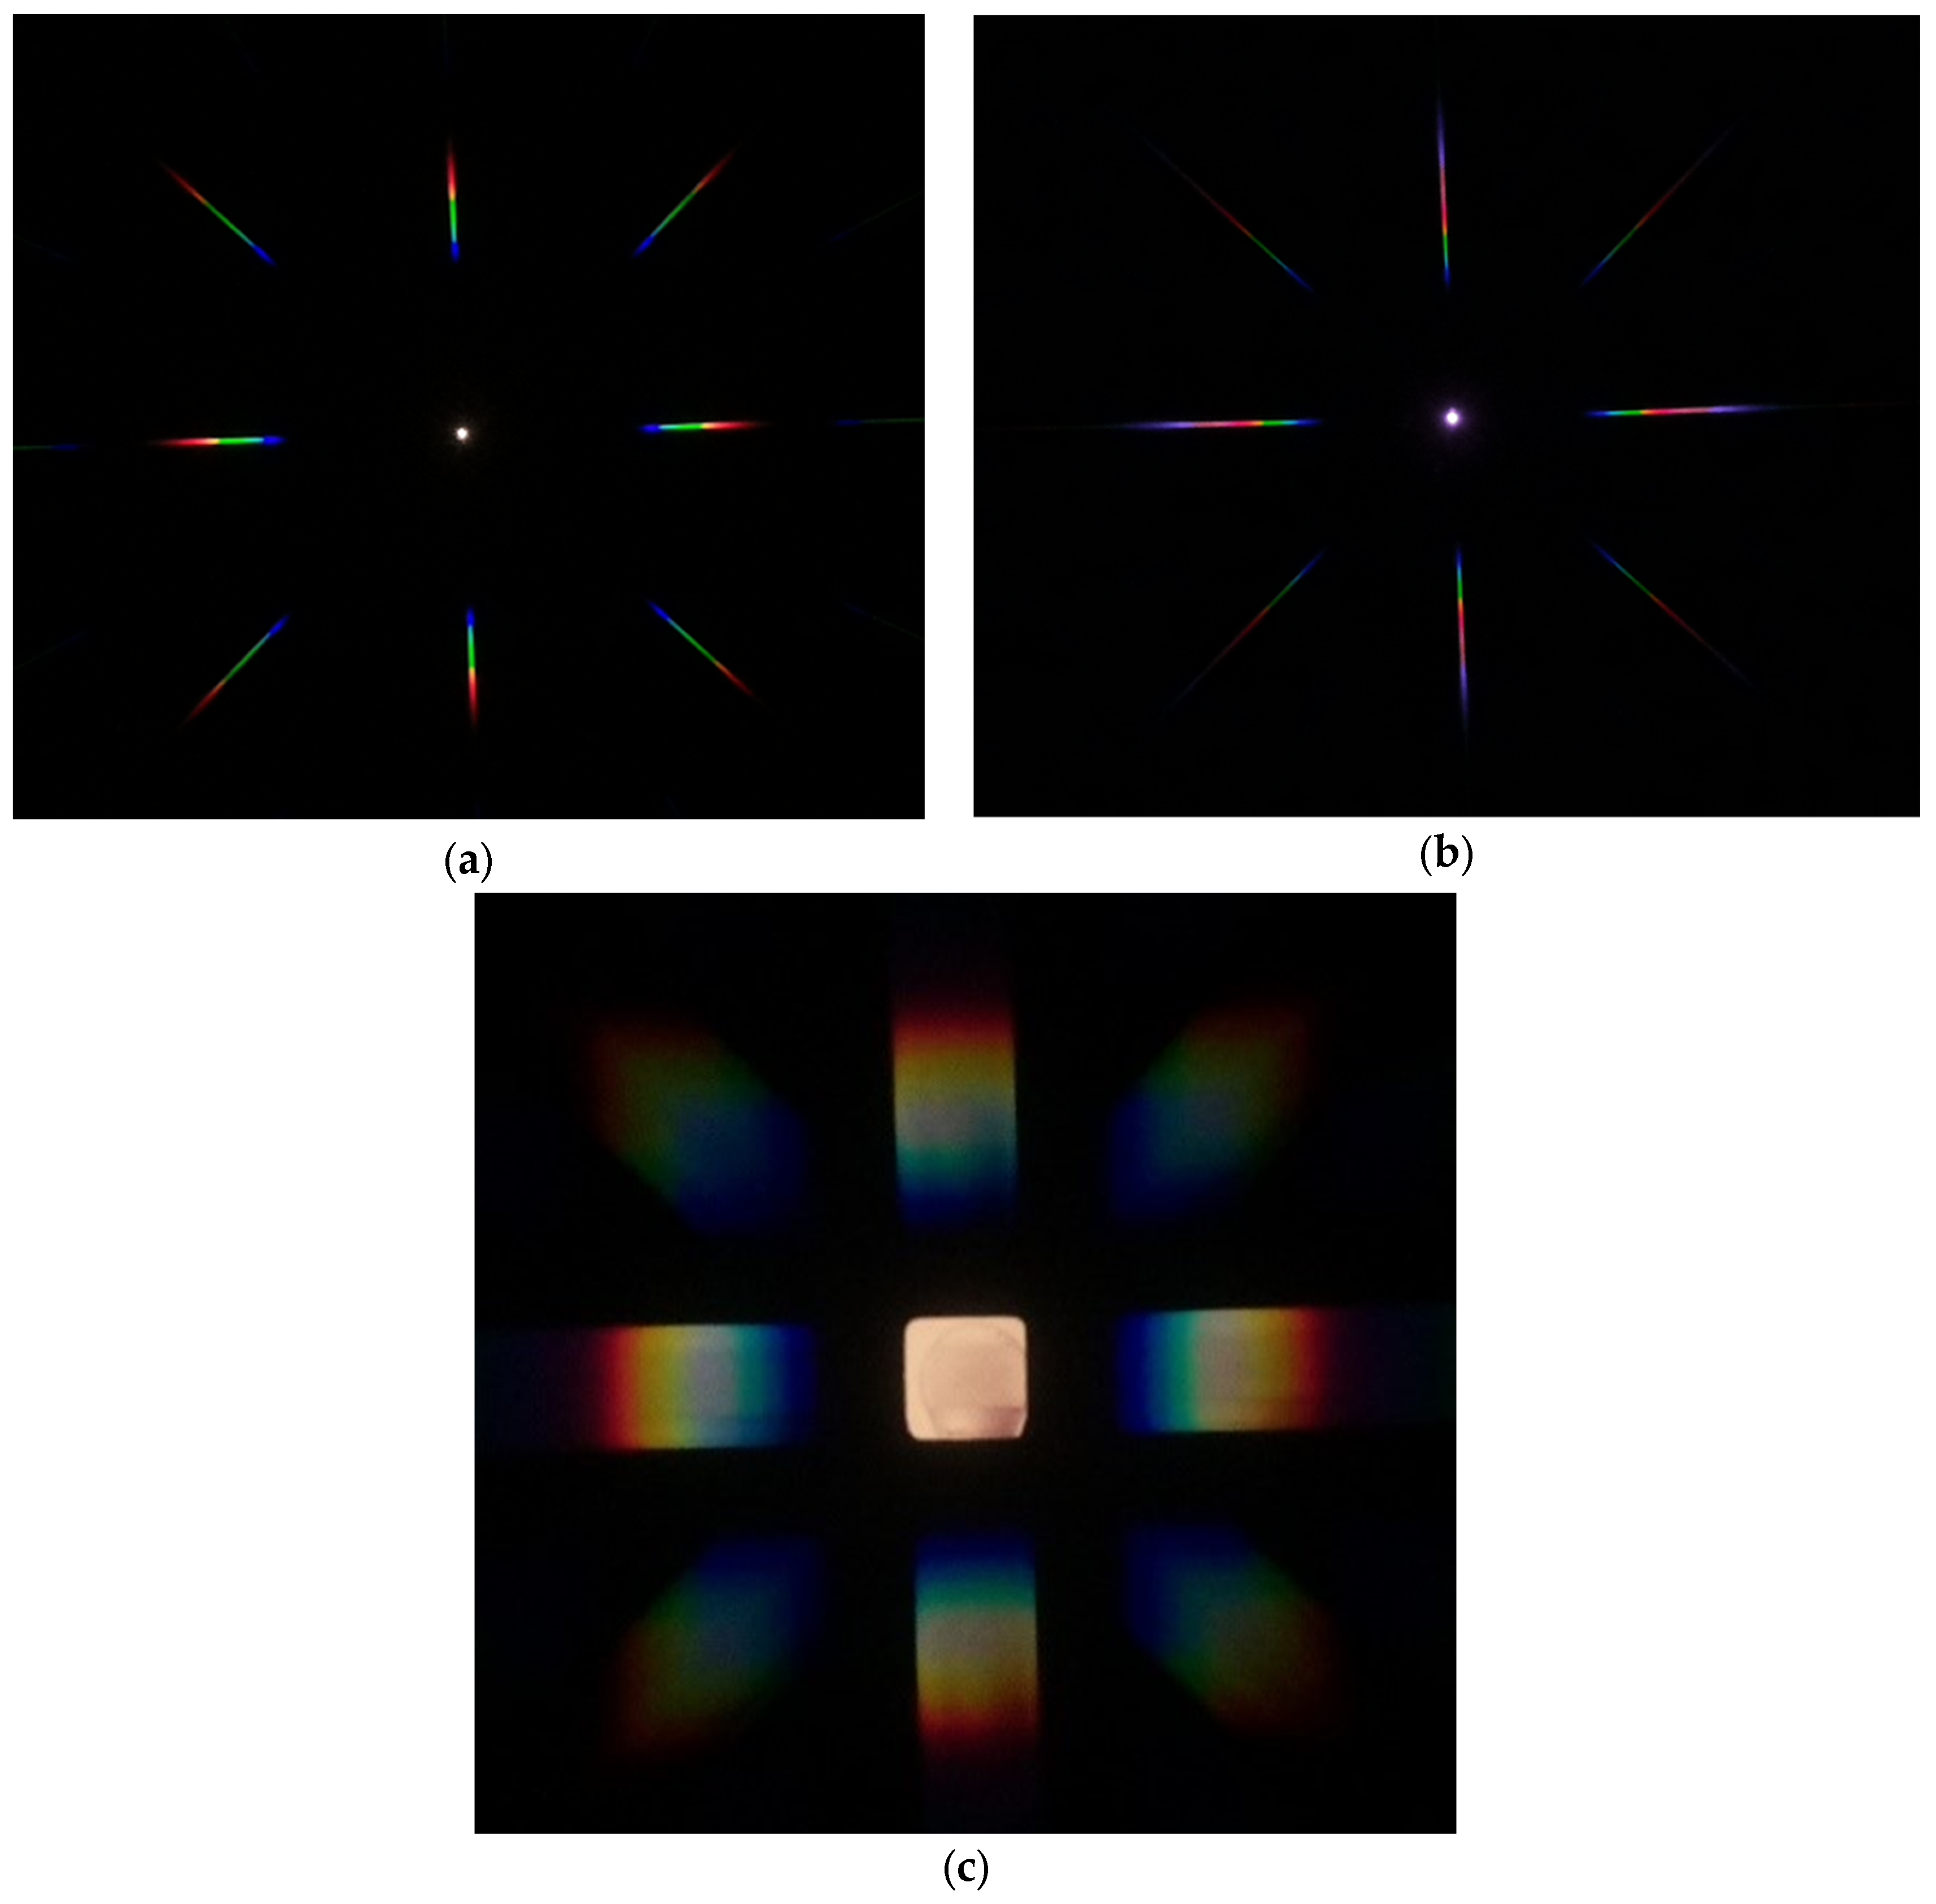
The zero-order area is characterized by a square shape positioned at the center of the image, while the first-order area encompasses the region where light undergoes diffraction, containing the most vital information for the spectral image. To conduct device calibration, it is imperative to capture three distinct spectral images, allowing the client software to identify significant spectral parameters crucial for HS image exportation. The first spectral image should encompass the boundaries of both the zero- and first-order areas. The second image must incorporate diffracted light featuring three or more well-known wavelength peaks. Finally, the last image should comprise a continuous spectrum. To ensure that these images offer identifiable areas, they should capture light emitted by both a fluorescent and an incandescent lamp. These types of lamps are chosen due to their distinctive characteristics: fluorescent lamps provide five recognizable wavelength peaks within the desired range of 400–1052 nm, while incandescent lamps emit a continuous spectrum [36]. Consequently, the calibration process necessitates spectral images acquired from a 6500 K fluorescent lamp and either a 3000 K incandescent lamp or a 3000 K fluorescent lamp.
These spectral images are visually depicted in Figure 8a,b. Figure 8c presents the spectral image requisite for calibrating the regions of interest and the square aperture. Figure 8a allows for the selection of the red, green, and blue areas, and the source area to serve as references for the squareHSI software. Furthermore, the boundaries of the first-order area and the source halogen area are determined based on Figure 8b. Figure 8c illustrates the spectral image that was used for the calibration process.
4.1.2. Validating Calibration
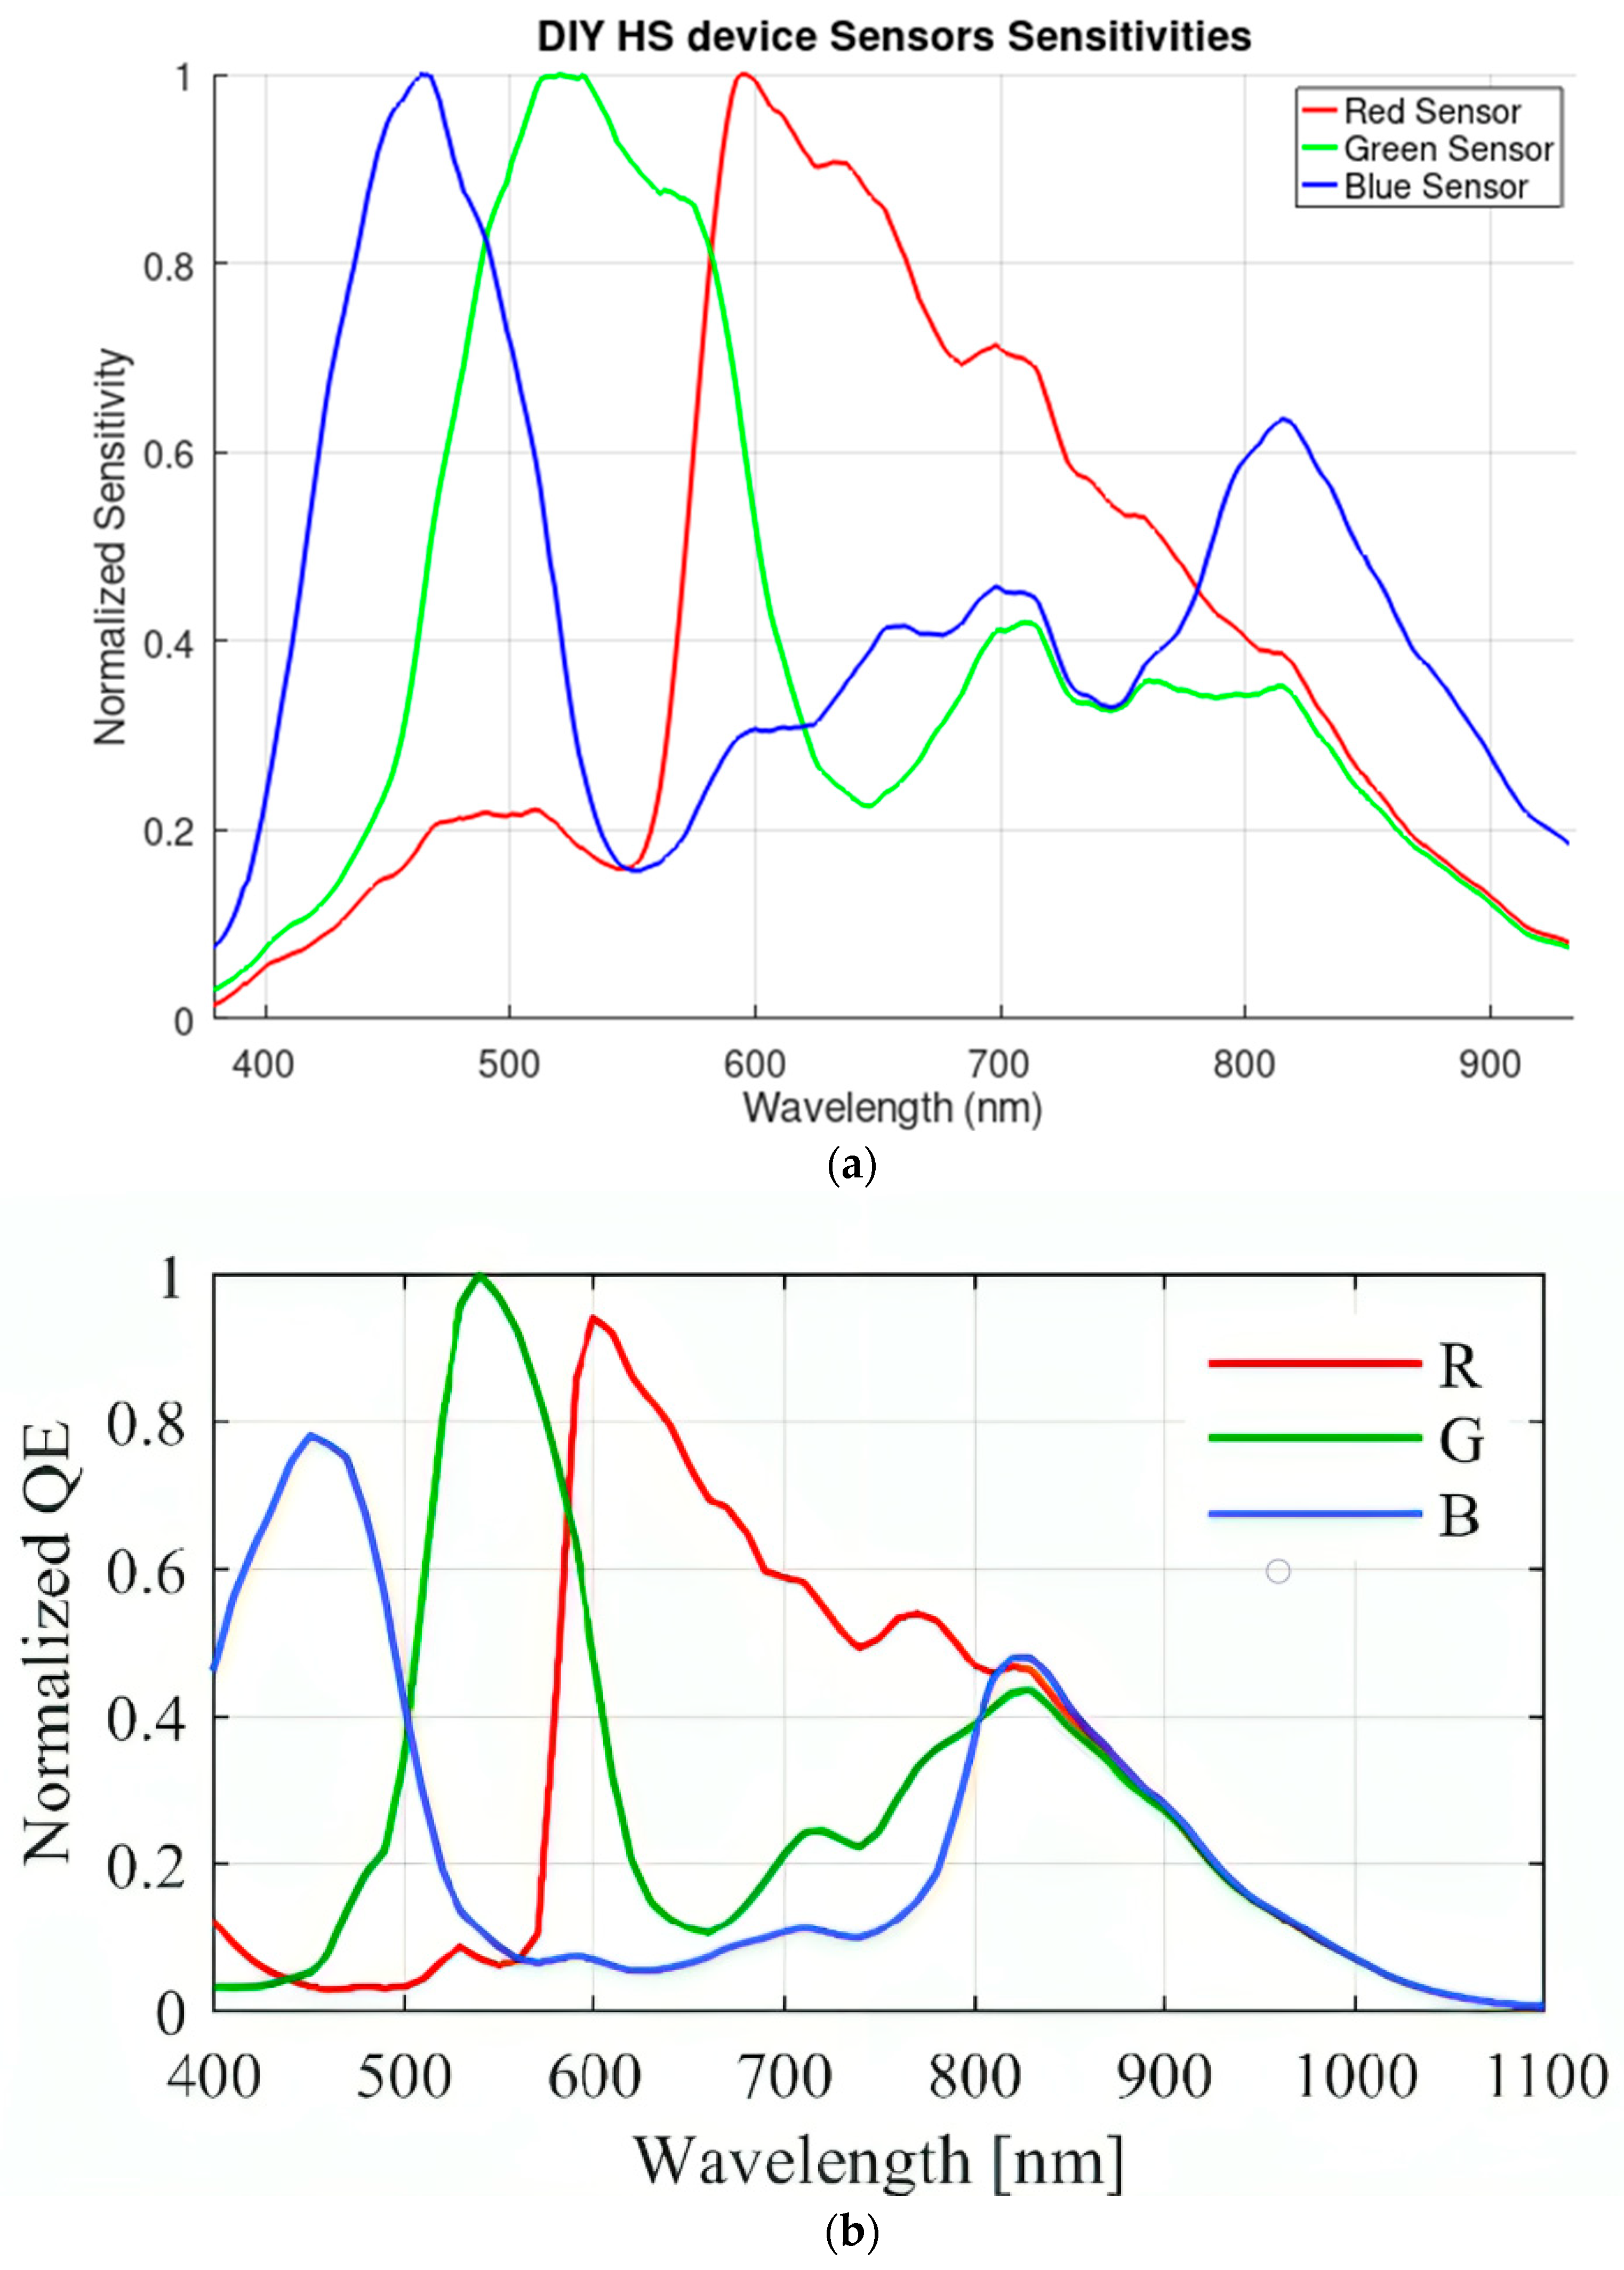
The most precise method for validating the calibration and overall functionality of the DIY HS device is through the use of the calibration .xml file that can be exported from the squareHSI software. Within this file, users have the capability to extract the lines of code necessary to generate a plot depicting the normalized sensitivities of the device’s RGB sensors. As illustrated in Figure 9a, the plot for the proposed DIY HS device was generated using the.xml calibration file exported from squareHSI, utilizing the GNU Octave software (version 8.3.0).
The functionality of the proposed DIY HS device can be validated through a comparison between the plot of the normalized RGB sensors sensitivities depicted in Figure 9a and the normalized RGB sensors sensitivities plot of a previously studied device, as shown in Figure 9b. This comparative analysis serves as a means to assess and confirm the operational capabilities of the DIY HS device.
4.2. Experimental Setup
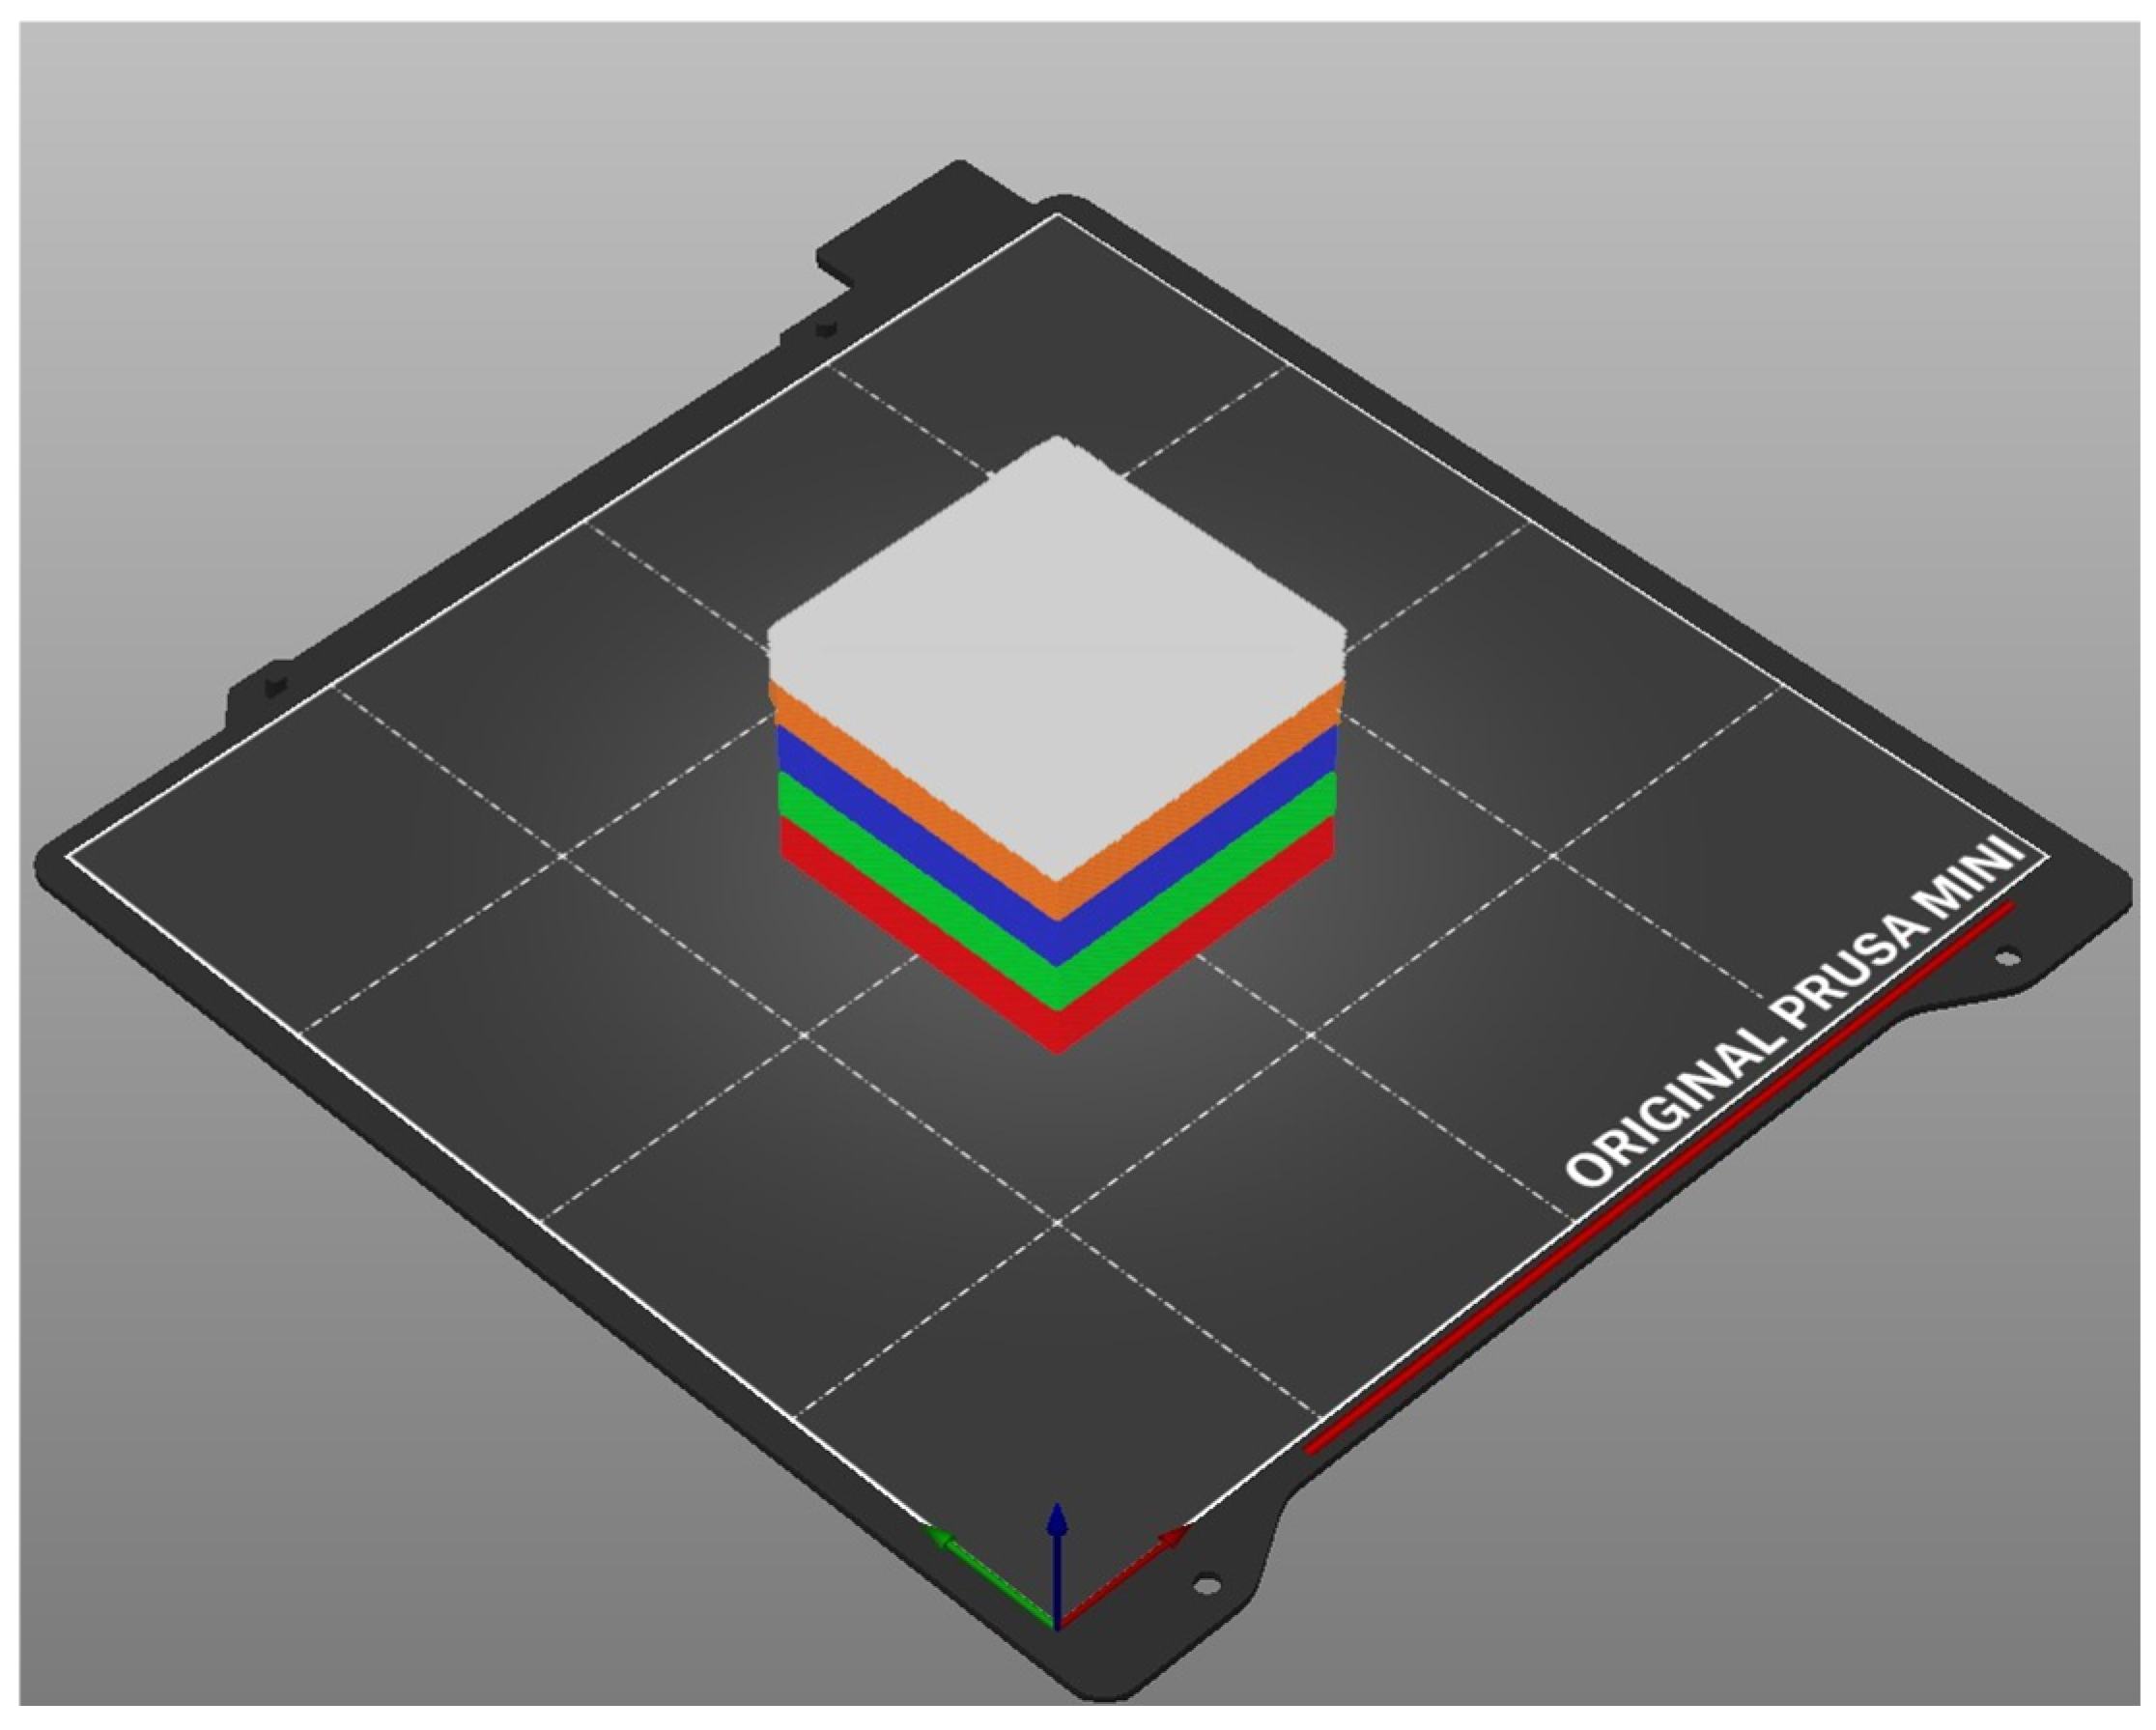
To validate the operation of the DIY HS device, a multi-color experiment was conducted using a 5 × 5 × 4 cm 3D-printed box featuring red, green, blue, orange, and white colors. Red light, characterized by longer wavelengths typically falling in the range of 620–750 nanometers, is situated at the lower end of the visible spectrum. Conversely, blue light exhibits shorter wavelengths, typically ranging from 450 to 495 nanometers. Green light occupies an intermediate position with wavelengths spanning from 495 to 570 nanometers. Lastly, orange light encompasses wavelengths between 590 and 620 nanometers. The box was fabricated using PLA and an Original Prusa MINI printer. The gcode file is depicted in Figure 10.
To determine the optimal distance between the HS camera and the 3D-printed box, a series of test captures were conducted within a range of 20–70 cm. The ideal HS image was captured at a distance of 50 cm. It is worth noting that the experimental setup utilized room lighting, specifically two fluorescent LED lamps with a color temperature of 6400 K and a brightness rating of 2340 lm, which was measured through the studied agro-toolbox device [30].
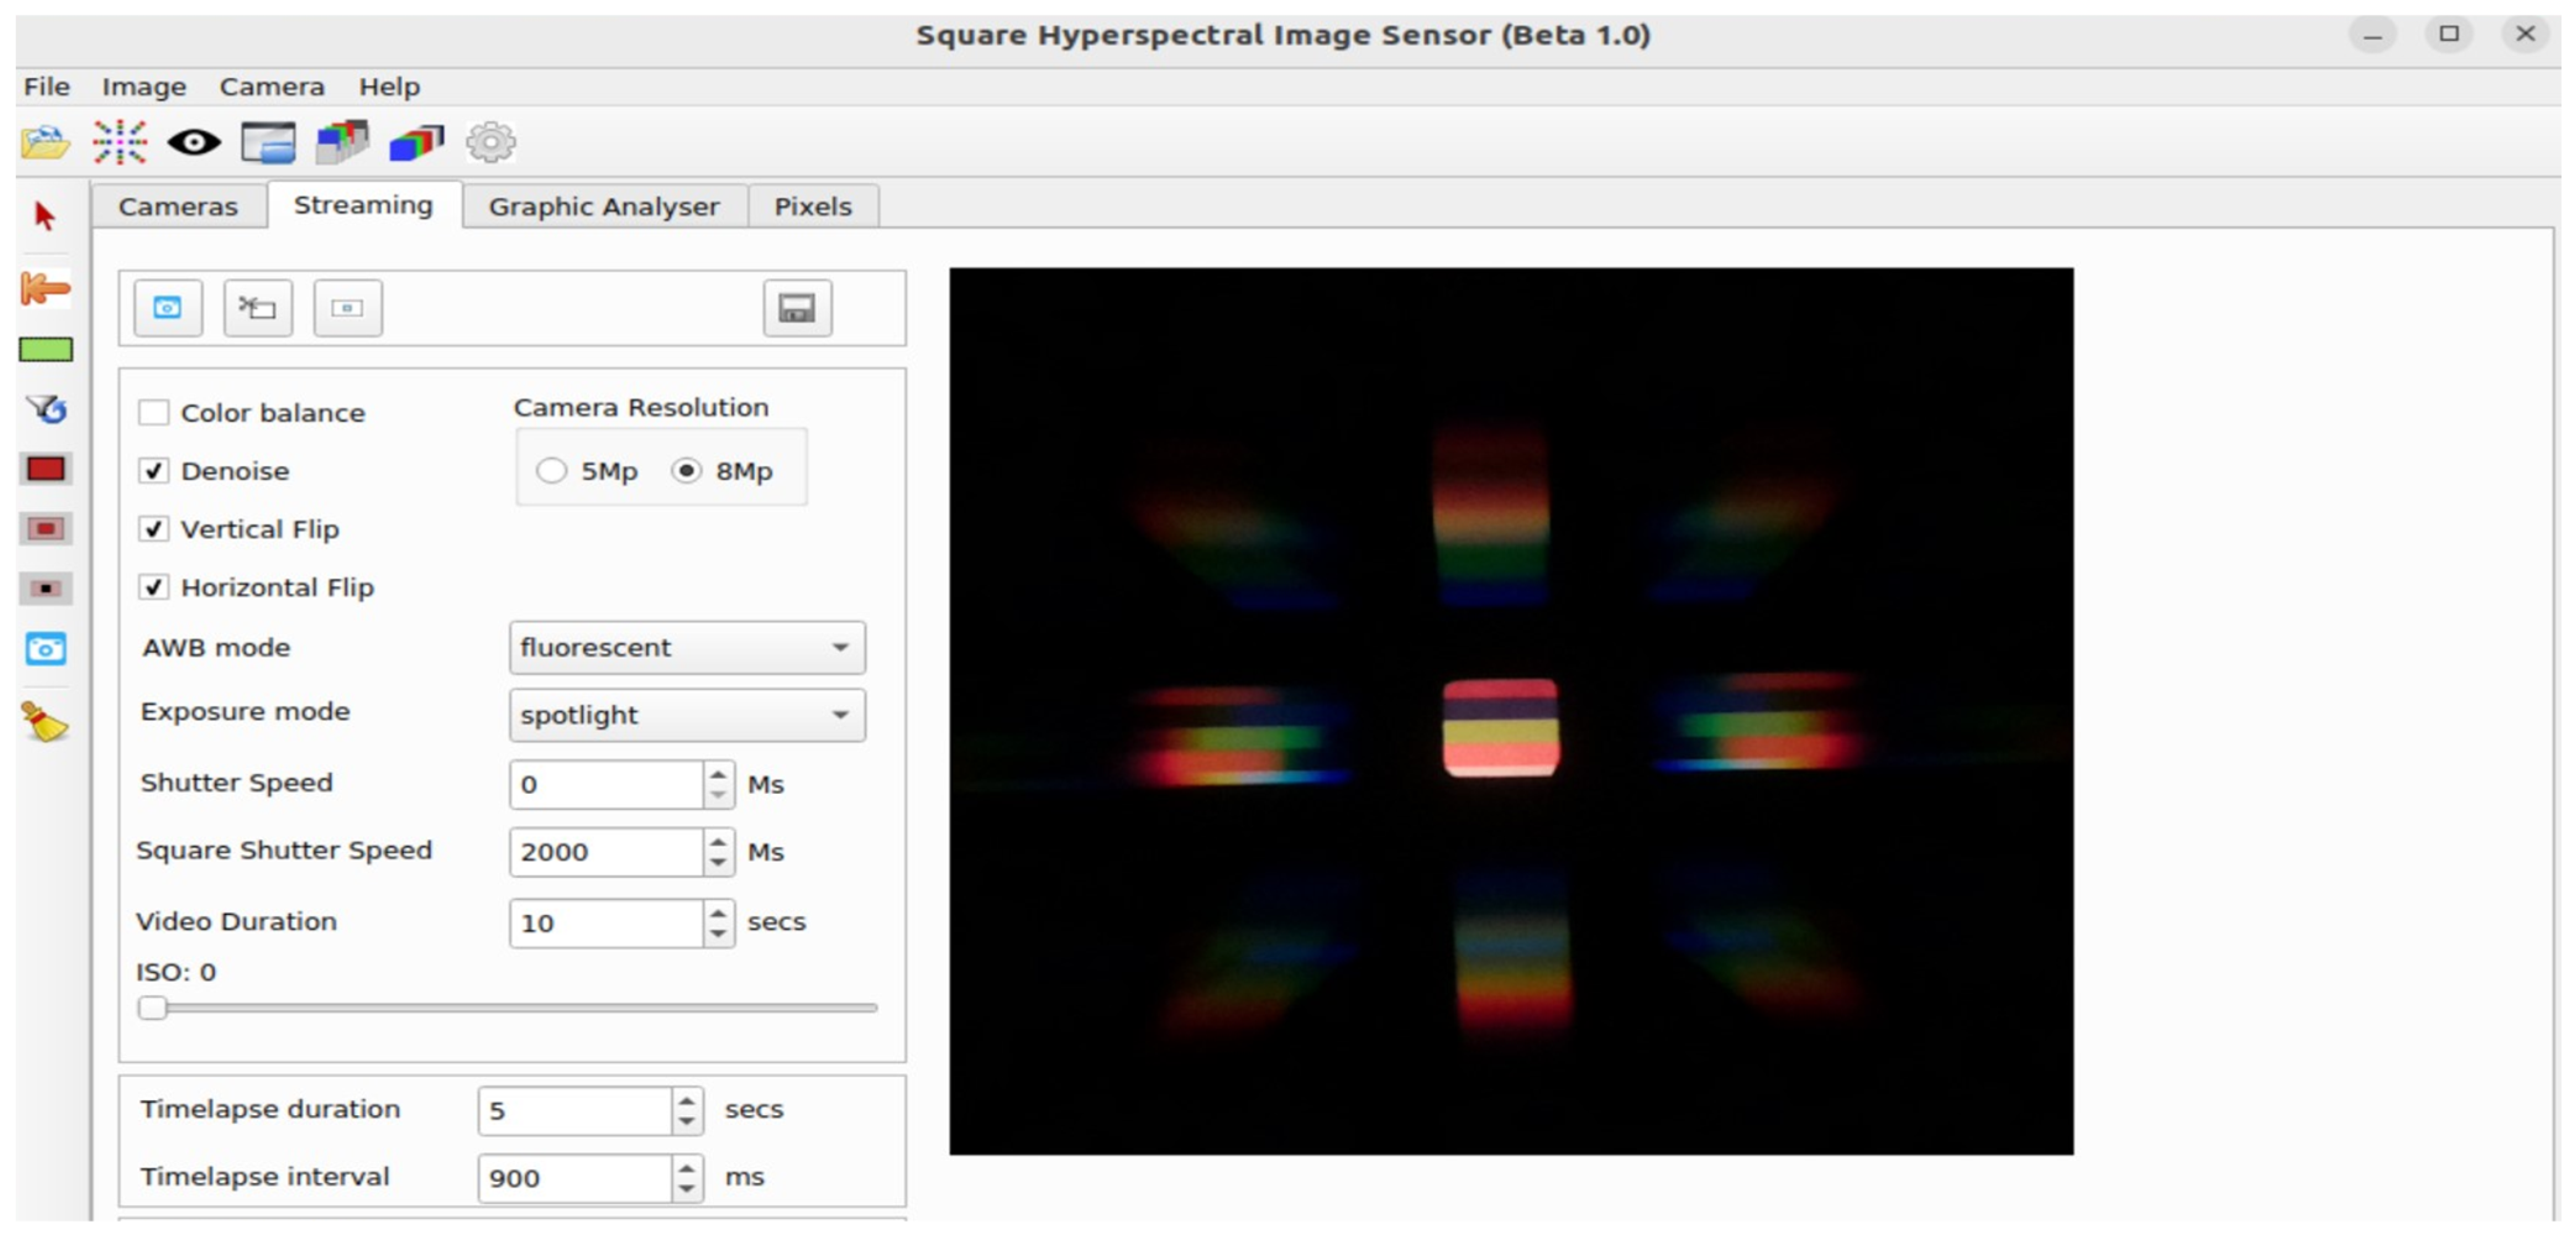
Once the experimental setup was prepared, spectral images could be captured. To ensure the highest image quality, adjustments were made to the camera settings. Specifically, the AWB (auto white balance) mode was changed to fluorescent, and the exposure mode was set to spotlight mode. Additionally, the color balance option was deselected from the streaming menu. The final spectral images taken are displayed in Figure 11, as accessed from the squareHSI streaming menu. The HS cube derived from these images can be exported using the “Generate Hypercube” button, as indicated in Figure 11. Following this, users can view the generated wavelengths in the Pixels tab.
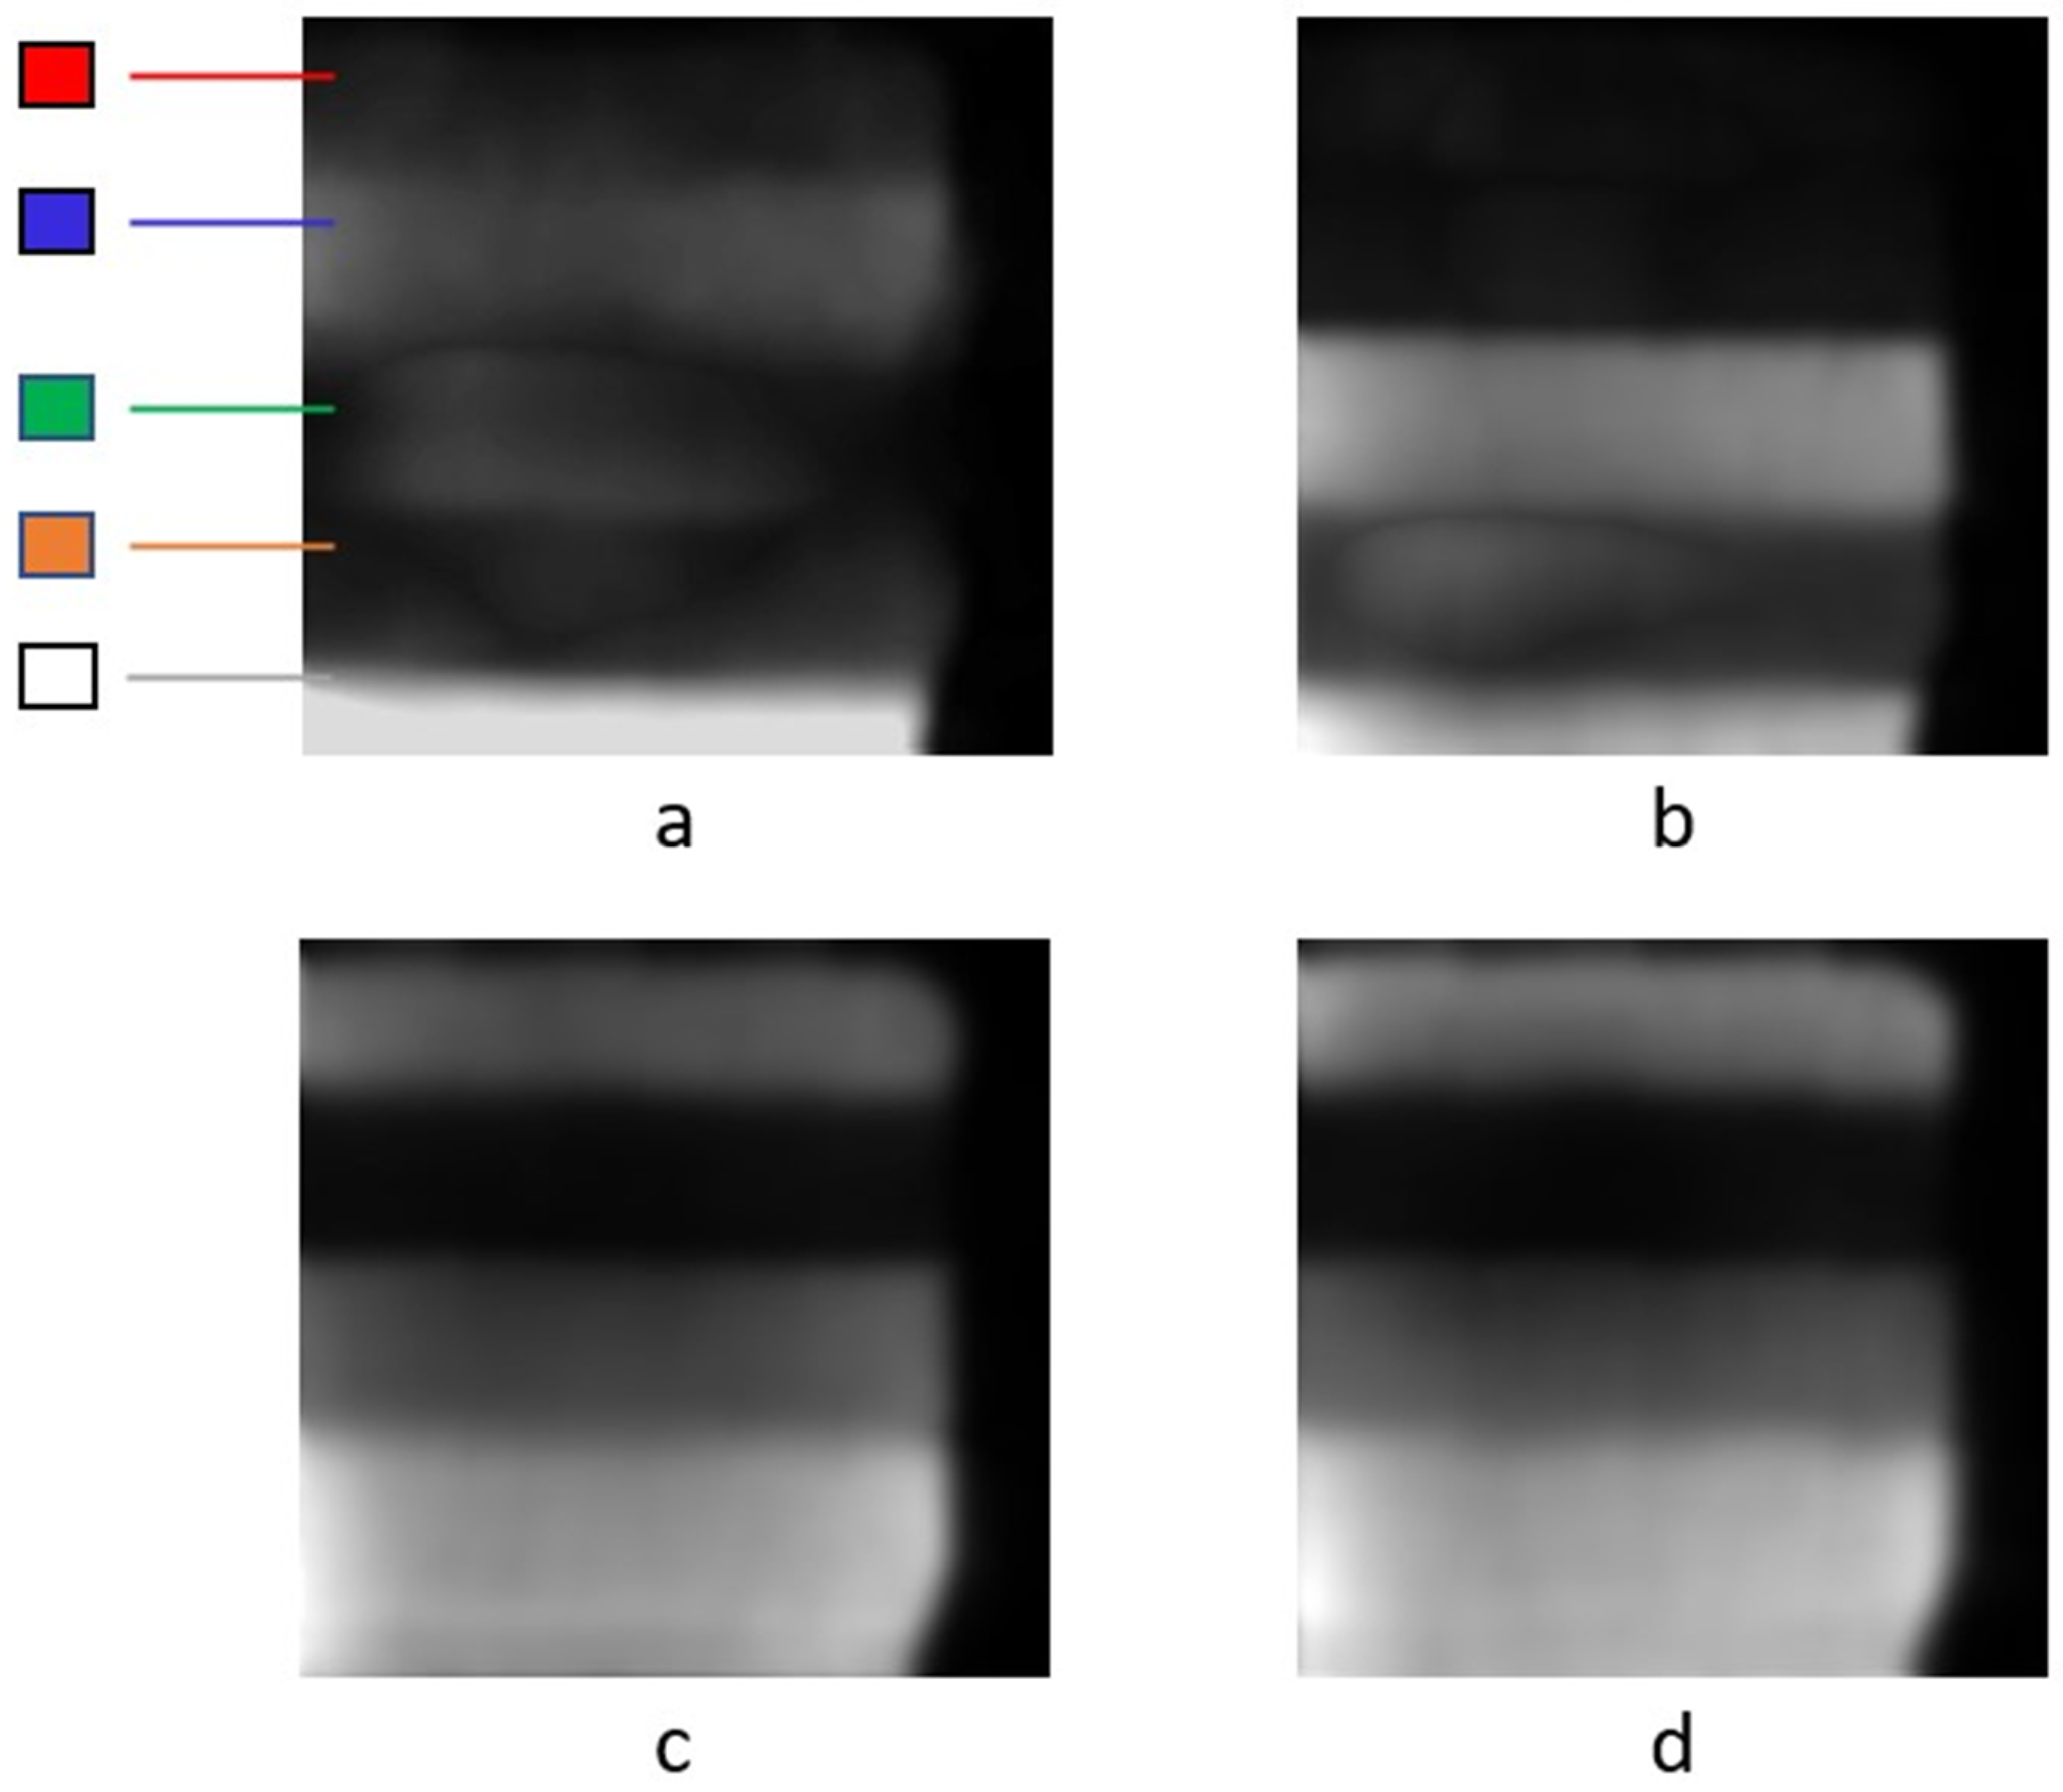
Moreover, a hypercube file is stored within the HypCubes folder located inside the squareHSI software directory. Utilizing this file, users can generate individual spectral images for each wavelength. Spectral images for the tested colors (red, green, blue, orange, white) are selected from the wavelength range corresponding to each color. Specifically, wavelengths of 448 nm are chosen for white and blue, 624 nm for orange and red, and 536 nm for green. Subsequently, users can export the values which are used to create the wavelength graph, enabling the creation of a customized plot for further analysis.
4.3. Results and Discussion
The exported spectral images are depicted in Figure 12. At a wavelength of 448 nm in Figure 12a, the white and blue colors are discernible. Notably, the white color, situated in the bottom layer of the image, appears brighter as it covers the entire spectrum of visible light compared to the blue color, found in the second layer, which appears less bright within the wavelength range of 450–495 nm.
Furthermore, in Figure 12b, at a wavelength of 532 nm, the green color is correctly portrayed as brighter due to its wavelength range spanning from 495 to 570 nm. The green color also manifests itself in Figure 12c,d owing to its proximity in wavelength to the red and orange colors. In Figure 12c,d, the orange and red colors are evident, attributed to their respective wavelength ranges of 590–620 nm and 620–750 nm. In Figure 12c, the orange color appears brighter than red due to its wavelength peak value; however, both colors are discernible in these two figures as a result of their closely aligned wavelength ranges. Additionally, the white color is present in all of Figure 12 due to its broad spectral nature.
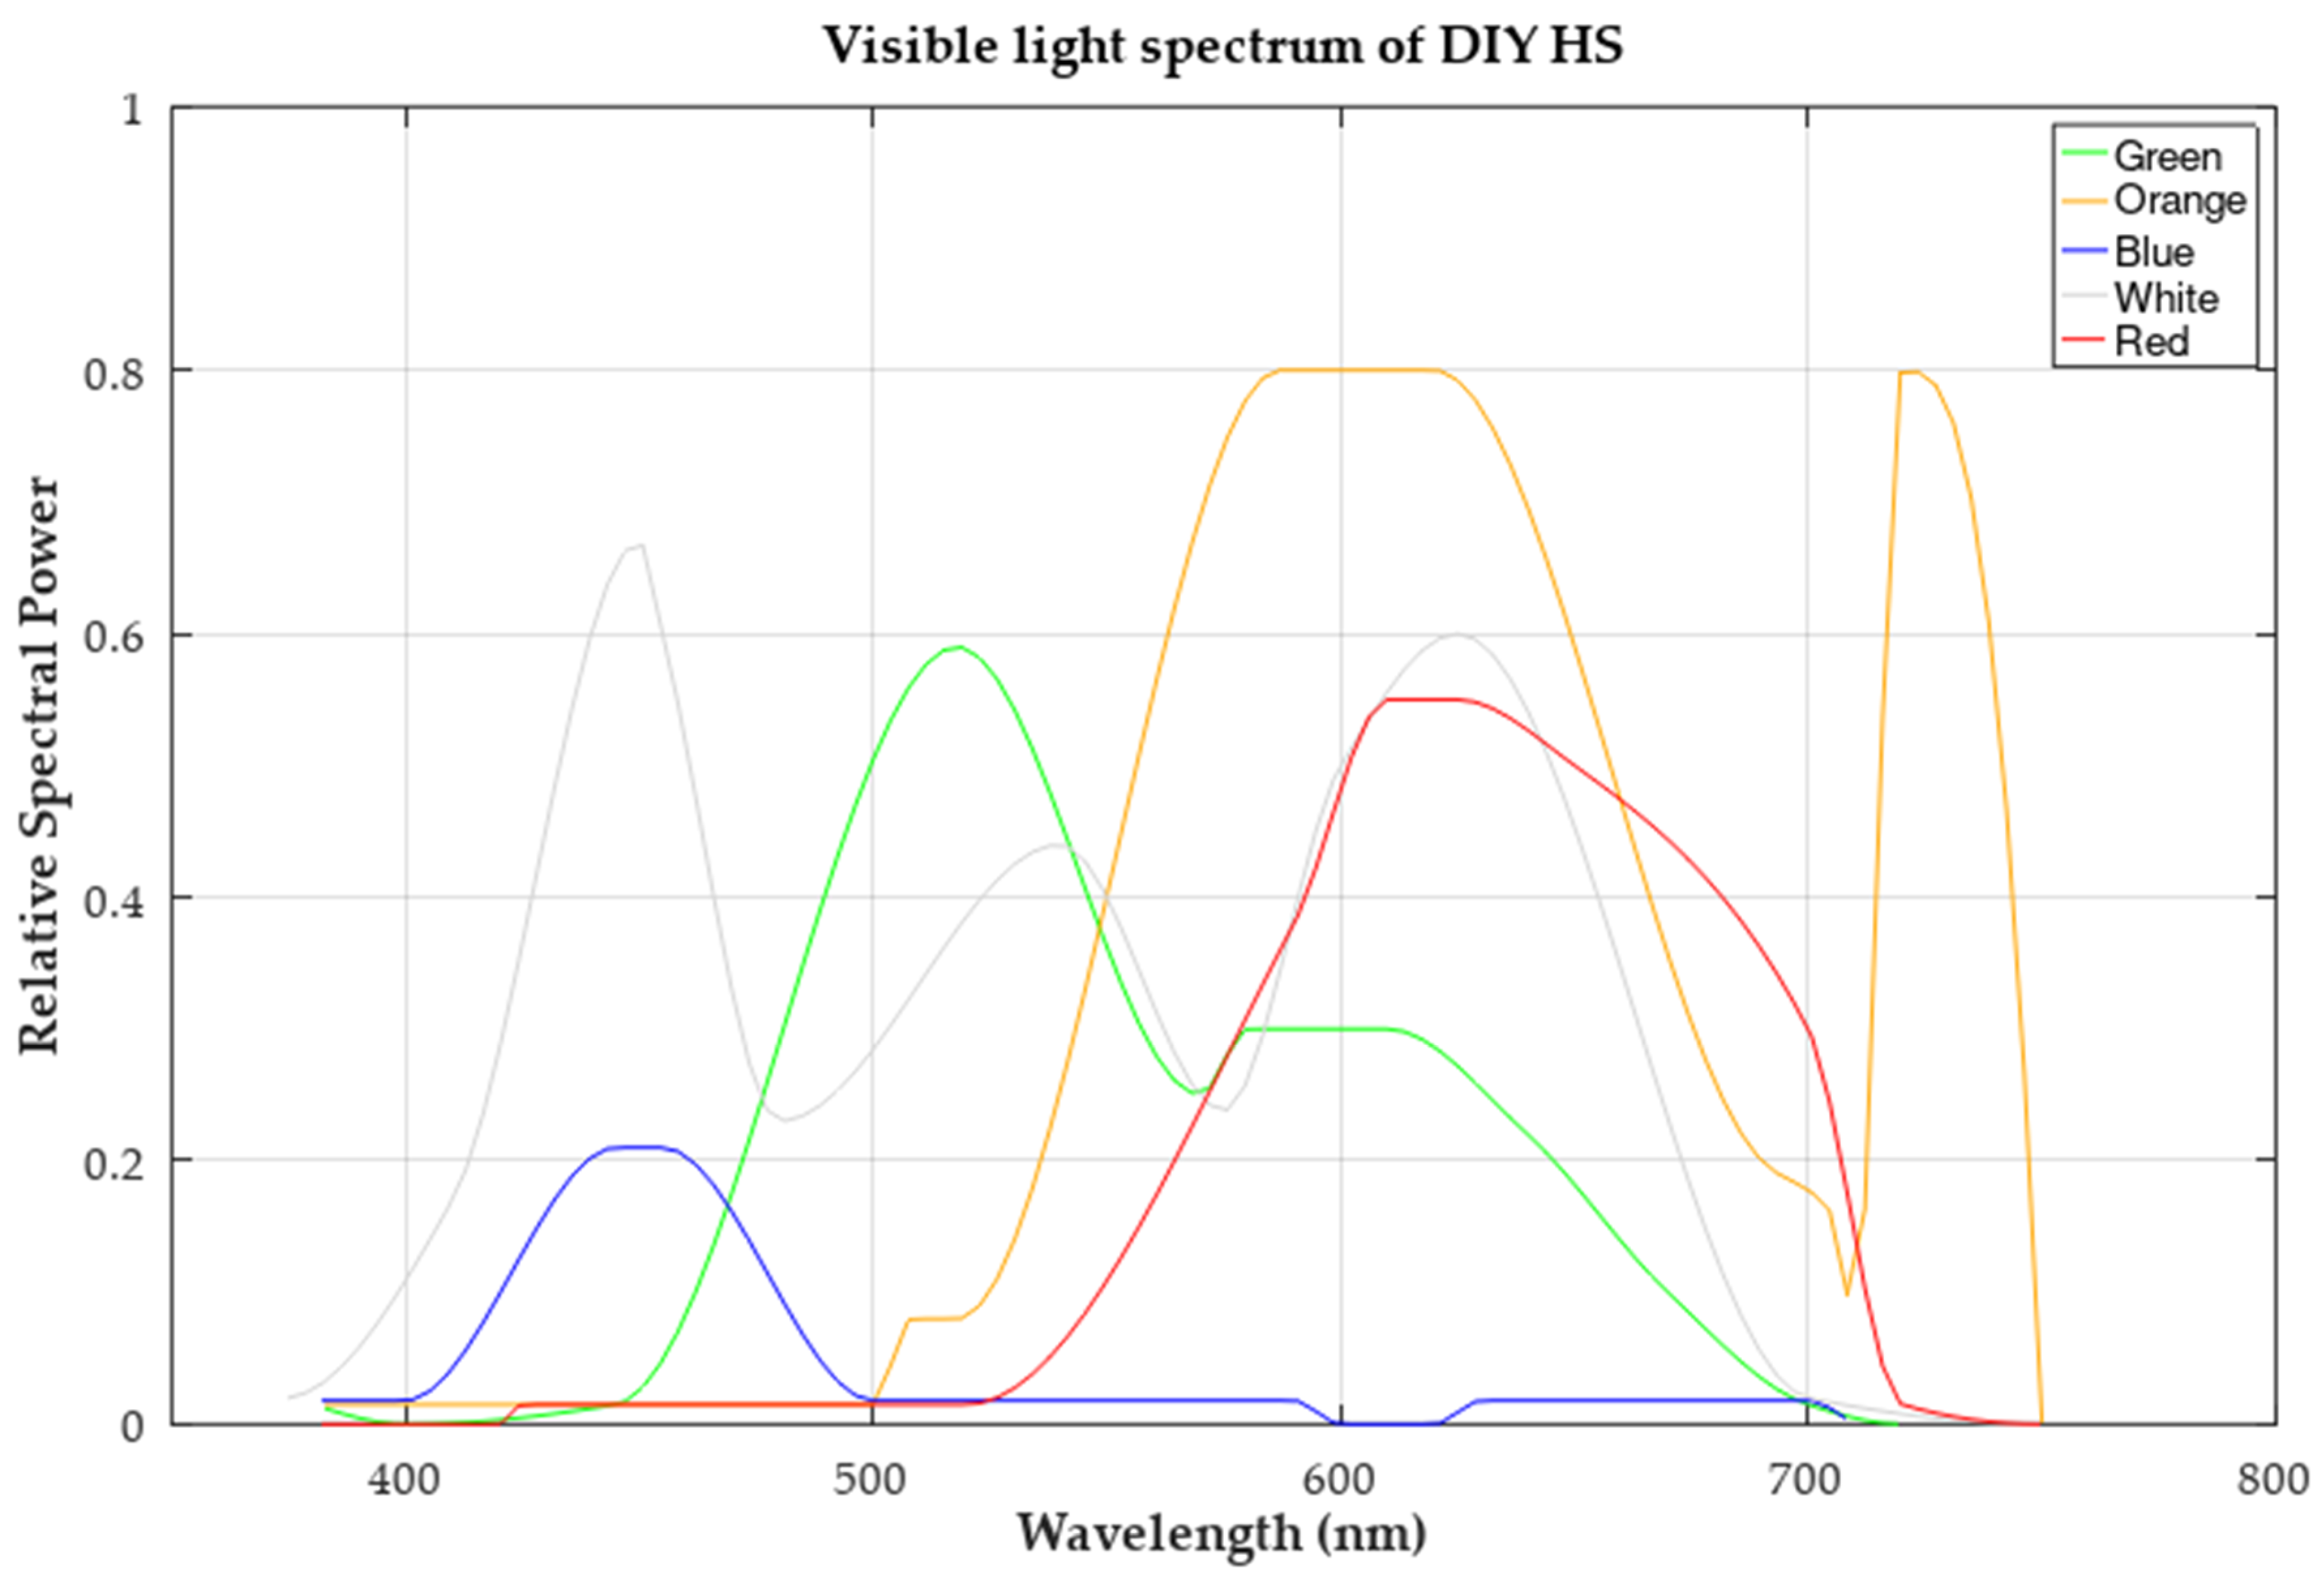
The spectrum of visible light for the colors red, green, blue, white, and orange has been generated in Octave and customized to enhance readability. Figure 13 presents the spectrum of visible light captured by the proposed DIY HS device, providing valuable insights into the device’s capabilities and the distinct characteristics of various colors within the visible spectrum.
The validation of the proposed device is further substantiated by the spectral information presented in Figure 13. It reaffirms the device’s capability to accurately capture and distinguish various colors within the visible spectrum. Specifically, the white color spans a wavelength range of 400–700 nm, covering the entire visible spectrum. The blue color is visible between 400 and 500 nm, aligning with its default wavelength range. The green color exhibits its peak sensitivity within the range of 495–570 nm. The orange and red colors showcase their peak values in the ranges of 590–620 nm and 620–750 nm, respectively. These observations underscore the device’s efficacy in capturing and discerning different colors based on their distinct spectral signatures.
5. Conclusions
In conclusion, the DIY HS device constructed using additive manufacturing methods has ushered in a new era of affordability, versatility, and accessibility in the field of spectral imaging. Through calibration and validation processes involving a 3D-printed multi-color box, this innovative device has demonstrated remarkable sensitivities across a wide spectrum of wavelengths, including red, blue, green, orange, and white light. The development of this DIY tool offers numerous advantages, particularly in the realm of ease construction. By utilizing readily available components and simple 3D printing construction methods, the tool can be assembled at a fraction of the cost of its commercial counterparts.
By keeping expenses minimal while ensuring robust functionality, this device extends ease of access to HS imaging technology to a broader audience of researchers and professionals. Such affordability not only democratizes access to HS data but also fosters innovation and exploration in various scientific fields where budget constraints have traditionally posed a significant hurdle. In this way, the device’s modest cost of EUR 194.56 serves as a testament to its potential to popularize HS imaging, making it a versatile and cost-effective tool for a wide range of applications.
This research not only showcases the versatility, cost-effectiveness, and precision achievable through additive manufacturing but also highlights the lightweight nature of the constructed device. The light weight (1263.65 g) of the DIY HS device can make the device compatible with UAV applications in agriculture or geology. Compared to other proposed DIY HS devices, the proposed solution not only offers a competitive edge in terms of cost and weight but also showcases superior material utilization. Its impressive spectral range coverage further solidifies its position as a powerful alternative in the field of HS imaging.
Furthermore, the 127 × 125-pixel spatial resolution and the spectral range with up to 290 wavebands from 379 to 937 nm alongside the resulting spectral resolution of 1.9241 nm per waveband, ensures its applicability in a diverse array of fields, from agriculture and environmental monitoring to medical diagnostics and beyond. This innovation represents a promising step forward in making HS imaging technology more accessible and versatile, thereby opening up new avenues for research and applications. As the possibilities of additive manufacturing and spectral analysis are explored, this DIY HS device stands as a testament to the power of innovation and collaboration in advancing scientific and technological frontiers.
The limitations of this HS device primarily revolve around the camera sensor’s low image resolution. Subsequent studies and experiments will be conducted with a particular focus on the camera sensor, to ensure the acquisition of high-quality HS images across various case studies. Prospective enhancements to the proposed device may entail exploring alternative camera sensor options and optical components to bolster both its spatial resolution and spectral range. These improvements could position the DIY HS device for use in agricultural applications, such as the identification of fungi in various trees and plants.
Further future improvements would be the development of a user-friendly mobile application that could significantly enhance the user-friendliness of the device, ensuring accessibility to individuals, including those less familiar with modern technologies. This user-friendly interface would simplify device control and broaden its convenience, potentially benefiting a wider range of users.
Author Contributions
Conceptualization, A.P. and S.P.; methodology, E.M.P. and N.G.; software, A.P. and N.G.; validation, N.G.; formal analysis, E.M.P. and A.P.; investigation, S.P. and A.P.; resources, E.M.P. and D.T.; data curation, A.P. and N.G.; writing—original draft preparation, A.P. and S.P.; writing—review and editing, E.M.P. and N.G.; visualization, S.P.; supervision, D.T.; project administration, E.M.P.; funding acquisition, E.M.P. All authors have read and agreed to the published version of the manuscript.
Funding
This research was funded by “Horizon 2020 PestNu project, grant number 101037128”. The APC was funded by the Centre for Research and Technology Hellas.
Data Availability Statement
Data available on request.
Acknowledgments
This work supported by the EU Green Deal project PestNu which has received funding from the European Union’s Horizon 2020 research and innovation programme under Grant Agreement no. 101037128.
Conflicts of Interest
The authors declare no conflict of interest.
Appendix A
Table A1 presents the cost calculation factors for the 3D printing process.

Table A1.
Cost calculation factors.
| Category | Quantity | Cost (EUR) |
|---|---|---|
| Electric power | 1 kWh | 0.39 |
| Average power consumption at 26 °C room temperature for PLA | 80 W | - |
| Average power consumption at 26 °C room temperature for PETG | 120 W | - |
| PLA filament | 1 kg | 17.66 |
| PETG filament | 1 kg | 18.54 |
Table A2 presents the additive manufacturing bill of material for all 3D-printed parts of the hyperspectral device.
Table A2.
Additive manufacturing bill of materials (BOM).
| Quantity (Items) | Part Name | Dimensions (mm) | Material | Used Filament (g) | Printing Time | Cost of Energy (EUR) | Cost of Material (EUR) | Unit Cost (EUR) |
|---|---|---|---|---|---|---|---|---|
| 1 | Camera Case | 206 × 189.41 × 106 | PETG | 496.00 | 47 h 14 min | 2.21 | 9.19 | 11.41 |
| 1 | Telephoto Lens Case | 33 × 97.75 × 74.75 | PETG | 28.21 | 2 h 20 min | 0.11 | 0.52 | 0.63 |
| 1 | Aperture | 3 × 97.75 × 74.75 | PLA | 20.60 | 1 h 24 min | 0.04 | 0.36 | 0.41 |
| 1 | Expansion 100 mm | 100 × 97.75 × 74.75 | PLA | 87.26 | 8 h 37 min | 0.27 | 1.54 | 1.81 |
| 1 | Macro Lens Case | 15 × 97.75 × 74.75 | PLA | 40.22 | 4 h 3 min | 0.13 | 0.71 | 0.83 |
| 1 | Diffraction Grating Case | 3 × 97.75 × 74.75 | PLA | 19.50 | 1 h 18 min | 0.04 | 0.34 | 0.38 |
| 1 | Camera Support Case | 25 × 97.75 × 74.75 | PLA | 35.96 | 3 h 0 min | 0.09 | 0.63 | 0.73 |
| 1 | Back Part | 52 × 3 × 97.75 × 113.66 | PETG | 63.70 | 5 h 15 min | 0.24 | 1.18 | 1.43 |
| Total | 791.45 | 3.13 | 14.49 | 17.63 |
Appendix B
Equations for calculating the total cost of the 3D-printed materials and the cost of energy for the 3D printing process.
References
- Bioucas-Dias, J.M.; Plaza, A.; Camps-Valls, G.; Scheunders, P.; Nasrabadi, N.; Chanussot, J. Hyperspectral Remote Sensing Data Analysis and Future Challenges. IEEE Geosci. Remote Sens. Mag. 2013, 1, 6–36. [Google Scholar] [CrossRef]
- Sowmya, V.; Soman, K.P.; Hassaballah, M. Hyperspectral Image: Fundamentals and Advances. In Recent Advances in Computer Vision: Theories and Applications; Hassaballah, M., Hosny, K.M., Eds.; Studies in Computational Intelligence; Springer International Publishing: Cham, Switzerland, 2019; pp. 401–424. [Google Scholar] [CrossRef]
- Li, J.; Pei, Y.; Zhao, S.; Xiao, R.; Sang, X.; Zhang, C. A Review of Remote Sensing for Environmental Monitoring in China. Remote Sens. 2020, 12, 1130. [Google Scholar] [CrossRef]
- Liaghat, S.; Balasundram, S. A Review: The Role of Remote Sensing in Precision Agriculture. Am. J. Agric. Biol. Sci. 2010, 5, 50–55. [Google Scholar] [CrossRef]
- Huang, H.; Liu, L.; Ngadi, M.O. Recent Developments in Hyperspectral Imaging for Assessment of Food Quality and Safety. Sensors 2014, 14, 7248–7276. [Google Scholar] [CrossRef]
- Gutiérrez-Gutiérrez, J.A.; Pardo, A.; Real, E.; López-Higuera, J.M.; Conde, O.M. Custom Scanning Hyperspectral Im-aging System for Biomedical Applications: Modeling, Benchmarking, and Specifications. Sensors 2019, 19, 1692. [Google Scholar] [CrossRef]
- Stuart, M.B.; McGonigle, A.J.S.; Willmott, J.R. Hyperspectral Imaging in Environmental Monitoring: A Review of Recent Developments and Technological Advances in Compact Field Deployable Systems. Sensors 2019, 19, 3071. [Google Scholar] [CrossRef]
- Lu, B.; Dao, P.D.; Liu, J.; He, Y.; Shang, J. Recent Advances of Hyperspectral Imaging Technology and Applications in Agriculture. Remote Sens. 2020, 12, 2659. [Google Scholar] [CrossRef]
- Giakoumoglou, N.; Pechlivani, E.M.; Sakelliou, A.; Klaridopoulos, C.; Frangakis, N.; Tzovaras, D. Deep learning-based multi-spectral identification of grey mould. Smart Agric. Technol. 2023, 4, 100174. [Google Scholar] [CrossRef]
- Thomas, S.; Kuska, M.T.; Bohnenkamp, D.; Brugger, A.; Alisaac, E.; Wahabzada, M.; Behmann, J.; Mahlein, A.K. Benefits of hyperspectral imaging for plant disease detection and plant protection: A technical perspective. J. Plant Dis. Prot. 2018, 125, 5–20. [Google Scholar] [CrossRef]
- Lagacherie, P.; Bailly, J.S.; Monestiez, P.; Gomez, C. Using scattered hyperspectral imagery data to map the soil properties of a region. Eur. J. Soil Sci. 2012, 63, 110–119. [Google Scholar] [CrossRef]
- Grigoriev, N. Construction and Development of a Low-Cost Hyperspectral Imaging System (Dissertation). 2022. Available online: https://urn.kb.se/resolve?urn=urn:nbn:se:umu:diva-197102 (accessed on 1 September 2023).
- Chang, C.-I.; Song, M.; Zhang, J.; Wu, C.C. HS Imaging and Applications. Remote Sens. 2017, 10, 517–537. [Google Scholar] [CrossRef]
- Feng, L.; Wei, L.; Nie, Y.; Huang, M.; Yang, L.; Fu, X.; Zhou, J. Design of a compact spectrometer with large field of view based on freeform surface. Opt. Commun. 2019, 444, 81–86. [Google Scholar] [CrossRef]
- Moreno Nieto, D.; Alonso-García, M.; Pardo-Vicente, M.A.; Rodríguez-Parada, L. Product Design by Additive Manufacturing for Water Environments: Study of Degradation and Absorption Behavior of PLA and PETG. Polymers 2021, 13, 1036. [Google Scholar] [CrossRef] [PubMed]
- Hsueh, M.-H.; Lai, C.-J.; Wang, S.-H.; Zeng, Y.-S.; Hsieh, C.-H.; Pan, C.-Y.; Huang, W.-C. Effect of Printing Parameters on the Thermal and Mechanical Properties of 3D-Printed PLA and PETG, Using Fused Deposition Modeling. Polymers 2021, 13, 1758. [Google Scholar] [CrossRef] [PubMed]
- Arroyo-Mora, J.P.; Kalacska, M.; Inamdar, D.; Soffer, R.J.; Lucanus, O.; Gorman, J.; Naprstek, T.; Schaaf, E.S.; Ifimov, G.; Elmer, K.; et al. Implementation of a UAV–Hyperspectral Pushbroom Imager for Ecological Monitoring. Drones 2019, 3, 12. [Google Scholar] [CrossRef]
- Sousa, J.J.; Toscano, P.; Matese, A.; Di Gennaro, S.F.; Berton, A.; Gatti, M.; Poni, S.; Pádua, L.; Hruška, J.; Morais, R.; et al. UAV-Based Hyperspectral Monitoring Using Push-Broom and Snapshot Sensors: A Multisite Assessment for Precision Viti-culture Applications. Sensors 2022, 22, 6574. [Google Scholar] [CrossRef] [PubMed]
- Botero-Valencia, J.S.; Valencia-Aguirre, J. Portable low-cost IoT hyperspectral acquisition device for indoor/outdoor applications. HardwareX 2021, 10, e00216. [Google Scholar] [CrossRef] [PubMed]
- Salazar-Vazquez, J.; Mendez-Vazquez, A. A plug-and-play Hyperspectral Imaging Sensor using low-cost equipment. HardwareX 2020, 7, e00087. [Google Scholar] [CrossRef]
- Riihiaho, K.A.; Eskelinen, M.A.; Pölönen, I. A Do-It-Yourself Hyperspectral Imager Brought to Practice with Open-Source Python. Sensors 2021, 21, 1072. [Google Scholar] [CrossRef]
- Mao, Y.; Betters, C.H.; Evans, B.; Artlett, C.P.; Leon-Saval, S.G.; Garske, S.; Cairns, I.H.; Cocks, T.; Winter, R.; Dell, T. OpenHSI: A Complete Open-Source Hyperspectral Imaging Solution for Everyone. Remote Sens. 2022, 14, 2244. [Google Scholar] [CrossRef]
- Sigernes, F.; Syrjäsuo, M.; Storvold, R.; Fortuna, J.; Grøtte, M.E.; Johansen, T.A. Do it yourself hyperspectral imager for handheld to airborne operations. Opt. Express 2018, 26, 6021–6035. [Google Scholar] [CrossRef]
- MUSES9 Multispectral Camera–Spectricon. (n.d.) Spectricon.com. Available online: https://spectricon.com/muses9-multispectral-camera/ (accessed on 5 October 2023).
- Oh, S.W.; Brown, M.S.; Pollefeys, M.; Kim, S.J. Do It Yourself Hyperspectral Imaging with Everyday Digital Cameras. In Proceedings of the 2016 IEEE Conference on Computer Vision and Pattern Recognition (CVPR), Las Vegas, NV, USA, 27–30 June 2016; pp. 2461–2469. [Google Scholar] [CrossRef]
- Pust, O. Innovative Filter Solutions for Hyperspectral Imaging. Opt. Photonik 2016, 11, 24–27. [Google Scholar] [CrossRef]
- Norris, D. Machine Learning with the Raspberry Pi: Experiments with Data and Computer Vision; Springer: Berlin/Heidelberg, Germany, 2020. [Google Scholar] [CrossRef]
- Available online: https://www.raspberrypi.com/products/raspberry-pi-4-model-b/specifications/ (accessed on 1 September 2023).
- PDhawankar, P.; Kumar, A.; Crespi, N.; Busawon, K.; Qureshi, K.N.; Javed, I.T.; Prakash, S.; Kaiwartya, O. Next-Generation Indoor Wireless Systems: Compatibility and Migration Case Study. IEEE Access 2021, 9, 156915–156929. [Google Scholar] [CrossRef]
- Papadopoulou, V.; Kontodina, T.; Pechlivani, E.M.; Asimakopoulou, A.; Ioannidis, D.; Tzovaras, D. 3D Printed Smart Luminous Artifacts. In Progress in Digital and Physical Manufacturing. ProDPM 2021; Correia Vasco, J.O., De Amorim Almeida, H., Gonçalves Rodrigues Marto, A., Bento Capela, C.A., Da Silva Craveiro, F.G., Coelho Da Rocha Terreiro Galha Bárt, H.M., De Jesus Coelho, L.M., Simões Correia, M.A., Nogueira Vieira, M.M., Barreiros Ruben, R.M., et al., Eds.; Springer Tracts in Additive Manufacturing; Springer: Cham, Switzerland, 2023. [Google Scholar] [CrossRef]
- Pechlivani, E.M.; Papadimitriou, A.; Pemas, S.; Ntinas, G.; Tzovaras, D. IoT-Based Agro-Toolbox for Soil Analysis and Environmental Monitoring. Micromachines 2023, 14, 1698. [Google Scholar] [CrossRef] [PubMed]
- Petrov, P.; Agzamova, D.; Pustovalov, V.; Zhikhareva, E.; Saprykin, B.; Chmutin, I.; Shmakova, N. Research into the effect of the 3D-printing mode on changing the properties of PETG transparent plastic. In Proceedings of the 24th International Conference on Material Forming, Liège, Belgium, 14–16 April 2021. [Google Scholar] [CrossRef]
- Farah, S.; Anderson, D.G.; Langer, R. Physical and mechanical properties of PLA, and their functions in widespread applications—A comprehensive review. Adv. Drug Deliv. Rev. 2016, 107, 367–392. [Google Scholar] [CrossRef]
- Taib, N.-A.A.B.; Rahman, M.R.; Huda, D.; Kuok, K.K.; Hamdan, S.; Bakri, M.K.B.; Julaihi, M.R.M.B.; Khan, A. A review on poly lactic acid (PLA) as a biodegradable polymer. Polym. Bull. 2023, 80, 1179–1213. [Google Scholar] [CrossRef]
- Original Prusa i3 MK3S+ 3D Printer. (n.d.). Prusa3D by Josef Prusa. 2023. Available online: https://www.prusa3d.com/product/original-prusa-i3-mk3s-3d-printer-3 (accessed on 1 September 2023).
- Abdel-Rahman, F.; Okeremgbo, B.; Alhamadah, F.; Jamadar, S.; Anthony, K.; Saleh, M.A. Caenorhabditis elegans as a model to study the impact of exposure to light emitting diode (LED) domestic lighting. J. Environ. Sci. Health Part A Toxic/Hazard. Subst. Environ. Eng. 2017, 52, 433–439. [Google Scholar] [CrossRef]
- Skorka, O.; Kane, P.; Ispasoiu, R. Color correction for RGB sensors with dual-band filters for in-cabin imaging applications. Electron. Imaging 2019, 31, 46-1–46-8. [Google Scholar] [CrossRef]
Figure 1.
Architectural illustration of the HS device.

Figure 2.
Structure of the optical components.

Figure 3.
Connection of the electronic components.

Figure 4.
Camera parts in exploded view.

Figure 5.
Standard triangle language files for 3D-printed camera parts.

Figure 6.
Aspects of the final HS device structure.

Figure 7.
First- and zero-order areas.

Figure 8.
(a) 6500 K fluorescent lamp, (b) 3000 K incandescent lamp, (c) spectral image to calibrate region of interest.
Figure 8.
(a) 6500 K fluorescent lamp, (b) 3000 K incandescent lamp, (c) spectral image to calibrate region of interest.

Figure 9.
(a) Normalized RGB sensors sensitivities of DIY HS device, (b) normalized RGB sensors sensitivities of alternative studied device [37].
Figure 9.
(a) Normalized RGB sensors sensitivities of DIY HS device, (b) normalized RGB sensors sensitivities of alternative studied device [37].

Figure 10.
Gcode file for multi-color box.

Figure 11.
HS image of the experimental setup in squareHSI.

Figure 12.
Spectral images for (a) 448 nm, (b) 536 nm, (c) 594 nm, and (d) 624 nm.

Figure 13.
Spectrum of visible light of the DIY HS.

Table 1.
Proposed vs. alternative DIY device specifications.
| Device | Total Cost (EUR) | Total Weight (g) | Spectral Range (nm) | Material | Spectral Resolution (nm) | Spatial Resolution (Pixels) |
|---|---|---|---|---|---|---|
| Proposed Device | 194.56 | 1263.65 | 379–937 | PETG & PLA interior parts | 1.9241 | 127 × 125 |
| Botero-Valencia et al. [19] (2021) | 251.83 | - | 410–940 | ABS | - | - |
| Salazar-Vazquez et al. [20] (2020) | 462.74 | 300 | 400–1052 | PLA | 2.0698 | 116 × 110 |
| Riihiaho et al. [21] (2021) | 2000.00 | - | 400–600 | PLA | - | 3376 × 2704 |
| Mao et al. [22] (2022) | - | 119 | 400–830 | ABS/Photosensitive resin | 4 | 2064 × 1544 |
| Sigernes et al. [23] (2018) | 647.84 | 200 | 400–800 | PLA | - | - |
| MUSES9-MS 1100 [24] | 10,000–100,000 | 1500 | 360–1100 | Commercial product | 123.33 | 3096 × 2080 |
Table 2.
Hardware components overview.
| Name | Type |
|---|---|
| Front camera telephoto lens | Optical |
| Macro lens | Optical |
| Diffraction grating | Optical |
| Raspberry Pi NoIR camera | Optical/Electronic |
| Raspberry Pi 4 board | Electronic |
| Cooling fan | Electronic |
| Power bank | Electronic |
Table 3.
Specifications of the optical components.
| Component Name | Part Number | Quantity | Cost (EUR) | Weight (g) | Size (mm) | Specification |
|---|---|---|---|---|---|---|
| Front Camera Telephoto Lens | SeeedStudio 114992275 “www.mouser.com (accessed on 1 September 2023)” | 1 | 41.27 | 81 | 35 | 10 MP resolution, C-CS mount, adjustable aperture ring with F1.7–F16 and focus ring. |
| Diffraction Grating | SKU #01602 “www.rainbowsymphony.com (accessed on 1 September 2023)” | 1 | 3.69 | 2 | 20 × 20 | Double axis, 5319 lines/cm |
| Macro Lens | Digital-46846 “www.fotomarket.gr (accessed on 1 September 2023)” | 1 | 23.39 | 32 | 52 | +10 close-up filter |
Table 4.
Specifications of the electronic components.
| Component Name | Part Number | Quantity | Cost (EUR) | Weight (g) | Size (mm) | Specification |
|---|---|---|---|---|---|---|
| Raspberry Pi 4 Board | SC0192-8 “www.nettop.gr (accessed on 1 September 2023)” | 1 | 48.31 | 46 | 56 × 85 × 16 | 8 GB RAM, 16 GB MicroSD, 5.0 V input voltage, Broadcom BCM2711, quad-core Cortex-A72 (ARM v8) 64-bit SoC @ 1.5 GHz, 2.4 GHz and 5.0 GHz IEEE 802.11ac Wireless |
| Raspberry Pi NoIR Camera Module V2.1 | 2510729 (www.nettop.gr) | 1 | 25.73 | 3 | 38 × 38 × 17.43 | Sony IMX219 CMOS sensor, 8 megapixels, 4.6 mm sensor diagonal, 1.12 × 1.12 μm pixel size, IR cut filter |
| Veger S20 Power bank | VP3008PD | 1 | 32.20 | 302 | 108.9 × 70 × 8.2 | 20,000 mAh, 20 W, 3 outputs (USB C + USB 1/2) and 2 inputs (USB C +Micro USB), QC 3.0 |
| Raspberry Pi Cooling Fan | 12-00C189 (www.nettop.gr) | 1 | 2.34 | 6.2 | 30 × 30 × 7.5 | 1 Watt |
| Total | 176.93 | 472.2 |
Disclaimer/Publisher’s Note: The statements, opinions and data contained in all publications are solely those of the individual author(s) and contributor(s) and not of MDPI and/or the editor(s). MDPI and/or the editor(s) disclaim responsibility for any injury to people or property resulting from any ideas, methods, instructions or products referred to in the content. |
© 2023 by the authors. Licensee MDPI, Basel, Switzerland. This article is an open access article distributed under the terms and conditions of the Creative Commons Attribution (CC BY) license (https://creativecommons.org/licenses/by/4.0/).
Share and Cite
MDPI and ACS Style
Pechlivani, E.M.; Papadimitriou, A.; Pemas, S.; Giakoumoglou, N.; Tzovaras, D. Low-Cost Hyperspectral Imaging Device for Portable Remote Sensing. Instruments 2023, 7, 32. https://doi.org/10.3390/instruments7040032
AMA Style
Pechlivani EM, Papadimitriou A, Pemas S, Giakoumoglou N, Tzovaras D. Low-Cost Hyperspectral Imaging Device for Portable Remote Sensing. Instruments. 2023; 7(4):32. https://doi.org/10.3390/instruments7040032
Chicago/Turabian StylePechlivani, Eleftheria Maria, Athanasios Papadimitriou, Sotirios Pemas, Nikolaos Giakoumoglou, and Dimitrios Tzovaras. 2023. "Low-Cost Hyperspectral Imaging Device for Portable Remote Sensing" Instruments 7, no. 4: 32. https://doi.org/10.3390/instruments7040032