Direct Photonic Fusion of Vitrified Bonding Materials

1
Department of Engineering, University of Liverpool, Liverpool L69 3BX, UK
2
Bonded Abrasive Group, Cambridge, Massachusetts, MA 01239, USA
*
Author to whom correspondence should be addressed.
Inventions 2017, 2(3), 19; https://doi.org/10.3390/inventions2030019
Submission received: 17 July 2017
/
Revised: 8 August 2017
/
Accepted: 16 August 2017
/
Published: 18 August 2017
(This article belongs to the Special Issue Modern Grinding Technology and Systems)
Abstract
:The purpose of this study is to show the effects of the direct fusion of raw materials used for vitrified grinding wheels by photonic interactions. The paper describes the construction of a sintering apparatus that employs a pulsed neodymium: yttrium aluminum garnet (Nd:YAG) laser to fuse a combination of raw materials such as ball clay, feldspar, and borax to form a partially-crystalline glass material. The experimental results show that lasers can replace traditional methods of glass frit formation by fusing raw materials used in the manufacture of glass bonds for vitrified grinding wheels. X-ray diffraction data shows that a glass with short range order has formed using the new method. The work described herein provides a new avenue for glass frit formation applied to grinding wheel manufacture.
1. Introduction
When studying the structure of vitrified bonds (i.e., raw materials that vitrify and form a mechanical and chemical bond with abrasive grains), it is obvious that differences in bonding characteristics are common in grinding wheels made with the same batch formulation but made from a variety of commercially available raw materials. This is not surprising considering that clays and feldspar minerals vary in composition and have different concentrations of trace elements. Oxides present in clays and feldspars can affect crystallization behavior to a large degree [1]. The subsequent melting and devitrification behavior of these raw materials can greatly affect the products of fusion. One way to prepare grinding wheels is to use pre-fitted raw materials where oxide compositions can be tailored to suit a particular grinding operation [2]. The current method of pre-fritting is to melt clays and feldspars at high temperature in a specially prepared platinum crucible so that the molten mass can be quickly quenched from high temperature to prepare the melt for fritting [3,4,5,6]. This is done by pouring the molten glass into a suitable coolant to control the rate of glass formation prior to milling and crushing to form the powdered glass frit [7,8,9,10]. The main aim of this work is to increase the rate at which the bonding materials are fused to form a glass or glass–ceramic bond using a directed photon beam, which not only prepares the fused mass for fritting, but can be further developed to form a vitrified network in a grinding wheel without the need for fritting, thus reducing the time it takes to produce a commercially available grinding wheel.
2. Experimental Apparatus and Materials
A specially designed photonic sintering unit was constructed using a Rofin Sinar 90 W flash-lamp pumped, Q-switched yttrium aluminum garnet (Nd:YAG) laser (molecular vibrating) with a frequency range of 0–60 kHz (photon wavelength, λ = 1.06 µm (infra-red), photon frequency, ν = 2.8 × 10¹⁴ Hz, quantum efficiency ~40%). The laser consisted of a standard cavity design with the active medium being Nd3+ ions in a YAG crystal rod mounted to one of the foci of an elliptical chamber made from gold-coated aluminum. At the opposing end was a krypton lamp whose emission spectrum suits the Nd3+ activity profile. Mode control was activated by a Q-switch that creates controlled photonic oscillations in such a way that a mechanical chopper, optoelectronic switch, or an acoustic-optic switch can be used to control the mode of the light beam [11]. For this particular laser, the acoustic-optic switch propagates sound waves through a crystal lattice generated by a piezo-electric transducer. A radio frequency oscillator generates sound waves in the 24–27 MHz range that produces waves with an alternating refractive index, causing it to act like an optical grating and stopping the action of the laser.
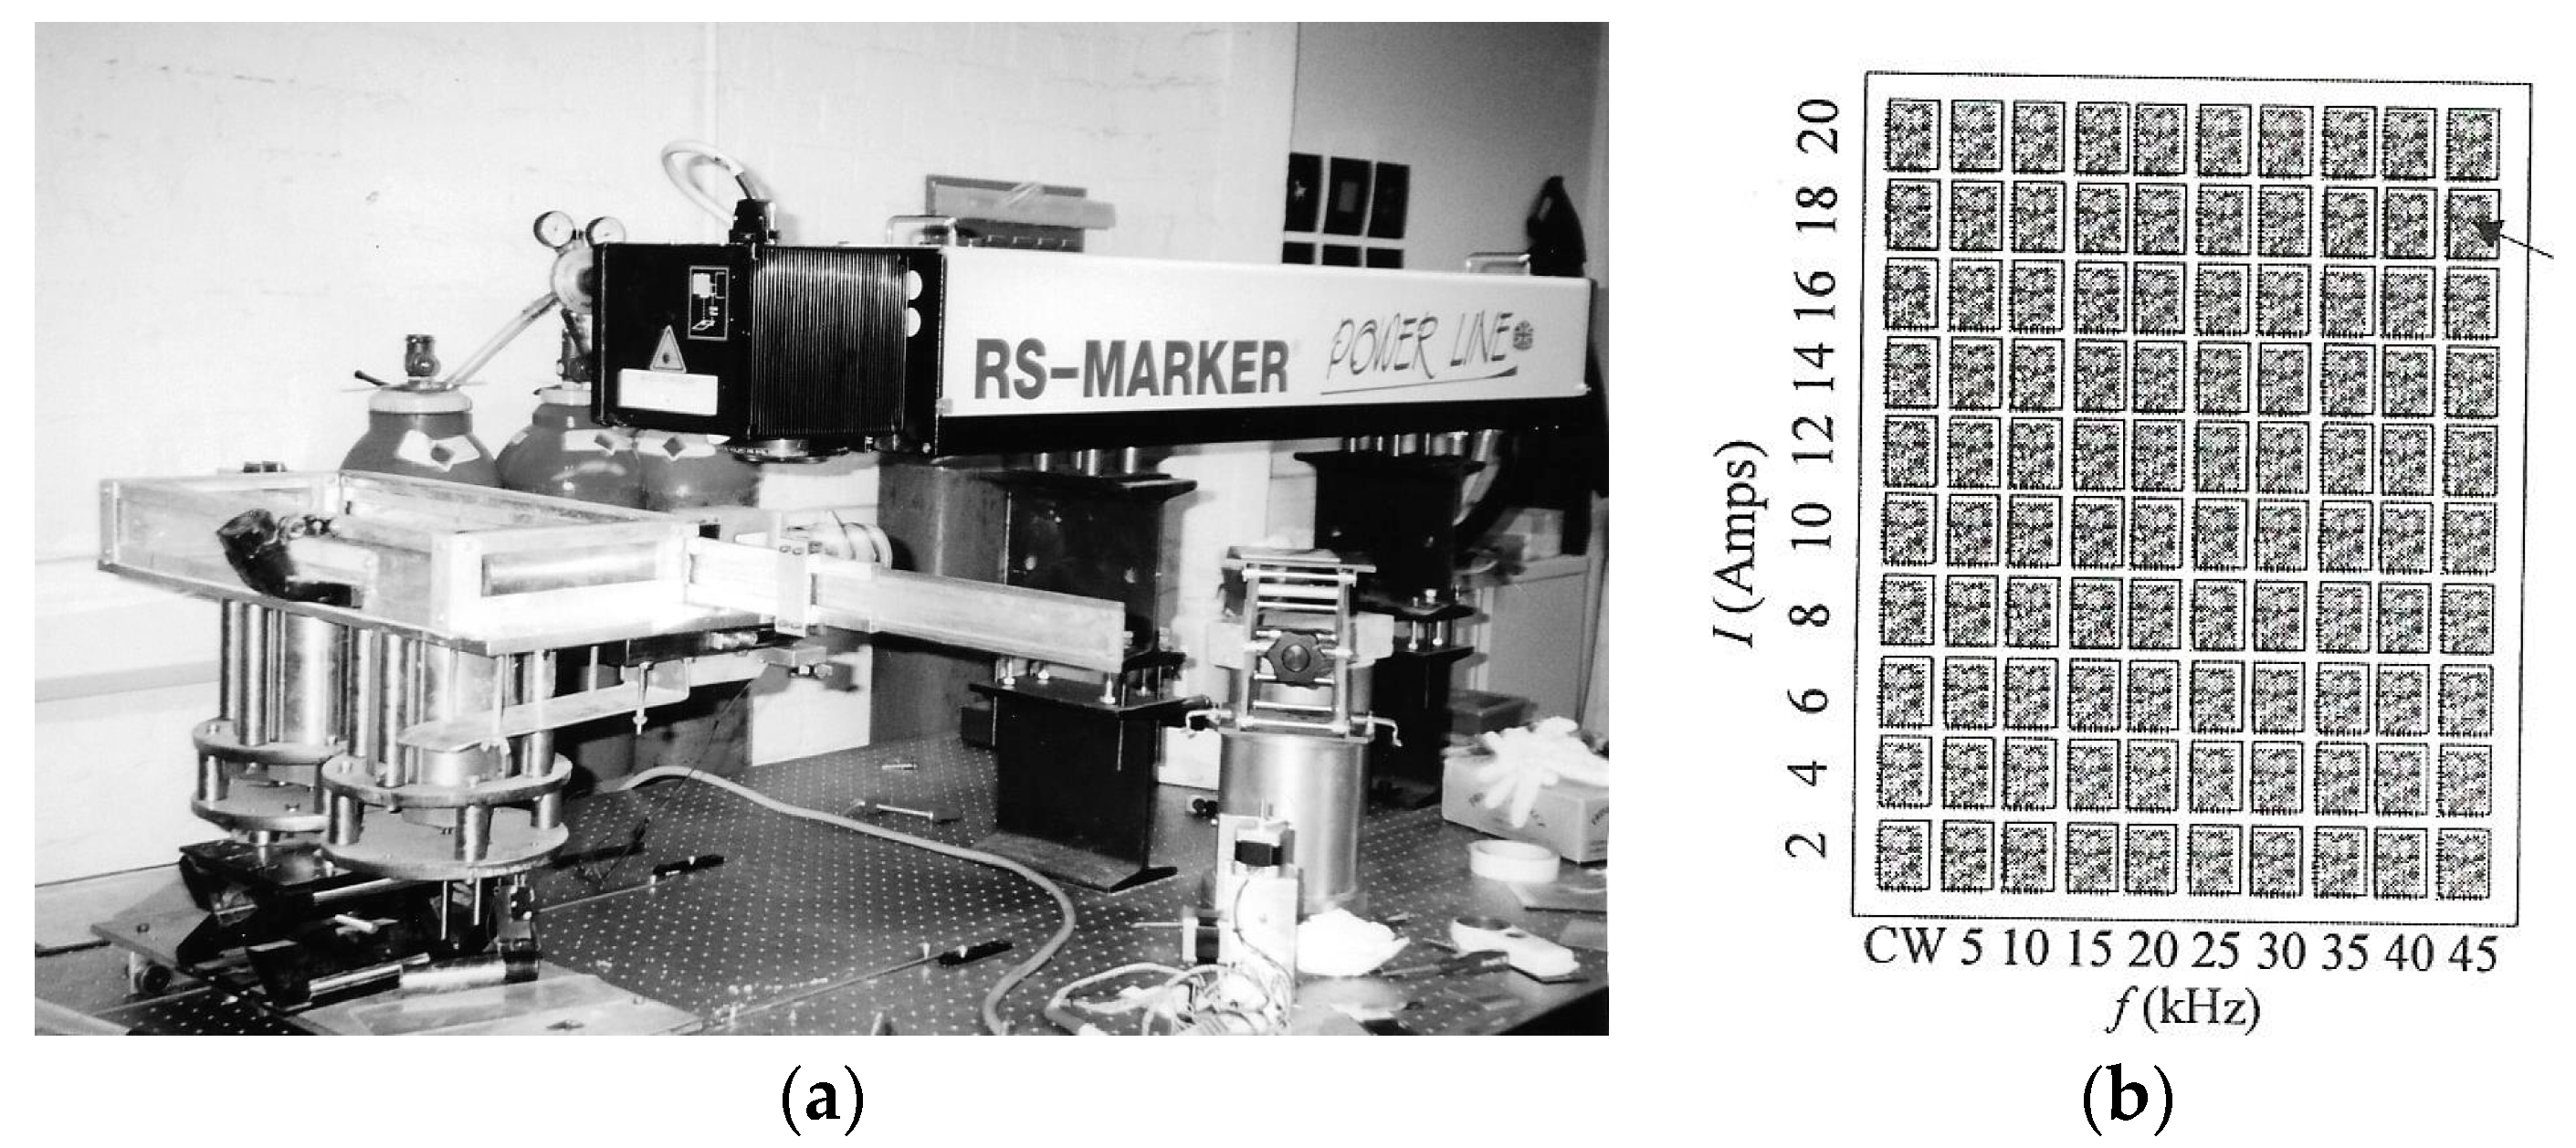
Approximately 60–100 W of power is required to deflect a 60 W beam, so the Q-switch has to be cooled during laser operation. The speed of the optical shutters allows energy to build up in the cavity when the laser action is halted, thus creating very high peak power to be generated. For a 20 W Nd-YAG laser, Q-switch action may produce 1 mJ/pulse (pulse widths ~6 ns), resulting in the generation of 100 kW peak power. The pulse energy and pulse widths used in the current work were in the range of 0.2–3 mJ and 80–250 ns, respectively. For pulse frequencies between 15 and 60 kHz, the output power ranged from 2–12 W (lamp currents ~8–20 A (Figure 1)).
Scan line overlap was ~50% of line width, and the peak power density was 1.4 GW/cm2. Line scanning was achieved using a scanning head galvanometer containing two thermally regulated galvanometers giving a scanning speed range of 1–500 mm/s over an 80 mm × 80 mm scanning area. The focal length of the imaging lens was 112 mm, giving a minimum spot size of 50 µm. The experimental apparatus is shown in Figure 2a.
The build chamber consists of a build cylinder and powder delivery cylinder, each of 100 mm diameter powered by two linear stepping motors with a minimum step size of 250 nm and maximum stepping rate of 380 steps/s. A thin layer of powder (10 mm thickness) was mounted on the build platform so that laser–material interactions could be characterized during the experimental procedure. The parametric variables investigated were frequency (0–60 Hz), scanning velocity (~50–500 mm/s), lamp current (8–20 A), focal length (104–112 mm), and spot size (100−300 µm). The system configuration enabled a matrix of 100 parametric values to be examined. The schematic layout of the laser–material interaction experiments is shown in Figure 2b.
The materials used in the experiments are those typically used in vitrified grinding wheels and include Devon ball clay (BC), Finnish flotation feldspar (FFF), borax frit (BX), and mixtures of all three raw materials. The preliminary results showed that no interactions occurred between the pulsed photonic beam and the ball clay up to 17.3 A, then vaporization occurred. Rapid heating of a powder results in a shock wave traveling towards the laser beam which vaporizes as it leaves the surface at velocities >105 m/s. However, on inspection of the ball clay, there was no evidence of powder blasting or cratering on the clay surface. This situation is tolerable because ball clay is used in grinding wheel manufacture to support abrasive particles together as a matrix while the fusible component of the bond melts and fills the interstices between clay particle and abrasive grain.
3. Experimental Results
The experimental work focused on the effects of changing process variables such as laser spot size, focal length, scanning velocity, lamp current, and optical frequency on the physical appearance and crystallographic structure of the fused bonding materials. The bonding materials processed were ball clay (BC), feldspar (FFF), borax frit (BX), and a mixture composed of 60 wt. % frit (BX), 20 wt. % ball clay (BC) and 20 wt. % feldspar (FFF).
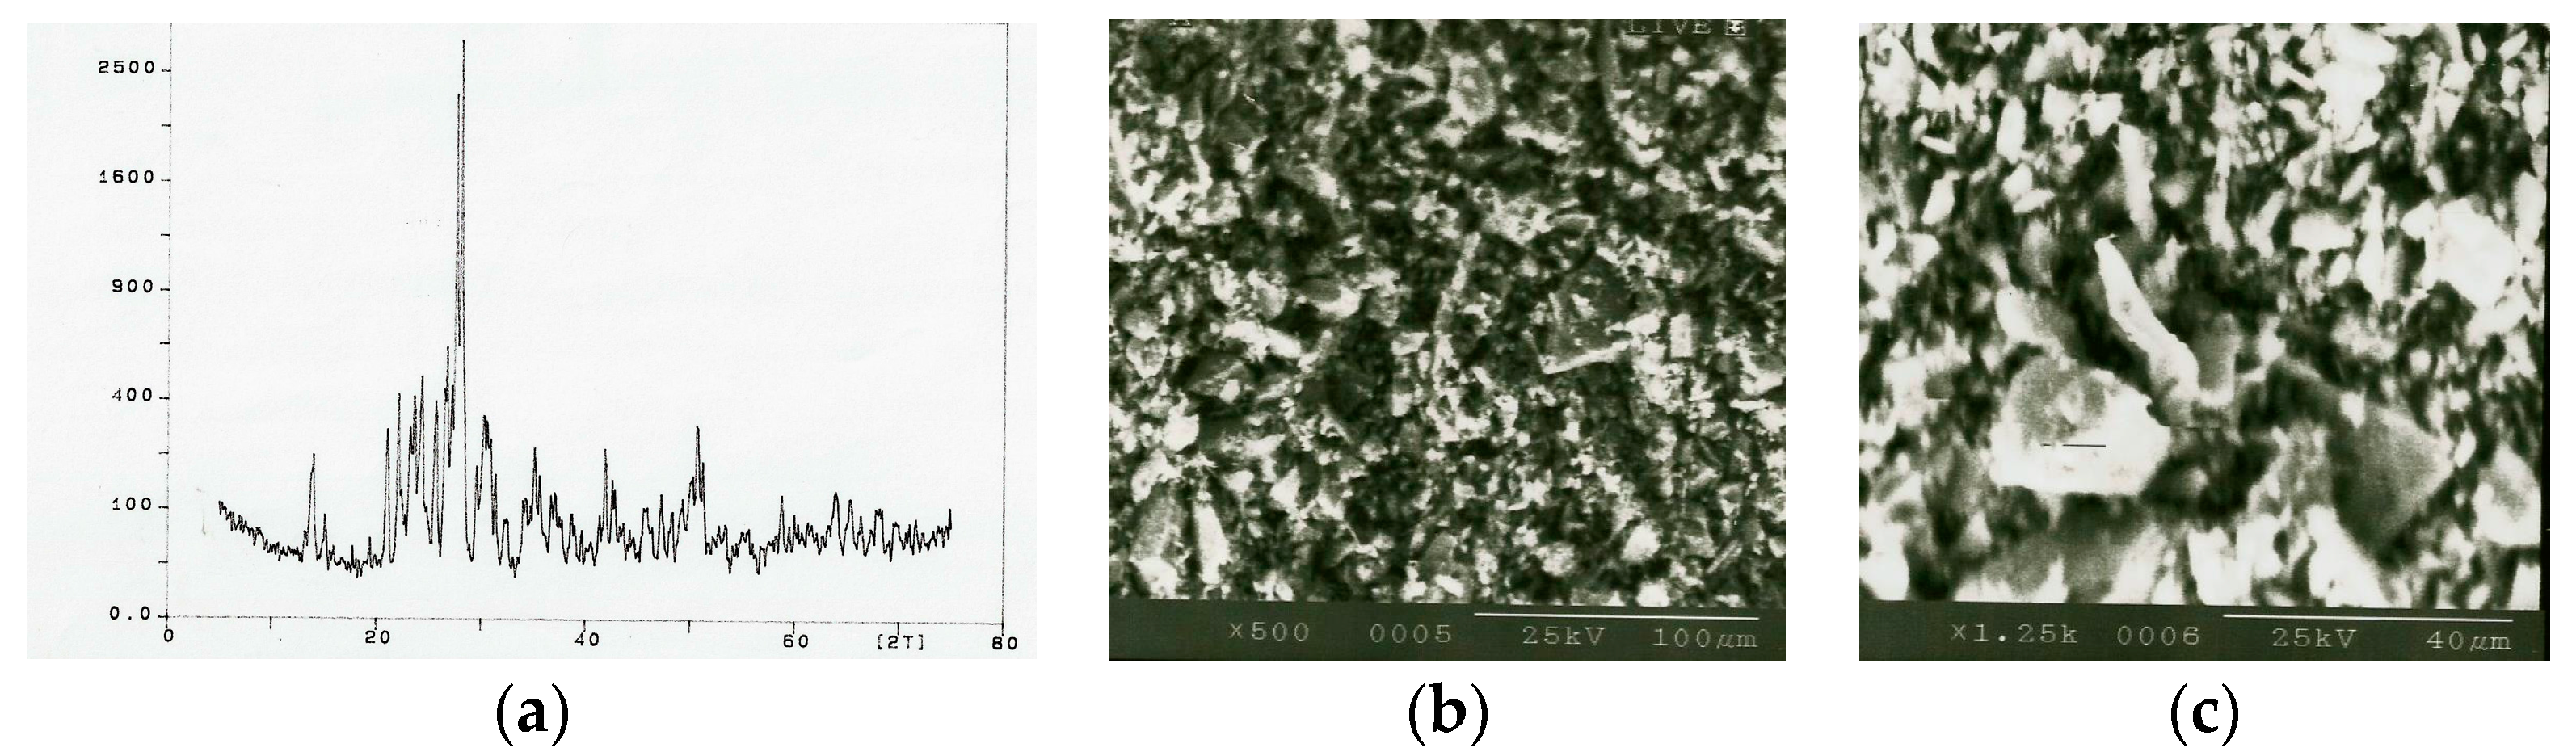
Initially, X-ray diffraction of the raw materials was performed to characterize each bond ingredient using a Phillips 1710 X-ray generator with a 40 kV tube voltage and a 30 mA current. Monochromatic Cu kα radiation, λ = 1.54060 Å (wavelength intensity ratio ~0.5, divergence slit angle ~0.5°, receiving slit angle ~0.2°), was employed in the analysis. A scanning speed of 2° per minute for diffraction angles of 2θ between 15° and 60° was recorded by computer (start angle ~5° (2θ), end angle ~5° (2θ), step size ~0.04° (2θ)). The spectrum of each raw material was analyzed and compared with known spectra. Powder specimens were prepared by crushing in a mortar and pestle in preparation for quantitative X-ray diffraction. To eliminate the requirement of knowing mass absorption coefficients of ceramic samples for quantitative X-ray diffraction, Alexander and Klug [12] introduced the use of an internal standard for powder X-ray analysis. The powder bed subjected to “X-rays” should give the maximum diffracted intensity. The spectrum for ball clay (BC) is shown in Figure 3a. The spectrum shows kaolinite (Al2Si2O5(OH)4) at 2θ angles (plane) [d-value (α1)] of 12.285° (001) [7.199 Å], 19.79° (020) [4.4826 Å], 24.815° (002) [3.5851 Å], 34.92° (-201) [2.5673 Å], 35.925° (200) [2.4978 Å], 37.65° (003) [2.3872 Å], 50.955° (004) [1.7907 Å], 59.855° (114) [1.544 Å], 63.895° (223) [1.4558 Å], 68.255° (062) [1.3730 Å], and 72.14° (204) [1.3083 Å]. The next major component of ball clay is quartz (SiO2), and shows 2θ angles (plane) [d-value (α1)] of 26.585° (101) [3.3503 Å], 40.25° (111) [2.2388 Å], 54.81° (202) [1.6736 Å], and 67.655° (212) [1.3837 Å]. Muscovite mica ((K, Na)Al2(SiAl)4O10) also appears in the spectrum, but is of low measurable order.
The spectrum for Finnish Flotation Feldspar (FFF) is shown in Figure 4a. The major components detected include quartz (SiO2) showing 2θ angles (plane) [d-value (α1)] of 26.585° (101) [3.3503 Å], 40.25° (111) [2.2388 Å], 54.81° (202) [1.6736 Å] and 67.655° (212) [1.3837 Å] and albite (NaAlSi3O8) showing reflections at 020, 003, 112, 040 and 004 planes with corresponding d-values of 6.42, 4.24, 3.756, 3.21 and 3.18 Å, respectively.
The spectrum for Borax frit (BX) is shown in Figure 5a. The major components include anhydrous borax (Na2B4O7), which is approximately 31 wt. % Na2O and 69 wt. % B2O3, and quartz (SiO2) showing 2θ angles (plane) [d-value (α1)] of 26.585° (101) [3.3503 Å], 40.25° (111) [2.2388 Å], 54.81° (202) [1.6736 Å], and 67.655° (212) [1.3837 Å].
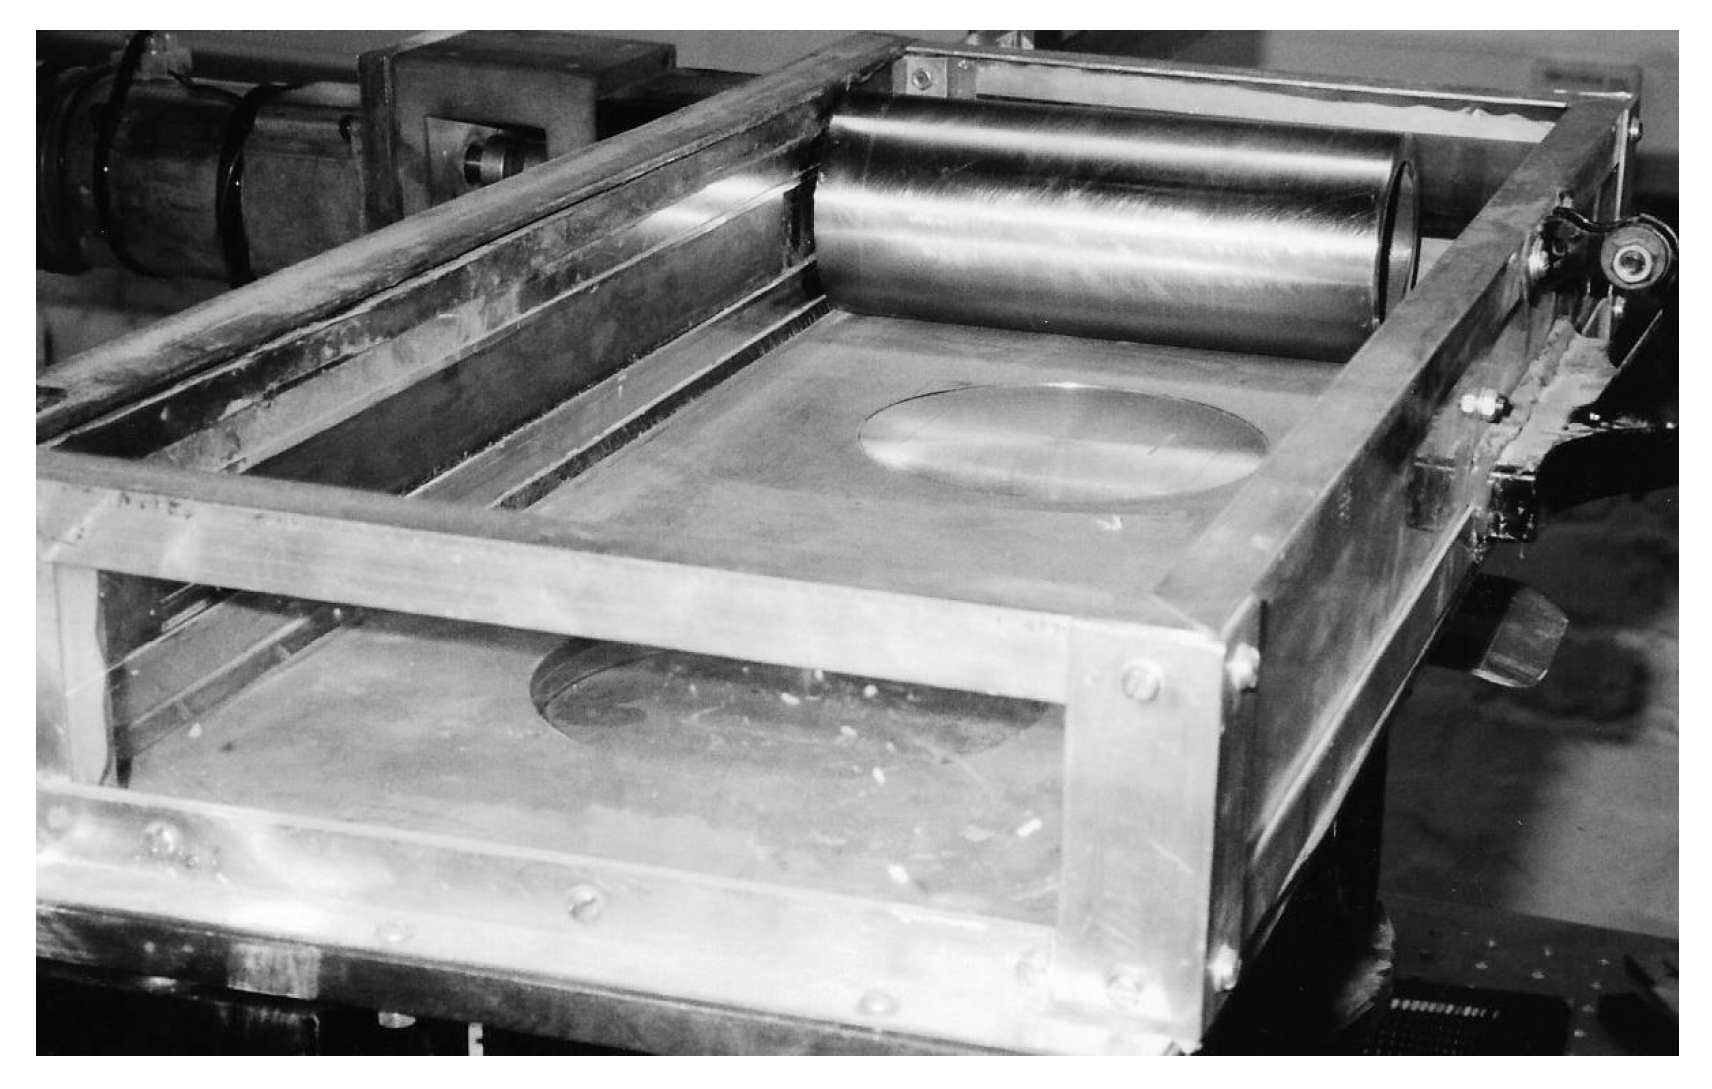
The bonding materials were then handled as powders loaded manually in the build chamber to ensure direct photonic interactions between laser beam and powder bed as a single layer presented on a planar surface (Figure 6). The raw materials were exposed to the photonic beam, which projected itself as a spot of various sizes (100, 200, and 300 µm) scanned across the powder bed at various speeds—typically 50, 250, and 500 mm/s.
The following observations were made for each material after a thin layer was exposed to the laser beam at various spot sizes and laser scan velocities:
(i) Ball clay (BC)—for a 100 µm spot size and 50 mm/s scan velocity, there was no interaction between laser and ball clay up to 9.8 A lamp current, beyond 9.8 A and at a frequency of 26 kHz, burning of the ball clay occurred. When the scan velocity was increased to 250 mm/s, vaporization began at 18.6 A lamp current between 0 and 60 kHz. Beyond 500 mm/s scan velocity, no interaction was observed between the photonic beam and the ball clay. For 200 µm spot size, slight burning of the ball clay powder occurred at 16.9 A lamp current between 0 and 60 kHz frequency; at larger spot size (~300 µm), no interactions occurred at higher scan velocities, although burning occurred at 50 mm/s scan speed at 16.9 A lamp current between the 0 and 60 kHz frequency range. The topography of the BC powder bed is shown in Figure 3b,c at 500× and 1250× magnifications, respectively.
(ii) Finnish floatation feldspar (FFF)—at 100 µm spot size and 50 mm/s scan velocity, discoloration of the powder occurred up to 10.6 A lamp current between 0 and 60 kHz frequency, after which vaporization occurred. Above 33 kHz frequency, the powder appeared to crystallize. This observation occurred at higher scan velocity until a 20 A lamp current produced complete crystallinity. With large spot sizes, crystalline phases were created at lamp currents >18.6 A. For a 300 µm spot size, FFF crystallinity occurred above 17.8 A lamp current between 0–60 kHz frequency range. For higher scan velocities (>250 mm/s), FFF became white in color. The topography of the FFF powder bed is shown in Figure 4b,c at 500× and 1250× magnifications, respectively.
(iii) Borax frit (BX)—no interactions were observed up to 11.9 A lamp current through the frequency range of 0–60 kHz. Beyond 11.9 A lamp current, slight fusion of the frit occurred at low scan velocities. The topography of the BX powder bed is shown in Figure 5b,c at 500× and 1250× magnifications, respectively.
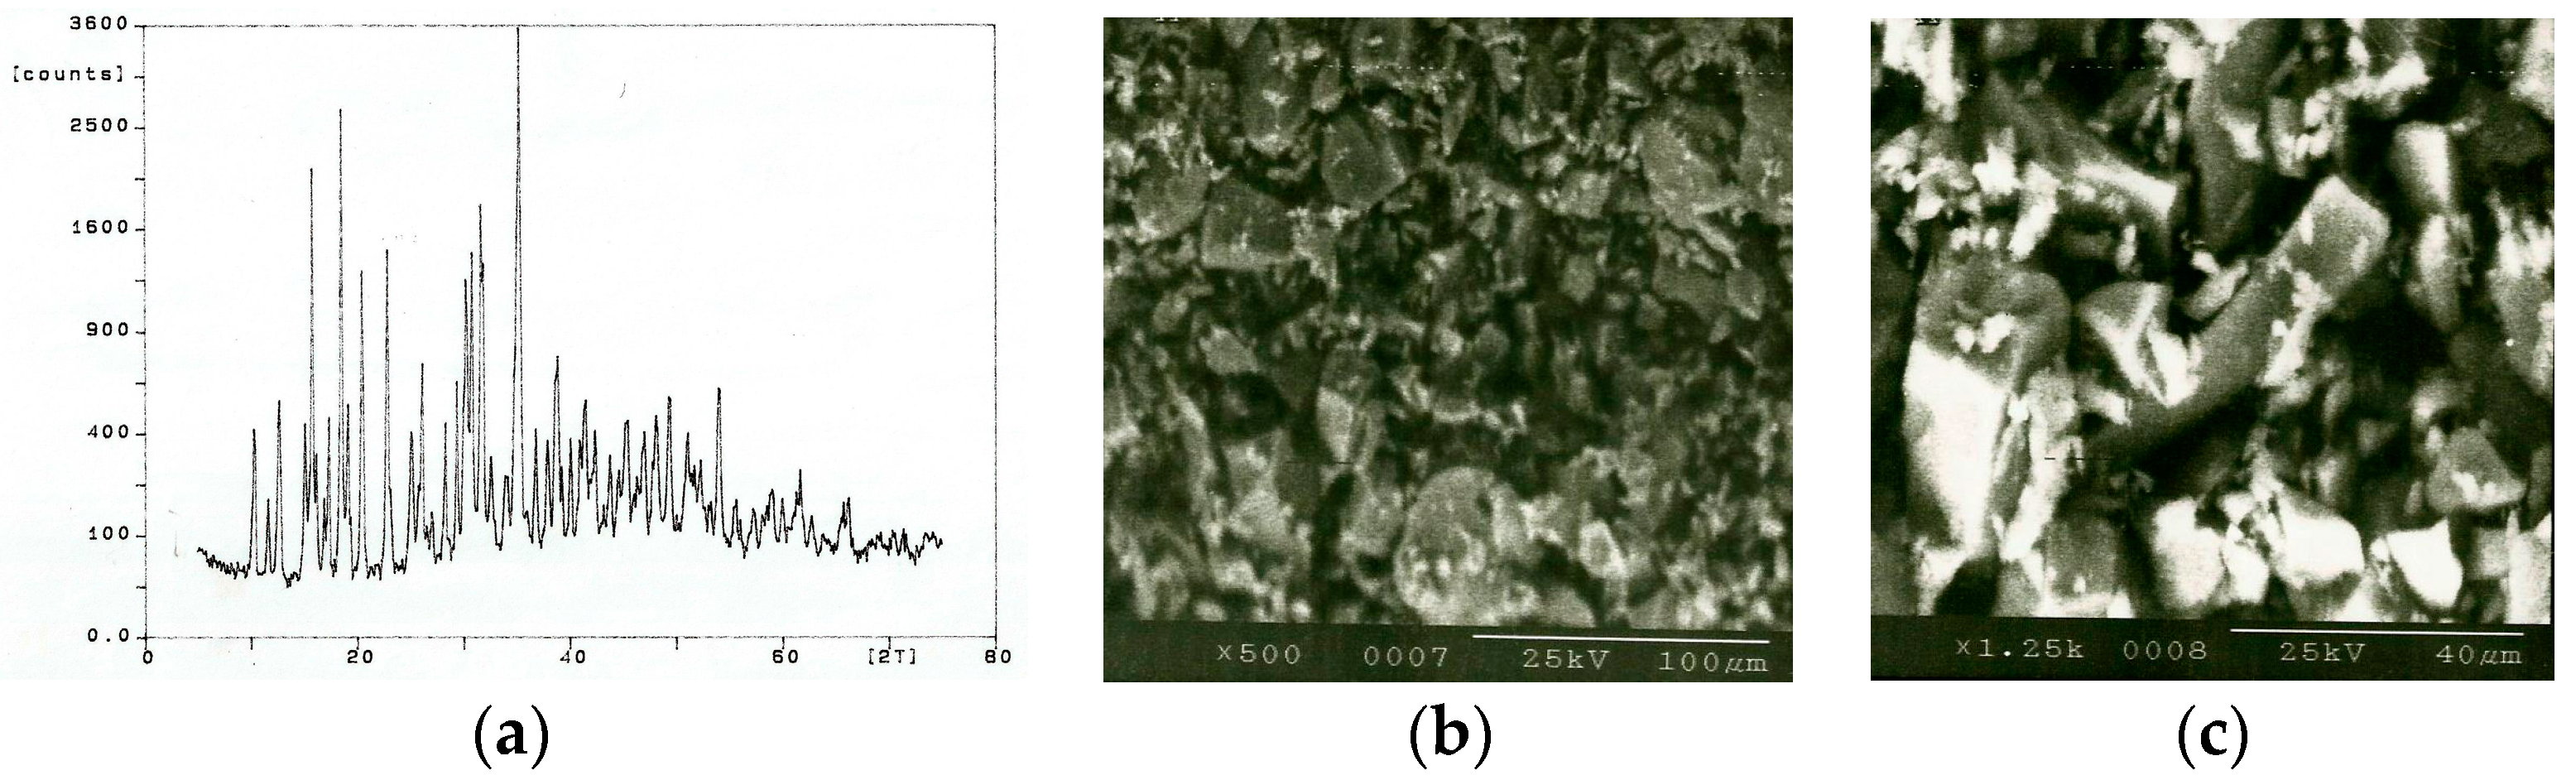
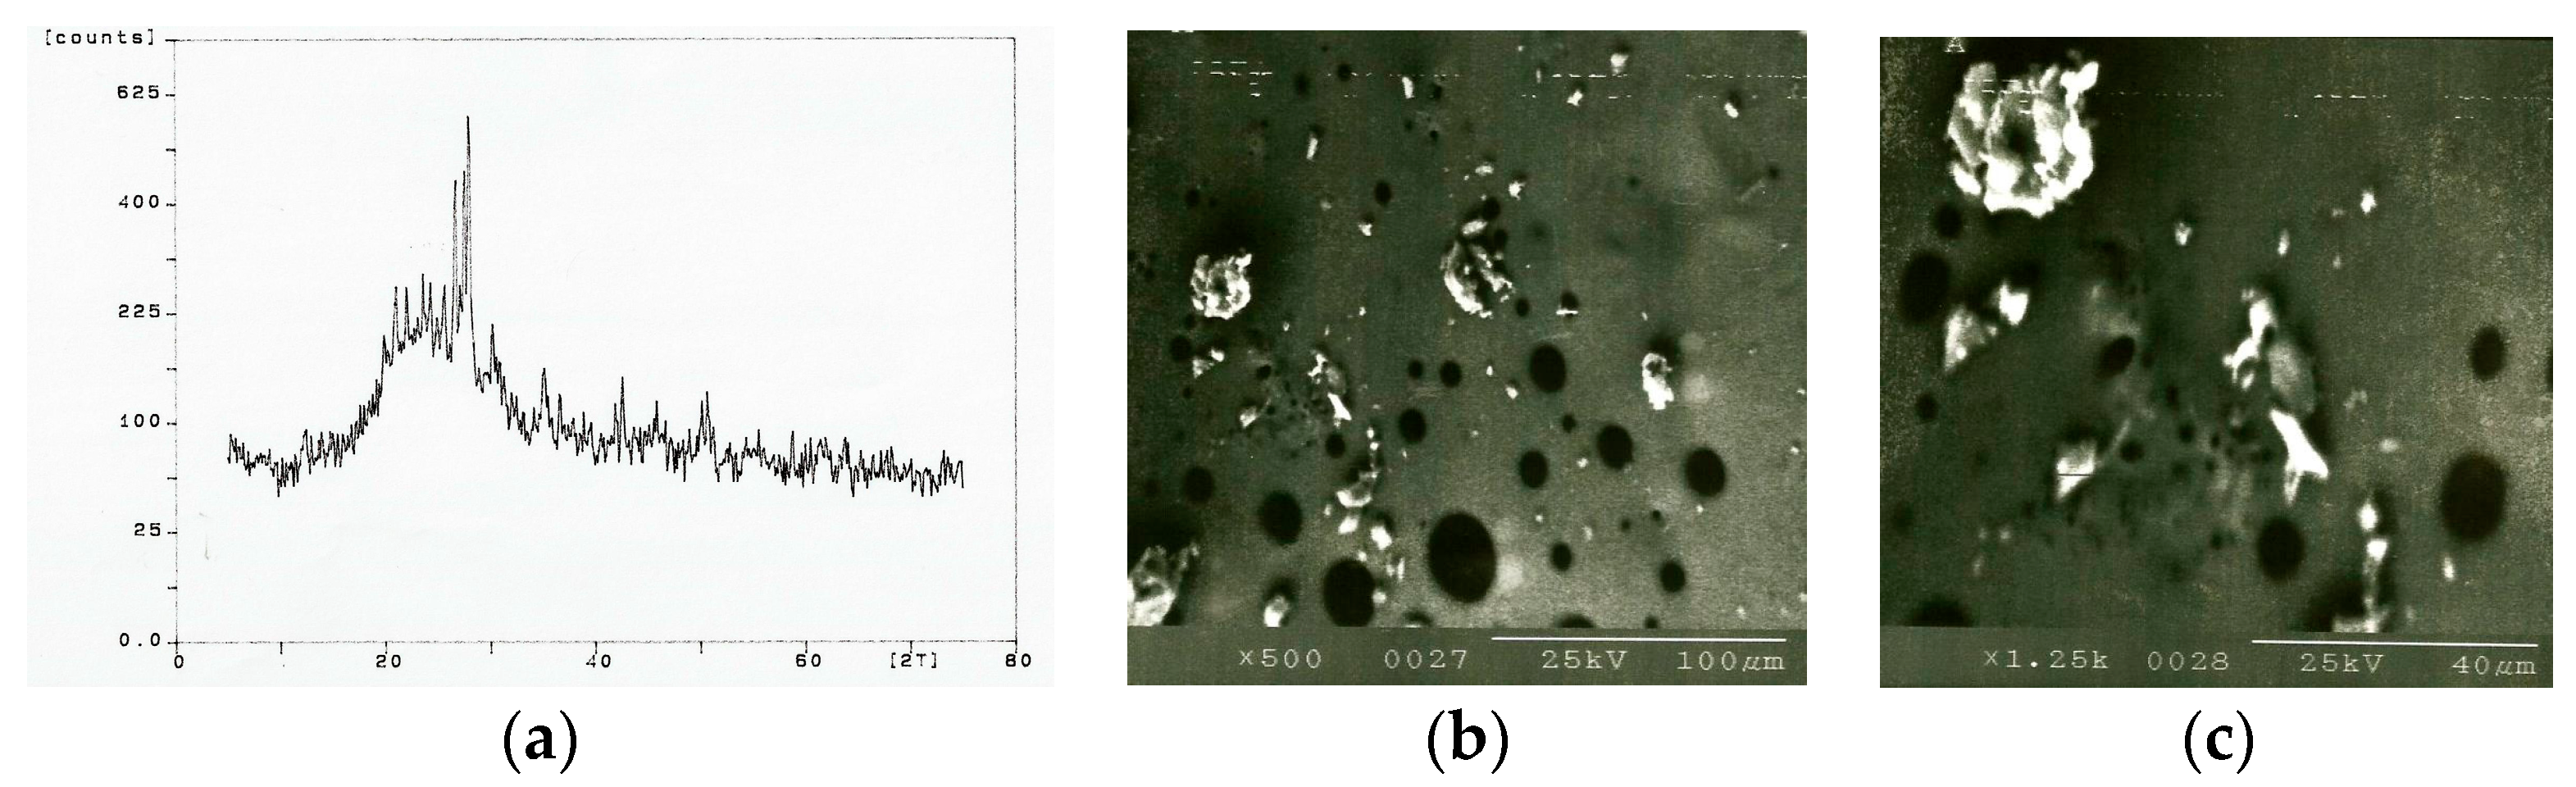
(iv) Sintered bond mix—at 100 µm spot size and 50 mm/s scan velocity, no interactions were observed up to 9.8 A lamp current in the 0–60 kHz frequency range. Between 9.8 and 11.9 A lamp current, vaporization occurred with slight crystallinity observed in the bond mix. At lamp currents beyond 13.8 A, burning of the mix occurred. At higher scan velocities, partial fusion or no interactions occurred. Similar observations were made with large spot sizes, the optimum conditions being lamp currents between 9.8 and 11.9 A in the 0–60 kHz frequency range to produce vaporization of the mix accompanied by slight crystallinity. The topography of the bond mix powder bed is shown in Figure 7b,c at 500× and 1250× magnifications, respectively. The expected equilibrium phases from the directly fused mixture (20 wt. % BC, 20 wt. % FFF, and 60 wt. % BX) are quartz (unreacted and partially dissolved), mullite, cristobalite, and glass. However, from the samples tested, the compounds quartz, mullite, and glass were successfully detected, indicating non-equilibrium formation conditions (Figure 7a). A calibration curve was constructed using a suitable internal standard (CaF2), a diluent, and a synthetic form of the phase(s) to be measured. Synthetic mullite with purity >99.8% and powdered quartz with purity >99.84% SiO2 were used throughout the experiments. The method used for quantitative analysis of ceramic powders was developed by Khandelwal and Cook [13] and refined by Monshi and Messer [14].
The internal standard provides an intense (111) reflection (d = 1.354 Å) lying between the (100) reflection for quartz (d = 4.257 Å) and the (200) reflection for mullite (d = 3.773 Å). Using copper kα radiation (λ = 1.5405 Å), the corresponding values of diffraction angle 2θ are: (100) quartz = 20.82°; (111) calcium fluoride = 28.3°; and (200) mullite = 32.26°. The calibration curve generated by varying proportions of calcium fluoride, synthetic quartz, and mullite is shown in Reference [8]. Mass fractions of the crystalline phases in the mixture can be interpreted from the calibration lines by measuring the intensity ratio of the phase(s) to the internal standard. The diffraction peaks of interest for quantitative analysis lie between 15° and 40° of the diffraction angle 2θ [8]. The reflections are the (111) planes of calcium fluoride, (200) planes of mullite, and the (100) planes of quartz. In order to calculate the mass fractions of quartz and mullite in the mixture, the height of the chosen diffraction peak and its width at half-height were measured from the diffraction spectrum. The product of these two measures were then compared with that of the internal standard, and the resultant intensity ratio was used to find the exact mass fraction of the phase(s) measured in the glass that was subjected to X-ray diffraction [8].
The X-ray spectrum for bond mixture is shown in Figure 7a. The major components detected include quartz (SiO2) showing 2θ angles (plane) [d-value (α1)] of 26.585° (101) [3.3503 Å], 40.25° (111) [2.2388 Å], 54.81° (202) [1.6736 Å], and 67.655° (212) [1.3837 Å], mullite (Al6Si2O13) showing reflections at (110), (200), (001), (111), and (201) planes with corresponding d-values of 5.39, 3.774, 2.886, 2.542, and 2.292 Å, respectively, and a non-crystalline glass phase. The images shown in Figure 7b,c show that the surrounding bond mix has melted, while large clay relicts have remained intact. The bubbles shown are decomposed gases held in the clays that form and escape from their matrix during melting. These gases are typically CO2 and SO2, and are seen in molten glass frits during standard grinding wheel manufacture. The release of gases contained in clays and various pore forming agents occurs at high temperatures (>650 °C). The images shown in Figure 7 and the X-ray spectra of the bond mix subjected to laser beam interactions are not dissimilar to that of a glass frit made using the traditional way of melting where bonding materials are placed in a platinum crucible, heated to the melting temperature, then poured in a cooling furnace for the preparation of fritting prior to use in vitrified grinding wheels.
4. Discussion
The fusing of the raw materials was apparent at low scanning speeds and spot sizes. The powder formed a brittle structure that was full of porosity. The depth of fusion was ~0.5 mm for the bond mix. However, ball clay (BC) scanned separately burned at low scan speeds and spot sizes. At higher levels, no interaction between the photonic beam and the clay occurred. This is advantageous for the preparation of frits for grinding wheels because the clay particles remain intact as the lower melting point material flows around it. It is noted that the melting point of ball clay (BC) is ~1400 °C. Feldspar (FFF) particles behaved a little differently. Slight melting occurred at the edges of the feldspar particles at low scan speeds and spot sizes (FFF melting point is ~1200 °C). Although some melting is encouraged for feldspar, complete melting is not required in the bond mix because a large size grinding wheel may collapse under its own weight when fired due to the melting of too many bond components at the same temperature. The most surprising of all the raw materials was the behavior of borax frit (BX) during photonic interactions. The melting point of borax frit is ~742 °C, so one should have anticipated melting during the photonic interactions. However, direct interaction with BX frit tends to indicate that the photon beam is reflected by the thin powder layer of the BX frit. When mixed with the BC and FFF, BX frit appears to melt and form a highly non-crystalline structure that is shown in the X-ray spectrum shown in Figure 7a. This tends to indicate that the heat absorbed by BC and FFF by exposure to the photonic beam may be responsible for heating and causing BX to melt when presented as a mixture to the laser beam. This presents a very interesting situation in terms of providing raw materials for vitrified grinding wheels, because materials that reflect optical energy may be blended with materials that absorb energy in order to provide homogeneous melting of the bond mixture that bonds to abrasive grains. This implies that abrasive grains may not require heating during grinding wheel manufacture that uses lasers, thus preserving the initial strength and mechanical characteristics of abrasive grains that are normally impaired due to long periods of traditional thermal treatment in kilns.
Future research may therefore lead to the development of grinding wheels whose abrasive grains maintain their original properties due to the absence of thermal degradation caused by the use of focused photonic energy to selectively heat parts of the grinding wheel during manufacture. The avoidance of using clays altogether may be possible for small grinding wheels, because clays may be replaced by oxides whose composition may be tailored to suit the particular grinding application. However, the fusibility of oxides must be examined to ensure that photonic interactions can truly achieve the production of glass frits without the use of clays. It is expected that experiments described in this paper will lead to the development of new inventions associated with the production of glass bonding systems and new innovations in the way that direct photonic fusion can be used in the manufacture of vitrified grinding wheels. New inventions will be focused on producing vitrified grinding wheels that vitrify in a shorter amount of time using much less energy than current methods. The current work has shown that not only is direct photonic fusion of vitrified bond materials possible, but when applied to grinding wheel manufacture, the process may preserve the fracture characteristics of virgin abrasive grains without the deleterious effects of thermal degradation caused by traditional methods of grinding wheel manufacture.
Acknowledgments
The authors thank Paul Dando of Saint-Gobain Abrasives for supplying the raw materials and John Curran for training Martin Toward to use the laser sintering apparatus and its construction. The authors also thank Professor Bernard Hon for allowing the authors to conduct the work at the Product Innovation Development Center, University of Liverpool. The authors thank the Engineering and Physical Science Research Council for funding this work under grant number GR/N06731/01.
Author Contributions
Mark J. Jackson and Martin J. Toward conceived and designed the experiments; Martin J. Toward performed the experiments; Mark J. Jackson and Martin J. Toward analyzed the data; and Mark J. Jackson wrote the paper.
Conflicts of Interest
The authors declare no conflict of interest.
References
- Jackson, M.J.; Hitchiner, M.P. Vitrified Bonding Systems and Heat Treatment. In High Performance Grinding Advanced Cutting Tool; Springer Nature: New York, NY, USA, 2013; pp. 45–94. [Google Scholar]
- Graf, W. Overview of Abrasives. In Handbook of Creep-Feed and Surface Grinding; Winterthur Schlieftechnik AG: Winterthur, Switzerland, 2010; p. 21. [Google Scholar]
- Jackson, M.J.; Mills, B. Interfacial bonding between corundum and glass. J. Mater. Sci. Lett. 2000, 19, 915–917. [Google Scholar] [CrossRef]
- Jackson, M.J. Studies on refractory bonding systems used in vitrified silicon carbide grinding wheels. Proc. Inst. Mech. Eng. 2000, 214, 211–221. [Google Scholar] [CrossRef]
- Jackson, M.J.; Mills, B. Vitrification heat treatment and the dissolution of quartz in grinding wheel bonding systems. J. Inst. Mater. Miner. Min. 2001, 100, 1–8. [Google Scholar] [CrossRef]
- Jackson, M.J.; Wakefield, R.T.; Jones, S.A.; Mills, B.; Rowe, W.B. Materials selection applied to vitrified corundum grinding wheels. J. Inst. Mater. Miner. Min. 2001, 100, 229–236. [Google Scholar]
- Jackson, M.J.; Mills, B. Microscale wear of vitrified abrasive materials. J. Mater. Sci. 2004, 39, 2131–2143. [Google Scholar] [CrossRef]
- Jackson, M.J. Tribological design of grinding wheels using X-ray diffraction techniques. Proc. Inst. Mech. Eng. 2006, 220, 1–17. [Google Scholar] [CrossRef]
- Jackson, M.J. Sintering and vitrification heat treatment of cBN grinding wheels. J. Mater. Proc. Technol. 2007, 191, 232–234. [Google Scholar] [CrossRef]
- Jackson, M.J. An historical review of wear mechanisms and the structure of vitrified grinding wheels. Int. J. Nanomanuf. 2009, 3, 368–397. [Google Scholar] [CrossRef]
- Steen, W.M. Chapter 1—Background and General Applications. In Laser Materials Processing, 2nd ed.; Springer: Berlin, Germany, 1998; pp. 11–57. [Google Scholar]
- Alexander, L.; Klug, H.P. Basic aspects of X-ray absorption. Anal. Chem. 1948, 20, 886–889. [Google Scholar] [CrossRef]
- Khandelwal, S.K.; Cook, R.L. Effect of alumina additions on crystalline constituents and fired properties of electrical porcelain. Am. Ceram. Soc. Bull. 1970, 49, 522–526. [Google Scholar]
- Monshi, A.; Messer, P.F. Ratio of slopes method for quantitative X-ray diffraction analysis. J. Mater. Sci. 1991, 26, 3623–3627. [Google Scholar] [CrossRef]
Figure 1.
Laser power as a function of pulse frequency and lamp current for the Rofin Sinar 90 W flash-lamp, pumped, Q-switched yttrium aluminum garnet (Nd:YAG) laser.
Figure 1.
Laser power as a function of pulse frequency and lamp current for the Rofin Sinar 90 W flash-lamp, pumped, Q-switched yttrium aluminum garnet (Nd:YAG) laser.
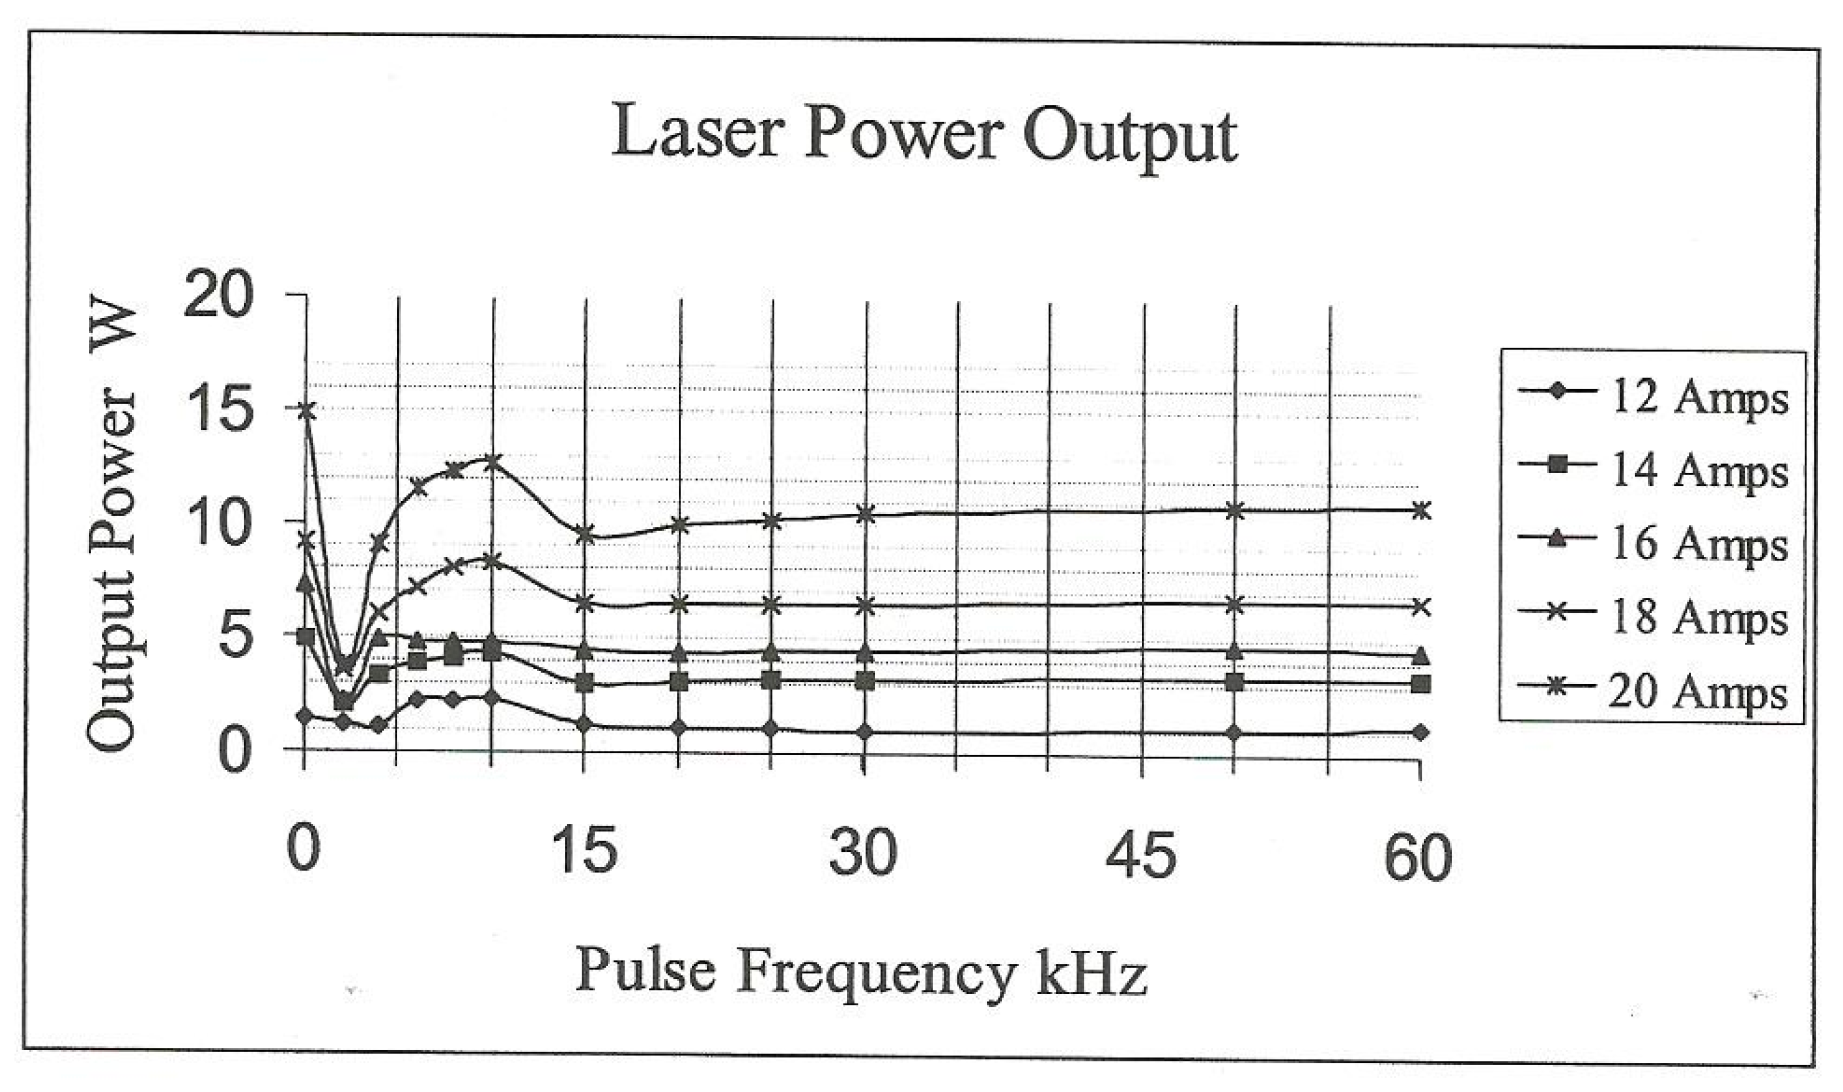
Figure 2.
(a) Photonic sintering apparatus showing Q-switched Nd-YAG laser plus lens and scanning head galvanometer mounted directly above the build chamber; and (b) Schematic layout of laser–material interaction design-of-experiments showing magnitude of lamp current versus beam pulse frequency. Arrow indicates the first, or initial, location of interaction experiments.

Figure 3.
Ball clay (BC) material sample: (a) X-ray diffraction pattern for 2θ angles showing arbitrary counts (counts) versus 2θ angles (2T) in degrees; (b) Scanning electron micrograph at 500× magnification; and (c) Scanning electron micrograph at 1250× magnification.
Figure 3.
Ball clay (BC) material sample: (a) X-ray diffraction pattern for 2θ angles showing arbitrary counts (counts) versus 2θ angles (2T) in degrees; (b) Scanning electron micrograph at 500× magnification; and (c) Scanning electron micrograph at 1250× magnification.
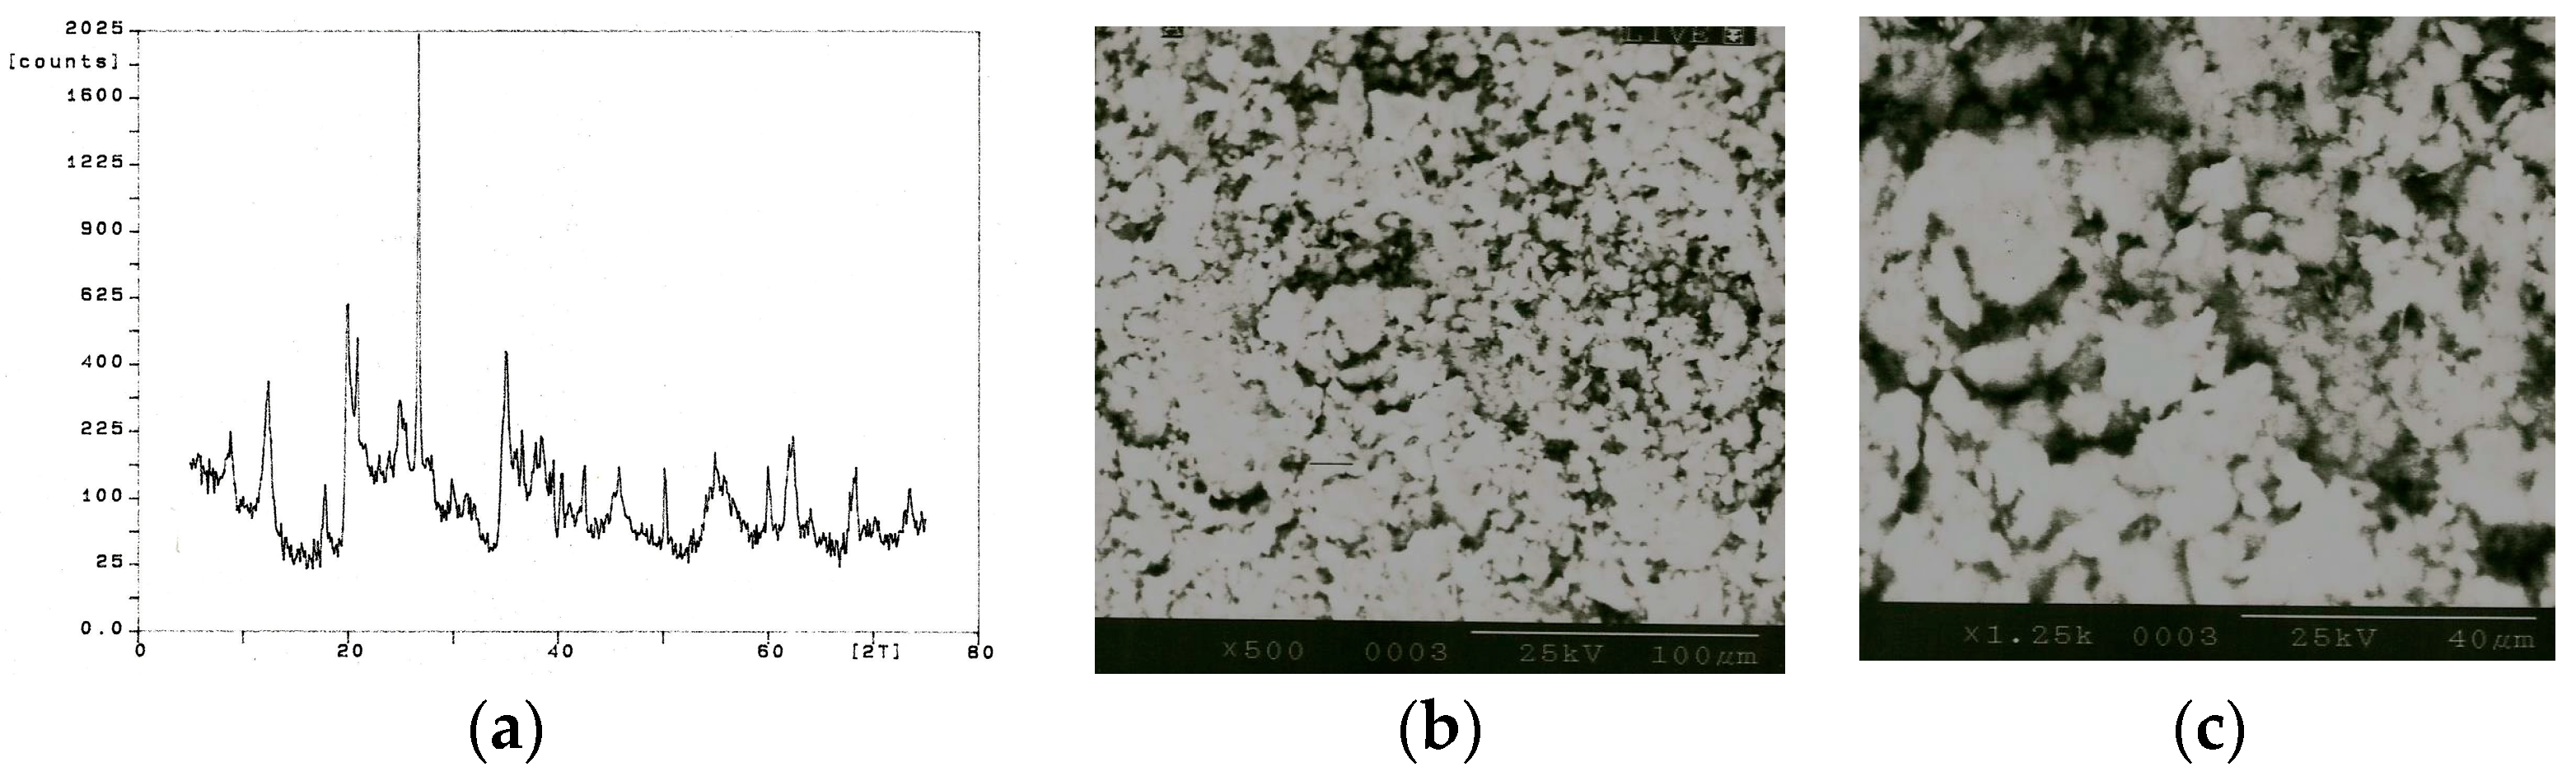
Figure 4.
Finnish flotation feldspar (FFF) material sample: (a) X-ray diffraction pattern for 2θ angles showing arbitrary counts (counts) versus 2θ angles (2T) in degrees; (b) Scanning electron micrograph at 500× magnification; and (c) Scanning electron micrograph at 1250× magnification.
Figure 4.
Finnish flotation feldspar (FFF) material sample: (a) X-ray diffraction pattern for 2θ angles showing arbitrary counts (counts) versus 2θ angles (2T) in degrees; (b) Scanning electron micrograph at 500× magnification; and (c) Scanning electron micrograph at 1250× magnification.

Figure 5.
Borax frit (BX) material sample: (a) X-ray diffraction pattern for 2θ angles showing arbitrary counts (counts) versus 2θ angles (2T) in degrees; (b) Scanning electron micrograph at 500× magnification; and (c) Scanning electron micrograph at 1250× magnification.
Figure 5.
Borax frit (BX) material sample: (a) X-ray diffraction pattern for 2θ angles showing arbitrary counts (counts) versus 2θ angles (2T) in degrees; (b) Scanning electron micrograph at 500× magnification; and (c) Scanning electron micrograph at 1250× magnification.

Figure 6.
The build chamber showing a thin layer of powder presented as a single layer on a planar surface prior to direct photonic interaction.
Figure 6.
The build chamber showing a thin layer of powder presented as a single layer on a planar surface prior to direct photonic interaction.

Figure 7.
Sintered bond mix (20 wt. % BC, 20 wt. % FFF, and 60 wt. % BX) material sample: (a) X-ray diffraction pattern for 2θ angles showing arbitrary counts (counts) versus 2θ angles (2T) in degrees; (b) Scanning electron micrograph at 500× magnification; and (c) scanning electron image at 1250× magnification.
© 2017 by the authors. Licensee MDPI, Basel, Switzerland. This article is an open access article distributed under the terms and conditions of the Creative Commons Attribution (CC BY) license (http://creativecommons.org/licenses/by/4.0/).
Share and Cite
MDPI and ACS Style
Jackson, M.J.; Toward, M.J. Direct Photonic Fusion of Vitrified Bonding Materials. Inventions 2017, 2, 19. https://doi.org/10.3390/inventions2030019
AMA Style
Jackson MJ, Toward MJ. Direct Photonic Fusion of Vitrified Bonding Materials. Inventions. 2017; 2(3):19. https://doi.org/10.3390/inventions2030019
Chicago/Turabian StyleJackson, Mark J., and Martin J. Toward. 2017. "Direct Photonic Fusion of Vitrified Bonding Materials" Inventions 2, no. 3: 19. https://doi.org/10.3390/inventions2030019