
Practical Improvement Scenarios for an Innovative Waste-Collection Recycling Program Operating with Mobile Green Points (MGPs)


Abstract
:1. Introduction
1.1. General
1.2. Climate Change
1.3. Natural-Resource Protection or Preservation and Integrated Waste Management
1.4. Rising Commodity and Product Prices
1.5. THE GREEN CITY Recycling Program
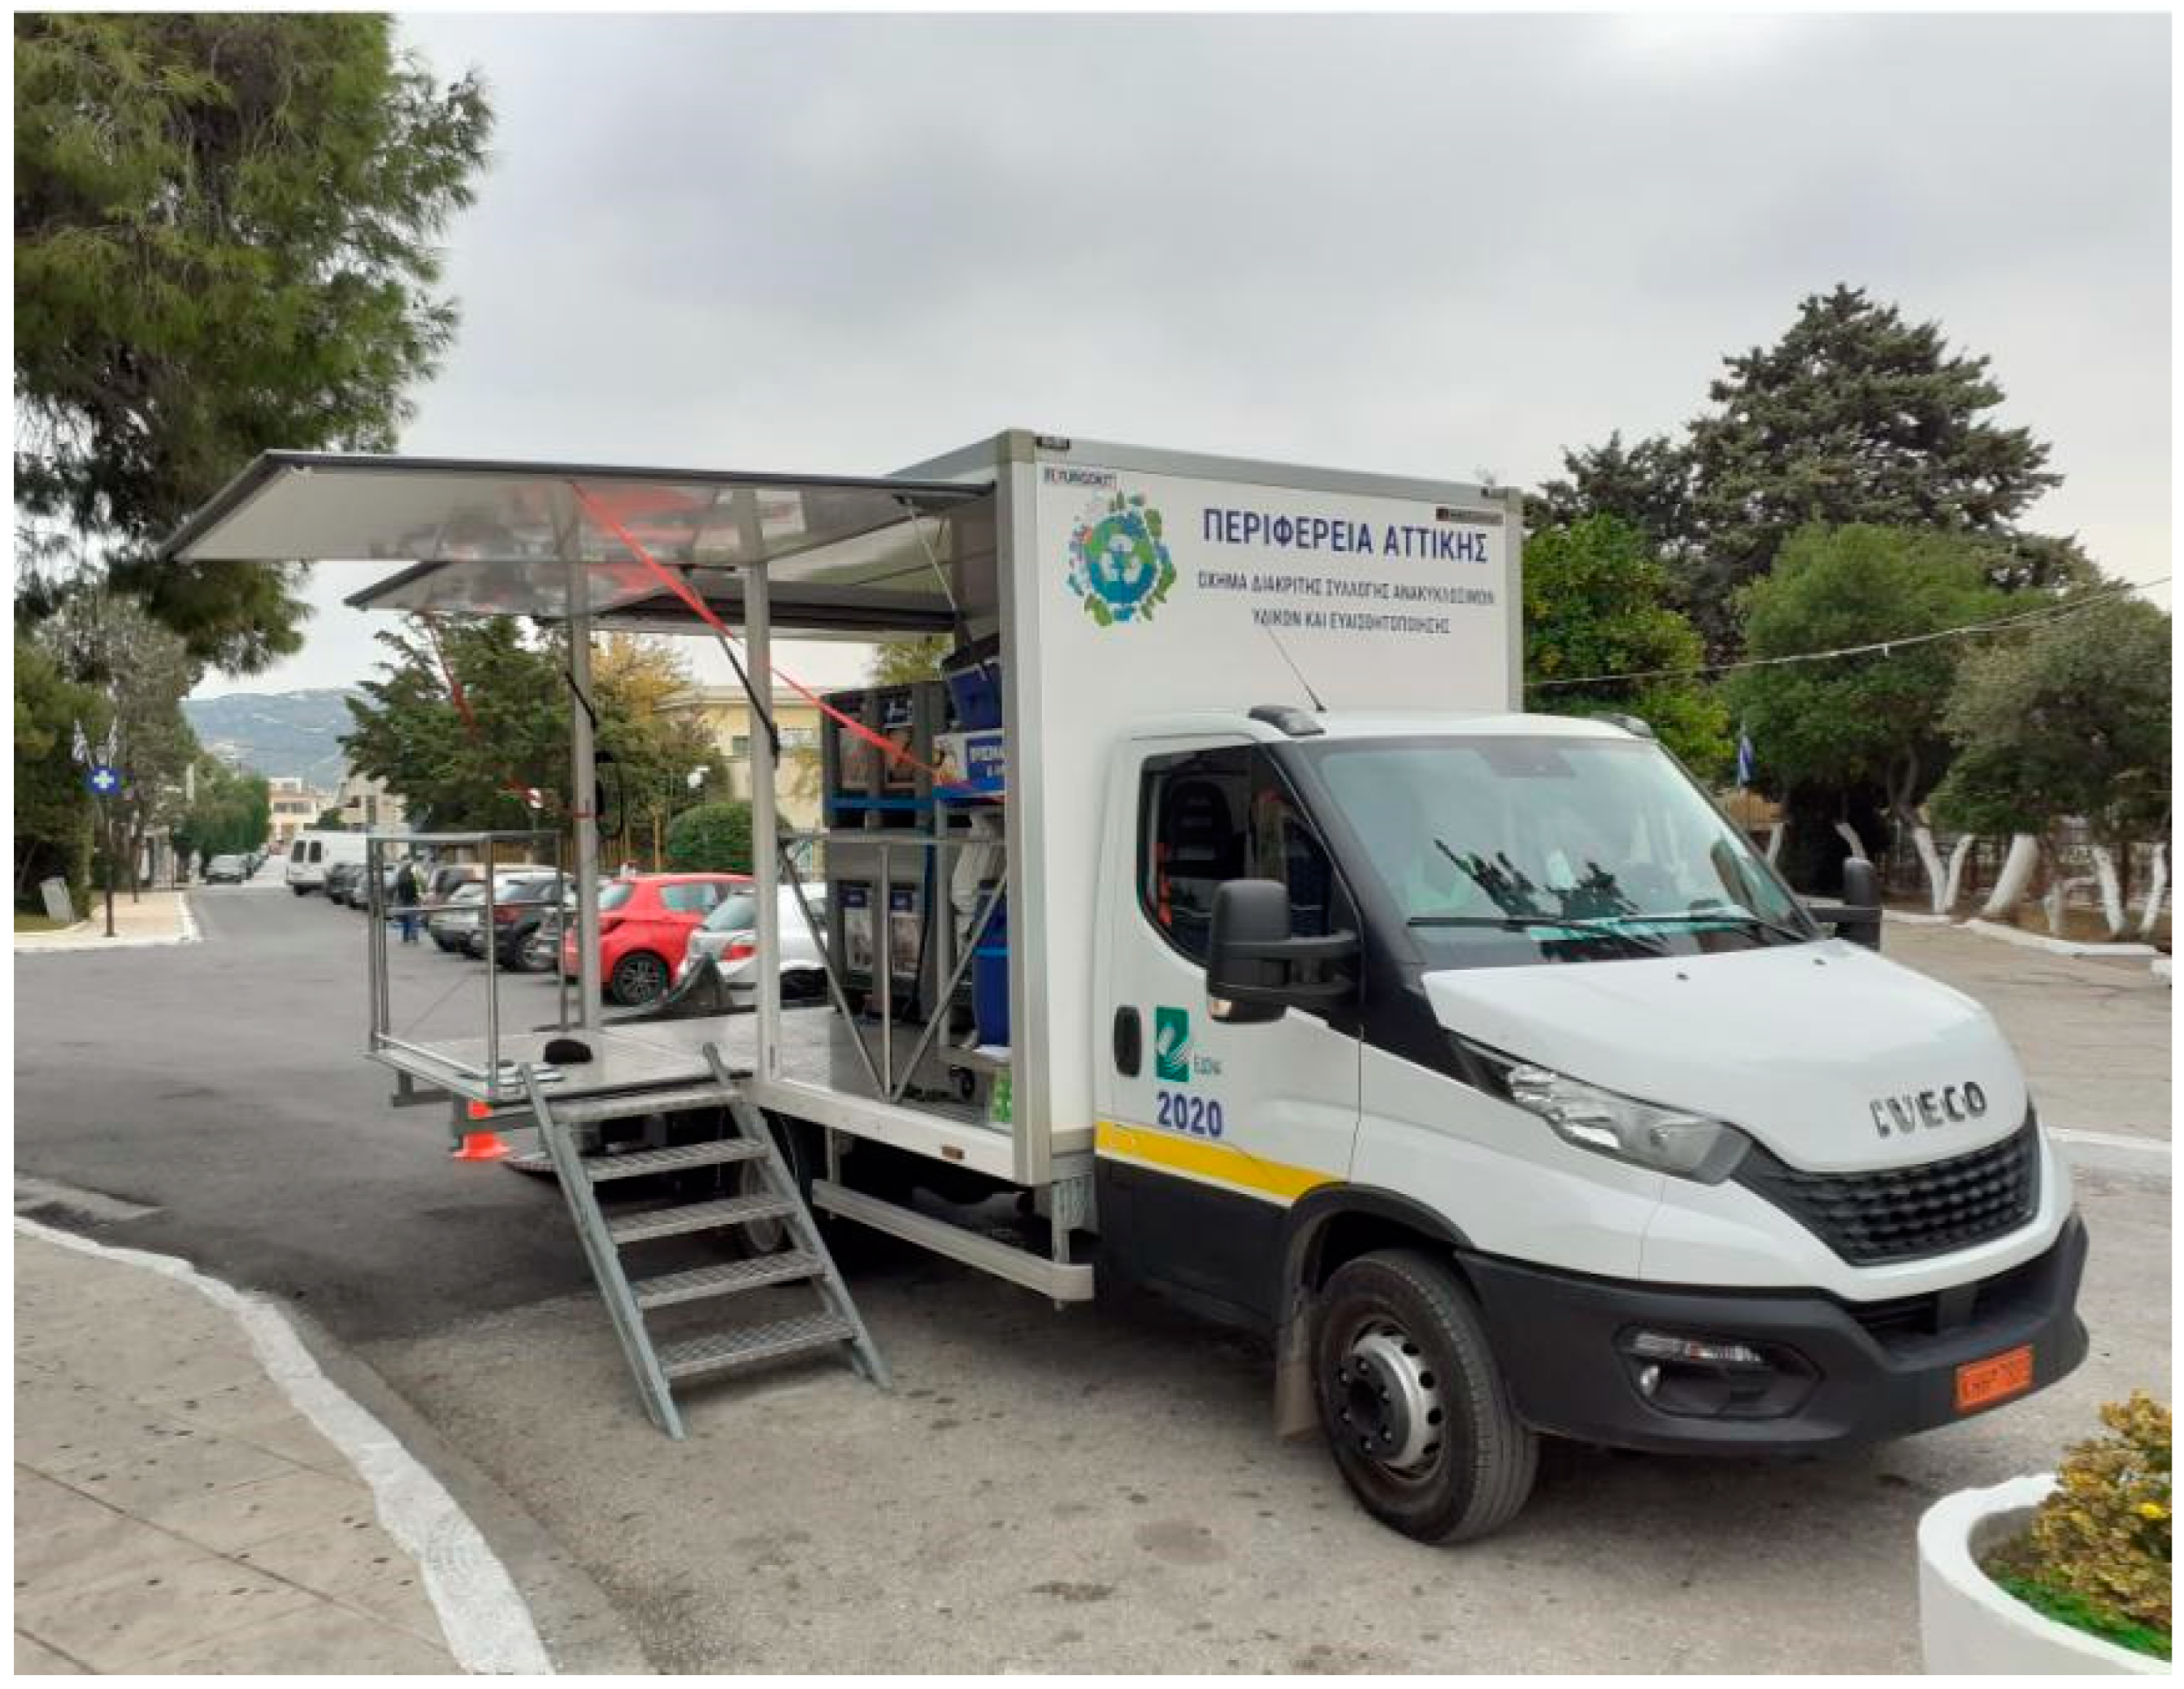
1.5.1. General Description
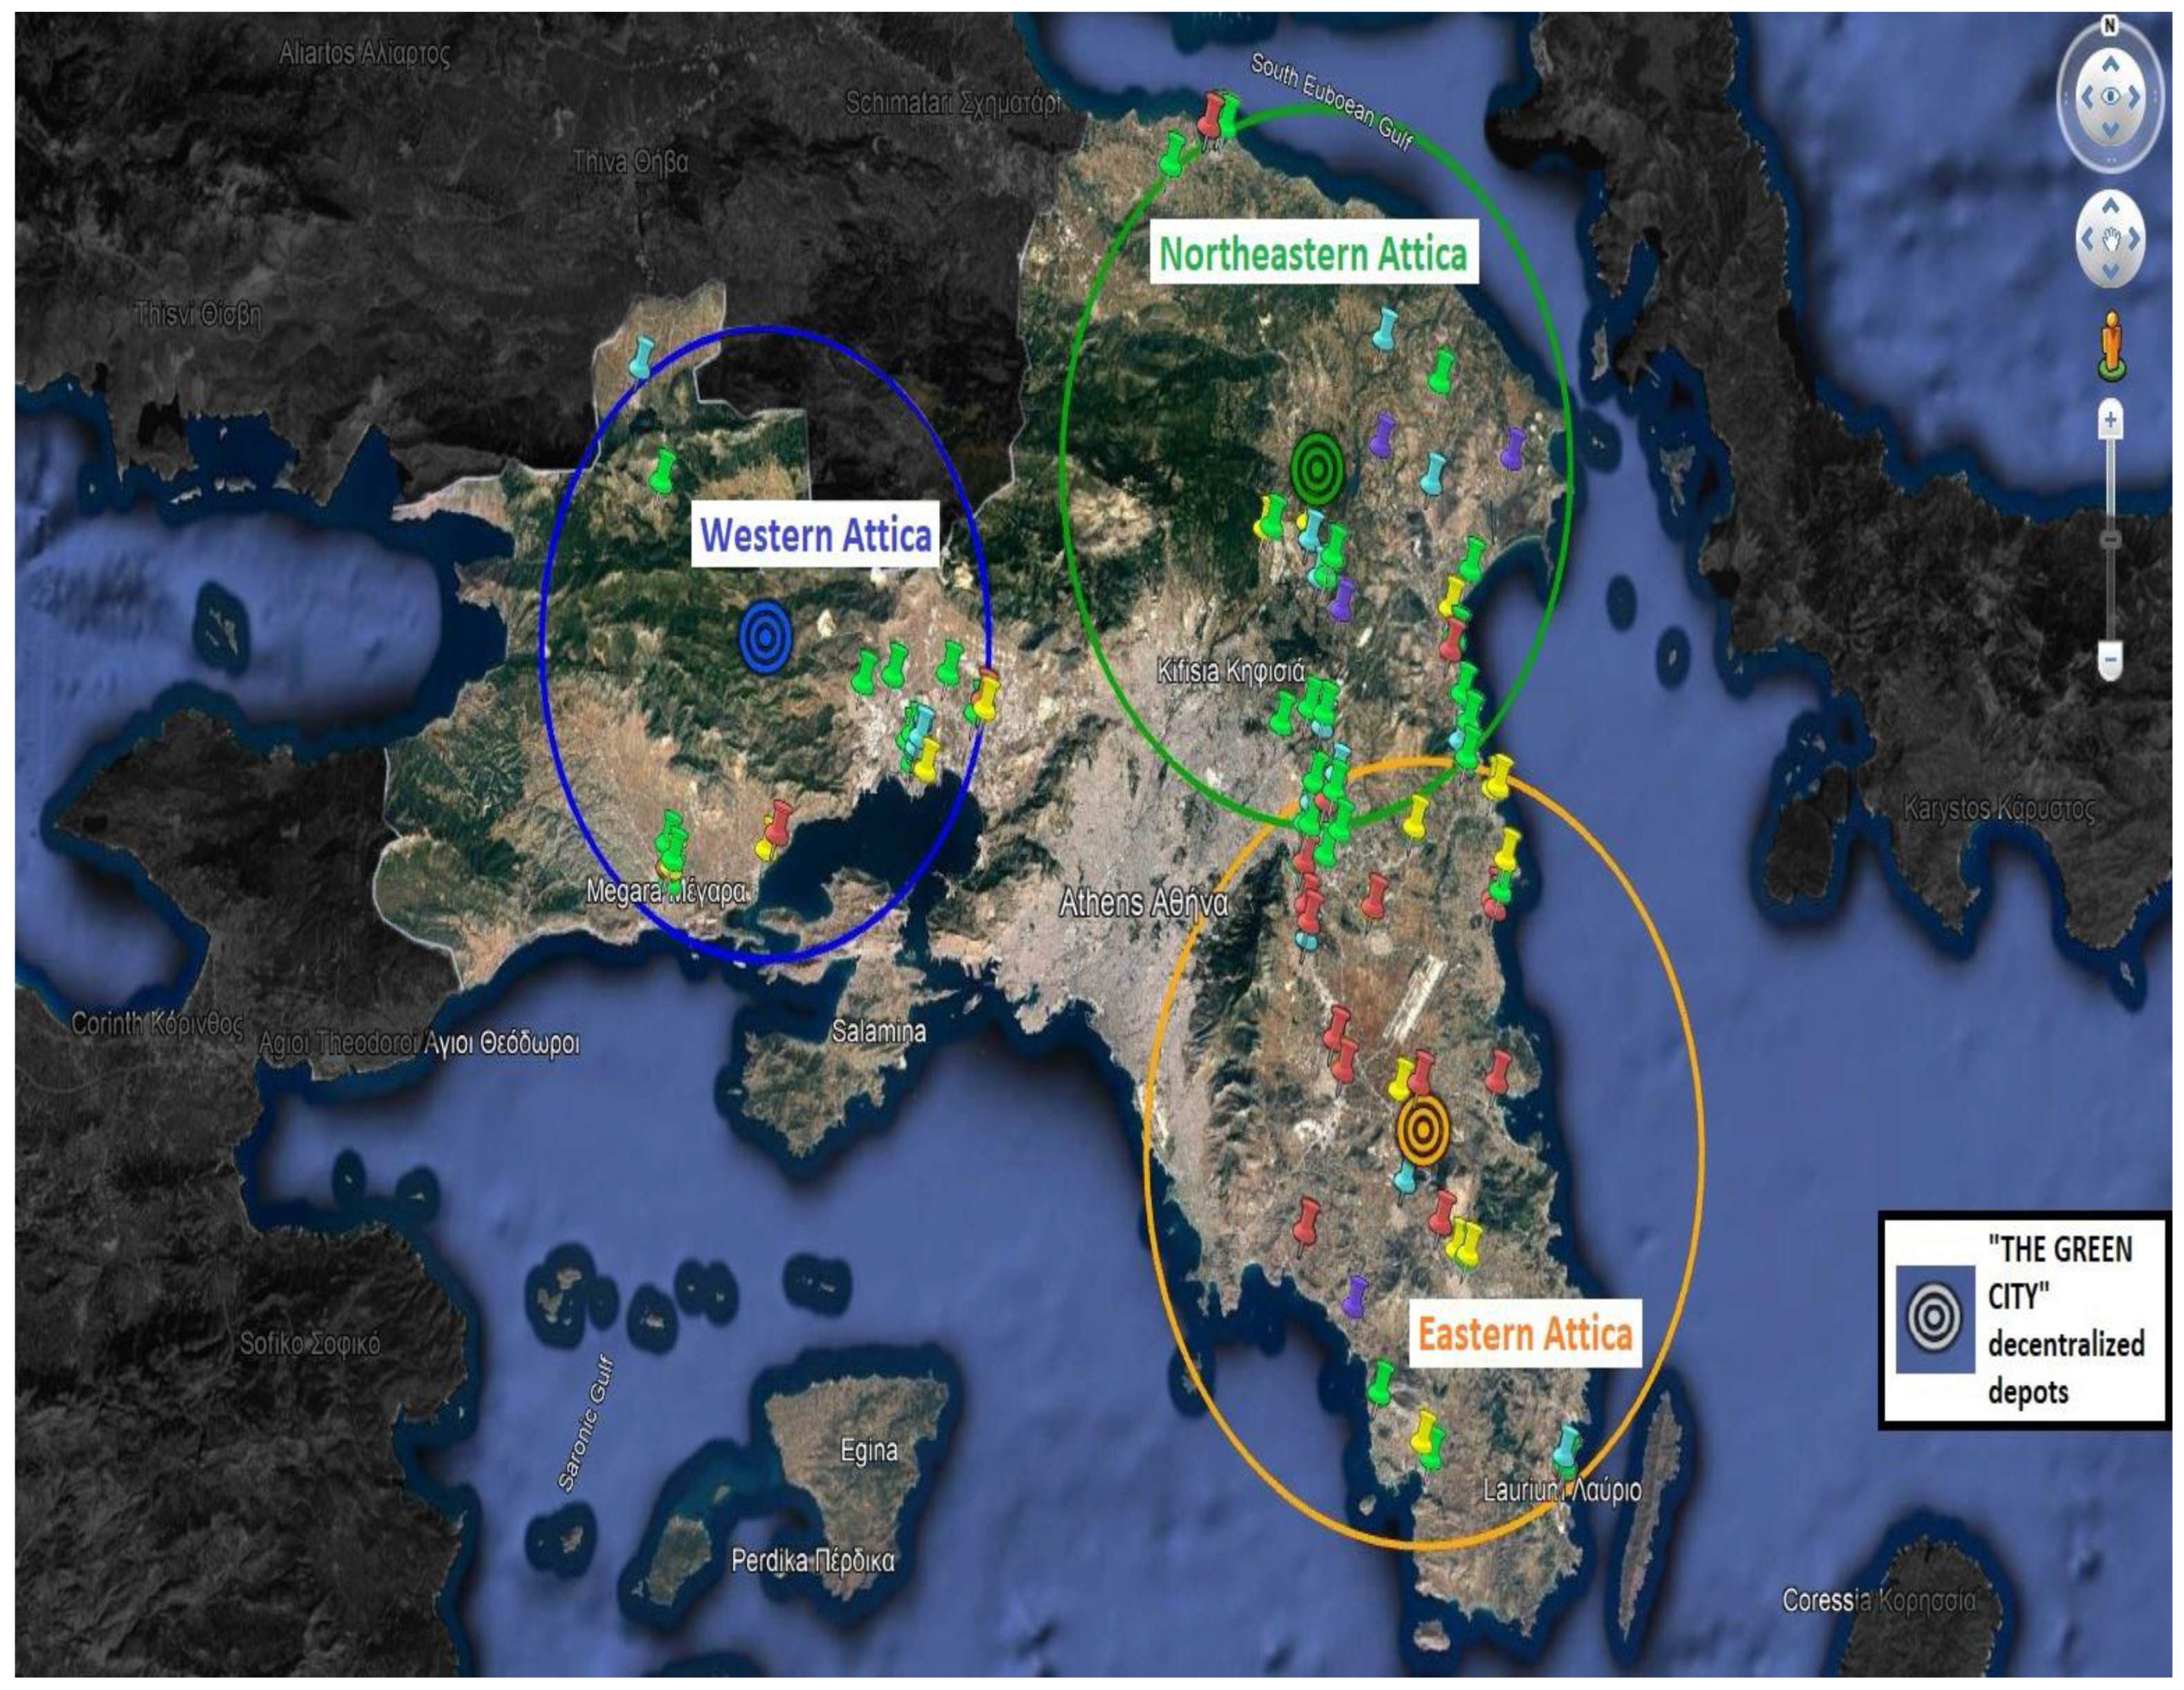
1.5.2. THE GREEN CITY Routes
2. Materials and Methods
2.1. Methodology of Calculating Remote-Route Distances
2.2. Improvement Scenarios for THE GREEN CITY Recycling Program

2.2.1. First Improvement Scenario with Main Depot Decentralization

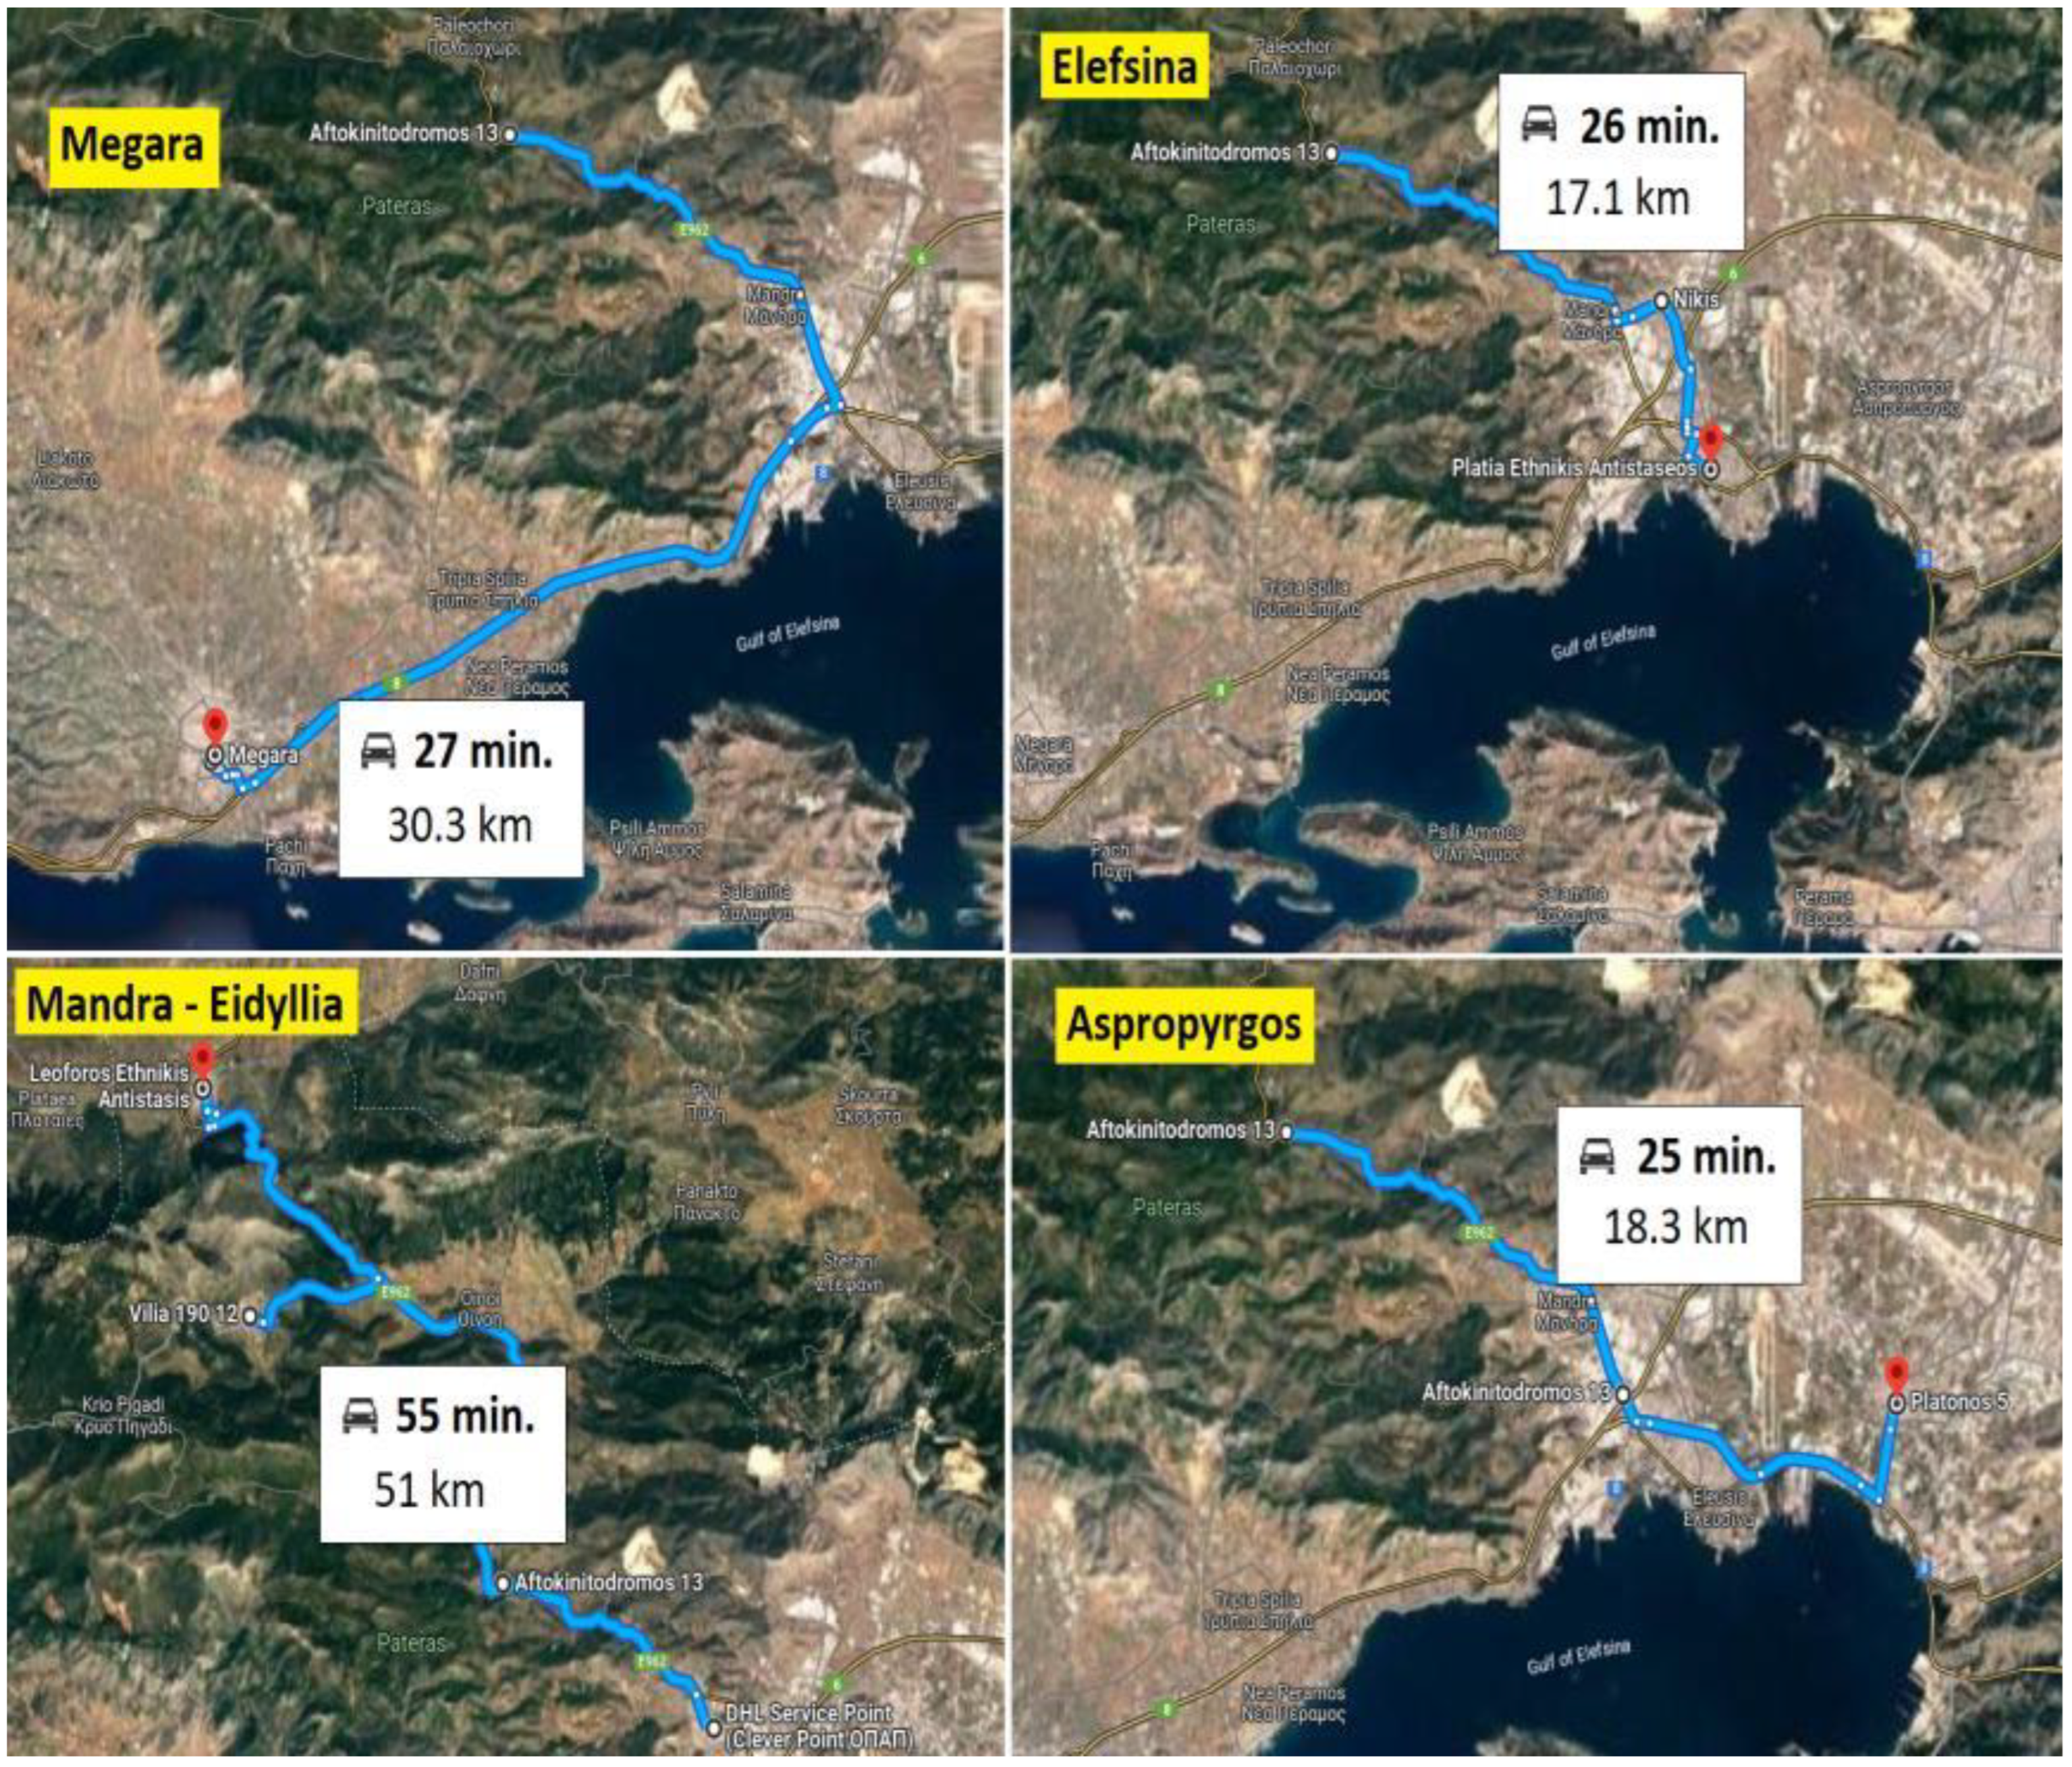
First Improvement Scenario Distances


Fuel Cost for the MGPs in the First Improvement Scenario
CO2 Emissions into the Atmosphere from the MGPs in the First Improvement Scenario
2.2.2. Second Improvement Scenario with Main Depot Decentralization and the Merging of Neighboring Remote Routes
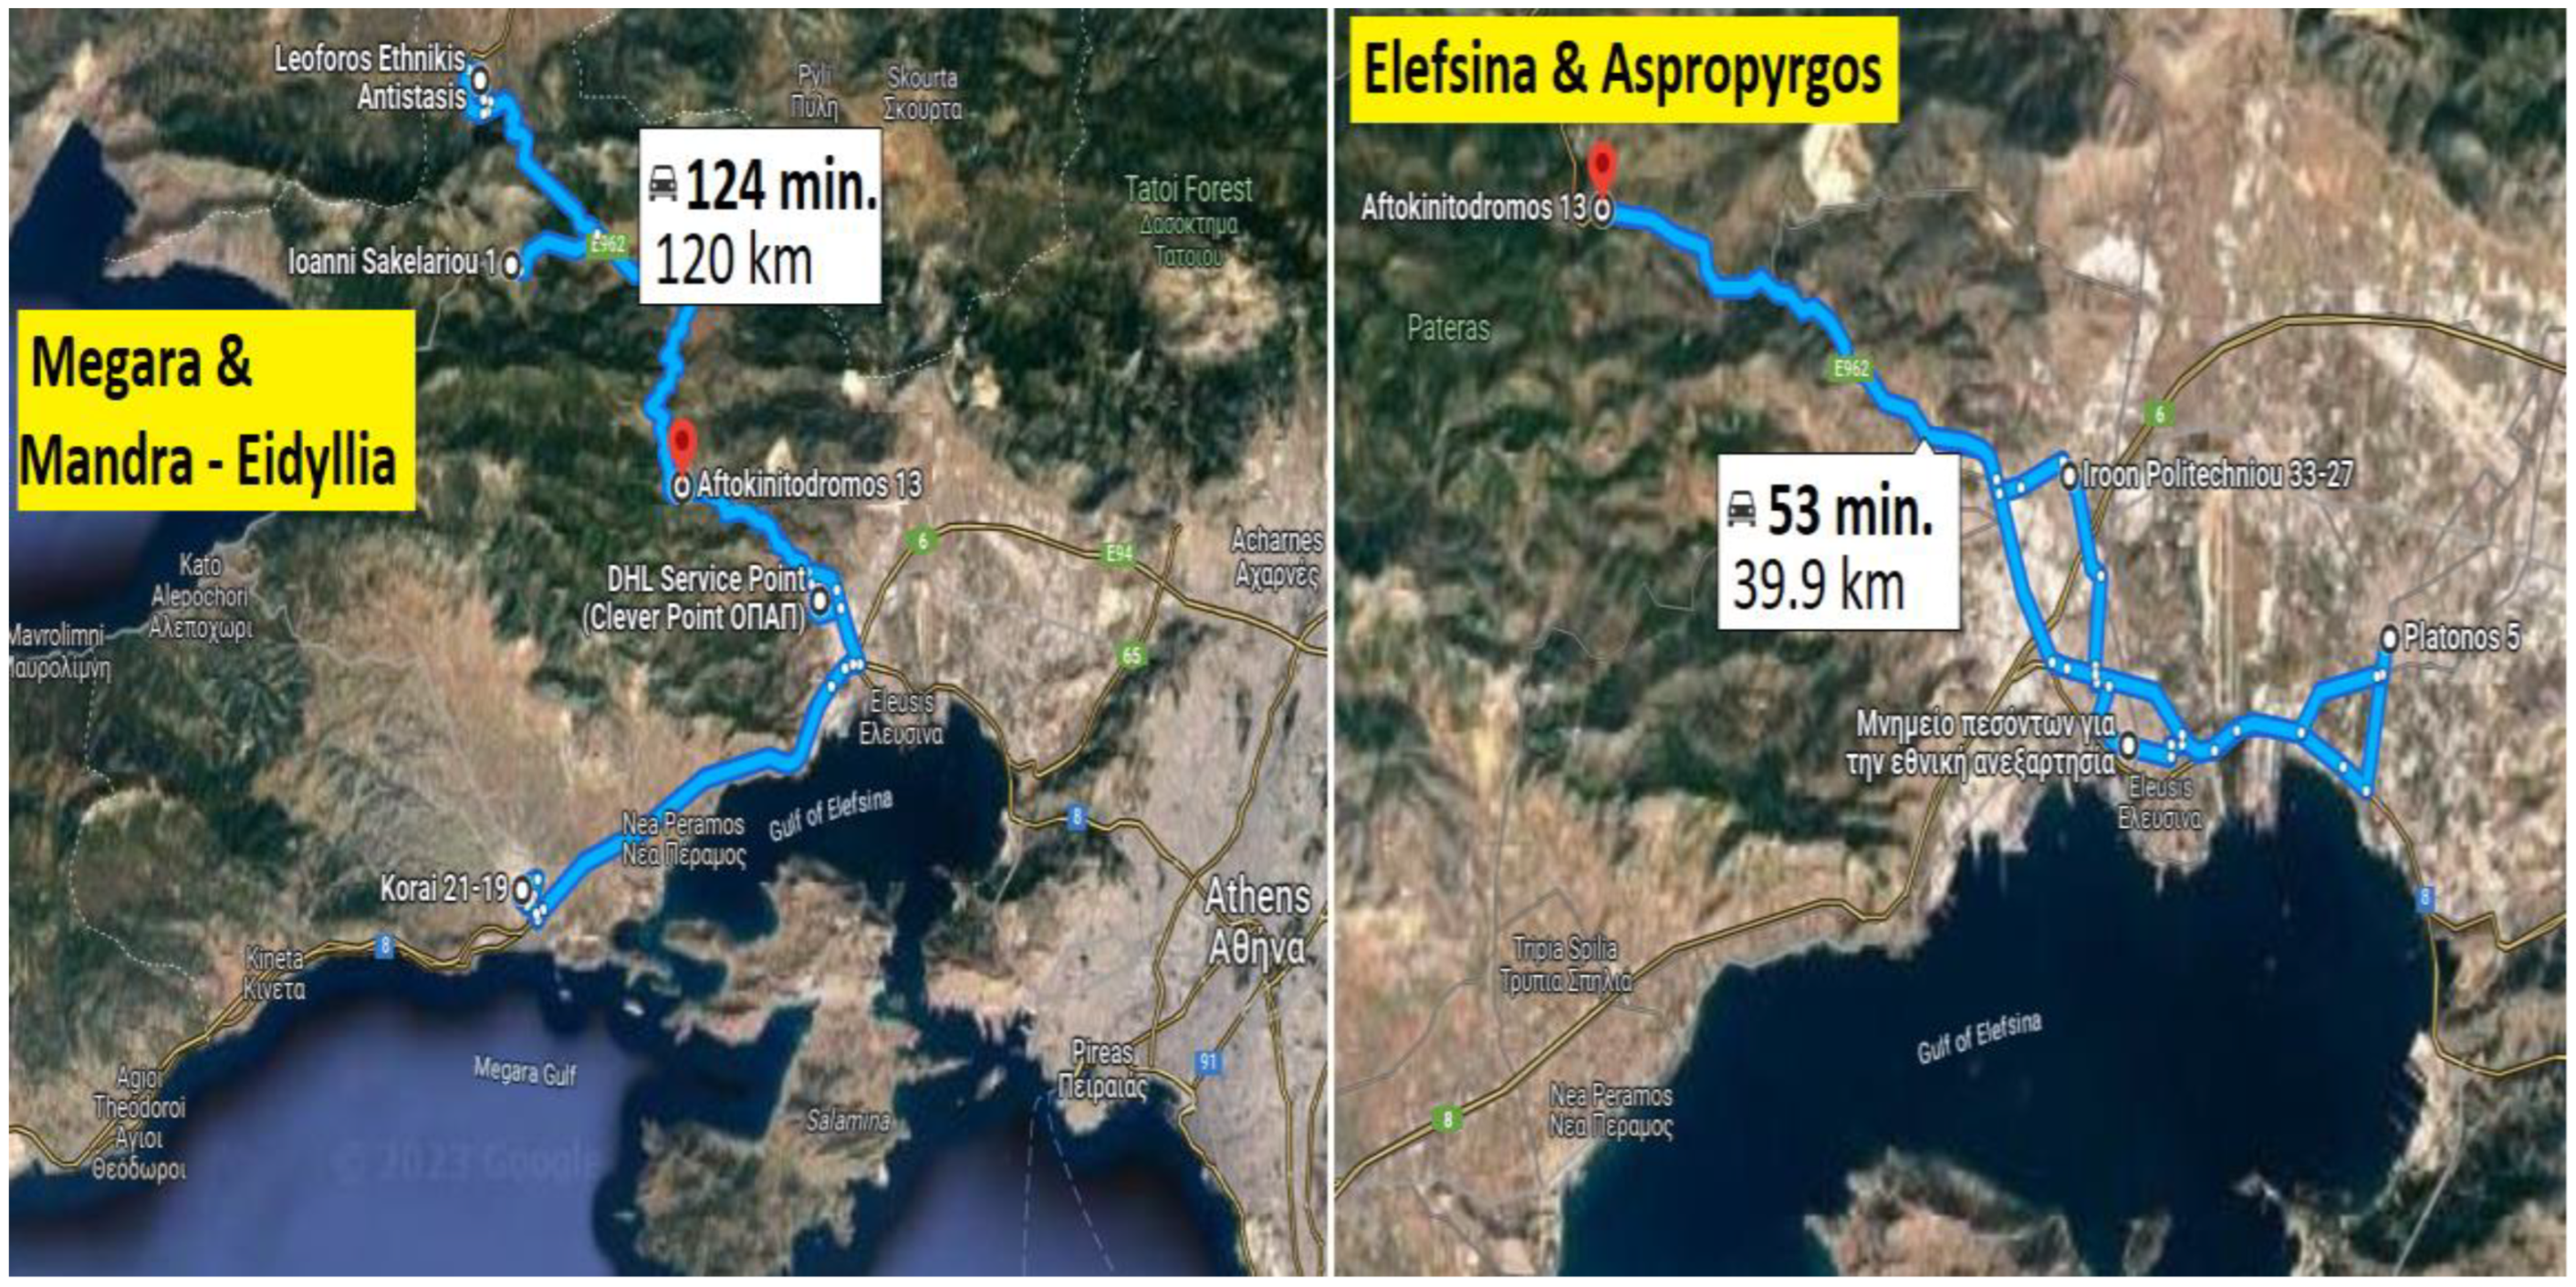
Second-Improvement-Scenario Distances


Fuel Cost for the MGPs in the Second Improvement Scenario
CO2 Emissions into the Atmosphere from the MGPs in the Second Improvement Scenario
3. Results and Discussion
3.1. Comparison of THE GREEN CITY Recycling Program’s Current Situation and Its Two Improvement Scenarios

3.2. Advantages and Disadvantages of THE GREEN CITY Recycling Program’s First Improvement Scenario Compared with Its Current Situation
3.3. Advantages and Disadvantages of THE GREEN CITY Recycling Program’s Second Improvement Scenario Compared with Its Current Situation
3.4. Managerial Constraints, Research Challenges and Future Considerations
3.4.1. Environmental Dimension
3.4.2. Economics–Financial Dimension
3.4.3. Humanitarian–Anthropocentric Dimension
4. Conclusions
Author Contributions
Funding
Institutional Review Board Statement
Informed Consent Statement
Data Availability Statement
Conflicts of Interest
References
- Alloisio, I.; Borghesi, S. Climate change mitigation. In Good Health and Well-Being; Leal Filho, W., Wall, T., Azeiteiro, U., Azul, A.M., Brandli, L., Özuyar, P.G., Eds.; Encyclopedia of the UN Sustainable Development Goals; Springer International Publishing: Cham, Switzerland, 2019; pp. 1–12. [Google Scholar] [CrossRef]
- Gołasa, P.; Lenort, R.; Wysokiński, M.; Baran, J. Concentration of greenhouse gas emissions in the European Union. Metal 2014, 2014, 23. [Google Scholar]
- Wang, W.J.; Ma, S.; He, H.S.; Liu, Z.; Thompson, F.R.; Jin, W.; Wu, Z.F.; Spetich, M.A.; Wang, L.; Xue, S.; et al. Effects of rising atmospheric C2, climate change, and NitOrogen deposition on aboveground net primary production in a temperate forest. Environ. Res. Lett. 2019, 14, 104005. [Google Scholar] [CrossRef]
- Acharya, H. Municipal solid waste management; Problem and opportunity. Retrieved Oct. 2017, 12, 2018. [Google Scholar]
- Melece, L.; Brizga, J.; Ernsteins, R. Municipal Waste Management Issues. Eng. Rural. Dev. 2018, 5, 1245–1252. [Google Scholar] [CrossRef]
- Ladin, M.A.; Muhammad, M.; Mohamed Irtema, H.I.; Yahia, H.A.; Ismail, A.; Rahmat, R.A. A Study of fuel price increase and its influence on selection of mode of transports. J. Teknol. 2015, 72. [Google Scholar] [CrossRef] [Green Version]
- Gohari, A.; Matori, N.; Wan Yusof, K.; Toloue, I.; Cho Myint, K. Effects of the fuel price increase on the operating cost of freight transport vehicles. E3S Web Conf. 2018, 34, 01022. [Google Scholar] [CrossRef] [Green Version]
- Lackner, M.; Seiner, J.M.; Chen, W.-Y. Fuel efficiency in transportation systems. In Handbook of Climate Change Mitigation and Adaptation; Chen, W.-Y., Suzuki, T., Lackner, M., Eds.; Springer: New York, NY, USA, 2021; pp. 1–23. [Google Scholar]
- Coyle, D.M.; Street, W. Presented at the Windsor Workshop. Windsor, ON, Canada, 14–17 June 2004. [Google Scholar]
- Tsimnadis, K.; Kyriakopoulos, G.L.; Arabatzis, G.; Zervas, E. Waste collection and treatment networks with source separation from Mobile Green Points (MGP): Citizen’s awareness and spatial planning for the collection of clean recyclable materials. IOP Conf. Ser. Earth Environ. Sci. 2022, 1123, 012069. [Google Scholar] [CrossRef]
- Tsimnadis, K.; Kyriakopoulos, G.L.; Arabatzis, G.; Leontopoulos, S.; Zervas, E. An innovative and alternative waste collection recy-1105 cling program based on source separation of Municipal Solid Wastes (MSW) and operating with Mobile Green Points (MGPs). Sustainability 2023, 15, 3106. [Google Scholar] [CrossRef]
- European Environment Agency-EEA. 2020. Available online: https://www.eea.europa.eu/highlights/average-co2-emissions-from-new (accessed on 1 December 2022).
- United States Environmental Protection Agency-EPA. 2022. Available online: https://www.epa.gov/greenvehicles/greenhouse-gas-emissions-typical-passenger-vehicle (accessed on 9 December 2022).
- General Secretariat of Commerce and Consumer Protection-Greece. 2022. Available online: http://oil.gge.gov.gr/ (accessed on 11 November 2022).
- Kumar Singh, S.; Chauhan, A.; Sarkar, B. Supply chain management of e-waste for end-of-life electronic products with reverse logistics. Mathematics 2023, 11, 124. [Google Scholar] [CrossRef]
- Debnath, A.; Sarkar, B. Effect of circular economy for waste nullification under a sustainable supply chain management. J. Clean. Prod. 2023, 385, 135477. [Google Scholar] [CrossRef]
- Kyriakopoulos, G.L.; Solovev, D.B. Circular economy (CE) innovation and internationalization of small and medium enterprises (SMEs): Geographical overview and sectorial patterns. In Proceedings of the International Science and Technology Conference “FarEastCon 2021”, Vladivostok, Russian, 5–8 October 2021; Solovev, D.B., Savaley, V.V., Bekker, A.T., Petukhov, V.I., Eds.; Smart Innovation, Systems and Technologies (SIST); Springer: Berlin/Heidelberg, Germany, 2022; Volume 275, pp. 113–142. [Google Scholar] [CrossRef]
- Kyriakopoulos, G.L. Environmental legislation in European and International contexts: Legal practices and social planning toward the circular economy. Laws 2021, 10, 3. [Google Scholar] [CrossRef]
- Singh, S.K.; Chauhan, A.; Sarkar, B. Sustainable biodiesel supply chain model based on waste animal fat with subsidy and advertisement. J. Clean. Prod. 2023, 382, 134806. [Google Scholar] [CrossRef]
- Makri, P.; Hermides, D.; Kontakiotis, G.; Zarkogiannis, S.D.; Besiou, E.; Janjuhah, H.T.; Antonarakou, A. Integrated ecological assessment of heavily polluted sedimentary basin within the broader industrialized area of Thriassion plain (Western Attica, Greece). Water 2022, 14, 382. [Google Scholar] [CrossRef]
- Saitanis, C.; Karandinos, M.G.; Riga-Karandinos, A.N.; Lorenzini, G.; Vlassi, A. Photochemical air pollutant levels and ozone phytotoxicity in the region of Mesogia-Attica, Greece. Int. J. Environ. Pollut. 2003, 19, 197–208. [Google Scholar] [CrossRef]
- Vega-Perkins, J.; Newell, J.P.; Keoleian, G. Mapping electric vehicle impacts: Greenhouse gas emissions, fuel costs, and energy justice in the United States. Environ. Res. Lett. 2023, 18, 014027. [Google Scholar] [CrossRef]
- Chung, Y.-S.; Wu, H.-L. Stress, strain, and health outcomes of occupational drivers: An application of the effort reward imbalance model on Taiwanese public transport drivers. Transp. Res. Part F Traffic Psychol. Behav. 2013, 19, 97–107. [Google Scholar] [CrossRef]
- Mannion, R.; Konteh, F.H.; Jacobs, R. Organisational drivers of performance in mental health providers. J. Health Organ. Manag. 2023, 37, 273–287. [Google Scholar] [CrossRef] [PubMed]
- Kulshrestha, V.; Shahid, S.M. Barriers and drivers in mental health services in New Zealand: Current status and future direction. Glob. Health Promot. 2022, 29, 83–86. [Google Scholar] [CrossRef] [PubMed]


| Western Attica (First Scenario) | ||
|---|---|---|
| Destination | Time (Minutes) | Distance (Kilometers) |
| Megara | 27 | 30.3 |
| 54 | 60.6 | |
| Mandra—Eidyllia | 55 | 51 |
| 110 | 102 | |
| Elefsina | 26 | 17.1 |
| 52 | 34.2 | |
| Aspropyrgos | 25 | 18.3 |
| 50 | 36.6 | |
| Total | 133 | 116.7 |
| 266 | 233.4 | |
| Eastern Attica (First Scenario) | ||
| Destination | Time (min) | Distance (km) |
| Pallini | 27 | 25 |
| 54 | 50 | |
| Rafina—Pikermi | 36 | 33.1 |
| 72 | 66.2 | |
| Paiania | 17 | 17 |
| 34 | 34 | |
| Kropia | 23 | 18.6 |
| 46 | 37.2 | |
| Spata—Artemida | 31 | 26.7 |
| 62 | 53.4 | |
| Markopoulo | 14 | 10.5 |
| 28 | 21 | |
| Saronikos | 30 | 24.2 |
| 60 | 48.4 | |
| Lavreotiki | 24 | 27.8 |
| 48 | 55.6 | |
| Total | 202 | 182.9 |
| 404 | 365.8 | |
| Northeastern Attica (First Scenario) | ||
| Destination | Time (min) | Distance (km) |
| Oropos | 36 | 28.4 |
| 72 | 56.8 | |
| Marathon | 70 | 48.7 |
| 140 | 97.4 | |
| Dionysos | 19 | 9.5 |
| 38 | 19 | |
| Penteli | 43 | 34.4 |
| 86 | 68.8 | |
| Total | 168 | 121 |
| 336 | 242 | |
| One-Way Trip | ||
| Round Trip | ||
| Western Attica (Second Scenario) | ||
|---|---|---|
| Destination | Time (min) | Distance (km) |
| Megara and Mandra—Eidyllia * | 124 | 120 |
| Elefsina and Aspropyrgos * | 53 | 39.9 |
| Total | 177 | 159.9 |
| Eastern Attica (Second scenario) | ||
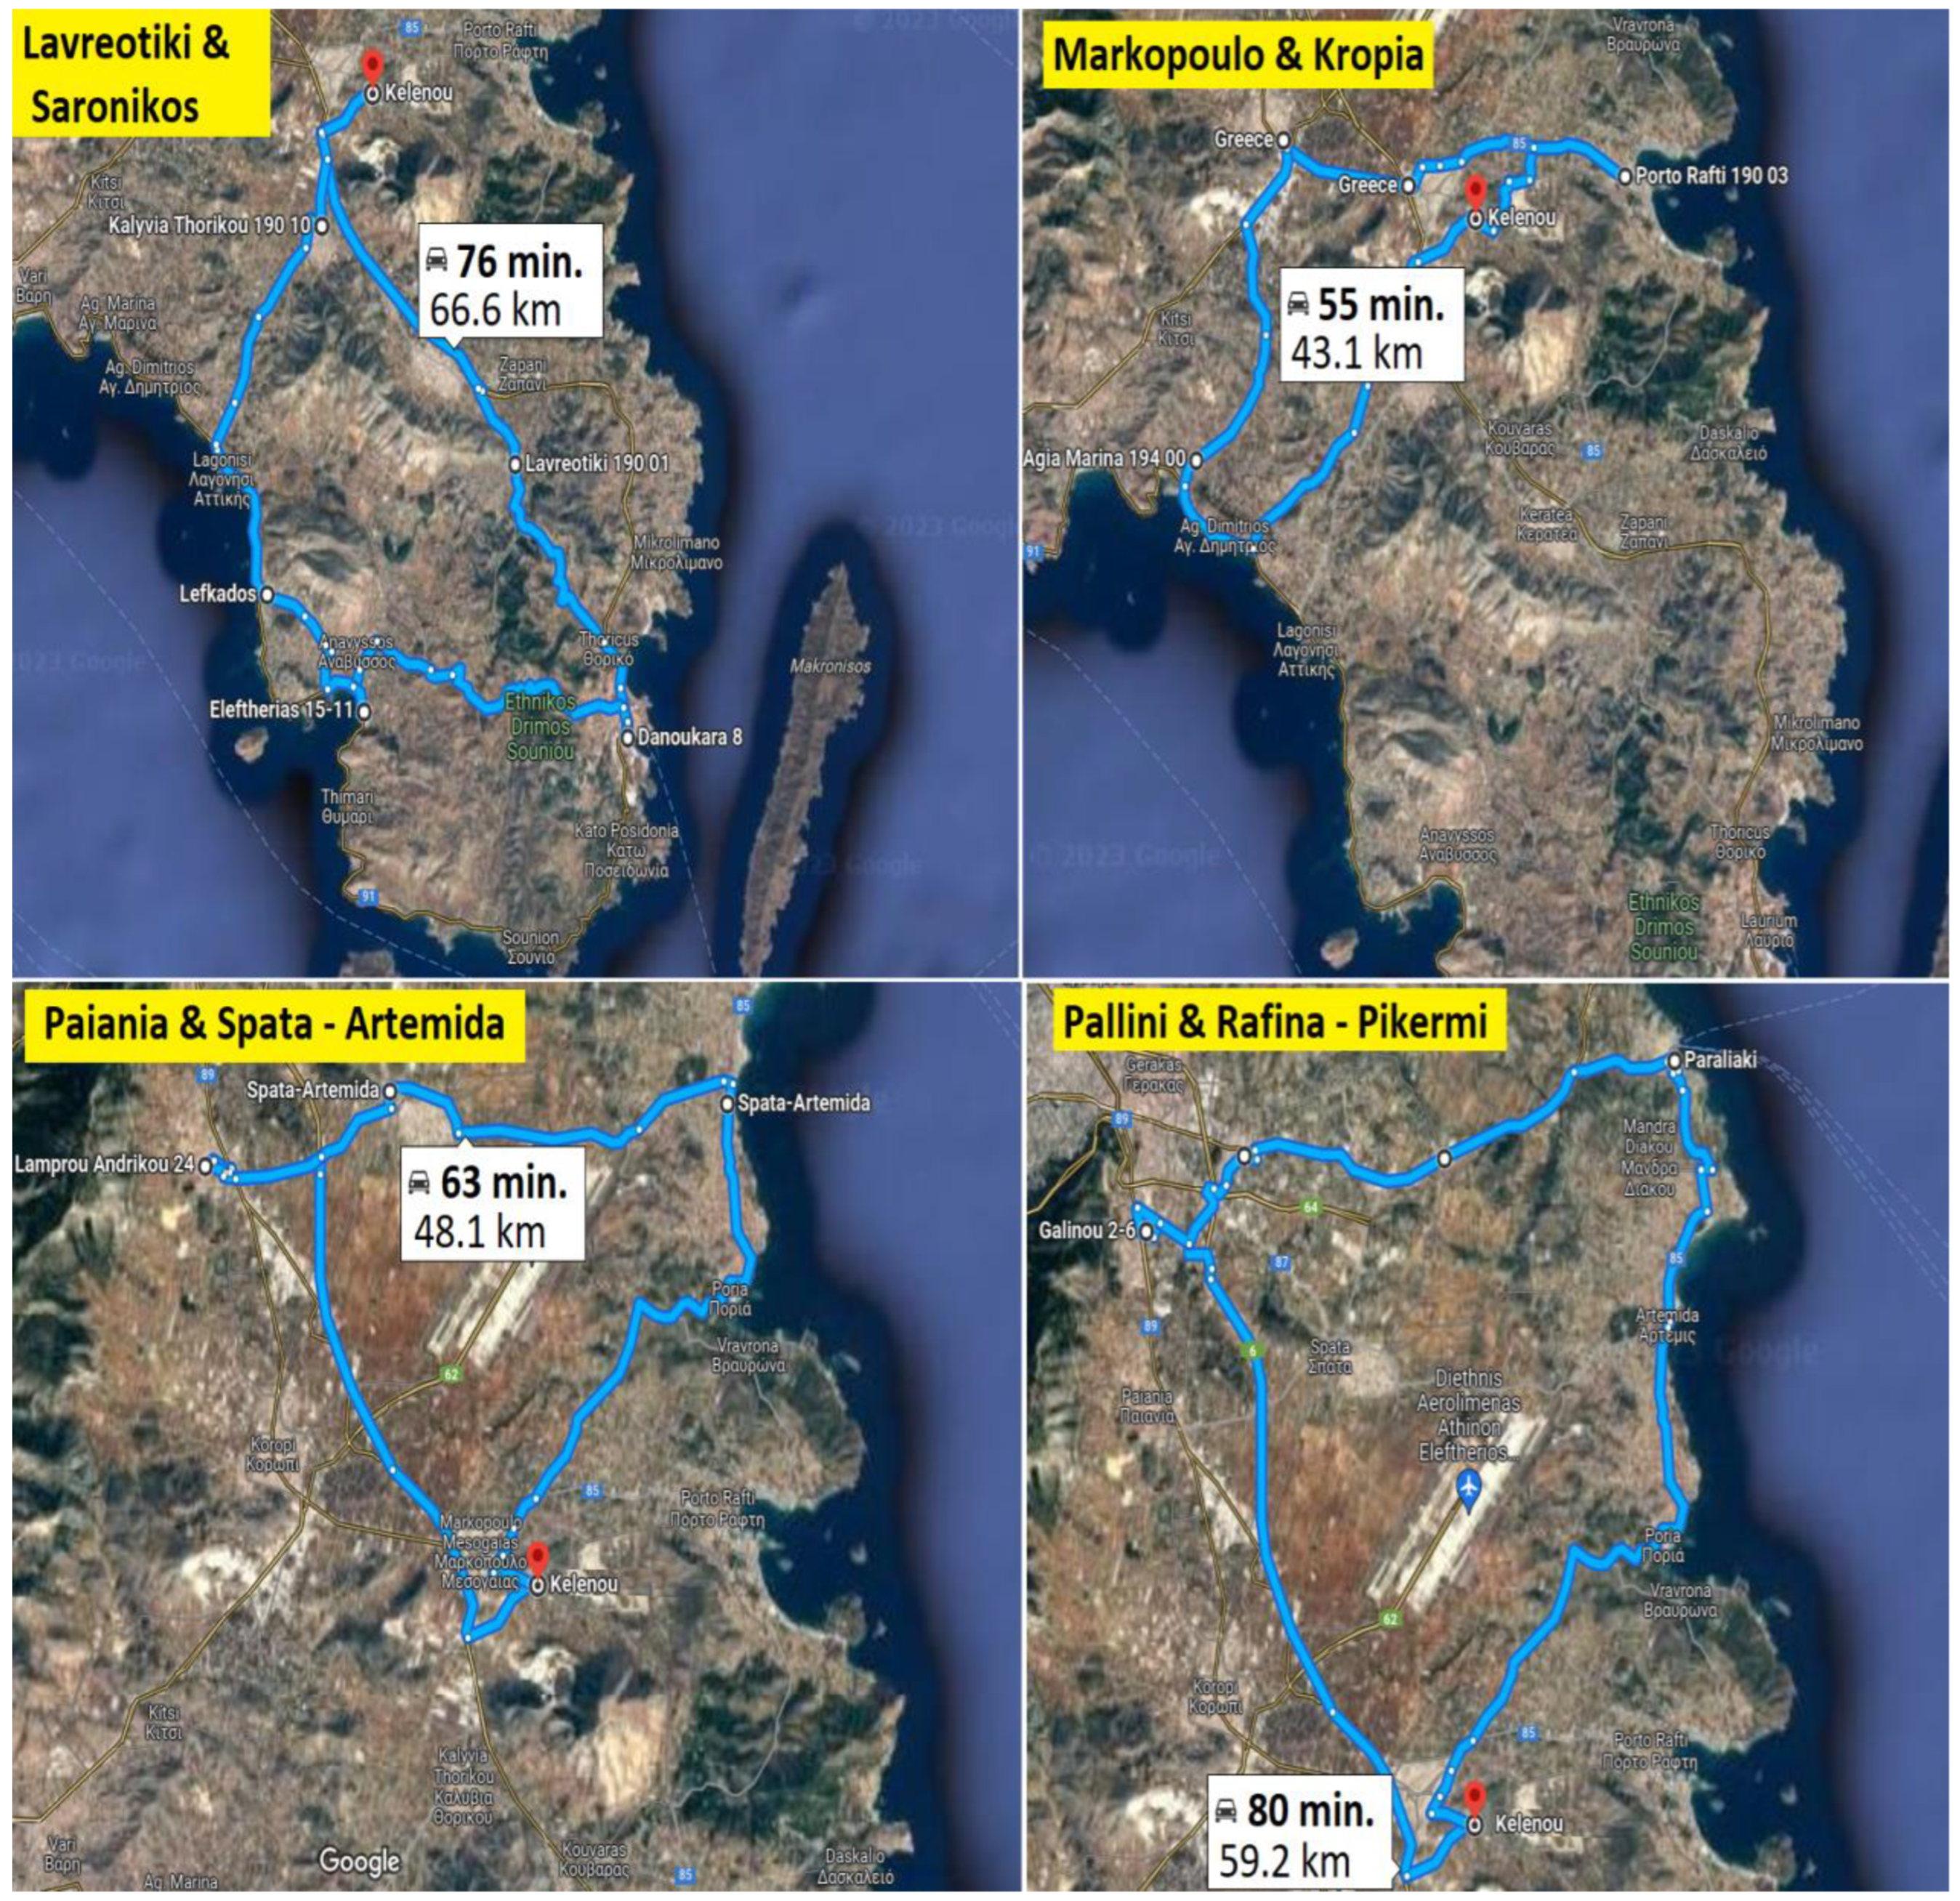
| Destination | Time (min) | Distance (km) |
| Pallini and Rafina—Pikermi * | 80 | 59.2 |
| Paiania and Spata—Artemida * | 63 | 48.1 |
| Markopoulo and Kropia * | 55 | 43.1 |
| Lavreotiki and Saronikos * | 76 | 66.6 |
| Total | 274 | 217 |
| Northeastern Attica (Second scenario) | ||
| Destination | Time (min) | Distance (km) |
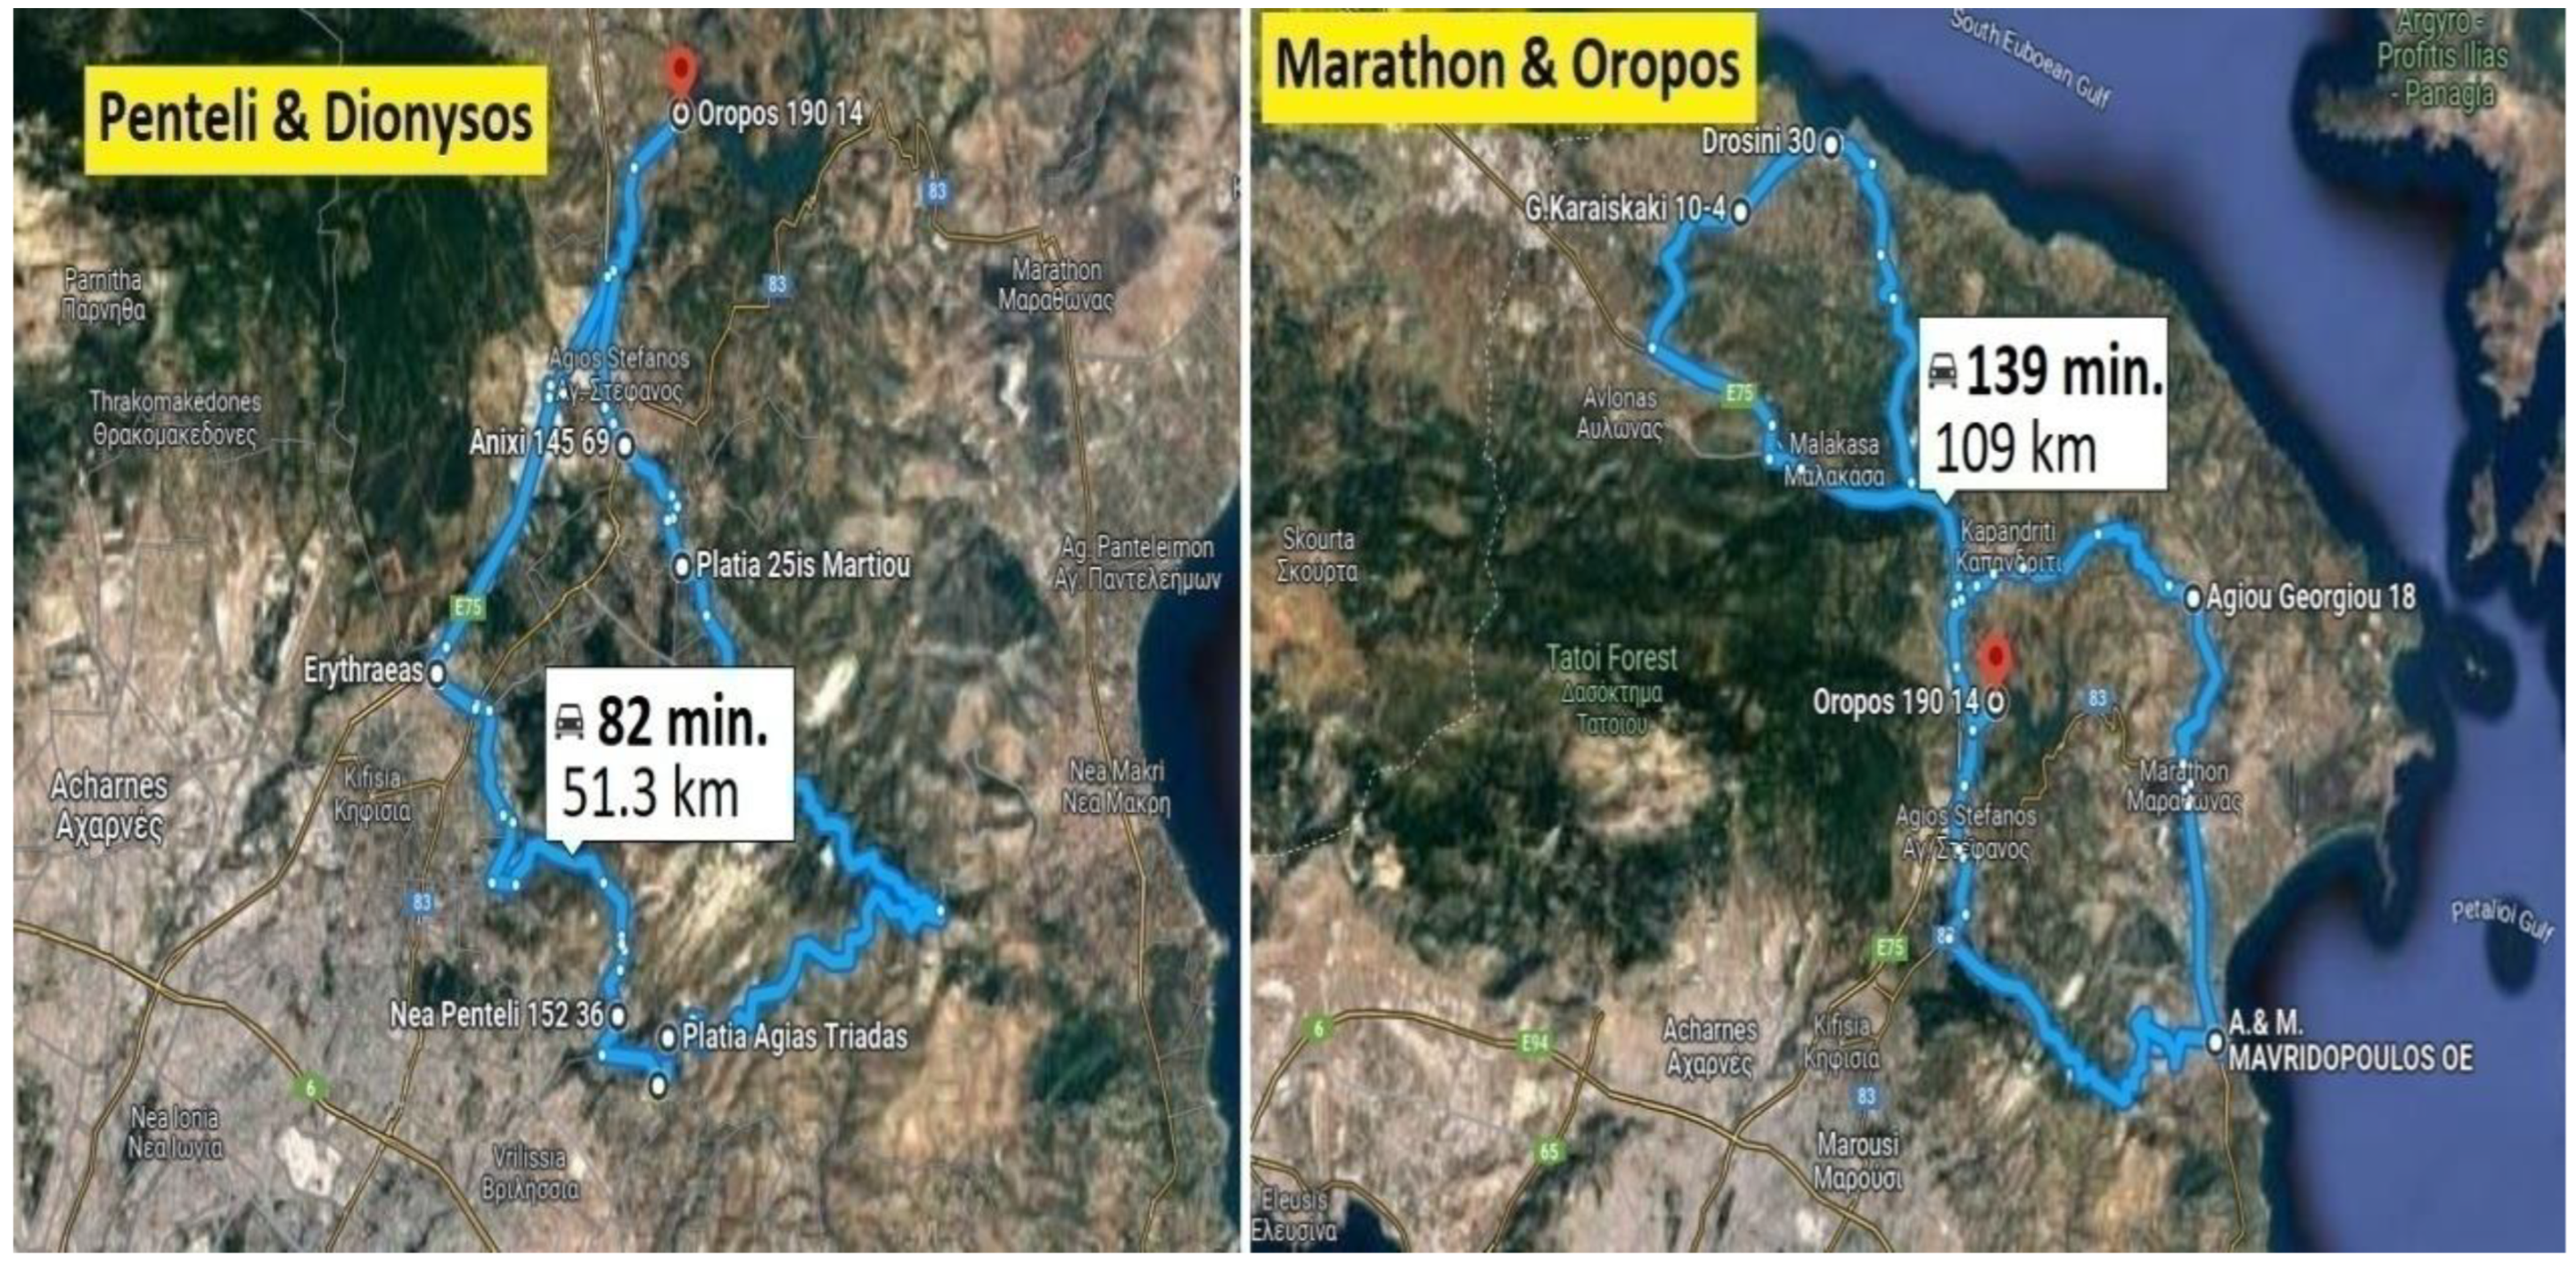
| Marathon and Oropos * | 139 | 109 |
| Penteli and Dionysos * | 82 | 51.3 |
| Total | 221 | 161.3 |
| Comparison between Current Situation and First Improvement Scenario | ||||
|---|---|---|---|---|
| Current Situation | First Improvement Scenario | Difference | Percentage of Change | |
| Total Annual Distance (km) | 70,531.2 | 40,377.6 | −30,153.6 | −42.8% |
| Total Annual Distance (min) | 69,312 | 48,288 | −21,024 | −30.3% |
| Total Annual Fuel Cost (EUR ) | 17,632.8 | 10,094.4 | −7538.4 | −42.8% |
| Total Annual CO2 Emissions (kg) | 25,885 | 14,819 | −11,066 | −42.8% |
| Comparison Between Current Situation and Second Improvement Scenario | ||||
| Current Situation | Second Improvement Scenario | Difference | Percentage of Change | |
| Total Annual Distance (km) | 70,531.2 | 25,785.6 | −44,745.6 | −63.4% |
| Total Annual Distance (min) | 69,312 | 32,256 | −37,056 | −53.5% |
| Total Annual Fuel Cost (EUR ) | 17,632.8 | 6446.3 | −11,186.5 | −63.4% |
| Total Annual CO2 Emissions (kg) | 25,885 | 9463 | −16,422 | −63.4% |
| First Improvement Scenario Compared with Current Situation | |
|---|---|
| Advantages (+) | Disadvantages (−) |
| Distance reduction | Demand of significant capital expenditures for establishing decentralized depots |
| Route duration reduction | Lower accessibility to public transport for the employees of THE GREEN CITY program |
| Fuel-cost decrease | Increase in daily commuting costs for the employees |
| CO2 emission decrease | Indirect growth of THE GREEN CITY recycling program’s carbon footprint due to lack of accessibility to public transport |
| Increase in MGPs operational lifetime | |
| Decrease in MGPs maintenance costs | |
| Strain decrease in MGP drivers and improvement in their health | |
| Air-pollution diminution in Attica region | |
| Mitigation of climate change’s negative impacts | |
| Increased energy conservation | |
| Recycling program’s operational-cost reduction | |
| Second Improvement Scenario Compared with Current Situation | |
|---|---|
| Advantages (+) | Disadvantages (−) |
| Great distance reduction (monthly and annually) | Significant capital expenditure demand for establishing decentralized depots |
| Significant time reduction (monthly and annually) | Lower accessibility to public transport for the employees of THE GREEN CITY program |
| Great fuel-cost decrease | Increase in daily commuting costs for the employees |
| Great CO2-emission decrease | Indirect growth of THE GREEN CITY recycling program’s carbon footprint due to lack of accessibility to public transport |
| Increase in MGPs’ operational lifetime | Increase in distance (daily) |
| Decrease in MGPs’ maintenance costs | Increase in time (daily) |
| MGP drivers’ strain decreases and improvement in their health (long term) | Increase in MGP drivers’ strain and deterioration of their health (short term) |
| Air pollution diminution in Attica region | High implementation uncertainty |
| Mitigation of negative impacts of climate change | |
| Increased energy conservation | |
| Recycling program’s operational cost reduction | |
Disclaimer/Publisher’s Note: The statements, opinions and data contained in all publications are solely those of the individual author(s) and contributor(s) and not of MDPI and/or the editor(s). MDPI and/or the editor(s) disclaim responsibility for any injury to people or property resulting from any ideas, methods, instructions or products referred to in the content. |
© 2023 by the authors. Licensee MDPI, Basel, Switzerland. This article is an open access article distributed under the terms and conditions of the Creative Commons Attribution (CC BY) license (https://creativecommons.org/licenses/by/4.0/).
Share and Cite
Tsimnadis, K.; Kyriakopoulos, G.L.; Leontopoulos, S. Practical Improvement Scenarios for an Innovative Waste-Collection Recycling Program Operating with Mobile Green Points (MGPs). Inventions 2023, 8, 80. https://doi.org/10.3390/inventions8040080
Tsimnadis K, Kyriakopoulos GL, Leontopoulos S. Practical Improvement Scenarios for an Innovative Waste-Collection Recycling Program Operating with Mobile Green Points (MGPs). Inventions. 2023; 8(4):80. https://doi.org/10.3390/inventions8040080
Chicago/Turabian StyleTsimnadis, Konstantinos, Grigorios L. Kyriakopoulos, and Stefanos Leontopoulos. 2023. "Practical Improvement Scenarios for an Innovative Waste-Collection Recycling Program Operating with Mobile Green Points (MGPs)" Inventions 8, no. 4: 80. https://doi.org/10.3390/inventions8040080