Article

Quantification of Statins in Pharmaceutical Products Using Screen-Printed Sensors Based of Multi-Walled Carbon Nanotubes and Gold Nanoparticles

by
Ramona Oana Roșca
,
Alexandra Virginia Bounegru
and
Constantin Apetrei
*
Department of Chemistry, Physics and Environment, Faculty of Sciences and Environment, “Dunărea de Jos” University of Galaţi, 47 Domnească Street, 800008 Galati, Romania
*
Author to whom correspondence should be addressed.
Inventions 2023, 8(5), 111; https://doi.org/10.3390/inventions8050111
Submission received: 18 July 2023 / Revised: 22 August 2023 / Accepted: 28 August 2023 / Published: 30 August 2023

Abstract

:
This study describes the use of electrochemical sensors to detect and quantify several statins (rosuvastatin and simvastatin) in pharmaceutical products. Two types of commercially screen-printed sensors were used and compared: one based on carbon (SPCE) and the other modified with gold nanoparticles and multi-walled carbon nanotubes (SPE/GNP-MWCNT). Cyclic voltammetry was employed for determination. The AuNP-MWCNTs/SPCE sensor outperformed the SPCE sensor, displaying excellent electrochemical properties. It demonstrated high sensitivity with low limits of detection (LOD) and quantification (LOQ) values: 0.15 µM and 5.03 µM, respectively, for rosuvastatin and 0.30 µM and 1.01 µM, respectively, for simvastatin. The sensor had a wide linear range of 20–275 µM for rosuvastatin and 50–350 µM for simvastatin. Using the AuNP-MWCNTs/SPCE sensor, rosuvastatin and simvastatin were successfully quantified in pharmaceutical products. The results were validated towards producer-reported values (standardized drugs) and a conventional analysis method (FTIR). The sensor exhibited excellent stability, reproducibility, and analytical recovery ranging from 99.3% to 106.6% with a low relative standard deviation (RSD) of less than 1%. In conclusion, the AuNP-MWCNTs/SPCE sensor proved to be a reliable and sensitive tool for detecting and quantifying statins in pharmaceutical products. Its superior electrochemical properties, low LOD and LOQ values, wide linear range, and high analytical recovery make it a promising choice for pharmaceutical quality control.

1. Introduction

Pharmaceutical products based on statins are known for lowering blood cholesterol levels, but they also play a role in preventing cardiovascular diseases. These drugs are found in pharmaceutical products only in the standardized form containing pharmaceutical active compounds such as simvastatin, rosuvastatin, etc. [1].
Statins are the class of drugs widely used for the competitive inhibition of 3-hydroxy-3-methylglutaryl coenzyme A reductase (HMG-CoA reductase). HMG-CoA is the enzyme that catalyzes the limiting step in cholesterol biosynthesis. By inhibiting HMG-CoA reductase, statins reduce cholesterol synthesis by lowering serum low-density lipoprotein levels, particularly in patients with fasting triglycerides below 500 mg/dL [2]. Furthermore, the anti-inflammatory, antithrombotic, and endothelial effects significantly reduce mortality from cardiovascular diseases. In addition, a decrease in cholesterol concentration in the liver leads to activating the liver’s low-density lipoprotein (LDL) receptors that remove LDL precursors and LDL from the bloodstream. At the same time, statins inhibit the hepatic synthesis of apolipoprotein B100 and decrease the production and secretion of triglyceride-rich lipoproteins [3].
Simvastatin (SV) is an inactive lactone (without biological activity) that, after oral administration, is hydrolyzed in vivo to the corresponding β, δ-dihydroxyl acid (simvastatin acid, SVA) [4]. The latter is a strong inhibitor of HMG-CoA and can effectively reduce the plasma’s low-density lipoprotein (LDL) level [5]. SV hydrolysis is schematically represented in Figure 1.
Simvastatin is a statin derived from fungal fermentation and is often used to treat hypercholesterolemia [7]. However, due to in vivo hydrolysis and other statins with similar structures’ presence, the concentration of SV in human plasma is deficient.
Rosuvastatin (RV), another essential statin, is derived from hept-6-enoic acid [8]. Rosuvastatin is a dihydroxy monocarboxylic acid, namely (6E)-7-{4-(4-fluorophenyl)-2-[methyl methylsulfonyl)amino]-6-(propan-2-yl)pyrimidin-5-yl}hept-6-enoic acid having two hydroxy substituents at positions 3 and 5 (3R, 5S diastereomer) (Figure 2).
Considering the frequent use and variety of pharmaceutical products containing statins and other substances with therapeutic activities, such as acetylsalicylic acid, ramipril, enalapril, metoprolol, amlodipine, hydrochlorothiazide, atenolol, ezetimibe, etc., their quality control would not be possible without reliable analytics methods. Therefore, it is necessary to quantify the biologically active compounds in these pharmaceutical products via fast and accurate methods [9,10].
The analysis of the publications on analytical methods of identifying and quantifying statins shows that chromatographic and optical methods constitute a significant share.
Chromatographic methods are sensitive, with detection limits of 0.01–1 ng/mL. This makes it possible to monitor the therapeutic plasma level of statins and their metabolites in pharmacokinetic studies to determine the content of statins in pharmaceutical formulations [11,12]. Moreover, spectroscopic methods are suitable for the analysis of statins. However, if the sample to be analyzed is more complex, it requires pretreatment and separation of the main component before analysis [13,14]. However, despite the advantages of these instrumental methods, in recent years, research has focused on applying electrochemical methods for the determination of statins in both pharmaceuticals and biological fluids [15,16,17,18]. Electrochemical methods are preferred precisely due to advantages such as rapid detection, straightforward procedures, cost-effectiveness, ease of integration, and especially the feasibility for the utilized instruments to be small-sized and portable [19].
The most frequently used voltammetric methods were cyclic voltammetry (CV), square wave voltammetry (SWV), and differential pulse voltammetry (DPV) [18,20,21]. This is unsurprising, as they offer high sensitivity, accuracy, and linearity. Moreover, they are quite convenient for the analysis of complex samples, as they allow for the determination of the target analyte without being separated from other compounds, provided they are not reduced or oxidized at the same potential. In addition, colored compounds or excipients do not interfere with the determination of the investigated component, which brings a strong advantage to electrochemical methods compared to optical ones [11,22,23,24,25].
Previous studies have addressed the use of modified electrochemical sensors for the individual determination of either rosuvastatin or simvastatin in pharmaceutical products or biological samples. For instance, various materials and methods have been used for constructing the sensors for statin detection. The sensors used were based on glassy carbon electrodes [26,27], boron-doped diamond electrodes (BDDs) [28], Ni/NiWN (nickel wrinkled nanostructure) electrodes [29], and carbon paste electrodes modified with multi-walled carbon nanotubes (MWCNTs) [30]. These nanostructured materials offer excellent properties such as large surface area and conductivity, contributing to increased sensitivity and performance of the electrochemical sensors. Differential pulse voltammetry (DPV) was mostly employed to evaluate the performance characteristics of the sensors. The sensors have limits of detection for statins in the micromolar range. However, the development of sensors based on other materials and technology, such as screen-printed technology, is necessary in order to increase sensitivity and reduce costs.
To the best of our knowledge, the utilization of gold nanoparticle-modified sensors for the determination of rosuvastatin or simvastatin in pharmaceutical products has not been reported on. Therefore, the distinct contribution of this study lies in the electrochemical evaluation of both statins using two different commercially modified screen-printed sensors, one based on carbon and the other based on carbon with nanotubes and gold nanoparticles. Carbon nanotubes have excellent chemical stability, critical mechanical quality, large surface area, and superior electrical conductivity [31]. On the other hand, gold nanoparticles (AuNP) have particular attributes, such as high conductivity, catalytic properties, and low toxicity, useful in building modified electrodes [32]. This innovative approach allows for a comprehensive analysis and precise determination of both compounds in the same pharmaceutical sample.
This study aims to evaluate the electrochemical behavior of two screen-printed sensors, one based on carbon (SPCE) and another based on carbon modified with carbon nanotubes and gold nanoparticles (AuNP-MWCNTs/SPCE), for the determination and the quantity of rosuvastatin and simvastatin in pharmaceutical products. The preliminary electrochemical analyses and those applied for the quantification of statins were carried out using cyclic voltammetry. The quantitative results obtained using the electrochemical method will be compared with those obtained with the FTIR method.

2. Materials and Methods

2.1. Reagents

To characterize the electrochemical behavior of the two sensors, potassium ferrocyanide, potassium ferricyanide, 0.1 M potassium chloride, and 10−3 M catechol solutions were used, the compounds being of analytical purity, purchased from Sigma-Aldrich (St. Louis, MO, USA). All solutions were prepared with MilliQwater ultrapure water (resistivity 18.2 MΩ·cm) obtained from a Milli-Q Simplicity® water purification system (Merck KGaA, Darmstadt, Germany). Pharmaceutical products purchased from pharmacies were used for rosuvastatin and simvastatin quantification studies. Analytical grade potassium bromide (Sigma-Aldrich, St. Louis, MO, USA) was used for FTIR analysis.

2.2. Electrochemical Measurements

For the electrochemical analyses, two screen-printed electrodes were used, one based on carbon (SPCE) (code C110) and the other based on carbon nanotubes and gold nanoparticles (AuNP-MWCNTs/SPCE) (code 110CNT-GNP) purchased from Dropsens Ltd. (Llanera, Spain). In both cases, the diameter of the working electrode was 4 mm, and therefore the geometric area of the working electrode was 0.125 cm2.
The presence of gold nanoparticles on the surface of the modified sensor was highlighted via electrochemical impedance spectroscopy (EIS). EIS is an electrochemical technique that provides information about the properties of the interfaces related to the detection process that takes place on the active surface of the electrode [33] but also about the catalytic capacity of the modifying nanomaterial. EIS measurements were performed using an SP 150 potentiostat/galvanostat controlled via EC-Lab Express software. The volume of the electrochemical cell was 50 mL with three electrodes (Ag/AgCl reference electrode, Pt auxiliary electrode, and working electrode).
The electrochemical method used for sensor characterization and electroanalysis of statins was cyclic voltammetry, using an EG&G potentiostat/galvanostat (Princeton Applied Research, Oak Ridge, TN, USA) connected to a computer with ECHEM software installed. The electrode system comprised the working electrode (SPCE or AuNP-MWCNTs/SPCE), the reference electrode, the silver electrode/silver chloride, and the counter-electrode, a platinum wire.
The cyclic voltammograms were recorded at a scanning rate of 0.1 V/s, in the potential range between −0.4 and +1.2 V. For the kinetics study, several scanning rates between 0.1 V/s and 1.0 V/s were used, increasing each time by 0.1 V/s. Signal stabilization was achieved by recording seven successive cycles with a scanning rate of 0.1 V/s. The working electrodes were not subjected to any additional pretreatment steps.

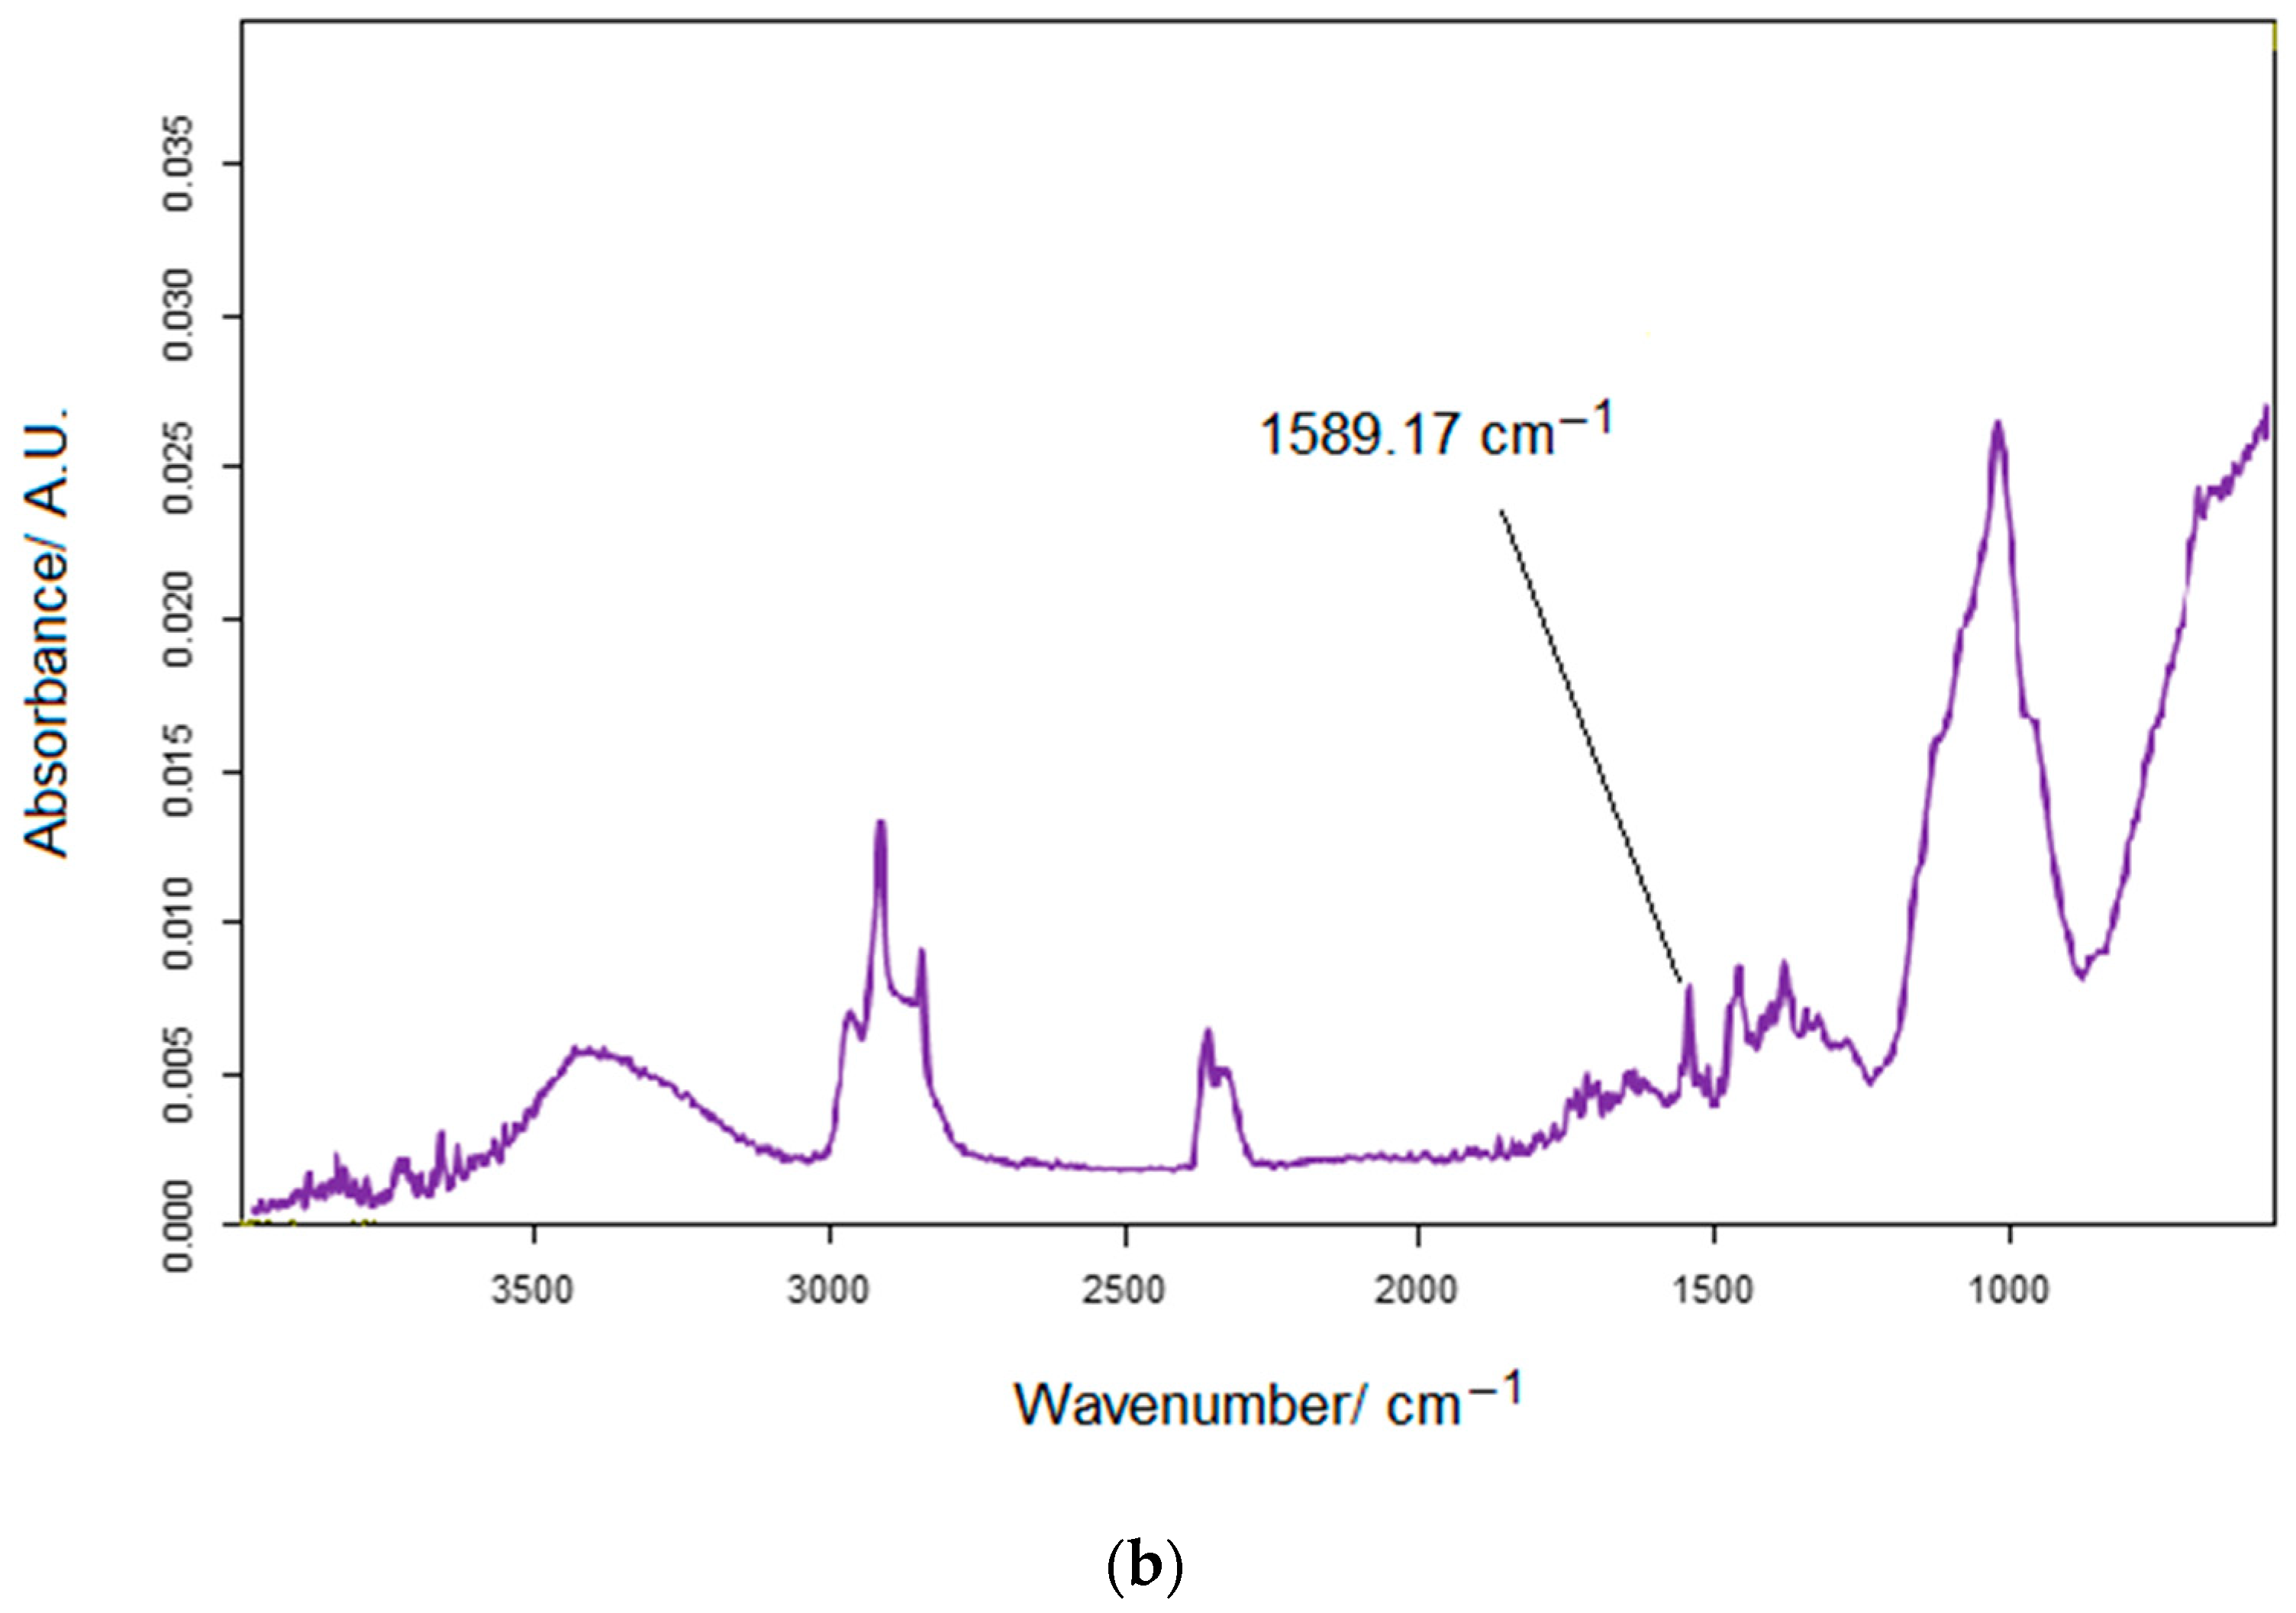
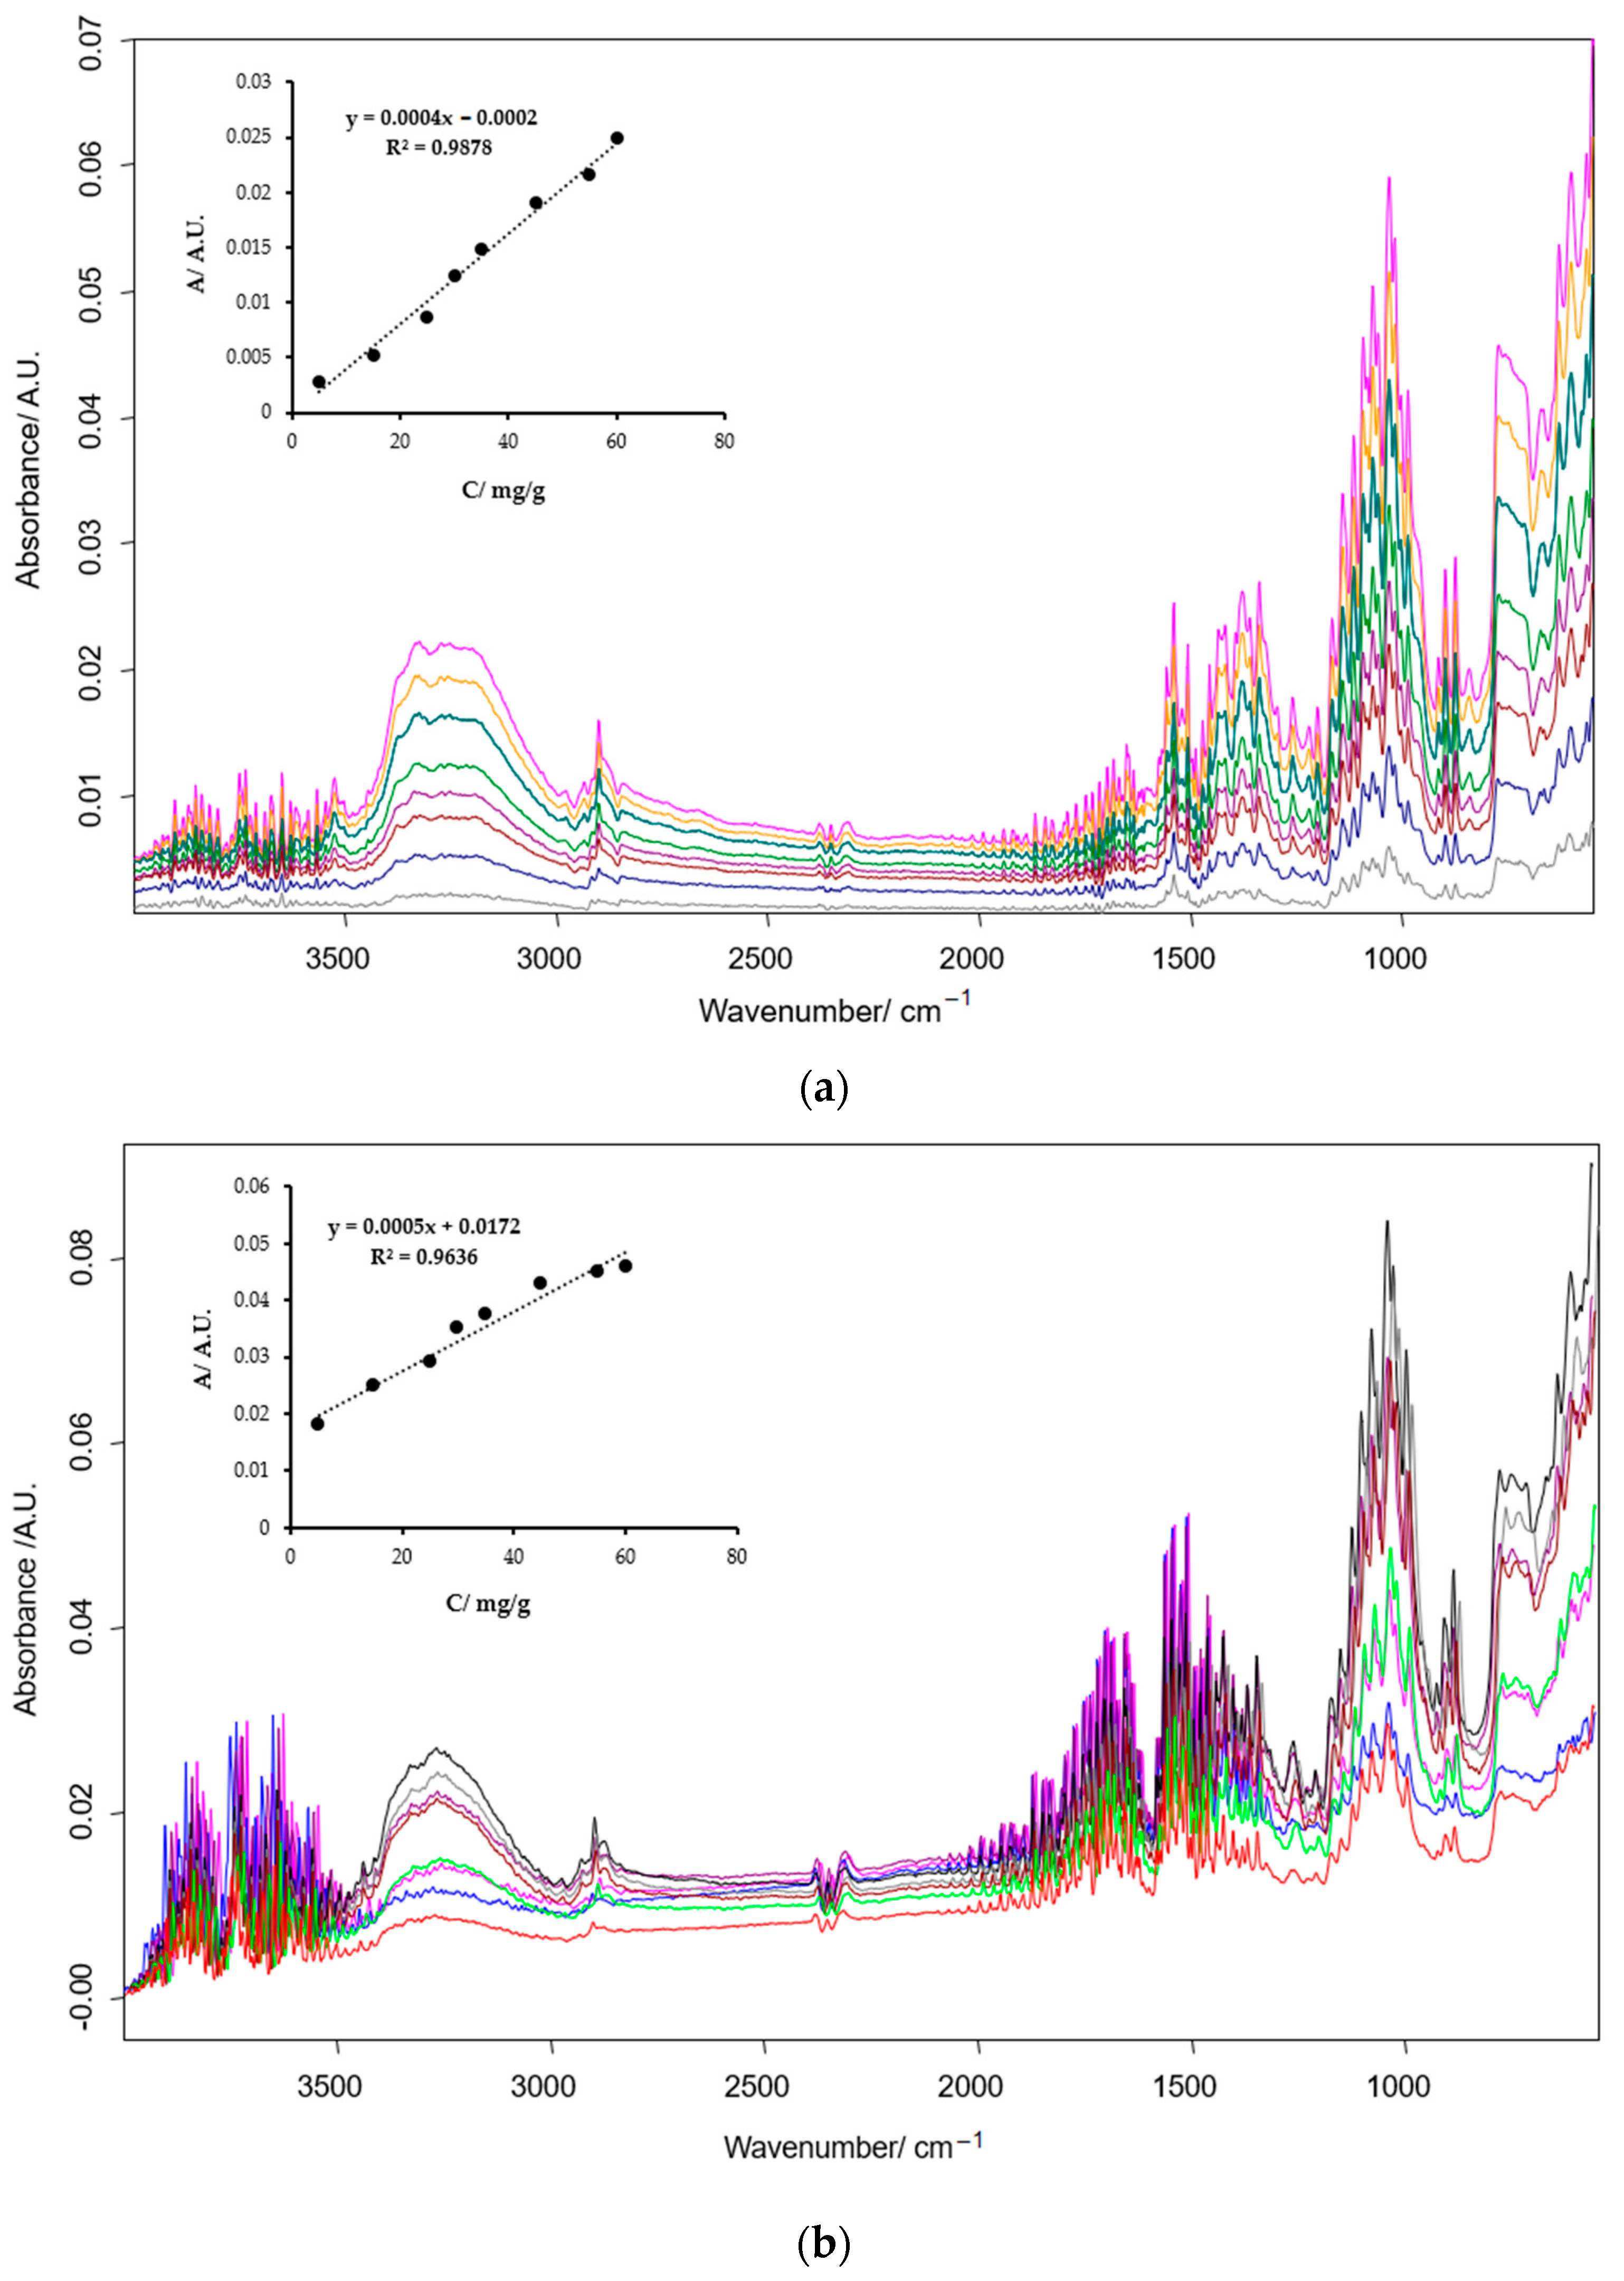
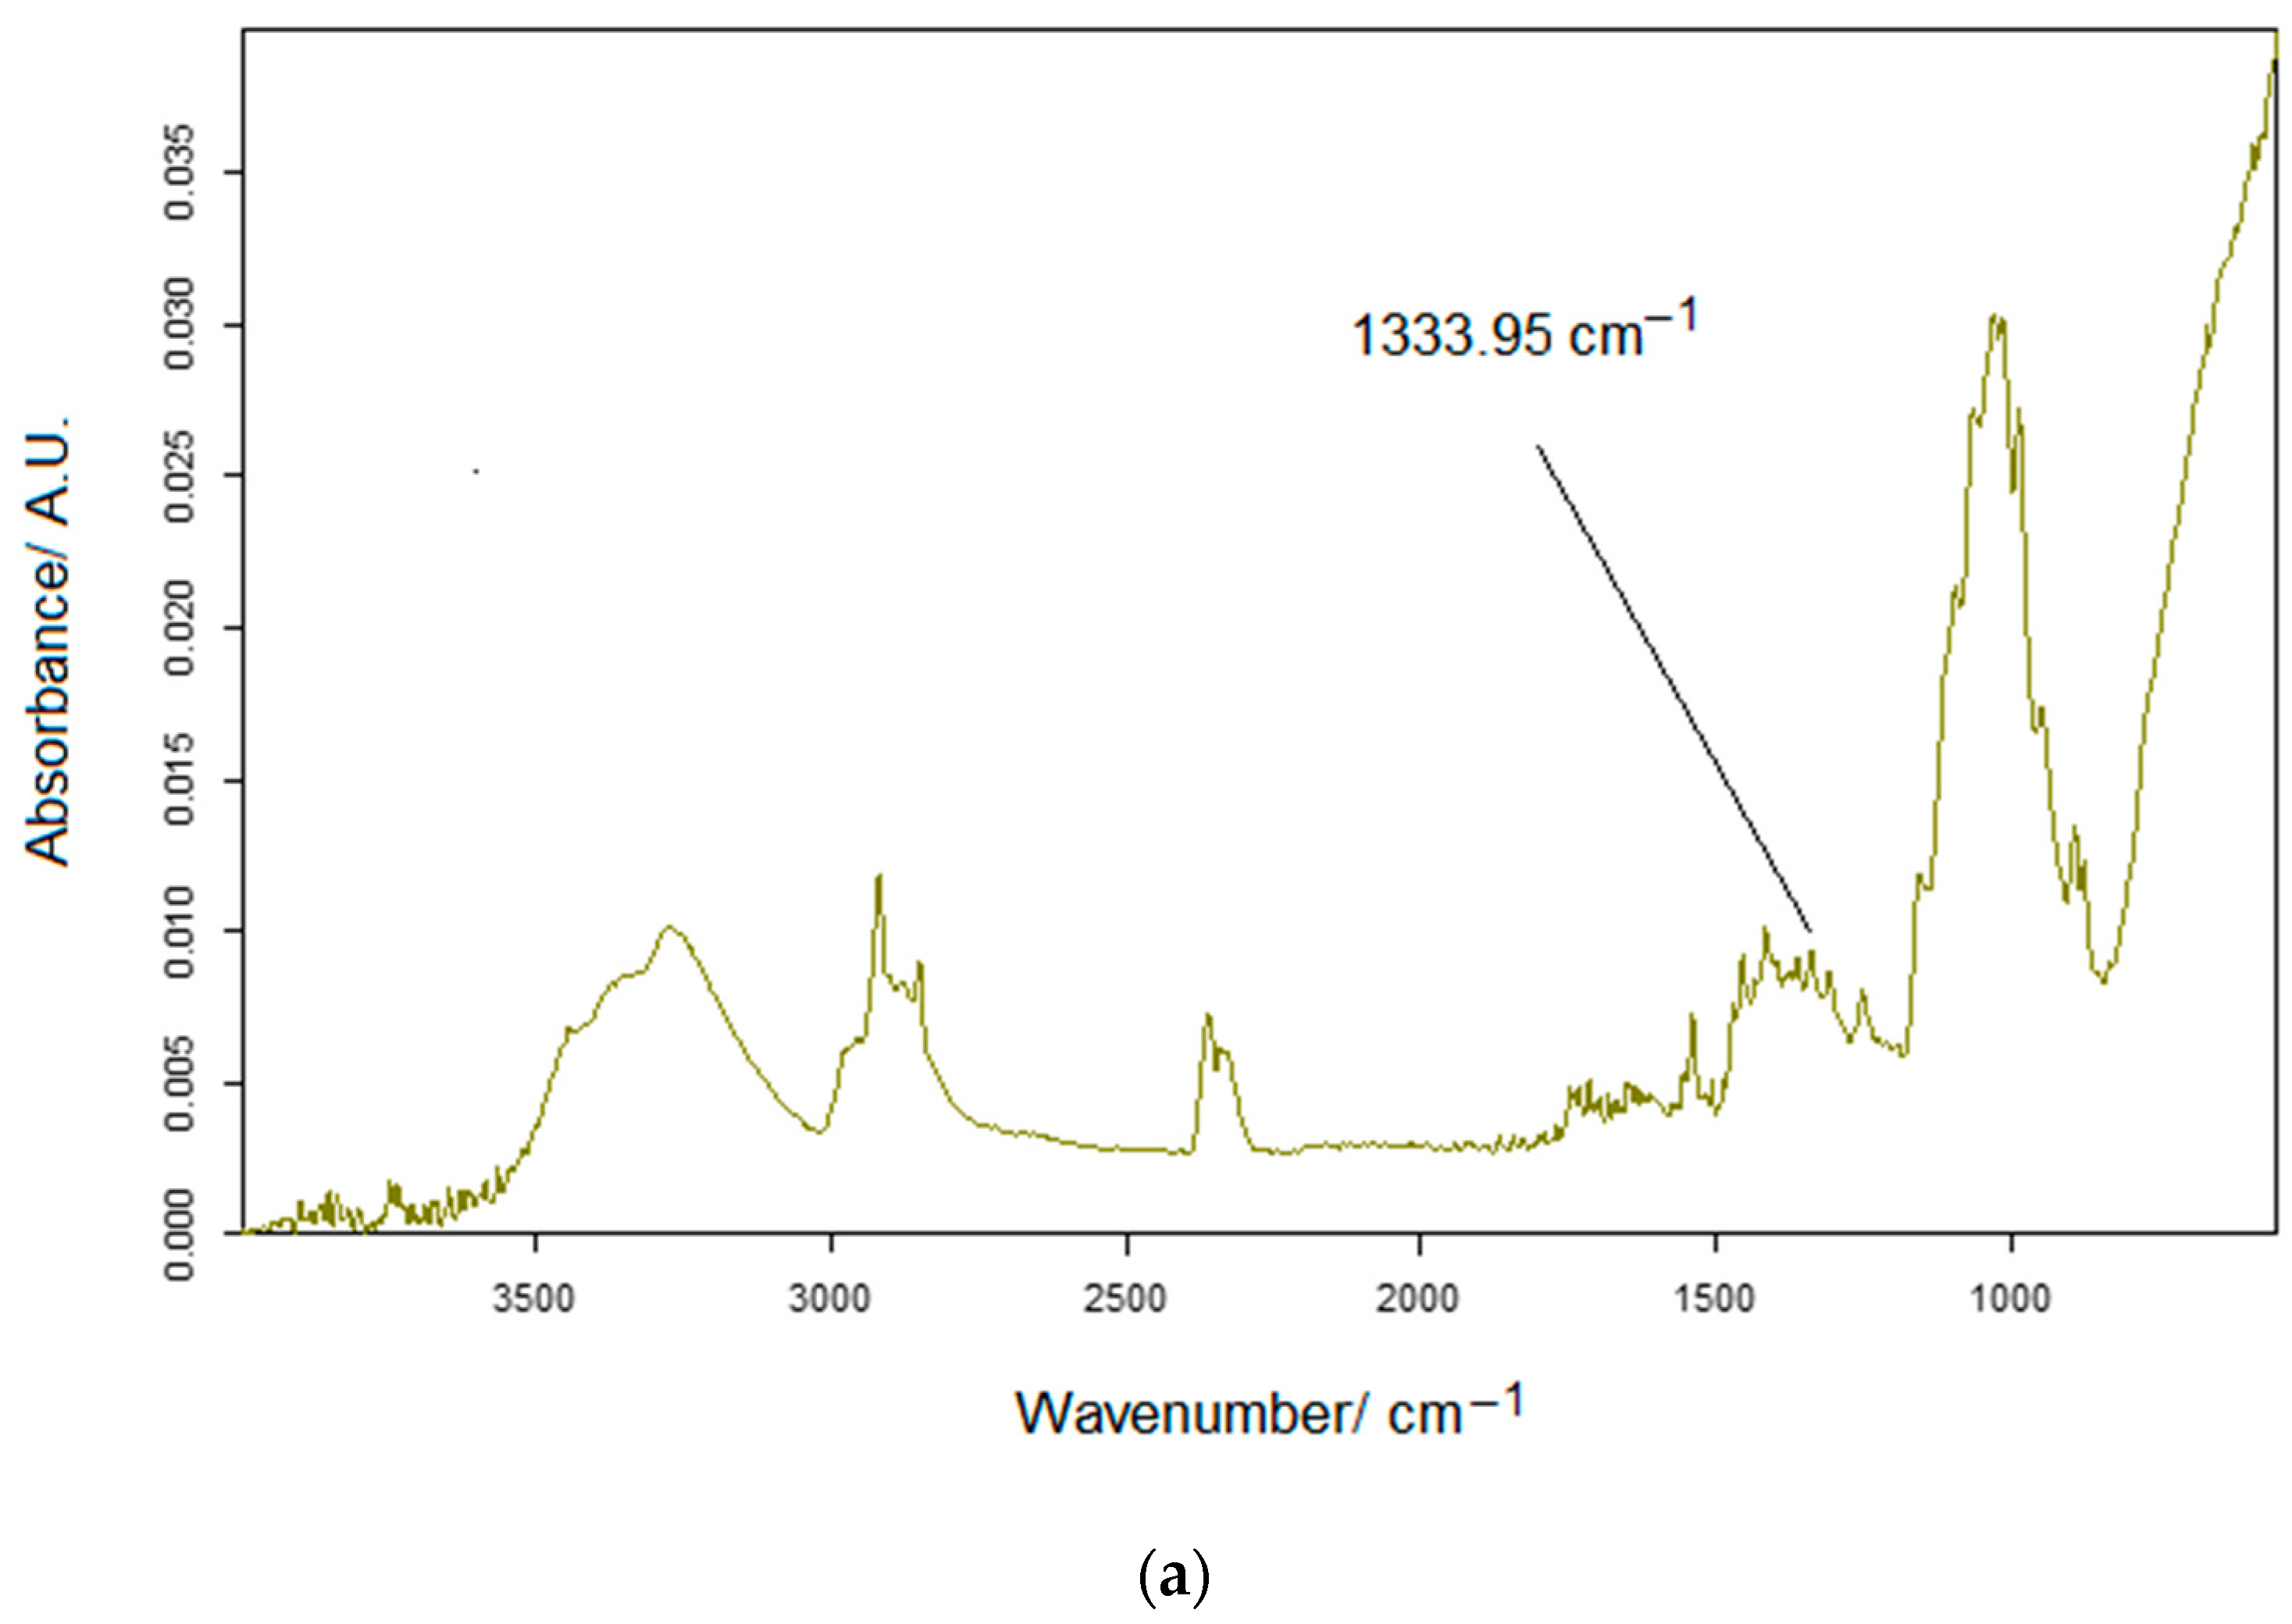
2.3. Spectrometric Measurements

To validate the electrochemical results, FTIR spectra were recorded using a Bruker ALPHA FT-IR spectrometer (BrukerOptik GmbH, Ettlingen, Germany) connected to OPUS software (BrukekrOptik GmbH, Ettlingen, Germany). FTIR spectra were recorded in attenuated total reflectance (ATR) mode, in the range of 4000–500 cm−1 (32 scans, resolution 4 cm−1), against air (background). The ATR ZnSe crystal was cleaned with ultrapure water and isopropanol between measurements.

2.4. Pharmaceutical Samples and Preparation of Solutions to Be Analyzed

The pharmaceutical products selected for the analysis are prescription drugs available in the pharmacy, with the active compound rosuvastatin 20 mg (trade name Crestor 20 mg) and simvastatin 20 mg (trade name Simvacard 20 mg).
Crestor 20 mg is a film-coated tablet and contains rosuvastatin 20 mg as rosuvastatin calcium 20.80 mg/tablet. The other components are lactose monohydrate, microcrystalline cellulose, calcium phosphate, Crospovidone, magnesium stearate, film-lactose monohydrate, hypromellose, glycerol triacetate, titanium dioxide (E 171), and red iron oxide (E 172).
Zentiva produces Simvacard (20 mg) in oval, biconvex, white film-coated tablets with a median line on both sides, marked with “SVT 20” on one side. The active substance is simvastatin, and the other components are (a) the tablet core, consisting of anhydrous lactose, pregelatinized starch, talc, microcrystalline cellulose, butylhydroxyanisole, magnesium stearate and (b) the tablet film, consisting of hydroxypropyl cellulose, hypromellose, titanium dioxide (E171), talc.
To prepare the stock solution, three tablets of each product were triturated and dissolved in ultrapure water one at a time. Before trituration, the film on the tablet surface was removed by rinsing with ultrapure water. The suspensions were subjected to ultrasonication, then filtered through filter paper, and the supernatant was collected. The residue left on the filter paper was removed. The filtered solution was dried in an oven at 105 °C for one hour. The powder obtained after drying was analyzed via the FTIR method. Because the statin was extracted from the pharmaceutical forms, the purification of the active compound was ensured. Later, stock solutions were prepared in a concentration of 30 µM by dissolving the powder in a mixture of 0.1 M KCl solution and 10−2 M HCl aqueous solution (pH 2) in the case of rosuvastatin and 0.1 M KCl solution in the case of simvastatin. For homogeneity and clarity, the solutions were ultrasonicated again with the help of the Elma S10H Elmasonic device. The same procedure was applied to prepare samples of pharmaceutical products to quantify statins, with the difference that a single tablet was triturated and dissolved for each solution. All pharmaceutical samples were analyzed in triplicate.

3. Results and Discussion

3.1. Characterization of the Active Surface of the Sensors

In the first stage of the study, the two sensors were analyzed via electrochemical impedance spectroscopy (EIS). Using this technique, the processes of charge transfer, mass transfer, and diffusion could be explored, providing information on the properties of nanomaterials, such as conductance or resistance to electron transfer. The three electrodes were connected to perform the EIS analysis, and a potential of 10 mV was applied in the frequency range 1 Hz–100 kHz, producing a Nyquist diagram. This diagram provides data on solution-produced resistance (Rs), charge transfer resistance (Rct), and Warburg impedance (W) [24]. The diameter of the semicircle obtained in the impedance spectrum is equal to the charge transfer resistance (Rct). Rct is related to the charge transfer kinetics of the redox probe at the electrode interface [34].
The two sensors were immersed one after the other in an electrolyte consisting of K3[Fe(CN)6]/K4[Fe(CN)6] 5·10−4 M/5·10−4 M − KCl 0.1 M, and the electrochemical process was transposed in the form of a Randles equivalent circuit that simply presents the solution resistance (Rs), the charge transfer resistance (Rct), the double layer capacitance at the electrode surface (CdI), and the Warburg resistance (Zw) [35]. As shown in Figure S1, the Nyquist diagrams obtained in this study appear to be a semicircle specific to the Randles circuit. Furthermore, since there is a diffusion process of molecules on the sensors’ surface, the diagrams print an additional resistance called Warburg impedance, represented by a slope that appears to the right of the semicircle [33].
The Rct value was 54,304.4 Ω for the SPCE electrode, and the AuNP-MWCNTs/SPCE recorded a considerably lower Rct value, 25,555.3 Ω.
The difference in the value of Rct between the two sensors suggests that AuNP-MWCNTS/SPCE possesses better electrocatalytic activity, mainly due to the synergy between the properties of gold nanoparticles and those of carbon nanotubes. This electrochemical behavior follows the specifications in the literature [34,36].

3.2. Characterization of the Electrochemical Behavior of Sensors in Catechol Solution

In this section, the electrochemical behavior of the two electrodes, SPCE and AuNP-MWCNTs/SPCE, in a solution of catechol 10−3 M − KCl 0.1 M was evaluated using cyclic voltammetry. The signal recordings were made in a potential range of −0.4 V and +1.2 V at a scanning rate of 0.1 V/s (Figure S2).
As shown in Figure S2, the oxidation-reduction process of catechol on the sensor’s surface is noticeable in both cases. Furthermore, both stable and quasi-reversible peaks are well highlighted in both cases, with very low background noise. The most important experimentally obtained electrochemical parameters and the characteristics of the two sensors are presented in Table S1.
The values of the parameters from Table S1 confirm the superior electrochemical behavior of the sensor modified with carbon nanotubes and gold particles compared to the one based on carbon. The lower values of ΔE and E1/2 show better reversibility of AuNP-MWCNTs/SPCE. Additionally, in the case of AuNP-MWCNTs/SPCE, the current intensities are higher, and the peaks have a well-defined appearance. However, both sensors show stability and efficient sensitivity, and the quasi-reversible redox process of catechol is well highlighted, in accordance with the reporting of other studies [37].
By recording the cyclic voltammograms at different scanning rates (0.1–1.0 V/s), the determining stage of the electrochemical process is established, and the active area of the sensors will be calculated. Since, in both cases, the anodic peak presents a higher current intensity, this will be taken into account for establishing the linear regression.
The recorded cyclic voltammograms show that the intensity of catechol oxidation currents increases proportionally both with the scanning rate and with the square root of the scanning rate. However, performing the linear regressions for both situations, it is observed that there is better linearity between the current of the anodic peak (Ipa) and the square root of the scanning rate in the case of both sensors, as seen in Figure S3. The determination of the active area of the electrodes was based on the number of electrons involved in the redox process of catechol, which is known to be a two-electron transfer process.
Therefore, the electrochemical process at the electrode level work is predominantly controlled by catechol diffusion, as specified in previous papers.
The linear dependences between Ipa and v1/2 and the application of the Randles–Sevcik equation ( I p a = 268,600 × n 3 2 × A × D 1 2 × C v 1 2 ) [38,39] were used to calculate the active area of the electrodes.
This is considered the diffusion coefficient of catechol, D = 8.5 × 10⁻⁶ cm2 × s−1 [40].
Table S2 shows the values obtained for the active surface area and the roughness factor of the two working electrodes.
AuNP-MWCNTs/SPCE has an active surface area approximately six times larger (0.7791 cm2) and SPCE about five times larger than their geometric area (0.6675 cm2). Furthermore, AuNP-MWCNTs/SPCE has a noticeably higher sensitivity due to the presence of carbon nanotubes and gold nanoparticles. Due to the synergy between the two nanomaterials, the electrical and mechanical properties improve considerably, favoring a rapid electron transfer [41,42,43]. The subsequent results can be better than in the case of SPCE.

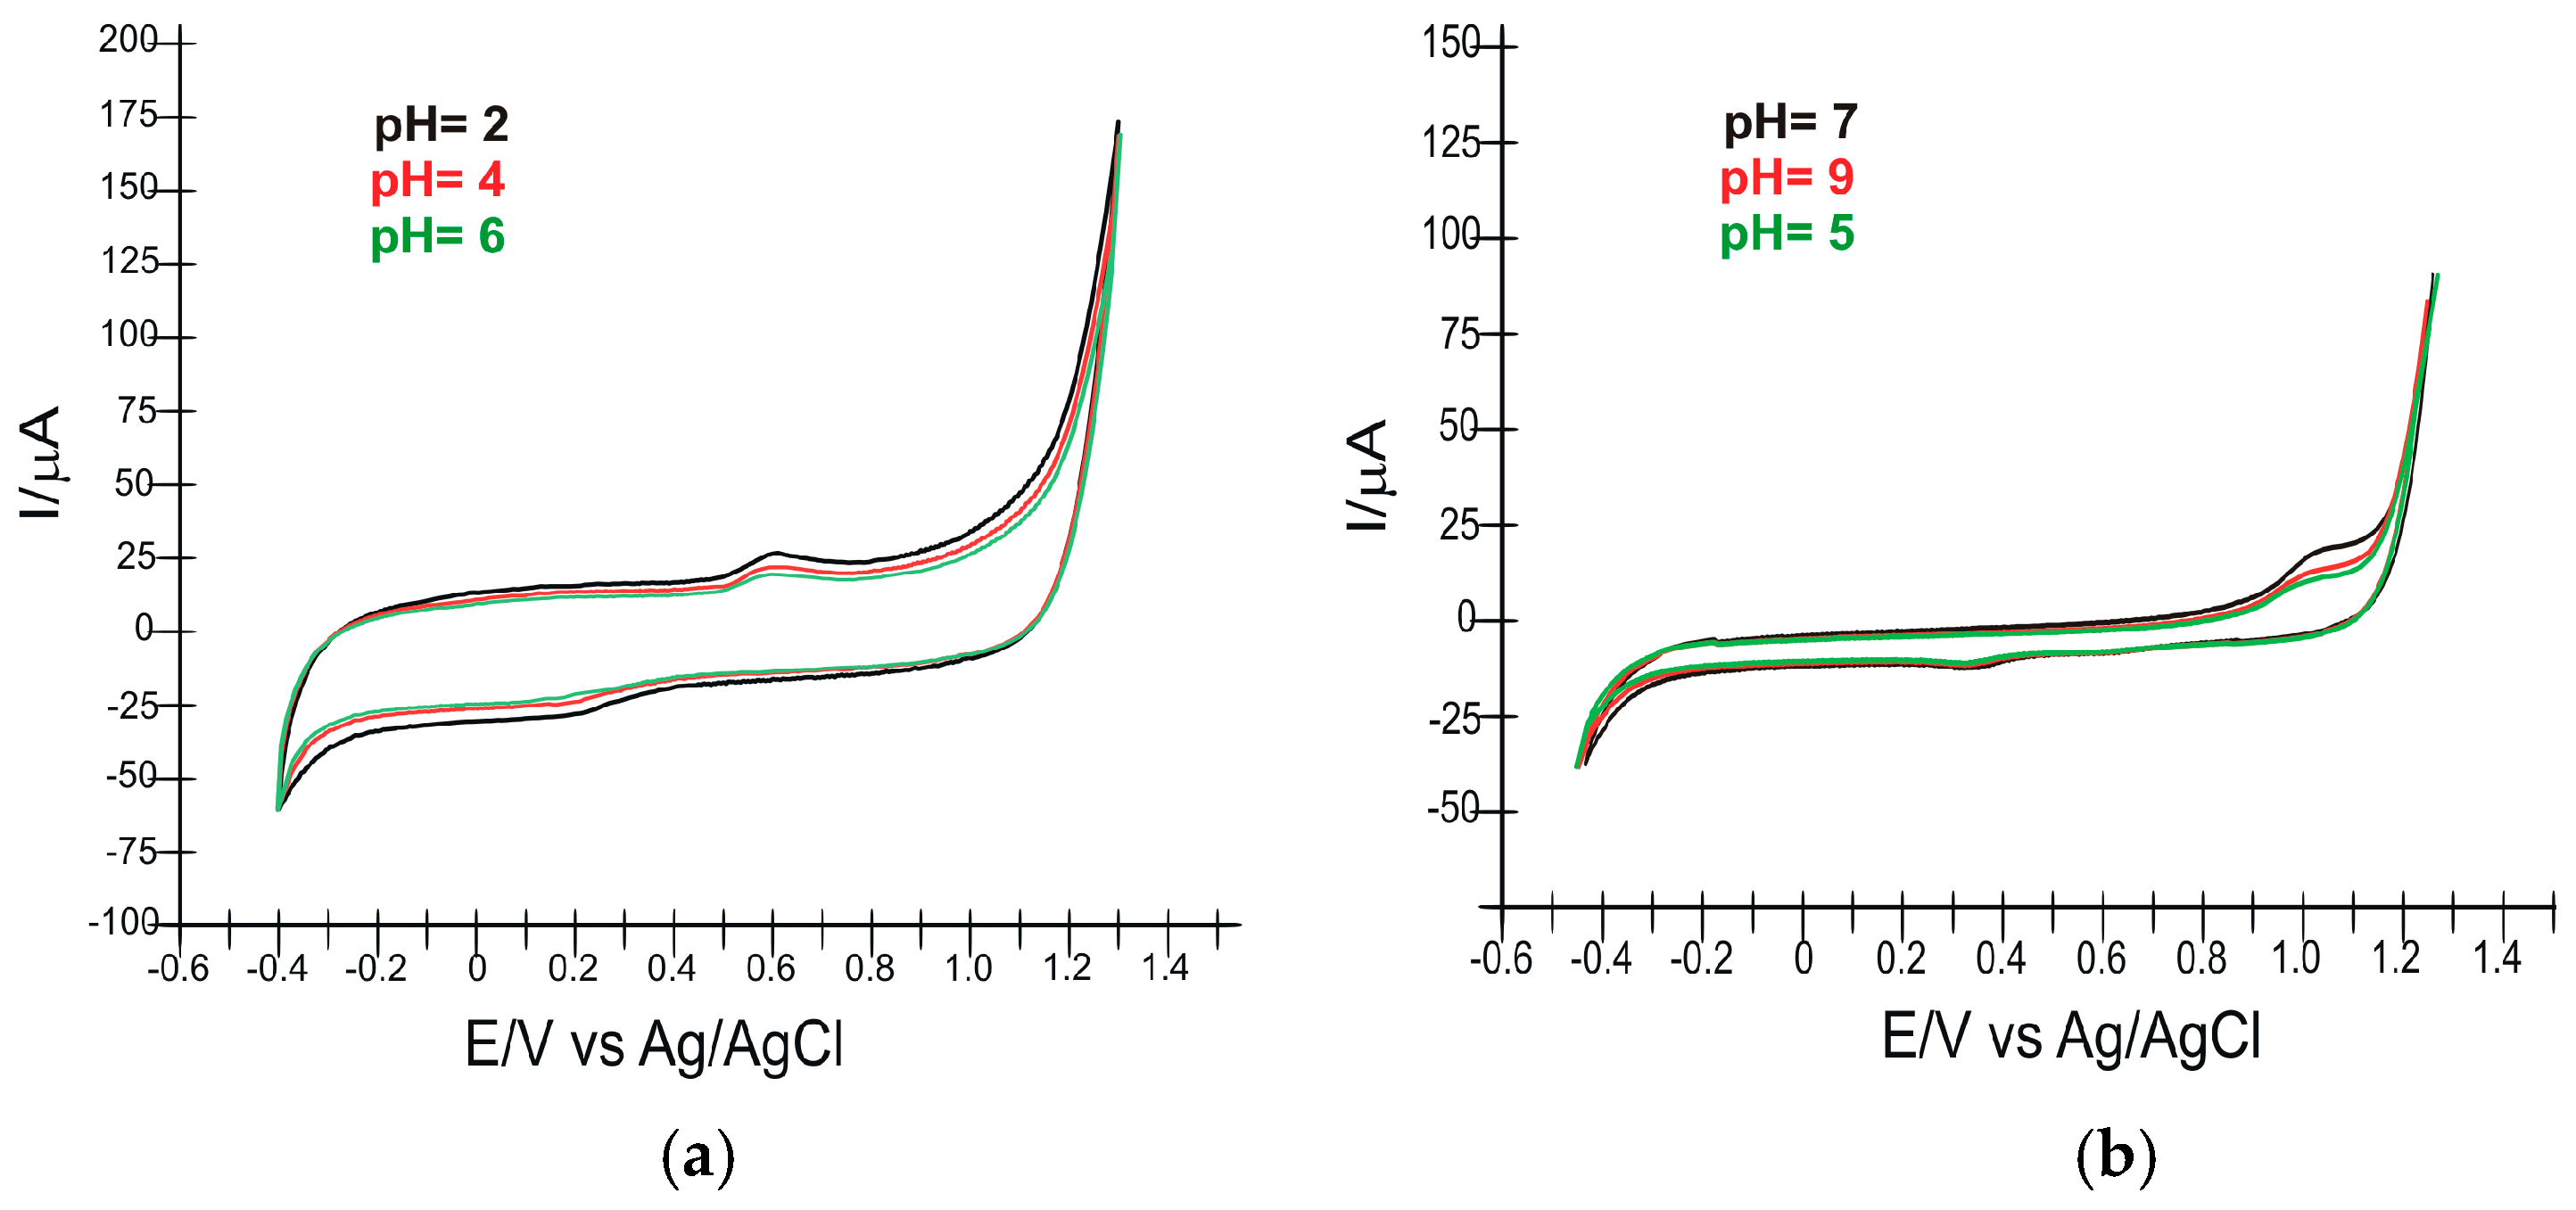
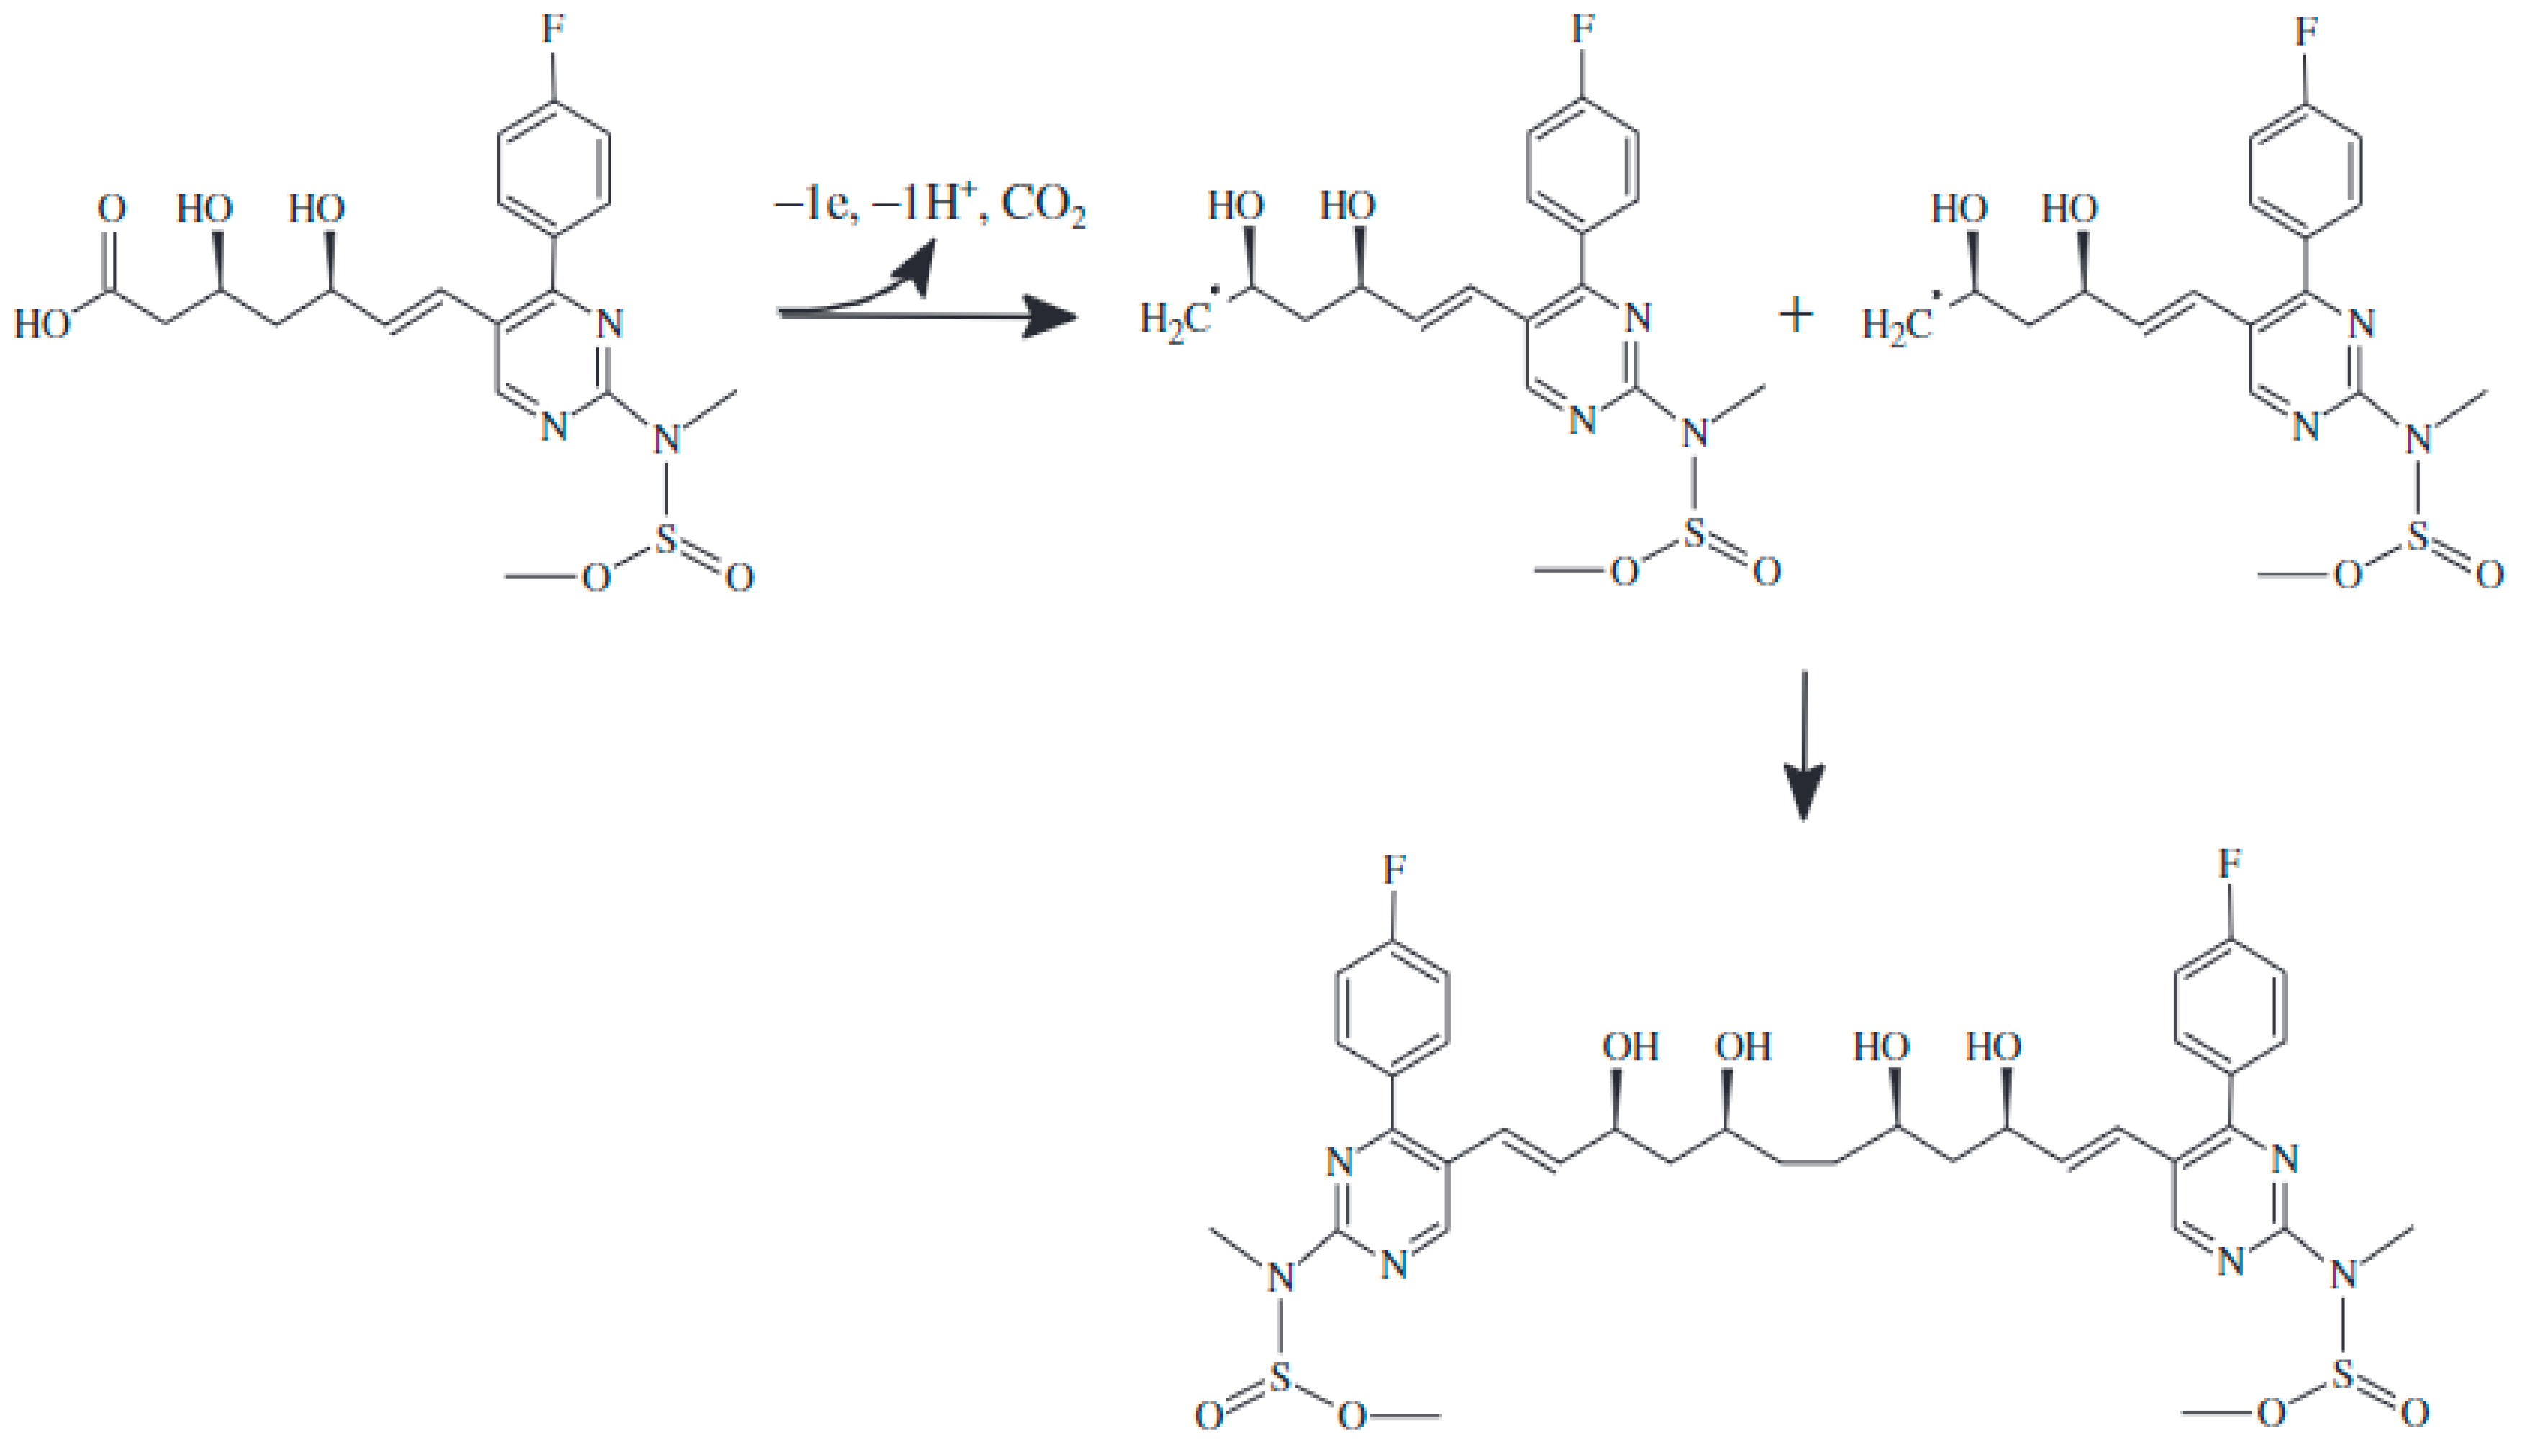
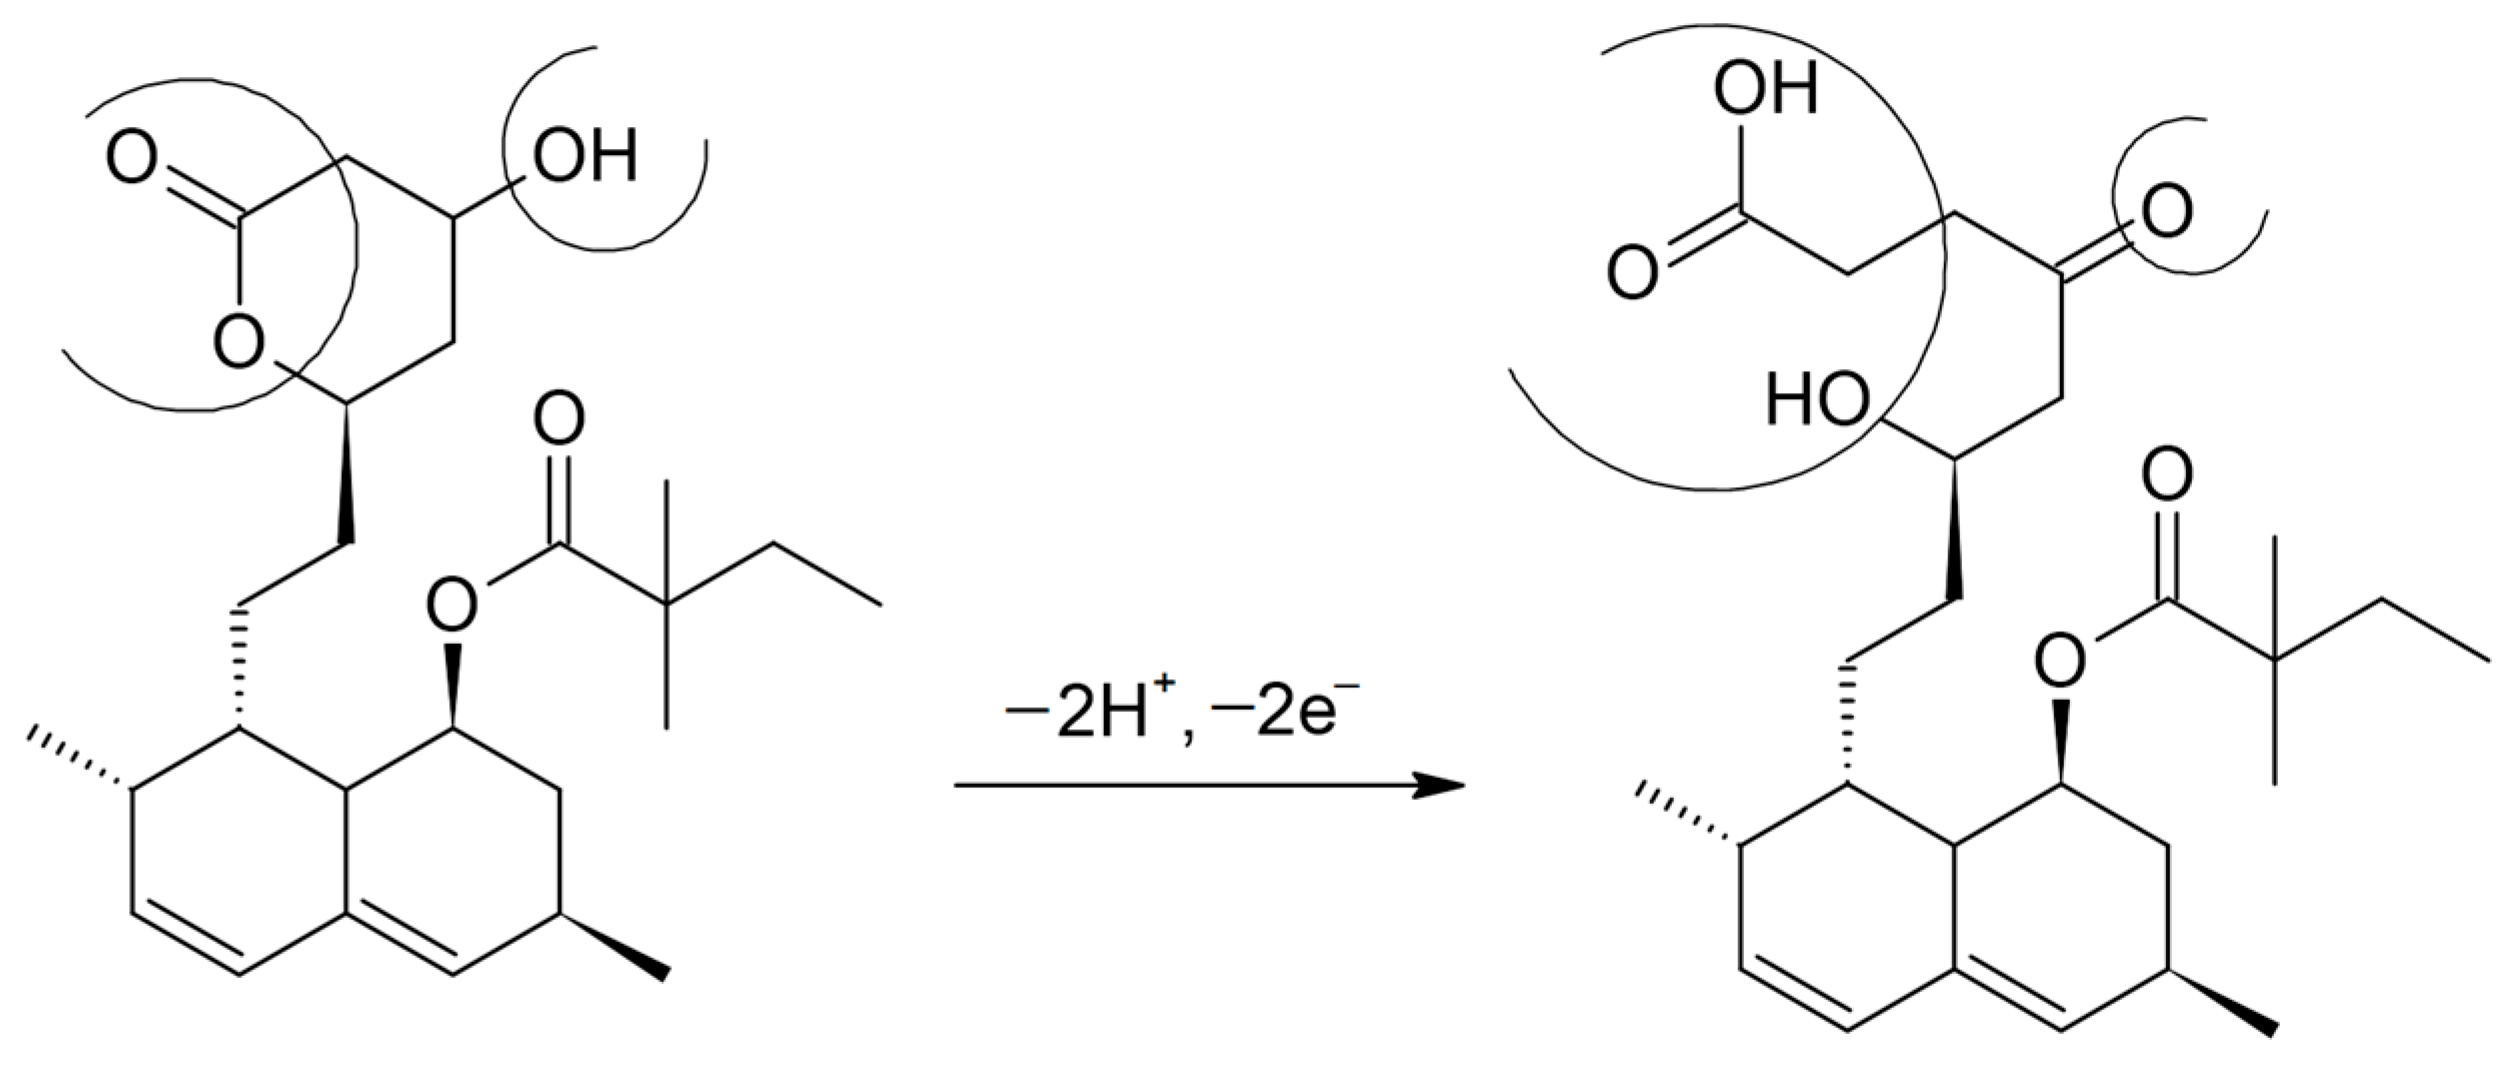
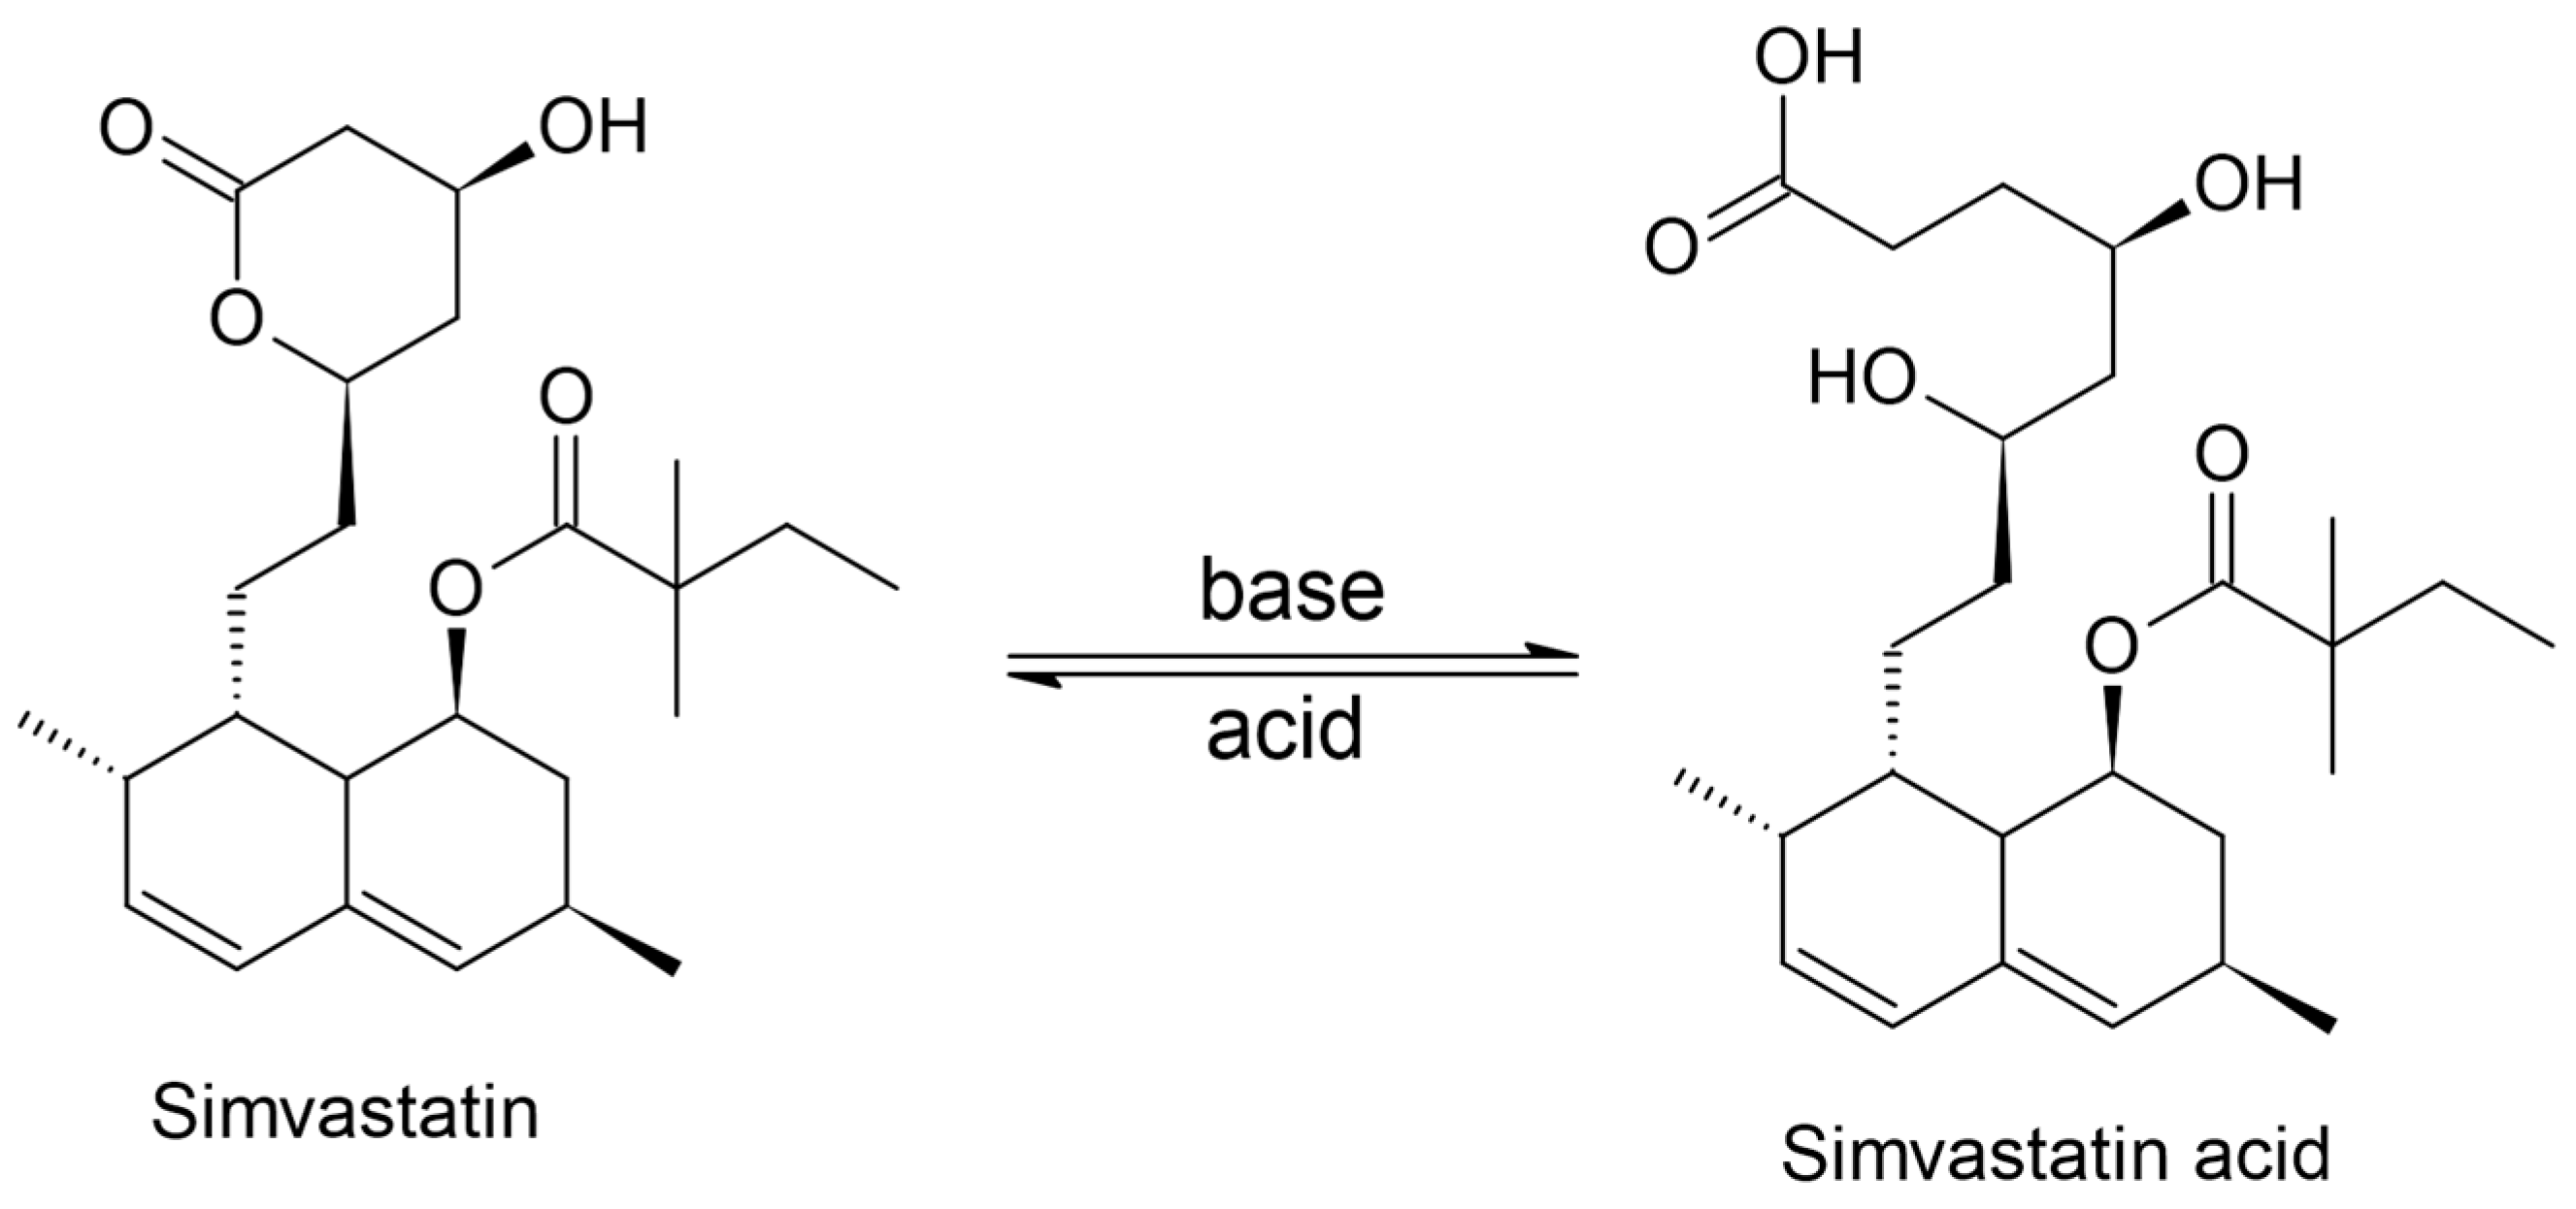
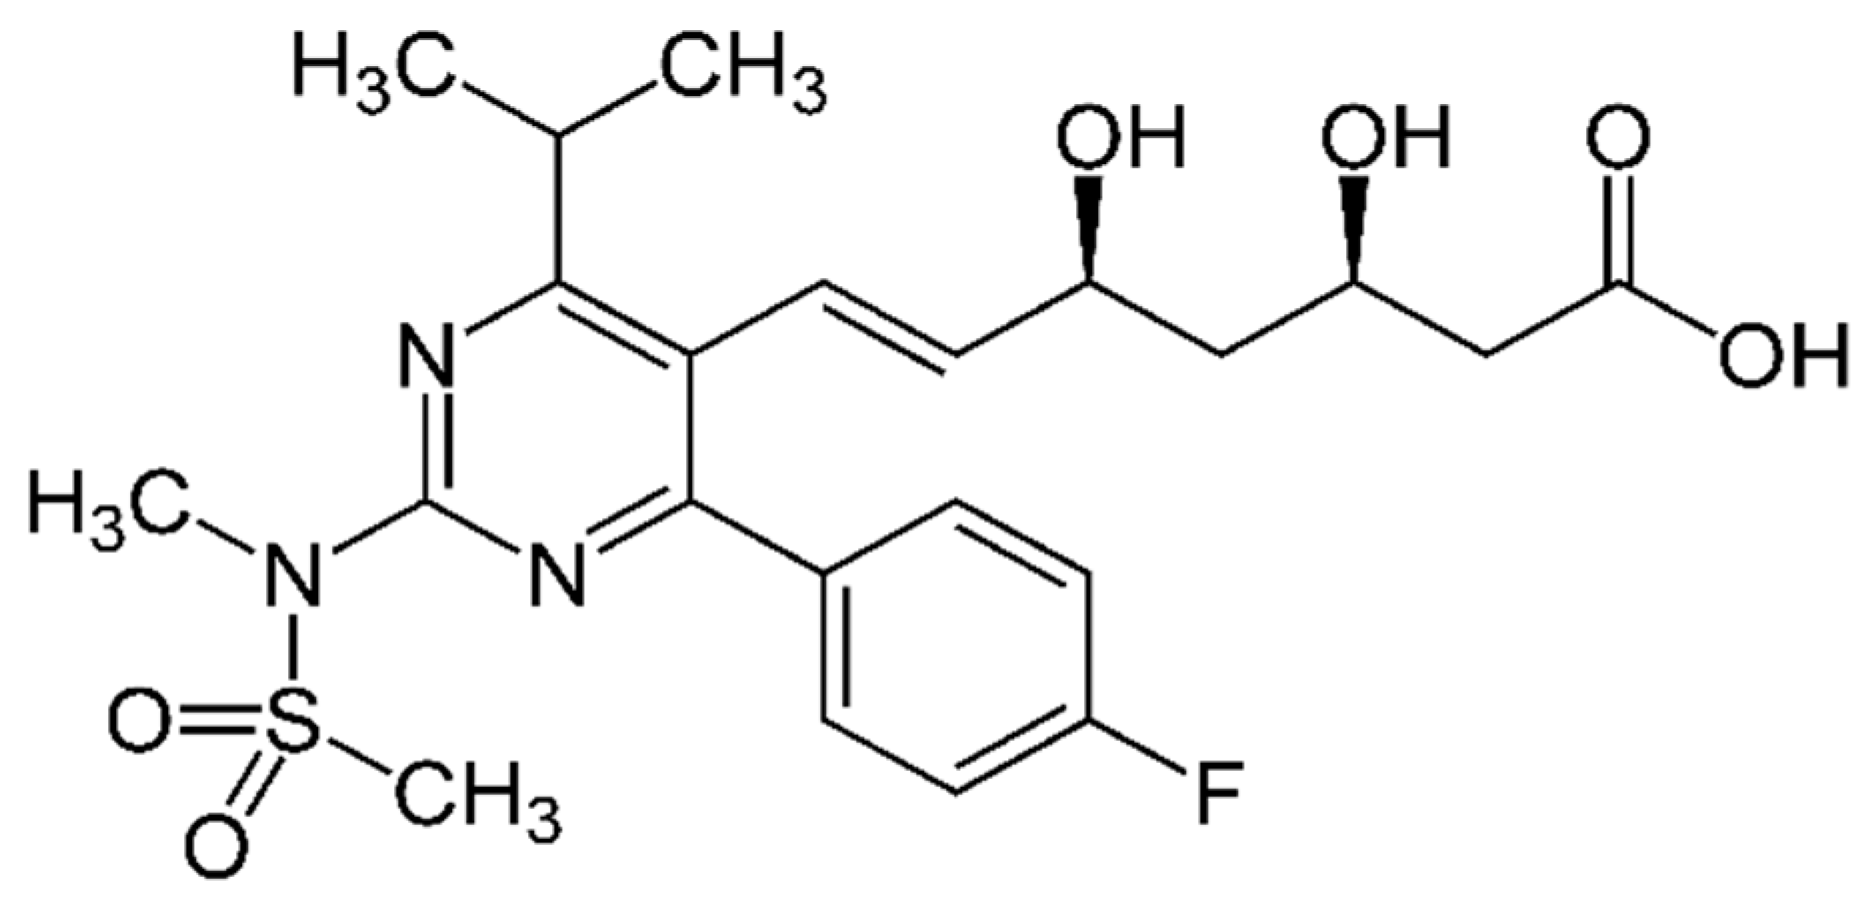
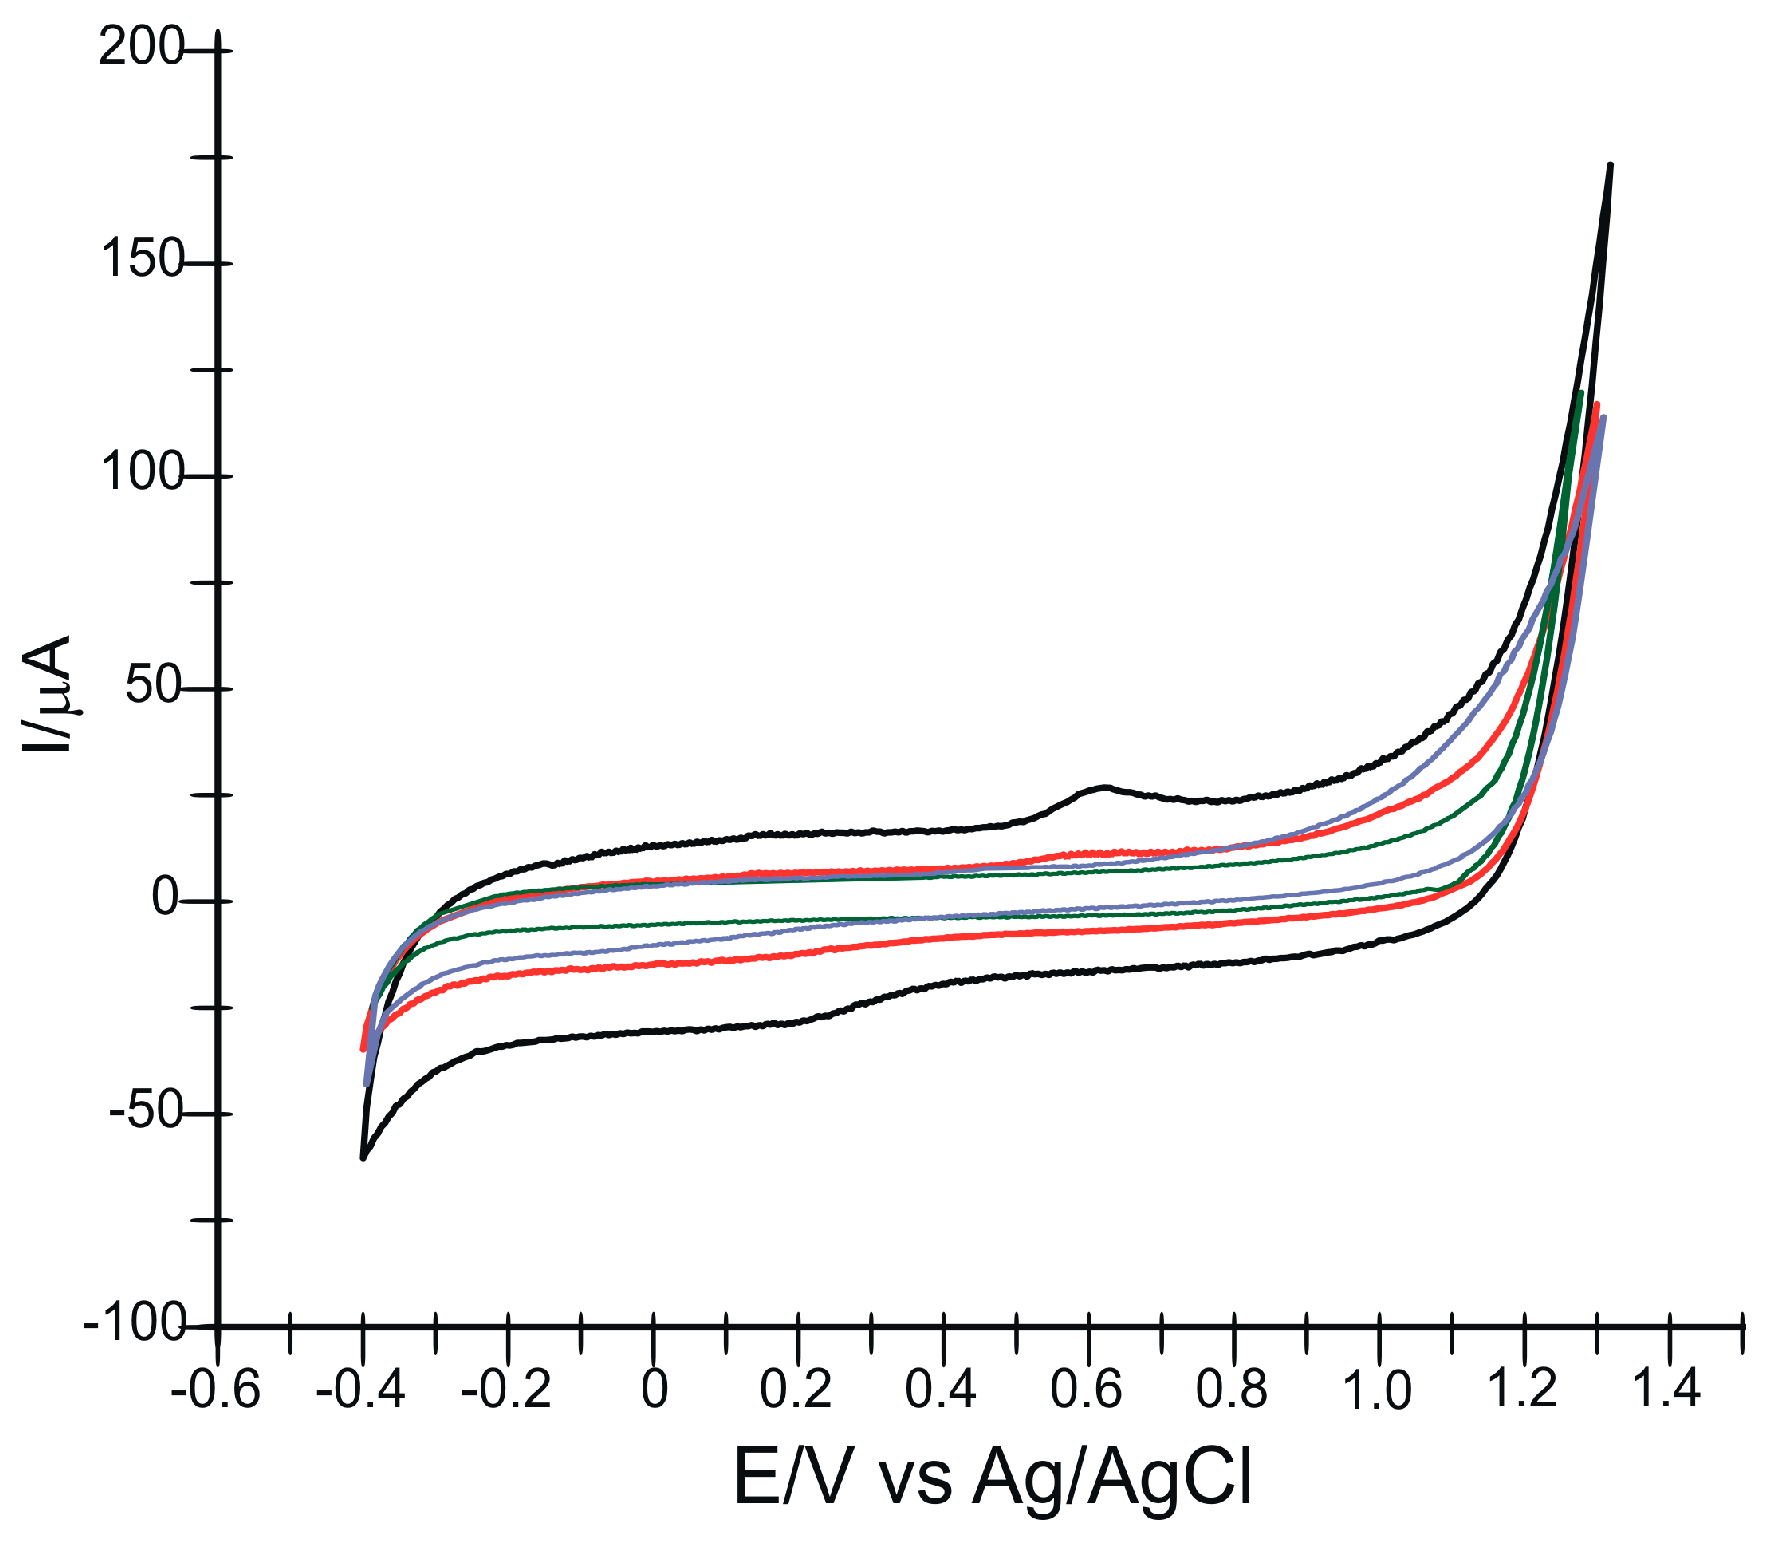
3.3. Study of the Electrochemical Behavior of the Sensors in Rosuvastatin and Simvastatin Solutions

Next, the redox behavior of rosuvastatin was analyzed using the two working electrodes. pH optimization was carried out in the range of 2.0 to 6.0 for rosuvastatin and 5.0 to 9.0 for simvastatin. In the case of rosuvastatin, it was observed that the current intensity decreases with increasing pH, while for simvastatin, the highest and well-defined current was obtained at pH = 7.0 (Figure 3 and Figure S4). These results are consistent with previously published studies [44,45].
Figure 4 shows the cyclic voltammograms of SPCE and AuNP-MWCNTs/SPCE in support electrolyte solution (0.1 M KCl −10−2 M HCl) vs. a 30 µM rosuvastatin solution.
As can be seen, an oxidation process was triggered at 0.58 V for SPCE and 0.65 V for AuNP-MWCNTs/SPCE during anodic scanning. According to other previous studies, the oxidation process of rosuvastatin is irreversible [16,45]. In this reaction, the protonated carboxyl group loses a proton and an electron in an irreversible oxidation reaction, forming an unstable carboxylic radical species. Due to this instability, the carboxyl radical quickly loses CO2, resulting in a carbocation. The carbocation undergoes a coupling reaction to produce a dimer. The proposed scheme for the oxidation reaction of rosuvastatin is shown in Figure 5.
The same sensors were also used to study the redox behavior of simvastatin in a solution with the same concentration of 30 µM. Figure 6 shows the oxidation of simvastatin in the case of the modified sensor. The lack of oxidation peak when using SPCE could be explained by the reduced concentration of statin in the solution to be analyzed. Additionally, the higher capacitive current observed with the SPCE sensor could contribute to the lack of an oxidation peak as it may overshadow the oxidation peak of simvastatin, making it difficult to detect.
It is important to note that the absence of an oxidation peak for simvastatin with the SPCE sensor in this specific experimental setup does not necessarily imply the complete absence of simvastatin oxidation.
When the AuNP-MWCNTs/SPCE is immersed in the simvastatin solution, one oxidation peak is observed at +1.1 V with Ia = 17.75 μA. An irreversible process can also be noted in the case of simvastatin involving the transfer of two protons and two electrons (Figure 6). The chemical structure of simvastatin contains a β-hydroxy-lactone ring, which undergoes a ring-opening process during the electrochemical oxidation [46] (Figure 7).
By observing the aspect of the voltammograms recorded with the two electrodes in the statin solutions, it can be stated that these two compounds have similar electrochemical behavior, namely an irreversible oxidation process. Therefore, the differences in the intensity of the peaks, respectively, and the shift of the peaks’ potentials are related to the different processes taking place at the active surface of screen-printed electrode (carbon nanotubes and gold nanoparticles).

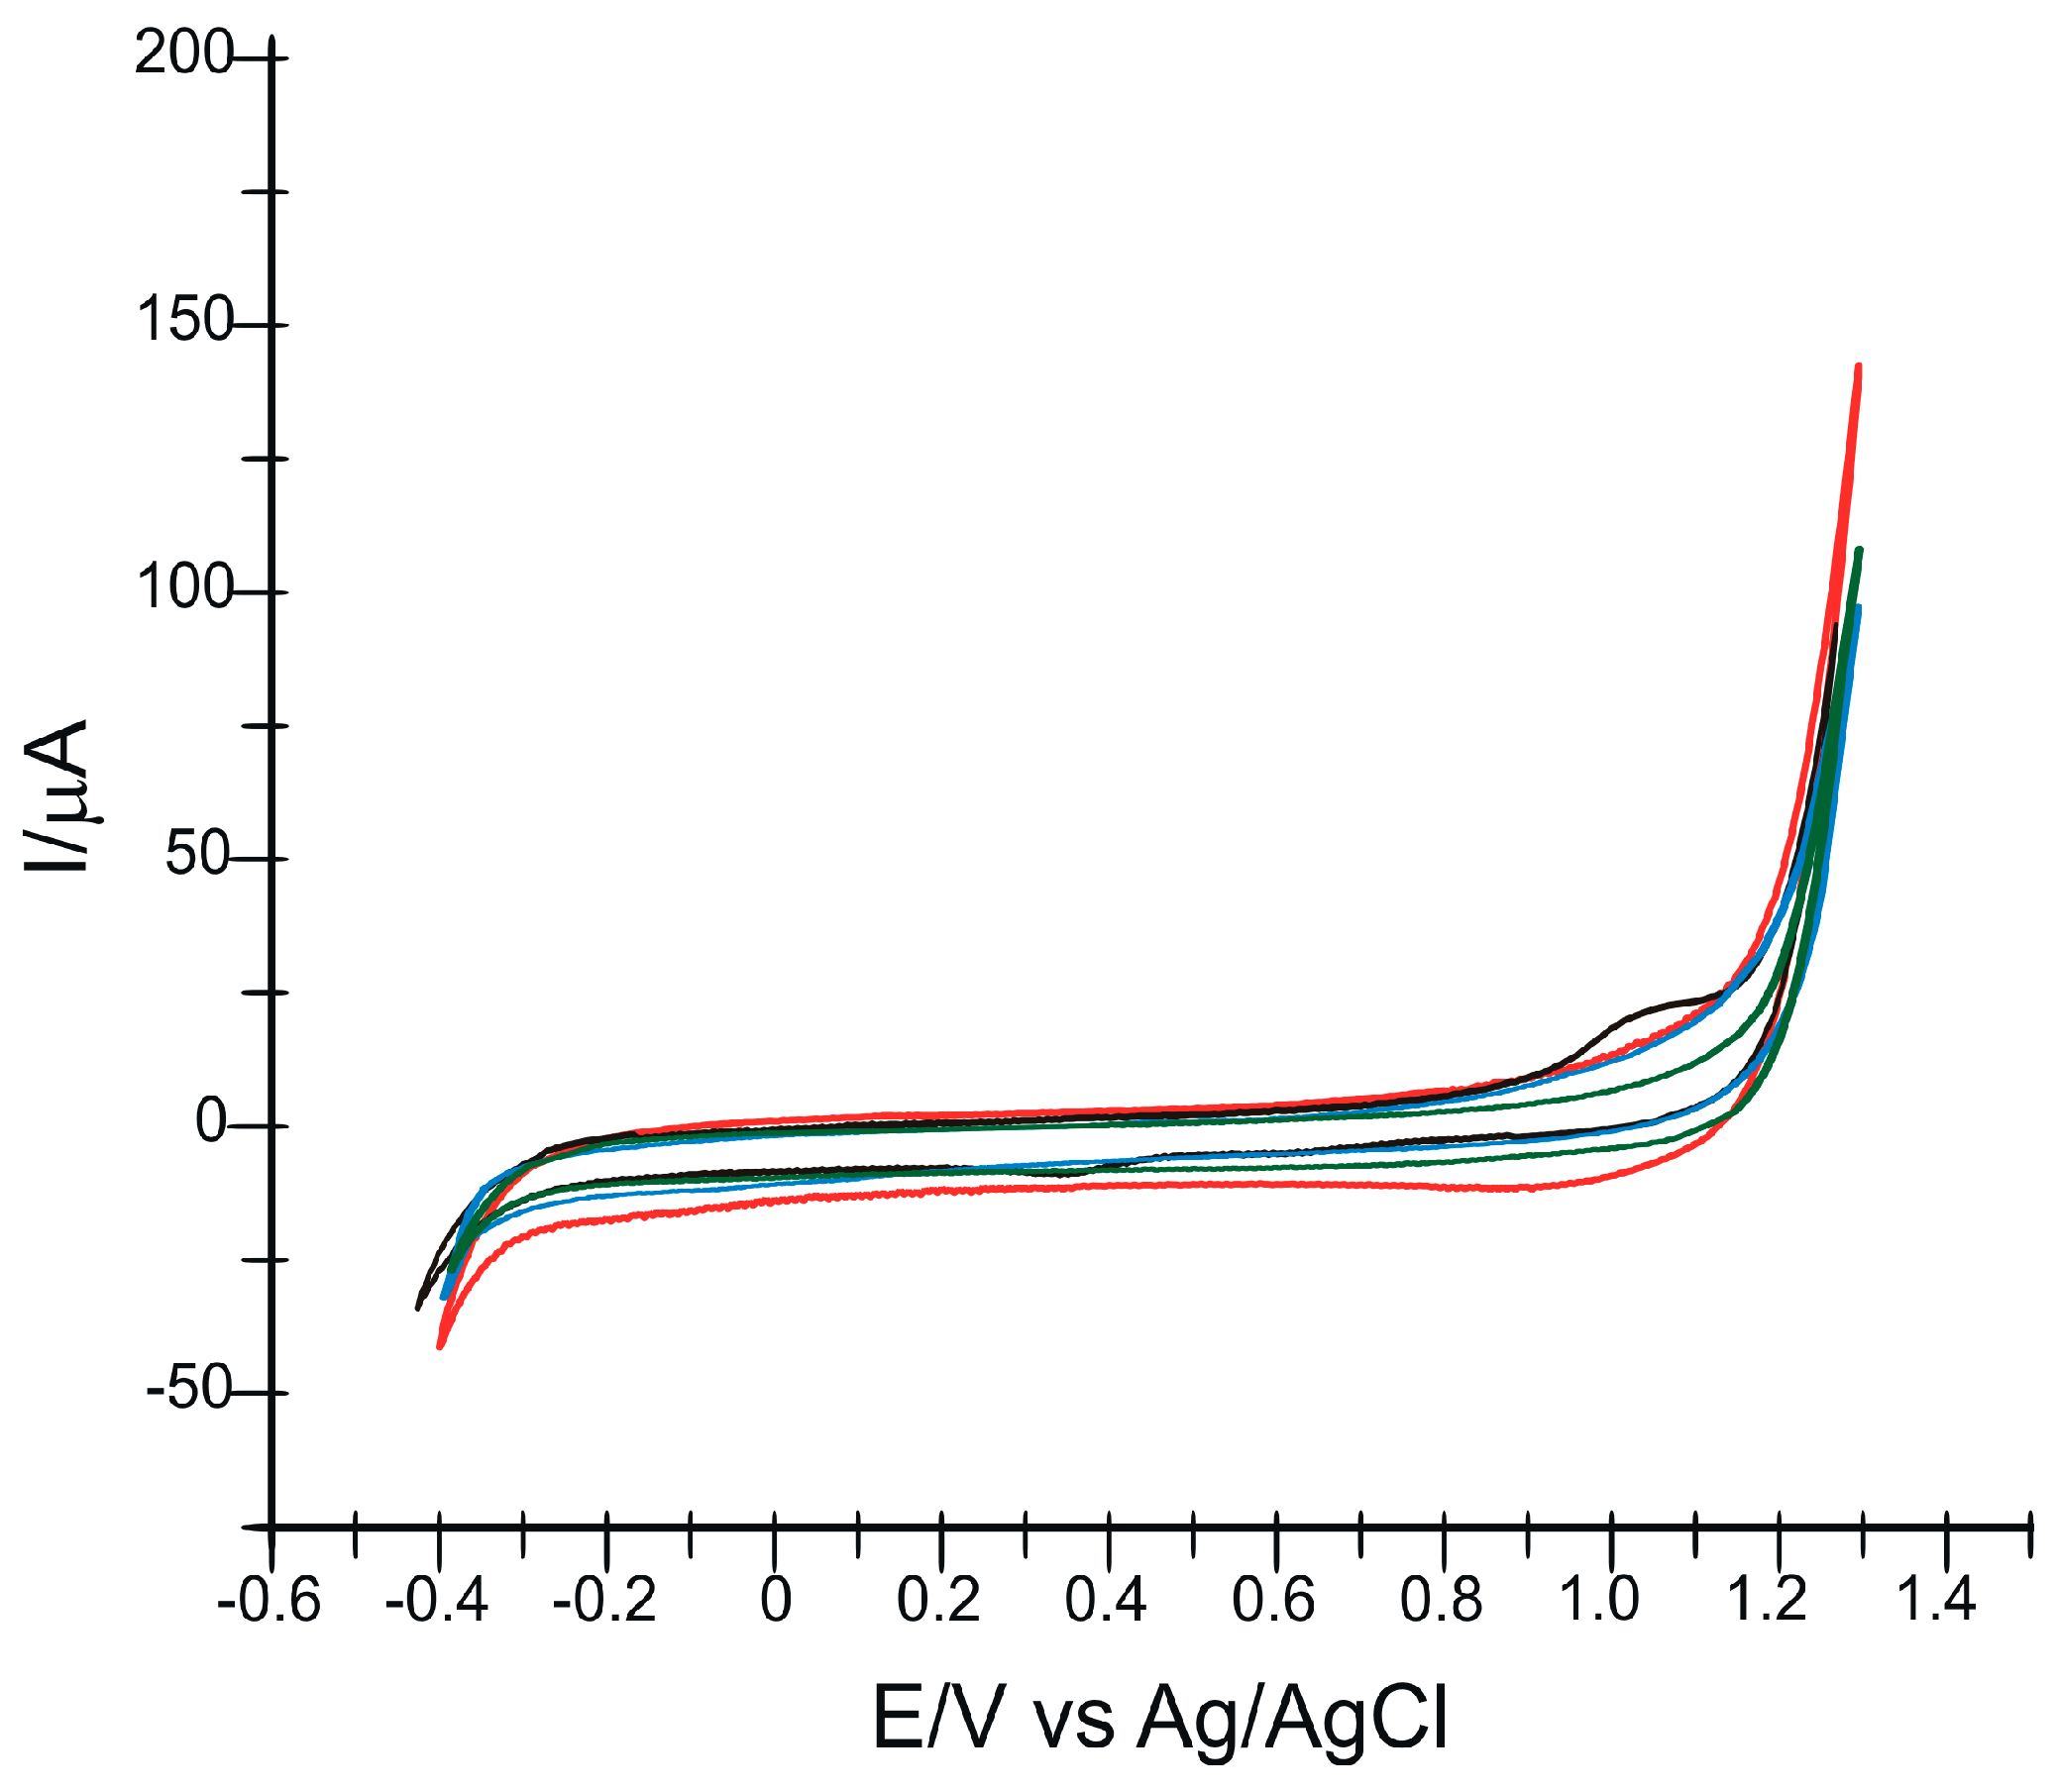
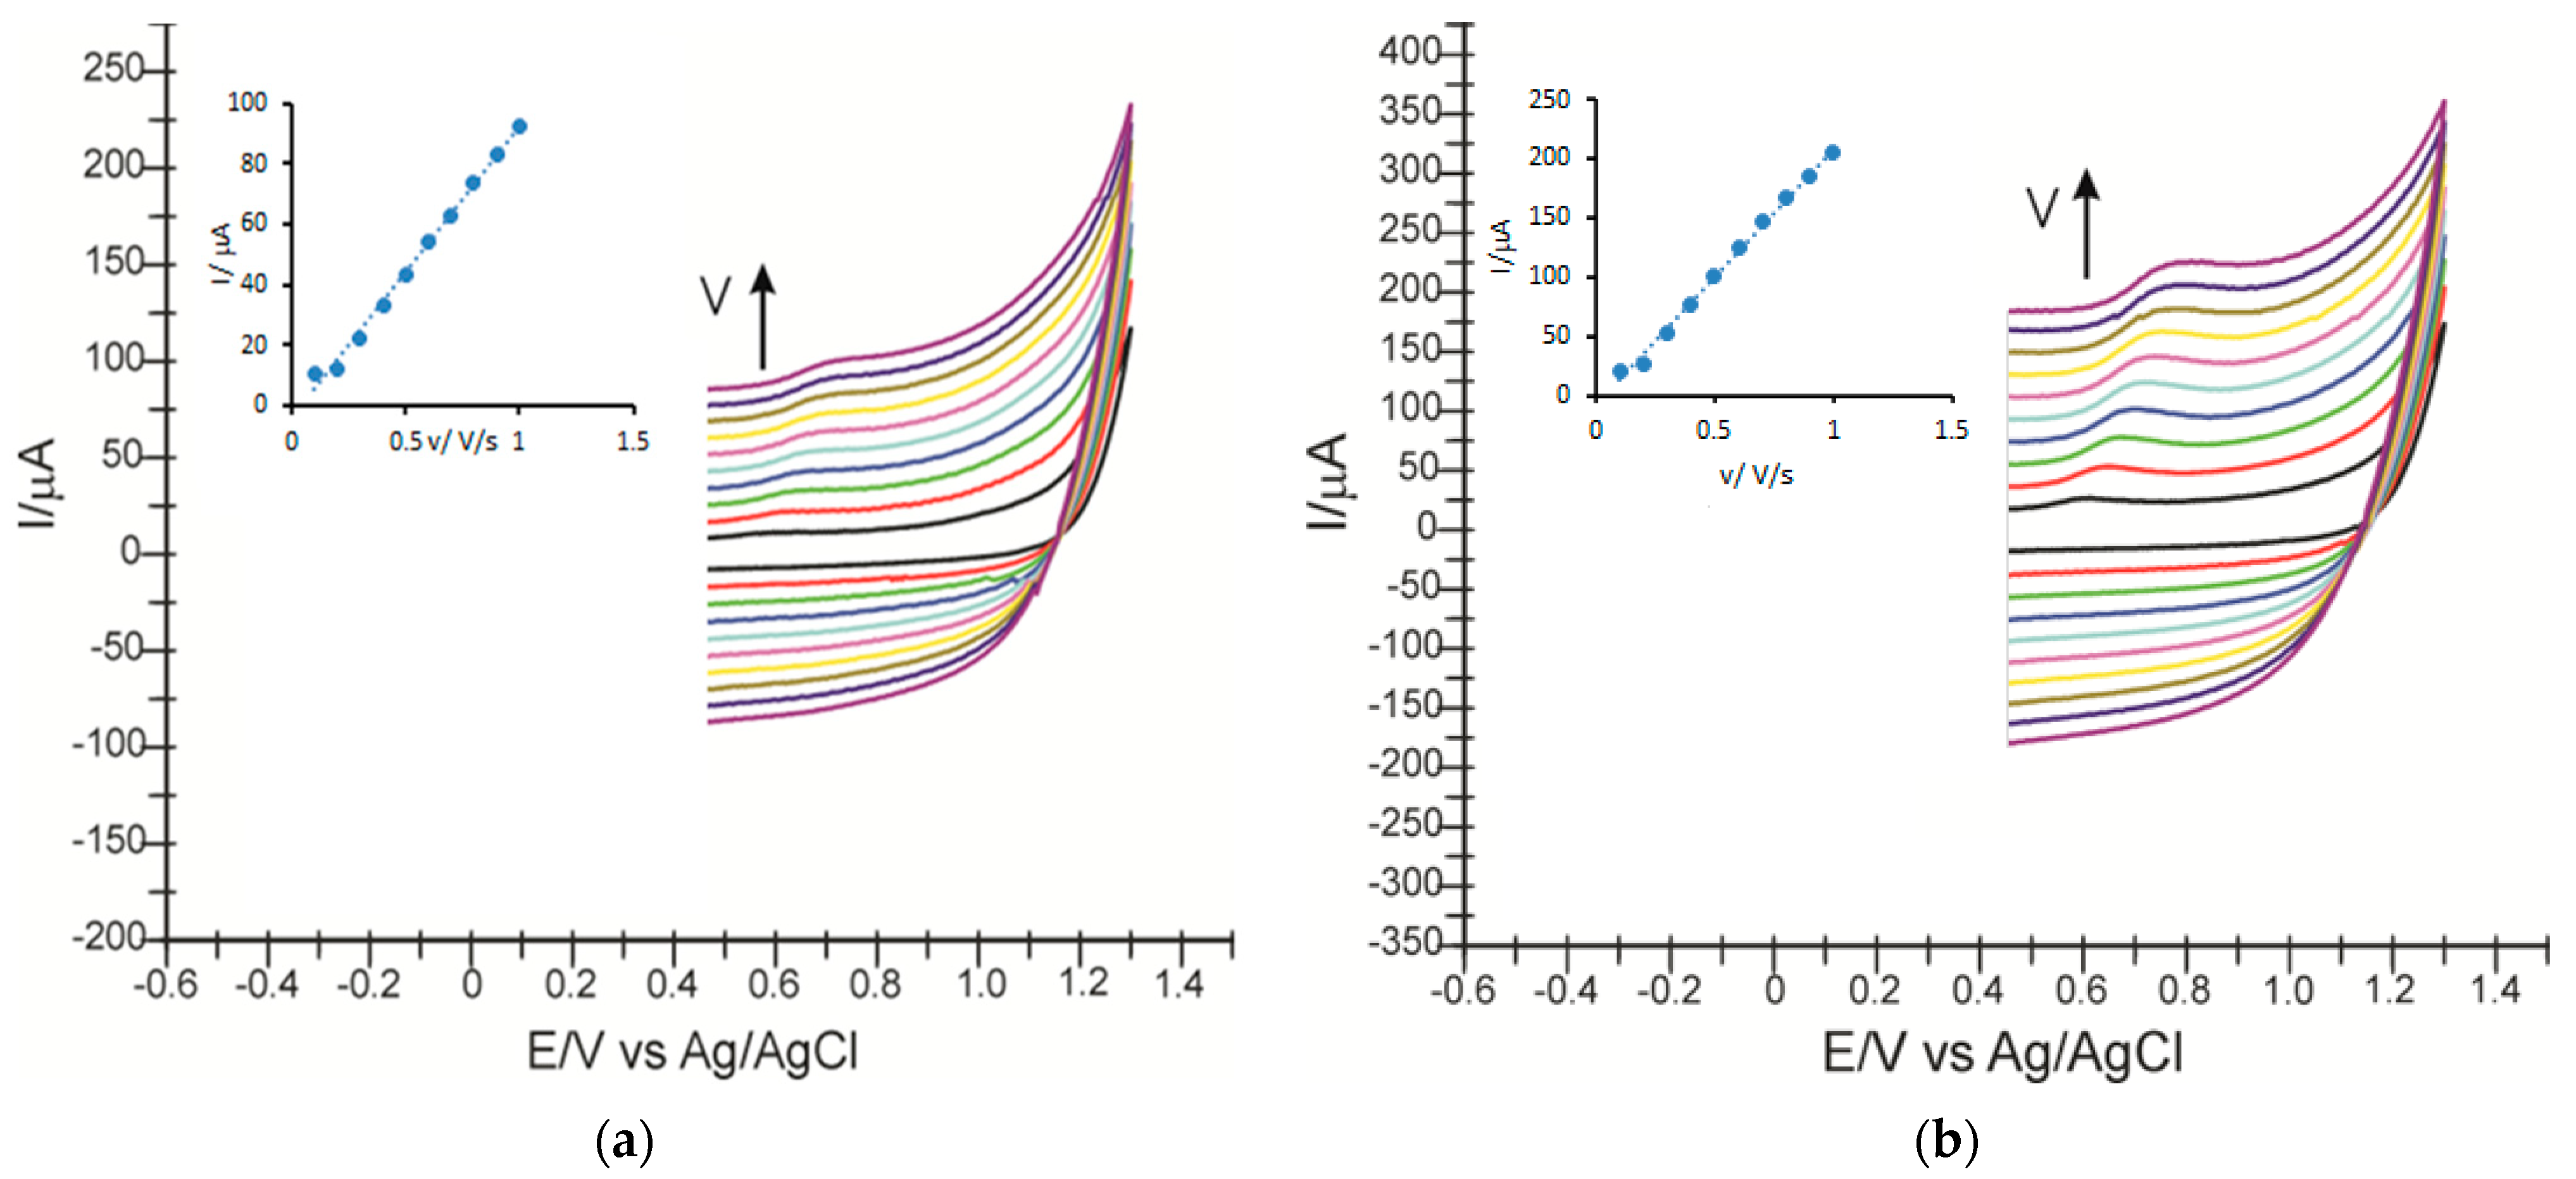
3.4. Influence of Scan Rate on Sensor Responses

The influence of the scanning rate was studied in the case of rosuvastatin, using both SPCE and AuNP-MWCNTs/SPCE sensors.
The scan rates varied between 0.1 and 1.0 V/s, changing the scan rate gradually with each recording by 0.1 V/s. As the scanning rate increased, the anodic current increased in intensity, as can be seen in Figure 8.
Evaluating the linear dependence of the anodic current towards the scanning rate but also towards the square root of the scale rate, it is established that the process is predominantly controlled by the adsorption of the chemical species on the surface of the sensor, for both statins, with each sensor. As noted in Table 1, the slope values in the case of the linear dependence between the logarithm of the anodic current intensity (I) and the logarithm of the scan rate (v) indicate a slight deviation from the theoretical value of 0.5 [47].
It should be mentioned that the signal was stabilized for each statin after the first two scanning cycles (results not shown). The first two cycles showed slightly more pronounced oxidation, which decreased progressively, showing the adsorption of statin on the electrode surface. This behavior was present both with rosuvastatin and simvastatin. Moreover, as reported in other studies, the oxidation process of statins is irreversible and involves the exchange of two protons and two electrons [16,46].
Laviron’s equation [48] was used to calculate the concentration of electroactive species adsorbed on the electrode surface.
I = n 2 F 2 Γ A v 4 R T
where:
  • Г—concentration of the active species adsorbed on the electrode surface, mol × cm−2;
  • I—current corresponding to the peak, A;
  • A—electrode surface, cm2;
  • n—number of electrons transferred during redox processes;
  • F—Faraday’s constant, 96,485 C × mol−1;
  • R—universal gas constant, 8.314 J/mol K;
  • T—absolute temperature, 298 K.
Following the obtained parameters, Γ was calculated using Laviron’s equation, more exactly from the slope of the linear dependence between I and v. The obtained values can be found in Table 2.
All the results suggest that AuNP-MWCNTs/SPCE presents a superior sensitivity compared to SPCE due to nanomaterials from the active surface of the screen-printed electrodes, which increase the active area and improves the adsorption process.

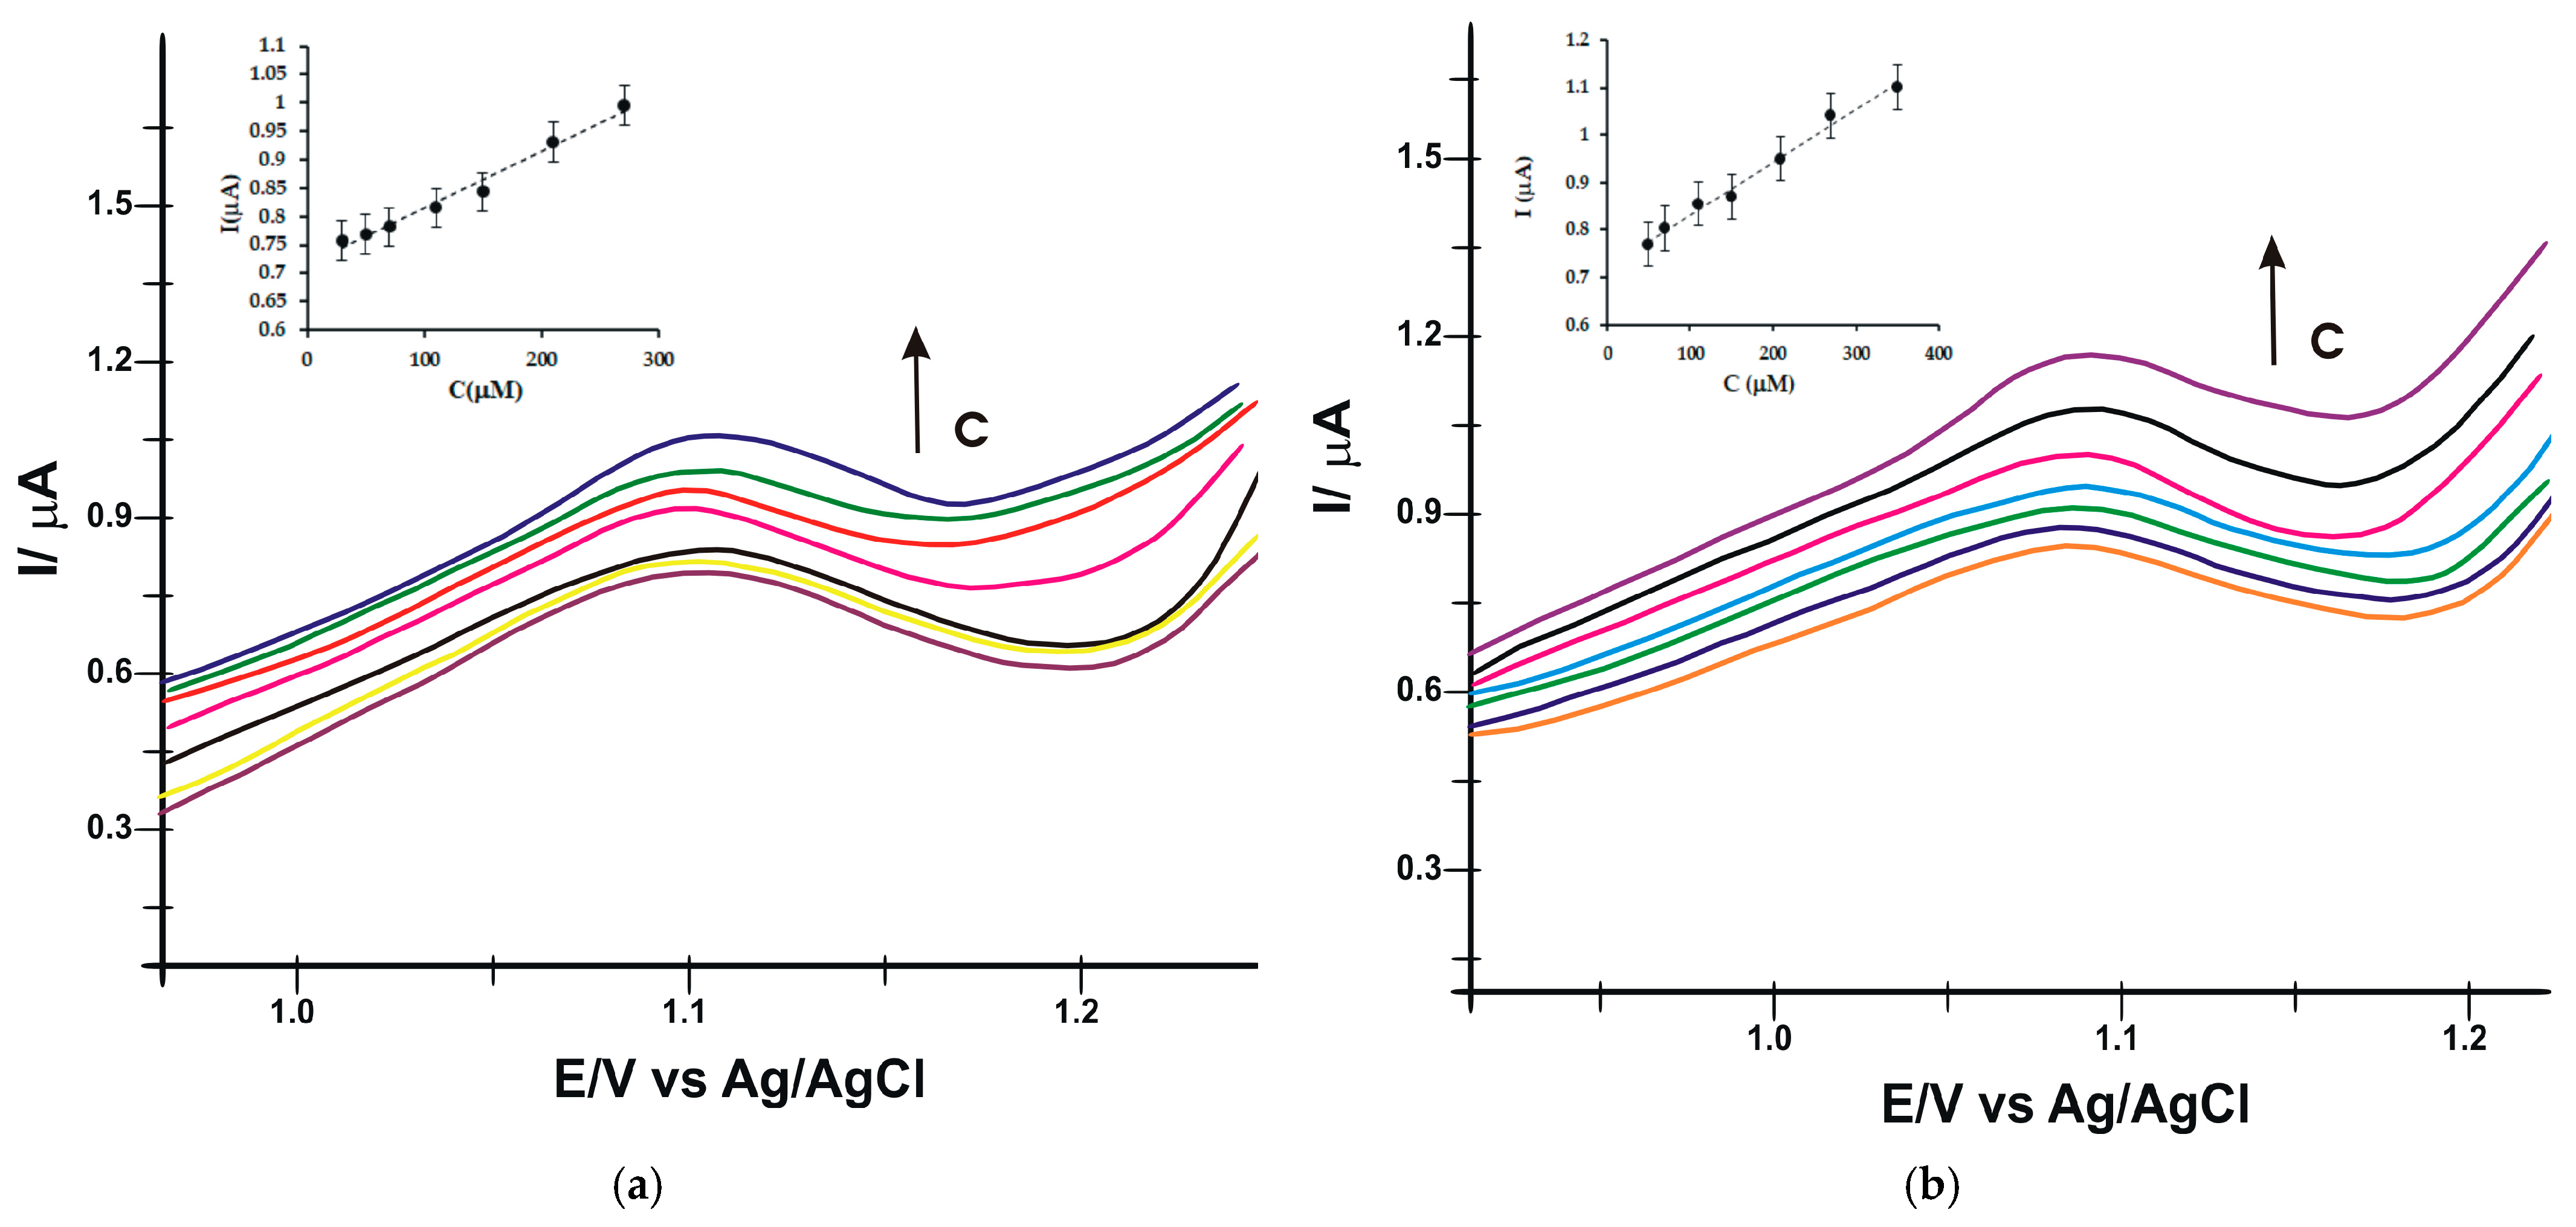
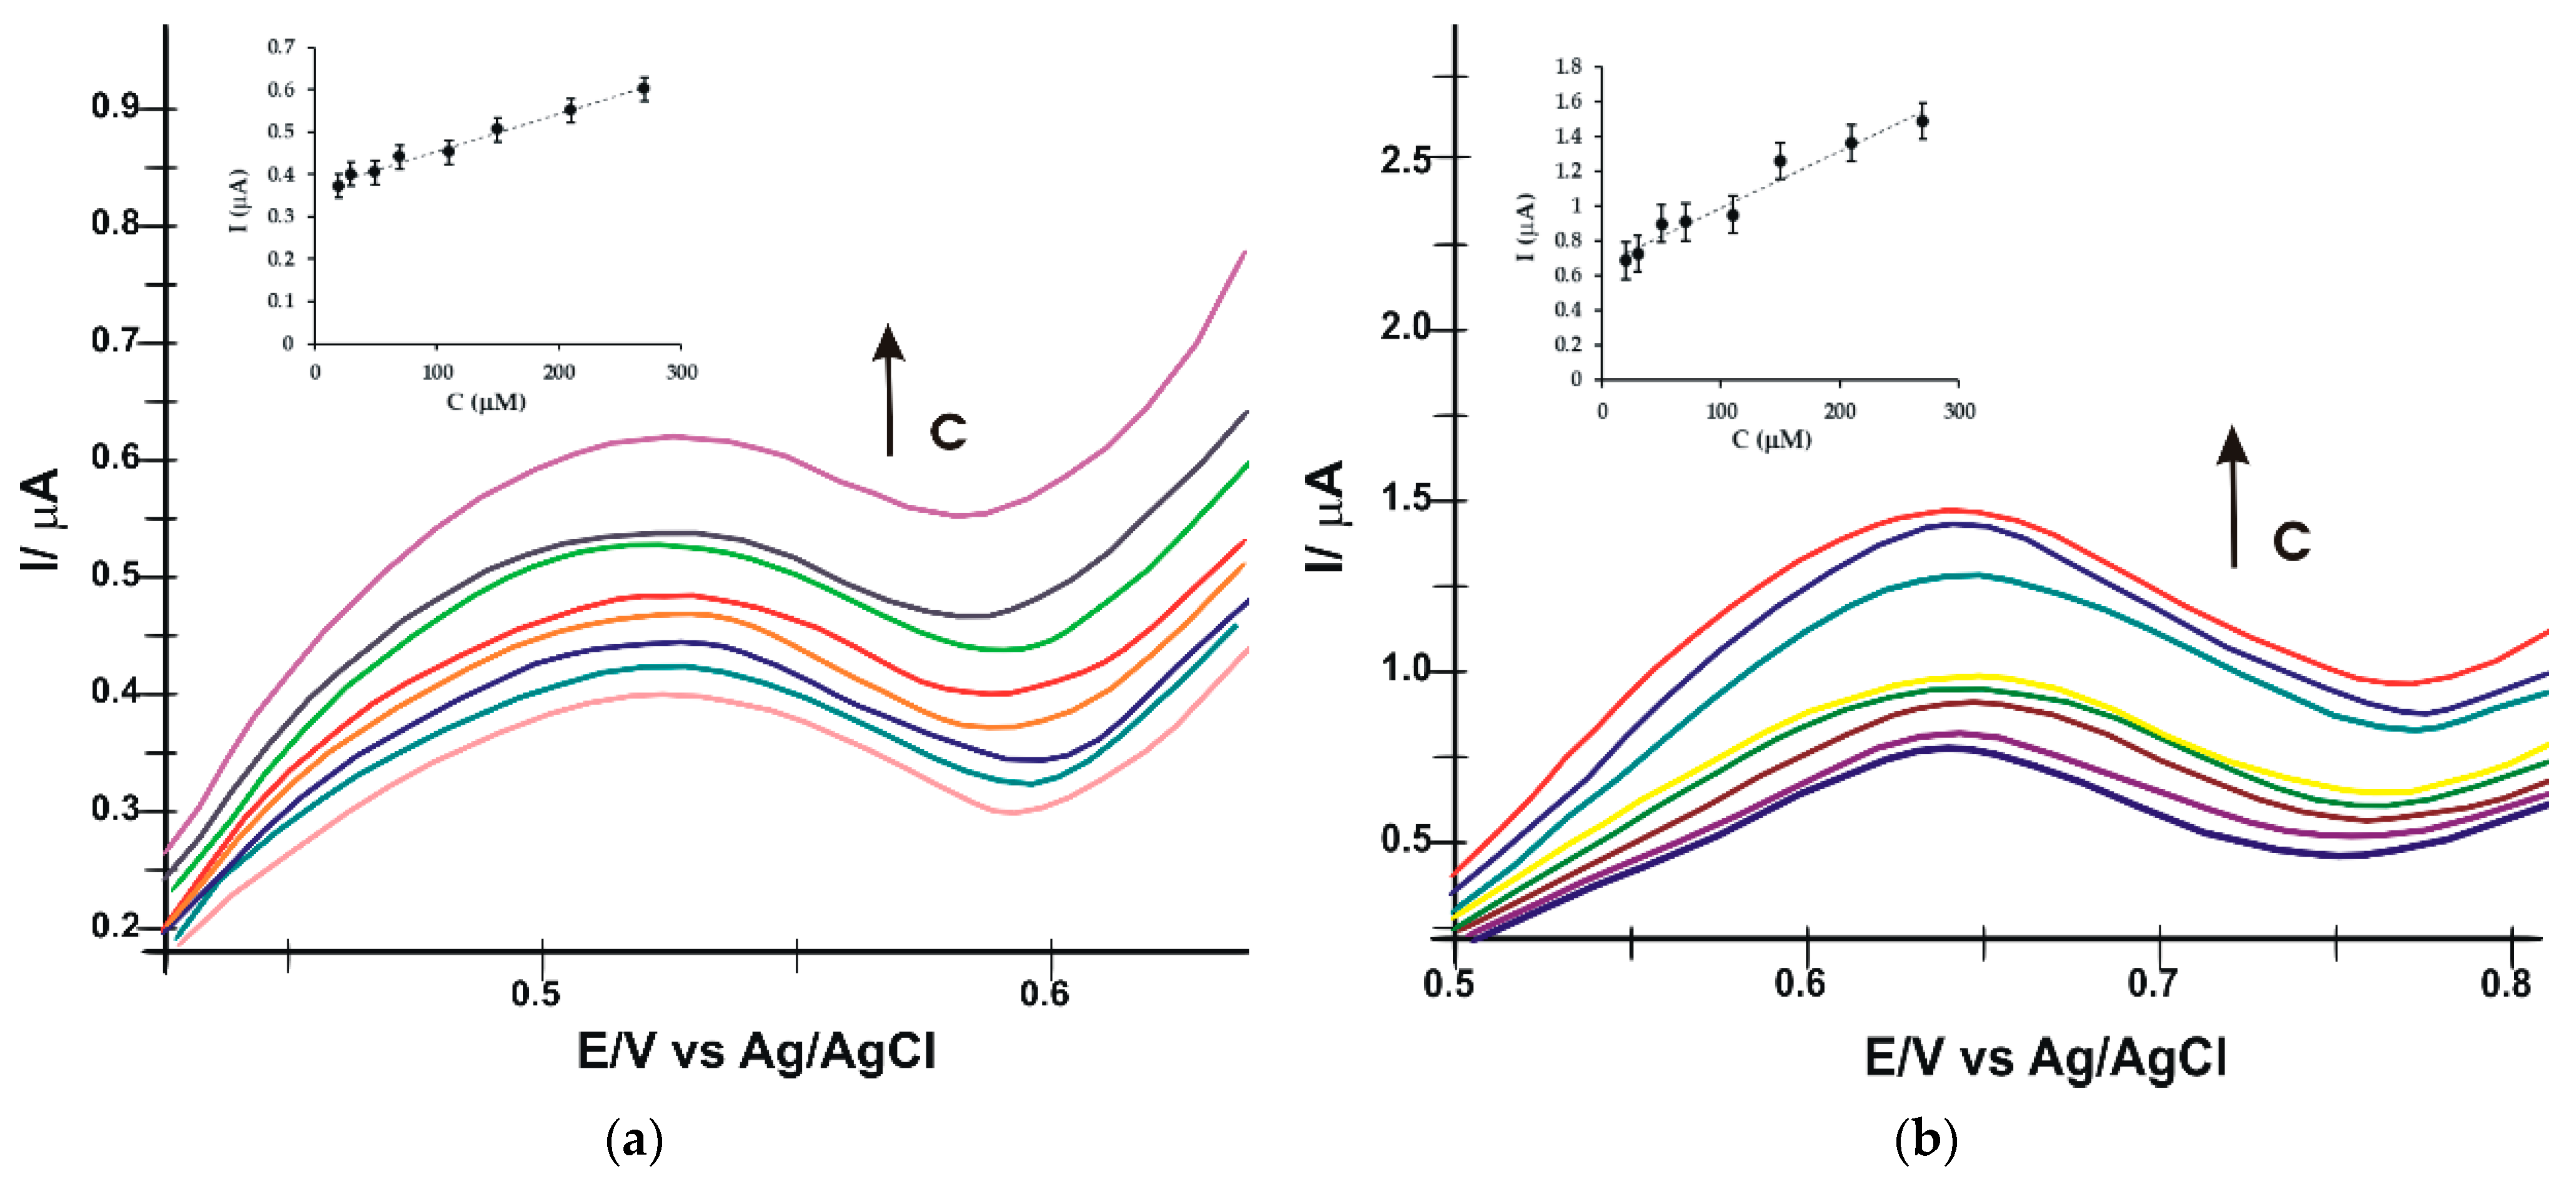
3.5. Determination of LOD and LOQ

The same electrodes, SPCE and AuNP-MWCNTs/SPCE, were used to obtain the calibration curves of all sensors for rosuvastatin and simvastatin in the concentration range of 5–400 μM. The stock solutions used for calibration had the same concentration, 600 µM, and the different concentrations of the solution were obtained by adding different volumes of stock solution in support electrolyte solution and recording the cyclic voltammograms.
In the case of rosuvastatin, both sensors show a linear dependence between the intensity of the anodic peak and the analyte concentration range between 20–275 µM (Figure 9). The calibration curves were performed with three replicates.
In the case of simvastatin, the linearity range depends on the sensor used; more precisely, when CVs are recorded with SPCE, the linear dependence between the intensity of the anodic peak and the concentration of simvastatin is in the range of 30–275 µM, and in the case of AuNP-MWCNTs/SPCE, in the range of 50–350 µM (Figure 10).
The limits of detection (LOD = 3 σ/m) and quantification (LOQ = 10 σ/m) of the sensors for RV and SV were calculated using calibration equations and standard deviations (σ is the standard deviation of the electrochemical signal for the blank sample at the potential corresponding to the peak corresponding to RV and SV respectively) for both sensors used in the analysis. The LOD and LOQ values of the two sensors can be found in Table 3.
Although the slope values of the calibration plot did not significantly vary between the two electrodes, AuNP-MWCNTs/SPCE demonstrated significant improvements in LOD and LOQ. This suggests enhanced performance of the modified sensor in terms of detection and quantification. Furthermore, it is important to highlight that signal stability was significantly better with the modified sensor, manifesting as lower deviation in measurements, which contributes to the trust in and accuracy of the results obtained with this sensor.
It is indeed true that at low concentrations (not shown in the plots), the slope of the calibration curve differs. However, we focused on selecting a concentration range with the best linearity and an R2 value closer to 1. Moreover, the results demonstrate the feasibility of the voltammetric method for the analysis of the two statins. The obtained values are similar or even better than those reported in the literature [6,27,28,29,44,49,50] (Table 4), which proves that the AuNP-MWCNTs/SPCE sensor has adequate electroanalytical performance for RV and SV quantification in actual samples.
The association of carbon nanotubes and gold nanoparticles demonstrated in all stages of the study that it is an efficient way to improve the electrochemical performance of the modified sensor. AuNP-MWCNTs/SPCE, having an active surface area much more significant than its geometric area, obtained, as expected, an efficient detection limit, which is why it will be used to determine statins in pharmaceutical samples.

3.6. Recovery Studies

The analytical recovery of each statin was analyzed by recording the cyclic voltammograms after the addition of known amounts of the active substance. The results are presented in Table 5.
Analytical recoveries ranged from 99.3% to 106.5%, with RSD (relative standard deviation) of approximately 1% for the two statins. The obtained results confirm the excellent electrocatalytic properties of the AuNP-MWCNTs/SPCE sensor and also an optimal accuracy of the electrochemical method. Therefore, AuNP-MWCNTs/SPCE can be successfully used for the determination of rosuvastatin and simvastatin concentrations in various pharmaceutical products or in other applications within the field.

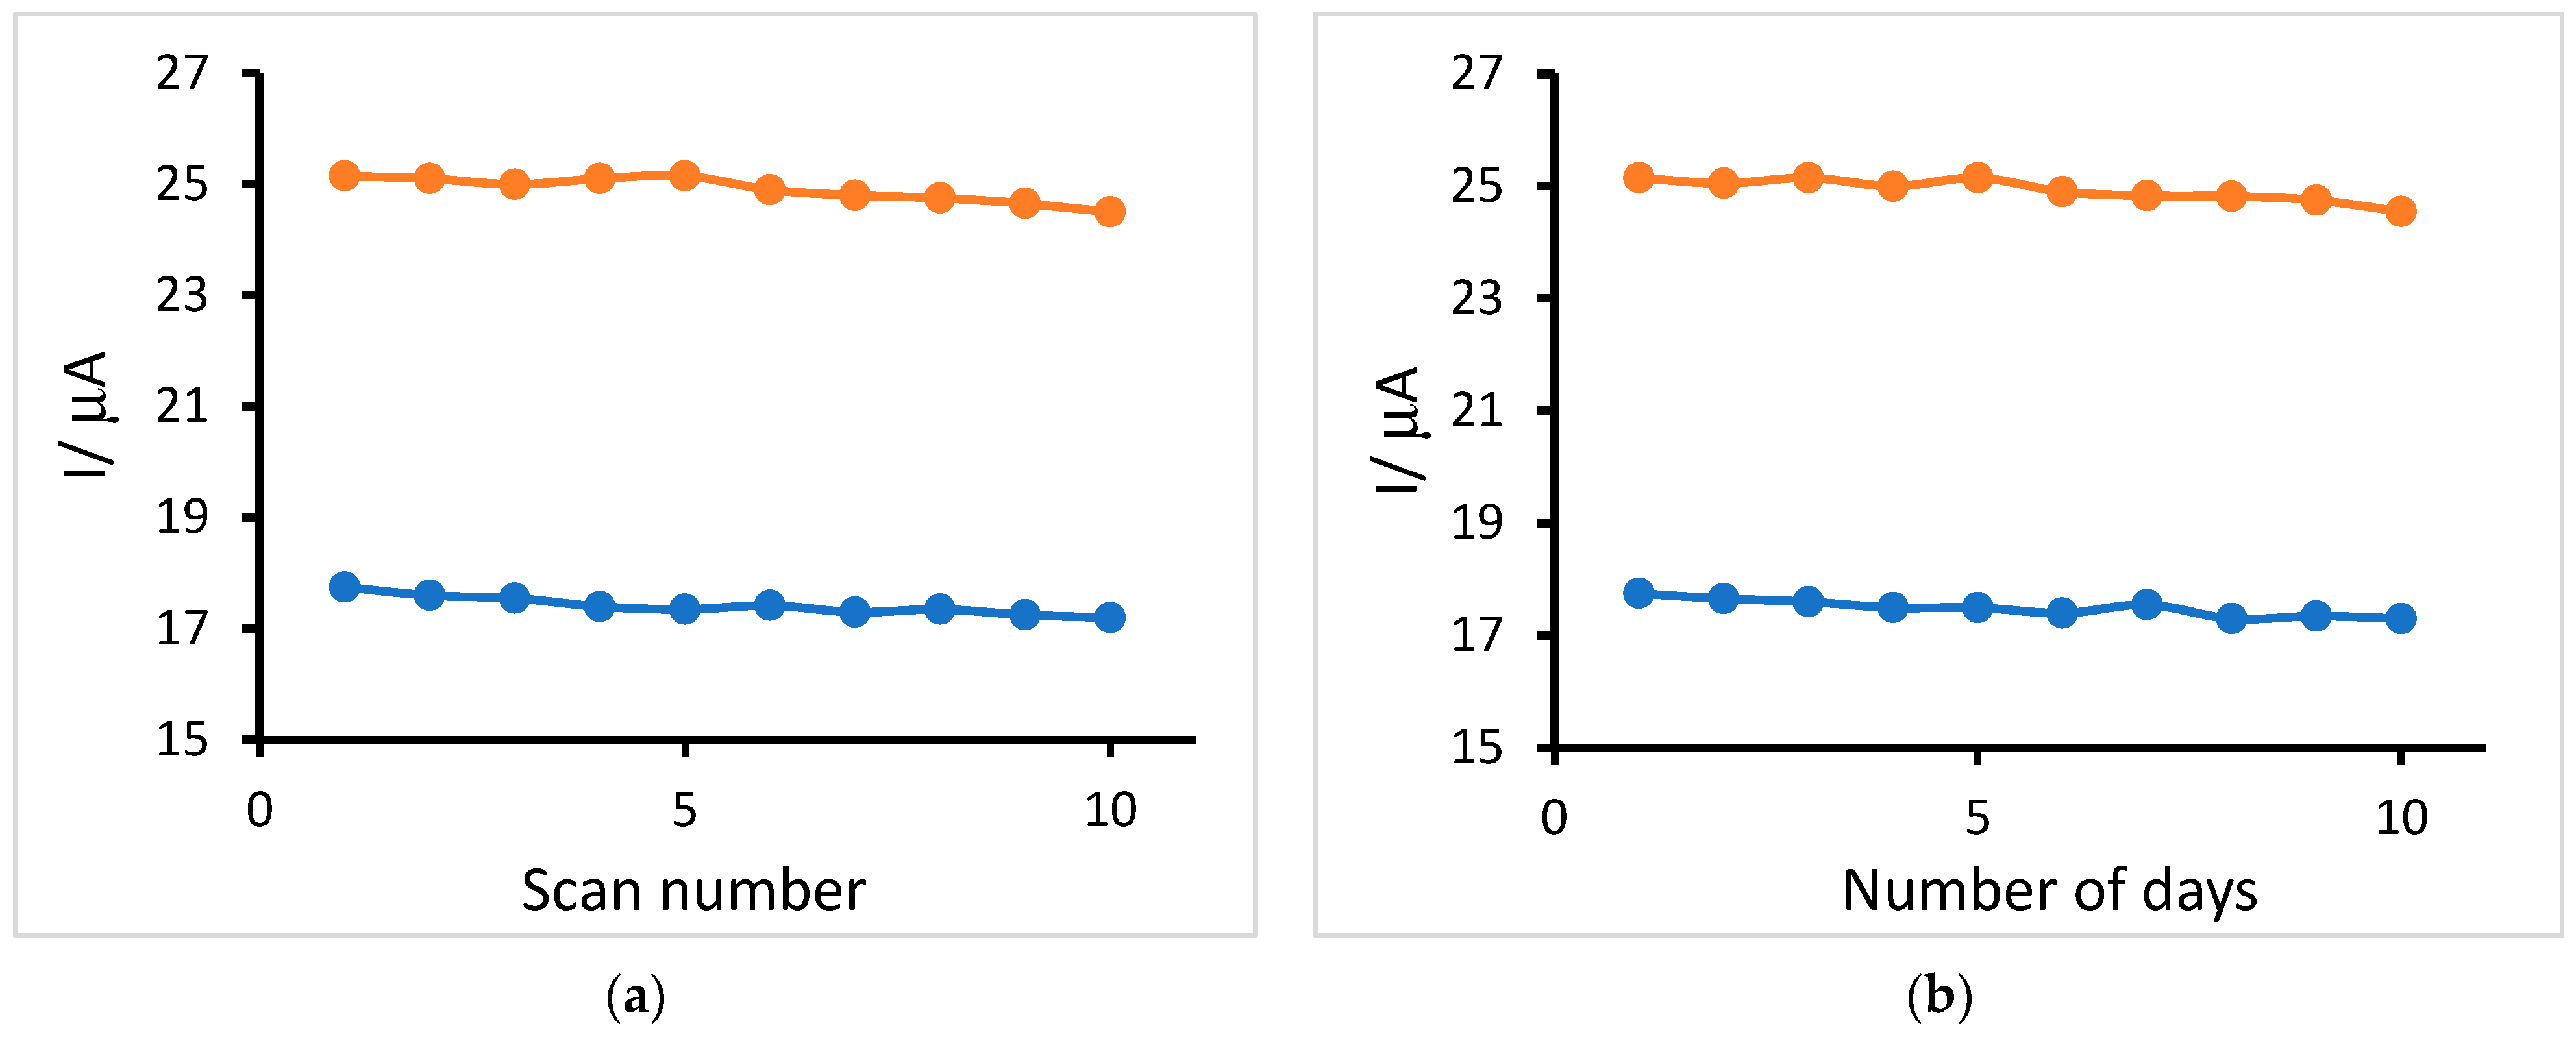
3.7. Stability and Reproducibility Studies

Ten successive voltammetric measurements tested the stability of the AuNP-MWCNTs/SPCE sensor in the rosuvastatin solution (30 µM) and simvastatin solution (30 µM) (Figure S5). Between scans, the sensor was rinsed three times with 0.1 M KCl solution. The intensity of the anodic current decreased by 2.38% in the case of rosuvastatin and by 2.53% in the case of simvastatin (Figure 11a).
Moreover, the AuNP-MWCNTs/SPCE sensor was used on ten consecutive days to measure the anodic current in the exact solutions, one measurement per day. After uses, the sensor was rinsed with 0.1 M KCl solution and kept at room temperature. After ten days, the sensor response decreased by 2.58% in the case of rosuvastatin and by 3.09% in the case of simvastatin (Figure 11b).
To verify the reproducibility of AuNP-MWCNTs/SPCE, the response of two identical sensors in 30 µM solutions of statins was studied. No differences greater than 1% were observed between the two sensors for either RV or SV detection.

3.8. Interference Studies

For the interference studies, the behavior of the AuNP-MWCNTs/SPCE sensor was assessed by adding atorvastatin, a compound therapeutically and chemically related to RV and SV. Solutions of RV and SV with a concentration of 30 μM were prepared, and the same concentration of atorvastatin was added to each solution. The obtained results are presented in Table 6.
As observed in Table 6, the presence of atorvastatin does not significantly influence the determination of either of the two statins (RV and SV). The oxidation peak of atorvastatin is highlighted at a distinct potential compared to the oxidation peaks of both RV and SV. Therefore, the possibility of even simultaneous determination of these statins could be considered.
These results suggest that the AuNP-MWCNTs/SPCE sensor exhibits good precision and selectivity for the determination of RV and SV in real samples.

3.9. Quantification of Statins in the Analyzed Pharmaceutical Products

Considering the optimal sensitivity of the AuNP-MWCNTs/SPCE sensor confirmed in all the analyses performed, it can be used to quantify RV and SV from two standardized pharmaceutical products. The applied method was cyclic voltammetry; the potential range was from −0.4 V to +1.2 V, and the scanning rate was 0.1 V/s. The presence and concentration of rosuvastatin and simvastatin are evaluated in the following products: Crestor 10, 20, and 40 mg and Simvacard 10, 20, and 40 mg. The intensities of the peaks related to statin oxidation in each solution, the amount of product analyzed (mass of one tablet), and the slope of the equation of the calibration line were taken into account; thus the concentration of statin in each product was calculated.
To validate the voltammetric method, the results were compared with those obtained after FTIR analysis, a method often used in drug control.
To quantify statins via FTIR analysis, eight solid standards consisting of rosuvastatin, simvastatin, and KBr were initially prepared to create a calibration curve in the concentration range of 5–60 mg/g (Figure 12). In the case of rosuvastatin, the correct equation was obtained based on the absorbance at 1333.95 cm−1, this wavelength being representative of the extension of the S=O group in the chemical structure of the analyte, a group that is not found in the structure of simvastatin.
Several bands were highlighted in the case of the product Crestor 20 mg; for example, at the wavenumber 2957.45 cm−1, the band is related to the N-H stretch, and at 1728.23 cm−1 for the C=O stretch from the statin structure. The other bands are found at 1556.76 cm−1, which shows the stretching of the C=C bond, at la 2916.25 cm−1 for C-H stretching, and at 1515.21 cm−1 for N-H bending. At 3275.15 cm−1, a strong and wide band for O-H stretching is observed; at 1488.74 cm−1 and 1400.61 cm−1, the asymmetric and symmetric bending vibration from the CH3 group is observed at 1333.95 cm−1, the asymmetric vibration for S = O is observed [52].
In the case of the product Simvacard 20 mg, the FTIR spectrum’s appearance is similar, with the compound having similar groups in the structure, with the exception of the S=O group. In this case, the values of the absorbances appearing at the wavenumber 1589.17 cm−1 corresponding to amide I (extension of the C=O group) were used for the calibration curve. The FTIR spectra of the two pharmaceutical products can be seen in Figure 13.
Table 7 shows the results obtained via both methods of analysis, which are by the concentration of the active substance declared by the manufacturer. Therefore, the AuNP-MWCNTs/SPCE sensor proved increased accuracy, sensitivity, and selectivity, suitable for determining some statins from actual samples. The coefficient of variation is a maximum of 2.2% in the case of rosuvastatin and a maximum of 2.5% in the case of simvastatin. These minor differences may appear due to the presence of excipients, which are indispensable for preparing the pharmaceutical form.
The FTIR method was used as a reference technique to validate the electrochemical method employed for the quantification of statins. FTIR is a spectroscopic technique based on the absorption and emission of infrared radiation by the analyzed molecules [53]. In this study, FTIR spectra were obtained for the target statins, and they were used to confirm the presence and identity of the analyzed compounds. The comparison between the results obtained via the electrochemical method and those obtained by FTIR demonstrated the correlation and accuracy of the electrochemical method in determining the content of statins. Thus, the FTIR method played a crucial role in the validation and confirmation of the electrochemical method used in this study.
After applying the t-test, the p values indicate that there is no statistically significant difference between the two analysis methods. The t statistic is −0.542, indicating that the difference in means between the results of the two methods is not significant. The negative t value suggests that the mean of the values obtained through CV is slightly lower than that of the values obtained through the FTIR method.

4. Conclusions

The quantification of the active compound is a significant step in the authorization process of any pharmaceutical product. Electrochemical sensors are sensitive, reproducible, and relatively easy-to-manufacture devices that could be used in drug control at different points in the development of a pharmaceutical form.
In this study, the quantities of two statins (rosuvastatin and simvastatin) from pharmaceutical products authorized for sale on the Romanian market were detected and quantified by means of screen-printed sensors, applying cyclic voltammetry. For this purpose, the two sensors were characterized from an electrochemical point of view and subjected to preliminary studies to provide details about their electrochemical performances. Superior results were obtained with the AuNP-MWCNTs/SPCE sensor compared to SPCE, confirmed by better values of some electrochemical parameters such as active surface area, detection, and quantification limit. Therefore, AuNP-MWCNTs/SPCE was used to analyze the two statins quantitatively. Furthermore, the voltammetric method was validated due to the results obtained, similar to those reported by the manufacturer but also those obtained via the conventional FTIR method. Thus, it can be stated that cyclic voltammetry is a simple, versatile, precise method with a low cost. The AuNP-MWCNTs/SPCE sensor presents excellent sensitivity and selectivity for detecting rosuvastatin and simvastatin due to the synergy between the electrocatalytic properties of gold nanoparticles and carbon nanotubes.

Supplementary Materials

The following supporting information can be downloaded at: https://www.mdpi.com/article/10.3390/inventions8050111/s1, Figure S1: Nyquist plots of EIS for SPCE (red line) and AuNP-MWCNTs/SPCE (black line) in K3[Fe(CN)6]/K4[Fe(CN)6] 5·10−4 M/5·10−4 M—KCl 0.1 M for a frequency range from 1 Hz to 100 kHz, amplitude 10 mV. Inset: Equivalent circuit used to fit the impedance spectra; Figure S2: Cyclic voltammograms recorded at SPCE (black line) and AuNP-MWCNTs/SPCE (red line) in 10−3 M catechol—0.1 M KCl solution; Figure S3: Cyclic voltammograms recorded at different scan rates (0.1–1 V/s), and dependence I vs. the square root of the scan rate in the case SPCE (a) and AuNP-MWCNTs/SPCE (b). Scan rate 0.1 V/s; Figure S4: Plot of Ia vs pH of 30 μM RV (a) and 30 μM SV (b) solution using cyclic voltammetry; Figure S5: The successive cyclic voltammograms recorded by AuNP-MWCNTs/SPCE in the 30 μM RV solution; Table S1: Electrochemical parameters obtained from cyclic voltammograms of sensors immersed in 10−3 M catechol—0.1 M KCl aqueous solution; Table S2: Geometrical area, active surface area, and roughness factor for SPCE and AuNP-MWCNTs/SPCE.

Author Contributions

Conceptualization, C.A., A.V.B. and R.O.R.; methodology, C.A.; validation, R.O.R. and A.V.B.; formal analysis, R.O.R.; investigation, R.O.R. and A.V.B.; resources, C.A.; writing—original draft preparation, R.O.R. and A.V.B.; writing—review and editing, C.A.; supervision, C.A. All authors have read and agreed to the published version of the manuscript.

Funding

This research received no external funding.

Data Availability Statement

Not applicable.

Conflicts of Interest

The authors declare no conflict of interest.

References

  1. Adhyaru, B.B.; Jacobson, T.A. Safety and Efficacy of Statin Therapy. Nat. Rev. Cardiol. 2018, 15, 757–769. [Google Scholar] [CrossRef] [PubMed]
  2. Tsoukas, M.A.; Mantzoros, C.S. Lipodystrophy Syndromes. In Endocrinology: Adult and Pediatric; Elsevier: Amsterdam, The Netherlands, 2016; pp. 648–661.e5. ISBN 978-0-323-18907-1. [Google Scholar]
  3. West of Scotland Coronary Prevention Group. West of Scotland Coronary Prevention Study: Identification of High-Risk Groups and Comparison with Other Cardiovascular Intervention Trials. Lancet 1996, 348, 1339–1342. [Google Scholar] [CrossRef]
  4. Ochiai, H.; Uchiyama, N.; Imagaki, K.; Hata, S.; Kamei, T. Determination of Simvastatin and Its Active Metabolite in Human Plasma by Column-Switching High-Performance Liquid Chromatography with Fluorescence Detection after Derivatization with 1-Bromoacetylpyrene. J. Chromatogr. B Biomed. Sci. Appl. 1997, 694, 211–217. [Google Scholar] [CrossRef] [PubMed]
  5. Mol, M.J.T.M.; Leuven, J.A.G.; Erkelens, D.W.; Schouten, T.A.; Stalenhoef, A.F.H. Effects of synvinolin (mk-733) on plasma lipids in familial hypercholesterolaemia. Lancet 1986, 328, 936–939. [Google Scholar] [CrossRef] [PubMed]
  6. Zhang, H.; Hu, C.; Wu, S.; Hu, S. Enhanced Oxidation of Simvastatin at a Multi-Walled Carbon Nanotubes-Dihexadecyl Hydrogen Phosphate Composite Modified Glassy Carbon Electrode and the Application in Determining Simvastatin in Pharmaceutical Dosage Forms. Electroanalysis 2005, 17, 749–754. [Google Scholar] [CrossRef]
  7. Krisnamurti, D.; Farida, S.; Putri, R.; Fachri, W.; Purwaningsih, E. The Effect of Simvastatin–Acalypha Indica Linn. Combination on the Improvement of Fatty Pancreas in Rats Induced with a High Fructose and Cholesterol Diet. J. Adv. Vet. Anim. Res. 2022, 9, 346. [Google Scholar] [CrossRef]
  8. Dyade, G.K.; Sawant, R.L.; Joshi, H.A.; Shinde, A.D.; Bandal, R.S.; Gadhingleskar, S.V. A Novel Approach: Effect of Polarity Index of Mobile Phase on Retention Time of Antihyperlipidemic Antihypertensive and Angiotensin Inhibiting Drugs in RP-HPLC Method. Res. Jour. Pharm. Technol. 2020, 13, 3065. [Google Scholar] [CrossRef]
  9. Alonso, R.; Cuevas, A.; Cafferata, A. Diagnosis and Management of Statin Intolerance. J. Atheroscler. Thromb. 2019, 26, 207–215. [Google Scholar] [CrossRef]
  10. Aydoğmuş, Z.; Asfoor, A. Electroanalytical Methods for Determination of Antiviral Drugs in Pharmaceutical Formulation and Biological Fluids: A Review. Chin. J. Anal. Chem. 2022, 50, 100063. [Google Scholar] [CrossRef]
  11. Antal, I.; Koneracka, M.; Zavisova, V.; Kubovcikova, M.; Kormosh, Z.; Kopcansky, P. Statins Determination: A Review of Electrochemical Techniques. Crit. Rev. Anal. Chem. 2017, 47, 474–489. [Google Scholar] [CrossRef]
  12. Mammone, F.R.; Rotundo, P.; Ferretti, R.; Puxeddu, M.; Silvestri, R.; Cirilli, R. Chemo- and Enantio-Selective Reversed-Phase HPLC Analysis of Rosuvastatin Using a Cellulose-Based Chiral Stationary Phase in Gradient Elution Mode. J. Pharm. Biomed. Anal. 2023, 225, 115239. [Google Scholar] [CrossRef]
  13. Bozhanov, S.; Maslarska, V. Spectroscopic and high-performance liquid chromatography methods for determination of statins. Pharmacia 2016, 63, 14. [Google Scholar]
  14. Dastaran, R.; Sheibani, A.; Shishehbore, M.R.; Saeedi-Sourck, H. Continuous Wavelet Transform for Simultaneous Determination of Atorvastatin and Rosuvastatin in Combined Pharmaceutical Formulations. J. Appl. Spectrosc. 2022, 88, 1195–1201. [Google Scholar] [CrossRef]
  15. Pandit, U.J.; Naikoo, G.A.; Sheikh, M.U.D.; Khan, G.A.; Raj, K.K.; Limaye, S.N. Electrochemical Determination of an Anti-Hyperlipidimic Drug Pitavastatin at Electrochemical Sensor Based on Electrochemically Pre-Treated Polymer Film Modified GCE. J. Pharm. Anal. 2017, 7, 258–264. [Google Scholar] [CrossRef]
  16. Silva, T.A.; Zanin, H.; Vicentini, F.C.; Corat, E.J.; Fatibello-Filho, O. Electrochemical Determination of Rosuvastatin Calcium in Pharmaceutical and Human Body Fluid Samples Using a Composite of Vertically Aligned Carbon Nanotubes and Graphene Oxide as the Electrode Material. Sens. Actuators B Chem. 2015, 218, 51–59. [Google Scholar] [CrossRef]
  17. Kokilambigai, K.S.; Seetharaman, R.; Lakshmi, K.S. Critical Review on the Analytical Techniques for the Determination of the Oldest Statin—Atorvastatin—In Bulk, Pharmaceutical Formulations and Biological Fluids. Crit. Rev. Anal. Chem. 2017, 47, 538–555. [Google Scholar] [CrossRef]
  18. Patil, V.B.; Malode, S.J.; Tuwar, S.M.; Shetti, N.P. Graphene Sheet-Based Electrochemical Sensor with Cationic Surfactant for Sensitive Detection of Atorvastatin. Sens. Int. 2022, 3, 100198. [Google Scholar] [CrossRef]
  19. Monteiro, M.C.; Winiarski, J.P.; Santana, E.R.; Szpoganicz, B.; Vieira, I.C. Ratiometric Electrochemical Sensor for Butralin Determination Using a Quinazoline-Engineered Prussian Blue Analogue. Materials 2023, 16, 1024. [Google Scholar] [CrossRef]
  20. Rebelo, P.; Pacheco, J.G.; Voroshylova, I.V.; Melo, A.; Cordeiro, M.N.D.S.; Delerue-Matos, C. A Simple Electrochemical Detection of Atorvastatin Based on Disposable Screen-Printed Carbon Electrodes Modified by Molecularly Imprinted Polymer: Experiment and Simulation. Anal. Chim. Acta 2022, 1194, 339410. [Google Scholar] [CrossRef]
  21. Kalate Bojdi, M.; Behbahani, M.; Ranjbari Koloyi, S. Application of a New Electrochemical Sensor Based on Carbon Paste Electrode with NiFe2O4 and Cross-Linked Chitosan Composite for Trace Detection of Atorvastatin. Appl. Chem. 2022, 17, 169–188. [Google Scholar] [CrossRef]
  22. Karimi-Maleh, H.; Karimi, F.; Alizadeh, M.; Sanati, A.L. Electrochemical Sensors, a Bright Future in the Fabrication of Portable Kits in Analytical Systems. Chem. Rec. 2020, 20, 682–692. [Google Scholar] [CrossRef] [PubMed]
  23. Lima, H.R.S.; da Silva, J.S.; de Oliveira Farias, E.A.; Teixeira, P.R.S.; Eiras, C.; Nunes, L.C.C. Electrochemical Sensors and Biosensors for the Analysis of Antineoplastic Drugs. Biosens. Bioelectron. 2018, 108, 27–37. [Google Scholar] [CrossRef] [PubMed]
  24. Lu, H.; He, B.; Gao, B. Emerging Electrochemical Sensors for Life Healthcare. Eng. Regen. 2021, 2, 175–181. [Google Scholar] [CrossRef]
  25. Stefano, J.S.; Orzari, L.O.; Silva-Neto, H.A.; de Ataíde, V.N.; Mendes, L.F.; Coltro, W.K.T.; Longo Cesar Paixão, T.R.; Janegitz, B.C. Different Approaches for Fabrication of Low-Cost Electrochemical Sensors. Curr. Opin. Electrochem. 2022, 32, 100893. [Google Scholar] [CrossRef]
  26. Nhu-Trang, T.-T.; Nguyen, H.-N.; Thach, T.-X.; Nguyen, H.-N.; Nguyen, C.-H.; Do, M.H. A Simple Electrochemical Method for Determination of Rosuvastatin Calcium in Cholesterol-Lowering Medical Products. AIP Conf. Proc. 2022, 2610, 060002. [Google Scholar] [CrossRef]
  27. Karadurmus, L.; Kurbanoglu, S.; Uslu, B.; Ozkan, S.A. An Efficient, Simultaneous Electrochemical Assay of Rosuvastatin and Ezetimibe from Human Urine and Serum Samples. Methods Protoc. 2022, 5, 90. [Google Scholar] [CrossRef]
  28. Silva, T.A.; Pereira, G.F.; Fatibello-Filho, O.; Eguiluz, K.I.B.; Salazar-Banda, G.R. Square-Wave Voltammetric Determination of Rosuvastatin Calcium in Pharmaceutical and Biological Fluid Samples Using a Cathodically Pretreated Boron-Doped Diamond Electrode. Diam. Relat. Mater. 2015, 58, 103–109. [Google Scholar] [CrossRef]
  29. Parsa, A.; Heli, H. Electrodeposition of Nickel Wrinkled Nanostructure from Choline Chloride:Urea Deep Eutectic Solvent (Reline) and Application for Electroanalysis of Simvastatin. Microchem. J. 2020, 152, 104267. [Google Scholar] [CrossRef]
  30. Ashrafi, A.M.; Richtera, L. Preparation and Characterization of Carbon Paste Electrode Bulk-Modified with Multiwalled Carbon Nanotubes and Its Application in a Sensitive Assay of Antihyperlipidemic Simvastatin in Biological Samples. Molecules 2019, 24, 2215. [Google Scholar] [CrossRef]
  31. Karimi-Maleh, H.; Cellat, K.; Arıkan, K.; Savk, A.; Karimi, F.; Şen, F. Palladium–Nickel Nanoparticles Decorated on Functionalized-MWCNT for High Precision Non-Enzymatic Glucose Sensing. Mater. Chem. Phys. 2020, 250, 123042. [Google Scholar] [CrossRef]
  32. Piovesan, J.V.; de Lima, C.A.; Santana, E.R.; Spinelli, A. Voltammetric Determination of Condensed Tannins with a Glassy Carbon Electrode Chemically Modified with Gold Nanoparticles Stabilized in Carboxymethylcellulose. Sens. Actuators B Chem. 2017, 240, 838–847. [Google Scholar] [CrossRef]
  33. Magar, H.S.; Hassan, R.Y.A.; Mulchandani, A. Electrochemical Impedance Spectroscopy (EIS): Principles, Construction, and Biosensing Applications. Sensors 2021, 21, 6578. [Google Scholar] [CrossRef] [PubMed]
  34. Amouzadeh Tabrizi, M.; Acedo, P. An Electrochemical Impedance Spectroscopy-Based Aptasensor for the Determination of SARS-CoV-2-RBD Using a Carbon Nanofiber–Gold Nanocomposite Modified Screen-Printed Electrode. Biosensors 2022, 12, 142. [Google Scholar] [CrossRef] [PubMed]
  35. Wang, S.; Zhang, J.; Gharbi, O.; Vivier, V.; Gao, M.; Orazem, M.E. Electrochemical Impedance Spectroscopy. Nat. Rev. Methods Primers 2021, 1, 41. [Google Scholar] [CrossRef]
  36. Fan, Y.; Shi, S.; Ma, J.; Guo, Y. Smartphone-Based Electrochemical System with Multi-Walled Carbon Nanotubes/Thionine/Gold Nanoparticles Modified Screen-Printed Immunosensor for Cancer Antigen 125 Detection. Microchem. J. 2022, 174, 107044. [Google Scholar] [CrossRef]
  37. Munteanu, I.G.; Apetrei, C. Tyrosinase-Based Biosensor—A New Tool for Chlorogenic Acid Detection in Nutraceutical Formulations. Materials 2022, 15, 3221. [Google Scholar] [CrossRef] [PubMed]
  38. Apetrei, I.M.; Apetrei, C. Voltammetric Determination of Melatonin Using a Graphene-Based Sensor in Pharmaceutical Products. IJN 2016, 2016, 1859. [Google Scholar] [CrossRef]
  39. Bard, A.J.; Faulkner, L.R. Electrochemical Methods: Fundamentals and Applications, 2nd ed.; Wiley: New York, NY, USA, 2001; ISBN 978-0-471-04372-0. [Google Scholar]
  40. Burestedt, E.; Narvaez, A.; Ruzgas, T.; Gorton, L.; Emnéus, J.; Domínguez, E.; Marko-Varga, G. Rate-Limiting Steps of Tyrosinase-Modified Electrodes for the Detection of Catechol. Anal. Chem. 1996, 68, 1605–1611. [Google Scholar] [CrossRef]
  41. Bounegru, A.V.; Apetrei, C. Carbonaceous Nanomaterials Employed in the Development of Electrochemical Sensors Based on Screen-Printing Technique—A Review. Catalysts 2020, 10, 680. [Google Scholar] [CrossRef]
  42. García-Carmona, L.; Moreno-Guzmán, M.; Sierra, T.; González, M.C.; Escarpa, A. Filtered Carbon Nanotubes-Based Electrodes for Rapid Sensing and Monitoring of L-Tyrosine in Plasma and Whole Blood Samples. Sens. Actuators B Chem. 2018, 259, 762–767. [Google Scholar] [CrossRef]
  43. Olivares, F.; Peón, F.; Henríquez, R.; del Río, R.S. Strategies for Area-Selective Deposition of Metal Nanoparticles on Carbon Nanotubes and Their Applications: A Review. J. Mater. Sci. 2022, 57, 2362–2387. [Google Scholar] [CrossRef]
  44. Darroudi, A.; Nazari, S.; Marashi, S.A.; Nazar Abad, M.K. Determination of Simvastatin by Voltammetry Method at Screen-Printed Electrode Modified by Graphene Oxide Nanosheets and Sodium Dodecyl Sulfate. J. Electrochem. Soc. 2022, 169, 026501. [Google Scholar] [CrossRef]
  45. El-Wekil, M.M.; Abdelhady, K.K.; Abdel Salam, R.A.; Hadad, G.M.; Ali, R. Facile Synthesis of Novel Nanocomposite Prepared from Spinel Copper Ferrite and Reduced Graphene Oxide in the Presence of Anti-Fouling Agent Diethyl Ammonium Acid Sulphate for Ultrasensitive Detection of Rosuvastatin in Human Plasma. Microchem. J. 2019, 147, 1133–1140. [Google Scholar] [CrossRef]
  46. Rus, I.; Tertiș, M.; Barbălată, C.; Porfire, A.; Tomuță, I.; Săndulescu, R.; Cristea, C. An Electrochemical Strategy for the Simultaneous Detection of Doxorubicin and Simvastatin for Their Potential Use in the Treatment of Cancer. Biosensors 2021, 11, 15. [Google Scholar] [CrossRef]
  47. Laviron, E.; Roullier, L.; Degrand, C. A Multilayer Model for the Study of Space Distributed Redox Modified Electrodes: Part II. Theory and Application of Linear Potential Sweep Voltammetry for a Simple Reaction. J. Electroanal. Chem. Interfacial Electrochem. 1980, 112, 11–23. [Google Scholar] [CrossRef]
  48. Apetrei, I.M.; Rodriguez-Mendez, M.L.; Apetrei, C.; de Saja, J.A. Fish Freshness Monitoring Using an E-Tongue Based on Polypyrrole Modified Screen-Printed Electrodes. IEEE Sens. J. 2013, 13, 2548–2554. [Google Scholar] [CrossRef]
  49. Fayazfar, H.; Afshar, A.; Dolati, A.; Ghalkhani, M. Modification of Well-Aligned Carbon Nanotubes with Dihexadecyl Hydrogen Phosphate: Application to Highly Sensitive Nanomolar Detection of Simvastatin. J. Appl. Electrochem. 2014, 44, 263–277. [Google Scholar] [CrossRef]
  50. El-Zahry, M.R.; Ali, M.F.B. Enhancement Effect of Reduced Graphene Oxide and Silver Nanocomposite Supported on Poly Brilliant Blue Platform for Ultra-Trace Voltammetric Analysis of Rosuvastatin in Tablets and Human Plasma. RSC Adv. 2019, 9, 7136–7146. [Google Scholar] [CrossRef]
  51. Coruh, Ö.; Özkan, S.A. Determination of the Antihyperlipidemic Simvastatin by Various Voltammetric Techniques in Tablets and Serum Samples. Die Pharm.-Int. J. Pharm. Sci. 2006, 61, 285–290. [Google Scholar]
  52. Salih, O.; Samein, L.H.; Ali, W. Formulation and in Vitro Evaluation of Rosuvastatin Calcium Niosomes. Int. J. Pharm. Pharm. Sci. 2013, 5, 525. [Google Scholar]
  53. Mallah, M.A.; Sherazi, S.T.H.; Bhanger, M.I.; Mahesar, S.A.; Bajeer, M.A. A Rapid Fourier-Transform Infrared (FTIR) Spectroscopic Method for Direct Quantification of Paracetamol Content in Solid Pharmaceutical Formulations. Spectrochim. Acta Part A Mol. Biomol. Spectrosc. 2015, 141, 64–70. [Google Scholar] [CrossRef] [PubMed]
Figure 1. Hydrolysis reaction in aqueous solutions of simvastatin (adapted from [6]).
Inventions 08 00111 g001
Figure 2. Chemical structure of rosuvastatin.
Inventions 08 00111 g002
Figure 3. Cyclic voltammograms recorded by AuNP-MWCNTs/SPCE in 30 µM RV solution (a) SV solution (b) (electrolyte support 0.1 M KCl −10−2 M HCl).
Inventions 08 00111 g003
Figure 4. Cyclic voltammograms recorded by sensors in electrolyte support 0.1 M KCl −10−2 M HCl, pH = 2.0 (SPCE−green line and AuNP-MWCNTs/SPCE−blue line) and in 30 µM rosuvastatin solution (electrolyte support 0.1 M KCl −10−2 M HCl, pH = 2.0) (SPCE−red line and AuNP-MWCNTs/SPCE−black line). Scan rate 0.1 V/s.
Inventions 08 00111 g004
Figure 5. Proposed mechanism for the electrochemical oxidation of rosuvastatin.
Inventions 08 00111 g005
Figure 6. Cyclic voltammograms recorded at sensors in electrolyte support 0.1 M KCl, pH = 7.0 (SPCE−green line and AuNP-MWCNTs/SPCE−blue line) and in 30 µM simvastatin solution (electrolyte support 0.1 M KCl, pH = 7.0) (SPCE−red line and AuNP-MWCNTs/SPCE−black line). Scan rate 0.1 V/s.
Inventions 08 00111 g006
Figure 7. The electrochemical oxidation mechanism proposed in the case of simvastatin (adapted from [46]).
Inventions 08 00111 g007
Figure 8. Cyclic voltammograms recorded with (a) SPCE and (b) AuNP-MWCNTs/SPCE sensors immersed in 30 µM rosuvastatin solution (support electrolyte solution 0.1 M KCl −10−2 M HCl) at scan rates between 0.1 V/s and 1.0 V/s (represented by different colors of the curves).
Inventions 08 00111 g008
Figure 9. Cyclic voltammograms recorded and linear fit for SPCE (a) on the concentration range 30–275 μM RV and AuNP-MWCNTs/SPCE (b) on the concentration range 20–275 μM RV (n = 3). Different colors correspond to different concentration of the analyzed solutions.
Inventions 08 00111 g009
Figure 10. Cyclic voltammograms (in zoom view) recorded and linear fit for SPCE (a) in the concentration range 30–275 μM SV and AuNP-MWCNTs/SPCE (b) in the concentration range 50–350 μM SV. Different colors correspond to different concentrations of the analyzed solutions.
Inventions 08 00111 g010
Figure 11. Variation of the intensity of the anodic current obtained by immersing AuNP-MWCNTs/SPCE in a solution of RV (red line), respectively SV (blue line) for ten successive scans (a) and for ten consecutive days (b).
Inventions 08 00111 g011
Figure 12. The FTIR spectra corresponding to the concentration range of 5–60 mg/g and the calibration curves for (a) RV and (b) SV. Different colors correspond to different concentrations of the analyzed solutions.
Inventions 08 00111 g012
Figure 13. FTIR spectrum of Crestor 20 mg (a) and Simvacard 20 mg (b).
Inventions 08 00111 g013aInventions 08 00111 g013b
Table 1. Equations of linear dependencies and coefficients of determination obtained when using SPCE and MWCNT/SPCE in solutions containing rosuvastatin and simvastatin, respectively. Scan rates between 0.1 V/s and 1.0 V/s
SensorI vs. vR2log (I vs. v)R2
Rosuvastin
SPCEI(μA) = 96.099v(V/s) + 4.05490.9946log I(μA) = 0.9312 log v(V/s) + 1.82590.967
AuNP-MWCNTs/SPCEI(μA) = 218.11v(V/s) + 9.04630.9954log I(μA) = 0.8871 log v(V/s) + 2.0660.977
Simvastatin
SPCEI(μA) = 76.199v(V/s) + 2.05390.9955log I(μA) = 0.4512 log v(V/s)+ 1.05240.968
AuNP-MWCNTs/SPCEI(μA) = 208.17v(V/s) + 8.02530.9962log I(μA) = 0.7861 log v(V/s) + 2.1250.978
Table 2. Slope I vs. v and Г corresponding to the two sensors.
ElectrodeSlope (A × s/V)Γ (mol × cm−2)
Rosuvastatin
SPCE0.0000960993.512·10−11
AuNP-MWCNTs/SPCE0.000218116.829·10−11
Simvastatin
SPCE0.0000761996.969·10−11
AuNP-MWCNTs/SPCE0.000208171.904·10−10
Table 3. The values of the limits of detection and quantification of the two sensors for the analysis of the two statins.
Sensor/AnalyteCalibration EquationR2LOD (μM)LOQ (μM)
RVSVRVSVRVSVRVSV
SPCEI = 0.0009c + 0.365I = 0.001c + 0.7130.9860.9815.374.8317.916.1
AuNP-MWCNTs/SPCEI = 0.0032c + 0.666I = 0.0011c + 0.7200.9540.9880.1510.3025.031.01
Table 4. Sensitive materials, LOD, LOQ and linear range of the main voltammetric sensors used for the detection of RV and SV.
SensorLOD (μM)LOQ (μM)Linearity Range (μM)Ref.
RV
GCE0.1940.66150–2500[26]
GCE26.65–12.5[27]
Boron-doped Diamond Electrode (BDD)1.04-9.40–88.8[28]
AuNP-MWCNTs/SPCE0.1515.0320–275 This work
SV
Ni/NiWN (nickel hydroxide) electrode4.88 16.350–400[29]
GCE0.550-2–100[51]
Carbon Paste Electrode Bulk-Modified with Multiwalled Carbon Nanotubes0.240.83.75–20[30]
AuNP-MWCNTs/SPCE0.3021.0150–350 This work
Table 5. Recovery test at rosuvastatin and simvastatin quantification.
Added Concentration
(×10−5 M)
Found Concentration
(×10−5 M)
Recovery (%) ± RSD (n = 5)
Rosuvastatin
44.23105.8 ± 0.9
76.9799.6 ± 0.8
1010.06100.6 ± 0.9
Simvastatin
22.13106.5 ± 0.9
43.9799.3 ± 0.8
66.16102.6 ± 0.9
Table 6. Influence of Atorvastatin on the Determination of RV and SV.
Stock SolutionInterferent CompoundRaportRecovery/%
RVAtorvastatin1:1102 ± 1.4
SV1:1103 ± 2.2
Table 7. The quantities of rosuvastatin in Crestor obtained via the voltammetric method and the FTIR method.
Pharmaceutical ProductQuantity Reported by Producer/mgDetected Quantity
CV Method (mg) Coefficient of Variation (%)FTIR Method (mg) Coefficient of Variation (%)p Valuet Statistic
Crestor109 2.210 1.70.6109−0.542
2021 1.022 2.0
4041 1.439 2.0
Simvacard1010 2.39 2.5
2021 1.019 1.9
4040 1.341 1.5
Disclaimer/Publisher’s Note: The statements, opinions and data contained in all publications are solely those of the individual author(s) and contributor(s) and not of MDPI and/or the editor(s). MDPI and/or the editor(s) disclaim responsibility for any injury to people or property resulting from any ideas, methods, instructions or products referred to in the content.

