

Optimal Siting and Sizing of Electric Vehicle Energy Supplement Infrastructure in Highway Networks

1
School of Mathematics and Physics, Xi’an Jiaotong-Liverpool University, Suzhou 215123, China
2
School of Advanced Technology, Xi’an Jiaotong-Liverpool University, Suzhou 215123, China
3
School of Electrical Engineering, Electronics and Computer Science, University of Liverpool, Liverpool L69 3GJ, UK
4
Shien-Ming Wu School of Intelligent Engineering, South China University of Technology, Guangzhou 510640, China
*
Author to whom correspondence should be addressed.
Inventions 2023, 8(5), 117; https://doi.org/10.3390/inventions8050117
Submission received: 10 August 2023
/
Revised: 2 September 2023
/
Accepted: 7 September 2023
/
Published: 15 September 2023
(This article belongs to the Special Issue Connected Vehicles and Charging Infrastructure: Innovations and Security)
Abstract
:The electric vehicle (EV) market is expanding rapidly to achieve the future goal of eco-friendly transportation. The scientific planning of energy supplement infrastructures (ESIs), with appropriate locations and capacity, is imperative to develop the EV industry. In this research, a mixed integer linear programming (MILP) model is proposed to optimize the location and capacity of ESIs, including vehicle charging stations (VCSs), battery swapping stations (BSSs), and battery charging stations (BCSs), in highway networks. The objective of this model is to minimize the total cost with the average waiting time for EVs being constrained. In this model, battery swapping and transportation behaviors are optimized such that the EV average waiting time can be reduced, and the average queue and service process waiting time is estimated by the M/M/1 model. Real-world data, i.e., from the London M25 highway network system, are used as a case study to test the effectiveness of the proposed method. The results show that considering battery transportation behaviors is more cost efficient, and the results are sensitive to the EV average waiting time tolerance, battery cost, and charging demand.
1. Introduction
Carbon dioxide emissions have caused severe environmental problems such as global warming. In order to solve this problem, the Paris Agreement was signed in 2015, aiming to reduce greenhouse gas emissions to limit the global temperature increase [1]. In particular, 16% of CO2 emissions around the world are caused by road transport [2]. Due to their low CO2 emissions, EVs have become a core technology in decarbonization. Under such circumstances, the last ten years have seen a significant increase in EV sales. In the 2021 new-car market, the share of EVs was 9% globally, while in China, this number reached 16% [2]. Overall, EVs are becoming a significant component of road transport.
Meanwhile, due to their limited battery capacity and long charging time, EVs are highly dependent on energy supplement infrastructure, especially in long-distance cases. However, energy supplement infrastructure is lacking around the world. According to the UK government, as of 1 July 2023, there are 44,020 charging devices in the country, and the number of devices per 100,000 population is 66. When it comes to rapid or quicker chargers, on average, 7937 people are sharing one device [3]. The gap between charging infrastructure supplementation and growing charging demand can lead to low efficiency in energy supplementation, which has caused significant resistance to EV user extension [4].
In particular, energy supplement efficiency is of great importance in the highway scenario. Compared to fuel vehicles, EVs have a significant energy supplement shortage due to the lower coverage of charging stations than gas stations, and the longer time cost for charging compared to fuel filling. This problem becomes more severe for long-distance trips. To solve this problem to some extent, one approach is to deploy more charging devices in the highway network, while another is to develop technologies that improve charging efficiency, including fast charging and battery swapping. Currently, few battery swapping stations have been constructed in the UK, and the number of EVs per charger in the UK has maintained a growing trend since 2019, indicating that the establishment of charging devices cannot fit the growing EV quantity [5]. The scientific planning of energy supplement infrastructure, including charging stations and battery swapping stations, is a key problem to be solved.
This research is motivated by problems related to the energy supplementation of EVs, especially in the highway scenario. To improve energy supplementation efficiency and reduce the average waiting time of EVs, three main components of the energy supplement infrastructure system, vehicle charging station (VCS), battery swapping station (BSS), and battery charging station (BCS), are considered. Moreover, to adapt to the spatial–temporal variability in charging demand, this research considers transporting the battery from low-demand stations to high-demand stations at a specific time. Such behaviors are generalized as the operation of batteries.
This paper is divided into the following sections: A literature review will be conducted in Section 2, and the research contributions will be outlined. In Section 3, the mathematical model will be introduced in detail, and the implementation will be covered in Section 4. Finally, Section 5 will provide a conclusion for this work.
2. Literature Review
The location allocation (LA) problem was first considered by Hakimi [6] in the form of a p-median model. The objective of this model is to find an optimal location in a network which minimizes the total distance to any other nodes in the network. Many researchers studied this work in the following decades. A number of studies related to location decisions for charging facilities were observed to be related to the basic p-median model [7].
With an increasing number of electric vehicles on the road network, some significant charging problems have appeared. Therefore, charging station (CS) planning problems have received more attention from researchers. CS-related problems can be classified as the refueling type in the location problems, with a frequency of 18% across all related papers [8]. Jia et al. proposed a mixed integer quadratic programming model to decide the siting and sizing of CSs, with the objective of minimizing the construction cost. An application of this model was introduced based on the city of Stockholm [9]. However, no waiting-time-related factors were considered in this model. Uslu and Kaya conducted a study on CS planning for intercity electric buses. With the aim of minimizing the construction cost for CSs and the waiting cost for customers, a mixed integer linear programming (MILP) model was raised [10]. In addition to relatively comprehensive targets, the model was designed for electric buses, which have stable running routes and timetables. Hence, this model does not work well for a general traffic network with diverse electric vehicles. From another aspect, Ma et al. proposed a model which minimized both user cost and station cost, and a model was then developed by applying game theory [11]. Meanwhile, some studies consider uncertainty in charging station siting and sizing problems, and the Monte Carlo method and adaptive differential evolution optimization algorithm are applied to determine the result [12,13]. Further, some studies consider optimal charging station planning in a coupled power and transportation network. The Pareto method is then applied to find the optimal solution [14]. Some other researchers claimed that the charging problem can be solved to some extent via a system dynamic operation approach or a Geographical Information System-based approach [15,16].
The battery swapping mode is more flexible to deal with non-uniform-distributed charging demand with peaks and valleys [17]. However, according to Revankar and Kalkhambkar, compared to CSs, an extra business plan is necessary for BSS [18]. This is so that an energy management plan for batteries, such as valley filling, can be determined by a distribution system organizer to achieve higher efficiency in energy supplementation [19]. Lu and Gao proposed a battery charging and swapping model aimed at reducing the waiting time before charging by providing a battery swapping service at CSs. Then, the optimal operation pattern for batteries can be found using the mixed integer linear programming (MILP) method, aiming to minimize the charging and transportation costs of batteries [20]. Xiang and Zhang studied the location determination for the battery CS of city buses, with a programming model minimizing the total cost, solved using the particle swarm optimization (PSO) algorithm. Also, the case based on the bus routes in Nanjing was studied, with eight nodes being picked as stations [21]. Liu et al. proposed a system including battery swapping, battery charging, and battery logistics. Mixed integer linear programming (MILP) was applied to determine the operational management approach [22]. However, the BCSs do not serve EVs directly, resulting in center-distributed BCSs. Zhang et al. studied capacity evaluation for CSs and BSSs which serve taxis and buses only [23]. A probabilistic model was raised, with solutions determined via a Monte Carlo simulation.
In general, existing studies on facility location problems mainly focus on cost and time efficiency. For example, Jia et al. and Xiang and Zhang [9,21] focused on total cost minimization, while in the model proposed by Lu and Gao, the objective function was to minimize waiting time [20]. Some studies considered both economic optimization and time efficiency, such as Uslu and Kaya [10]. The waiting time is usually determined using Markovian queuing theory. Some other approaches to reduce waiting time in energy supplement include adapting EV routing [24] and dynamic pricing [25], with energy supplement infrastructure as a given parameter.
This paper advances the relevant literature through the following contributions:
- This study establishes a coupled MILP model to optimize the battery quantity and the planning of VCS, BSS, and BCS while considering battery transportation and the EV battery’s energy supplement behavior (EV charging, EV battery swapping, and battery charging). This is the first study to integrate various charging/swapping station planning approaches with different charging/swapping behaviors.
- A chance constraint is set to consider more realistic scenarios regarding the average waiting time for electric vehicle charging.
- This research designs a model based on general traffic flow in a real highway network, which is a more general case compared to buses or taxis in a city road network.
3. Methodology
3.1. Research Question Statement
This paper proposes a method to determine the optimal siting and sizing of the VCSs, BSSs, and BCSs. In this research, the following behaviors in the energy supplement system are considered: 1. EV charging behavior; 2. EV battery swapping behavior; 3. battery charging behavior; 4. battery transportation behavior. Figure 1 shows the four behaviors in the network.
To give a further explanation of Figure 1, when an EV enters an ESI, it can be served by either a VCS or BSS; if the EV is served by a BSS, then the battery being swapped may be charged at a VCS or BCS at the same ESI, or it may also be transported to other ESI for charging. Compared to common ESI systems, merely with VCSs, in this model, infrastructure supporting the usage of batteries such as BSSs and BCSs is designed. Also, batteries can be transported between ESIs. In this way, energy supplement efficiency for EVs can be improved, and problems caused by spatial–temporal unbalanced charging demand can be solved to some extent.
The objective function of this model is to minimize the cost of station construction as well as battery purchasing and transportation, with the EV average waiting time being shorter than the given bound. The solution will indicate whether a VCS, BSS, or BCS is built at one node, and the capacity of the stations. Here, capacity refers to the largest number of vehicles that can be served at the same time. For VCSs and BCSs, the capacity refers to the number of chargers; for BSSs, the capacity is the number of battery swapping devices. Also, a pattern for battery transportation will be given to balance the inadequate charging capacity at one node and surplus charging capacity at another node. To achieve this, a mixed integer linear programming (MILP) model is introduced to optimize the location and capacity of VCSs, BSSs, and BCSs, the battery transportation behaviors, and the battery distribution at the operation start time.
3.2. Parameters and Variables
- (a)
- Parameters
: The set of all nodes in the system.
: The maximum capacity of vehicle charging stations (VCSs).
: The maximum capacity of battery swapping stations (BSSs).
: The maximum capacity of battery charging stations (BCSs).
: The cost of building a vehicle charging station with capacity c.
: The cost of building a battery swapping station with capacity c.
: The cost of building a battery charging station with capacity c.
: The general cost of each battery in a planning lifespan of ten years.
r: The regulated maximum distance between two energy supplement infrastructures.
: The exact charging time for each vehicle and empty battery.
: The exact battery swapping time for each vehicle.
: The tolerance of average waiting time at energy supplement stations for vehicles.
: The minimum probability that the average waiting time tolerance holds.
: The number of observed days for charging demand estimation.
: The observed number of vehicles to be filled at node k in time interval t on date n.
: The value at risk of a number of vehicles to be filled at node k in time interval t.
: Distance in the highway network from i and j.
: The transportation time for batteries from node i to node j.
: Takes a value of 1 if node k is on the shortest path from i to otherwise.
w: The general cost of battery transportation in a planning lifespan of ten years per battery per kilometer.
: The battery operation beginning time.
: The battery operation ending time.
- (b)
- Decision Variables
: Takes a value of 1 if a vehicle charging station is built at node k with capacity otherwise.
: Takes a value of 1 if a battery swapping station is built at node k with capacity otherwise.
: Takes a value of 1 if a battery charging station is built at node k with capacity otherwise.
: Takes a value of 1 if either a vehicle charging station or a battery swapping station is built at node otherwise.
: The number of EV batteries can be swapped at node k in time interval t.
: The number of EVs can be charged at node k in time interval t.
: The number of batteries that start to charge at the vehicle charging station at node k at the beginning of time interval t.
: The number of batteries that start to charge at the battery charging station at node k at the beginning of time interval t.
: The number of full batteries at node k at the beginning of time interval t.
: The number of empty batteries at node k at the beginning of time interval t.
: The number of full batteries beginning transport from node i to node j in time interval t.
: The number of empty batteries beginning transport from node i to node j in time interval t.
: The number of full batteries placed at node k at the battery operation beginning time.
- (c)
- Auxiliary Variables
: Service rate at node k in time interval t, namely, the number of vehicles that can be charged or battery swapped provided by the energy supplement infrastructure.
: Arrival rate at node k in time interval t, namely, the number of vehicles to be filled.
3.3. Model
The model is developed to minimize the total cost. Meanwhile, to make the station capacity well defined, the battery behavior reasonable, and the waiting time limited, some constraints are set. The general idea of the development of this model is shown in Figure 2.
- (a)
- Objective Function
The object of this model is to minimize the total cost, including the construction cost of vehicle charging stations, battery swapping stations, and battery charging stations, the transportation cost of full batteries and empty batteries, and the cost of purchasing extra batteries for swapping.
- (b)
- Constraints on Siting and Sizing of Energy Supplement Infrastructure
Given a node k, the vehicle charging station, battery swapping station, and battery charging station should either have a unique capacity or not exist (i.e., have capacity zero). Since , , and are binary variables, the values of these variables can be either zero or one. Constraints , and ensure that at most one capacity is allocated to a vehicle charging station, a battery swapping station, or a battery charging station at the given node.
Constraints (5) and (6) ensure that is one if some energy supplement infrastructure exists for vehicles (i.e., vehicle charging station and battery swapping station) at node k; otherwise, it is zero.
Constraint (7) ensures that the distance between two arbitrary energy supplement infrastructures for EVs has an upper bound of r. The term equals one if and only if node k is on the route from i to j with at least one energy supplement infrastructure. Therefore, the second term in the parentheses, i.e., the sum term, represents the total number of nodes with energy supplement infrastructure on this route, leading to the right-hand side of the inequality representing the maximum possible running distance, which should definitely be larger than or equal to the distance from i to j. This should be true for the arbitrary origin and destination. In this way, the limitation on the maximum distance between the infrastructure can be ensured.
- (c)
- Constraints on Battery Charging and Transportation
Constraints (8) and (9) ensure that the same number of full batteries can be transported back to the node where it is put into circulation, which is exactly the number of batteries being purchased and placed at this node. This is an assumption of this model to make sure that the battery operation is reasonable. Constraint (10) indicates that no empty batteries are put into operation at the beginning time.
Constraints (11) and (12) ensure the balance of full batteries and empty batteries. Note that is the minimal integer larger than or equal to . Constraint (11) shows that the number of full batteries in one time interval equals the number in the last time interval plus the number of batteries which have finished charging and the number of batteries being transported to this station, and minus the number of full batteries being swapped in the past interval and the number being transported away. Constraint (12) is constructed in a similar way. Note that Constraints (11) and (12) are developed based on the assumption that all batteries being swapped from EVs are empty.
Constraint (13) ensures that the number of batteries that begin charging in one time interval should be less than or equal to the number of empty batteries, where batteries being charged equals the number of batteries being charged at vehicle charging stations plus the number of batteries being charged at battery charging stations. Constraint (14) ensures the number of batteries being charged at the vehicle charging station is less than or equal to the charging capacity of the station. Similarly, (15) sets the same constraint for battery charging stations. Constraint (16) ensures that the number of batteries being swapped is limited by the swapping ability of the battery swapping station.
Constraints (17) and (18) ensure that the number of batteries for transportation is reasonable. For full batteries, it should be less than or equal to the number of full batteries at the beginning of the time interval minus the number being swapped in the one-hour interval, while for empty batteries, the right-hand side of the inequality should be the number of empty batteries plus the swapping number.
Constraint (19) ensures that, at each time, the total number of batteries should equal the number of all batteries in this model, namely, the sum of full batteries at the beginning time at all nodes.
- (d)
- Chance Constraint on EV Average Waiting Time
In this model, the EV average waiting time at an ESI is defined to be the sum of the waiting time in the queue and service time. Then, a chance constraint is set to ensure that the EV average waiting time is limited to some extent.
Constraint (20) builds the relationship between the available capacity, the capacity occupied by EVs, and the battery at time t node k. For EVs, the available capacity at period t should be less than or equal to the total VCS capacity at node k minus the sum of capacities occupied by battery charging and vehicle charging.
Constraints (21)–(22) are developed based on the M/M/1 queuing model. The M/M/1 queuing model, as shown in Figure 3, is applied here to estimate queuing at vehicle charging stations and battery swapping stations, which assumes that the arrival process and the service process (i.e., charging and battery swapping) at node k in time interval t follow a Poisson distribution with parameters and , and a server number of one. Note that the server number does not represent the capacity here, since the effect of capacity c is shown by the service rate , and the energy supplement infrastructure is viewed as a whole server in this model.
Constraint (21) indicates that the service rate at node k at time interval t is the sum of available charging service times plus available battery swapping service times. Based on the arrival rate and service rate, a chance constraint for waiting time, Constraint (22), can be developed. For the M/M/1 model, is the average waiting time at node k at time interval t, including queuing time and charging time [26]. Then, for the given maximum waiting time ,
should be upheld. If an energy supplement infrastructure is built at node k, then the constraint for waiting time is
The chance constraint of EV waiting time is modeled as follows. The idea comes from the nonuniform distribution of the amount of traffic. It is observed that the peak during festivals and holidays can be several times that of the normal amount of traffic, while charging demand is proportional to this. Under such circumstances, the waiting time constraint should not be strictly satisfied for all days, which can result in a waste of resources during normal days. Then, the lower bound is set, which is the probability that the waiting time constraint holds.
The chance constraint gives a stochastic portrait to charging demand in this determined MILP model. Inspired by the sample average approximation method, in this context, historical data in April 2023 (i.e., parameter ) were picked to represent the distribution of charging demand on different days, and the concept of value at risk will be applied to quantify the probability. First, by substituting Equation (21) into inequality (22), we obtain
To solve (23), the concept of value-at-risk VaR is applied [27].
Similarly, the chance constraint can be transformed into an inequality of the VaR of the charging demand. As introduced in the parameter section, is the observed charging demand at node k at time interval t on date n. For the given node k and time interval t, there exist a series of data indicating the charging demand on different days; this data series can be viewed as a set with cardinality n, say the set at node k at time interval t. This research assumed that 30 observations from 1 April 2023 to 30 April 2023 were picked to estimate the charging demand; hence, . Another assumption is that the random variable of the charging demand follows the same distribution as the data distribution in this set. Then, the chance constraint (23) is equivalent to the following inequality:
where
4. Case Study with Numerical Results
4.1. Parameter Settings
The proposed method of siting and sizing for energy infrastructure, including battery transportation, is tested in a real highway network, where the London M25 highway network and travel data are chosen as a case study. As shown in Figure 4, 14 places near the highway are picked as potential locations for energy supplement infrastructure.
The estimation of charging demand is based on the assumption that the charging demand is proportional to the passing traffic amount. The UK National Highways publishes the traffic data from billions of monitoring points on the portal [28]. To obtain the traffic passing the nodes in the graph, the traffic data from the nearest monitoring point to the node are selected.
After obtaining the traffic amount, it is necessary to determine the coefficient between the traffic amount and charging demand. The average percentage of EVs among all vehicles is about 10%, nearly three times the current percentage. In addition, battery technology is constantly improving, and the mileage is generally around 600 miles. According to the constraints, the distance between energy supplement infrastructure should be no more than 30 miles. Hence, it is estimated that 5% of EVs passing an energy supplement infrastructure need to be filled. Thus, the charging demand is determined to make up 0.5% of the traffic amount passing the node.
The other parameters are listed in Table 1.
4.2. Planning Results for Energy Supplement Infrastructure
The optimization model is formulated to a MILP problem based on the MATLAB R2022a platform and solved using the Gurobi 9.5.1 solver. The model has 11,592 variables and 3834 constraints.
The optimization results show that there are 698 charging piles in VCS, 57 battery swapping platforms in BSS, and 630 battery charging capacities, with 1198 batteries for swapping in the London M25 highway network. The total cost in the planning lifespan is GBP .
A comparison of the optimization results between those with and without battery transportation is displayed in Table 2. It can be observed that the model with battery transportation provides a result that is more cost efficient than the result without battery transportation. By considering battery transportation, batteries are not necessarily charged at the node where they are swapped, leading to four fewer stations of BCSs. Also, improvements in efficiency lead to fewer VCS and BSS capacities. Despite the slightly greater battery cost, the costs of VCSs, BSSs, and BCSs are lowered in the model with battery transportation. Hence, the model with battery transportation provides a better result compared to the model without battery transportation.
Further, the transportation route and number of full/empty batteries being transported is displayed in Table 3. Following this, a detailed explanation of the effect of battery transportation behavior can be given. To reveal the detailed effect of transportation on the battery swapping system, node 4 is taken as an example. The main battery transportation behavior with respect to node 4 happens on the route between 4 and 5. For full batteries, transportation from node 5 to node 4 happens at time intervals 7, 12, 13, 14, 15, 16, 17, 18, 19, and 22. The transportation numbers are 25, 13, 25, 22, 23, 25, 23, 21, 18, and 97, respectively. For empty batteries, transportation from node 5 to node 4 happens at time intervals 6, 7, 8, 9, 10, 11, 12, 13, 14, 16, 17, and 20, and the transportation numbers are 13, 15, 27, 13, 30, 10, 28, 24, 24, 48, 27, and 59, respectively. Further, 25 empty batteries are transported from node 1 to node 4 at time 8, and 20 empty batteries are transported from node 4 to node 3 at time 11. Namely, many empty batteries are transported from node 4 to node 5 at some time intervals, and then full batteries are transported back from node 5 to node 4. By applying battery transportation, the battery charging demand at node 4 can be solved at ESIs at node 5. The construction cost of one BCS can be saved in this way, at the cost of more BCS capacities at node 5 and more transportation cost. In general, the cost of constructing a new BCS surpasses the cost of adding more capacities at an existing BCS plus the transportation cost between two near nodes in the ten-year planning lifespan. This example at node 4 shows the reason why the model with battery transportation is more cost efficient than the model without battery transportation.
4.3. Effect of Average Waiting Time Tolerance
The tolerance of the EV average waiting time is a vital parameter in this planning model. When the tolerance is quite large, the average waiting time constraint can be very loose, resulting in little energy supplement infrastructure and long queues at stations. However, if the tolerance is very strict, a large number of ESIs will be planned to satisfy this bound, which may result in a waste of resources. In this research, the average waiting time in the queue system is set to 0.5 h. To show the effect of the average waiting time tolerance on the planning result, we have this tolerance moving from 0.1 to 0.9 in a step length of 0.1.
As shown in Figure 5, the total cost is sensitive to the average waiting time tolerance. In particular, the construction costs of VCSs and BCSs are sensitive, while the BSS cost and battery cost are not that sensitive. Also, it can be observed that the result is not sensitive to the parameter when is larger than 0.5.
4.4. Effect of Battery Cost
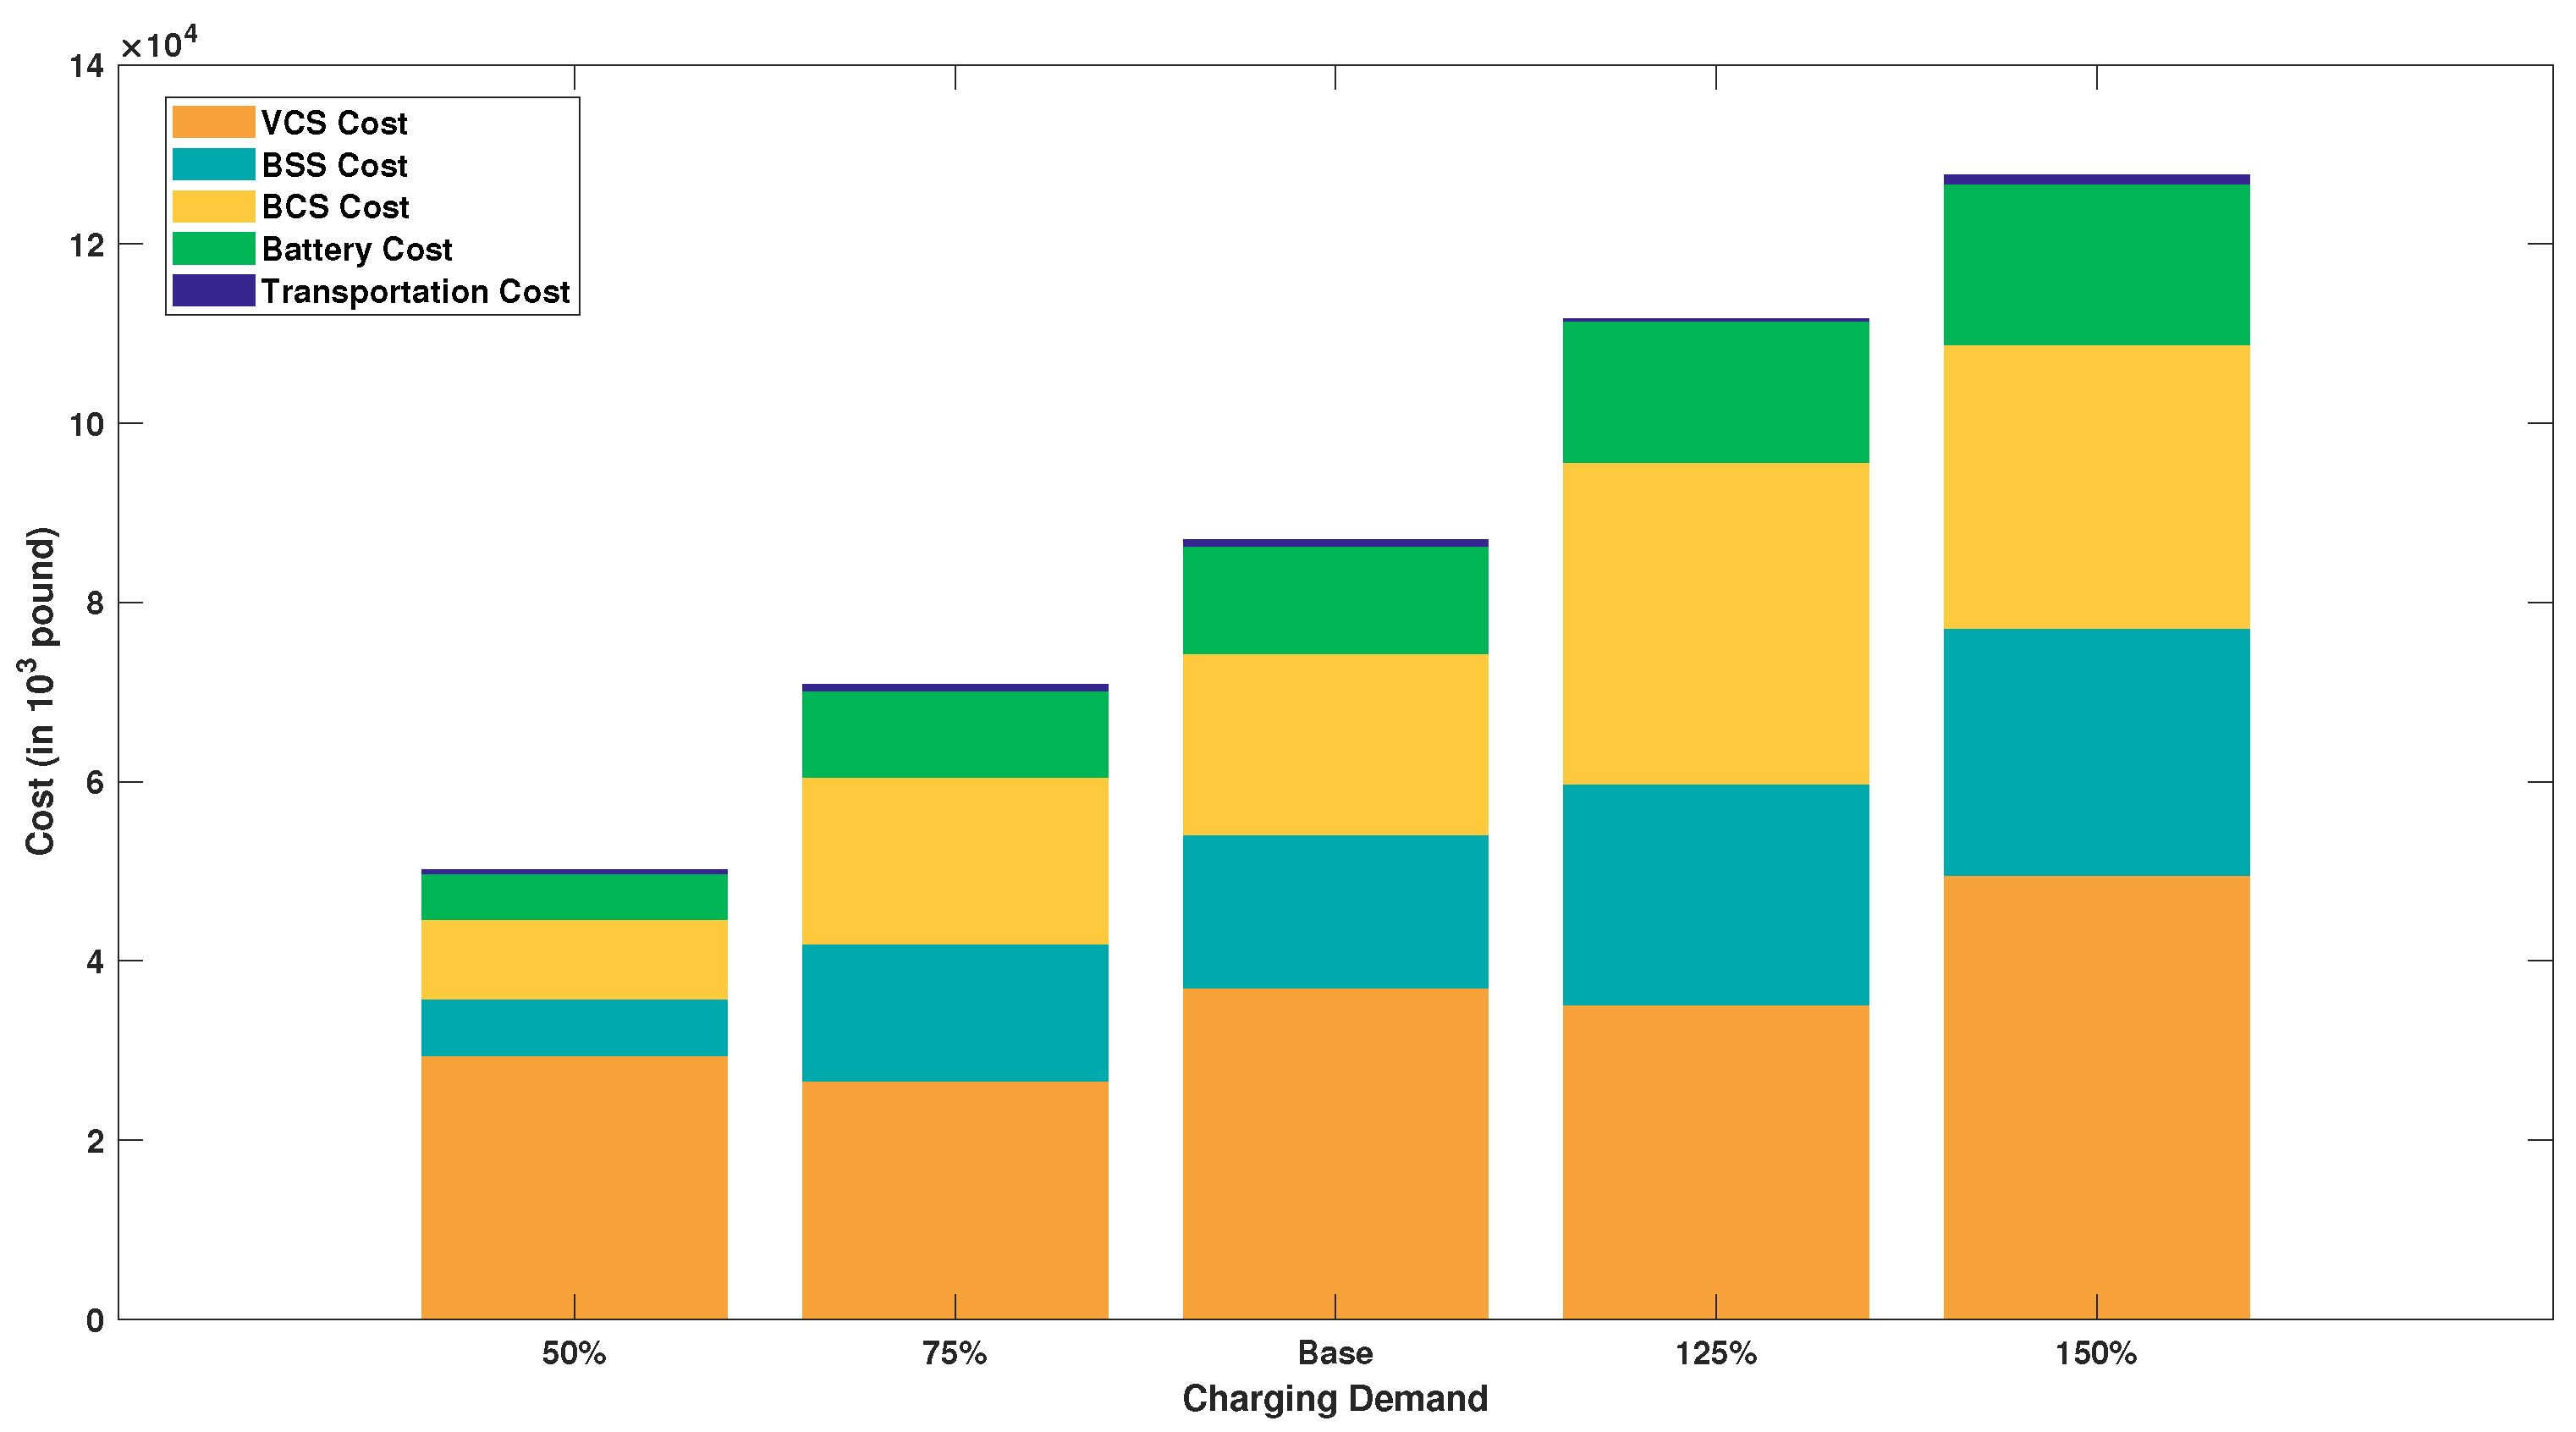
The charging demand decides the energy supplement infrastructure velocity directly. As shown in Figure 6, the total cost is sensitive to charging demand. In particular, there is no clear trend for VCSs, while battery swapping and charging-process-related parts, including BSSs, BCSs, and batteries, demonstrate a strong positive relationship with the charging demand. This trend shows that from the cost-efficiency perspective, when the charging demand grows, developing a battery swapping system works better than building more vehicle charging stations.
4.5. Effect of Charging Demand
As the cost of the battery increases, the total cost increases, and the number of batteries for service decreases, as shown in Figure 7. Among the total cost, the cost of VCSs grows significantly, while the costs of BSSs and BCSs decrease. The reason for this phenomenon is that as the battery cost increases, the share of battery swapping services decreases, while the share of charging increases. The cost of batteries experienced an increase before reaching GBP 10,000, due to the increment in battery unit price. Meanwhile, a drop in battery cost can be observed as the unit price grows larger than GBP 10,000, due to the reduction in battery swapping services.
5. Conclusions
This paper proposed a siting and sizing model of an energy supplement system including vehicle charging stations, battery swapping stations, and battery charging stations in the highway network. MILP is used to construct the model, where the EV average waiting time is formulated as a chance constraint. A case study is carried out.
The planning model results show that, on average, the waiting time of electric vehicles before energy filling is less than or equal to 0.5 h in 80% of circumstances. Vehicle charging stations and battery swapping stations are planned at all nodes to meet the energy supplement demand, while battery charging stations are only planned at certain nodes under some situations. Batteries are placed at nodes with battery swapping stations or nodes near battery swapping stations, and the operation result indicates that most battery transportation locations are near nodes. This planning model with battery transportation is more cost efficient than the model without battery transportation. Also, the constraints on the average waiting time of an EV demonstrates an obvious effect on the planning result, i.e., a stricter constraint on the average waiting time leads to more energy supplement infrastructure being planned.
The model proposed in this research can be applied to determine the optimal location and size of the energy supplement infrastructure. For ESI deployers and the government, the model can minimize the cost based on the condition that the charging demands of EV owners are satisfied to a certain level, while for EV owners, energy supplement becomes more convenient, and thus, waiting time can be shortened. Following this, the industry can be promoted, which benefits the goal of achieving eco-friendly transportation.
This work can be further improved by defining a more specific distribution of the service process and by estimating the waiting time using the M/G/1 queue model. In this research, the arrival process and service process of EVs are assumed to follow a Poisson distribution, and then the M/M/1 queue model is applied. For the arrival process this is reasonable, since the Poisson distribution represents a totally random process with a given mean value. However, for the service process, a more accurate distribution to represent the process is a specific distribution combining the service time of VCSs or BSSs and the probability of being served by VCSs or BSSs. Then, the M/G/1 queue model can be applied to this specific distribution. Moreover, the burden on the power grid by charging stations is ignored. The spatial–temporal distribution of the system’s charging load can affect the planning and operation of the power grid. To achieve an overall optimal solution of energy supplement infrastructure and the power grid, more factors such as the cost of power grid infrastructure and the power grid operation strategy can be be taken into consideration in future studies.
Author Contributions
Conceptualization, D.J. and B.H.; methodology, D.J. and B.H.; software, D.J.; validation, D.J., H.Z. and B.H.; formal analysis, D.J.; investigation, D.J.; resources, G.L., F.X. and S.L.; data curation, D.J.; writing—original draft preparation, D.J.; writing—review and editing, D.J. and H.Z.; visualization, D.J.; supervision, B.H.; project administration, B.H. and G.L.; funding acquisition, B.H. and F.X. All authors have read and agreed to the published version of the manuscript.
Funding
This work is partially supported by the XJTLU AI University Research Centre, Jiangsu Province Engineering Research Centre of Data Science and Cognitive Computation at XJTLU and SIP AI innovation platform (YZCXPT2022103). This work is supported and sponsored in part by XJTLU Research Development Funding, RDF-21-01-061.
Data Availability Statement
The data of highway traffic flow are available from the UK National Highways: https://webtris.highwaysengland.co.uk/ (accessed on 30 July 2023).
Conflicts of Interest
The authors declare no conflict of interest.
References
- UN. The Paris Agreement. Available online: https://www.un.org/en/climatechange/paris-agreement (accessed on 30 July 2023).
- IEA. Electric Vehicles. Available online: https://www.iea.org/energy-system/transport/electric-vehicles (accessed on 30 July 2023).
- GOV.UK. Electric Vehicle Charging Device Statistics: July 2023. Available online: https://www.gov.uk/government/statistics/electric-vehicle-charging-device-statistics-july-2023/electric-vehicle-charging-device-statistics-july-2023 (accessed on 30 July 2023).
- Leijon, J.; Boström, C. Charging Electric Vehicles Today and in the Future. World Electr. Veh. J. 2022, 13, 139. [Google Scholar] [CrossRef]
- Charge, T.F. NIO Ramps Up UK Team for Swap Station Launches. Available online: https://www.fastcharge.email/p/nio-swap-station-uk-launch (accessed on 26 August 2023).
- Hakimi, S.L. Optimum Distribution of Switching Centers in a Communication Network and Some Related Graph Theoretic Problems. Oper. Res. 1965, 13, 462–475. [Google Scholar] [CrossRef]
- Serra, D.; Marianov, V. The p-median problem in a changing network: The case of Barcelona. Locat. Sci. 1998, 6, 383–394. [Google Scholar] [CrossRef]
- Celik Turkoglu, D.; Erol Genevois, M. A comparative survey of service facility location problems. Ann. Oper. Res. 2020, 292, 399–468. [Google Scholar] [CrossRef]
- Jia, L.; Hu, Z.; Song, Y.; Luo, Z. Optimal siting and sizing of electric vehicle charging stations. In Proceedings of the 2012 IEEE International Electric Vehicle Conference, Greenville, SC, USA, 4–8 March 2012; pp. 1–6. [Google Scholar] [CrossRef]
- Uslu, T.; Kaya, O. Location and capacity decisions for electric bus charging stations considering waiting times. Transp. Res. Part D Transp. Environ. 2021, 90, 102645. [Google Scholar] [CrossRef]
- Ma, H.; Pei, W.; Zhang, Q.; Xu, D.; Li, Y. Location of Electric Vehicle Charging Stations Based on Game Theory. World Electr. Veh. J. 2023, 14, 128. [Google Scholar] [CrossRef]
- Jin, Y.; Acquah, M.A.; Seo, M.; Han, S. Optimal Siting and Sizing of EV Charging Station using Stochastic Power Flow Analysis for Voltage Stability. IEEE Trans. Transp. Electrif. 2023, 1. [Google Scholar] [CrossRef]
- Henrique, L.F.; Silva, W.N.; Silva, C.C.A.; Dias, B.H.; Oliveira, L.W.; Almeida, M.C.d. Optimal siting and sizing of distributed energy resources in a Smart Campus. Electr. Power Syst. Res. 2023, 217, 109095. [Google Scholar] [CrossRef]
- Keleshteri, S.F.; Niknam, T.; Ghiasi, M.; Chabok, H. New optimal planning strategy for plug-in electric vehicles charging stations in a coupled power and transportation network. J. Eng. 2023, 2023, e12252. [Google Scholar] [CrossRef]
- Kłos, M.J.; Sierpiński, G. Siting of electric vehicle charging stations method addressing area potential and increasing their accessibility. J. Transp. Geogr. 2023, 109, 103601. [Google Scholar] [CrossRef]
- Kłos, M.J.; Sierpiński, G. Strategy for the Siting of Electric Vehicle Charging Stations for Parcel Delivery Service Providers. Energies 2023, 16, 2553. [Google Scholar] [CrossRef]
- Zhang, L.; Zhou, S.; An, J.; Kang, Q. Demand-Side Management Optimization in Electric Vehicles Battery Swapping Service. IEEE Access 2019, 7, 95224–95232. [Google Scholar] [CrossRef]
- Revankar, S.R.; Kalkhambkar, V.N. Grid integration of battery swapping station: A review. J. Energy Storage 2021, 41, 102937. [Google Scholar] [CrossRef]
- Mehrjerdi, H. Resilience oriented vehicle-to-home operation based on battery swapping mechanism. Energy 2021, 218, 119528. [Google Scholar] [CrossRef]
- Lu, T.; Gao, C. A General Model for Optimal Scheduling of Battery Charging and Renewal Network. Power Syst. Technol. 2014, 38, 2700–2707. [Google Scholar] [CrossRef]
- Xiang, Y.; Zhang, Y. Optimal Location of Charging Station of Electric Bus in Battery Replacement Mode. In Smart Innovation, Systems and Technologies, Proceedings of the International Symposium for Intelligent Transportation and Smart City (ITASC) 2017 Proceedings, Shanghai, China, 19–20 May 2017; Zeng, X., Xie, X., Sun, J., Ma, L., Chen, Y., Eds.; Smart Innovation, Systems and Technologies; Springer: Singapore, 2017; pp. 113–125. [Google Scholar] [CrossRef]
- Liu, X.; Zhao, T.; Yao, S.; Soh, C.B.; Wang, P. Distributed Operation Management of Battery Swapping-Charging Systems. IEEE Trans. Smart Grid 2019, 10, 5320–5333. [Google Scholar] [CrossRef]
- Zhang, T.; Chen, X.; Yu, Z.; Zhu, X.; Shi, D. A Monte Carlo Simulation Approach to Evaluate Service Capacities of EV Charging and Battery Swapping Stations. IEEE Trans. Ind. Inform. 2018, 14, 3914–3923. [Google Scholar] [CrossRef]
- Schoenberg, S.; Dressler, F. Planning Ahead for EV: Total Travel Time Optimization for Electric Vehicles. In Proceedings of the 2019 IEEE Intelligent Transportation Systems Conference (ITSC), Auckland, New Zealand, 27–30 October 2019; pp. 3068–3075. [Google Scholar] [CrossRef]
- Xu, P.; Sun, X.; Wang, J.; Li, J.; Zheng, W.; Liu, H. Dynamic pricing at electric vehicle charging stations for waiting time reduction. In Proceedings of the 4th International Conference on Communication and Information Processing, ICCIP ’18, New York, NY, USA, 2–4 November 2018; pp. 204–211. [Google Scholar] [CrossRef]
- Bhat, U.N. An Introduction to Queueing Theory: Modeling and Analysis in Applications; Birkhäuser: Boston, MA, USA, 2008. [Google Scholar] [CrossRef]
- Crouhy, M.; Galai, D.; Mark, R. A comparative analysis of current credit risk models. J. Bank. Financ. 2000, 24, 59–117. [Google Scholar] [CrossRef]
- NationalHighways. WebTRIS—Map View. Available online: https://webtris.highwaysengland.co.uk (accessed on 30 July 2023).
Figure 1.
The behaviors of EVs and batteries in the highway network, with the box representing behaviors at a particular energy supplement infrastructure (ESI). Three behaviors happen in energy infrastructure: EV charging at VCSs, battery charging at BCSs and VCSs, and battery swapping at BSSs. Meanwhile, battery transportation behavior is conducted from one ESI to another in the highway network.
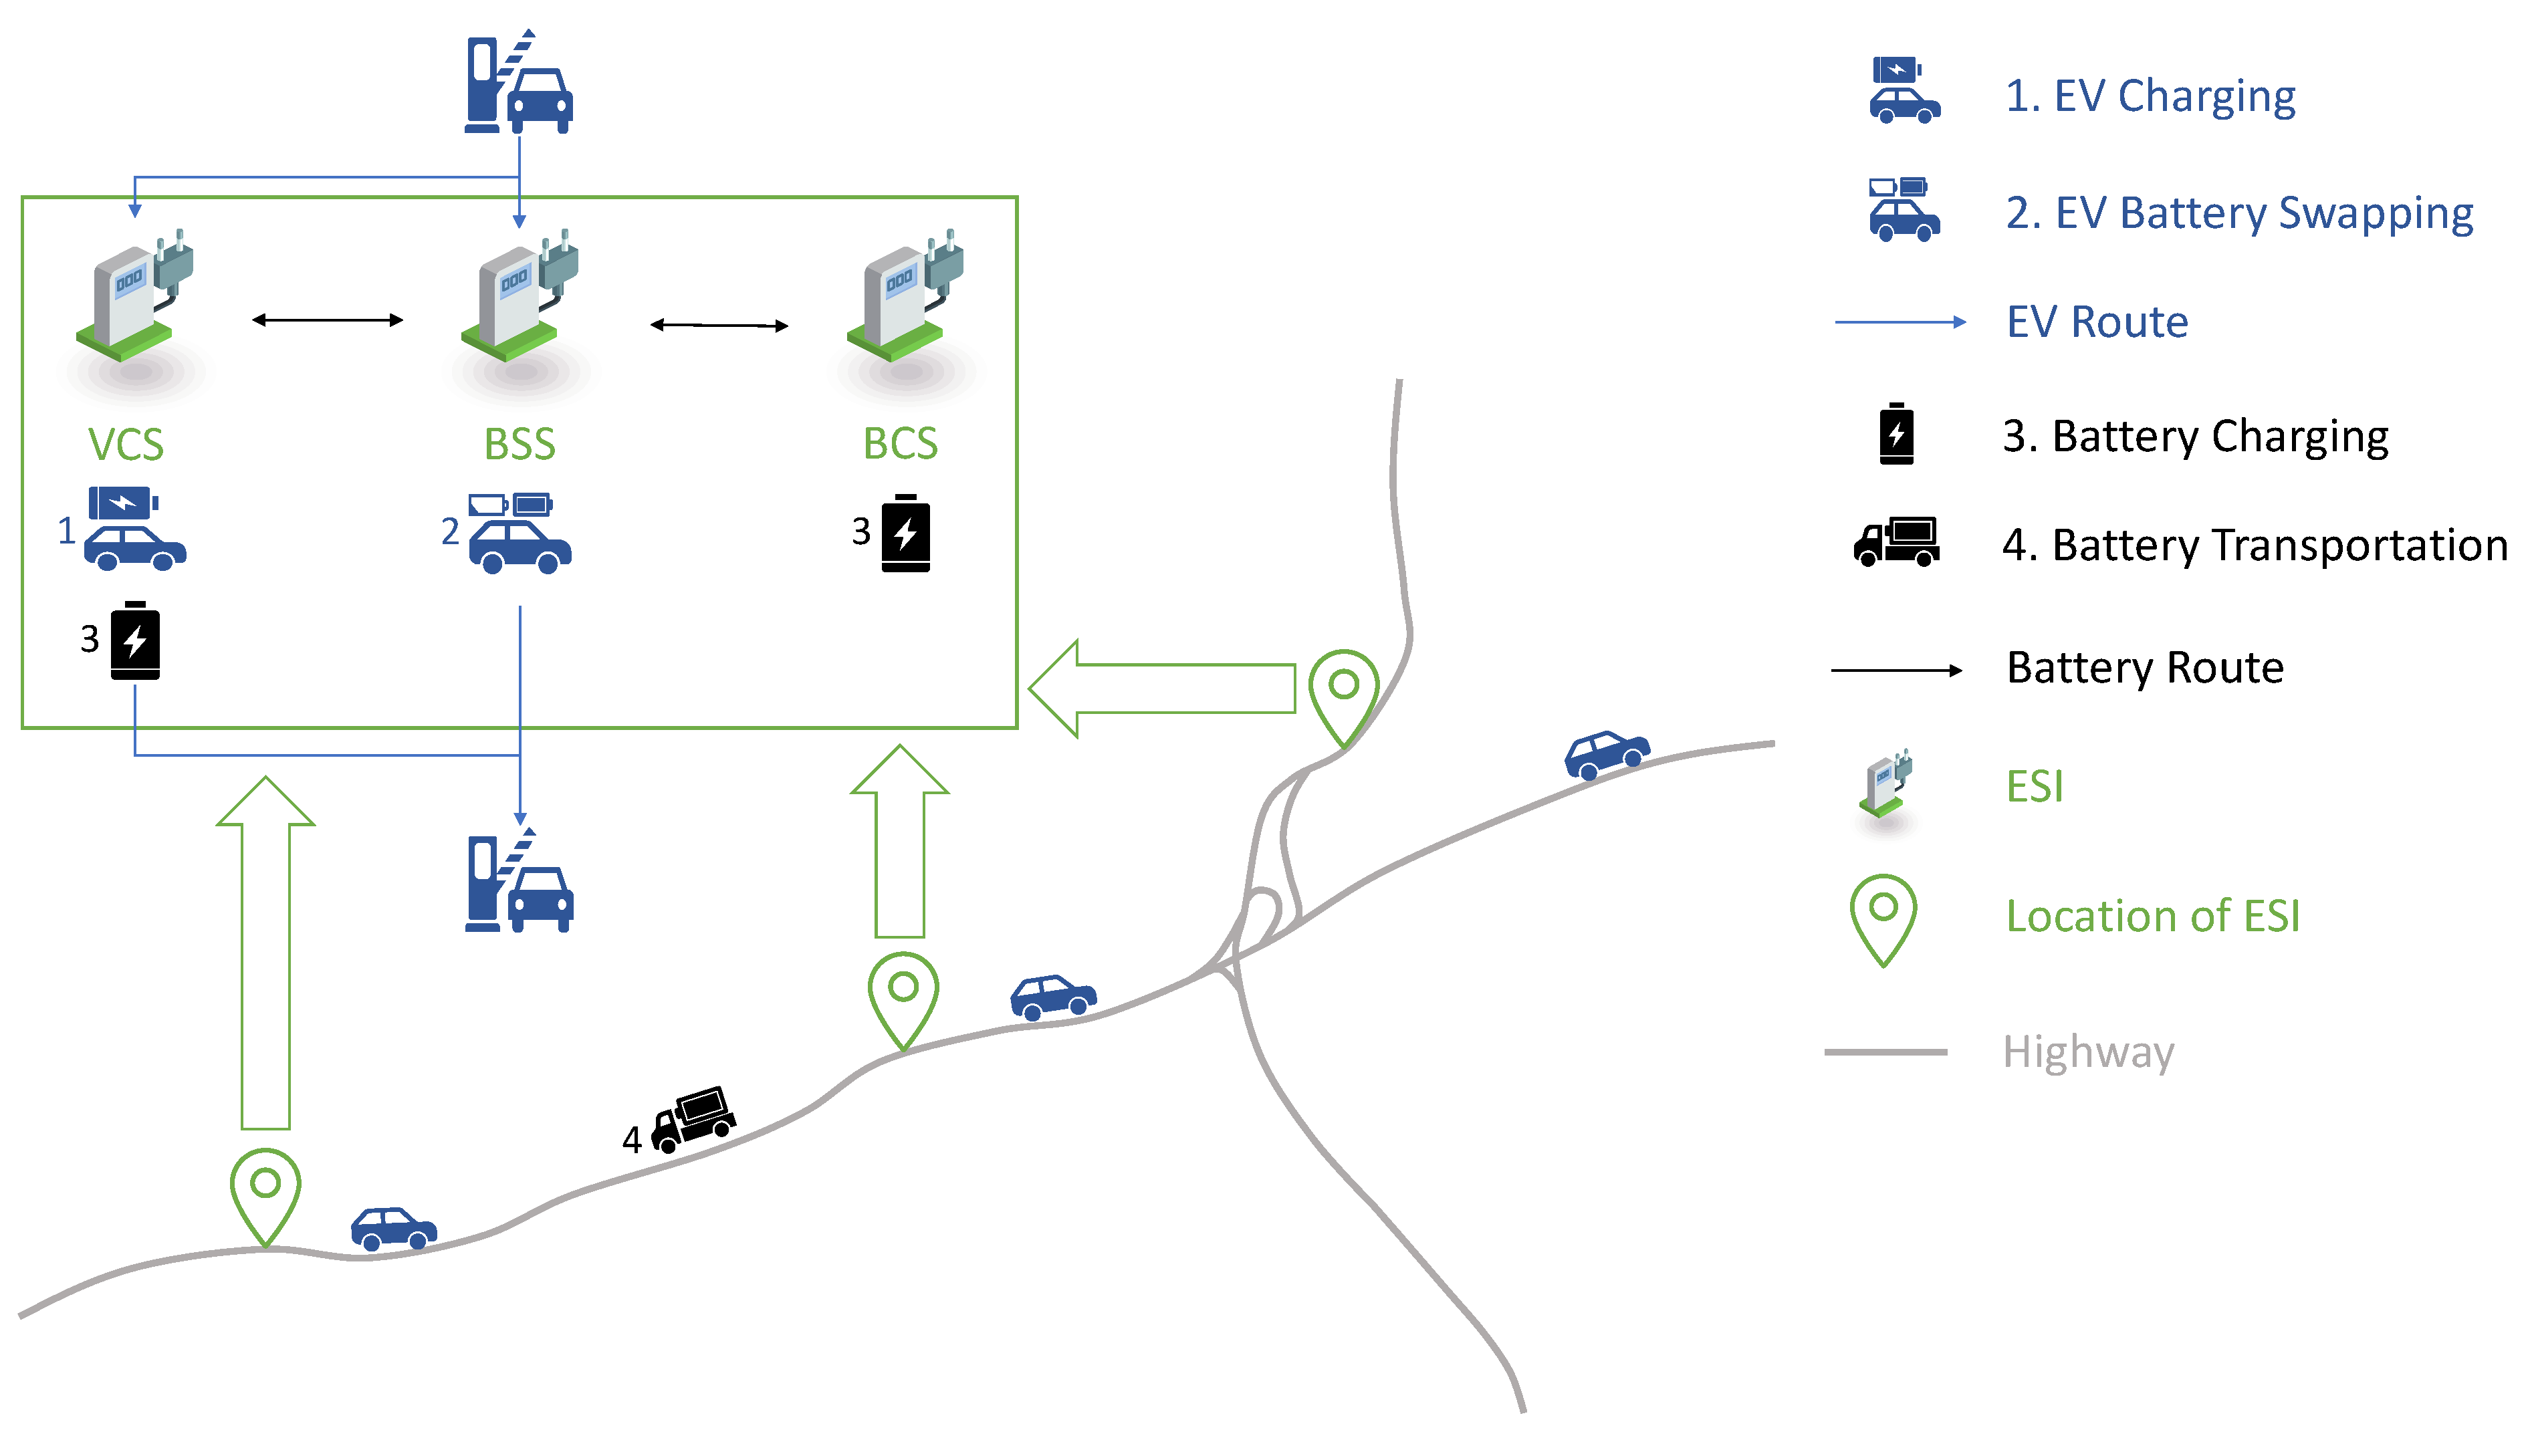
Figure 2.
A block diagram of the objectives and constraints of the model.
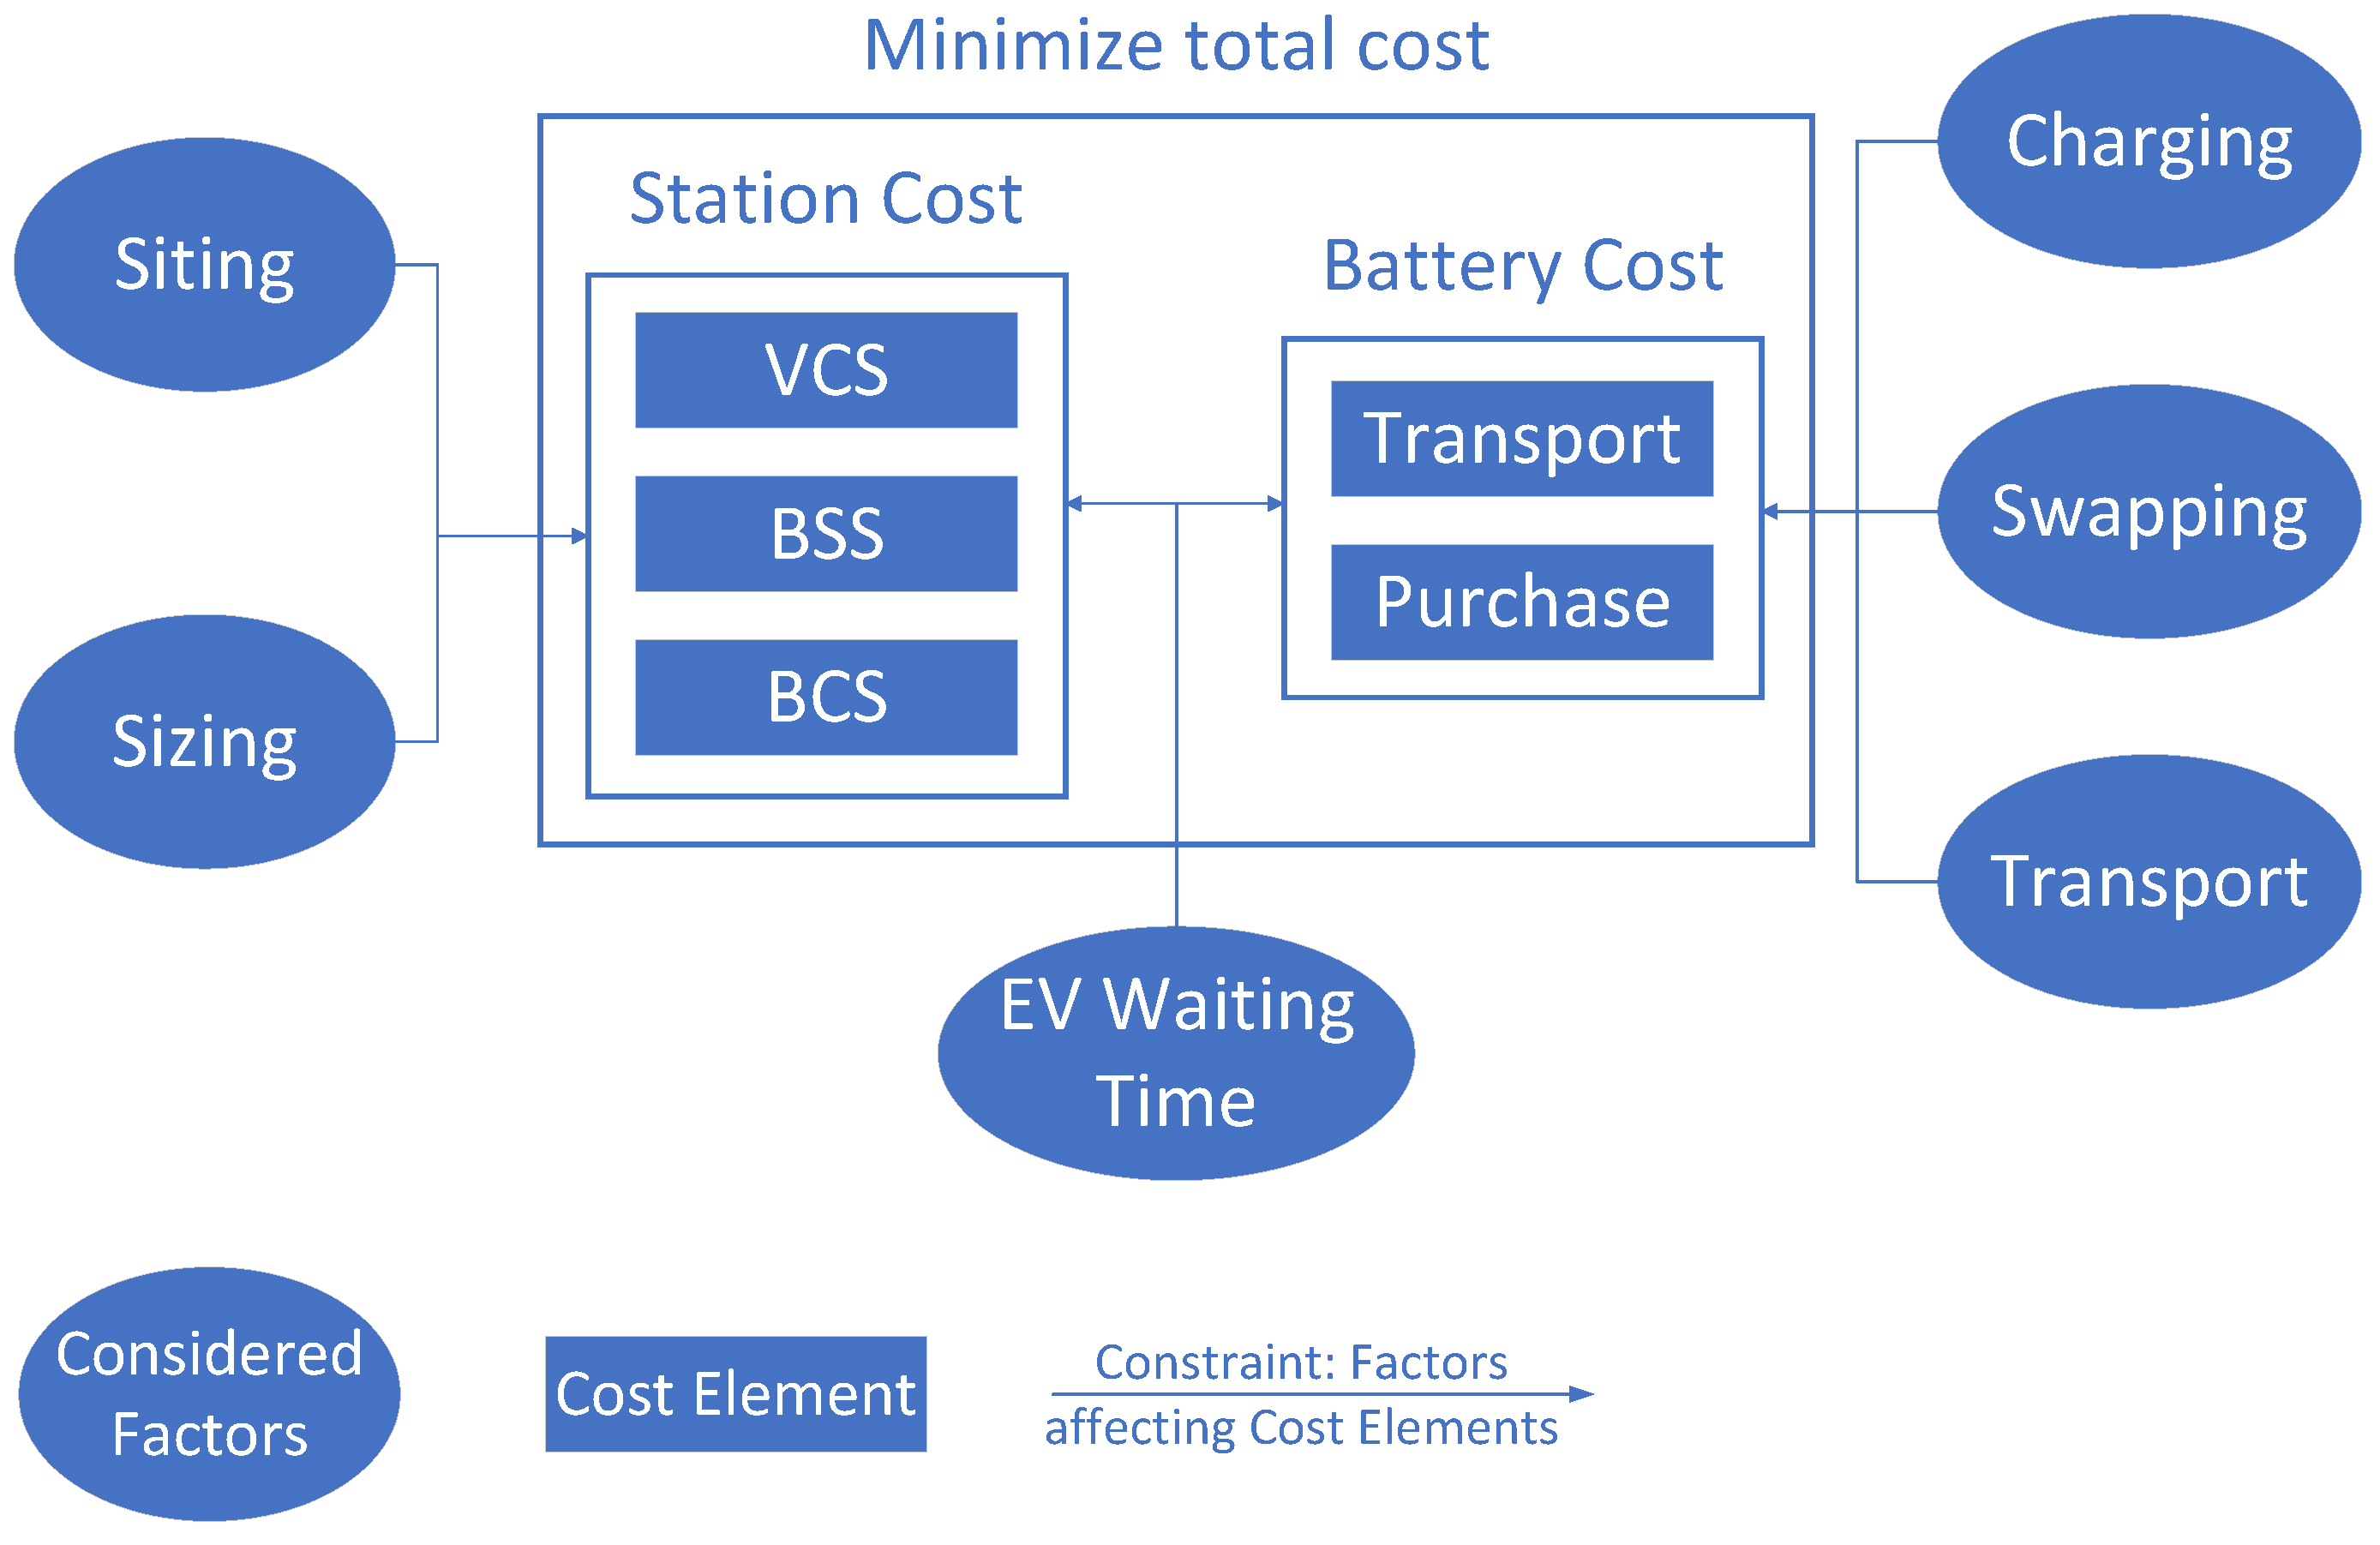
Figure 3.
Modeling of EV average waiting time at an ESI based on M/M/1 queue model.
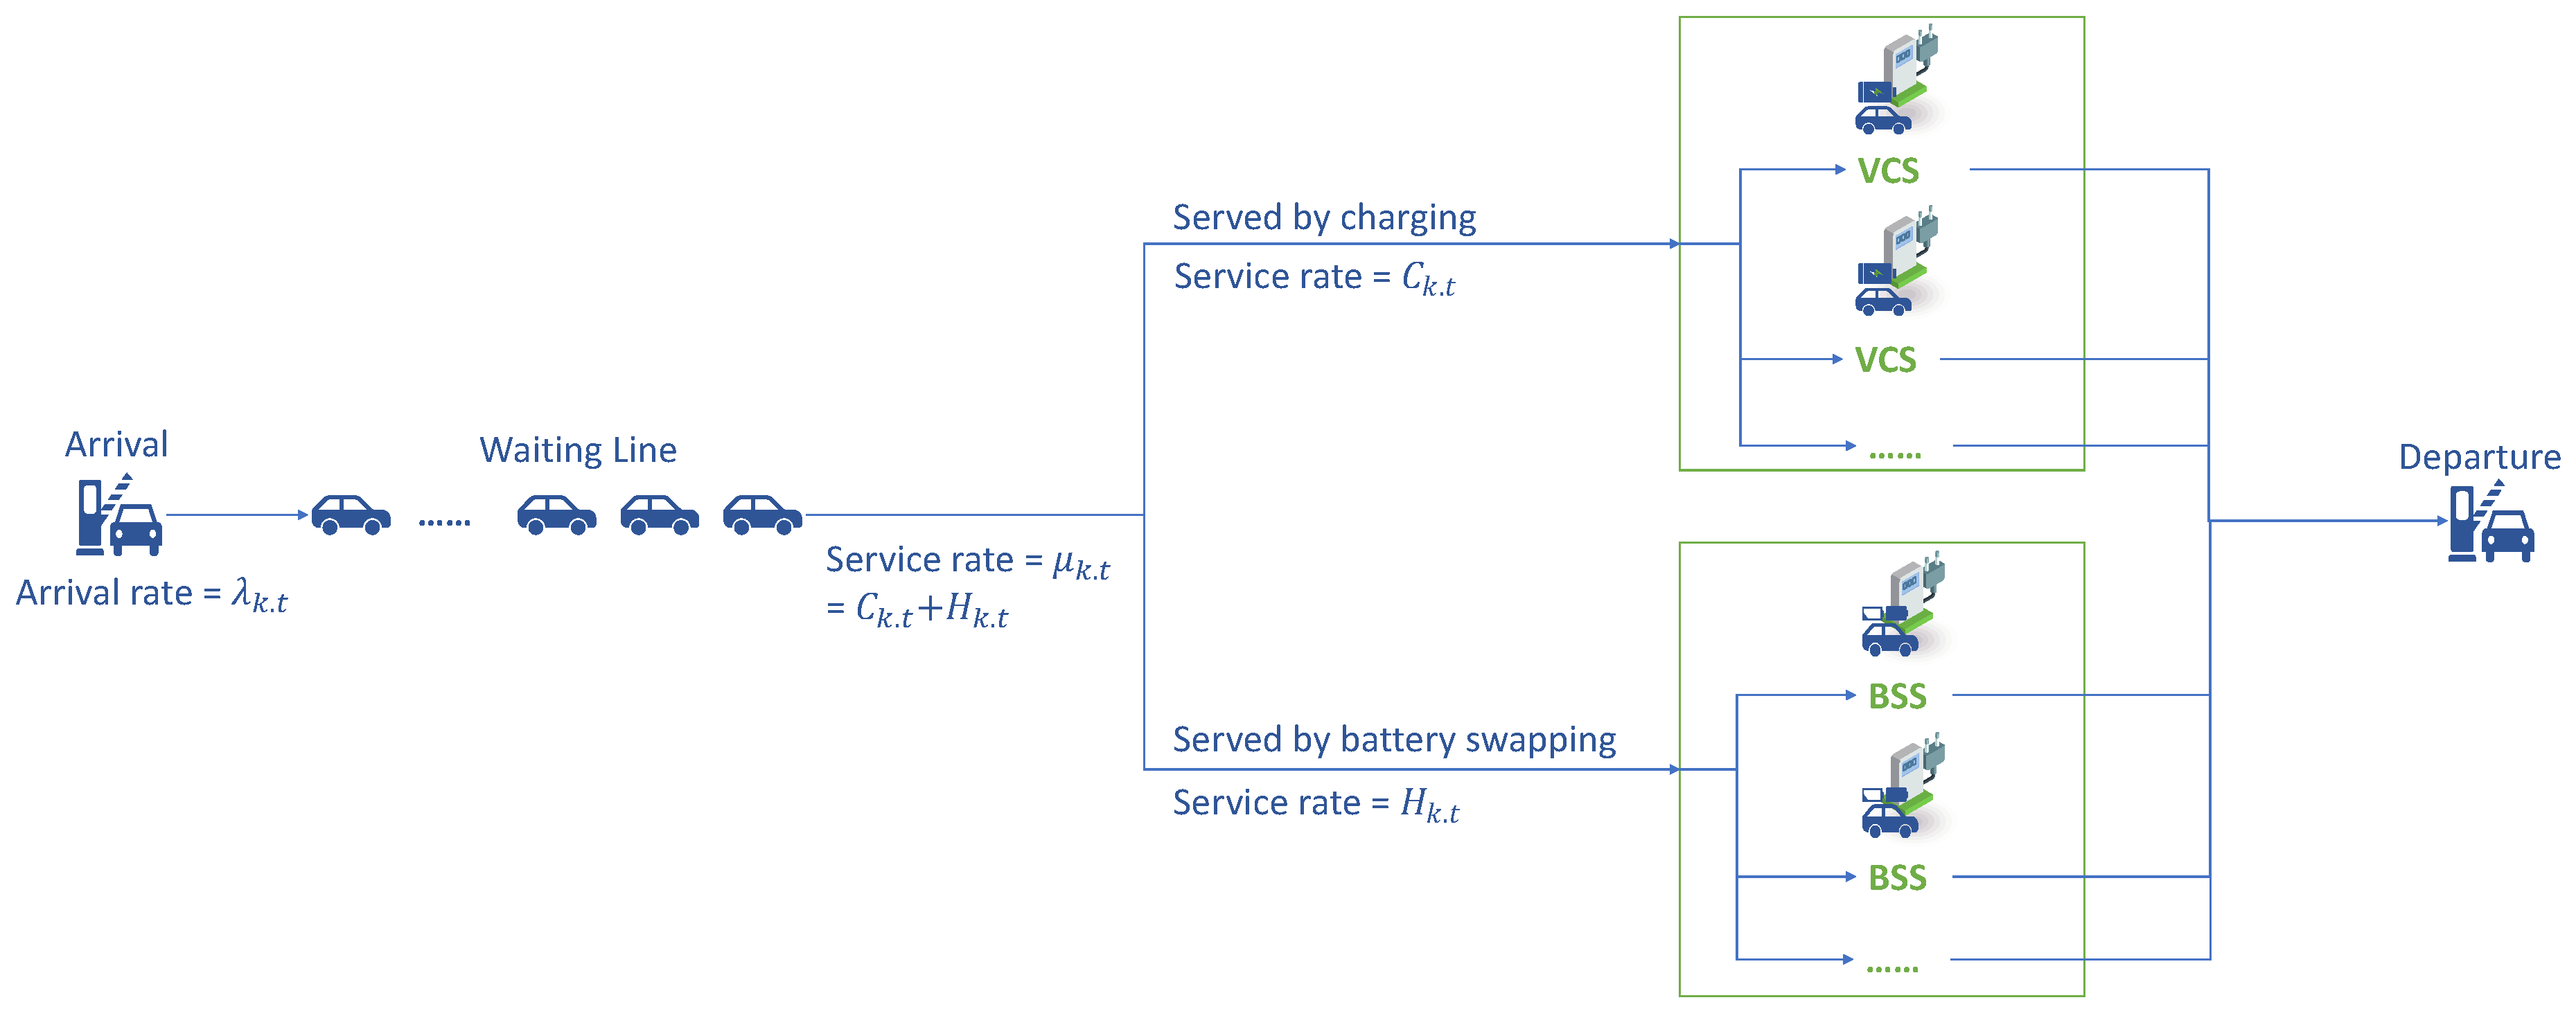
Figure 4.
The map of a London M25 highway network with 14 potential locations for ESI.

Figure 5.
The effect of average waiting time tolerance on each cost.

Figure 6.
The effect of battery cost on each cost.

Figure 7.
The effect of charging demand on each cost.

Table 1.
Parameters.
| Parameter | Value | Unit |
|---|---|---|
| N | - | |
| 100 | - | |
| 50 | - | |
| 100 | - | |
| GBP | ||
| GBP | ||
| GBP | ||
| 10 | GBP | |
| r | 30 | mile |
| 2 | hour | |
| hour | ||
| hour | ||
| 0.8 | - | |
| w | 0.0365 | GBP per battery per mile |
| 6 | - | |
| 23 | - |
Table 2.
Planning results for VCSs, BSSs, BCSs, and the number of batteries at the beginning at each node.
Table 2.
Planning results for VCSs, BSSs, BCSs, and the number of batteries at the beginning at each node.
| Node | Model with Battery Transportation | Model without Battery Transportation | |||||||
|---|---|---|---|---|---|---|---|---|---|
| VCS | BSS | BCS | Battery | VCS | BSS | BCS | Battery | ||
| 1 | 19 | 3 | 0 | 87 | 50 | 1 | 6 | 28 | |
| 2 | 43 | 5 | 80 | 105 | 85 | 4 | 52 | 52 | |
| 3 | 32 | 4 | 77 | 97 | 88 | 1 | 0 | 27 | |
| 4 | 26 | 5 | 0 | 111 | 92 | 6 | 53 | 93 | |
| 5 | 30 | 5 | 99 | 99 | 53 | 5 | 52 | 90 | |
| 6 | 51 | 5 | 60 | 83 | 39 | 6 | 62 | 107 | |
| 7 | 58 | 6 | 68 | 107 | 61 | 7 | 67 | 111 | |
| 8 | 58 | 7 | 97 | 122 | 56 | 8 | 79 | 135 | |
| 9 | 46 | 5 | 71 | 90 | 40 | 6 | 59 | 99 | |
| 10 | 100 | 2 | 0 | 51 | 40 | 6 | 59 | 99 | |
| 11 | 47 | 1 | 0 | 34 | 59 | 2 | 0 | 13 | |
| 12 | 99 | 1 | 0 | 31 | 37 | 5 | 48 | 91 | |
| 13 | 45 | 4 | 78 | 126 | 33 | 5 | 48 | 92 | |
| 14 | 44 | 4 | 0 | 55 | 48 | 4 | 37 | 79 | |
| Total | 698 | 57 | 630 | 1198 | 781 | 66 | 622 | 1116 | |
| Cost | 8.70 × | 9.28 × | |||||||
Table 3.
The results for full and empty battery transportation between ESIs in one day.
| Full Battery | Empty Battery | ||||
|---|---|---|---|---|---|
| Time | Route | Number | Time | Route | Number |
| 6 | 64 | 6 | 7 | ||
| 7 | 25 | 6 | 13 | ||
| 7 | 25 | 7 | 15 | ||
| 8 | 48 | 8 | 25 | ||
| 11 | 39 | 8 | 27 | ||
| 11 | 4 | 8 | 4 | ||
| 12 | 21 | 9 | 22 | ||
| 12 | 13 | 9 | 13 | ||
| 12 | 28 | 9 | 7 | ||
| 13 | 30 | 9 | 1 | ||
| 13 | 25 | 9 | 38 | ||
| 14 | 26 | 10 | 25 | ||
| 14 | 22 | 10 | 30 | ||
| 15 | 33 | 10 | 2 | ||
| 15 | 20 | 10 | 3 | ||
| 15 | 14 | 10 | 4 | ||
| 15 | 23 | 10 | 5 | ||
| 15 | 5 | 10 | 14 | ||
| 15 | 13 | 11 | 25 | ||
| 15 | 5 | 11 | 20 | ||
| 16 | 25 | 11 | 10 | ||
| 16 | 1 | 11 | 25 | ||
| 16 | 1 | 12 | 30 | ||
| 17 | 23 | 12 | 28 | ||
| 17 | 23 | 12 | 8 | ||
| 17 | 12 | 12 | 34 | ||
| 17 | 6 | 12 | 13 | ||
| 17 | 10 | 12 | 32 | ||
| 17 | 38 | 13 | 24 | ||
| 18 | 21 | 13 | 1 | ||
| 19 | 18 | 14 | 24 | ||
| 19 | 3 | 14 | 20 | ||
| 19 | 8 | 14 | 33 | ||
| 20 | 69 | 15 | 46 | ||
| 21 | 50 | 15 | 19 | ||
| 21 | 57 | 15 | 3 | ||
| 21 | 3 | 16 | 48 | ||
| 22 | 1 | 16 | 73 | ||
| 22 | 97 | 16 | 1 | ||
| 22 | 2 | 17 | 27 | ||
| 22 | 33 | 17 | 24 | ||
| 22 | 21 | 19 | 37 | ||
| 19 | 11 | ||||
| 19 | 3 | ||||
| 19 | 30 | ||||
| 19 | 45 | ||||
| 19 | 22 | ||||
| 20 | 13 | ||||
| 20 | 59 | ||||
| 20 | 28 | ||||
| 20 | 29 | ||||
| 20 | 4 | ||||
Disclaimer/Publisher’s Note: The statements, opinions and data contained in all publications are solely those of the individual author(s) and contributor(s) and not of MDPI and/or the editor(s). MDPI and/or the editor(s) disclaim responsibility for any injury to people or property resulting from any ideas, methods, instructions or products referred to in the content. |
© 2023 by the authors. Licensee MDPI, Basel, Switzerland. This article is an open access article distributed under the terms and conditions of the Creative Commons Attribution (CC BY) license (https://creativecommons.org/licenses/by/4.0/).
Share and Cite
MDPI and ACS Style
Jin, D.; Zhang, H.; Han, B.; Liu, G.; Xue, F.; Lu, S. Optimal Siting and Sizing of Electric Vehicle Energy Supplement Infrastructure in Highway Networks. Inventions 2023, 8, 117. https://doi.org/10.3390/inventions8050117
AMA Style
Jin D, Zhang H, Han B, Liu G, Xue F, Lu S. Optimal Siting and Sizing of Electric Vehicle Energy Supplement Infrastructure in Highway Networks. Inventions. 2023; 8(5):117. https://doi.org/10.3390/inventions8050117
Chicago/Turabian StyleJin, Ding, Huayu Zhang, Bing Han, Gang Liu, Fei Xue, and Shaofeng Lu. 2023. "Optimal Siting and Sizing of Electric Vehicle Energy Supplement Infrastructure in Highway Networks" Inventions 8, no. 5: 117. https://doi.org/10.3390/inventions8050117