
Experimental Investigation of a Micro Turbojet Engine Chevrons Nozzle by Means of the Schlieren Technique
by
 , , and
Grigore Cican
1,2,*,
Mihnea Gall
1,2,
Alina Bogoi
1,2,
Marius Deaconu
2 and
Daniel Eugeniu Crunțeanu
1 1
Faculty of Aerospace Engineering, Polytechnic University of Bucharest, 1-7 Polizu Street, 1, 011061 Bucharest, Romania
2
National Research and Development Institute for Gas Turbines COMOTI, 220D Iuliu Maniu, 061126 Bucharest, Romania
*
Author to whom correspondence should be addressed.
Inventions 2023, 8(6), 145; https://doi.org/10.3390/inventions8060145
Submission received: 14 October 2023
/
Revised: 5 November 2023
/
Accepted: 9 November 2023
/
Published: 14 November 2023
(This article belongs to the Special Issue New Sights in Fluid Mechanics and Transport Phenomena)
Abstract
:In connection with subsonic jet noise production, especially regarding the hot jet from a micro turbojet engine, we encountered a lack of recent high-resolution data in the literature describing the flow field using experimental validation through optical diagnoses. The objective of this paper is to examine and compare the influence on shear layers of the exhaust plug nozzle of a micro turbojet engine with and without chevrons mounted, using a high-speed camera used in Schlieren-type optical system diagnosis. Three different operating regimes are examined for both the baseline configuration and the configuration with 16 triangular-shaped chevrons. In conjunction with the image captures, the sound pressure level was recorded with the help of a microphone placed perpendicular to the flow, 0.4 m from the exhaust of the nozzle which was further processed. In quantitative terms, we found that the OASPL decreases by more than 1% when the engine is operating at higher regimes. Moreover, we found that the average exhaust jet angle, which is a measure of the quality of the fluid mixing layer is increased by 5% with respect to the baseline nozzle. By using the “darkest pixel” technique in Schlieren imaging, we can verify experimentally, for all working regimes, the theory that asserts that subsonic jet noise is a consequence of fine-scale homogeneous turbulence. Additionally, the potential novelty lies in the specific observations related to consistent dispersion of fine-scale eddies and how the presence of chevrons amplifies this uniformity within the turbulent field.
1. Introduction
Airport noise is still a significant environmental concern, even though today’s fleet of modern jet transport aircraft are significantly quieter than the first jet aircraft introduced roughly 40 years ago. Noise pollution is one of the most noticeable effects of aviation and a problem in the environment of those who live near airports, as well as farther away, under the main arrival and departure tracks. Aircraft noise is defined as the noise created by any aircraft or its parts at different times during a flight, while parked, while taxiing, during takeoff, during the departure or landing.
In the field of aviation, the predominant sources of noise primarily occur during the take-off and landing phases of flight. Among commercial jet aircraft, the primary sources of noise emanate from the engines, with secondary sources stemming from the airflow around the aircraft (referred to as aerodynamic noise) [1]. When it comes to categorizing the sources of aircraft noise [2], engine noise accounts for a significant proportion [3,4], with jet noise also making a notable contribution. It is worth noting that engine noise plays a substantial role in the overall sound levels when aircraft are operating in close proximity to airports. Turbofan engines are commonly used on commercial transports due to their advantage in performance. Engine noise sources come from the fan (including stator), the compressor, the combustor, the turbine, and the exhaust (also referred as the jet). The theory of aerodynamic jet noise developed by Lighthill (1952) was the first theory that explained the behavior of jet mixing noise, and although it has been modified and extended by several authors, it has not undergone any fundamental changes. Acoustically, he proved that the turbulent mixing zone is equivalent to a distribution of convected quadrupole sources located in the nearfield of the nozzle. Broadband and tonal acoustic radiation is produced in large quantities by the exhaust jets of aircraft engines.
Moreover, after the 1970’s, the use of larger nozzles that generate jets with higher mass flows, but lower overall velocities (higher bypass ratios) have proven to be a very effective method to reduce jet noise over the years by manufacturers. In essence, noise from an engine decreases with decreasing jet speed. Unfortunately, this approach is losing its usefulness as more creative solutions to lessen jet noise are sought. One of the objectives of the early experimental studies on jet noise was to find ways to reduce the intensity of the noise that was radiated, while maintaining nozzle performance (i.e., jet thrust) by making use of knowledge about the characteristics of the sources of noise generation in the turbulent mixing region of a jet. There are numerous studies and research initiatives addressing jet noise reduction [5,6]. Here we revisit some of these jet noise reduction techniques.
The corrugated nozzle [7], was fitted to many of the civil aircraft flying between 1955 and 1980. The noise reduction mechanism was achieved because the circumference of the jet at exit was broken up into a series of smaller jets, each jet being associated with each corrugation, and these structures persisted along a substantial length of the jet mixing region. A higher mixing rate, a decrease in mean shear, and a resulting decrease in the observed length of the potential core, were the results of the flow velocity changing at subsonic speeds. According to Lighthill’s acoustic analogy, the sound power was reduced because of a decrease in the effective acoustic source volume and jet velocity [8]. Since it was already known that decreasing the diameter of a jet proportionately increased the peak frequency, the corrugated nozzle’s noise reduction properties were further altered by the shift in the noise spectrum to higher frequencies dependent on the number of corrugations. The reduced jet noise obtained with the corrugated nozzle was perceived as minimal, because the need for additional weight combined with the thrust loss, produced a significant increase in fuel consumption.
The multitube nozzle was an alternative device on the corrugated nozzle that followed the same principles with the drawbacks of being heavier and having internal losses. The combination of these devices with an ejector gave increased noise reduction [9], but again at the expense of increased weight and increased drag in flight [4].
Acoustic liners are extensively used in aero-engine nacelles to reduce noise. To increase the amount of space that is acoustically treated, lining is used whenever possible in air intakes, fan casings, and bypass ducts. Typical liner configurations are composed by arrays of Helmholtz resonators for the dissipation of the transmission acoustic energy [10]. The environment in which linings have to operate is extremely unfriendly. This is because acoustic absorbers have to operate at temperatures that range from −50 °C to +600 °C between the limits of the intake air flow at high altitude and the hot gas temperatures in the exhaust system. This hostile environment and the fact that the weight is increasing as the structures become more and more complex multiple-layer assemblies, encouraged the researchers to test other noise-reduction devices, known as tabs or serrated edges.
Experimental research is being performed to determine how tabs [11,12,13], or small protrusions in the flow at the exit plane of a nozzle, affect mixing and noise in subsonic and supersonic jets. The simple tabs eliminated screech noise from supersonic jets while altering the shock-expansion diamond structure drastically. Because the flow perturbations created under subsonic and supersonic conditions were identical, it was assumed that the basic mechanism was independent of compressibility. According to the experimental findings, each tab generated a pair of streamwise vortices that were more of the “trailing vortex” kind than the “necklace vortex” type [11]. It is worth mentioning that for the “trailing vortices” to be properly produced, a significant shift pressure must exist between the tab’s upstream and downstream faces. This clarified why the tabs were useless or less efficient in overexpanded flows as the adverse pressure jump that occurred near the nozzle exit in that situation diminished the differential pressure produced by the tab.
A triangular shaped tab, sometimes known as a chevron, should function similarly, but if it were positioned as a “delta wing” with the apex pointing upstream, the resulting opposite sign vortices would cause the core fluid to be more effective ejected from the jet. A triangular-shaped tab with its apex leaning downstream, also referred to as a chevron or as a delta-tab, was found to be the most effective in influencing jet evolution. For instance, the recently created GEnx-2B67 engines that power the Boeing 747-8 have a saw-tooth design on the trailing edges of the jet engine exhaust nozzles. These chevron nozzles increase the turbulent shear layer’s rate of mixing, which is the layer of air between the hot, moving exhaust gas stream from the engine’s inner flux and the cold secondary air flux around the engine core. Chevron nozzles contribute to a significant reduction in jet noise and pressure variations by enhancing streamwise vortices that increase mixing within the plume to speed up the decay of the jet potential core. Enhancing the mixing zone typically makes motion at smaller scales, which amplifies high frequency noise. As a consequence, the angle of maximum directivity located in the direction close to the downstream jet axis is reduced because of the breakdown of the larger scale turbulence into smaller scale turbulence, which also lowers the overall sound pressure level.
The aim of this paper is to evaluate the effect of the chevrons on the flow field and acoustic field of a micro turbojet exhaust. The comparison is made between a baseline nozzle and a nozzle with 16 chevrons.
To achieve noise reduction, the exhaust nozzle chevrons are typically immersed in the nozzle fan flow. However, this immersion also results in drag, or thrust losses. Since these losses can be a considerable penalty for flights with long cruise times, the present paper’s fixed chevron designs are with no immersion.
There are several studies based on experimental papers that try to show the effect of chevrons on the flow and acoustic field. Such studies include those that examine how well the integrated chevrons operate on the nozzle of the engine [14] and those that test the chevrons only in the air [15,16,17,18]. Numerous research using numerical simulations have attempted to explain the phenomena that causes the chevrons to operate, reduce noise, and change the flow field. Additionally, the difference in pressure between the top and bottom surfaces of chevrons and the presence of the triangular shape in the chevron design, generates vortices that extend downstream of the nozzle acting as sound barriers that disrupt the coherent sound waves produced by the jet and reduce the overall sound pressure level (OASPL [19,20,21,22]).
In [23], a visual analysis of the jet development emerging from chevron nozzles at a Reynolds number of 25,000 has been conducted experimentally. To explore the behavior of the flow development, flow visualization using laser illumination on titanium tetrachloride smoke was performed to see the jet structure at various cross-sections along the jet axis [23]. In a different paper, a comparison is made between numerical simulations and those obtained with the Schlieren system for a supersonic jet. With an emphasis on numerical technique, this study investigates the degree of jet mixing for a supersonic jet leaving a Mach 1.8 convergent–divergent nozzle under the direction of two short rectangular actuators that produce vortices. The tabs provide a blockage ratio of about 0.05. A commercial computational fluid dynamics (CFD) package was used for the numerical investigations, and for greater accuracy, all simulations were run in three dimensions using the steady Reynolds-averaged Navier–Stokes equations and the shear-stress transport k-ω turbulence model. The barrel shock, the expansion fans, and the Mach waves that are present in the flow field are captured using numerical Schlieren images [24].
In [25], Schlieren systems are used to perform an experimental investigation of how two splitters with spike-shaped features affect shock wave diffraction for Mach values of 1.31 and 1.59 and to gain understanding of the progressive diffraction processes occurring in several planes that interact together to create a complex turbulent structure with a vortical pattern. Both experimental and numerical techniques were employed to examine the mixing process and distribution characteristics of a supercritical endothermic hydrocarbon fuel (EHF) jet injected into a supersonic crossflow. Flow field structural features and instantaneous plume were captured using the Schlieren system and acetone planar laser-induced fluorescence (PLIF) optical system. To model the interaction between a transverse jet and a supersonic crossflow, mixture and real gas models were utilized, demonstrating a high level of accuracy compared to experimental results. The numerical results were also used to analyze mixing efficiency and total pressure loss [26]. Furthermore, low-cost methods for visualizing and analyzing pulsed synthetic jets in cooling applications were employed in another study [27]. The interaction between a plasma jet and targets with varying physical properties was investigated using Schlieren optics [28]. Schlieren academic applications on acoustics allow visualizing sound itself with the help of this visualization technique [29]. Apart from jet mixing diagnosis, the Schlieren visualization technique is also used for transient ignition studies [30] and heat transfer [31].
There is a clear gap in the scientific literature regarding the chevrons’ working principles and how the flow field is influenced leading to noise level alleviation. For most studies, the focus is on numerical predictions, with almost no experimental validation by means of optical diagnosis. Furthermore, the experimental jet visualization of micro turbojet engine exhaust coupled with different noise level reduction devices, in particular chevrons, is again scarce in the present literature. The aim of this paper is to study the influence of chevrons on the shear layers by means of a high speed Schlieren type optical diagnosis. The chevrons are installed at the exhaust nozzle of a micro turbojet engine. Three different operating regimes in terms of rotational speed are analyzed for both the baseline configuration (no chevron) and the 16 triangular shaped chevron configuration. Together with the optical diagnosis, the sound level in the proximity of the engine is recorded and further post-processed.
2. Materials and Methods
2.1. Experimental Test Bench
For a micro turbojet engine, the problem of noise reduction is very challenging because of its small dimensions that do not permit noise reduction by producing jets with greater mass flow, but lower velocities using larger nozzles. As a result, the adopted strategy of decreasing the speed of the jet was to change the nozzle architecture for noise reduction. For a 16 chevron configuration, the influence on the turbulence of the jet flow in decreasing the noise for different operating regimes was assessed.
The measurements were performed on the micro turbojet engine Jet CAT P80, which is in the endowment of the Aerospace Engineering Faculty of the Polytechnic University of Bucharest. The test rig together with the engine were distributed by GUNT Hamburg [32]. This turbojet engine has been used in the past for multiple experiments and research studies [33,34].
A Z-type Schlieren setup was aligned to visualize the microjet engine exhaust (Figure 1). The setup consists of two 11 cm diameter parabolic mirrors, an adjustable slit diaphragm (knife) for light cutoff, a point light source and a Phantom VEO710 high speed camera [35]. The camera was operated at 24k fps at 512 × 512 resolution. The light source and the knife were placed one focal length apart from mirror 1 and mirror 2, respectively, while the off-axis beam angles were set below 20° to limit the optical distortions [36]. While the first mirror transformed the incoming beam into a parallel one, the second mirror focused the light on the knife. The large distance between the two mirrors avoided the contamination of the light source towards mirror 1 by the engine exhaust gases. The experimental test bench with the Schlieren system aligned at the exhaust of the micro turbojet engine is presented in Figure 2.
The acoustic measurements were performed by using the multi-channel acquisition system Orchestra from 01 dB, that allowed simultaneous recording on 12 channels. The Orchestra system is certified IEC 61260 for FFT and digital filtering Class 1. The design of the unit allows the system to fulfil type 1 specification of IEC 606541 and IEC 60804, while the digital filters fulfil the class 0 specification of IEC 61260. The maximum acquisition frequency was 51.2 kHz with a dynamic range of 115 dB.
The acoustic sound pressure signal was recorded with a ½ 40 AQ microphone manufactured by G.R.A.S., Holte, Denmark. This high-precision condenser microphone, designed in compliance with IEC 61094-4 standards, is engineered for accurate sound measurement in random, diffuse, and reverberant sound environments. It boasts exceptional durability and reliability, capable of measuring sound pressure levels ranging from 3.15 Hz to 16 kHz, reaching up to 148 dB. Each 40 AQ microphone undergoes individual factory calibration and is supplied with a calibration chart that specifies its unique open-circuit sensitivity and pressure frequency response. The 40 AQ is specifically tailored to ensure accurate sound level measurements in random (diffuse) sound fields, such as those resulting from multiple sound sources or reflective surfaces. The 40 AQ was mounted on a GRAS ½-inch Preamplifier Type 26 CA which has a frequency range between 2 Hz–200 kHz.
The entire measurement line was calibrated using a Sound Calibrator Type 42 AB, manufactured by G.R.A.S., Holte, Denmark which generates 114 dB (re. 20 μPa) ± 0.2 dB at 1 kHz, IEC 942 (1988) Class 1.
The raw signal was processed with the commercial software dBFA 4.8.1 from 01 dB Metravib, France.
The microphone was placed 0.4 m from the engine as is shown in Figure 3.
This study focuses on the investigation of jet noise generated as a result of the turbulent mixing of high-speed gases with the surrounding air. To assess the noise reduction specifically attributed to the jet gases with the chevron nozzle, it is crucial to identify the acoustic spectral components of the acoustic sources and subsequently filter out those that are not within our scope of interest. The acoustic raw signals underwent processing in the frequency domain through the utilization of the Fast Fourier Transform (FFT) function, followed by averaging across the entire time duration. In the initial stage of noise signal filtering, a band stop filter was applied to the spectral components associated with the shaft speed, which leads to the compressor and turbine Blade-Pass Frequency (BDF) and its harmonics.
2.2. Chevrons’ Nozzle Configuration
The design of the chevrons was based on the 3D reference model, with the key parameters that characterize them being the chevron count (N), chevron length (L), and the immersion angle (I) [37]. As indicated in a previous study [38], it is advisable to maintain the chevron’s length within a range of 5 to 10 percent of the equivalent diameter. More information can be found in [14]. The main dimensions of the tested nozzles are reported in Figure 4. The micro turbojet engine with the 16-chevron nozzle installed is presented in Figure 5.
In the current experimental campaign, the turbojet engine was steadily operated under three different regimes, in terms of shaft rotational speed, for both the baseline and the chevron configuration. The first regime corresponded to engine idle (i.e., 35,000 RPM), the second one was 55,000 RPM, while the third one was at 100,000 RPM.
3. Results and Discussion
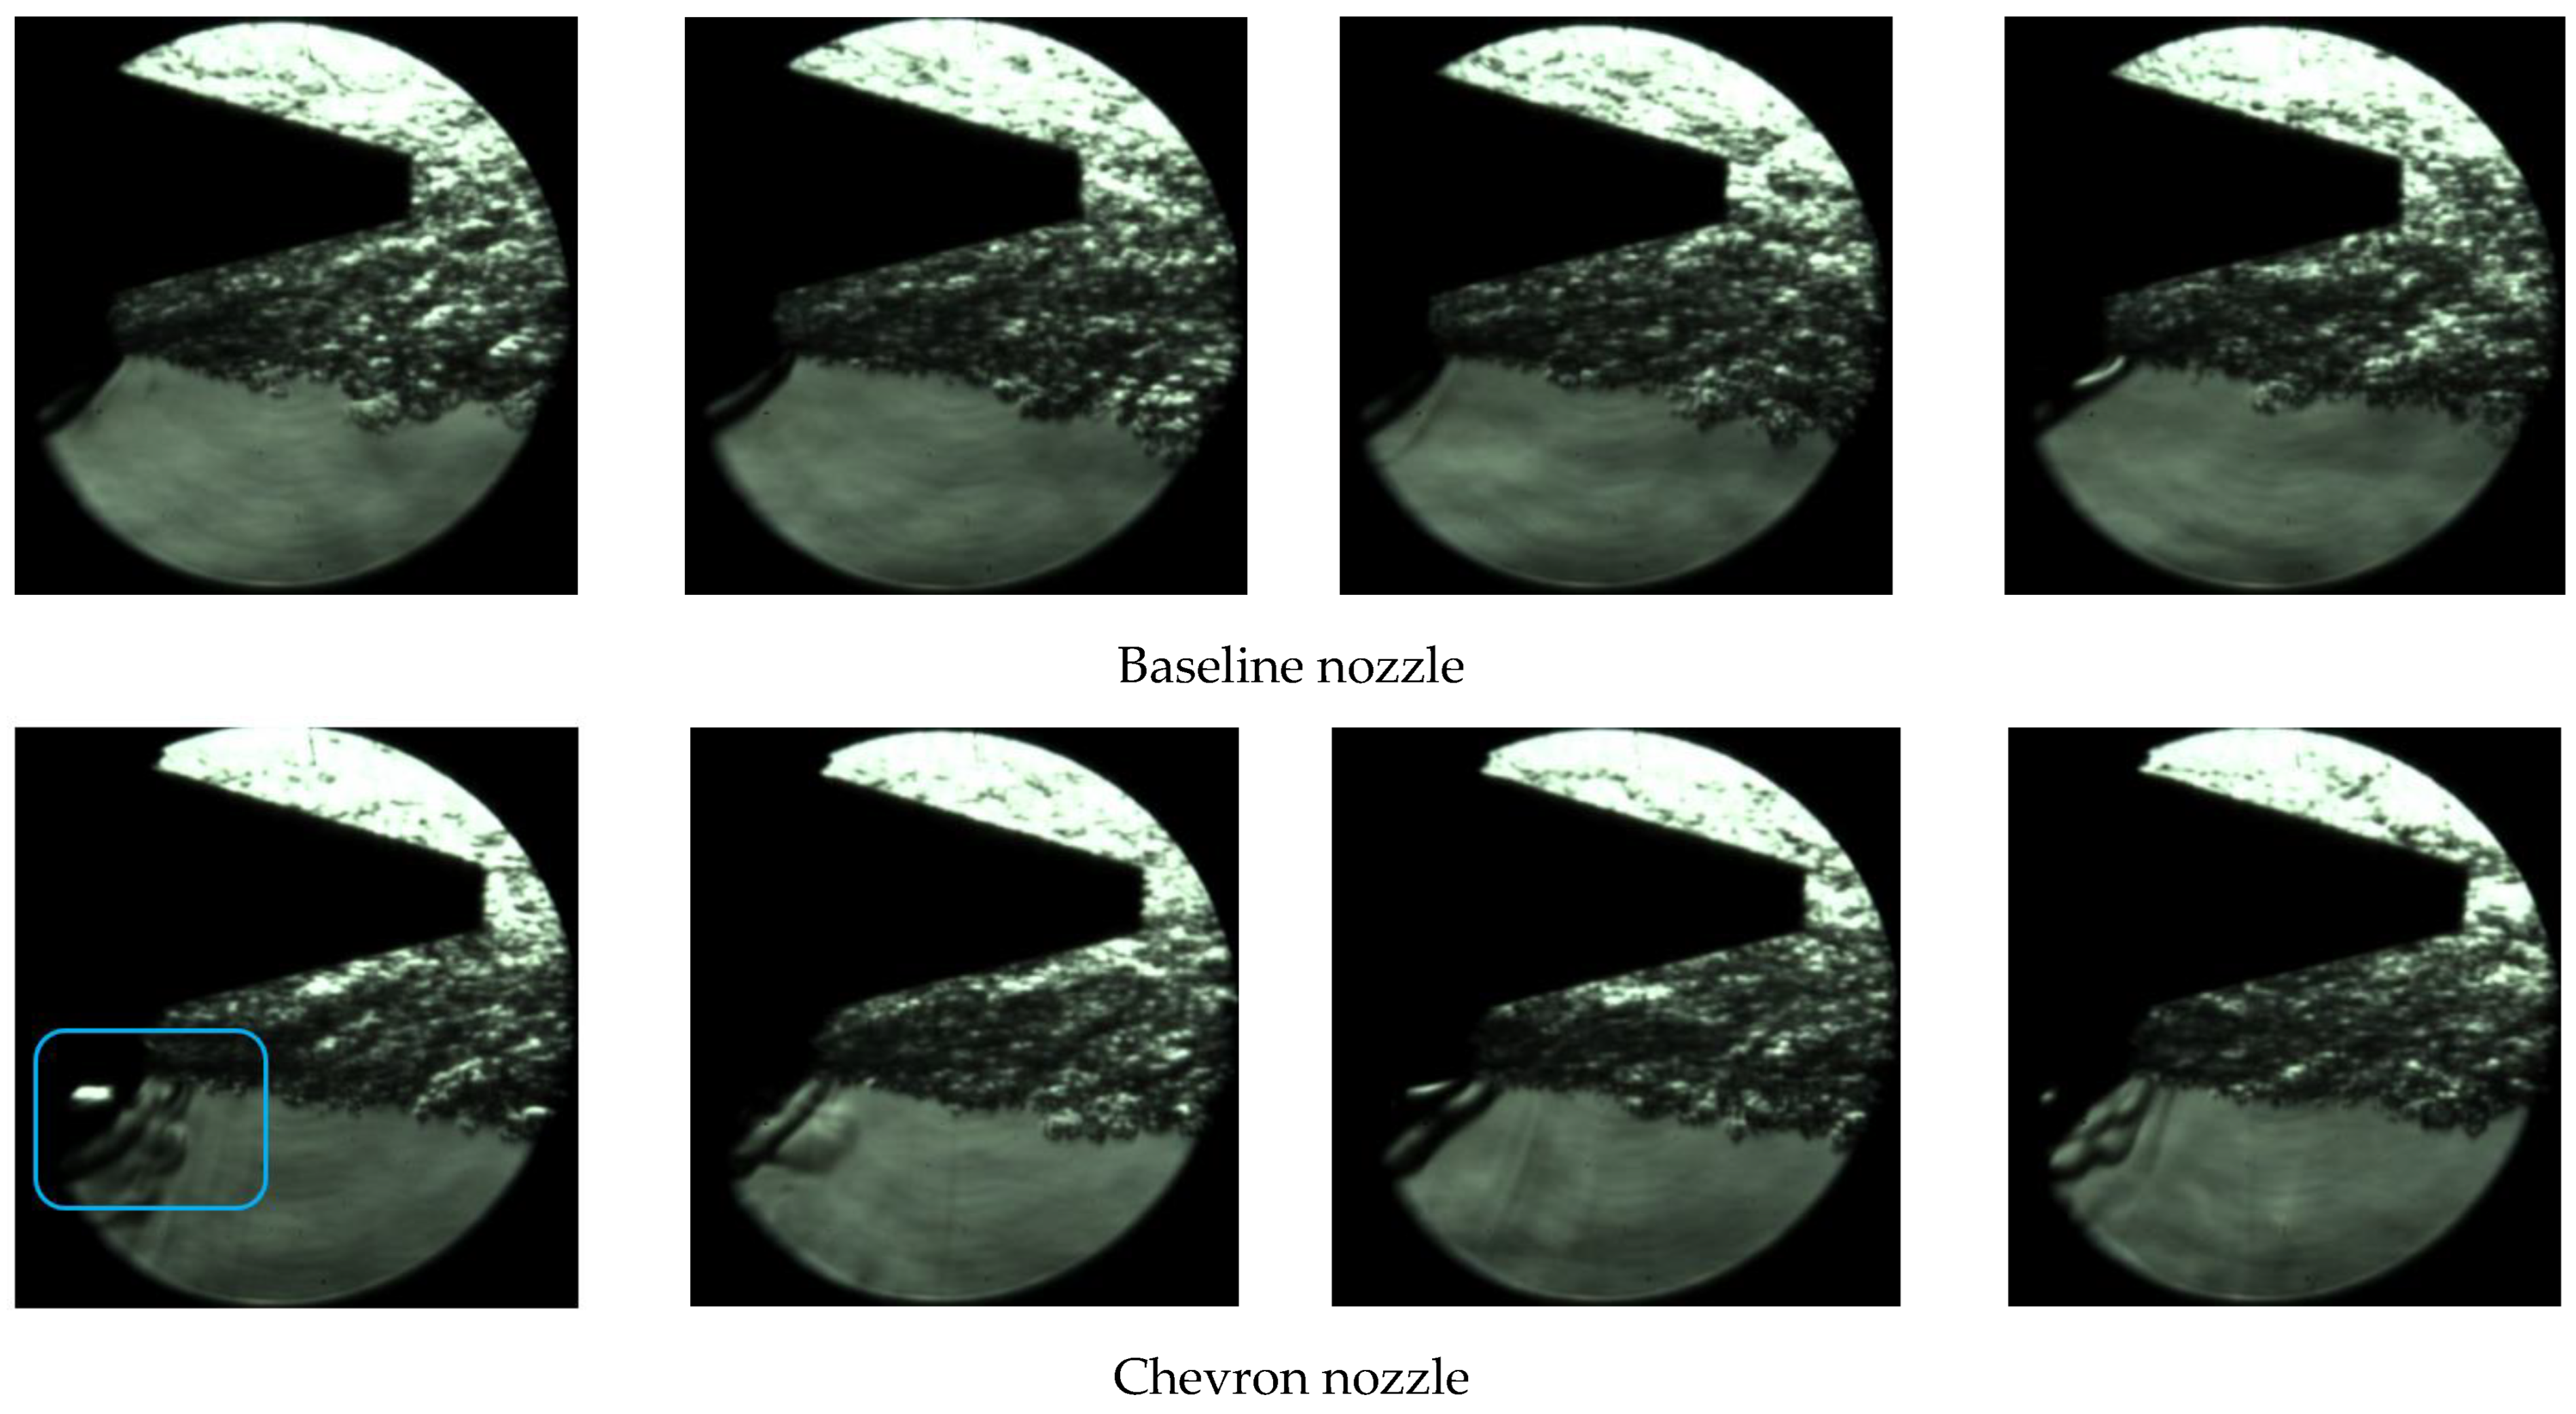
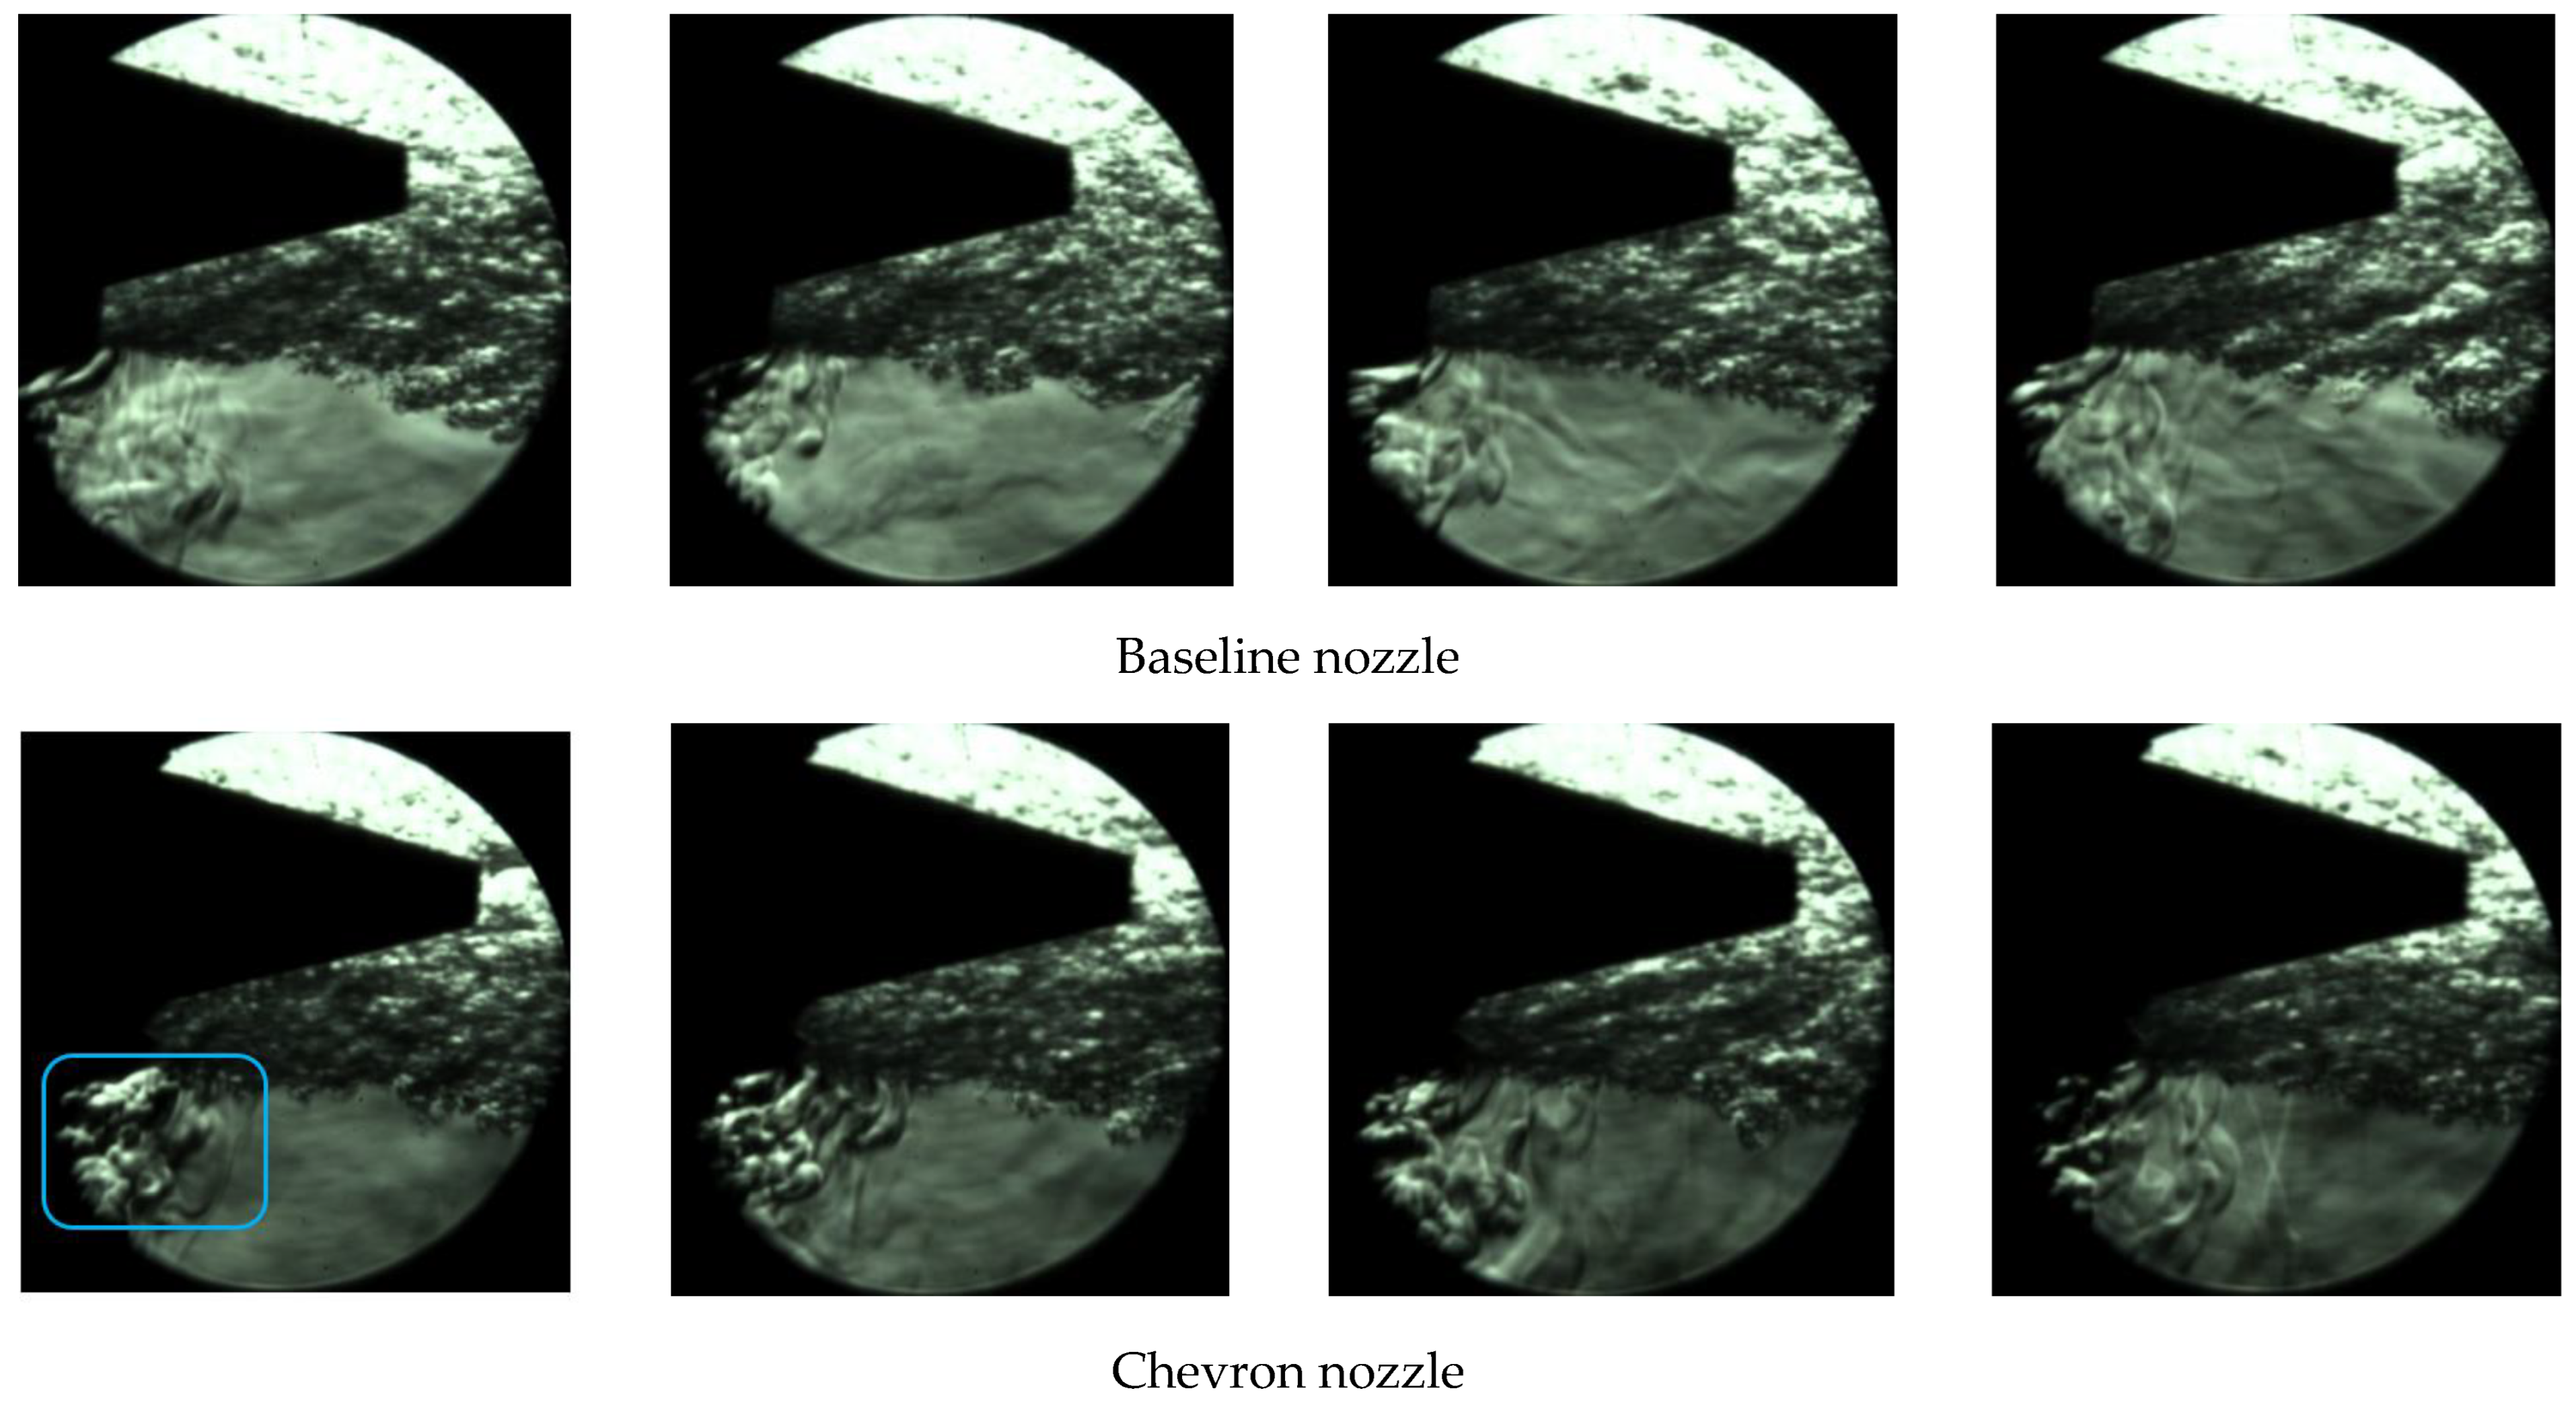
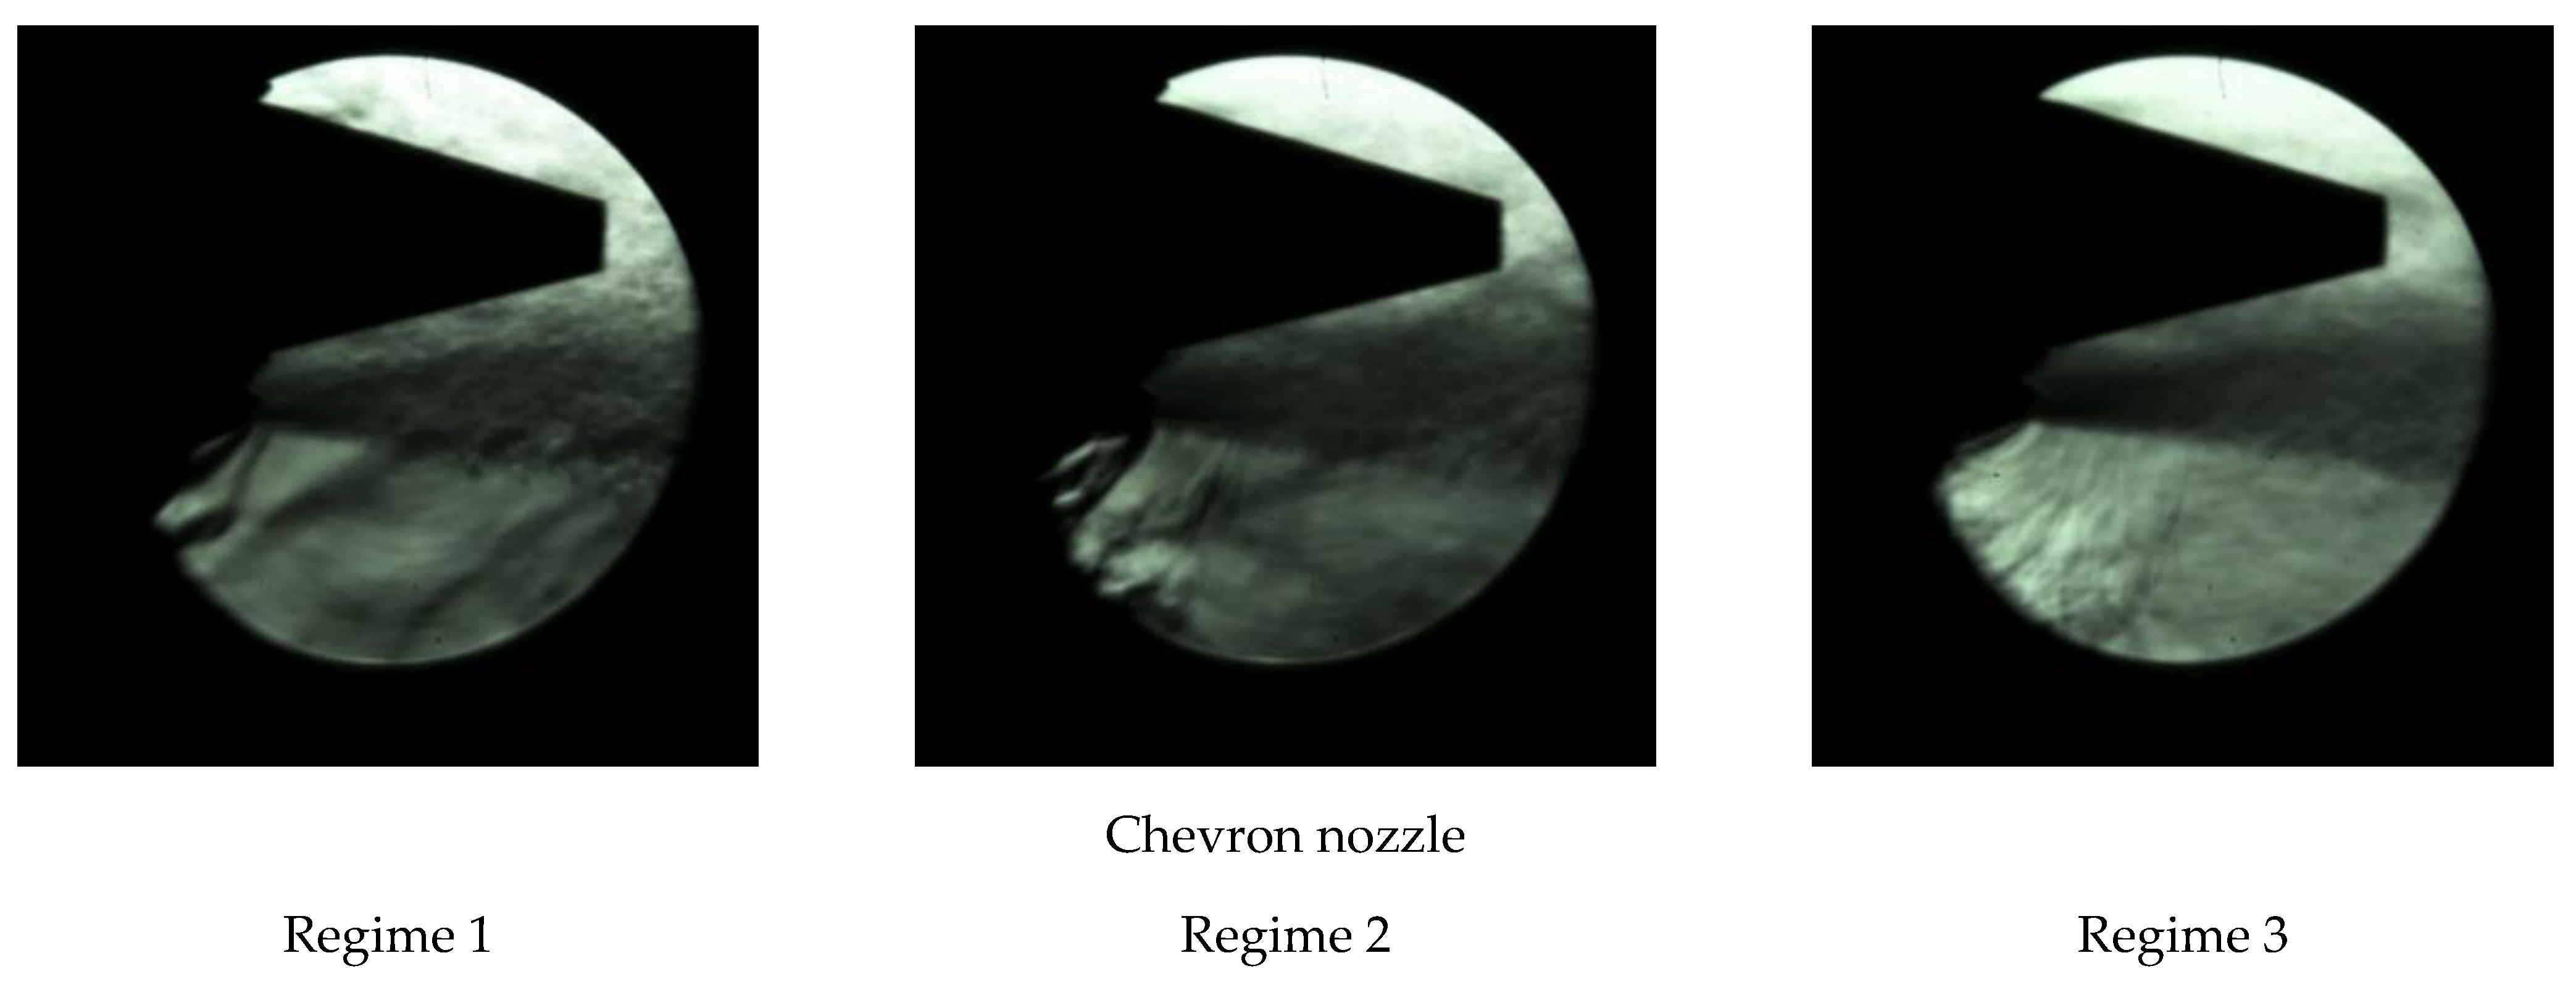
The specialized literature is quite poor in articles with experimental data that study the influence of the number, inclination to the nozzle axis and configuration of chevrons mounted on the exit edges of convergent nozzles for micro turbojets [9,14,39]. Although a large amount of literature has been written on subsonic and supersonic jets, there is still a visible lack of articles highlighting the structure and the dynamics of the hot subsonic jet using the Schlieren technique. The aim of this study was to bring more insight to the turbulent annular jet pattern with and without chevrons on the micro turbojet engine and to investigate how the enhanced mixing flow induced by the chevrons increases the smaller scales of motion by breaking down the larger scale turbulence into small scales at different working regimes. Thus, we wanted to analyze in what manner reducing the low frequency noise leads to the reduction in overall sound pressure level. Therefore, Figure 6, Figure 7 and Figure 8 show the exhaust jet Schlieren visualization as instantaneous captures for the analyzed regimes. The extracted frames are 1000 frames apart, i.e., 41.66 ms apart.
It is important to briefly review the fundamental mechanism evolution of the subsonic jet from the nozzle in order to comprehend the physical phenomena of Schlieren’s data offered by Figure 6, Figure 7 and Figure 8. When the jet emerges out of a nozzle into the low-speed or stagnant ambient fluid, the surrounding fluid is entrained toward the jet flow field. While moving streamwise, the jet extends out in a radial direction, because of the Kelvin–Helmholtz instabilities that occur at the boundary of the mixing layer and result in the creation of rolling-up vortex rings. Therefore, azimuthal vortices are created at the edge of the mixing layer. Large-scale vortices are effective suction generators and are produced by the tangential shear. The surrounding low-speed fluid is absorbed into the main flow by the large-scale vortices. As a result, every cross section of the jet experiences a rapid rise in mass flow. In their study [40], Martin and Meiburg demonstrated that the interaction between azimuthal vortices (primary vortical structures) and streamwise vortical structures occurs at the termination of the potential core region. This interaction results in the distortion of vortex rings, eventually leading to the formation of small-scale structures. The presence of significant turbulence structures and instability waves plays a pivotal role in influencing the dynamics, dispersion, and mixing of the jet fluid. According to Tam [41,42] and other scientists, in comparison to supersonic jets, where the large turbulence structures and instability waves are directly responsible for generating the dominant part of the noise, in subsonic jets the dominant noise source is the small-scale turbulence. Consequently, the broadband noise radiation is increased for subsonic jets due to the increased fine-scale turbulence. All these phenomena are consistent with the frames given in Figure 6, Figure 7 and Figure 8. Moreover, the deployment of 16 chevrons at the nozzle outlet provides an increasing alteration in the development of the jet starting from the first working regime. These results from the azimuthal variation of flow angle and 16 pairs of counter-rotating streamwise vortices are generated from the delta-tab configuration which enhance mixing.
At first glance, for all three cases, the flow pattern led to the picture of a turbulent region that is relatively homogenous and isotropic in its structure and composition. It becomes clear after looking at all the figures, that in the turbulent shear layer of a jet, turbulence consists of two dominant components. They are the quasi-coherent and quasi-orderly large turbulence structures and the random and chaotic fine-scale turbulence. The difficulty in resolving the smallest viscous and mass diffusion scales of turbulence, which decrease in size nearly inversely like the Reynolds number relative to the local transverse size of the turbulent region, is a drawback of this visualization techniques, especially at higher Reynolds numbers. This situation could be explained, however, by the fact that Schlieren flow visualization images created from these flows, typically allow only an external (or integrated) view of the region of turbulence and are not generally capable of revealing the internal structure, up to the Kolmogorov scale.
However, if one looks carefully, some noticeable differences can be identified. First, the fluid associated with the irrotational region in the periphery of the jet is set in motion more evidently through the induced velocity field of the vortical structures in the jet, by the existence of the chevrons. In fact, when a high-speed fluid is ejected through a nozzle, it creates a pressure drop, resulting in a suction effect that draws in additional fluid from the surrounding environment into the jet through the chevrons. This ejection phenomenon is localized in the vicinity of the exhaust for lower regimes, but it becomes more evident for the higher regimes causing the fluid located at considerable distances from the turbulent region to be entrained into the turbulent flow. This fact is highlighted by the blue frame. In Figure 6, for the first regime, one can identify, outside the turbulent jet, a medium where the nonlinear effects are typically less significant compared to the dominant linear wave propagation behavior. This is explained by the presence of concentric waves in the near field around the turbulent jet due to the interaction (n.b. refraction, scattering) between the turbulent eddies and the upstream propagating sound waves like combustion or turbine noise. These turbulent vortices, which range in size from small eddies to larger-scale coherent structures, are advected downstream with the jet flow and undergo complex interactions with each other and the surrounding medium. Turbulent eddies refer to the small-scale, random fluctuations that occur within turbulent flows which are highly chaotic, three-dimensional structures that arise due to the nonlinear interactions between different flow scales. They contribute to the overall mixing and energy dissipation in turbulent flows. On the other hand, coherent structures are organized and relatively larger-scale flow patterns within turbulent flows which exhibit some level of temporal and spatial coherence, meaning they maintain their shape and coherence over a certain period of time and distance. Coherent structures can take the form of large-scale vortices, elongated structures, or other organized flow patterns. The convection of these swirling structures in the turbulent jet creates fluctuations in pressure and velocity, which in turn act as secondary sources of sound, generating additional waves that propagate outward from the jet. These secondary waves interfere with the primary sound wave, resulting in the formation of regions of constructive and destructive interference. In constructive interference regions, the waves reinforce each other, leading to areas of higher density. In contrast, in destructive interference regions, the waves cancel each other out, resulting in areas of lower sound intensity. It is important to note that the specific appearance and behavior of the sound waves around a turbulent jet depend on the specific regime of the flow as it is observed in the experimental observations given in Figure 6, Figure 7 and Figure 8. Thus, as the jet velocity and turbulent intensities increase, the effects of turbulence outside the jet become more significant and the nonlinear effect in the near field is much more evident.
Regarding the presence of chevrons, one can easily notice that the outside domain of the turbulent jet becomes more perturbed and more disorganized and irregular shapes are presented, amplifying the nonlinear interactions, see Figure 8.
Apart from the instantaneous captures, two additional methods were employed to process the Schlieren data. The first one performed a time history average for each pixel for two different numbers of frames: for 1000 frames in Figure 9 and for 100 frames in Figure 10.
Figure 9.
Average type post-processing of the Schlieren (1000 frames).

Figure 10.
Average type post-processing of the Schlieren (100 frames). Averaging multiple frames of Schlieren images reduces irregularities that may be present in individual frames, obtaining a smoother representation of the flow features, like the jet angle at the exit for each regime. To obtain a clear visualization of the jet angle (see Table 1) we choose to perform a pixel-by-pixel averaging across 1000 frames, which represents 41.66 ms.


Table 1.
Average exhaust jet angle for 100 k RPM regime (deg).
| Regime | Configuration | Experimental | CFD |
|---|---|---|---|
| Regime 1 | baseline | 19.8 | 18 |
| chevrons | 24.6 | 19.9 | |
| Regime 2 | baseline | 18.8 | 18 |
| chevrons | 21.6 | 19.2 | |
| Regime 3 | baseline | 14.8 | 17.3 |
| chevrons | 19.7 | 18.4 |
With increasing regimes, the jet angles exhibit a decrease in values. Specifically, for the baseline case, the angle decreases 25% and in the case with chevrons, the angle decreases 20%. Specifically, average exhaust jet angle was estimated based on the computation of the angle between two vectors, i.e., one vector being parallel with the cone side, while the other is parallel to the shear layer in the proximity of the exhaust from the nozzle. Thus, the presence of chevrons results in a smaller reduction in jet angles, which is viewed as a result of the increasing turbulent mixing near the nozzle when the regimes are increased.
Furthermore, we perform an average of only 100 frames to better show how chevrons improve entrainment and to analyze the persistent features over a short period of time, such as 4.166 ms.
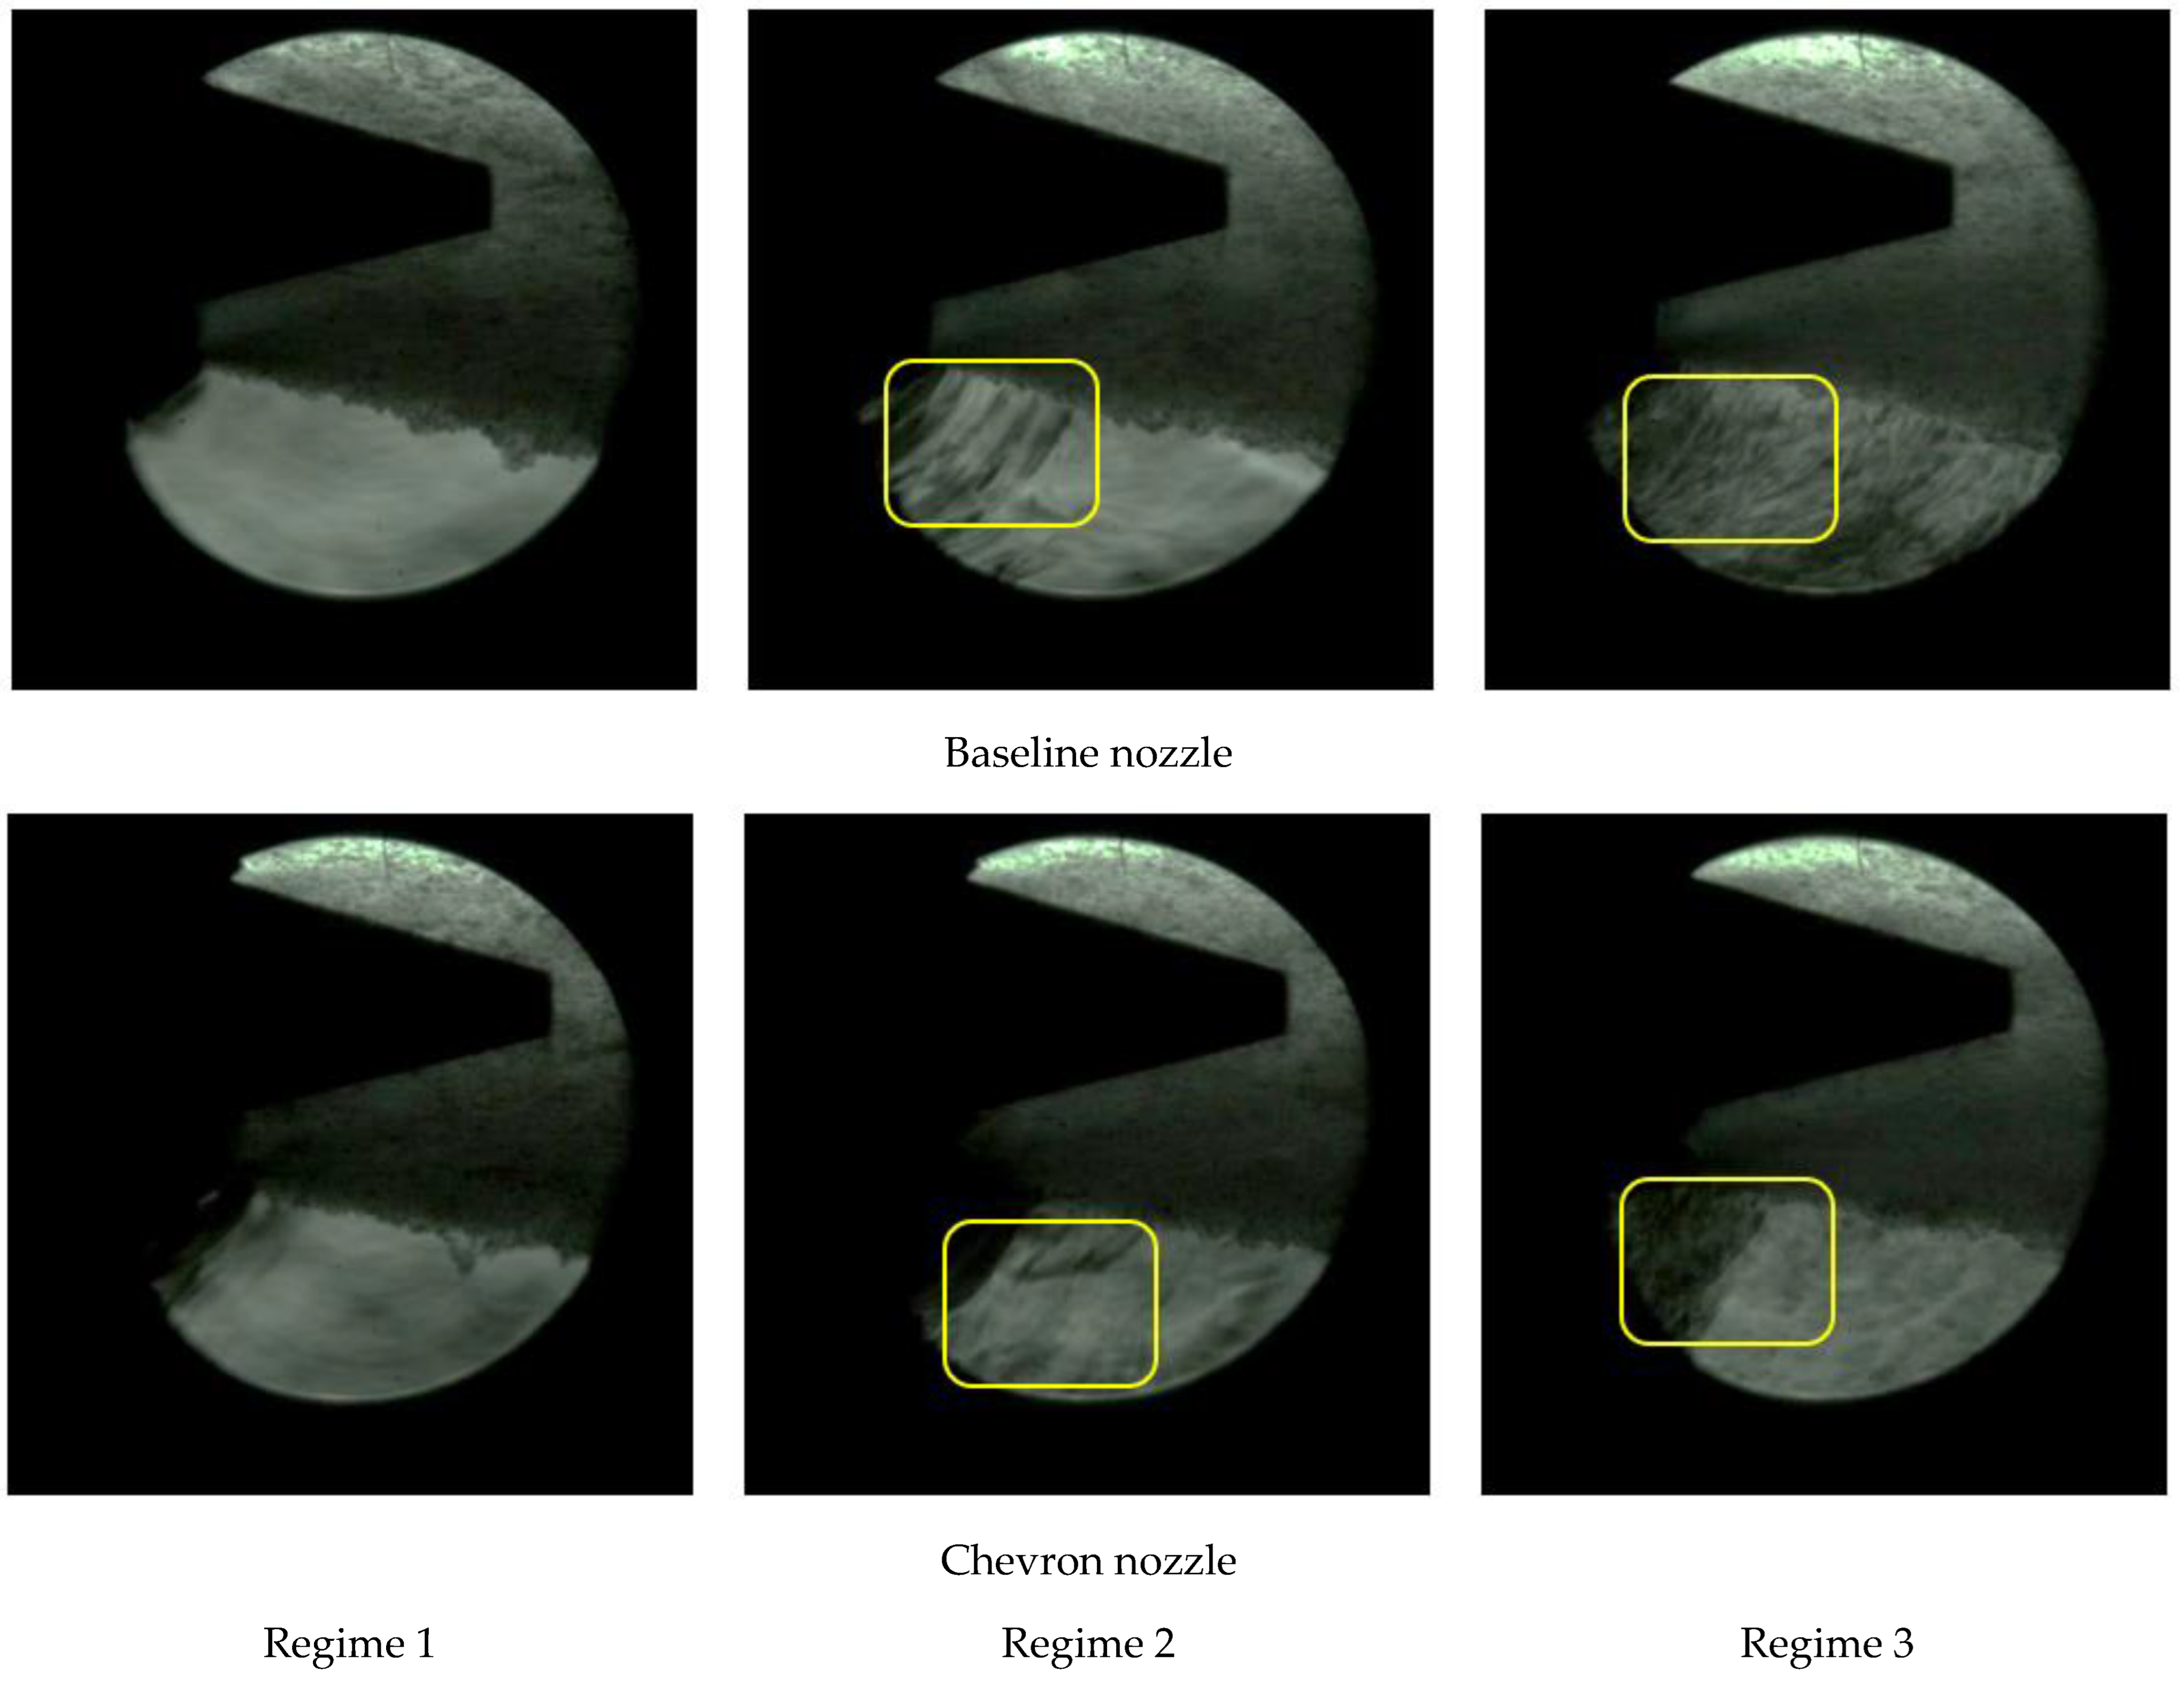
In the second post-processed method, the darkest pixel in a certain time history was saved and was referred to as darkest pixel type post-processing. At first glance, the shear layer is described more sharply by the darkest pixel approach than by the average method.
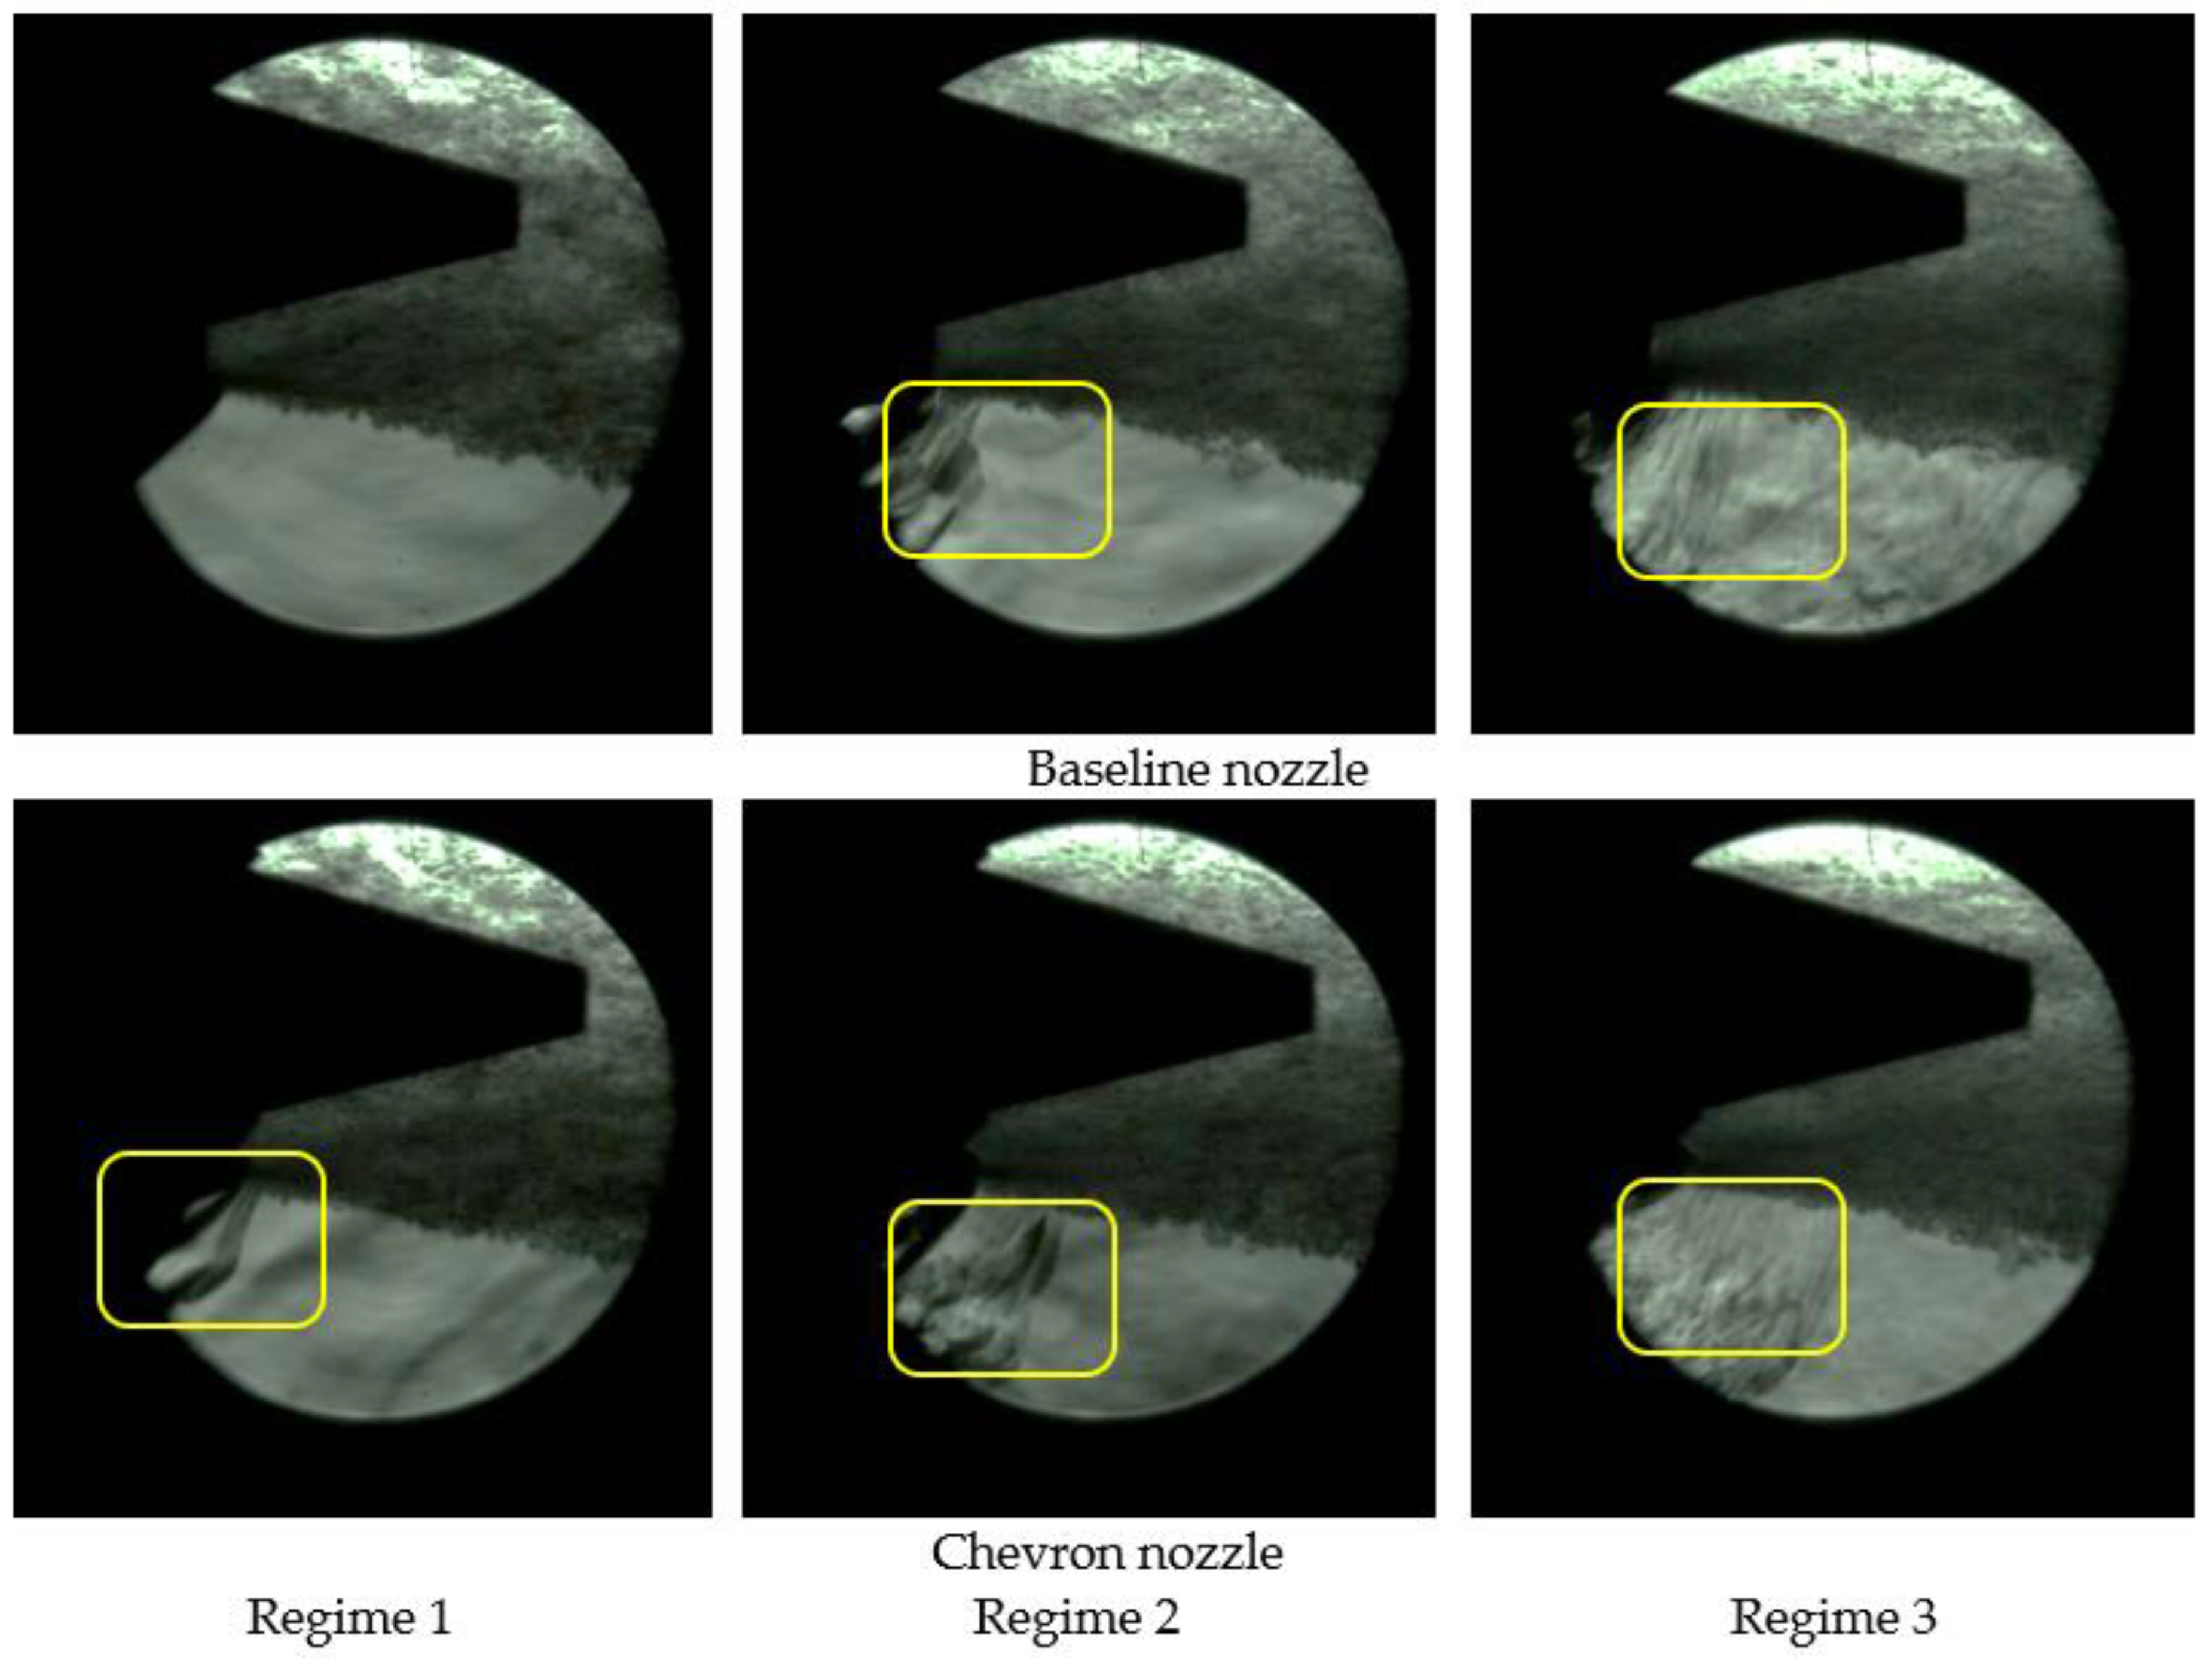
Looking more profoundly at the images, a very interesting feature was observed regarding the pattern of the flow, in Figure 11 and Figure 12 for 1000 frames and 100 frames, respectively. First, we can say that the fine-scale eddies represented by the small dark zones, which signify that their density is higher with respect to other zones, are isotropically distributed inside the domain in all the regimes with or without chevrons. In the case of a nozzle with chevrons, the distribution seems to be much more uniform, fine and discrete than in the baseline case. The images are similar to Brownian motion and distribution for molecules in the kinetic-molecular theory. This confirms the proposed theory by Tam and Auriault [43], of how noise is produced by fine-scale turbulence. The concept is based on an analogy with the pressure field produced by the random motion of the gas molecules that occurs in gas kinetic theory. The “blobs of vortices” or small eddies that make up fine-scale turbulence are advected by the mean flow and move in random directions with respect to one another. Gas kinetic theory states that random motion generates a pressure field at the macroscopic level. The same logic can be used to explain the random movement of fine turbulent structures that produces a rather localized pressure field. Acoustic radiation results from the time fluctuations of the pressure field. The directivity of radiation is nearly isotropic, but because of the convection effect, it is slightly skewed in the direction of flow. In the jet mixing layer, the small variation in density is equivalent with small variations in volume which behave like small monopole sources and finally, these produce fine-scale turbulence noise as a result. Regarding the radiated waves (n.b. highlighted by the yellow frame) making a certain angle with respect to the boundary of the mixing layer, these are the result of the variations in the amplitude and size of individual turbulent large structures. Such variations lead to changes in the pressure spectrum of moving waves with different velocities and intensities. As is seen in the highlighted frames, the intensity of Mach wave radiation depends greatly on the speed of the large turbulence structures. Mach wave radiation becomes more intense with the chevrons and higher working regimes.
The second part shows the acoustic results recorded by the microphone for the three regimes with and without chevrons. As was specified in a previous chapter, the acoustic signals were processed by applying a band stop filter. In the spectral analyses presented in Figure 13 (left side), tonal spectral components are observed, which come especially from the shaft speed and Blade Pass Frequency (BPF) of the compressor and the turbine. Thus, the band stop filter was applied to these frequencies, resulting in a broadband noise spectrum (Figure 13—right side) that is mostly generated by the noise of the jet, noise that is analyzed in this study. The results are shown in Figure 13. Under regime 1 (shaft speed 586 Hz–35,040 RPM, which is not visible because it is masked by the other noise) the unfiltered spectrum shows two peaks at 10,337 Hz and 13,500 Hz with high amplitude. The component at 13,500 Hz corresponds to the BPF of the turbine (23 blades × 586 Hz) and the component from 10,337 Hz does not correspond to any component related to the engine speed, possibly being an aeroacoustics source. In the spectra from regime 2, it can be seen that the shaft speed of 918.75 Hz–55,125 RPM, in this case having a high amplitude and the BPF of the compressor which has six blades, results in a frequency of 11,000 Hz. Under regime 3, only the shaft speed is visible at a frequency of 1687.5 Hz (101,250 RPM) together with its harmonics with small amplitudes.
As equal importance is set to each frequency band, one chooses as a quantitative insight on the impact of chevron on noise reduction spectrum, the overall sound pressure, OASPL:
where is the reference pressure and represents the mean squared pressure spectrum. Table 2 shows the results for all three regimes and for the baseline. The OASPL was computed in the frequency band from 10 Hz–20 kHz.
One can notice that the chevrons’ impact is more beneficial in the high operating regimes of the engine where at the top regime, the chevron nozzle contributes to a noise reduction of 1.5 dB.
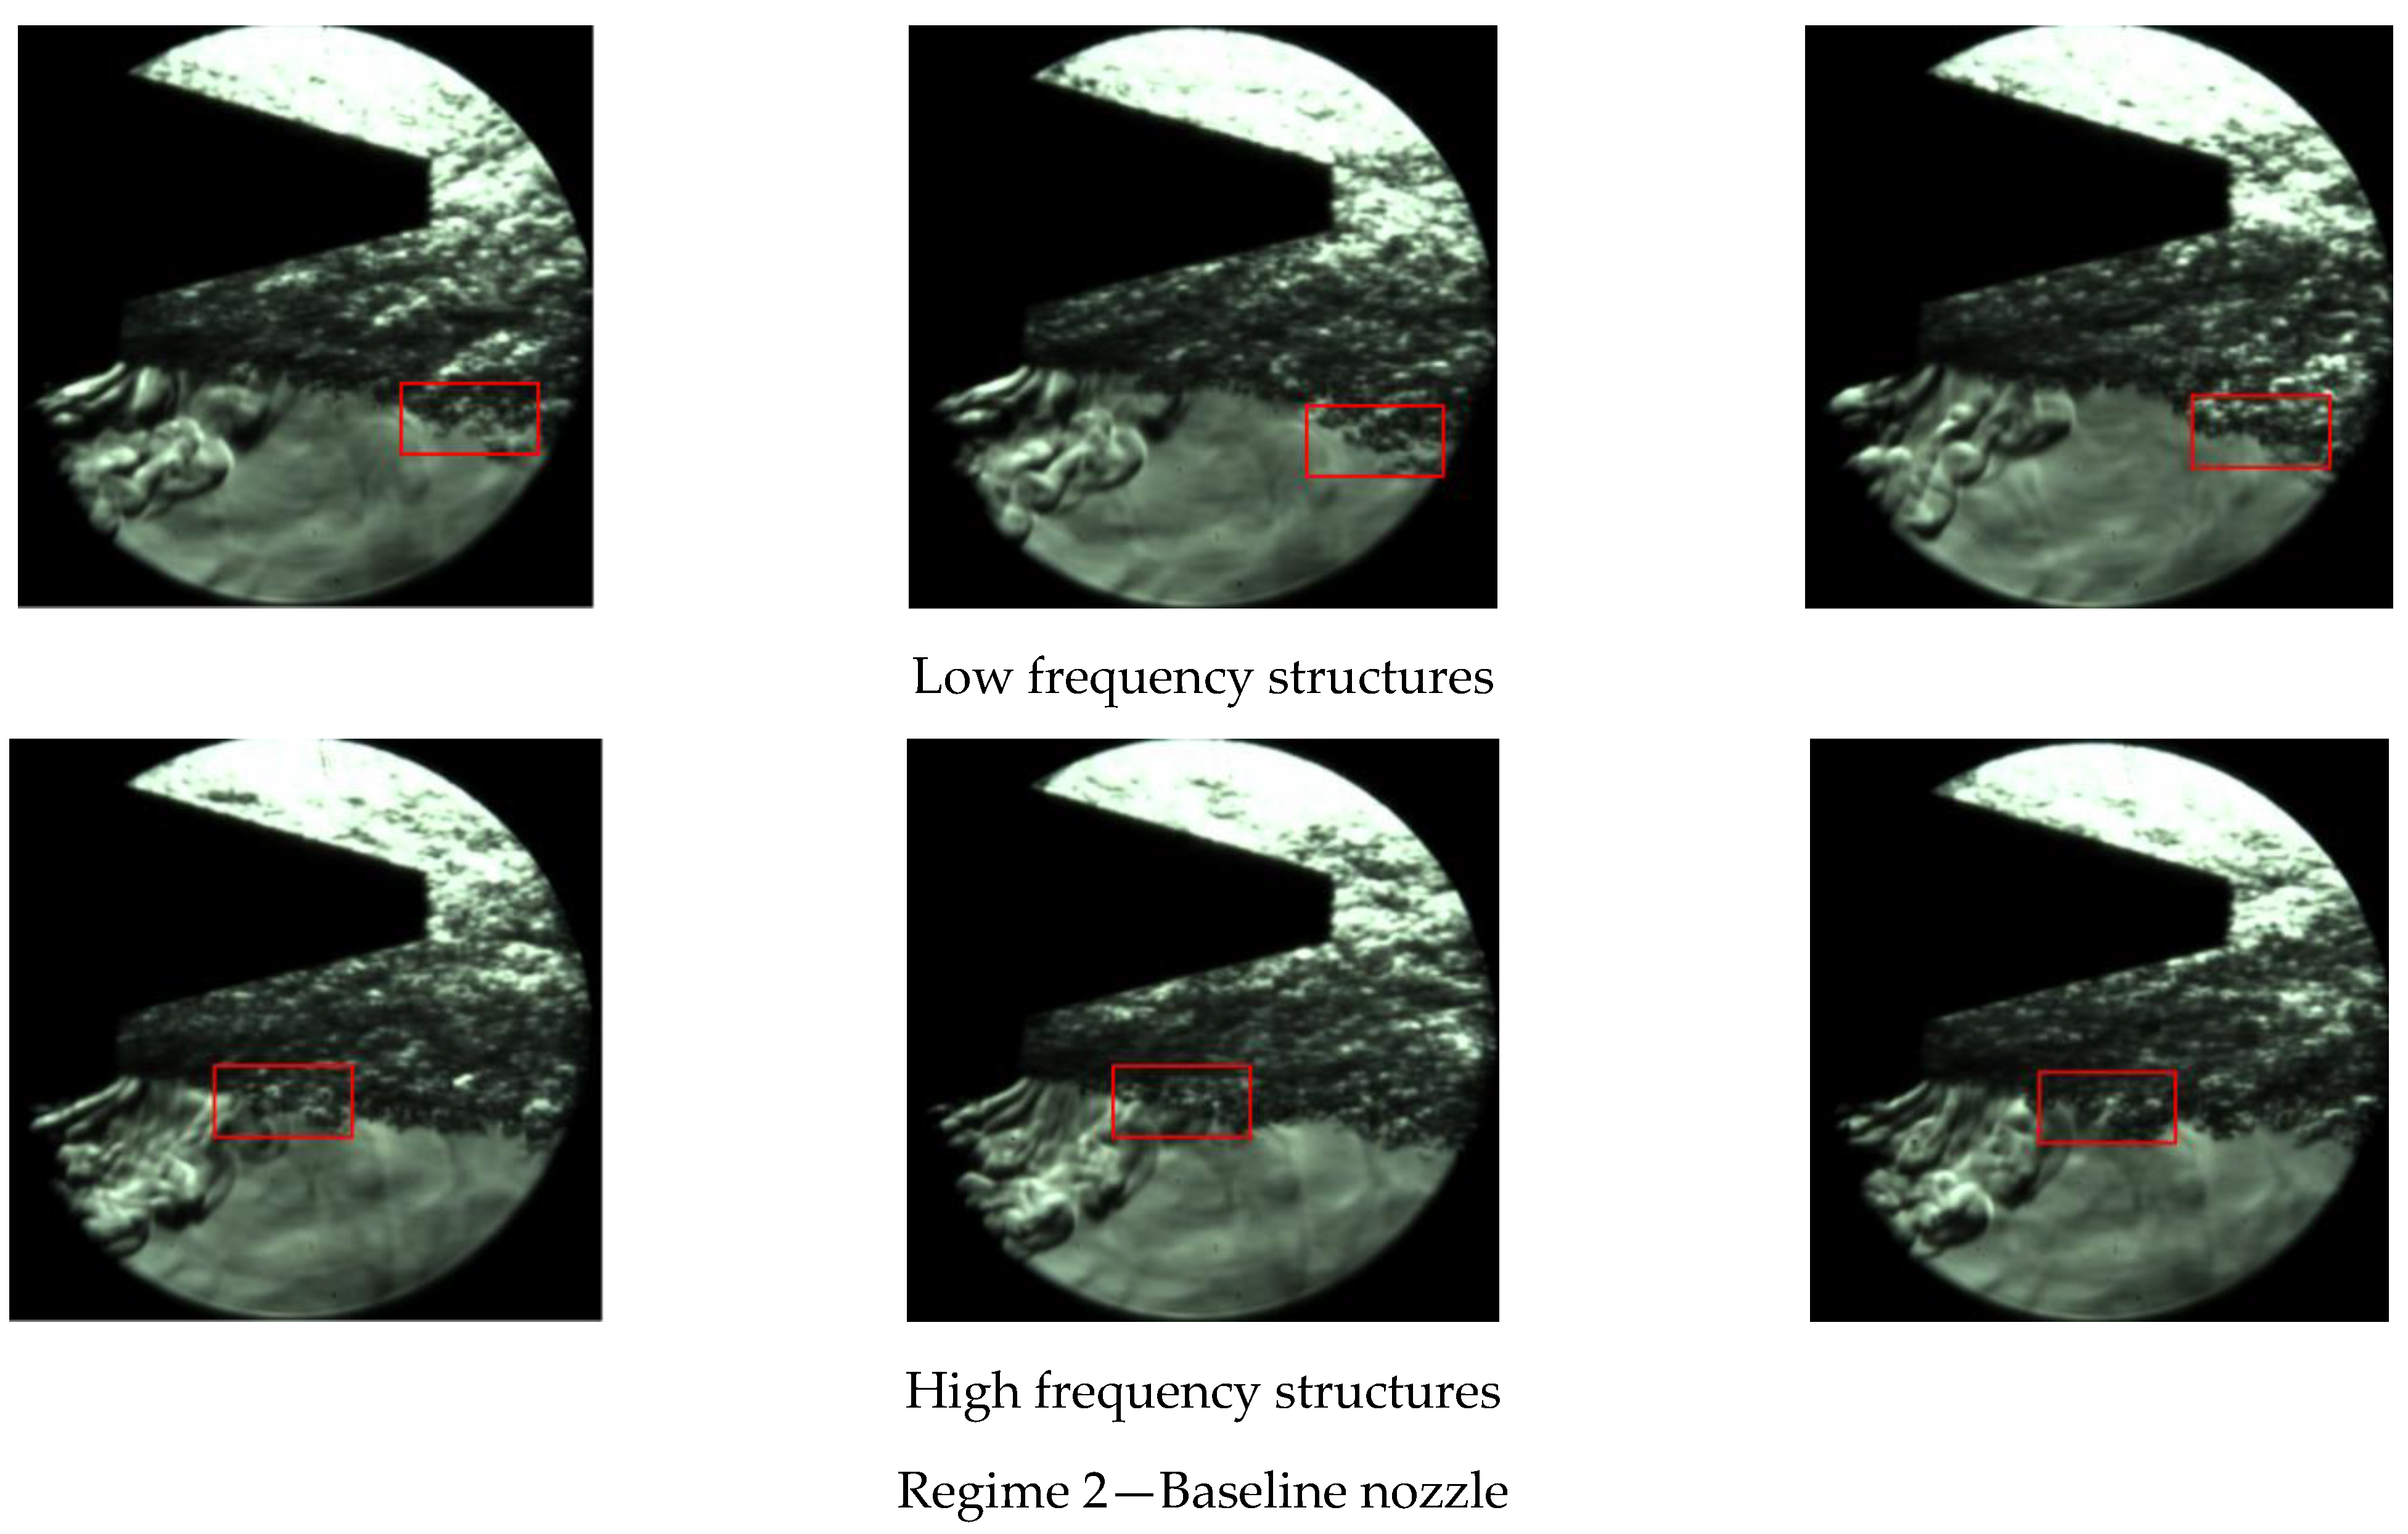
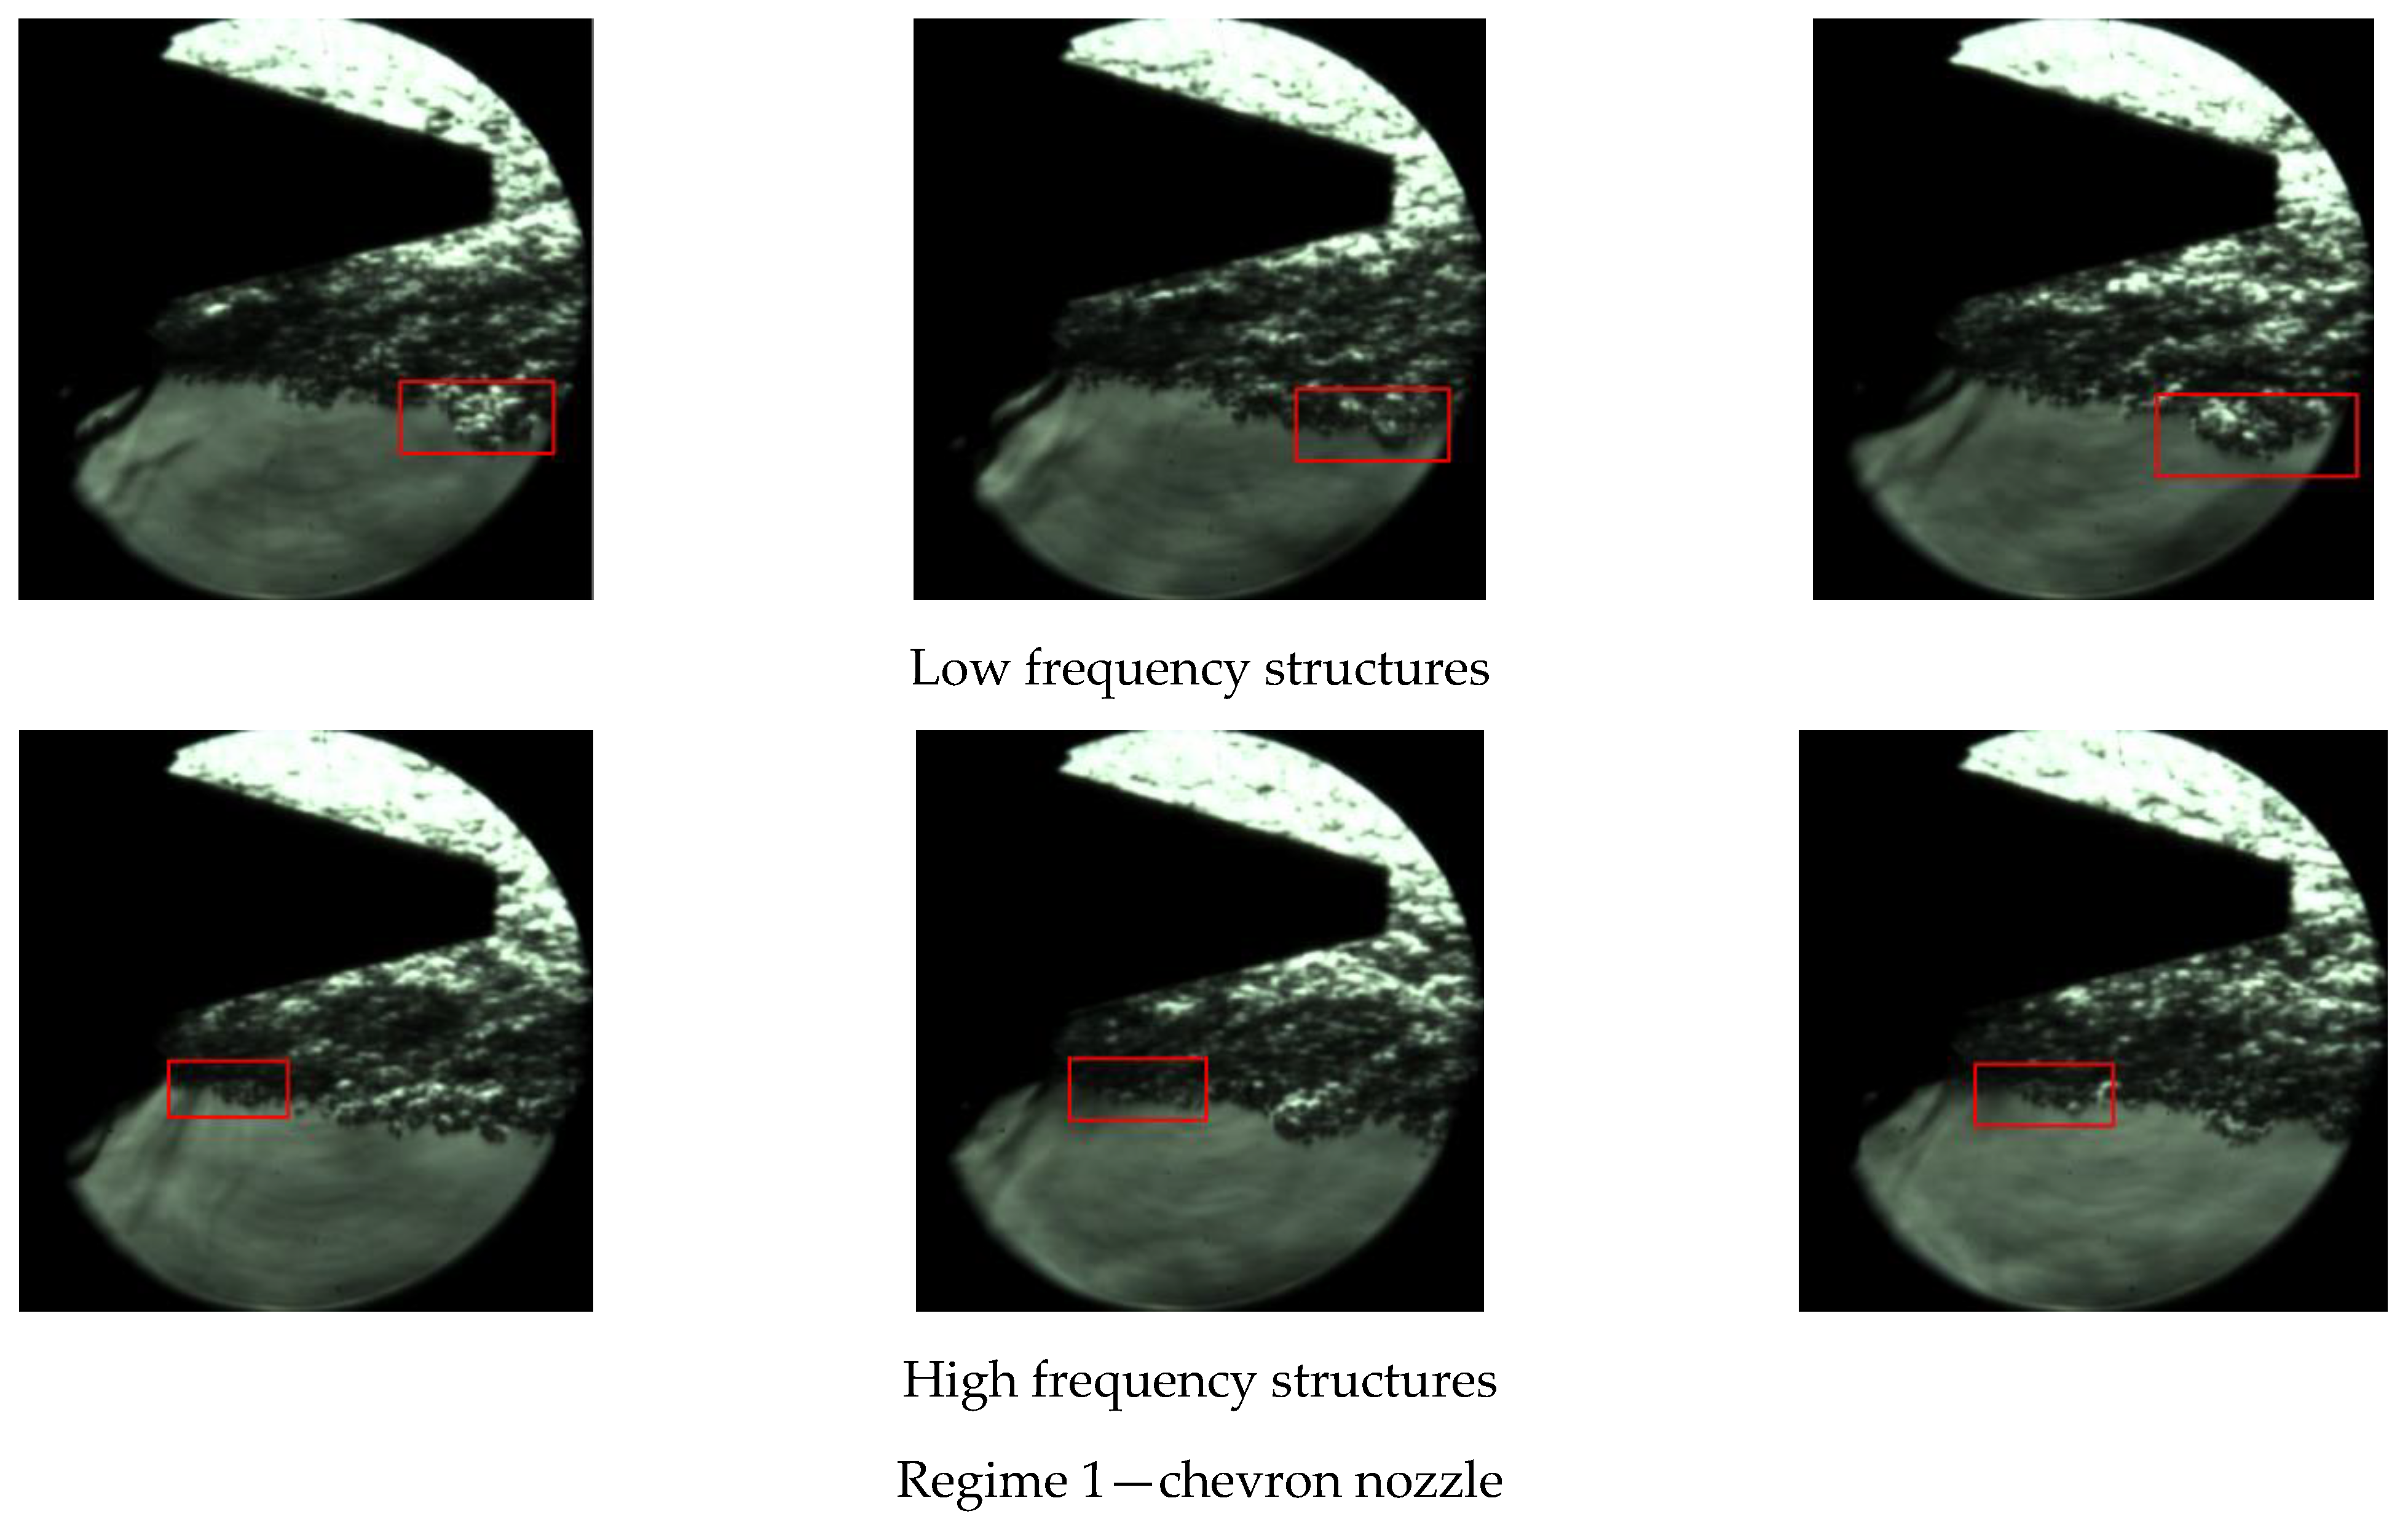
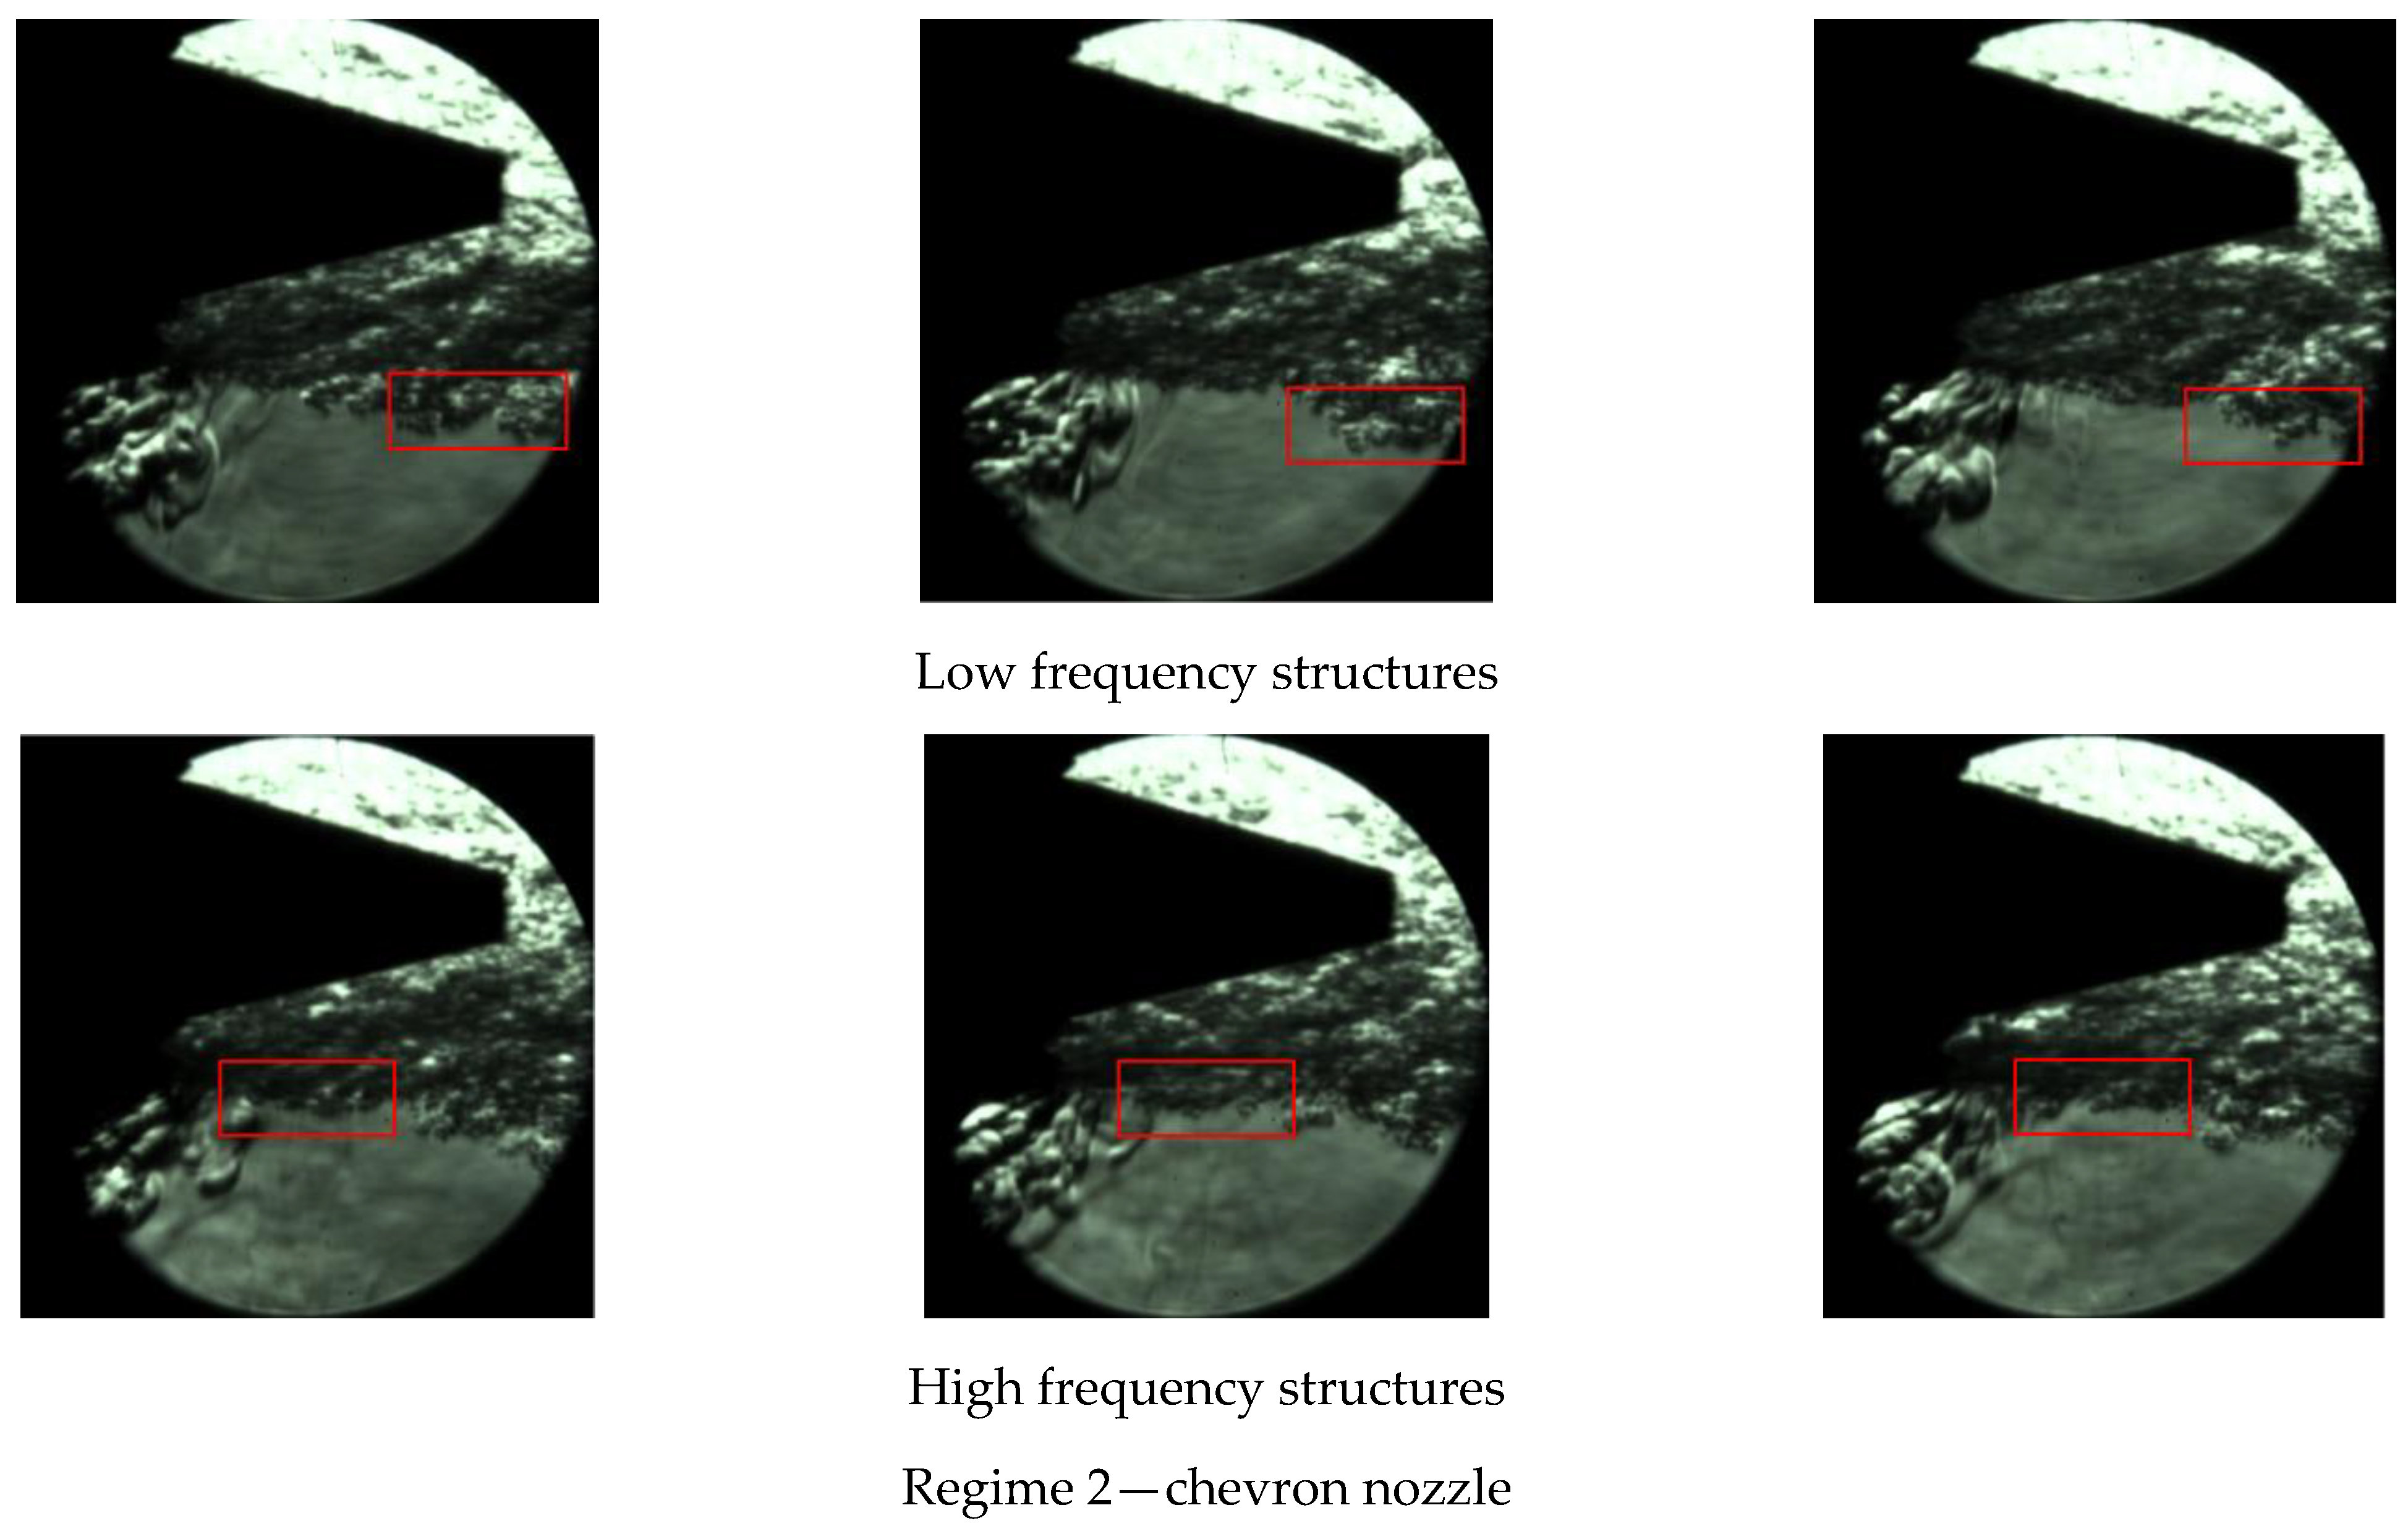
Based on the SPL vs frequency plots, local maxima were identified for each regime. The focus was on dominant frequencies, rather than broadband areas. Using the Schlieren data, periodic features in the flow were identified for each regime and for the baseline nozzle configuration in Figure 14, Figure 15 and Figure 16 and in Figure 17, Figure 18 and Figure 19 for each regime and for chevron nozzle configuration. By low/high frequency structures, one refers to the frequency at which the periodic features reappear in the flow in the same region marked with the red window. A post-processing example for the low frequency in the baseline nozzle case is presented in Figure 20. Captions are added to allow the computation of the time interval between the presented frames.
For each case, the frequency of 30 vortices of this kind was computed (i.e., the frequency between the same vortex appearance at a fixed point in space). A mean frequency along with a confidence interval calculation based on 30 samples using the t-student distribution is reported [44]. The t-student coefficient was 1.697. Table 3 reports the comparative results in terms of frequency between the acoustic and the Schlieren experimental measurements. In spite of the qualitative nature of the vortex extraction based on Schlieren data, the obtained frequency ranges are close to the dominant ones found in the SPL analysis with microphones. In some cases, the analysis yields quite a large confidence interval. This is explained by the presence of two vortex structures’ frequencies that alternate. One can observe that once the rotational speed of the microjet increases, the frequency of the second peak increases as well, in both the acoustics-based experiment and in the Schlieren based analysis. One can also notice that what was a low frequency feature in regime 1 and regime 2, turns into a high frequency one for regime 3. From the microphone data (Figure 13), there is a common peak location for the baseline and chevron cases which explain a single column in Table 3 for the experimental acoustics of the 2 nozzle configurations. For regime 3, one was not able to identify low frequency vortex structures in the Schlieren data and no available data is present in Table 3.
4. Conclusions
There is a noticeable lack of recent high-resolution data in the context of subsonic jet noise generation, particularly when considering the hot jet exhausted by a micro turbojet engine, especially when we talk about experimental validation of flow field using modern optical diagnosis techniques, such as the Schlieren technique. This study explores and attempts to bridge this data gap by collecting a consistent set of flow and noise data for two different configurations: baseline and chevron nozzle for three different operational regimes. This study explores and attempts to fill this data gap by giving a consistent set of flow and noise data gathered for two alternative configurations: baseline and chevron nozzle for three different operational regimes using modern optical diagnosis techniques, such as the Schlieren technique. In addition to the instantaneous recordings, two supplementary techniques were utilized to handle the Schlieren data: average type post-processing and darkest pixel type post-processing for 100 and 1000 frames, respectively. Each of them reveals interesting new features.
The first point of interest concerns the extracted unprocessed frames provided by the Schlieren visualization during the experiments. By the help of instantaneous captures with high-resolution it is confirmed that the presence of chevrons in the jet flow creates a local ejection effect that induces the irrotational region of the fluid field, to be set in motion and drawn into the turbulent flow through the suction effect (n.b. we can see it in animation). What is noteworthy, is the reduction in OASPL (Overall Sound Pressure Level) by approximately 1% at higher operational regimes. This significant reduction is clearly evident in Figure 13 and Table 2. This observation is intriguing because, even as the ejection of high-speed fluid through the chevrons becomes more pronounced, resulting in the entrainment of fluid from a significant distance away from the turbulent region, one might initially expect an increase in noise. The behavior of the chevrons, however, has a counterintuitive effect, which will be elucidated later.
The second interesting fact arises from the post-processing averaging procedure. As we wanted to quantitatively evaluate the influence of high-speed fluid ejection phenomena through the chevrons, an averaging procedure was used to improve the visibility of flow features edges. This includes both linear and non-linear acoustic wave phenomena, which may not be readily apparent in individual frames. We employed this method to enhance our ability to measure the jet angle accurately across all operational regimes and to significantly highlight the presence of both constructive and destructive interferences. This allowed us to gain a deeper understanding of these interferences, which stem from the interaction between concentric waves in the near field surrounding the turbulent jet. This interaction is primarily attributed to the presence of small turbulent propagating eddies downstream (as highlighted by the yellow curves in Figure 9) and the radiated sound waves resulting from the entrainment of fluid during the ejection process, in combination with combustion or turbine noise (as highlighted by the cyan curves in Figure 9).
The third valuable insight comes from the “darkest pixel” post-processing technique. This method, commonly employed in Schlieren imaging to enhance the visibility and analysis of flow features, particularly in regions where there are significant gradients or changes in refractive index, offers a fresh perspective on the flow. It allows for a clearer observation of the isotropic and more uniform distribution of fine-scale eddies in the jet flow when chevrons are introduced. Moreover, it reveals a very interesting pattern flow. The motion inside the jet resembles the dispersion and the Brownian motion of molecules in the kinetic-molecular theory. This seems to confirm the proposed theory by Tam and Auriault [43] for how the noise in subsonic jets is produced by fine-scale turbulence. According to the gas kinetic theory, random motion creates a pressure field at the macroscopic level. Radiated waves at certain angles to the boundary of the mixing layer are influenced by variations in the amplitude and size of individual large turbulent structures. The intensity of Mach wave radiation increases with the presence of chevrons and higher working regimes.
The final part of the paper is dedicated to the acoustic data from measurements performed in the near pressure field of the exhaust engine, recorded by a microphone for the three regimes with and without chevrons. The comparative frequency analysis reveals similar frequency ranges between acoustic measurements and Schlieren data, indicating a satisfactory agreement in dominant frequencies. Future work will focus on further increasing and improving both the modal analysis and the data analysis using the Schlieren technique to reveal features that are not included in this work.
Author Contributions
G.C., M.G., A.B., M.D. and D.E.C. Conceptualization, A.B., M.D. and D.E.C. Methodology, G.C., M.G., A.B. and M.D. Data Collection, G.C., M.G., A.B., M.D. and D.E.C. Writing, G.C., A.B. and D.E.C. Supervision and Reviewing. All authors have read and agreed to the published version of the manuscript.
Funding
This research was performed within the “Nucleu” Programme, part of the National Plan for Research, Development and Innovation 2022–2027, carried out with the support of the Romanian Ministry of Research, Innovation and Digitalisation, project no. PN23.12.01.01.
Institutional Review Board Statement
Not applicable.
Informed Consent Statement
Not applicable.
Data Availability Statement
Data are contained within the article.
Conflicts of Interest
The authors declare no conflict of interest.
References
- Flight Operations Support and Line Assistance. Getting to Grips with Aircraft Noise; Airbus: Leiden, France, 2003; Available online: https://www.smartcockpit.com/docs/getting-to-grips-to-aircraft-noise.pdf (accessed on 10 March 2023).
- Zhao, K.; Okolo, P.; Neri, E.; Chen, P.; Kennedy, J.; Bennett, G. Noise reduction technologies for aircraft landing gear—A bibliographic review. Prog. Aerosp. Sci. 2020, 112, 100589. [Google Scholar] [CrossRef]
- Torija, A.; Self, R. Aircraft classification for efficient modelling of environmental noise impact of aviation. J. Air Transp. Manag. 2018, 67, 157–168. [Google Scholar] [CrossRef]
- Smith, M.J.T. Aircraft Noise; Cambridge University Press: Cambridge, UK, 1989. [Google Scholar]
- Sadeghian, M.; Bandpy, M.G. Technologies for aircraft noise reduction: A review. J. Aeronaut. Aerosp. Eng. 2020, 9, 219. [Google Scholar]
- Balakrishnan, P.; Srinivasan, K. Jet noise reduction using co-axial swirl flow with curved vanes. Appl. Acoust. 2017, 126, 149–161. [Google Scholar] [CrossRef]
- Greatrex, F.B. Engine noise, Acoustics Engine Noise. Aeronaut. J. 1954, 58, 223–235. [Google Scholar] [CrossRef]
- Moore, C.J. The Role of Shear-Layer Instability Waves in Jet Exhaust Noise. J. Fluad Mech. 1977, 80 Pt 2, 321–367. [Google Scholar] [CrossRef]
- Cican, G.; Frigioescu, T.-F.; Crunteanu, D.-E.; Cristea, L. Micro Turbojet Engine Nozzle Ejector Impact on the Acoustic Emission, Thrust Force and Fuel Consumption Analysis. Aerospace 2023, 10, 162. [Google Scholar] [CrossRef]
- Ferrante, P.; De Roeck, W.; Desmet, W.; Magnino, N. Back-to-back comparison of impedance measurement techniques applied to the characterization of aero-engine nacelle acoustic liners. Appl. Acoust. 2016, 105, 129–142. [Google Scholar] [CrossRef]
- Zaman, K.B.M.Q.; Samimy, M.; Reeder, M.F. Effect of Tabs on the Evolution of an Axisymmetric Jet. In Proceedings of the Eighth Symposium on Turbulent Shear Flows, Munich, Germany, 9–11 September 1991. [Google Scholar]
- Krasheninnikov, S.Y.; Mironov, A.K. Aerodynamic and acoustic characteristics of turbulent jet flows in mixer-ejector exhaust systems. In Proceedings of the 5th International Symposium on Transport Noise and Vibration, St. Petersburg, Russia, 2000. [Google Scholar]
- Krasheninnikov, S.Y.; Mironov, A.K. Effect of the Streamwise Component of the Vorticity Formed in a Turbulent Jet Source on the Acoustic Characteristics of the Jet. Fluid Dyn. 2003, 38, 698–711. [Google Scholar] [CrossRef]
- Cican, G.; Deaconu, M.; Crunteanu, D.-E. Impact of Using Chevrons Nozzle on the Acoustics and Performances of a Micro Turbojet Engine. Appl. Sci. 2021, 11, 5158. [Google Scholar] [CrossRef]
- Crispo, C.M.; Greco, C.S.; Cardone, G. Flow field features of chevron impinging synthetic jets at short nozzle-to-plate distance. Exp. Therm. Fluid Sci. 2019, 106, 202–214. [Google Scholar] [CrossRef]
- Smyk, E.; Markowicz, M. Acoustic and flow aspects of synthetic jet actuators with chevron orifices. Appl. Sci. 2021, 11, 652. [Google Scholar] [CrossRef]
- Crispo, C.M.; Greco, C.S.; Avallone, F.; Cardone, G. On the flow organization of a chevron synthetic jet. Exp. Therm. Fluid Sci. 2017, 82, 136–146. [Google Scholar] [CrossRef]
- Lee, I.; Zhang, Y.; Lin, D. Experimental investigation of jet noise from a high BPR dual-stream jet in a static model-scale test. Appl. Acoust. 2019, 150, 246–267. [Google Scholar] [CrossRef]
- Engel, R.C.; Silva, C.R.; Deschamps, C.J. Application of RANS-based method to predict acoustic noise of chevron nozzles. Appl. Acoust. 2014, 79, 153–163. [Google Scholar] [CrossRef]
- Bin, J.; Uzun, A.; Hussaini, M.Y. Adaptive mesh refinement for chevron nozzle jet flows. Comput. Fluids 2010, 39, 979–993. [Google Scholar] [CrossRef]
- Murugu, S.P.; Srikrishnan, A.R.; Krishnaraj, B.K.; Jayaraj, A.; Mohammad, A.; Velamati, R.K. Acoustic Modeling of Compressible Jet from Chevron Nozzle: A Comparison of URANS, LES and DES Models. Symmetry 2022, 14, 1975. [Google Scholar] [CrossRef]
- Xia, H.; Tucker, P.G.; Eastwood, S. Large-eddy simulations of chevron jet flows with noise predictions. Int. J. Heat Fluid Flow 2009, 30, 1067–1079. [Google Scholar] [CrossRef]
- Nandita, N.H.; Sruthi, R.; Prabha, S.; Sundaram, M.; Kumar, A. Flow visualization of the jet exiting a chevron nozzle. Aeron Aero Open Access J. 2018, 2, 62–65. [Google Scholar] [CrossRef]
- Ranjan, A.; Kaushik, M.; Deb, D.; Muresan, V.; Unguresan, M. Assessment of Short Rectangular-Tab Actuation of Supersonic Jet Mixing. Actuators 2020, 9, 72. [Google Scholar] [CrossRef]
- Gnani, F.; Lo, K.H.; Zare-Behtash, H.; Kontis, K. Shock Wave Diffraction Phenomena around Slotted Splitters. Aerospace 2015, 2, 1–16. [Google Scholar] [CrossRef]
- Zhou, W.; Xing, K.; Dou, S.; Yang, Q.; Xu, X. Experimental and Numerical Investigations on the Mixing Process of Supercritical Jet Injected into a Supersonic Crossflow. Aerospace 2022, 9, 631. [Google Scholar] [CrossRef]
- Pellessier, J.E.; Dillon, H.E.; Stoltzfus, W. Schlieren Flow Visualization and Analysis of Synthetic Jets. Fluids 2021, 6, 413. [Google Scholar] [CrossRef]
- Simoncelli, E.; Stancampiano, A.; Boselli, M.; Gherardi, M.; Colombo, V. Experimental Investigation on the Influence of Target Physical Properties on an Impinging Plasma Jet. Plasma 2019, 2, 369–379. [Google Scholar] [CrossRef]
- Veith, S.I.; Friege, G. Making sound visible—A simple schlieren imaging setup for schools. Phys. Educ. 2021, 56, 025024. [Google Scholar] [CrossRef]
- Zhu, P.; Wang, Q.; Pan, D.; Zhu, T.; Ji, C. Experimental Study on Transient Ignition Characteristics of Acoustic Excited Methane Jet Diffusion Flames. Appl. Sci. 2022, 12, 9719. [Google Scholar] [CrossRef]
- Andrews, P.; Lax, P.; Elliot, S.; Firsov, A.; Leonov, S. Flow Characterization at Heated Air Supersonic Facility SBR-50. Fluids 2022, 7, 168. [Google Scholar] [CrossRef]
- Micro Turbojet Test Rig by GUNT Hamburg. Available online: https://gunt.de/en/ (accessed on 1 November 2023).
- Cican, G.; Deaconu, M.; Mirea, R.; Ceatra, L.C.; Cretu, M. An Experimental Investigation to Use the Biodiesel Resulting from Recycled Sunflower Oil, and Sunflower Oil with Palm Oil as Fuels for Aviation Turbo-Engines. Int. J. Environ. Res. Public Health 2021, 18, 5189. [Google Scholar] [CrossRef]
- Cican, G.; Toma, A.; Puşcaşu, C.; Catana, R. Jet CAT P80 thermal analyses and performance assessment using different fuels types. J. Therm. Sci. 2018, 27, 389–393. [Google Scholar] [CrossRef]
- Phantom High Speed Camera, Wayne, New Jersey, USA. Available online: https://www.phantomhighspeed.com/products/cameras/veo/veo710 (accessed on 1 November 2023).
- Settles, G.S. Schlieren and Shadowgraph Techniques; Springer: Berlin/Heidelberg, Germany; New York, NY, USA, 2001. [Google Scholar]
- Bridges, J.; Brown, C.A. Parametric Testing of Chevrons on Single Flow Hot Jets; Glenn Research Center/NASA/TM: Cleveland, OH, USA, 2004; p. 213107. [Google Scholar]
- Birch, N.; Webster, J. Gas Turbine Engine Exhaust Nozzle Having a Noise Attenuation Device Driven by Shape Memory Material Actuators. U.S. Patent 6813877B2, 11 September 2004. Available online: https://patents.google.com/patent/US6813877 (accessed on 10 March 2021).
- Schmidt, R.; Hupfer, A. Design and numerical simulation of ejector nozzles for very small turbojet engines. CEAS Aeronaut. J. 2021, 12, 923–940. [Google Scholar] [CrossRef]
- Martin, J.E.; Meiburg, E. Numerical Investigation of Three-Dimensionally Evolving Jets Subject to Axisymmetric and Azimuthal Perturbations. J. Fluid Mech. 1991, 230, 271–318. [Google Scholar] [CrossRef]
- Tam, C.K.W. Jet Noise Generated by Large-Scale Coherent Motion. Aeroacoustics of Flight Vehicles. Theory Pract. 1991, 1258, 6. [Google Scholar]
- Tam, C.K.W.; Morris, P.J. The radiation of sound by the instability waves of a compressible plane turbulent shear layer. J. Fluid Mech. 1980, 98, 349. [Google Scholar] [CrossRef]
- Tam, C.K.W.; Auriault, L. Jet mixing noise from fine scale turbulence. AIAA J. 1999, 37, 145–153. [Google Scholar] [CrossRef]
- Benedict, R. Fundamentals of Temperature, Pressure, and Flow Measurements; Wiley-Interscience Publication: Hoboken, NJ, USA, 1991. [Google Scholar]
Figure 1.
Schlieren system sketch.

Figure 2.
Experimental test bench with aligned Schlieren system.

Figure 3.
Acoustic experimental test bench. (a) Top view; (b) Front view (sketch); (c) Top view (sketch).
Figure 3.
Acoustic experimental test bench. (a) Top view; (b) Front view (sketch); (c) Top view (sketch).

Figure 4.
Nozzle 3D designs—baseline and chevrons (a) perspective view (b) nozzles’ tested configurations.
Figure 4.
Nozzle 3D designs—baseline and chevrons (a) perspective view (b) nozzles’ tested configurations.

Figure 5.
Micro turbojet engine tested nozzles.

Figure 6.
Exhaust jet Schlieren visualization—Regime 1—instantaneous captures.

Figure 7.
Exhaust jet Schlieren visualization—Regime 2—instantaneous captures.

Figure 8.
Exhaust jet Schlieren visualization—Regime 3—instantaneous captures.

Figure 11.
Darkest pixel type post-processing of the Schlieren (1000 frames).

Figure 12.
Darkest pixel type post-processing of the Schlieren (100 frames).

Figure 13.
Averaged noise spectra for each configuration and regime (reference—baseline nozzle, N16_L10_I0—Chevron nozzle).
Figure 13.
Averaged noise spectra for each configuration and regime (reference—baseline nozzle, N16_L10_I0—Chevron nozzle).

Figure 14.
Low frequency structures and high frequency structures for regime 1; baseline nozzle.


Figure 15.
Low frequency structures and high frequency structures for regime 2; baseline nozzle.

Figure 16.
High frequency structures for regime 1; baseline nozzle.

Figure 17.
Low frequency structures and high frequency structures for regime 1; chevron nozzle.

Figure 18.
Low frequency structures and high frequency structures for regime 2; chevron nozzle.

Figure 19.
High frequency structures for regime 3; chevron nozzle.

Figure 20.
Low frequency structures’ post-processing examples (regime 1, baseline nozzle).

Table 2.
OASPL results—baseline vs. chevrons nozzle.
| Regime | Nozzle Type | OASPL (dB) | Noise Reduction (dB) | Percent of the Noise Reduction % | Acoustic Pressure (Pa) |
|---|---|---|---|---|---|
| Regime 1 | Baseline | 100.2 | 2.046585985 | ||
| Chevrons | 100.6 | −0.4 | −4.71285 | 2.14303861 | |
| Regime 2 | Baseline | 108.4 | 5.260535984 | ||
| Chevrons | 107.6 | 0.8 | 8.798916 | 4.797665838 | |
| Regime 3 | Baseline | 117.8 | 15.52494233 | ||
| Chevrons | 116.3 | 1.5 | 15.86049 | 13.06261105 |
Table 3.
Frequency comparative results—Schlieren data vs. Acoustics.
| Regime | Peak | Experimental Acoustics | Experimental—Schlieren Baseline Nozzle | Experimental—Schlieren Chevrons Nozzle |
|---|---|---|---|---|
| Regime 1 | Peak 1 | 200 Hz | 233 ± 118 Hz | 284 ± 152 Hz |
| Peak 2 | 798 Hz | 695 ± 274 Hz | 617 ± 240 Hz | |
| Regime 2 | Peak 1 | 249 Hz | 544 ± 221 Hz | 490 ± 157 Hz |
| Peak 2 | 923 Hz | 990 ± 238 Hz | 903 ± 222 Hz | |
| Regime 3 | Peak 1 | 255 Hz | - | - |
| Peak 2 | 1400 Hz | 1140 ± 481 Hz | 1190 ± 361 Hz |
Disclaimer/Publisher’s Note: The statements, opinions and data contained in all publications are solely those of the individual author(s) and contributor(s) and not of MDPI and/or the editor(s). MDPI and/or the editor(s) disclaim responsibility for any injury to people or property resulting from any ideas, methods, instructions or products referred to in the content. |
© 2023 by the authors. Licensee MDPI, Basel, Switzerland. This article is an open access article distributed under the terms and conditions of the Creative Commons Attribution (CC BY) license (https://creativecommons.org/licenses/by/4.0/).
Share and Cite
MDPI and ACS Style
Cican, G.; Gall, M.; Bogoi, A.; Deaconu, M.; Crunțeanu, D.E. Experimental Investigation of a Micro Turbojet Engine Chevrons Nozzle by Means of the Schlieren Technique. Inventions 2023, 8, 145. https://doi.org/10.3390/inventions8060145
AMA Style
Cican G, Gall M, Bogoi A, Deaconu M, Crunțeanu DE. Experimental Investigation of a Micro Turbojet Engine Chevrons Nozzle by Means of the Schlieren Technique. Inventions. 2023; 8(6):145. https://doi.org/10.3390/inventions8060145
Chicago/Turabian StyleCican, Grigore, Mihnea Gall, Alina Bogoi, Marius Deaconu, and Daniel Eugeniu Crunțeanu. 2023. "Experimental Investigation of a Micro Turbojet Engine Chevrons Nozzle by Means of the Schlieren Technique" Inventions 8, no. 6: 145. https://doi.org/10.3390/inventions8060145