Article

Lab Scale Investigation of Gaseous Emissions, Performance and Stability of an Aviation Turbo-Engine While Running on Biodiesel Based Sustainable Aviation Fuel

1
National Research and Development Institute for Gas Turbines COMOTI, 220D Iuliu Maniu, 061126 Bucharest, Romania
2
Faculty of Aerospace Engineering, Polytechnic University of Bucharest, 1-7 Polizu Street, 011061 Bucharest, Romania
*
Authors to whom correspondence should be addressed.
Inventions 2024, 9(1), 16; https://doi.org/10.3390/inventions9010016
Submission received: 28 November 2023 / Revised: 9 January 2024 / Accepted: 15 January 2024 / Published: 19 January 2024
(This article belongs to the Special Issue Thermodynamic and Technical Analysis for Sustainability (Volume 3))

Abstract

:
The research experimentally examines the viability of biodiesel obtained from pork fat (BP) as a sustainable aviation fuel (SAF) when mixed with kerosene (Ke)—Jet-A aviation fuel + 5% Aeroshell 500 oil. Various blends of biodiesel and kerosene (10, 20, and 30% vol. of BP added in Ke) were subjected to testing in an aviation micro turbo-engine under different operational states: idle, cruise, and maximum power. During the tests, monitoring of engine parameters such as burning temperature, fuel consumption, and thrust force was conducted. The study also encompassed the calculation of crucial performance indicators like burning efficiency, thermal efficiency, and specific consumption for all fuel blends under maximum power conditions. Combustion temperatures ahead of the turbines rise with an increase in biodiesel concentration, particularly in the idle regime, without compromising engine integrity. However, for regimes 2 and 3, the temperature in front of the turbine decreases with rising biodiesel concentration, accompanied by an increase in fuel flow rate. This phenomenon is reflected in the elevated specific consumption. Notably, for regime 3, there is a noticeable rise in specific consumption, starting from S = 0.0264 kg/Nh when the turbo-engine operates solely with Ke, to S = 0.0266 kg/Nh for Ke + 10% BP, S = 0.0269 kg/Nh for Ke + 20% BP, and S = 0.0275 kg/Nh for Ke + 30% BP. Physical–chemical properties of the blends, encompassing density, viscosity, flash point, and calorific power, were determined. Furthermore, elemental analysis and FTIR were used for chemical composition determination. The amount of CO2 produced during the stoichiometric combustion reaction with air showed variations. Initially, when using only Ke, it amounted to 3.12 kg per kilogram of fuel. Upon adding 10% BP, this value decreased to 3.09 kg, further reducing to 3.05 kg with 20% BP. The lowest value was observed with 30% BP, reaching 3.04 kg. Experimental assessments were performed on the Jet Cat P80® micro-turbo-engine, covering aspects such as starting procedures, sudden acceleration, sudden deceleration, and emissions of pollutants (NOx, CO, and SO2) during several engine operational phases. The outcomes reveal that the examined fuel blends exhibited stable engine performance across all tested conditions. This indicates that these blends hold promise as sustainable aviation fuels for micro turbo-engines, presenting benefits in terms of diminished pollution and a more ecologically sound raw material base for fuel production.

1. Introduction

Air quality degradation has several aspects such as gaseous pollution, global warming, and O3 layer depletion, with the main reason being the burning of fossil fuels [1]. Therefore, the use of renewable energy may be a solution for slowing if not stopping the processes involved in air quality degradation.
In terms of aviation fuels, several alternatives have been pointed out by the researchers: the use of alcohols, hydrogen (both liquid and gaseous), synthetic fuels, etc. [2]. Nowadays, in the field of aviation fuels, the main research is focused on the production and use of bio-fuels, which have been proven to be more environmentally friendly and have the potential to reduce greenhouse gasses and CO2 emissions [3]. The most promising bio-fuel in aviation applications seems to be biodiesel because it shows the highest potential to meet the needed energy requirements [4,5]. It appears to be the most feasible solution to O3 depletion and environment degradation by successfully replacing classical fuels. It is well established that biodiesel emit fewer gaseous pollutants during burning and its most important advantage is that it can be used in diesel engines without retrofitting them. It also shows lower toxicity, biodegradation and being a renewable fuel can successfully replace classic diesel [6,7].
On the other hand, alcohols seem to be an equally good solution, especially during use in piston engines [8,9,10]. Ethanol is one of the most important alcohols used in piston engines and studies have been conducted on its use. By covering aspects from ethanol production to engine performance while using gasoline/bioethanol blends (E3, E6, and E10) to gaseous emissions [11], researchers have pushed the boundary towards on-board hydrogen production and mixtures made out of alcohol and diesel [12], alcohol, and di-methyl carbonate [13]. Also, classes of alcohols (methanol, ethanol, butanol, etc.) have been tested in different mixtures with gasoline and their effect on an engine’s performance and emissions have been assessed [14].
The improvements brought to engine performance when alcohols have been mixed with gasoline have been studied. Thus, the adding of small amounts of alcohol does not influence the engine’s delivered properties (thrust, fuel consumption, etc.) [15]. CO2 and total emitted hydrocarbons (THC) increase with the increase in alcohol percentage within the blend [16]. Thus, the adding of the alcohol contributes to the improvement of thermal efficiency and anti-detonation properties of the fuel [17]; therefore, larger concentrations ranging from 10 to 85% and even 100% of ethanol in gasoline have been tested [18,19,20].
In terms of the use of alcohols in different mixtures for feeding aviation turbo-engines, several studies have been conducted based on the type of engine and its required performance. A few of the studies have been finalized also with demonstrative flights [21,22,23]. In addition to engine performance assessment, research has also been focused on the evaluation of combustion and gaseous pollutant emissions [24,25,26,27,28,29].
Mixtures of ethanol and Jet-A aviation fuel have been used to feed different types of engines ranging from a GTM-140 micro-turbine, full-size DGEN380 turbofan to a four-stroke direct-injection diesel engine [30,31].
Nevertheless, first tests and certifications on the use of biodiesel/airplane fuel (AVGAS) blends have been conducted for aviation piston engines [32] but also ethanol/Jet-A mixtures have been tested on piston aviation engines [33]. It has been determined that by using a new type of controller, the engine could overcome some drawbacks in terms of functioning characteristics.
Biodiesel/Jet-A mixtures have been fed to a piston aviation engine and several advantages occur with the use of ethanol both in terms of physical–chemical properties and delivered performance. Moreover, gaseous pollutant concentrations decrease compared with the ones obtained from the use of classical aviation fuel [34,35]. Other research papers have examined the use of biodiesel as a sustainable fuel for small turbojet engines in laboratory conditions. The studies explore different types of biodiesels and JET-A-1 mixtures and assess their impact on the fundamental parameters of these engines [28].
The use of bio-ethanol as fuel for aviation turbine engines was also studied. Different compositions, specifically 5%, 10%, and 15% concentrations of bio-ethanol blended with Jet-A fuel, were subjected to testing using the JET CAT P80 micro-turbo-engine. Throughout the testing process, various parameters were meticulously monitored, including engine speed, thrust generated, temperature preceding the turbine, fuel volumetric flow rate, and vibration levels assessed in both axial and radial directions. The micro-turbo-engine was sustained at three distinct operational states: idle, cruise, and maximum speed, each lasting approximately 1 min. Furthermore, a comparative evaluation was conducted between fuels, scrutinizing the micro-turbo-engine’s performance from the idle to maximum positions. Upon completion of the tests, a comprehensive jet engine cycle analysis was carried out at the maximum operational state. This analysis involved the calculation of fuel-specific consumption, combustion chamber efficiency, and thermal efficiency of the engine for each fuel blend. It is pertinent to note that these assessments were executed without any alterations made to the engine components or the automation system [27].
In the field of power engineering, investigations into the impact of biofuels and alcohol-derived blends on gas turbines have been conducted. Elevated ethanol concentrations resulted in heightened carbon monoxide (CO) emissions. Conversely, nitrogen oxides (NOx) witnessed a substantial decrease of up to 70% in the presence of biofuels, and there was a concurrent reduction in particulate matter (PM10) [36].
An analysis of the possibility of using recycled pork fat-based biodiesel as fuel for aviation turbo-engines is presented in [37]. The analysis consists of the assessment of four blends of Jet-A kerosene with 10%, 30%, 50%, and 100% biodiesel. The current paper is basically a continuation of paper [37]. The research conducted in this study provides an examination of the impacts associated with the utilization of biodiesel in a compact turbojet engine. The primary objective is to investigate the viability of a Jet-A and biodiesel blends as a potential fuel source for small turbojet engines, drawing upon insights from earlier research endeavors. The present study aims to evaluate the operational parameters of a micro turbo-engine commonly deployed in drones and aero-models. This assessment involves varying the composition of kerosene and biodiesel blends. Specifically, a comparative analysis was carried out, comparing fuel mixtures comprising Jet-A and 5% Aeroshell 500 Oil (Ke) against blends featuring 10%, 20%, and 30% biodiesel obtained from pork fat (BP), with Ke serving as the benchmark reference point. After determining the physical–chemical properties of the mixtures, a measurement campaign has followed where burning tests were carried out on the Jet Cat P80 micro-turbo-engine. The novelty of the paper compared with reference [37] is that now the transitory regimes are taken into account and gaseous pollutants resulted from the combustion of the above-mentioned blends and regimes were assessed.

2. Materials and Methods

In order to establish the sustainability of fuel blends based on biodiesel, several investigations were performed within this paper, namely, blends consisting of Jet-A aviation fuel (Ke): blends of Ke + 10% (BP), Ke + 20% (BP), and Ke + 30% (BP).
Experimental assessment of the physical–chemical properties of the above-mentioned fuels and fuel blends were performed. Also, functional testing was carried out by feeding a micro turbo-engine with the above-mentioned fuels and fuel blends.
The biodiesel used within the experiments was purchased from the market and was produced by Bunge Romania. It has the following characteristics: flash point: 161 °C, cinematic viscosity: 5.08 cSt, density 0.875 g/cm3, cetane number: 55. The aviation fuel was purchased from OMV Romania and has the following characteristics: flash point: 42.3 °C, density: 0.817 g/cm3, cinematic viscosity: 1.39 cSt. The oil used for engine lubrication was Aeroshell 500 provided by Shell Romania and has the following main characteristics: kinematic viscosity at 40 °C: 25.2 cSt, flash point: 264 °C, density: 1.005 g/cm3.

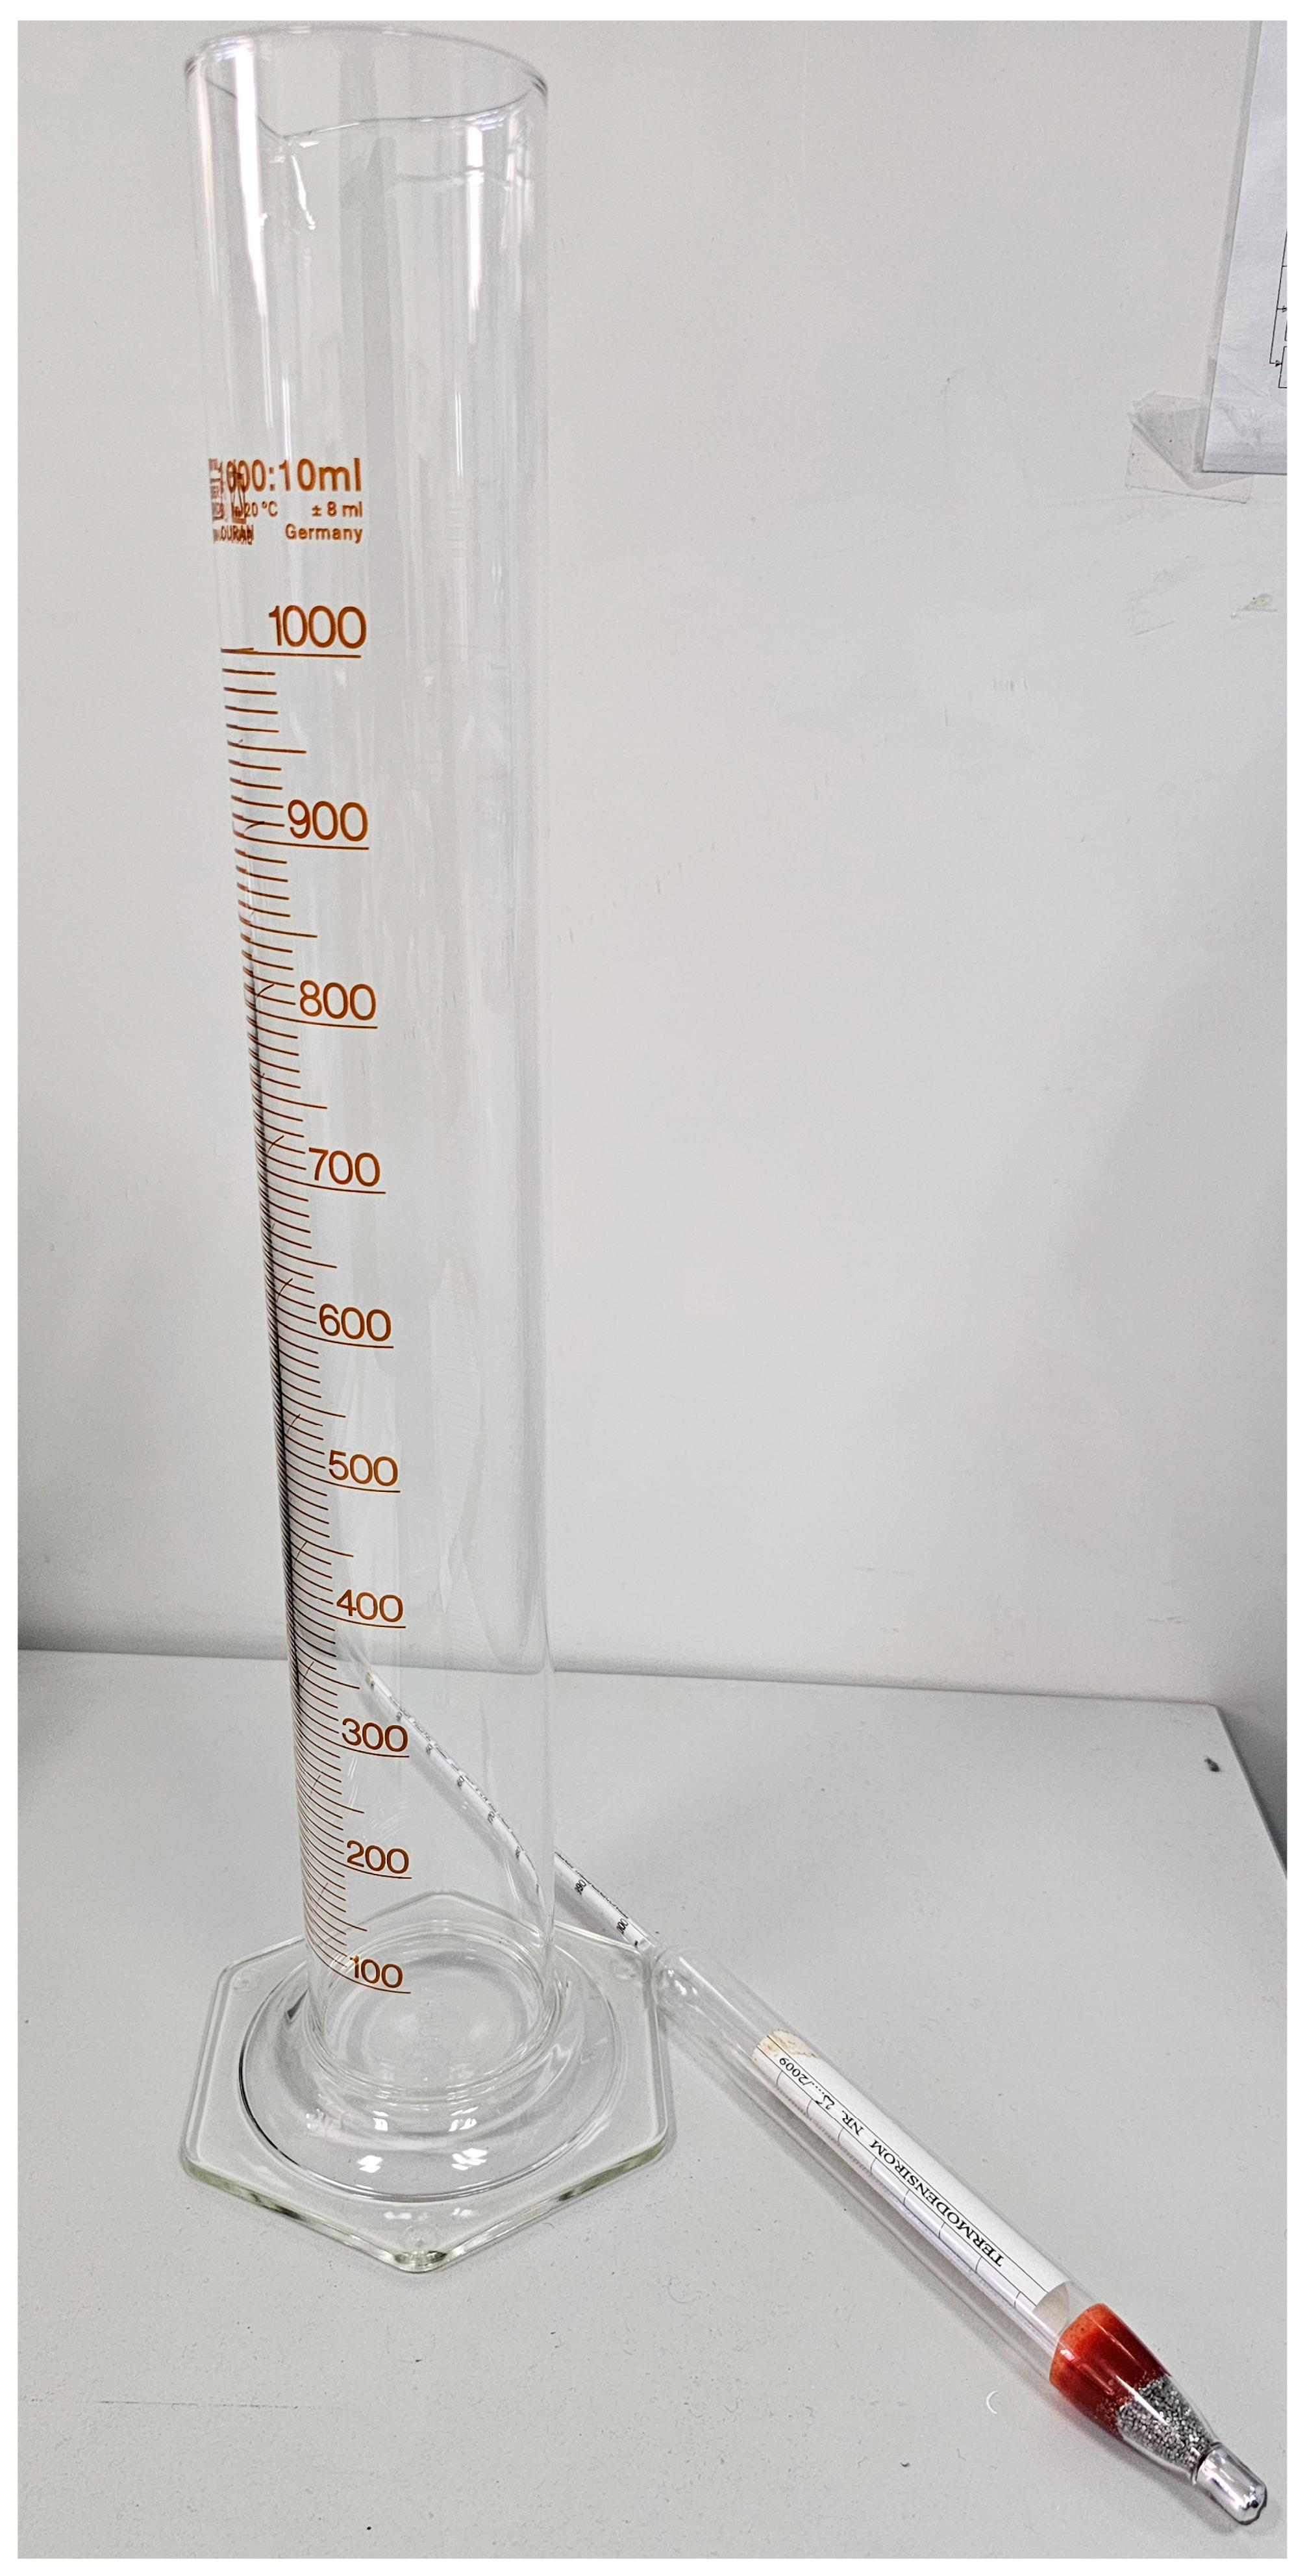
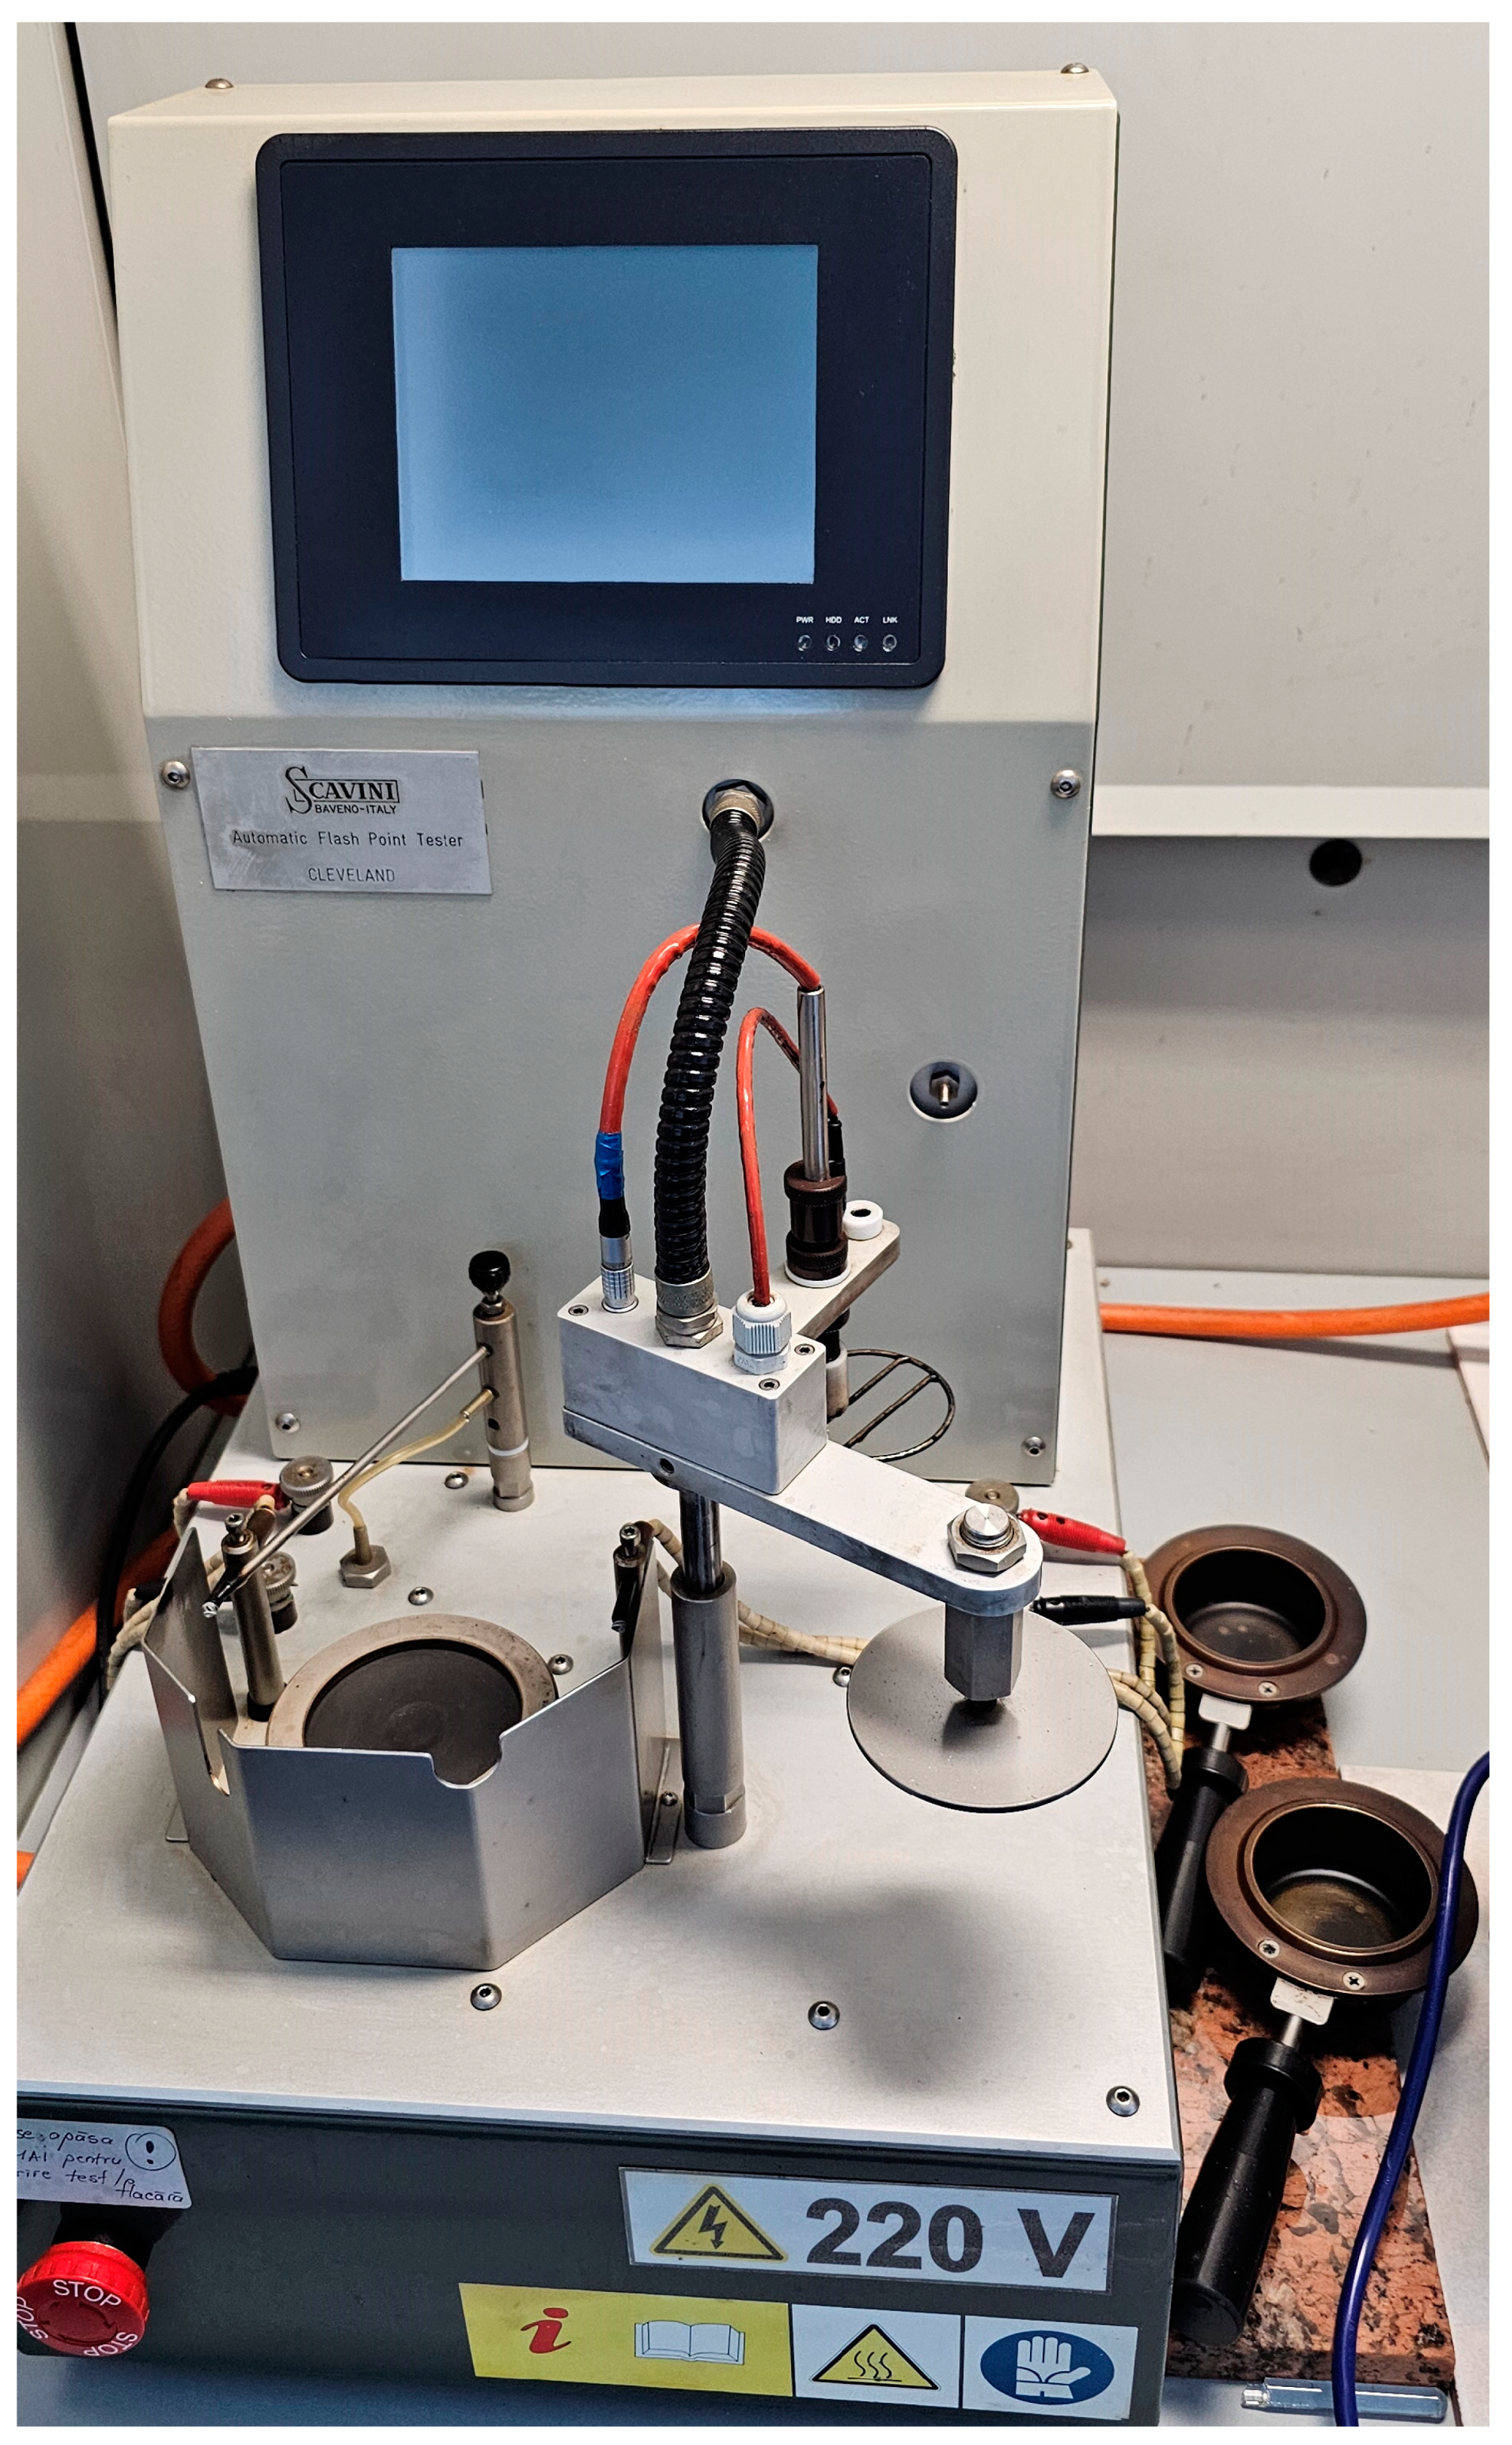
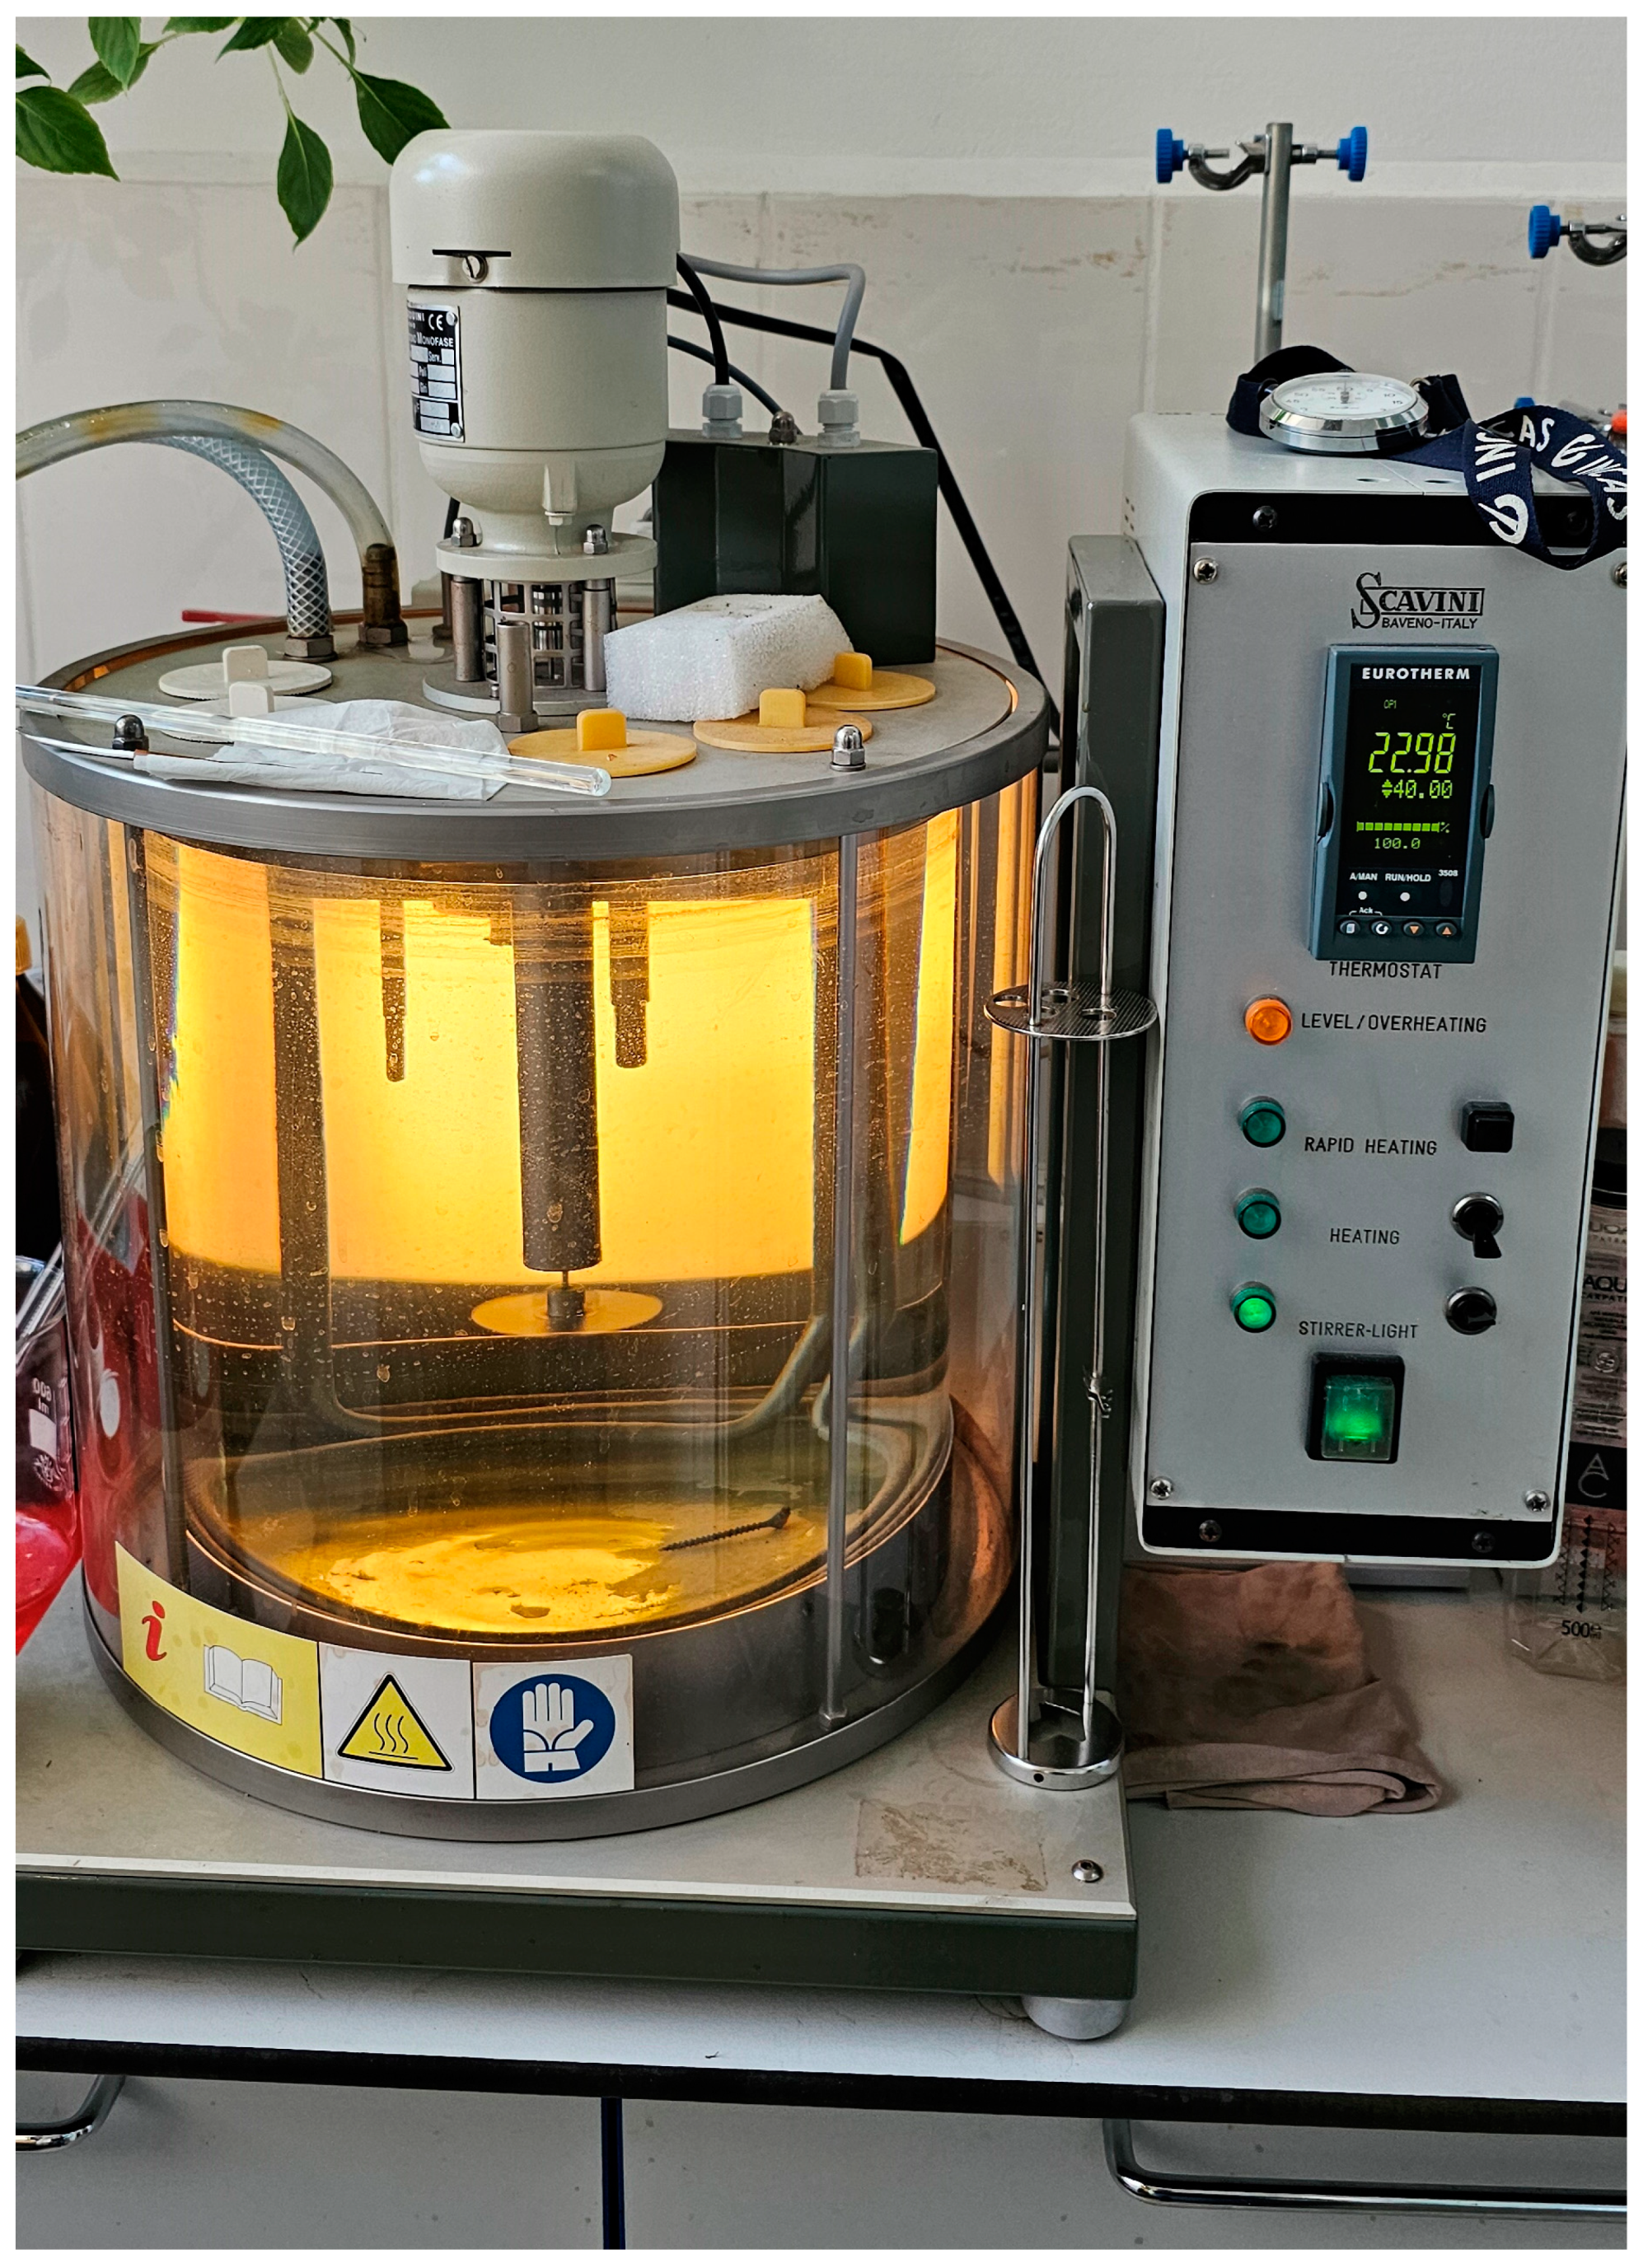
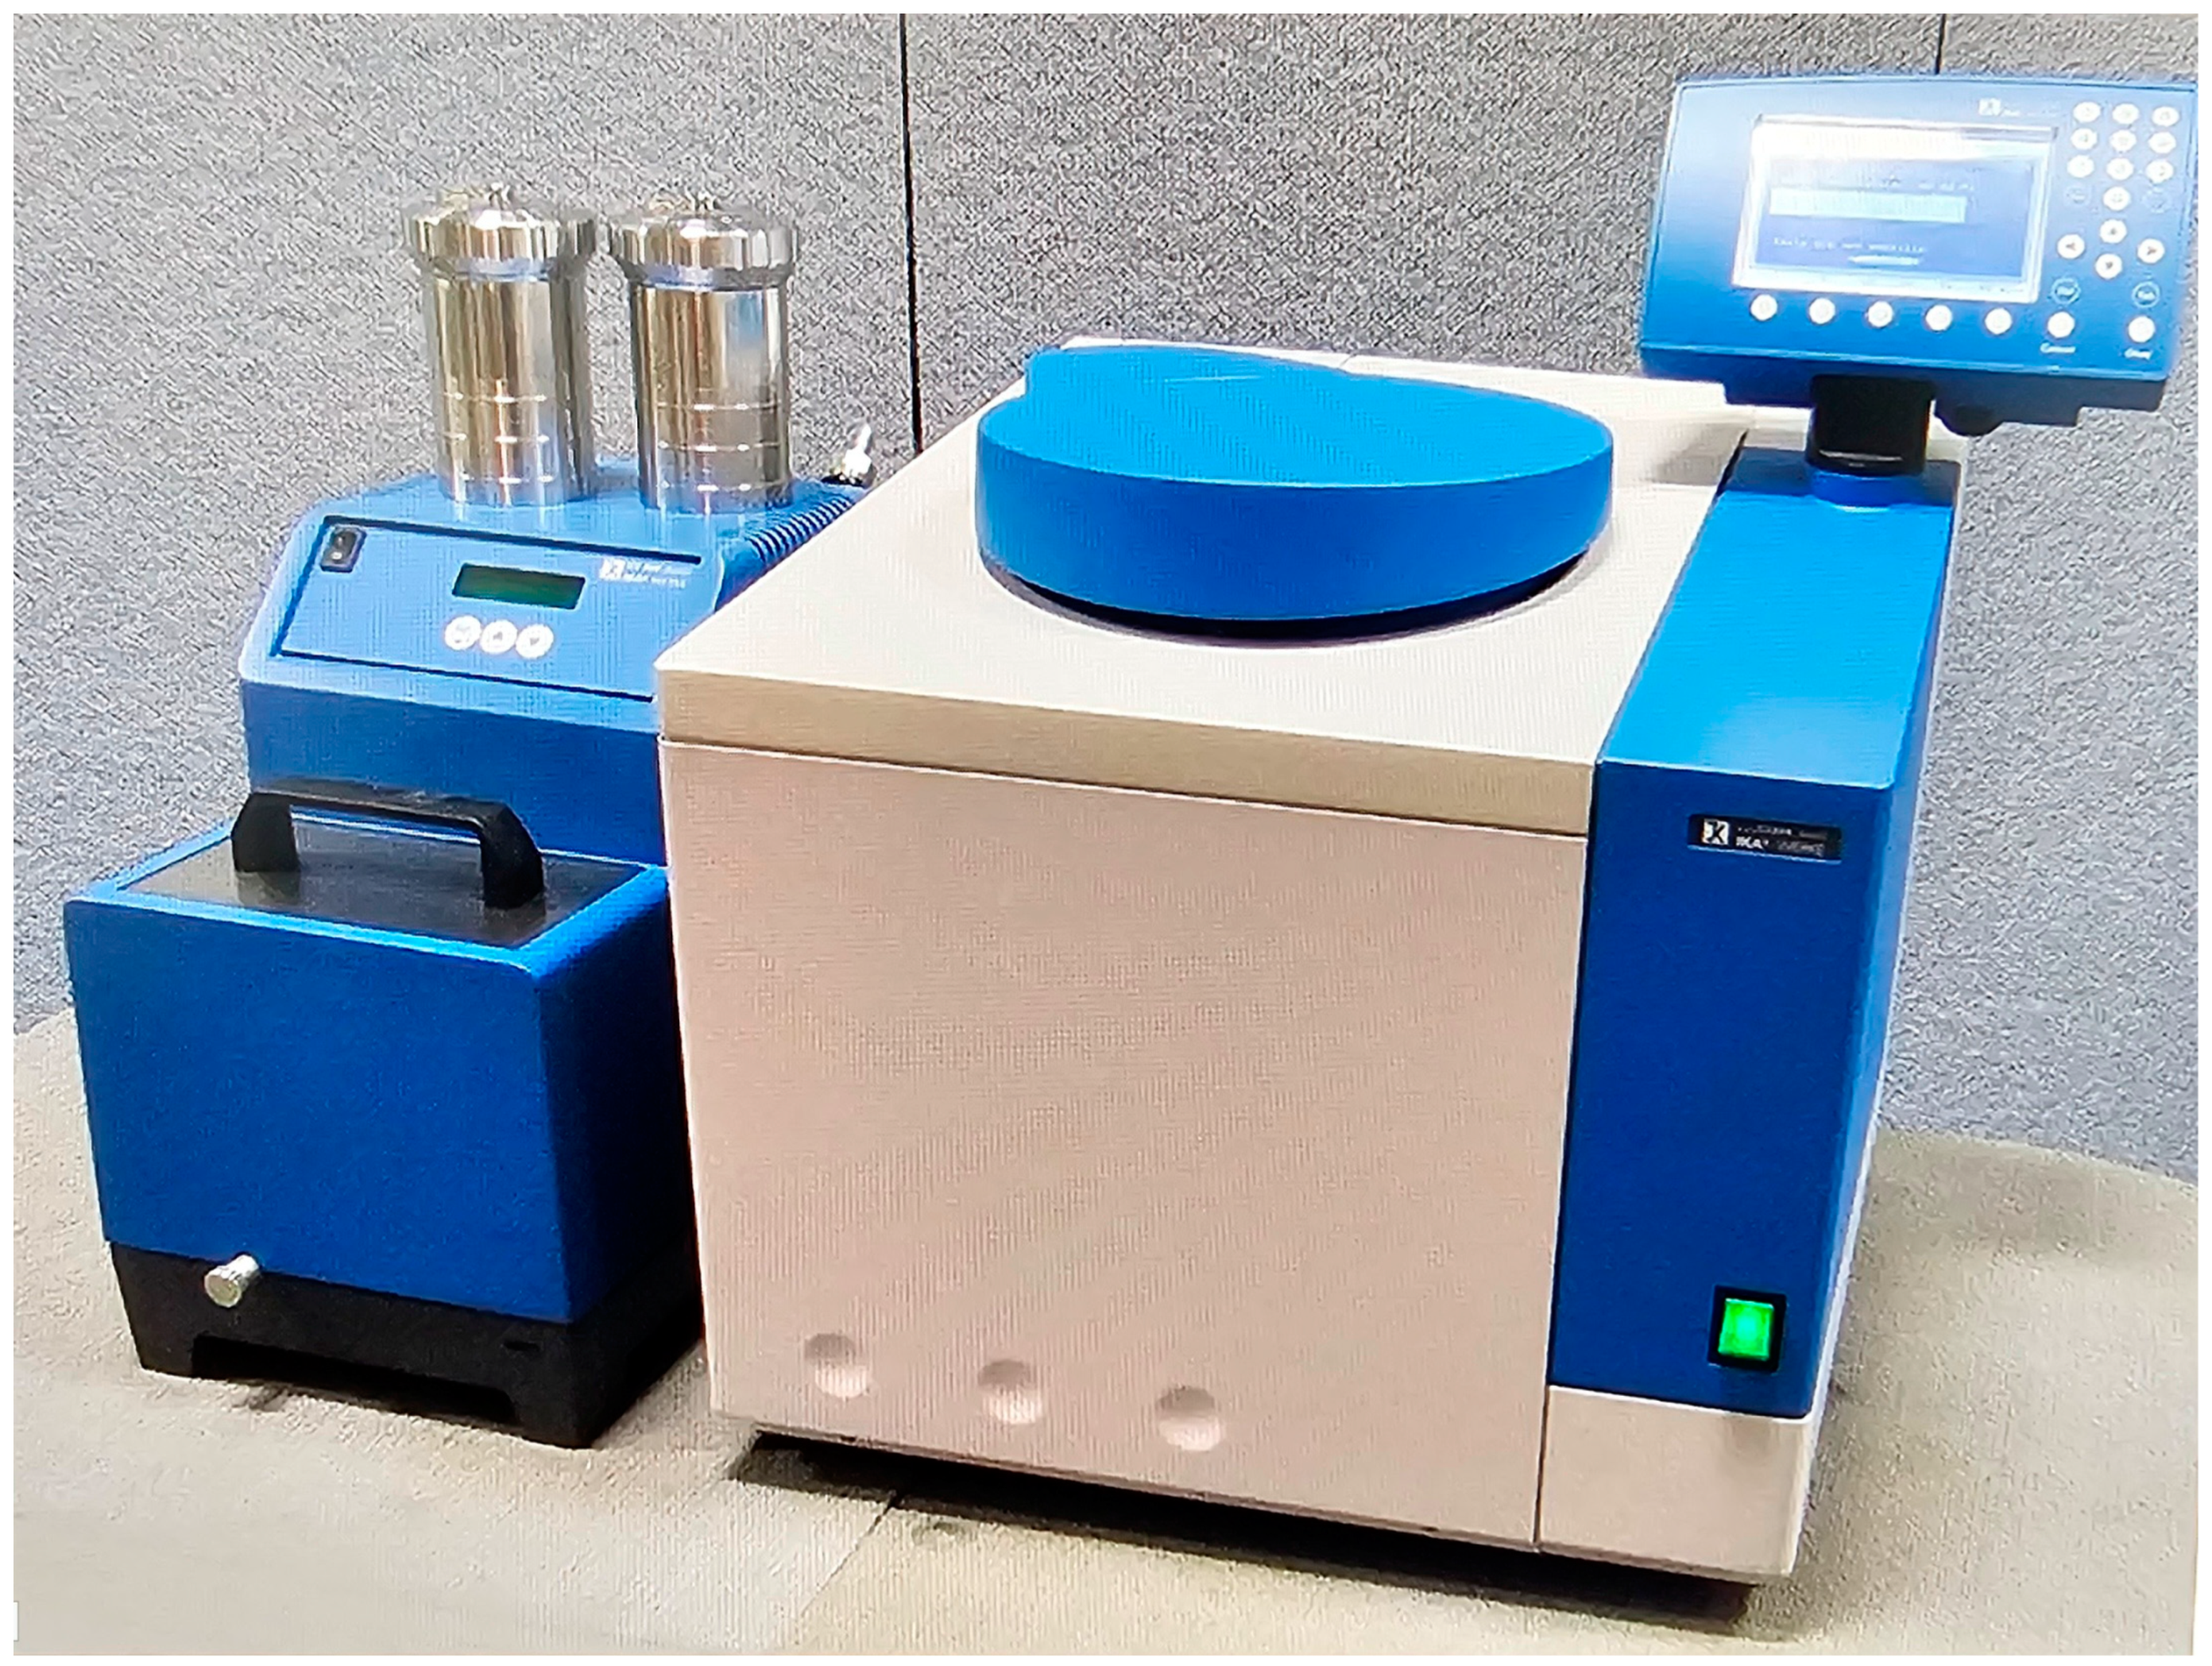
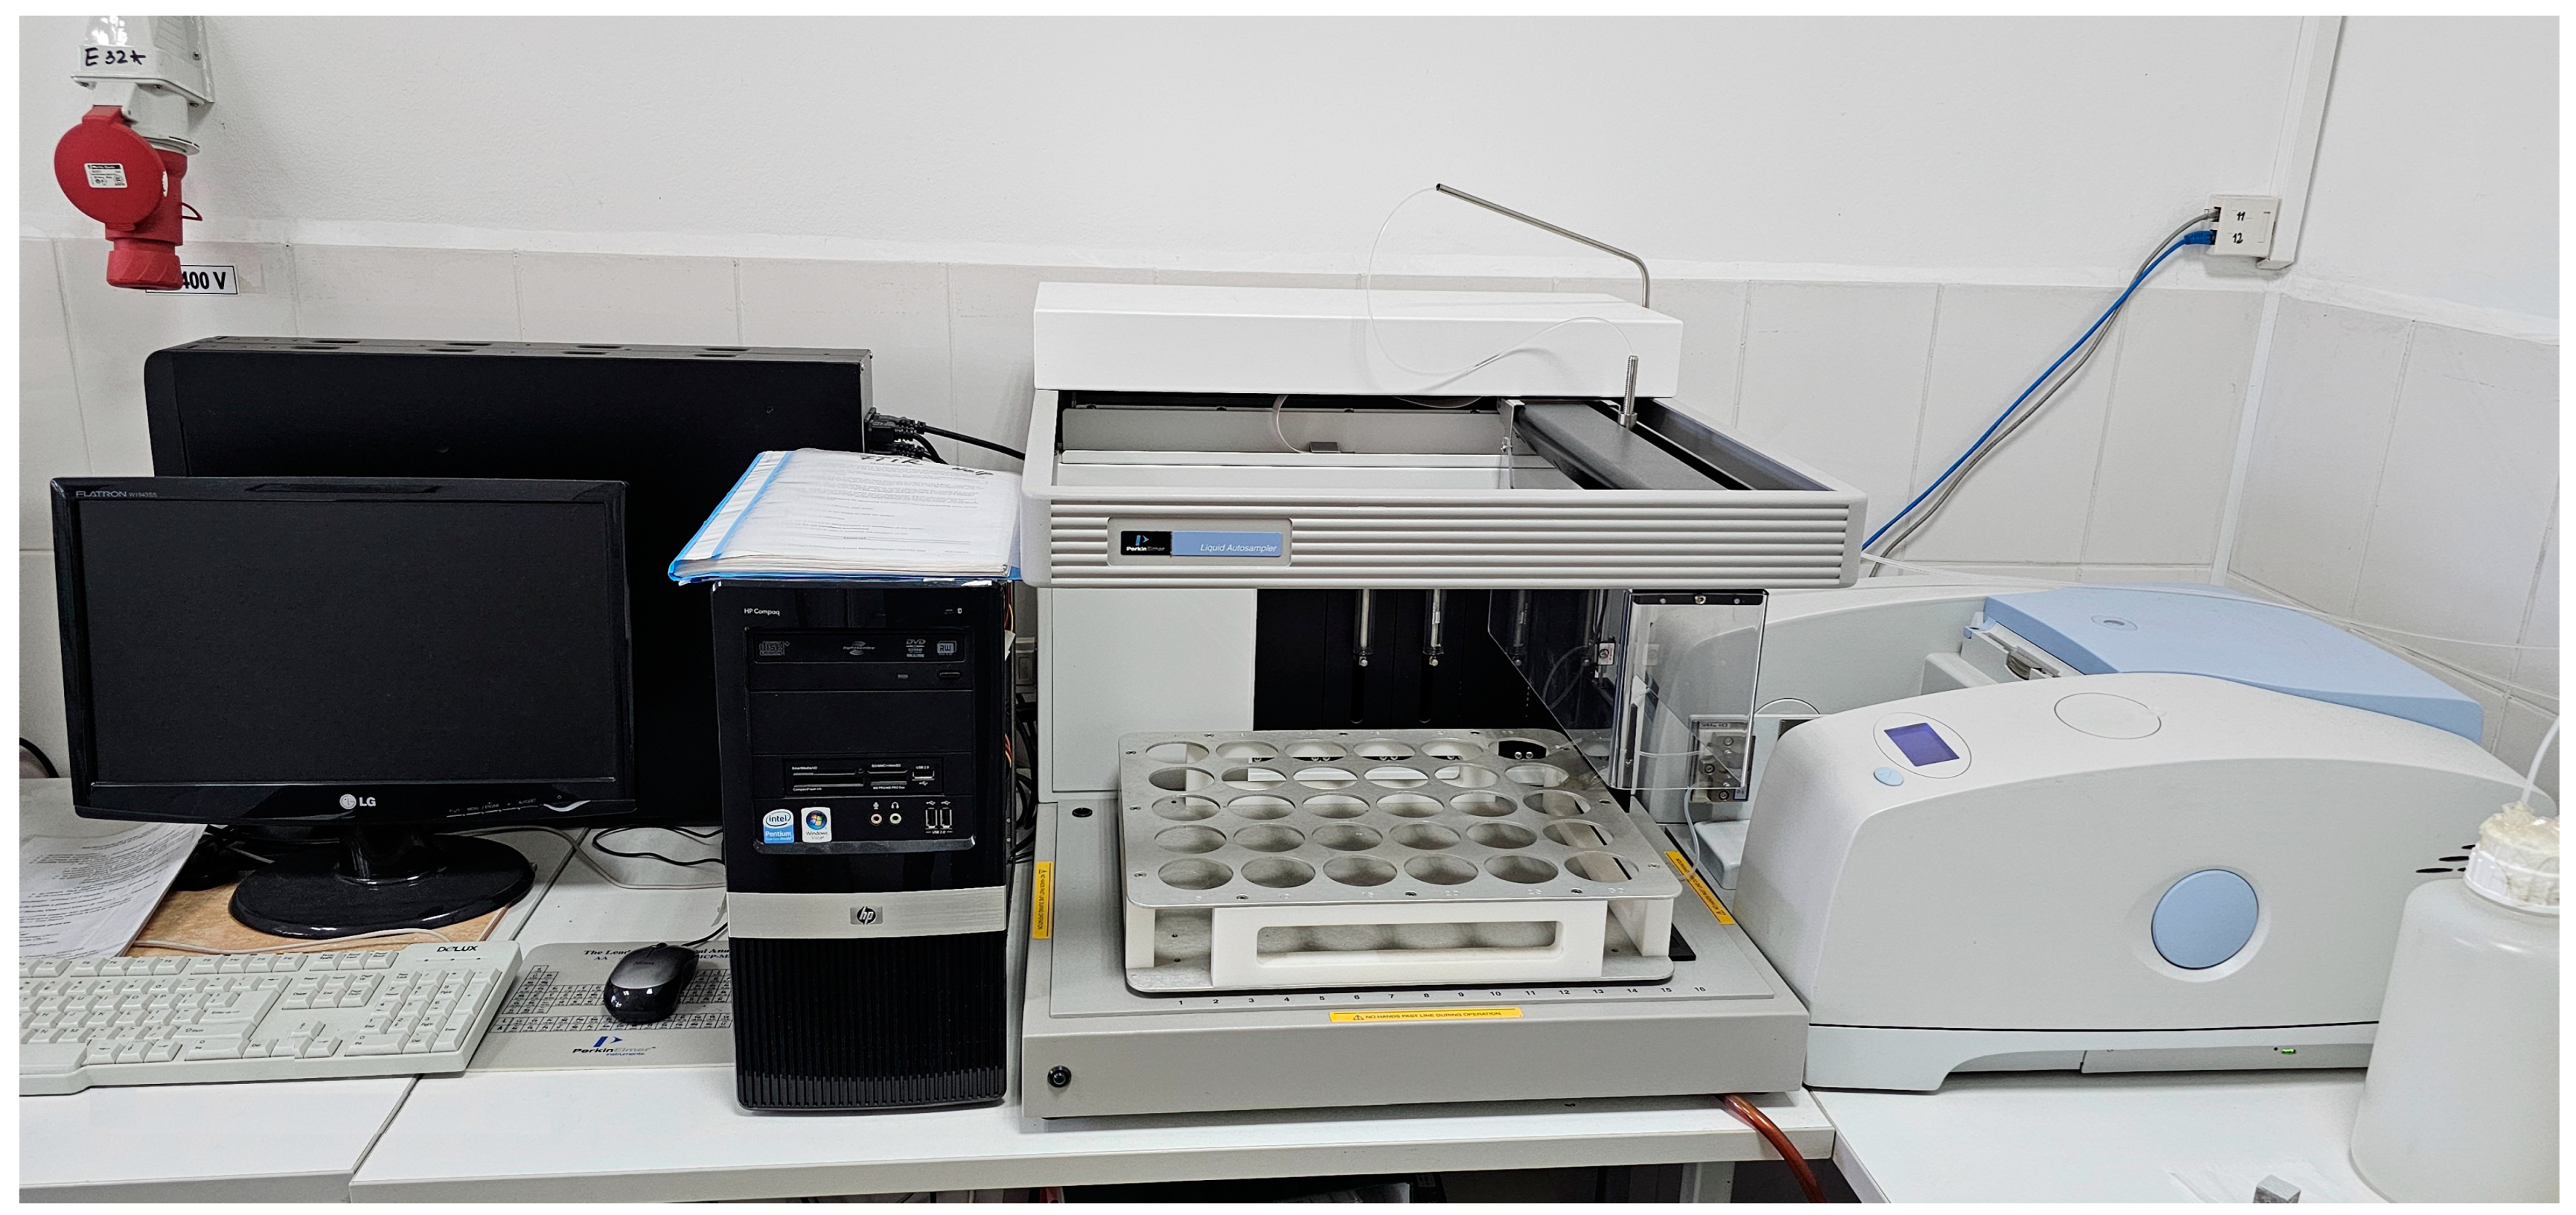
2.1. Blends Characterization

This chapter presents the equipment and the testing methods used to perform the determinations of the physical–chemical properties for the Jet-A fuel and biodiesel obtained from pork fat for all the fuel blends used for testing.
Density of the fuel blends determination
Densities of: Jet-A fuel, obtained from pork fat and all the tested fuel blends were measured as described in SR EN ISO 3675/2002 [38]. The testing equipment is comprised by glass cylinder with gradations and thermo dens-meters manufactured by Termodensirom SA, Bucharest, Romania and shown in Figure 1.
Flash Point measurements
Jet-A fuel, obtained from pork fat l and all the tested fuel blends, had its flash point (the lowest temperature of which the substances’ vapours ignite in the presence of a flame) measured as described in ASTM D92 [39]. Figure 2 is showing the Automatic flash point tester Cleveland, provided by Scavini, Italy used for this measurement.
Kinematic Viscosity measurements
The measurements were obtained at 40 °C, for the following liquids: Jet-A fuel, biodiesel obtained from pork fat, and all the tested blends. Cinematic viscosity was experimentally determined as described in SR EN ISO 3104/2002 [40]. The equipment is shown in Figure 3 is a Semi-automatic Viscometer and was provided by Scavini, Italy. It calculates the cinematic viscosity by multiplying the measured time (in seconds) with the capillary constant (which differs from one capillary to another), with the measurement unit as mm2/s (1 mm2/s = 1 cSt).
Low-Calorific Power Determination
Low-calorific power for the Jet-A fuel, obtained from pork fat, for all the tested fuel blends, was experimentally determined in accordance with ASTM D240-17 [41]. The IKA WERKE C 2000 Calorimeter was provided by Cole-Parmer, St. Netos, United Kingdom and the C 5012 calorimeter bomb produced by IKA Analisentechnik GmbH, Staufen, Germany), shown in Figure 4, was used to determine the low-calorific power.
FTIR Analysis (Fourier Transform Infrared Spectroscopy)
The FTIR for all samples was experimentally determined using a (FTIR) Spectrum Oil Express Series 100, v 3.0 spectrometer provided by Perkin Elmer—Romanian representative, Tancabesti, Romania (Figure 5) and with dedicated software for all the fuel blends.
Elemental analysis
An elemental analysis for the Jet-A fuel, obtained from pork fat, with all the tested fuel blends was carried out in order to assess the main elements of the fuels (C, N, H, and O).
The percentage of carbon, hydrogen, and nitrogen with oxygen content for the above-mentioned fuels was determined as described in ASTM D 5291–16 [42].

2.2. Theoretical Calculation of the Combustion Process

After the elemental composition of the fuel blends was determined, their corresponding minimum air quantities required for stoichiometric combustion were calculated. The accurate calculation of the resulting CO2 and water emissions allows a complete assessment of gaseous pollutant production during combustion. It was thus determined that the examined fuel blends generate lower levels of gaseous pollutants compared to conventional combustion processes.
In order to understand the stoichiometric combustion characteristics of various fuel blends, knowledge of their elemental composition is essential. This study considers hydrocarbons with the general formula CcHhOoNn [28], with specific fractions of gC, gH, gO, and gN elucidated in Table 1.
The calculation of the needed oxygen quantity for stoichiometric combustion is crucial in providing insights into the combustion process and facilitating a comprehensive understanding of the chemical reactions involved and can be calculated by using Equation (1).
M o = 32 12 g C + 32 4 g H 32 32 g O = 2.667 g C + 8 g H g O
M a i r = 4.35 M o
CO2 and H2O from the combustion process can be calculated by using the following:
C O 2 = 44 g C 12
H 2 O = 9 g H

2.3. Engine Experimental Procedure

The experiments were performed on a Jet CAT P80® turbo-engine [43], as shown in Figure 6.
The investigated fuel blends consist of kerosene with varying percentages of biodiesel 10% (BP), 20% (BP), and 30% (BP) and with 5% of Aeroshell 500 oil added to each blend for engine lubrication due to the fact that such a small engine does not have its own lubrication system. The tests were conducted under three distinct operating regimes: idle (18.7% throttle gas), cruise (30% throttle gas), and maximum (94% throttle gas for safety functioning). Each regime was subjected to a testing period of approximately 2 min, during which engine parameters were closely monitored. The measured parameters included temperature (Tcomp) after the compressor, temperature (Tcomb) before the turbine, fuel flow Qf, air flow, pressure in the combustion chamber, and thrust (F). The turbocharged engine maintained a constant shaft speed throughout the experiments, unaffected by the different fuel blends. However, to sustain this constant shaft speed, the fuel blends were introduced into the combustion chamber in varying proportions. Despite the variations in fuel blends, the compressor operated at a consistent speed, resulting in uniform pressure after the compressor and consistent air flow. Comparative assessments were made for parameters such as consumed fuel flow (Qf), temperature in front of the turbine (Tcomb), and thrust (F) under conditions of constant shaft speed.

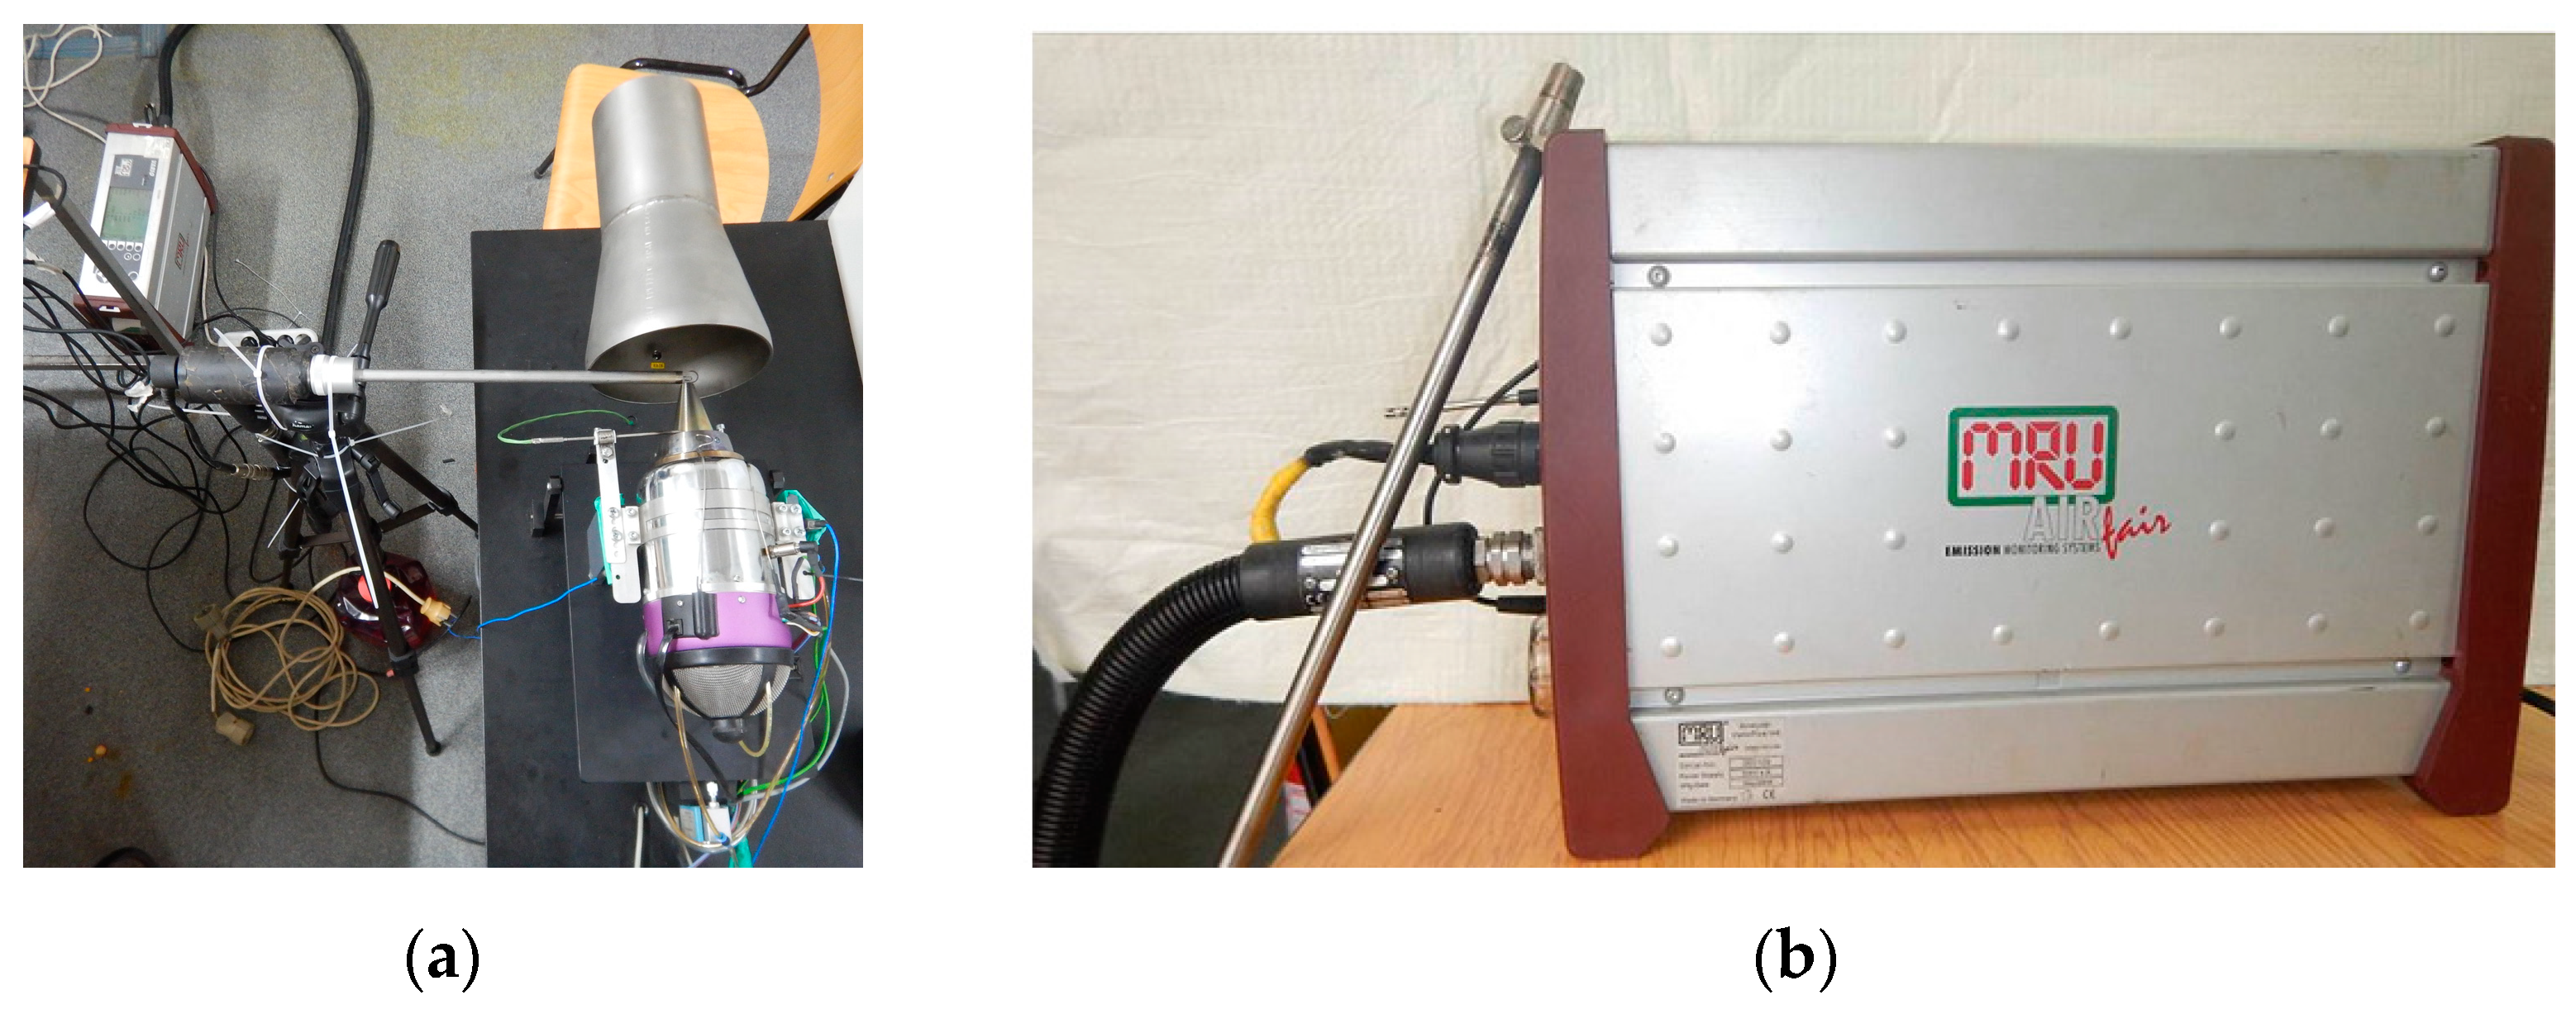
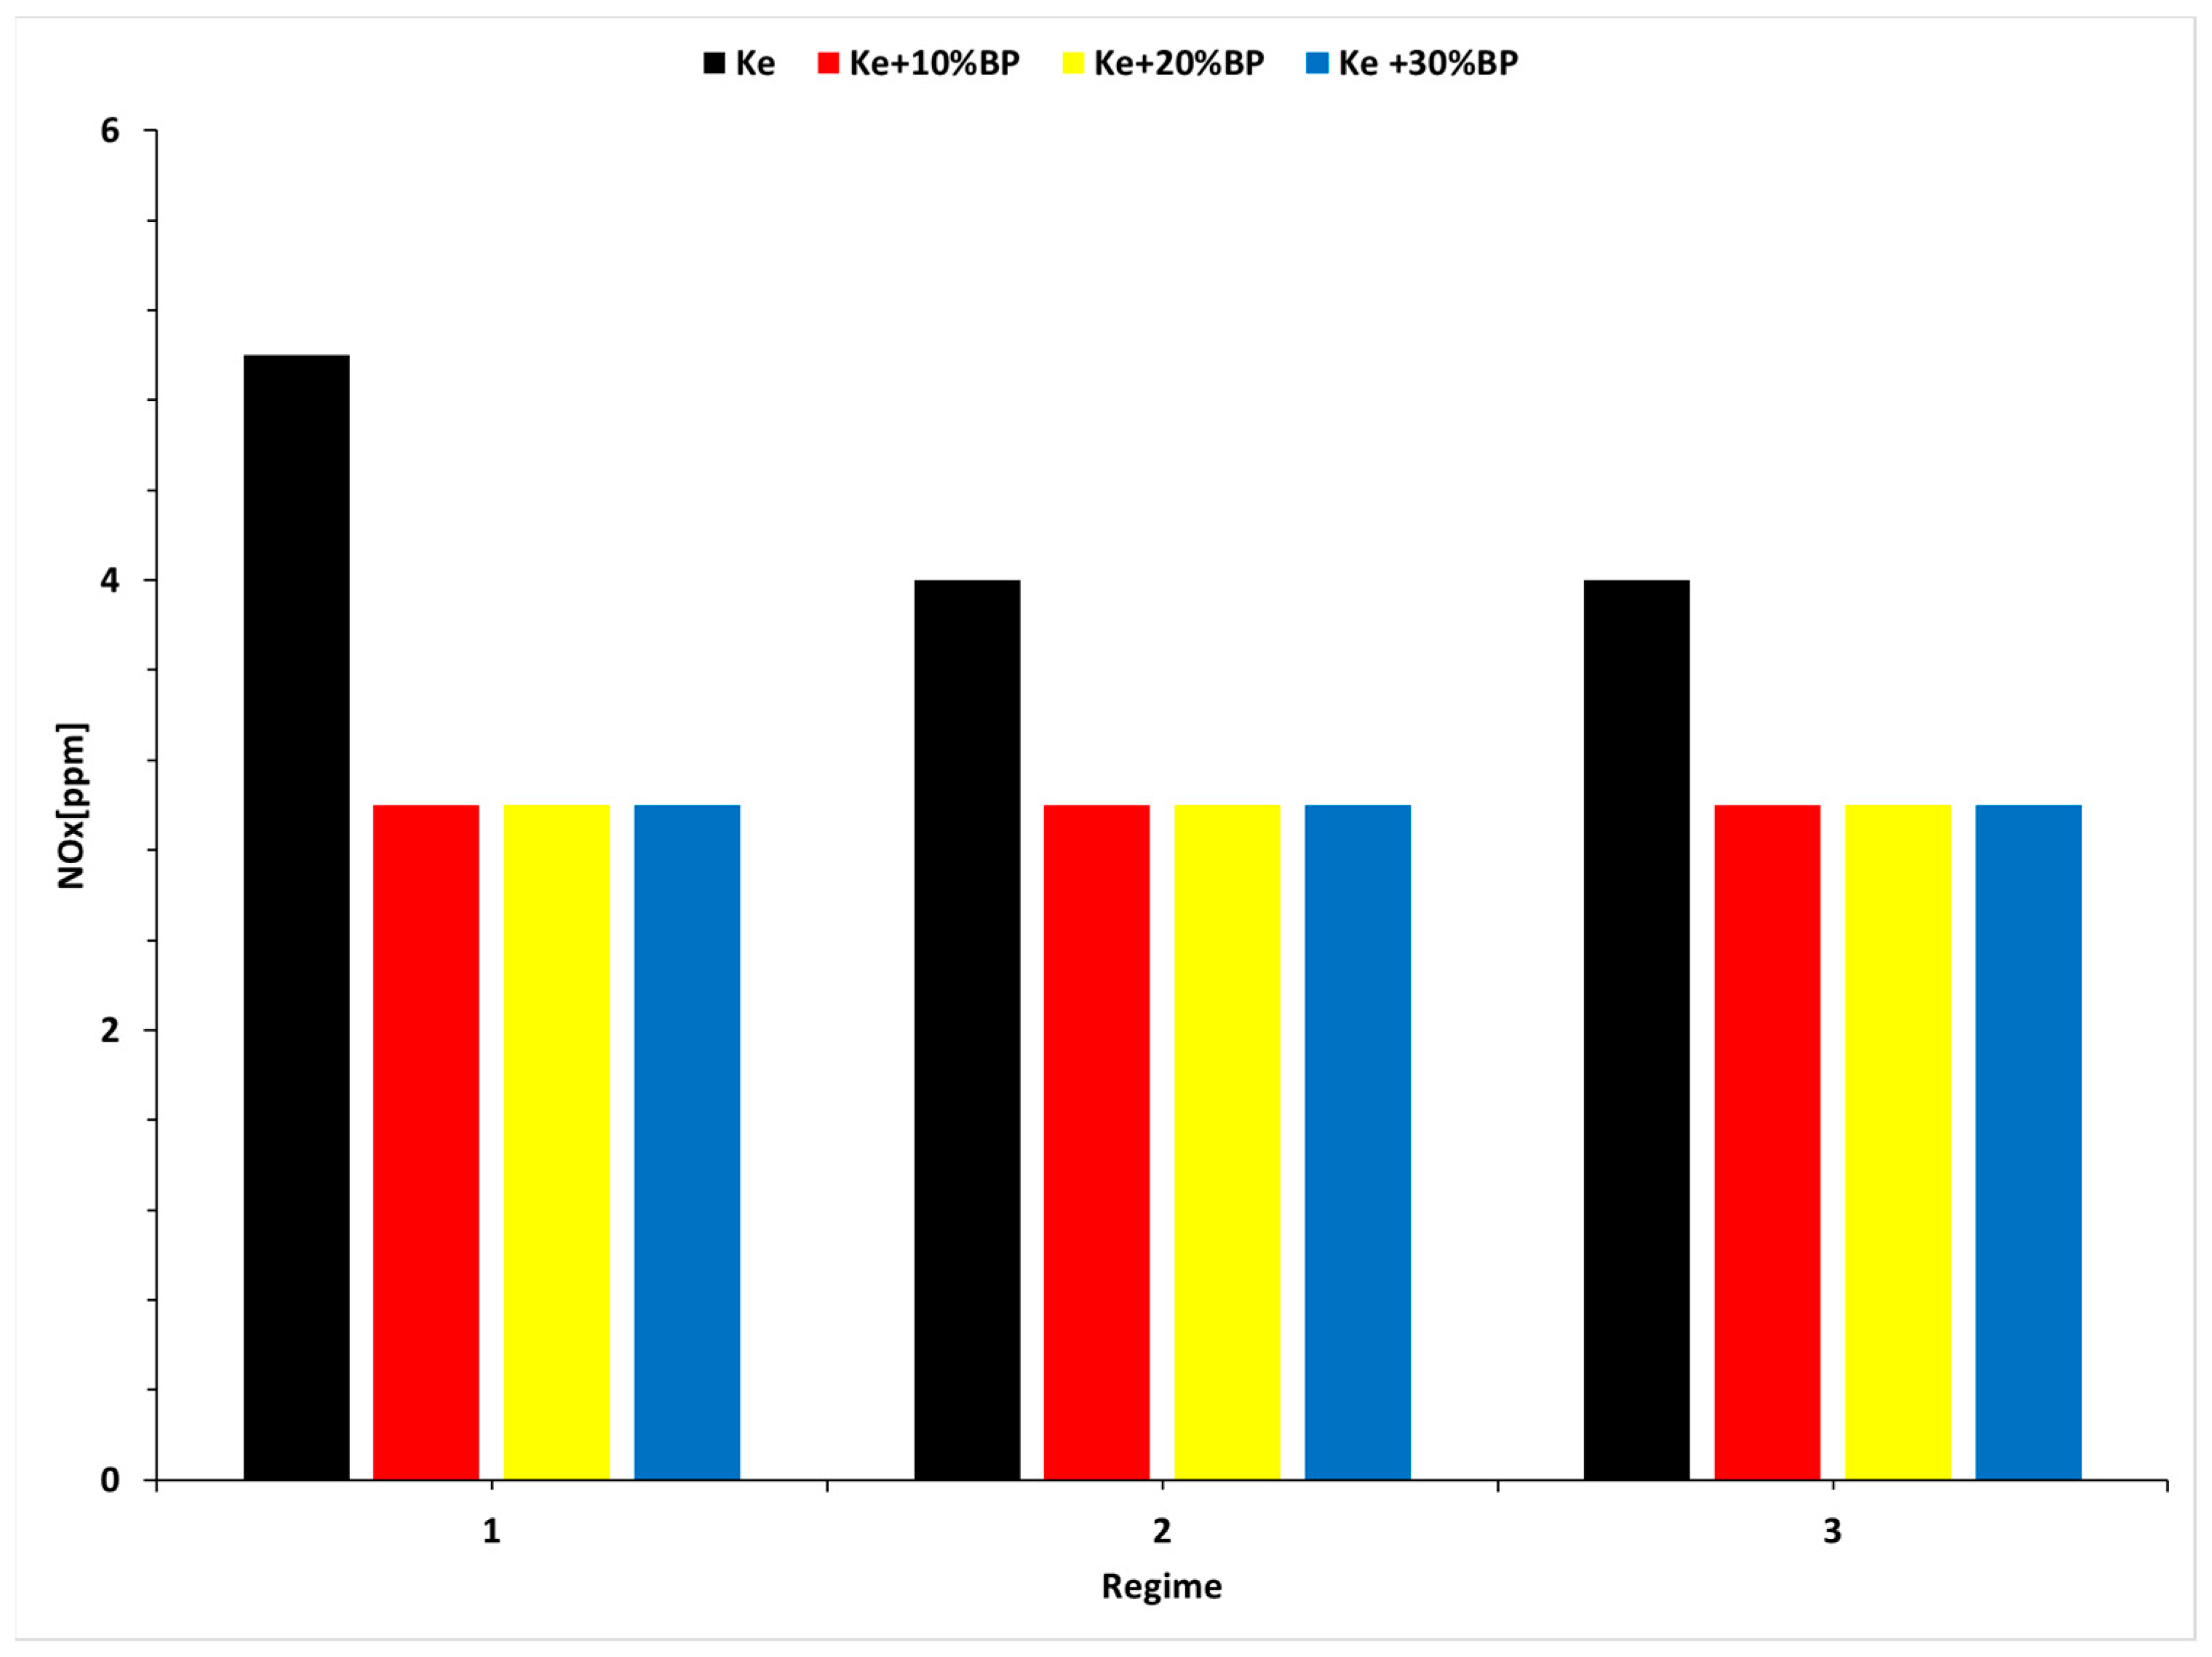
2.4. Gaseous Emissions Measurements

The gaseous emission measurements were made by using the MRU Vario Plus analyzer, which is presented in Figure 7. Simultaneously, measurements of gas components (e.g., O2, CO, NO, NO2, NOx, SO2, and CH4) are carried out.

3. Results and Discussion

3.1. Physical–Chemical Properties for Fuel Blends Experimental Results

Table 1 shows the obtained results for the physical–chemical determinations.
It should be mentioned that low-calorific power and elemental analysis were determined only for Jet-A fuel, while for the tested fuel blends, they were computed according to reference [44].
A detailed analysis of the data presented in Table 1 leads to several noteworthy conclusions:
  • Flash point, kinematic viscosity, and density exhibit an increasing trend with the rise in biodiesel concentration. This correlation suggests a notable impact of biodiesel content on these physical properties.
  • A decrease in low-calorific power is observed with an increasing biodiesel concentration, indicating an undesirable property. This observation prompts further investigation into the implications for combustion efficiency which may result in a much larger amount of fuel to be required than in the case of a Jet-A fuel.
  • Elemental analysis reveals that as biodiesel concentration increases, carbon and hydrogen content decrease, while oxygen content increases. This suggests a potential decrease in resulting CO2 concentration during the combustion process, attributed to a reduced need for oxygen.
  • Analysis across all the studied fuel blends indicates consistent trends. The kinematic viscosity at 40 °C, flash point, and low-calorific power exhibit a proportional increase with the increase in biodiesel percentage. This uniformity emphasizes the predictable influence of biodiesel concentration on these properties.
  • Elemental analysis further establishes that the rise in biodiesel percentage corresponds to an increase in oxygen content and a decrease in carbon content. These findings contribute to a comprehensive understanding of the elemental composition changes induced by varying alcohol concentrations in fuel blends.
FTIR spectroscopy is a very useful tool in assessing the chemical modifications within a substance. By adding biodiesel within regular aviation fuel its chemical composition modifies. Figure 3 shows the FTIR spectra for Kerosene, Ke + 10% B, Ke + 20% Bl, Ke + 30% B and 100% B.
When the FTIR spectra are compared, variations appear at 1745.83 cm−1 (C=O stretching), 1030.98 cm−1, 1117.54 cm−1, and 1170.23 cm−1 (C–O alkoxyl stretching), but their intensity varies according to the concentration of biodiesel, as shown in Figure 8. These peaks increase as the biodiesel concentration increases. Fatty acid methyl esters (FAME) are an indication of the amount of the biodiesel present in each of the blends since FAME appear at 1745.83 cm−1 and 1170.23–1030.98 cm−1. Methyl esters also show their absorptions characteristics (A = absorbance) in the peak around 1820–1680 cm−1.

3.2. Combustion Reaction Analysis

Based on Equations (1)–(4), the results are presented in Table 2: Mo being the quantity of oxygen, Mair the quantity of air, CO2 the quantity of carbon dioxide, and H2O the quantity of water resulting from the stoichiometric reaction per kilogram of fuel.
An inverse relationship is noted between the required air quantity and biodiesel concentration. This phenomenon is attributed to an increase in oxygen content accompanying higher biodiesel concentrations. Additionally, a proportional decrease in CO2 concentration is observed with increasing biodiesel concentration. These findings underscore the intricate interplay between biodiesel content, oxygen levels, and resultant carbon dioxide concentrations in the stoichiometric combustion process.

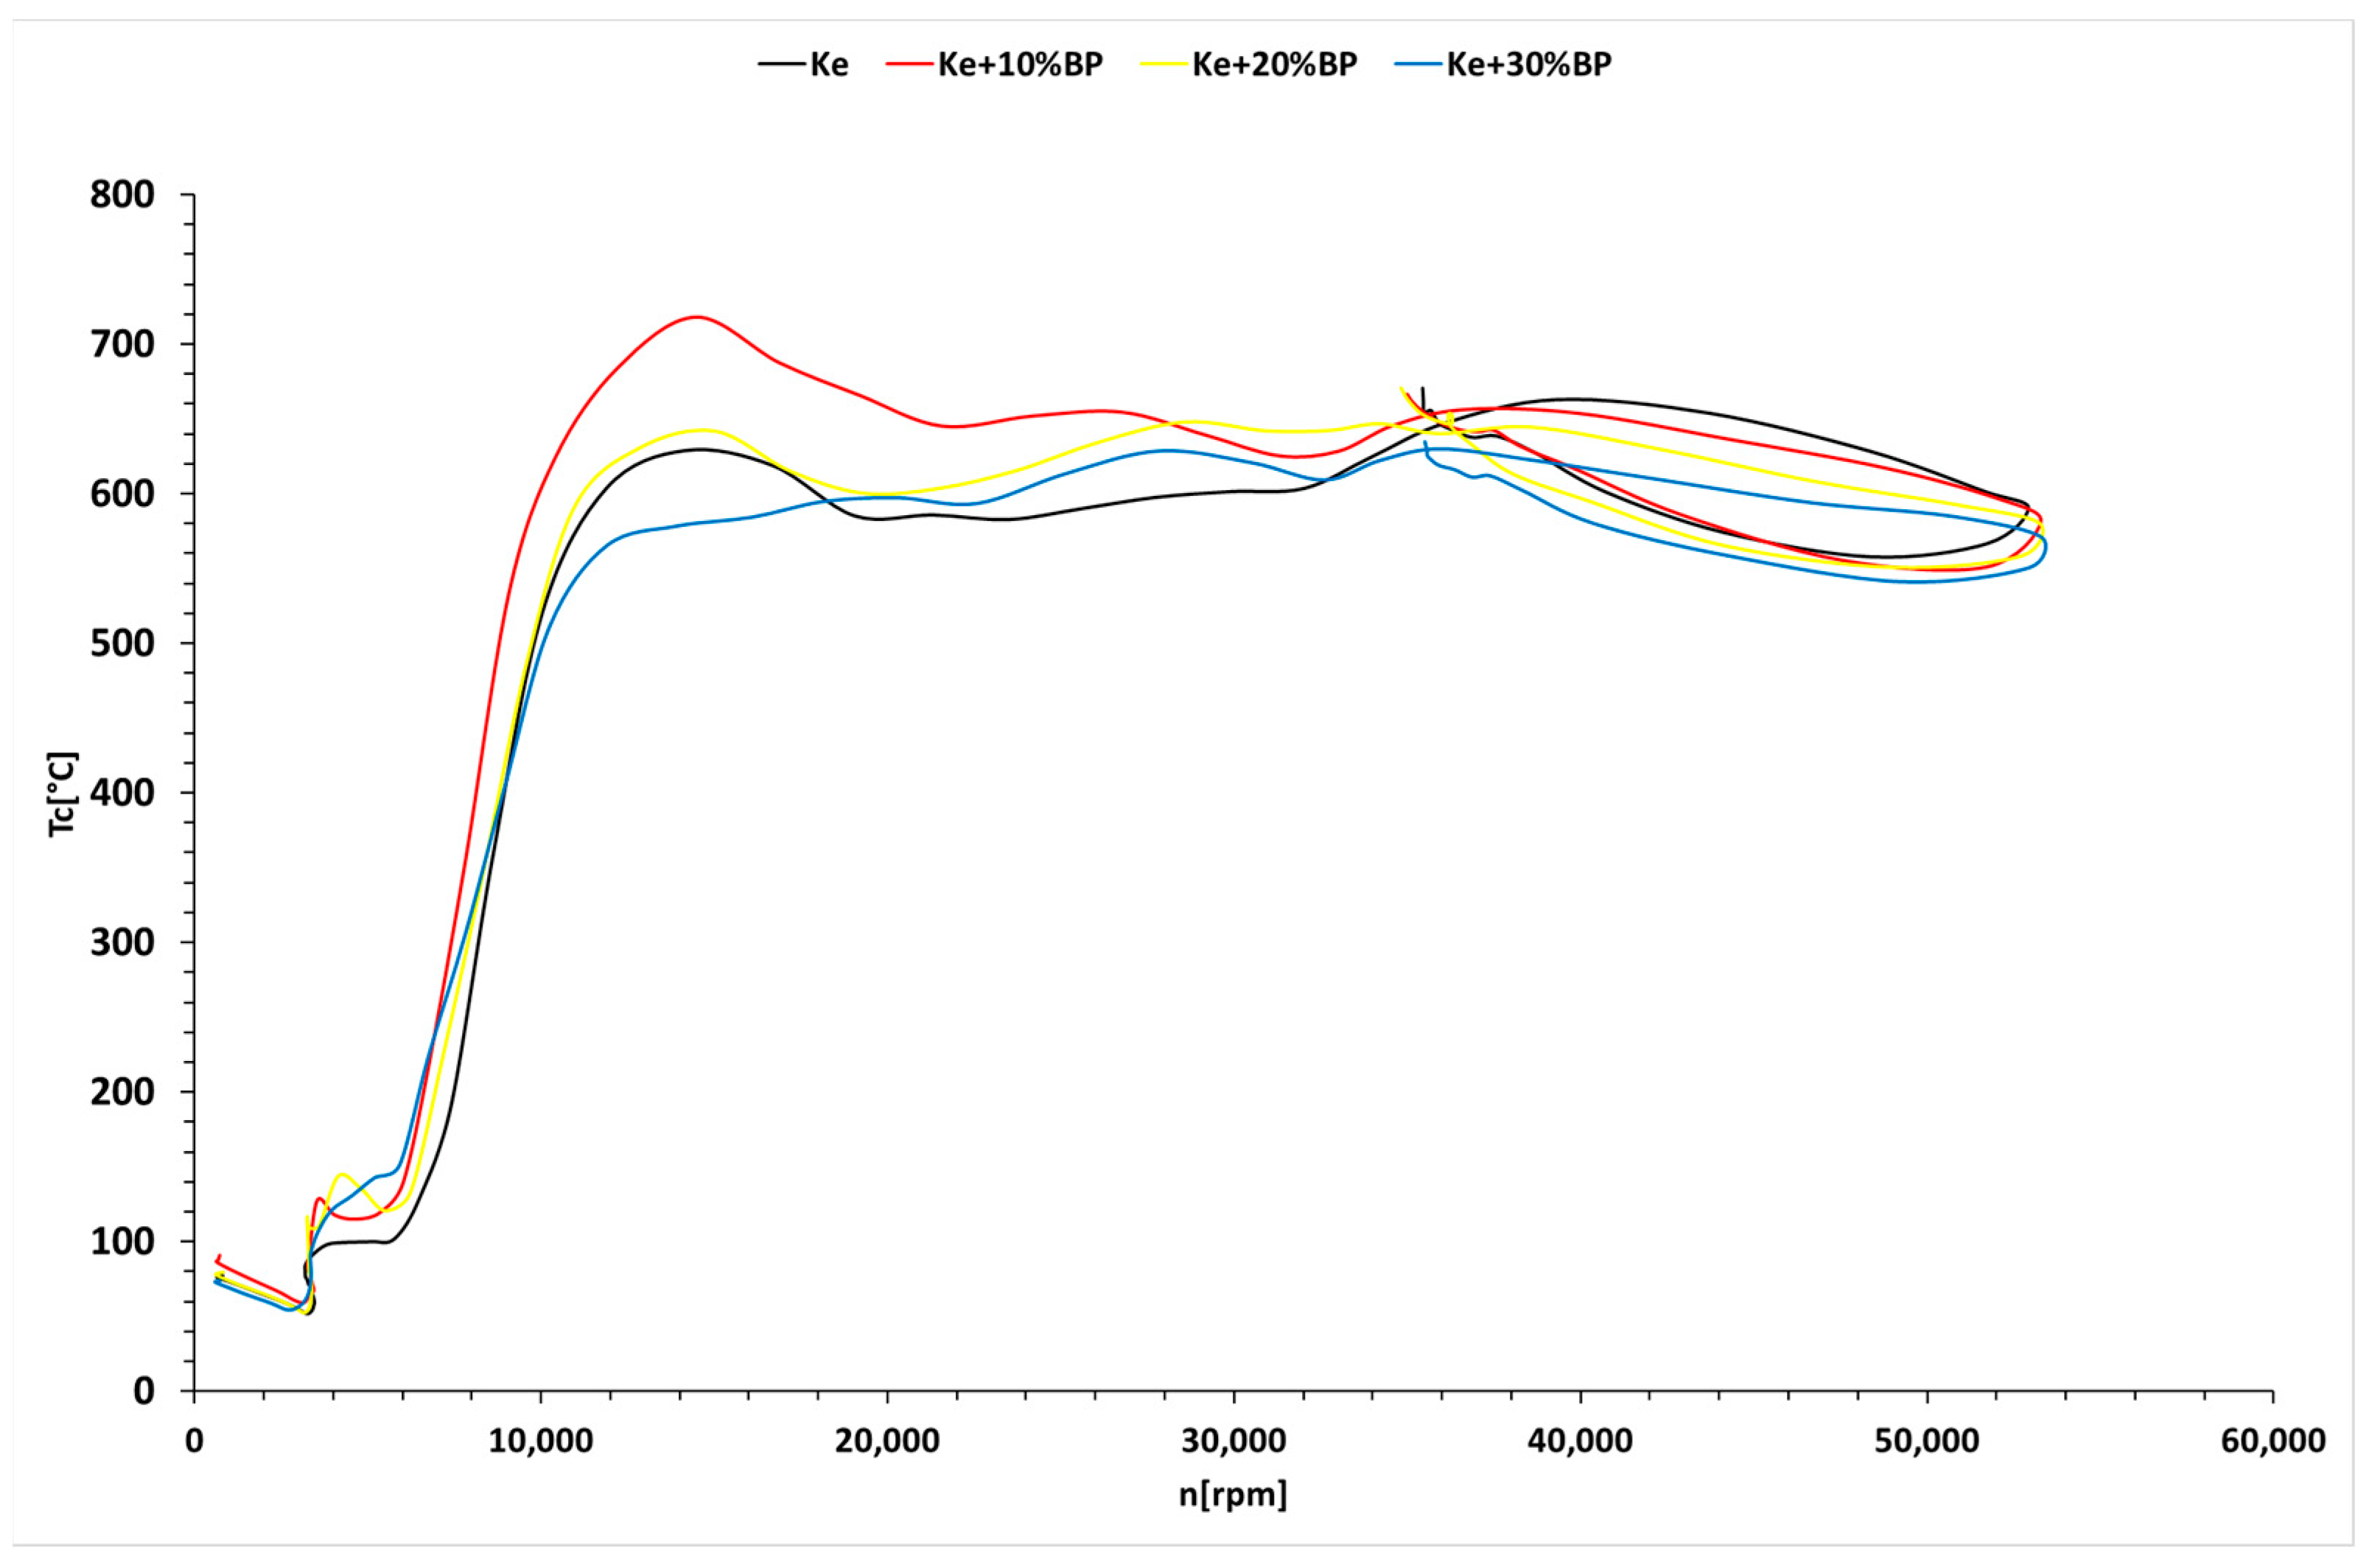
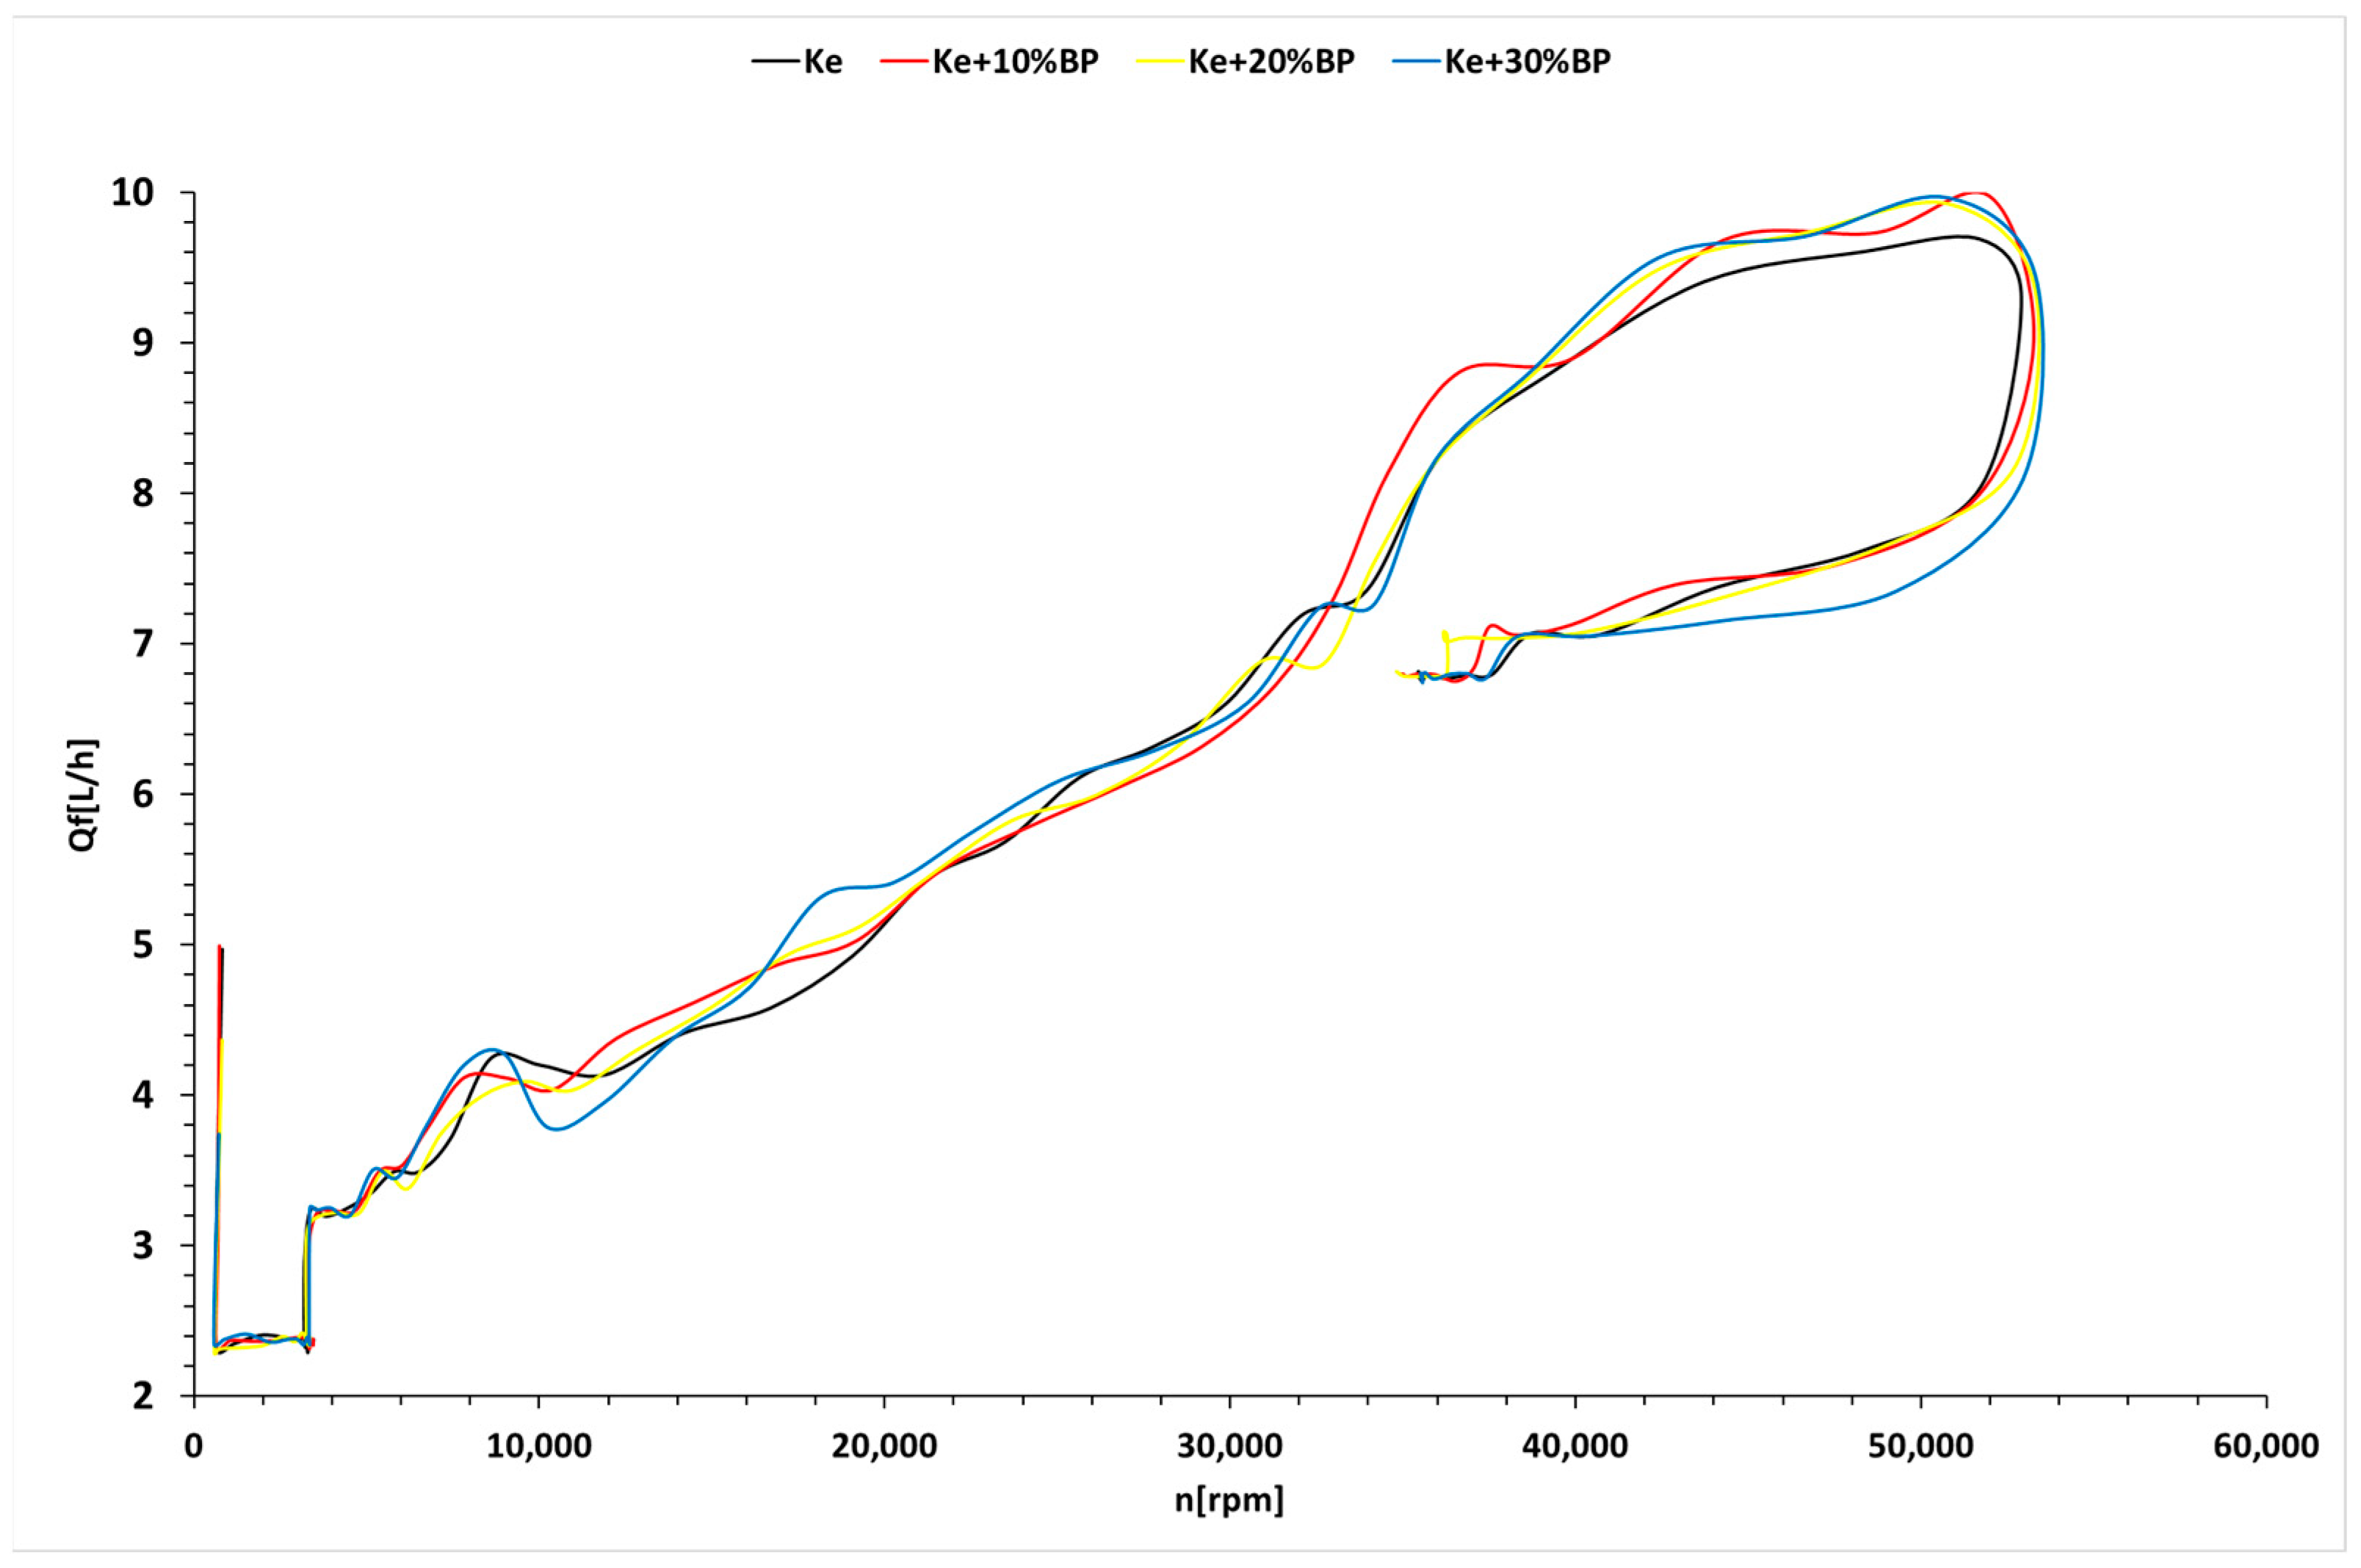
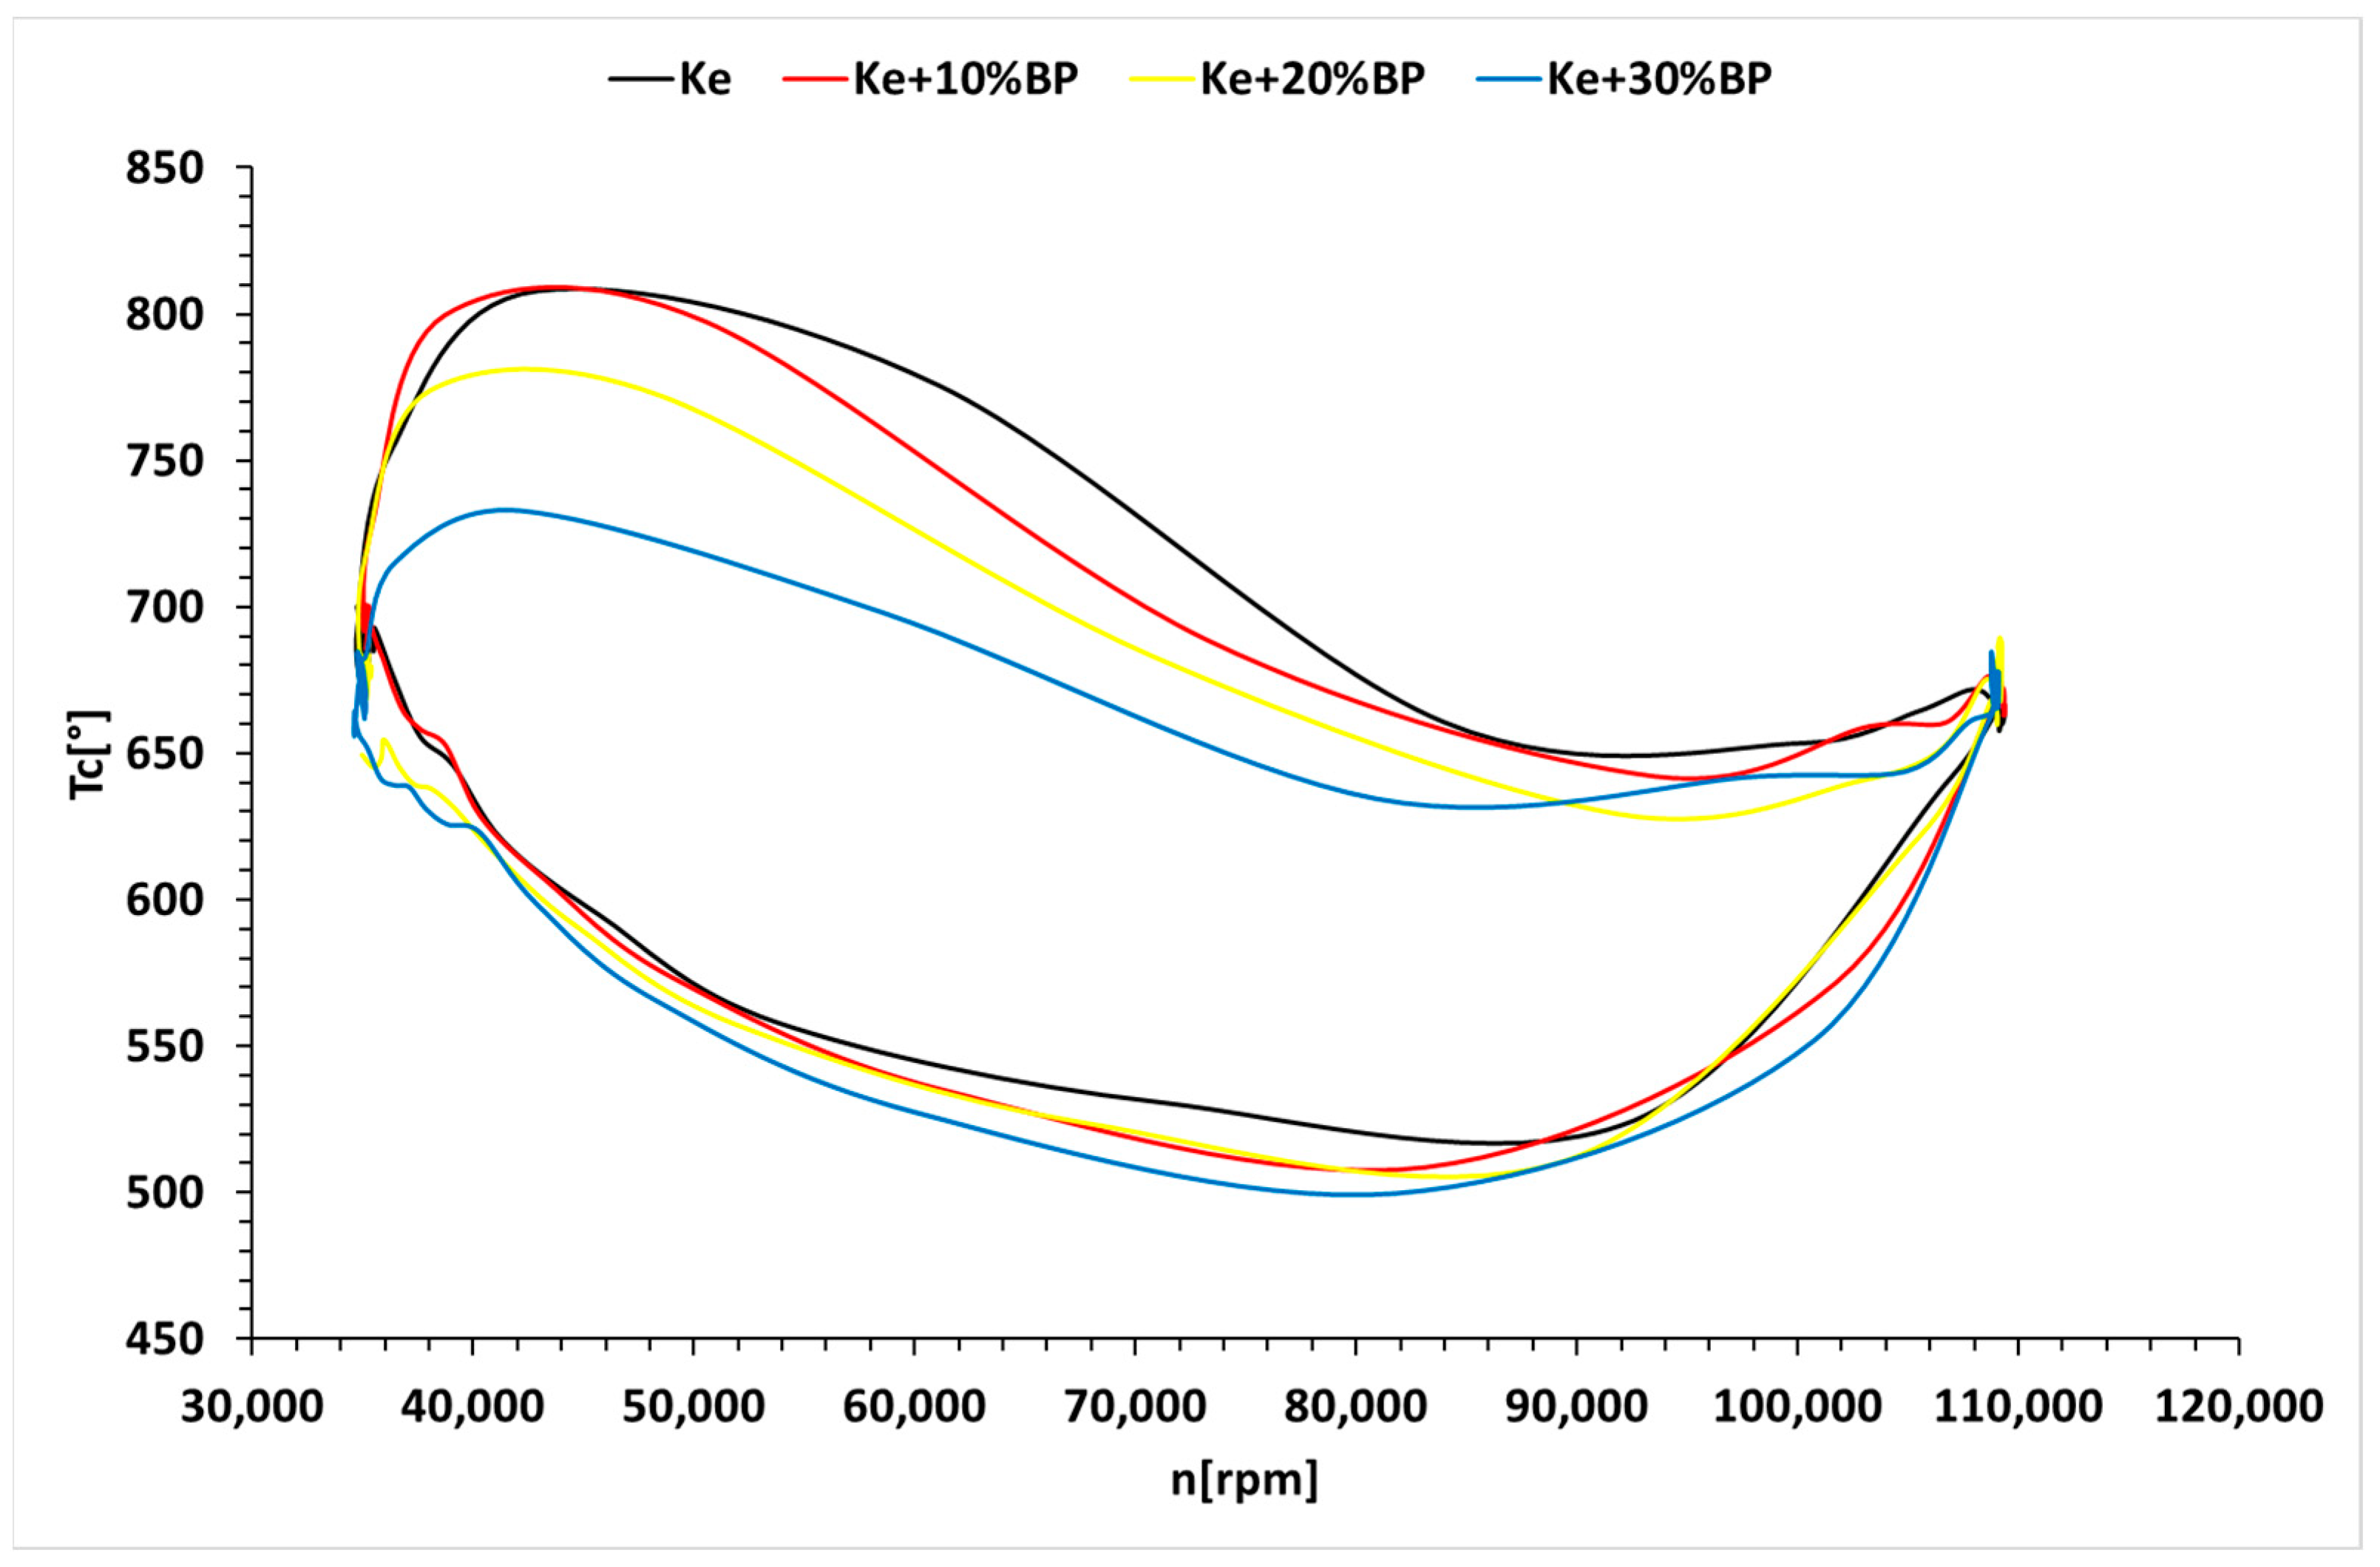
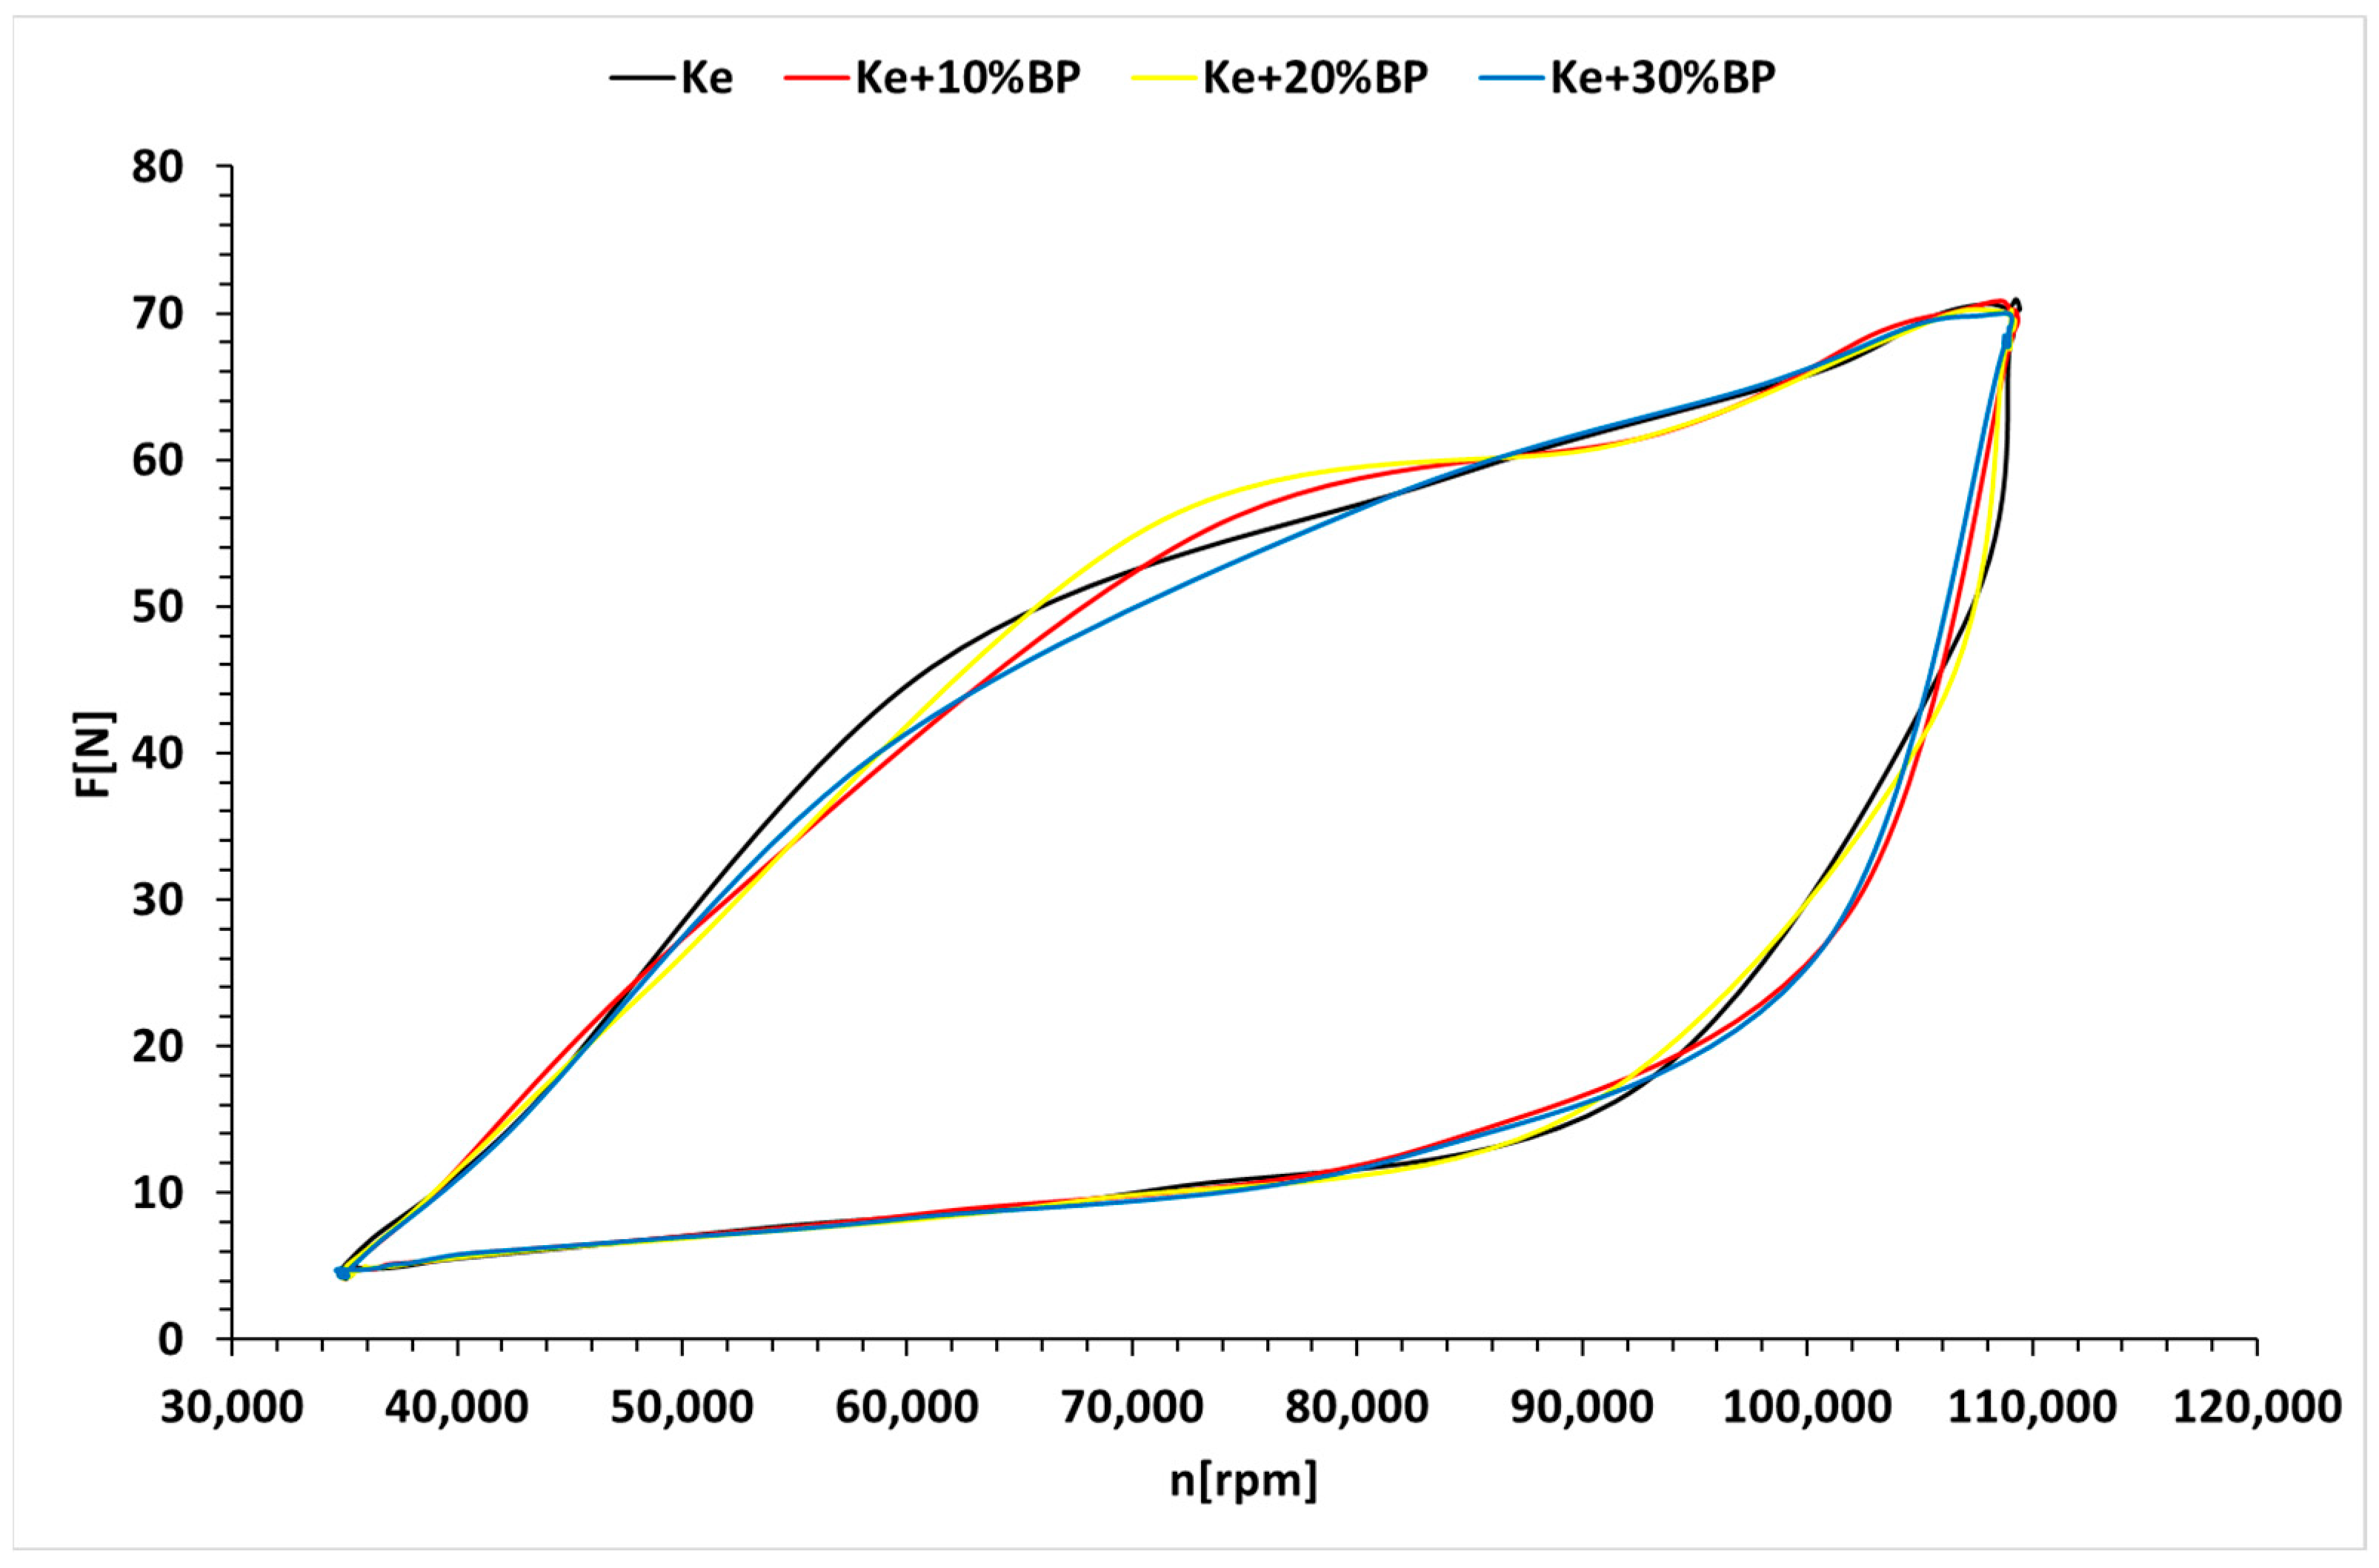
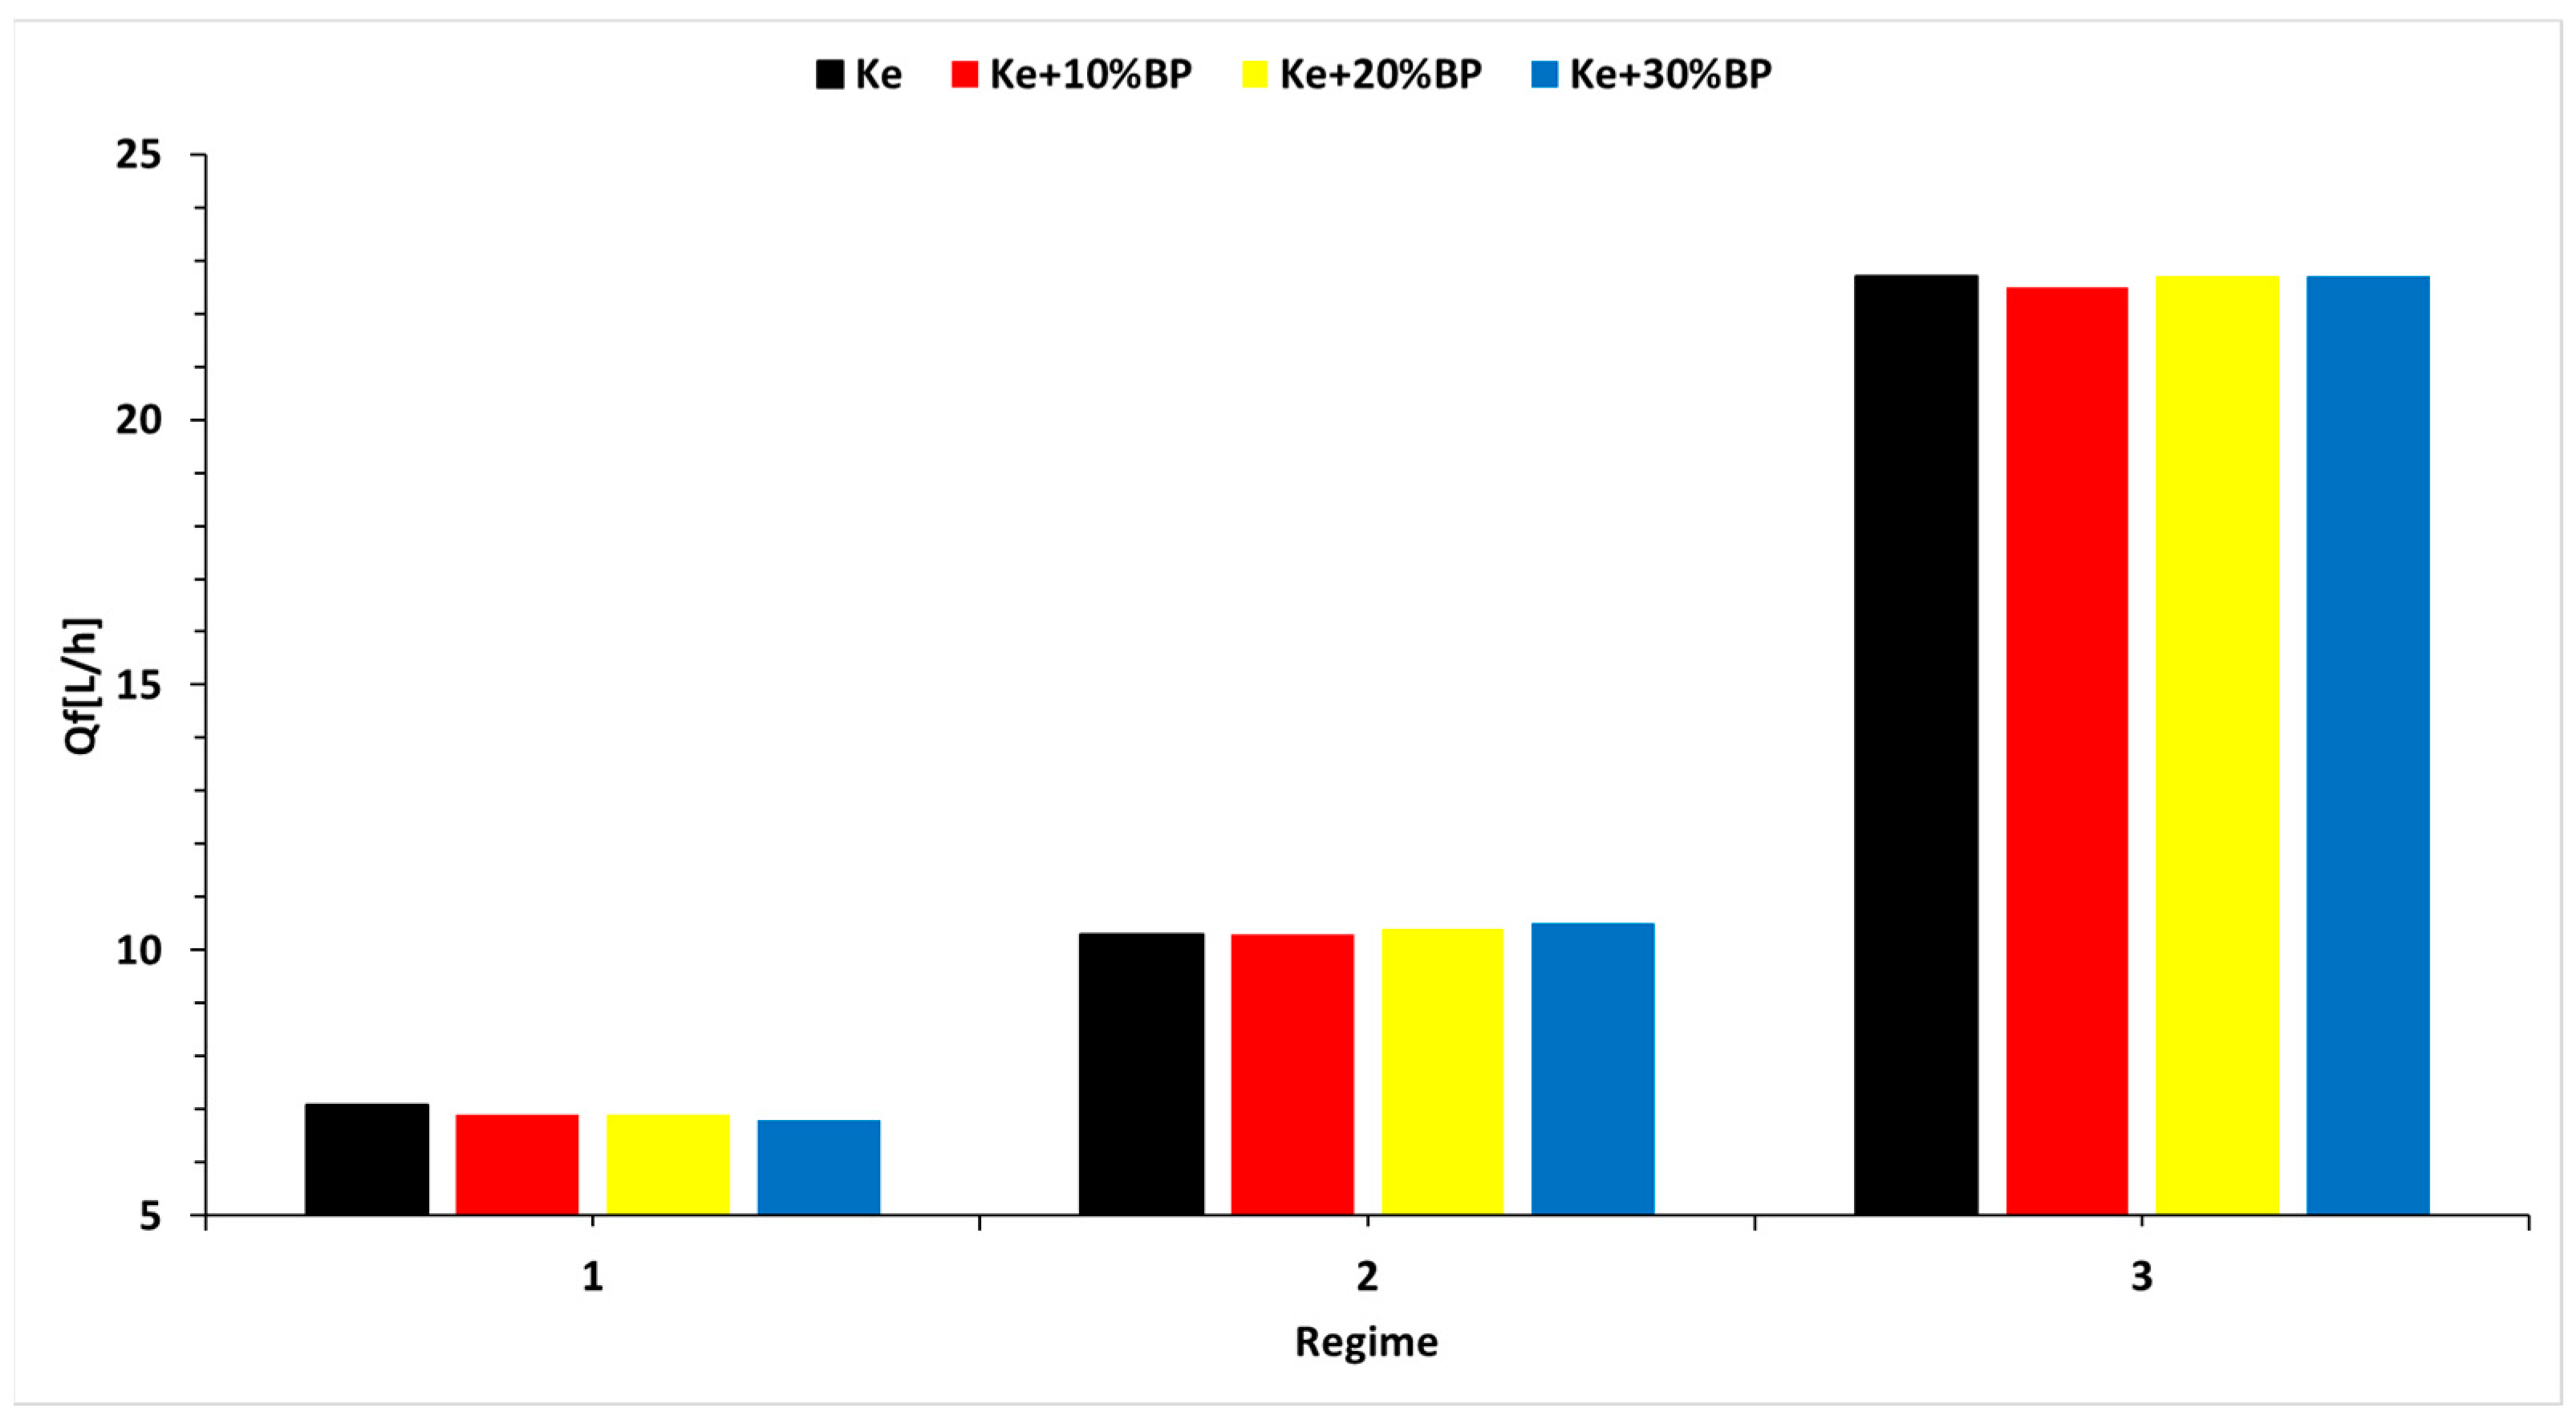
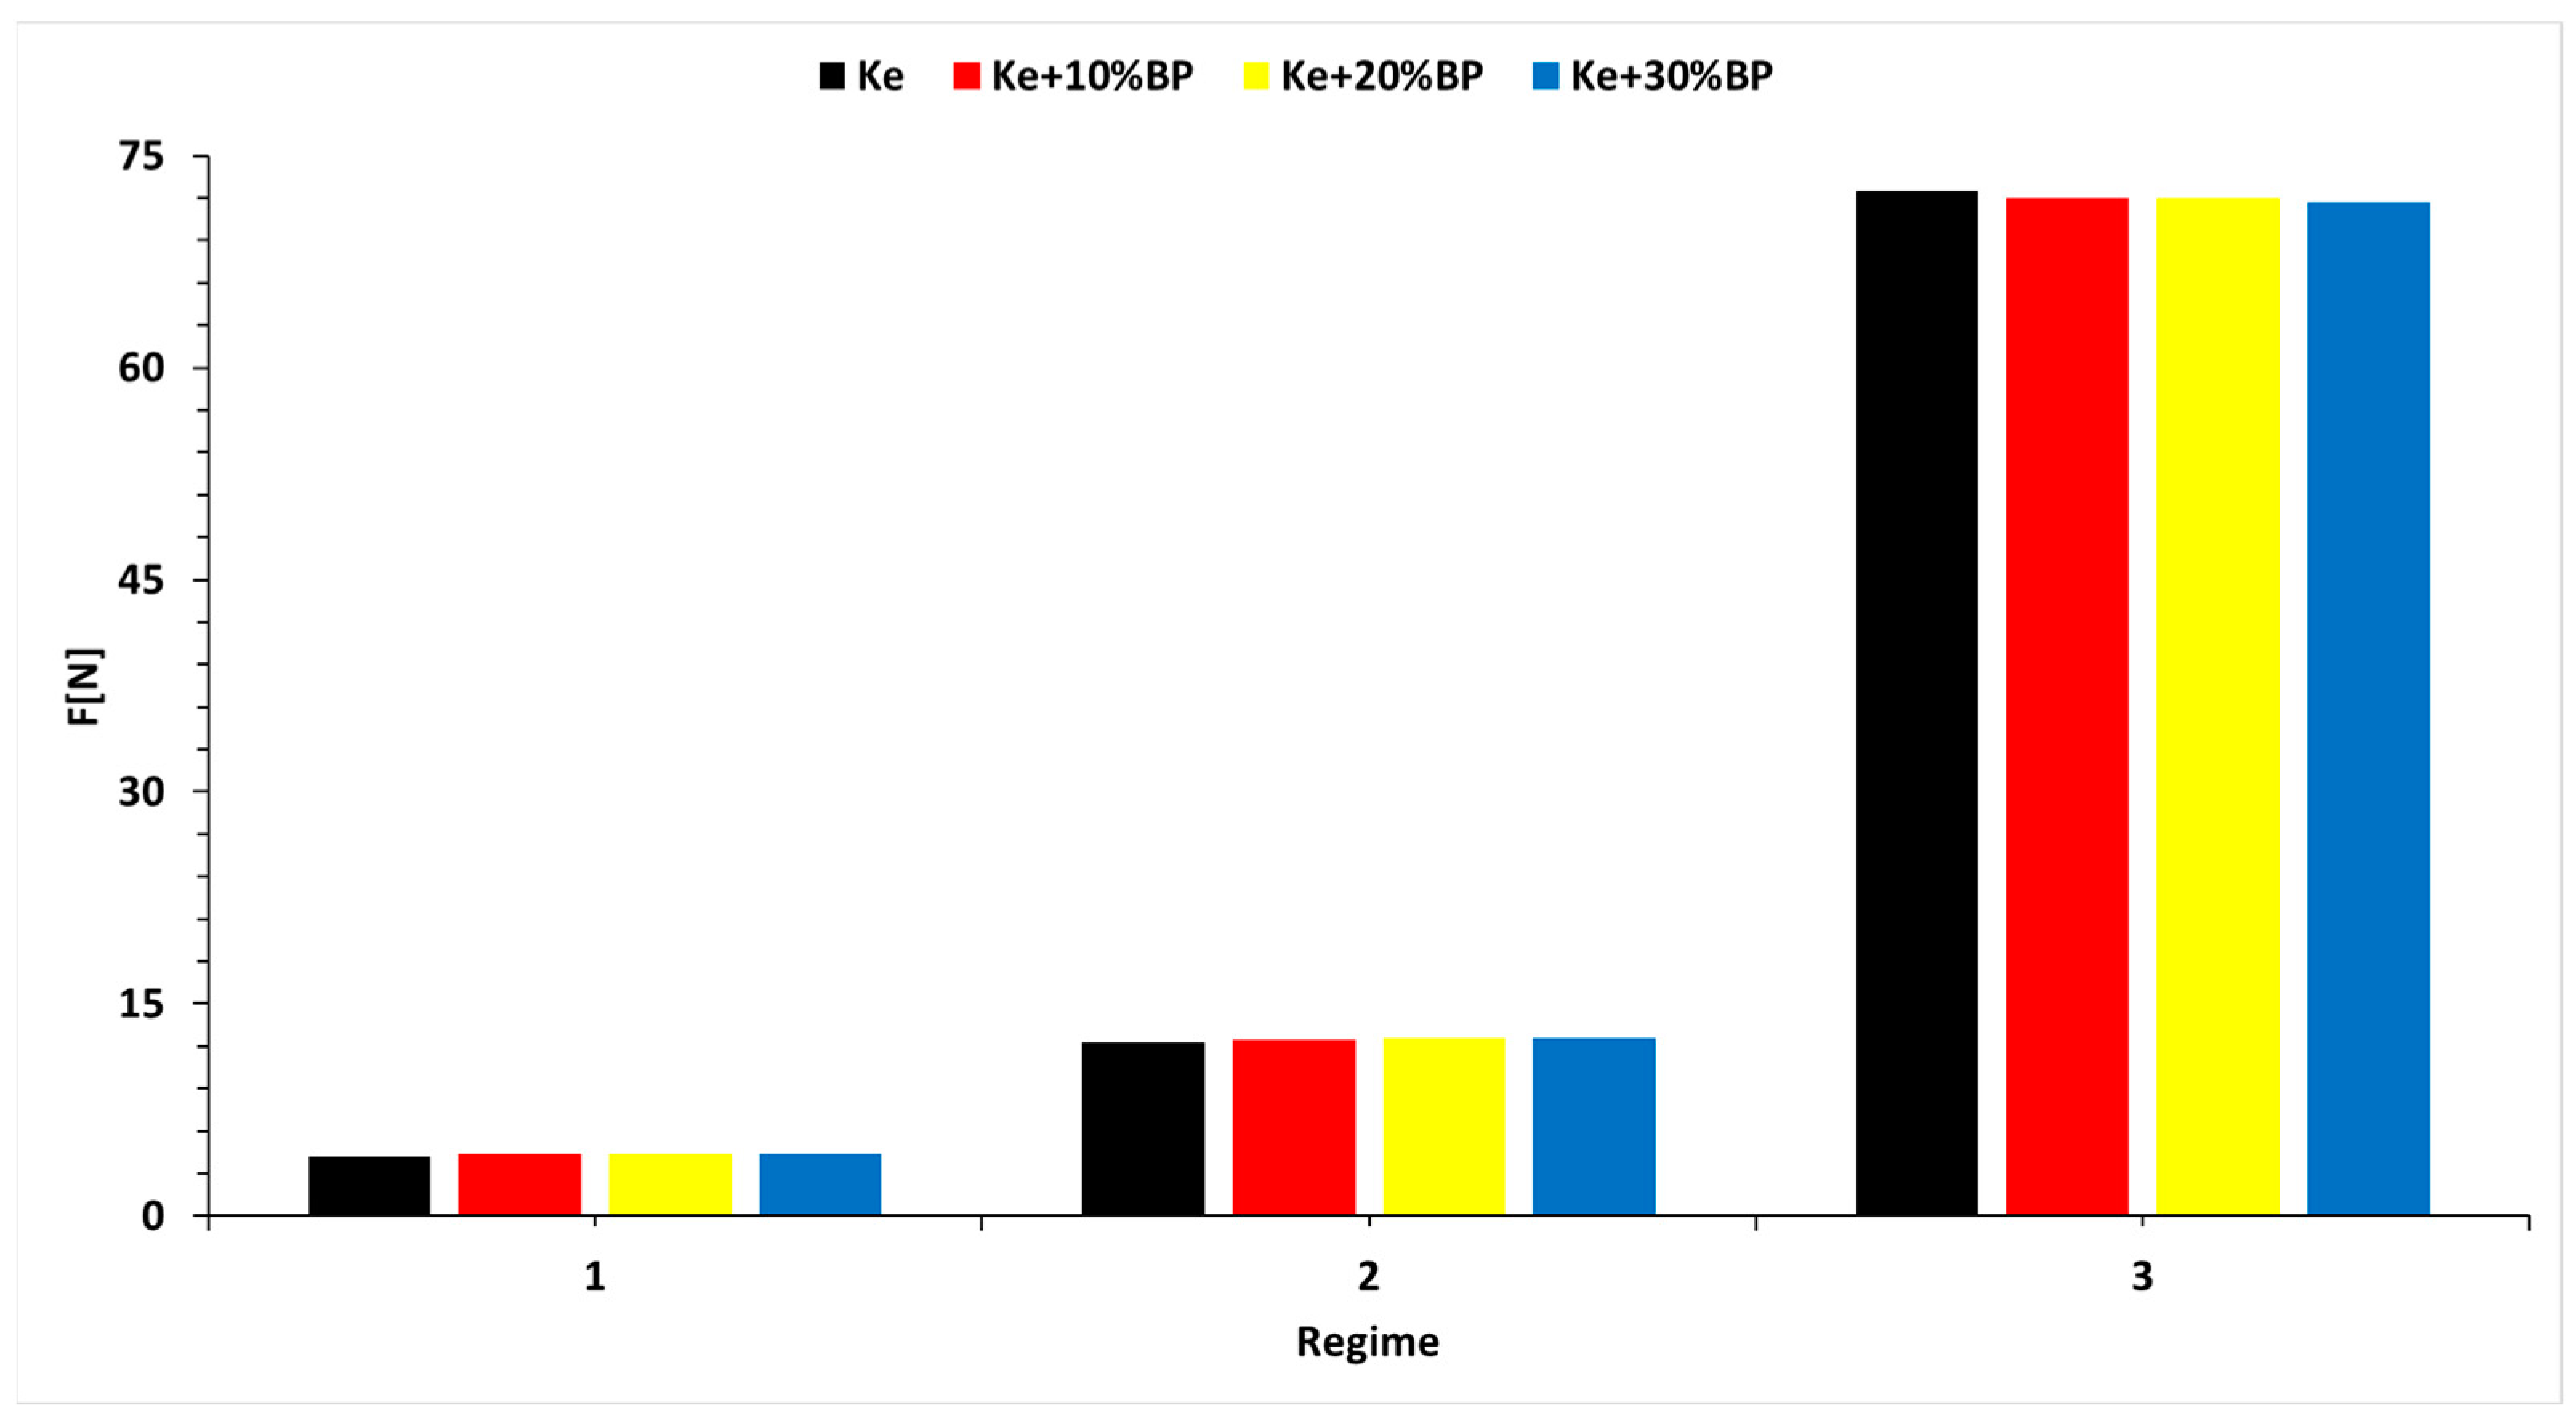
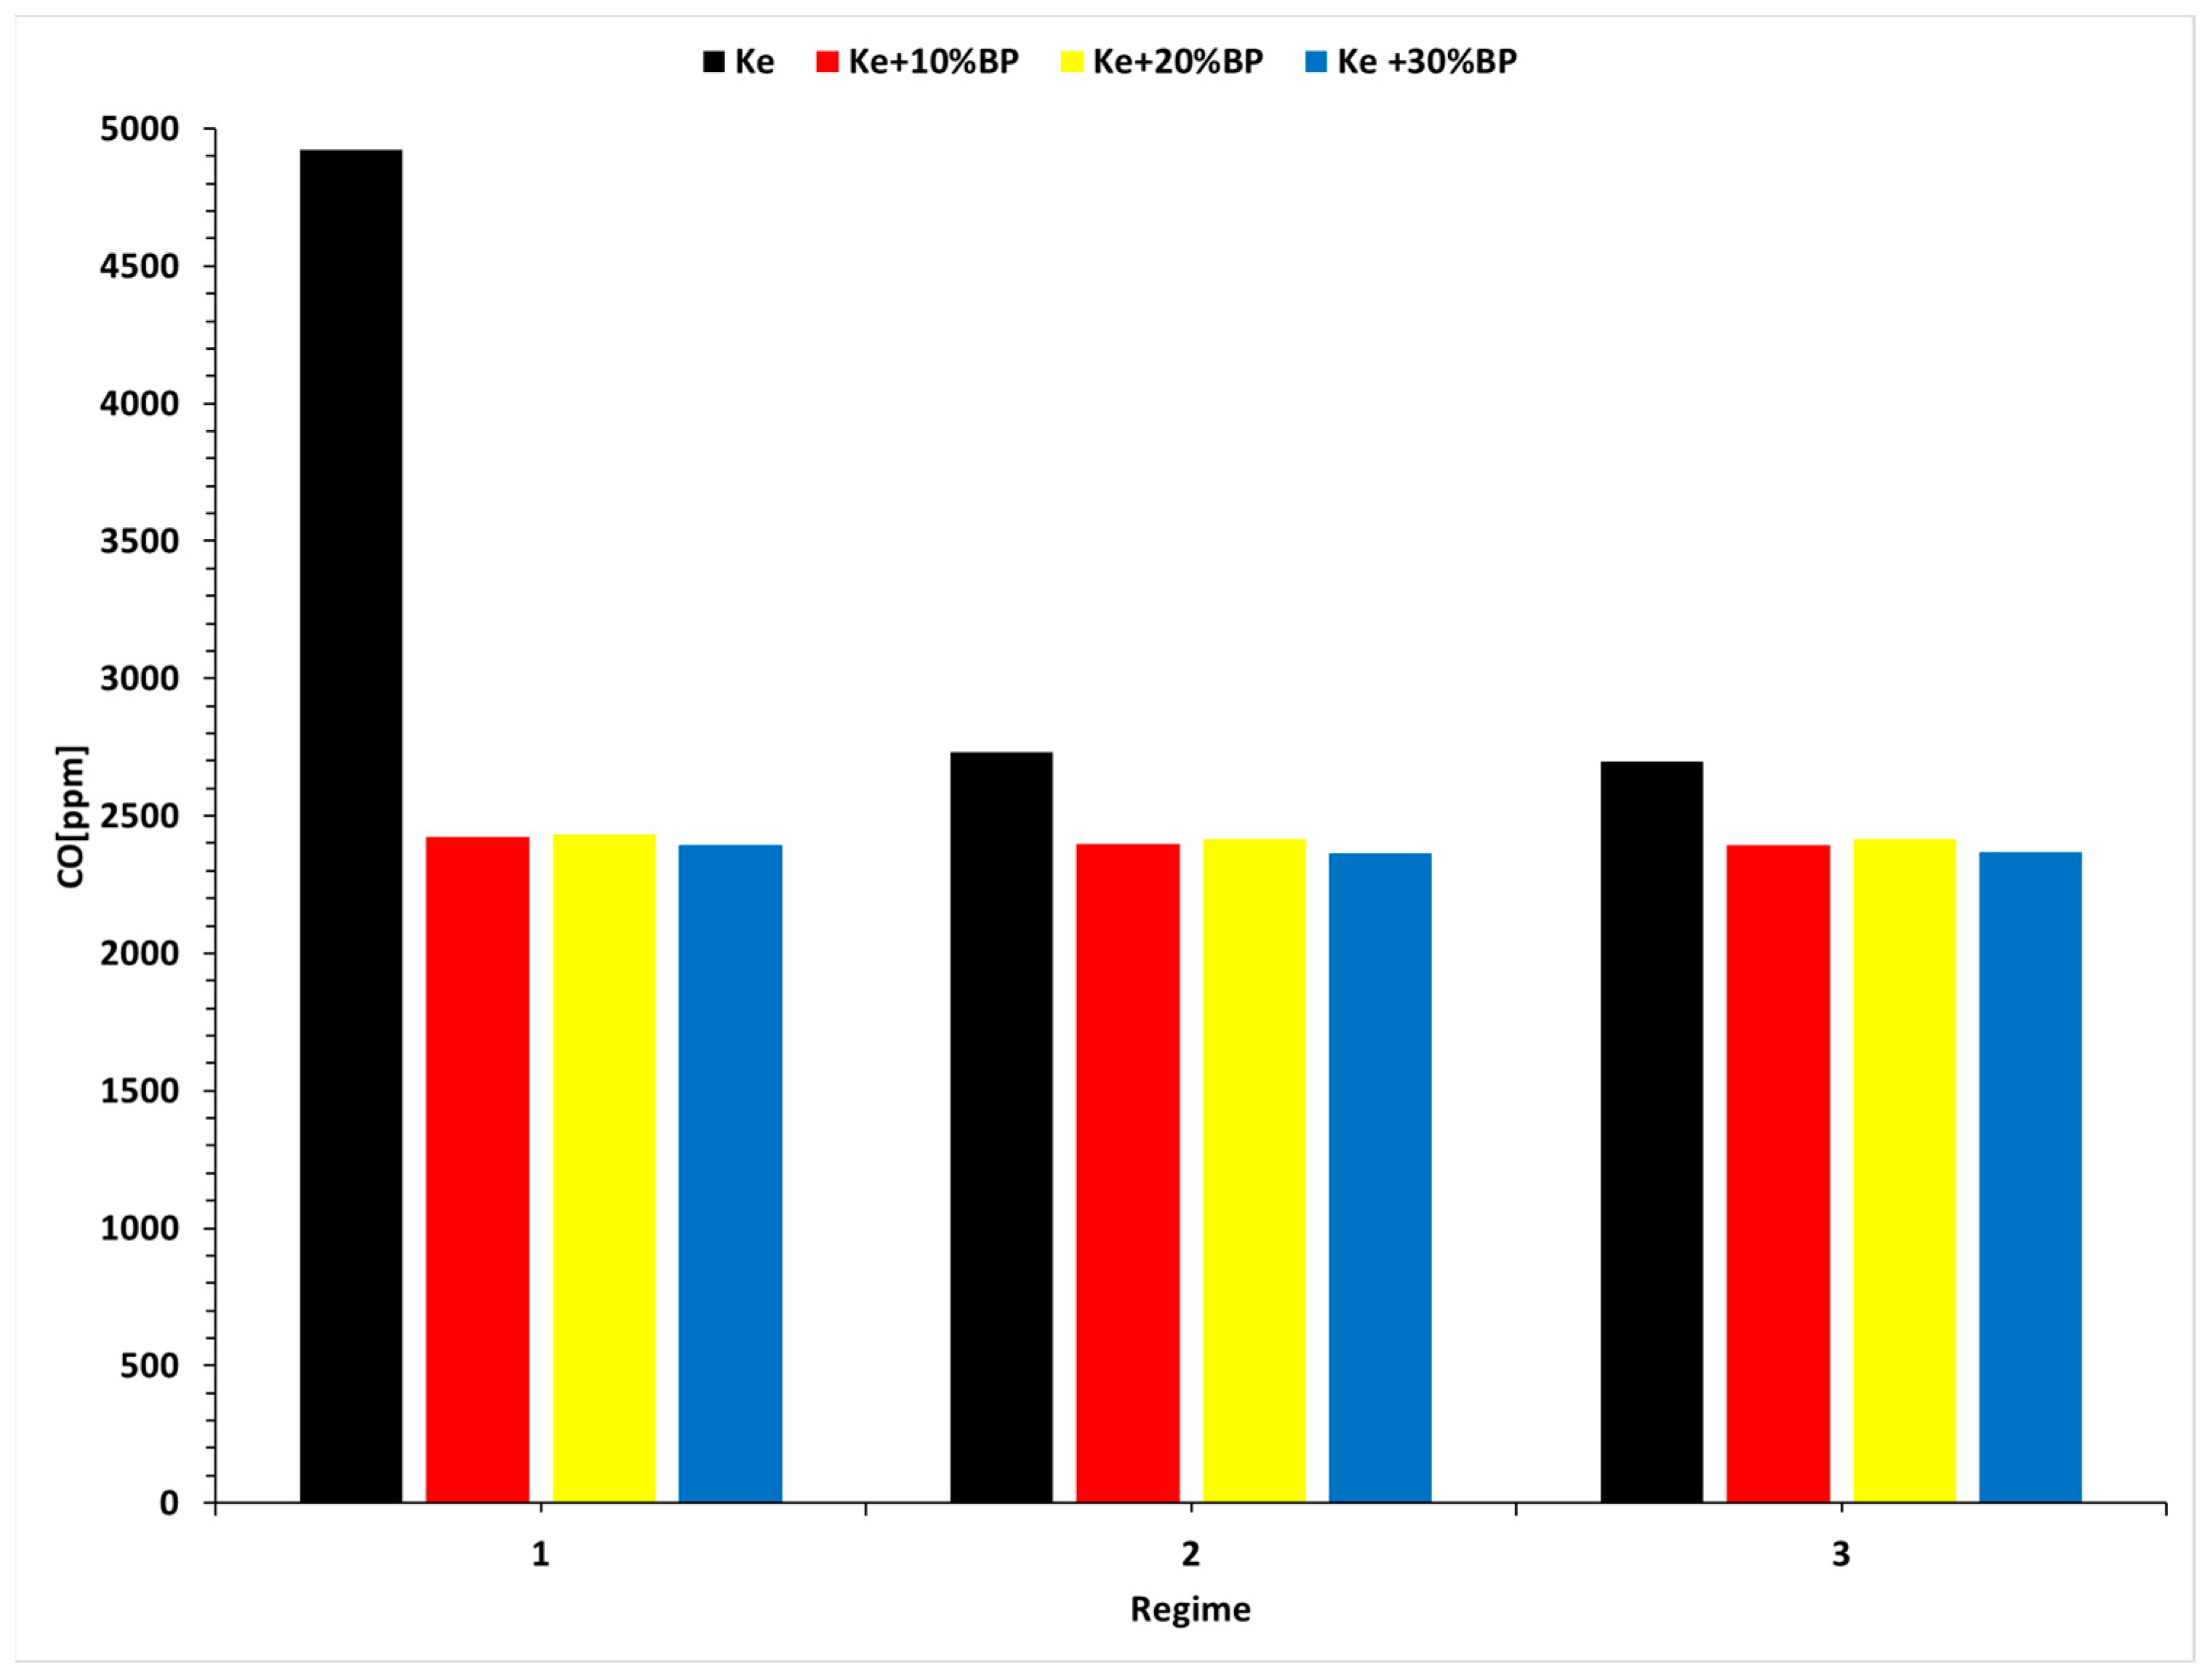
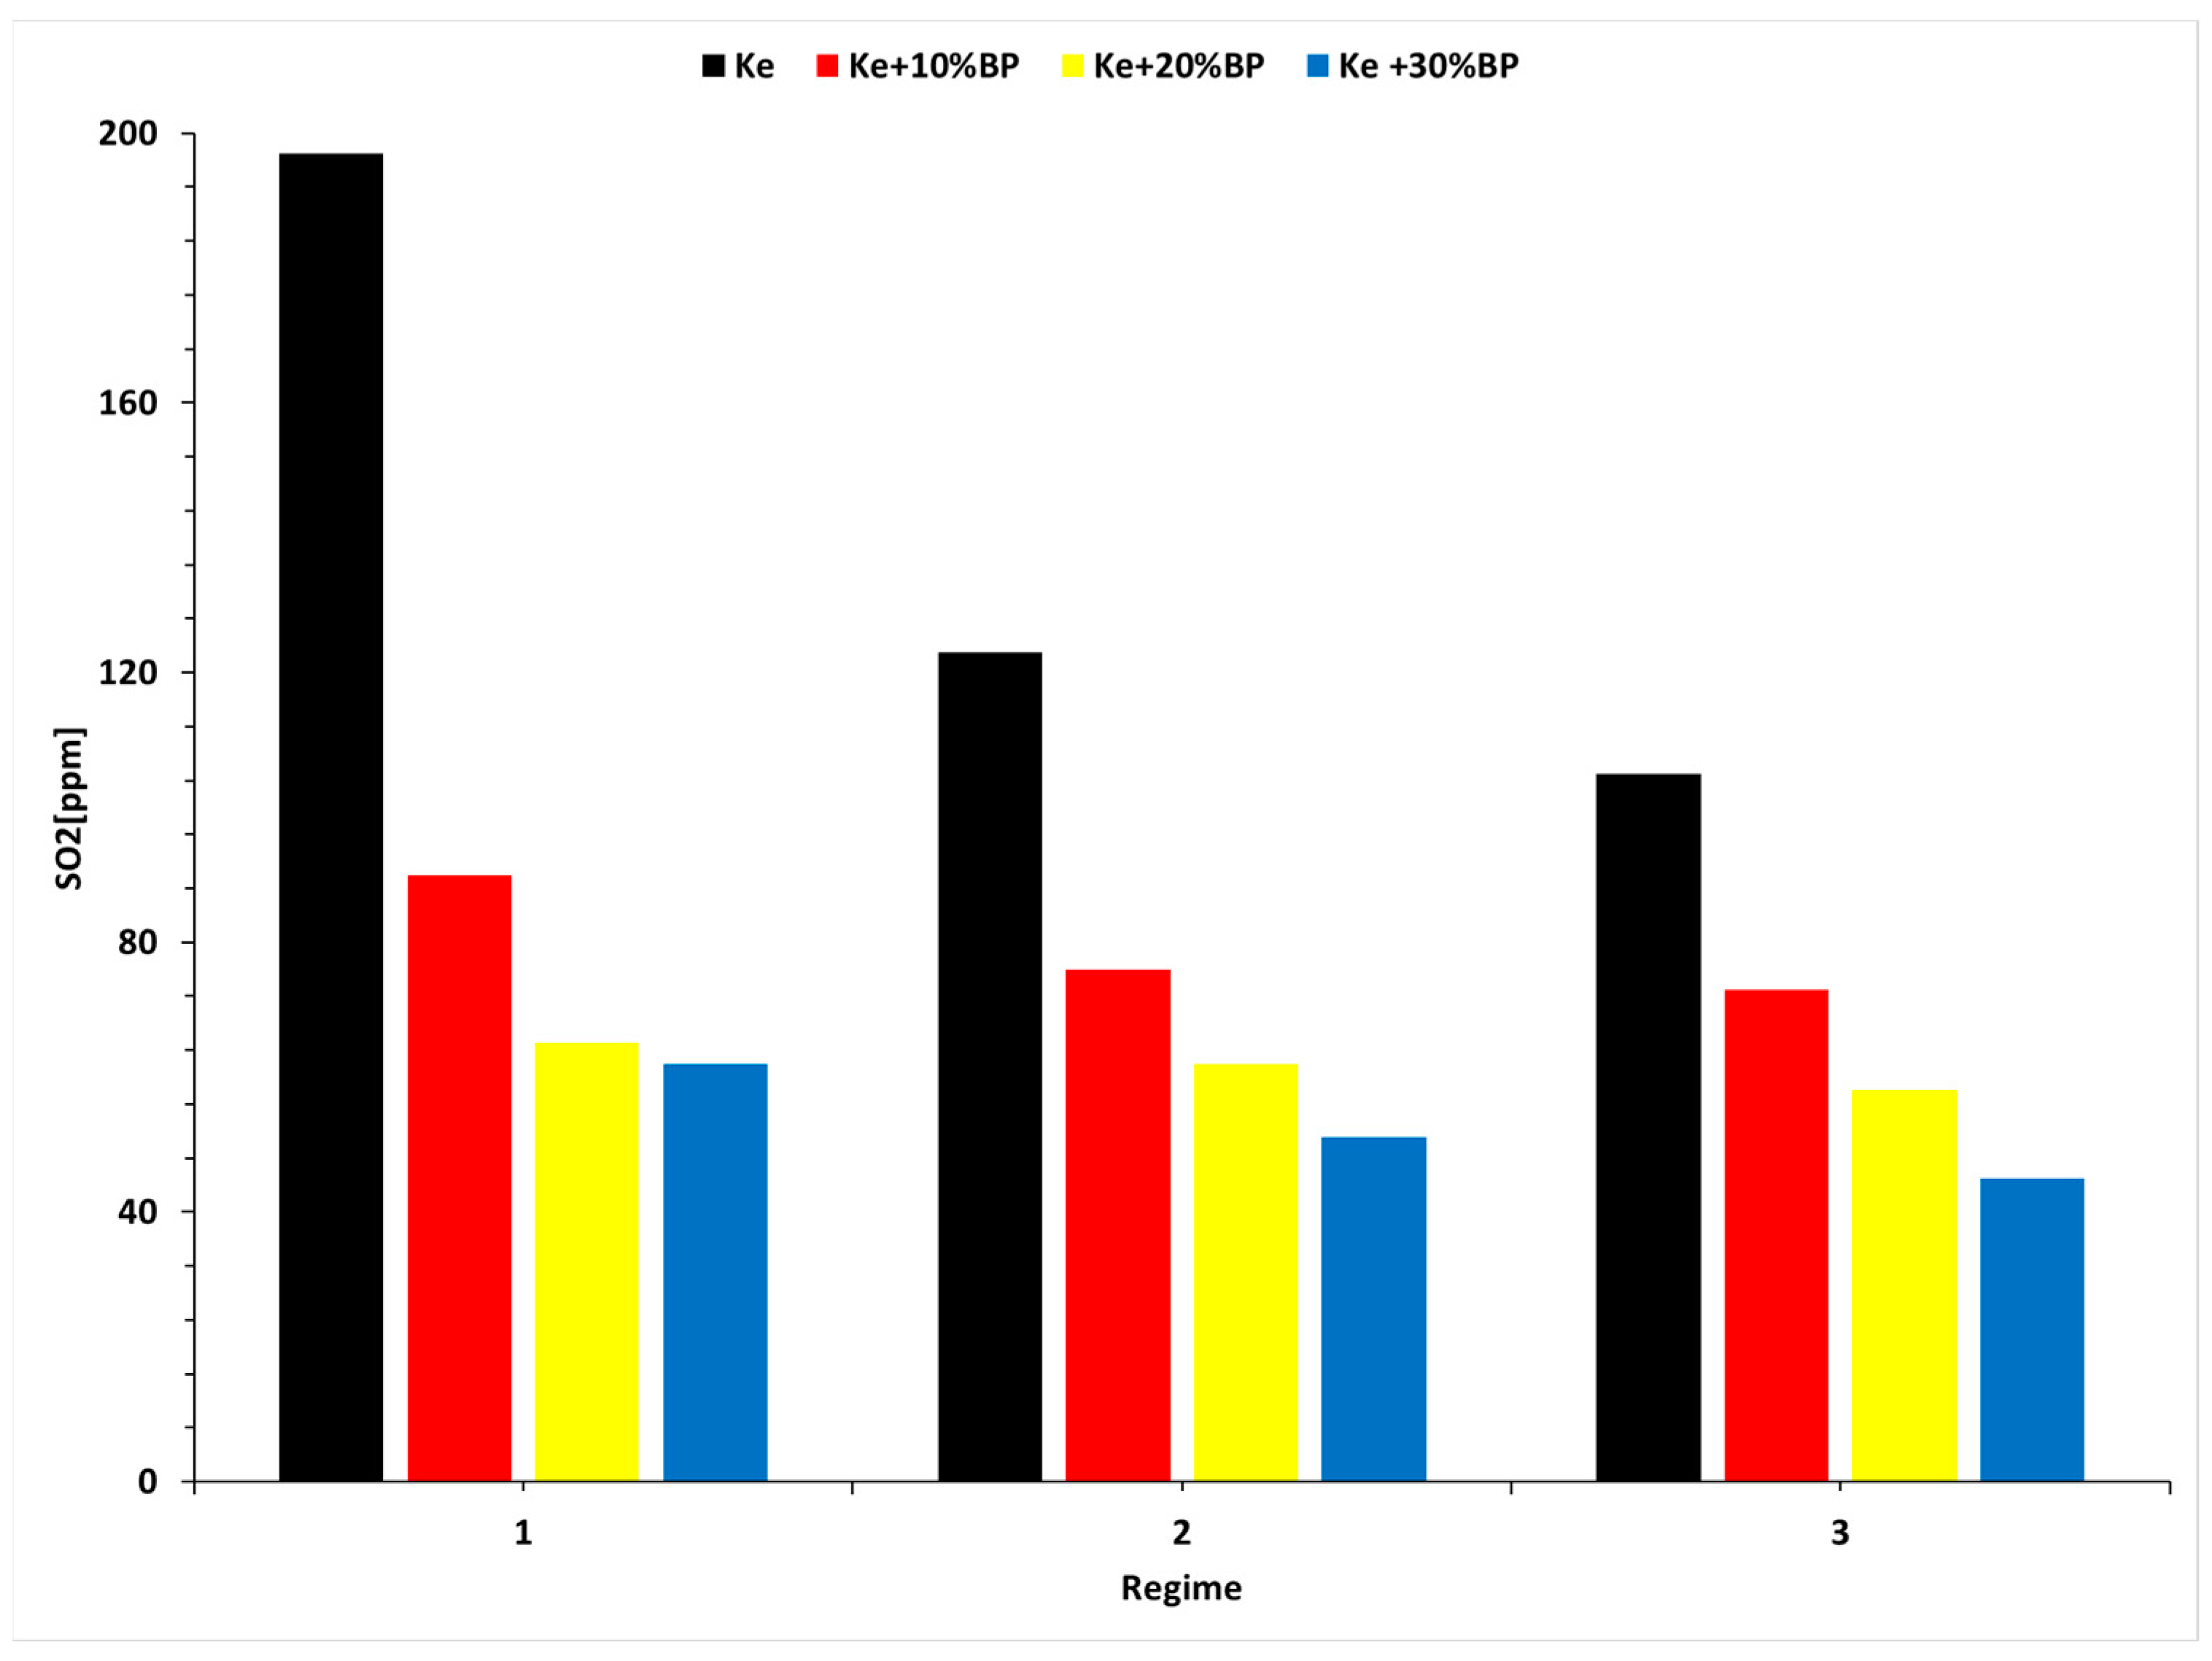
3.3. Micro-Turbojet Engine Experimental Results

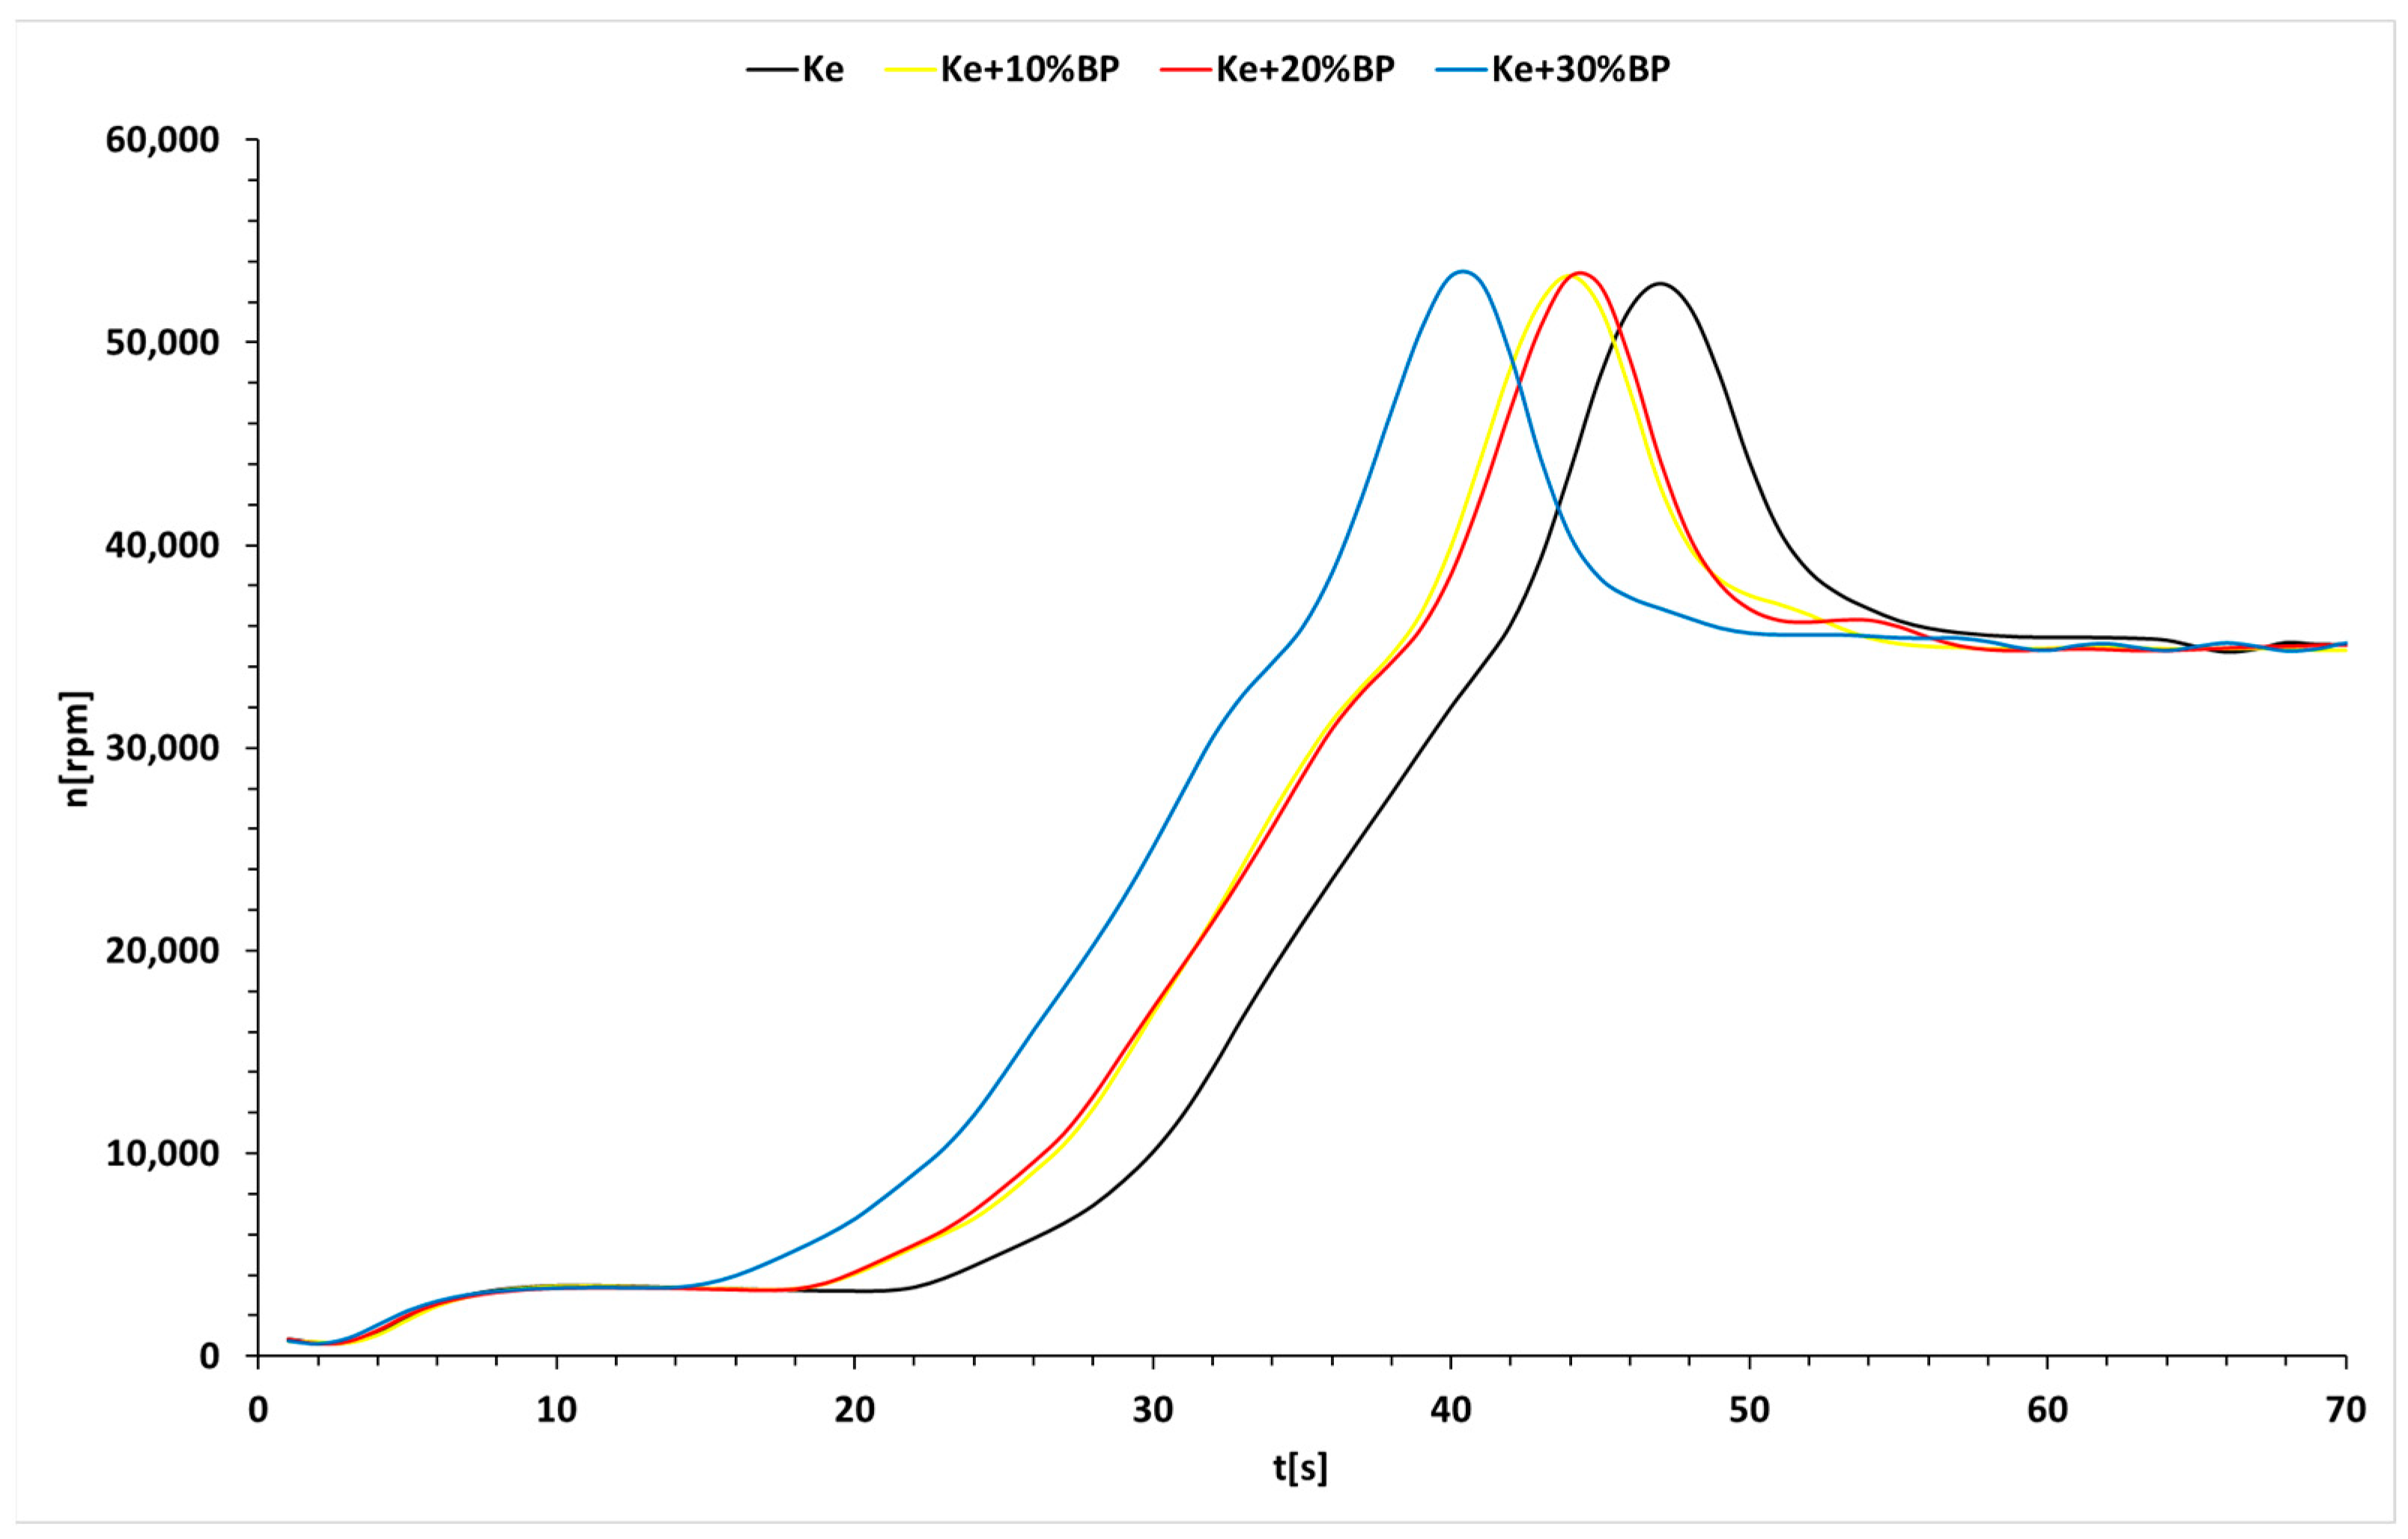
3.3.1. Experimental Results

This section presents the outcomes of the initial phase of the micro turbo-engine, focusing on the starting procedure. The starting regime is defined as the duration from the initial starter movement to the point where the engine achieves a stable operational state. The primary objective is to evaluate the stability of the starting process for different fuel blends. Figure 9, Figure 10 and Figure 11 illustrate the variations in engine characteristics during this phase, including rpm vs. time, fuel temperature vs. rpm, and fuel flow rate vs. rpm. These visual representations provide insights into the dynamics and performance of the engine during the critical starting period for each fuel blend.
It can be observed from Figure 9 that the starting time decreases as the biodiesel concentration increases; thus, for Ke, the stating time is the lowest. The variations shown in Figure 10 indicate that the succession of the starting procedure leads to a slight decrease in the fuel temperature due to the fact that when the engine is initiated by the electric starter, outside air is sucked into the burning chamber. Also, Figure 10 shows that the time frame needed for the spark plug to ignite the fuel blends decreases as the biodiesel concentration increases due to the fact that the temperature inside the combustion chamber increases too, thus leading to a more rapid ignition.
Figure 11 shows that the fuel debit needed for the starting procedure increases while the biodiesel concentration increases. This is due to the fact that the starting temperature for Ke is higher than the starting temperatures of the fuel blends; therefore, the engine is forcing a large amount of fuel within the burning chamber in the case of Ke. After the working temperature is reached, the fuel debit variation is switched (lower for Ke and higher for fuel blends). So, during the “cold” period of the starting procedure, Ke debit is higher than the fuel blend ones and after the working temperature is reached, Ke debit is lower than the fuel blend ones.
In order to assess the engine’s stability during transitory regimes, a sudden acceleration and deceleration experiment was performed for all fuels and blends. After the engine was suddenly accelerated from idle to max regime, it was kept there for 30 s until it stabilized, and after, that the sudden deceleration took place, and moved back to the idle state.
Figure 12, Figure 13 and Figure 14 show the variation of the most important parameters: fuel temperature vs. rpm, fuel flow rate vs. rpm, and thrust vs. rpm.
Out of the three figures shown above (Figure 12, Figure 13 and Figure 14), the following aspects were assessed: while the engine suddenly accelerates from idle to max, maintained until it stabilizes and then suddenly decelerates, it can be observed that the fuel temperature in front of the turbine is lower during the sudden acceleration and deceleration and also decreases as the biodiesel concentration increases. Fuel flow increases during the sudden acceleration period and increases as the biodiesel concentration increases due to the lower calorific power of the biodiesel. The delivered thrust decreases as the biodiesel concentration increases and also is lower during the sudden acceleration period.
Next, Figure 15, Figure 16 and Figure 17 show the main monitored parameters of interest in performance analysis that were recorded during the operation of the turbo-engine within stable regimes (idle, cruise, and max). The data were averaged for 1 min of functioning at each regime. The monitored and recorded parameters are thrust, fuel flow, gas temperature in front of the turbine, and gaseous pollutant concentrations, such as CO, SO2, and NOx.
Figure 15 provides the charts that describe variation of the temperature in front of the turbine for the three stable operating regimes and for the four different types of fuel.
From Figure 15, it can be noticed that the temperature measured in the combustion chamber is higher when the turbo-engine is powered by each of the four tested biodiesel blends while operating in the idle mode, than in the case of using a Jet-A type fuel without exceeding the upper prescribed limit for engine exploiting that is 800 °C. In the cruise operating regimes, the temperature measured in the combustion chamber decreases below the temperature attained in the combustion chamber when using a Jet-A type fuel, considering the reference temperature, when the biodiesel concentration in the four tested combustible blends increases. In the maximum operating regime, the temperature measured in front of the turbine when using the four combustible blends exhibits small fluctuations against the temperature attained in the combustion chamber when using a Jet-A type fuel. These small fluctuations can be attributed to the reading errors of the used thermocouple that was a thermocouple k type, and also, the fluctuations can be attributed to the extremely low flow rates provided by the fuel pump, creating difficulties in the automatic operation of the turbo-engine to maintain a constant speed.
Figure 16 provides the charts that show the variation in the fuel flow of the five fuel blends tested for the four operating regimes. As can be observed, there are no notable fluctuations in the fuel flow when the turbo-engine is operated.
Figure 17 provides the charts that display the variation in the thrust when the turbo-engine is powered by the fuel blends while operating in the three regimes mentioned above.
In all cases, the thrust of the turbo-engine exhibits an increase when biodiesel concentration increases in the fuel blends tested, for all the four studied operating regimes.
By analyzing the data from Figure 15, Figure 16 and Figure 17, the first conclusion that can be drawn is that the integrity and functionality of the turbo-engine are not affected when biodiesel is added in fuel.
When the turbo-engine operates at the idling regime, the temperature in front of the turbine has the greatest fluctuations of all operating regimes. Fuel consumption has small fluctuations for all operating regimes and for all fuel blends.
Thrust exhibited positive variations of a few percentages when the turbo-engine worked at idle and cruise regimes.
Figure 18, Figure 19 and Figure 20 show the variation of the most important gaseous pollutants obtained during the combustion process. Thus, NOx, SO2, and CO emissions have been measured as described above.
Figure 18 shows a drastic decrease in the CO production when the blends are used compared to Jet-A, especially during the idle and maximum regimes. This aspect can be correlated with the data from Table 1, where it is clearly shown that the amount of oxygen brought by the biodiesel into the blend increases, thus the need for outside air decreases, leading to an improved burning process and less CO production. Also, according to Table 1, carbon content decreases as the biodiesel concertation increases, which may lead to a lower coproduction during the combustion process.
Figure 19 and Figure 20 also show decreases in the gaseous pollutants while the concentration of biodiesel increases, although in the case of NOx, this decrease is slim. Nevertheless, the adding of biodiesel in the blend improves the combustion process; therefore, fewer pollutants are formed. Even though the content of nitrogen (N) within the blends remains constant, the nitrogen from the outside air decreases as the need for outside air decreases. The same theory can be applied to Sulphur.

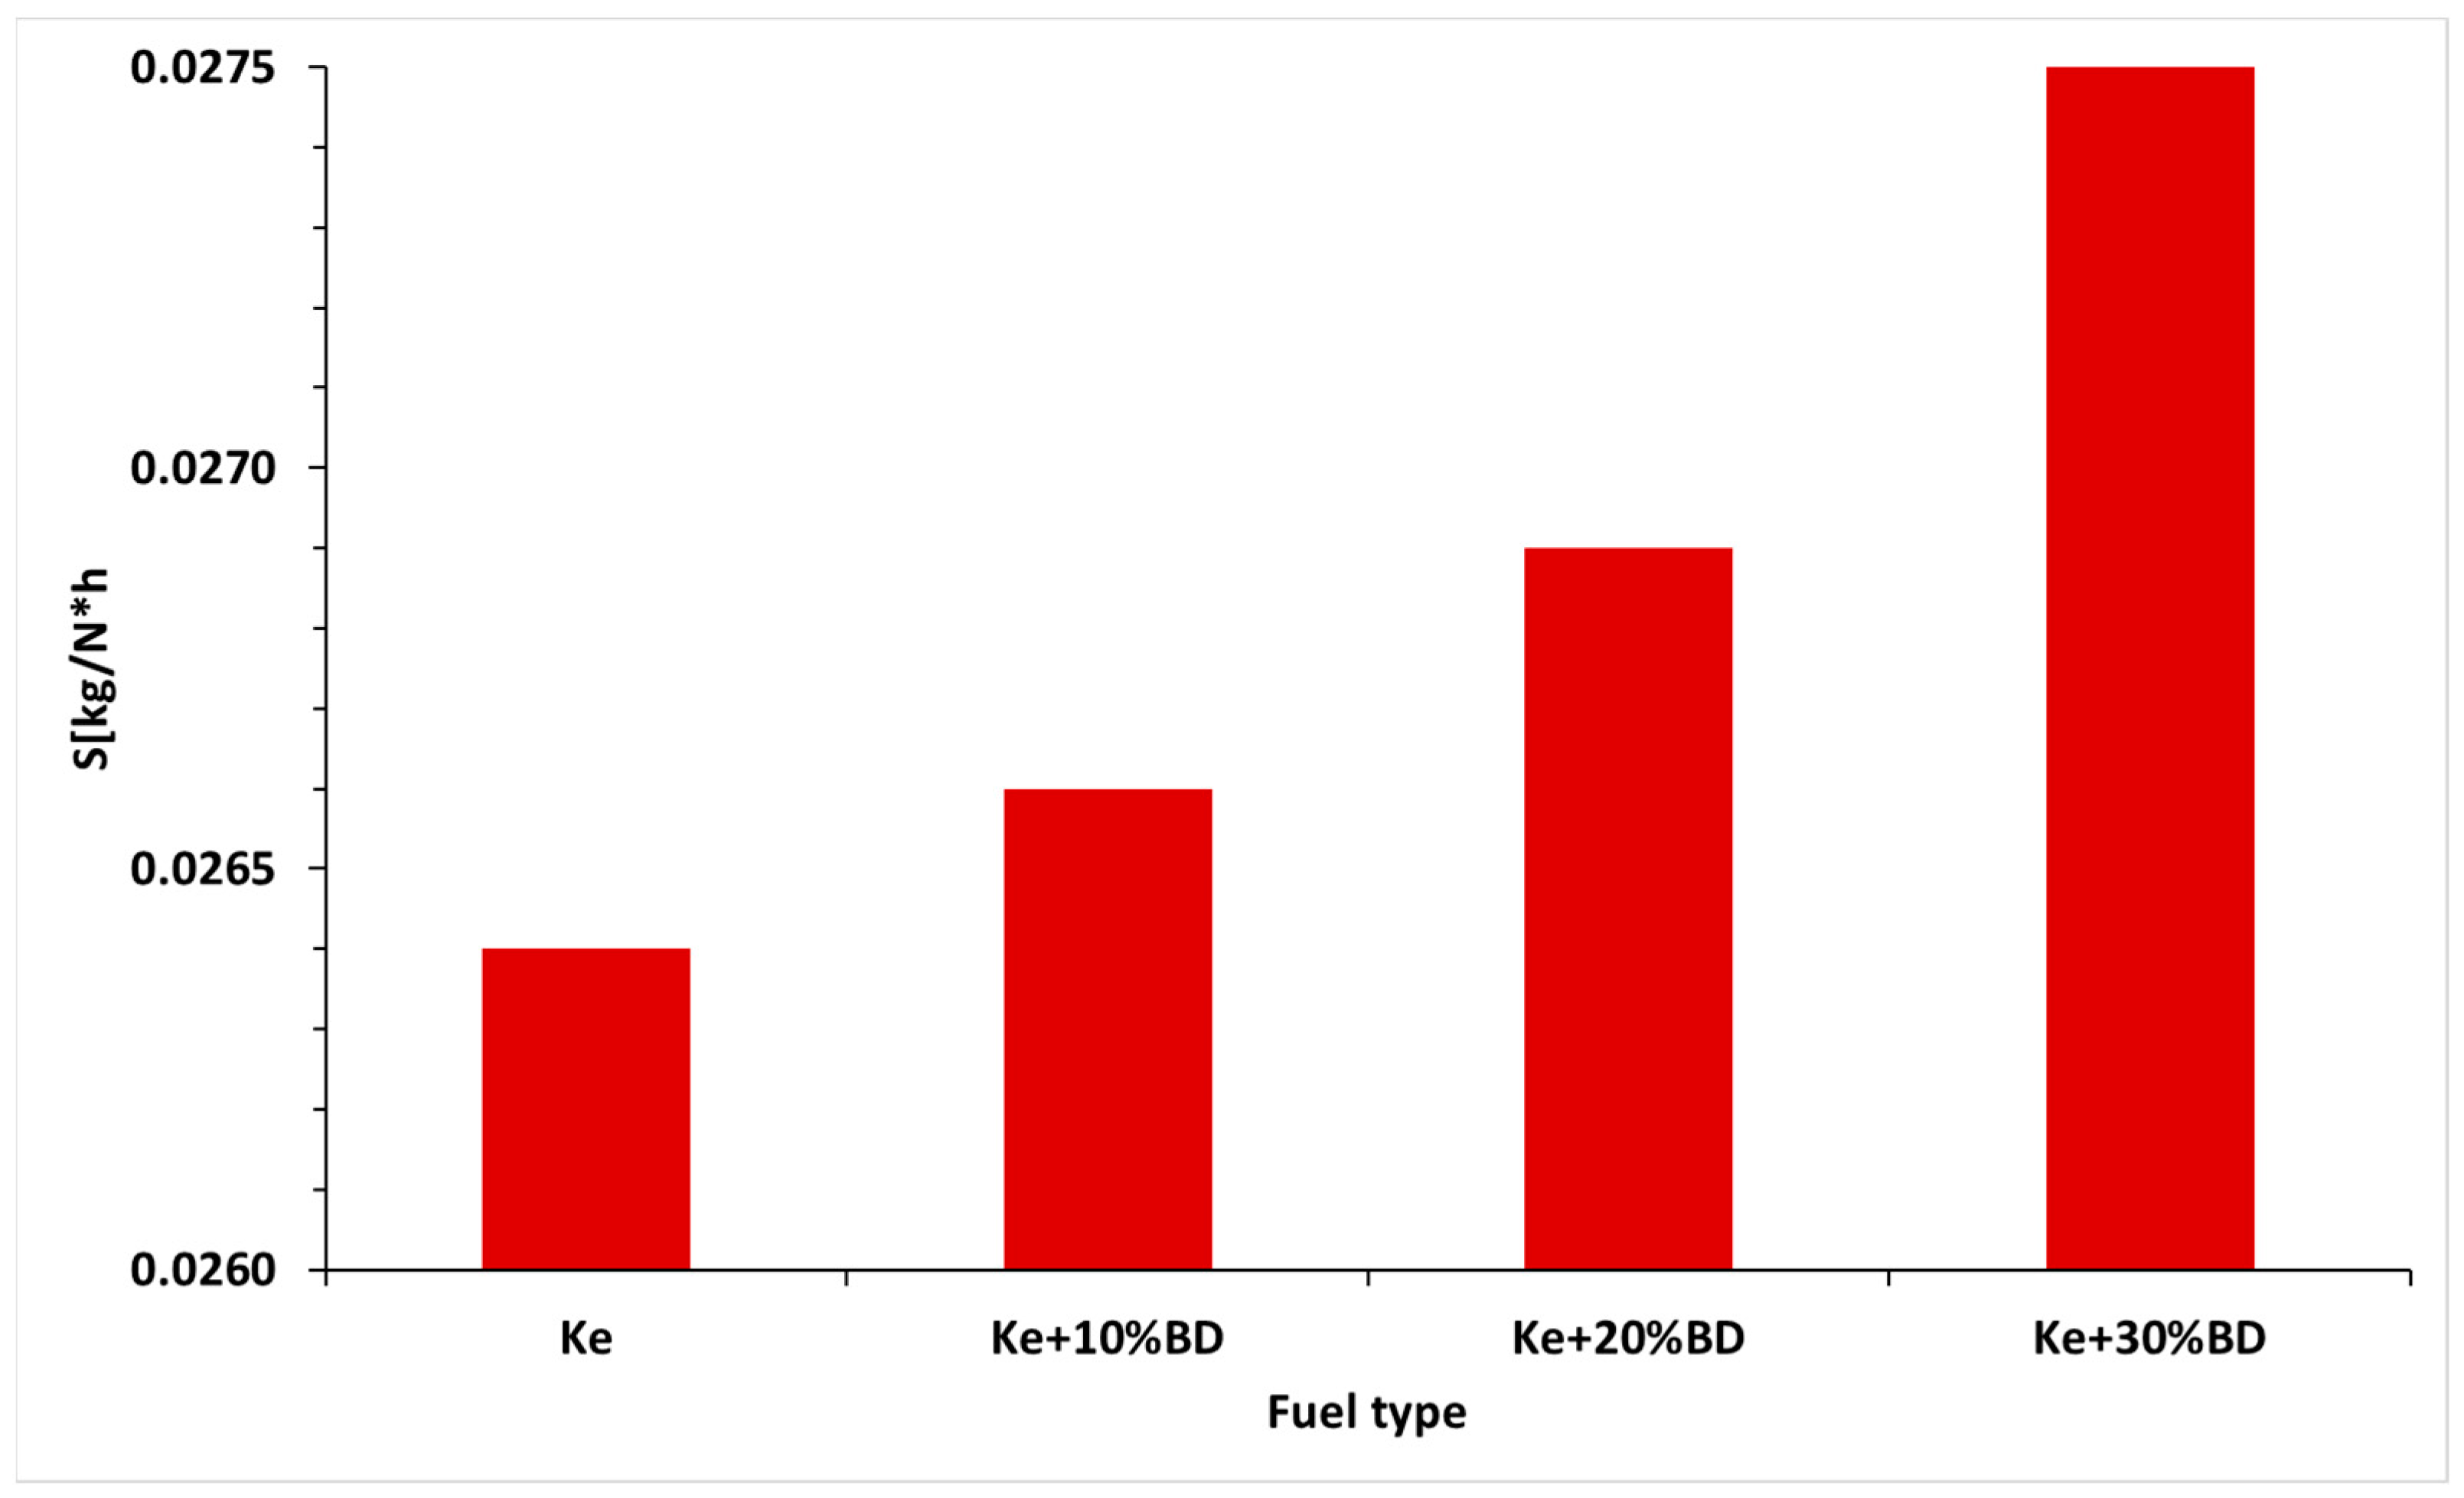
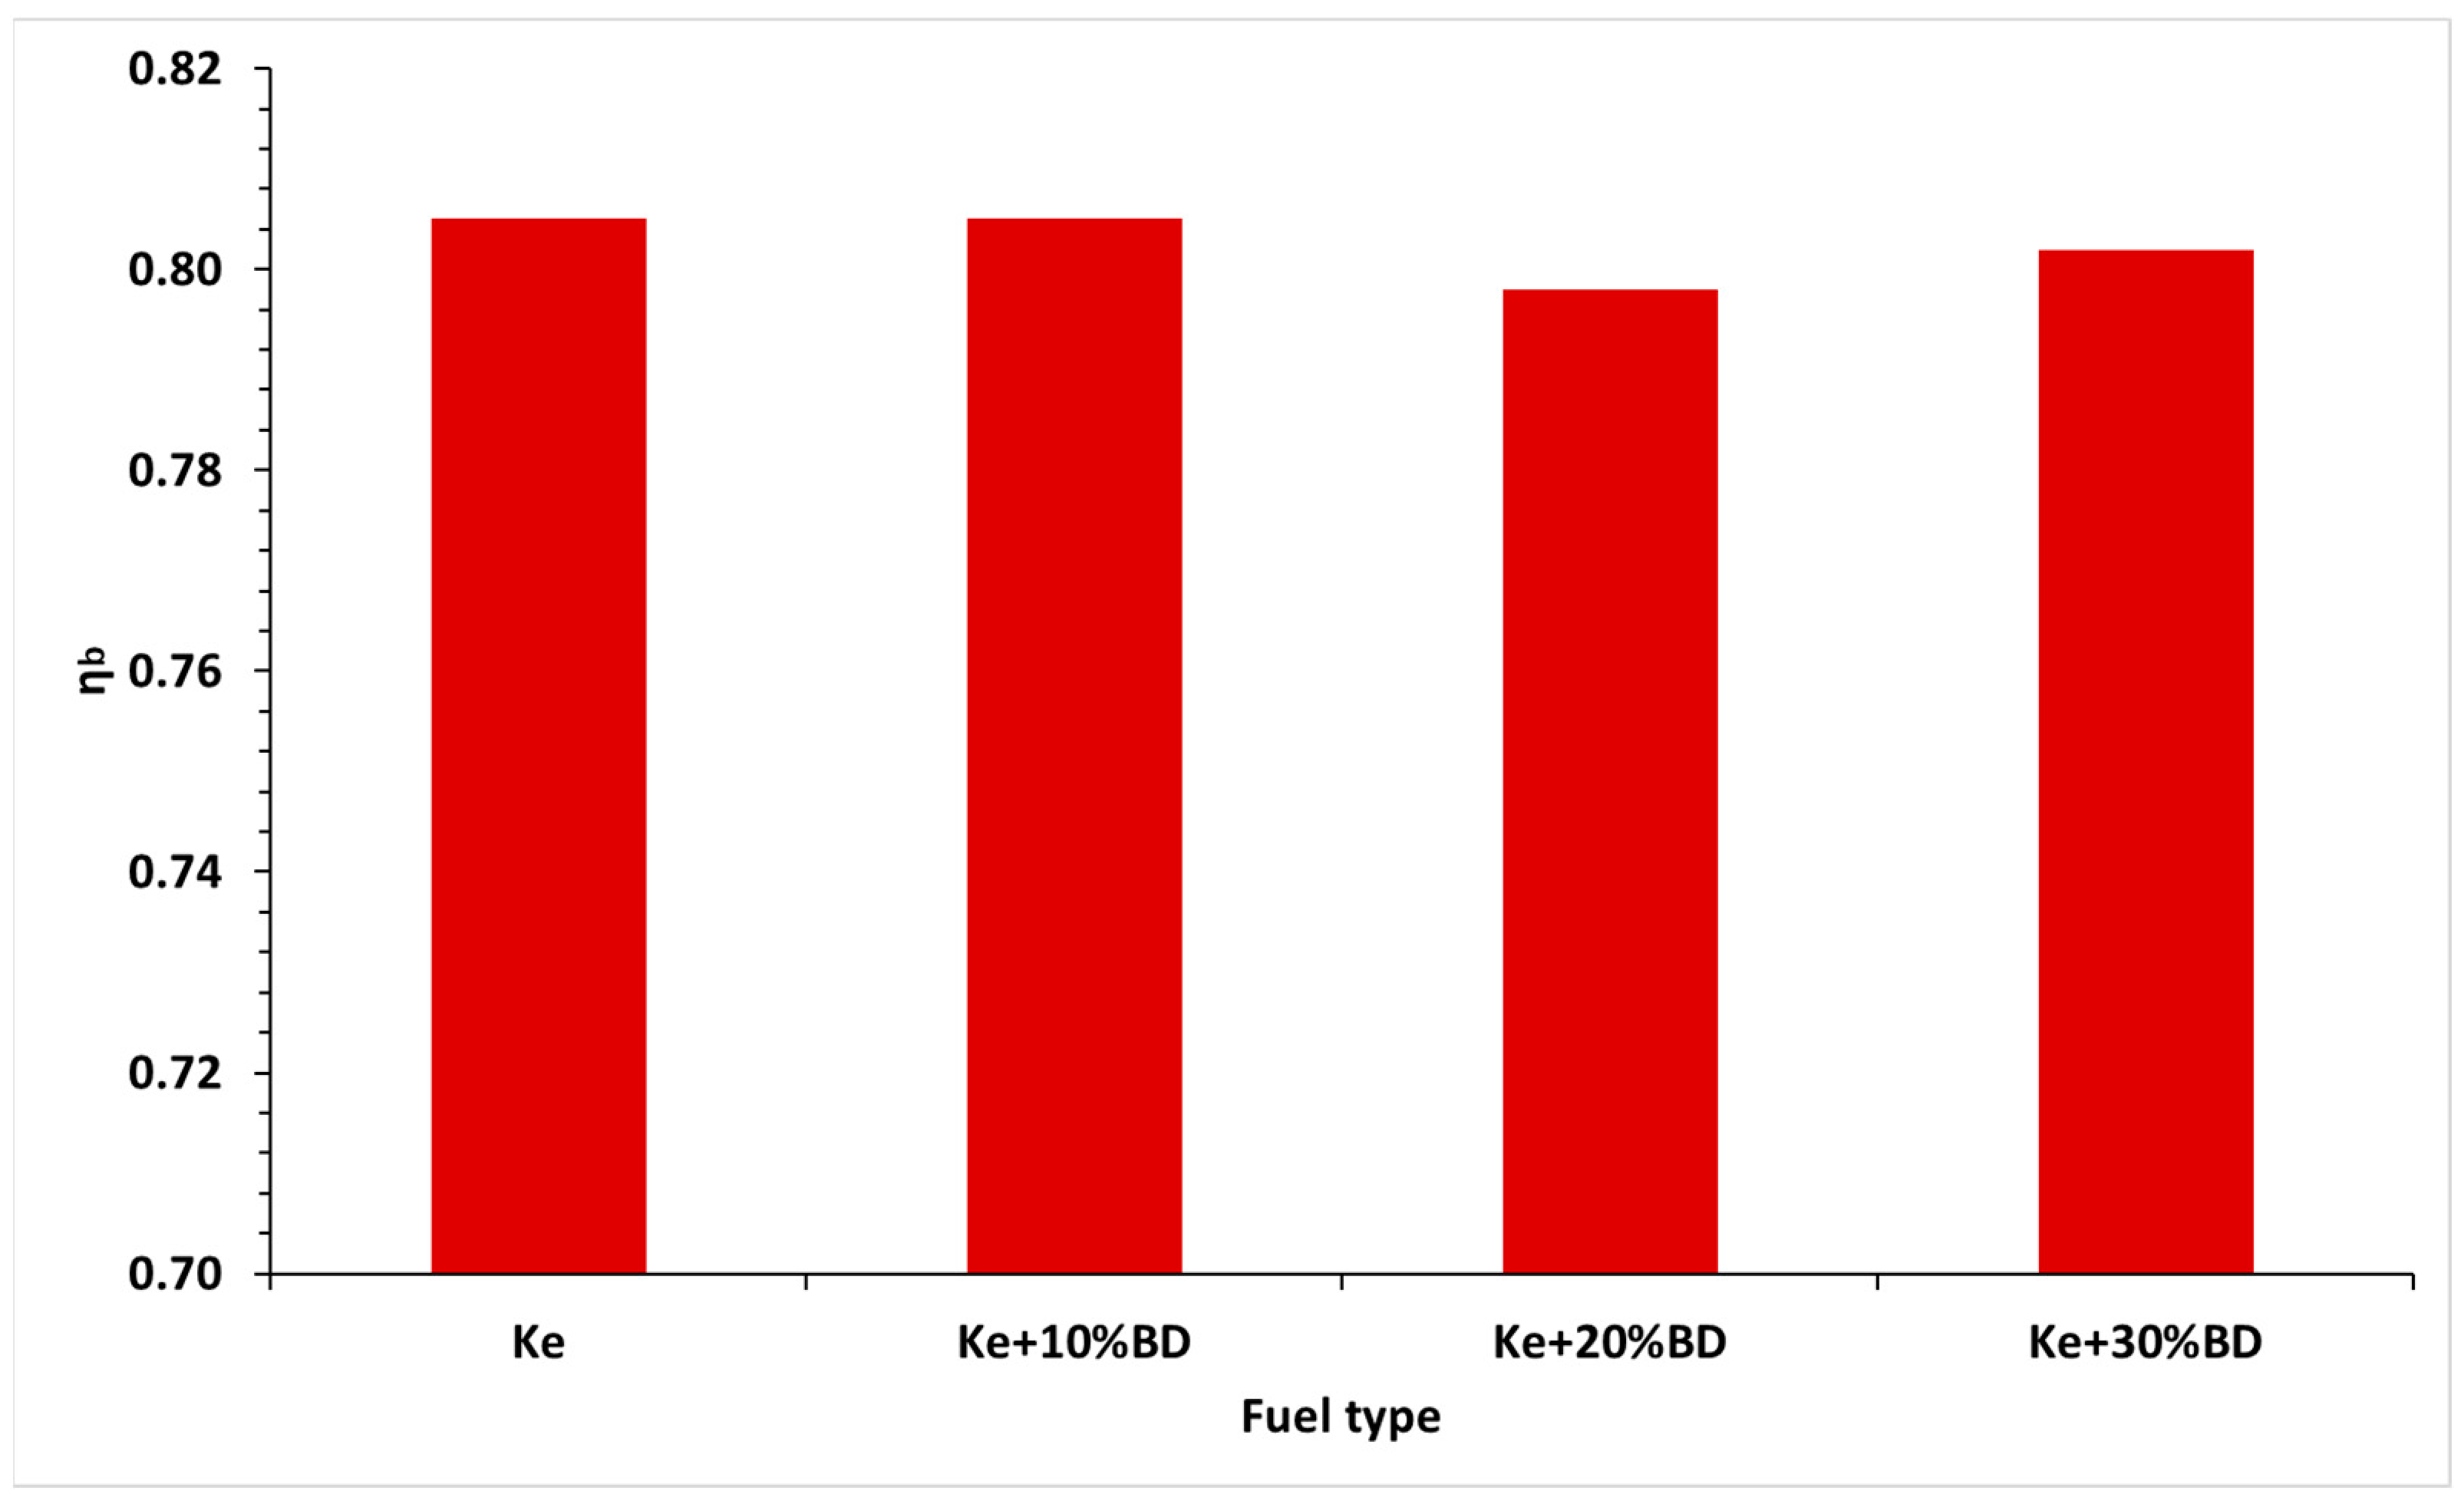
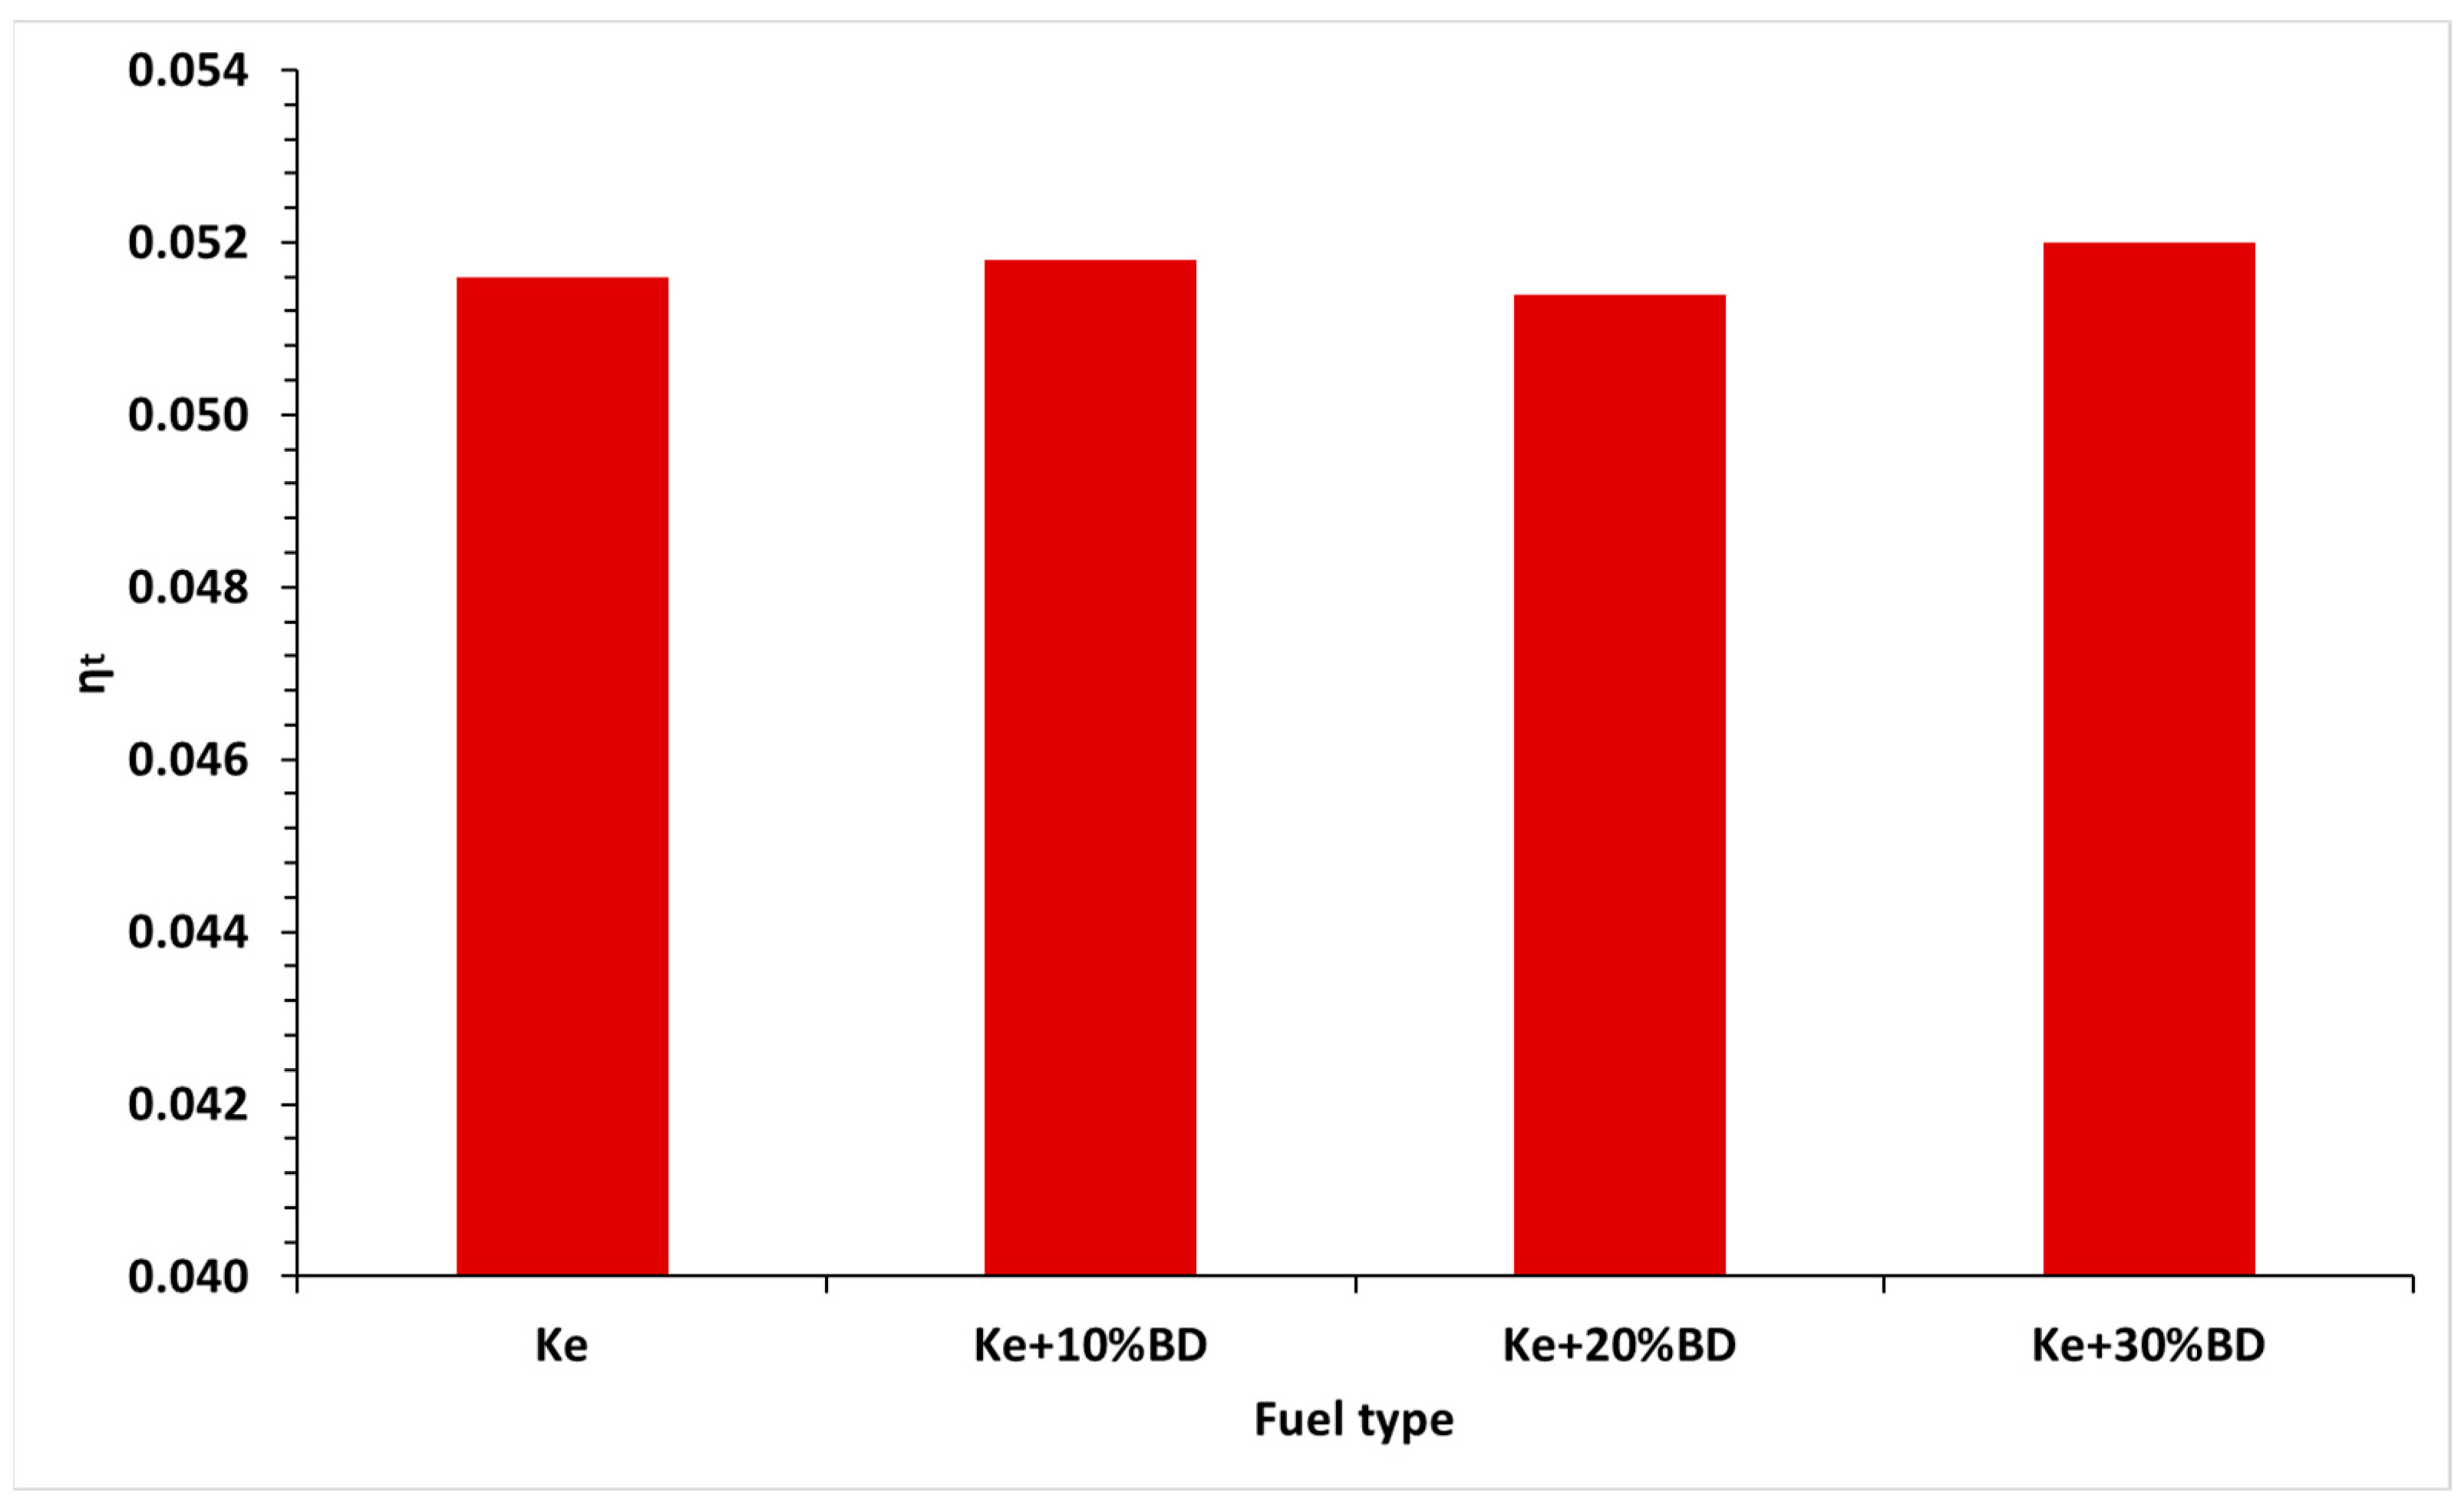
3.3.2. Jet Engine Cycle Analysis

Performance parameters are computed based on the methodology outlined in reference [27]. Density determination for each examined fuel blend enables the conversion of measured fuel flow, as recorded by the engine instrumentation, from l/h to kg/s. The specific consumption (S) is defined by Equation (5):
S = 3600 · M ˙ f F k g N · h
where M ˙ f represents the fuel flow in kg/s. In the context of both comprehending combustion development within the combustion chamber and estimating combustion completeness, the calculation of combustion efficiency (ηb) is crucial. This efficiency is expressed by Equation (6), offering a quantitative measure of the effectiveness of the combustion process, serving as a valuable indicator in the analysis of engine performance and combustion dynamics:
η b = M ˙ f + M ˙ a c p 3 _ c o m b · T _ c o m b M ˙ a · c p _ c o m p · T _ c o m p M ˙ f · L C P
where LCP—lower calorific power, cp—specific heat capacity, Tcomb—temperature in front of the combustion chamber (that was recorded).
The thermal efficiency of an engine, a crucial performance metric, is defined as the ratio of the net rate of organized work output to the rate of thermal energy available from the fuel within the engine. This parameter, denoted by Equation (7), provides a quantitative measure of the engine’s effectiveness in converting thermal energy from fuel combustion into useful work output. Thermal efficiency is a key indicator in assessing the overall performance and energy conversion capabilities of the engine under consideration:
η T = M ˙ a + M ˙ f v e 2 2 M ˙ f L C P = M ˙ a + M ˙ f F M ˙ a + M ˙ f 2 2 M ˙ f L C P
Figure 21, Figure 22 and Figure 23 show the variations in the specific fuel consumption, burning efficiency, and thermal efficiency for the maximum regime for all four fuels.
Figure 21 shows an increase in the specific consumption of fuel observed due to the higher concentration of biodiesel in the combustible blends and a lower calorific power of the blend.
It can be noted that specific consumption of the turbo-engine displays a small increase, which is a normal considering that the calorific power of the biodiesel is lower than the one of the Jet-A. Due to the lower LCV and higher specific consumption of the fuel blends compared with the Jet-A, the introduction of the biodiesel in aviation as fuel will lead to the necessity of bigger fuel tanks.
Analyzing Figure 22 and Figure 23, it can be observed that the value of the thermal efficiency is very low, in contrast to the values from the literature, because the operating procedures of a regular turbo-engine differ from those of the turbo-engines used for aviation applications.
The burning efficiency and the thermal efficiency exhibit small variations between the four tested combustible blends due to the increasing concentration of the biodiesel in the fuel blends tested.
As a discussion regarding the advantages of using this type of fuel for aviation turbojet engines, it can be stated that the concentration of SO2, CO, and NOx in the combustion gases decreases with the increasing concentration of biodiesel in the fuel. Additionally, the stability of the turbojet engine is not jeopardized. Furthermore, the analytical calculation of the quantity of CO2 for the stoichiometric reaction shows how the amount of CO2 resulting from the combustion decreases with the increasing concentration of biodiesel. As disadvantages of using this type of fuel for turbojet engines, it is noted that the calorific value of biodiesel and, implicitly, the studied blends, is lower than that of kerosene. This can be observed in the increase in specific fuel consumption with the increasing concentration of biodiesel in the fuel. In the idle regime, which is a more unstable operating regime than the others, an increase in the temperature in the combustion chamber is observed, resulting in a decrease in the fuel flow rate into the combustion chamber. In regime 2, the combustion temperature decreases more visibly with the increasing concentration of biodiesel, and similarly in regime 3, the temperature decrease is less pronounced, leading to an increase in the fuel flow rate.
The engine has a constant speed regulation law, which means that at the same operating regime, regardless of the fuel used, it maintains a constant speed. If the temperature in the combustion chamber decreases, it implies a reduction in turbine power. Consequently, the engine compensates for this decrease by increasing the fuel flow rate, explaining the increase in fuel flow rate and specific consumption.
This type of fuel can be used in aviation turbo-engines that do not fly at high altitudes because the freezing point of biodiesel is elevated, and it cannot be used at high altitudes where temperatures become negative. Thus, it becomes a suitable fuel for drones, model aircraft, etc.

4. Conclusions

The measurements carried out on the Jet CAT P80® turbo-engine show that the addition of the biodiesel in fuel does not endanger the functionality of the turbo-engines.
A higher biodiesel concentration in blends will increase the freezing point which leads to the impossibility of using these blends at high altitudes without being heated. The calorific value decreases with the increase in the biodiesel concentration having, as consequence, the increase in the specific consumption. The lower heating value for Ke was recorded at 45.292 kJ/kg; for Ke + 10% BP, it was 44.403 kJ/kg; for Ke + 20% BP, it was 43.67 kJ/kg; for Ke + 30% BP, it was 41.99 kJ/kg; and for biodiesel (BP) alone, it was 39.323 kJ/kg.
Elemental analysis indicates that for Ke, the carbon concentration is 85.17%, hydrogen is 13.31%, nitrogen is 0.07%, and oxygen is 1.45%, whereas for BP, the carbon concentration is 77.43%, hydrogen is 12.38%, nitrogen is 0.06%, and oxygen is 10.13%.
The quantity of CO2 resulting from the stoichiometric combustion reaction with air varied from 3.12 kg per kilogram of fuel when only Ke was used. When 10% BP was added, the value decreased to 3.09 kg; for 20% BP, it further reduced to 3.05 kg; and with 30% BP, it reached a lower value of 3.04 kg.
Combustion temperatures in front of the turbines increase with the increase in biodiesel concentration, in the idle regime, without endangering the engine integrity.
For regimes 2 and 3, the temperature in front of the turbine decreases with the increase in biodiesel concentration, and the fuel flow rate increases with the increase in biodiesel concentration. This is reflected in the increase in specific consumption. For regime 3, an increase in specific consumption was observed from S = 0.0264 kg/Nh when the turbo-engine operates only with Ke; for Ke + 10% BP, S = 0.0266 kg/Nh; for Ke + 20% BP, S = 0.0269 kg/Nh; and for Ke + 30% BP, S = 0.0275 kg/Nh.
The combustion efficiency and the thermal efficiency of the engine do not show significant variations between the kerosene and the other mixtures.
The adding of biodiesel within the blends drastically decreases the gaseous emissions obtained from the combustion process. This is due to the fact that, on the one hand BP brings more oxygen into the chemical formula and decreases the carbon content and, on the other hand, it improves the combustion process and thus the need for outside air decreases.
Regarding the SO2 concentration in gas emissions, there is a decrease in concentration for each regime with the increase in biodiesel concentration. Thus, in idle mode, the SO2 concentration for Ke was 197 [ppm], in regime 2, it was 123 [ppm], and in regime 3, it was 105 [ppm]. When 10% BP was added, for Ke, it was 90 [ppm] in regime 2 and 76 [ppm] in regime 3. When 20% BP was added, for Ke, it was 65 [ppm] in regime 2 and 62 [ppm] in regime 3. Finally, when 30% BP was added, for Ke, it was 62 [ppm] in regime 2, 51 [ppm] in regime 3, and 45 [ppm] in regime 3.
Regarding the CO concentration in gas emissions, there is a decrease in concentration for each regime with the increase in biodiesel concentration. Thus, in idle mode, the CO concentration for Ke was 4921 [ppm], in regime 2, it was 2731 [ppm], and in regime 3, it was 2697 [ppm]. When 10% BP was added, for Ke, it was 2422 [ppm] in regime 2 and 2396 [ppm] in regime 3. When 20% BP was added, for Ke, it was 2433 [ppm] in regime 2 and 2415 [ppm] in regime 3. Finally, when 30% BP was added, for Ke, it was 2394 [ppm] in regime 2, 2364 [ppm] in regime 3, and 2360 [ppm] in regime 3.
For the NOx concentrations, variations were not significant.
As future plans, we intend to extend our research to other types of biodiesels obtained from sustainable raw materials and also to study bio-kerosene.

Author Contributions

Conceptualization, R.M. and G.C.; methodology, R.M. and G.C.; validation, R.M. and G.C.; investigation, R.M.; data curation, R.M. and G.C.; writing—original draft preparation, R.M. and G.C.; writing—review and editing, R.M.; supervision, G.C. All authors have read and agreed to the published version of the manuscript.

Funding

This research received no external funding.

Data Availability Statement

The raw data supporting the conclusions of this article will be made available by the authors on request.

Acknowledgments

The authors would like to acknowledge INCDT COMOTI for administrative and technical support.

Conflicts of Interest

The authors declare no conflicts of interest.

References

  1. Bogdanov, D.; Gulagi, A.; Fasihi, M.; Breyer, C. Full energy sector transition towards 100% renewable energy supply: Integrating power, heat, transport and industry sectors including desalination. Appl. Energy 2021, 283, 116273. [Google Scholar] [CrossRef]
  2. Flightpath 2050 Europe’s Vision for Aviation Maintaining Global Leadership & Serving Society’s Needs Report of the High-Level Group on Aviation Research. Available online: https://www.arcs.aero/sites/default/files/downloads/Bericht_Flightpath_2050.pdf (accessed on 19 December 2019).
  3. Gonçalves, F.d.O.; Lopes, E.S.; Lopes, M.S.; Filho, R.M. Thorough evaluation of the available light-duty engine technologies to reduce greenhouse gases emissions in Brazil. J. Clean. Prod. 2022, 358, 132051. [Google Scholar] [CrossRef]
  4. Zhang, H.; Fang, Y.; Wang, M.; Appels, L.; Deng, Y. Prospects and perspectives foster enhanced research on bio-aviation fuels. J. Environ. Manag. 2020, 274, 111214. [Google Scholar] [CrossRef]
  5. Kandaramath Hari, T.; Yaakob, Z.; Binitha, N.N. Aviation Bio-fuel from Renewable Resources: Routes, Opportunities and Challenges. Renew. Sustain. Energy Rev. 2015, 42, 1234–1244. [Google Scholar] [CrossRef]
  6. Hemighaus, G.; Boval, T.; Bosley, C.; Organ, R.; Lind, J.; Brouette, R.; Thompson, T.; Lynch, J.; Jones, J. Alternative Jet Fuels: A Supplement to Chevron’s Aviation Fuels Technical Review; Chevron Corporation: San Ramon, CA, USA, 2006. [Google Scholar]
  7. Kubickova, I.; Kubicka, D. Utilization of Triglycerides and Related Feedstocks for Production of Clean Hydrocarbon Fuels and Petrochemicals: A Review. Waste Biomass Valorization 2010, 1, 293–308. [Google Scholar] [CrossRef]
  8. Tian, Z.; Zhen, X.; Wang, Y.; Liu, D.; Li, X. Comparative study on combustion and emission characteristics of methanol, ethanol and butanol fuel in TISI engine. Fuel 2020, 259, 116199. [Google Scholar] [CrossRef]
  9. Elfasakhany, A. State of Art of Using Biofuels in Spark Ignition Engines. Energies 2021, 14, 779. [Google Scholar] [CrossRef]
  10. Abdullah, M.N.; Yusop, A.F.; Mamat, R.; Hamidi, M.A.; Sudhakar, K.; Yusaf, T. Sustainable Biofuels from First Three Alcohol Families: A Critical Review. Energies 2023, 16, 648. [Google Scholar] [CrossRef]
  11. Jhang, S.-R.; Jhang, S.-R.; Lin, Y.-C.; Lin, Y.-C.; Chen, K.-S.; Chen, K.-S.; Lin, S.-L.; Lin, S.-L.; Batterman, S.; Batterman, S. Evaluation of fuel consumption, pollutant emissions and well-to-wheel GHGs assessment from a vehicle operation fueled with bioethanol, gasoline and hydrogen. Energy 2020, 209, 118436. [Google Scholar] [CrossRef]
  12. Krzemi’ Nski, A.; Ustrzycki, A. Effect of Ethanol Added to Diesel Fuel on the Range of Fuel Spray. Energies 2023, 16, 1768. [Google Scholar] [CrossRef]
  13. Osman, S.; Sapunaru, O.V.; Sterpu, A.E.; Chis, T.V.; I.Koncsag, C. Impact of Adding Bioethanol and Dimethyl Carbonate on Gasoline Properties. Energies 2023, 16, 1940. [Google Scholar] [CrossRef]
  14. Iliev, S. A Comparison of Ethanol, Methanol, and Butanol Blending with Gasoline and Its Effect on Engine Performance and Emissions Using Engine Simulation. Processes 2021, 9, 1322. [Google Scholar] [CrossRef]
  15. De Simio, L.; Gambino, M.; Iannaccone, S. Effect of ethanol content on thermal efficiency of a spark-ignition light-duty engine. ISRN Renew. Energy 2012, 2012, 219703. [Google Scholar] [CrossRef]
  16. Tibaquirá, J.E.; Huertas, J.I.; Ospina, S.; Quirama, L.F.; Niño, J.E. The effect of using ethanol-gasoline blends on the mechanical, energy and environmental performance of in-use vehicles. Energies 2018, 11, 221. [Google Scholar] [CrossRef]
  17. Turner, J.; Lewis, A.G.; Akehurst, S.; Brace, C.J.; Verhelst, S.; Vancoillie, J.; Sileghem, L.; Leach, F.; Edwards, P.P. Alcohol fuels for spark-ignition engines: Performance, efficiency and emission effects at mid to high blend rates for binary mixtures and pure components. Automob. Eng. 2018, 232, 36–56. [Google Scholar] [CrossRef]
  18. Newes, E.; Clark, C.M.; Vimmerstedt, L.; Peterson, S.; Burkholder, D.; Korotney, D.; Inman, D. Ethanol production in the United States: The roles of policy, price, and demand. Energy Policy 2022, 161, 112713. [Google Scholar] [CrossRef]
  19. De Oliveira, F.C.; Coelho, S.T. History, evolution, and environmental impact of biodiesel in Brazil: A Review. Renew. Sustain. Energy Rev. 2017, 75, 168–179. [Google Scholar] [CrossRef]
  20. Grahn, M.; Hansson, J. Prospects for domestic biofuels for transport in Sweden 2030 based on current production and future plans. Wiley Interdiscip. Rev. Energy Environ. 2015, 4, 290–306. [Google Scholar] [CrossRef]
  21. Agrisoma Biosciences Inc. Biojet Blend Fuels Transatlantic Flight. Biomass Magazine, 2018. Available online: http://biomassmagazine.com/articles/15596/biojet-blend-fuels-transatlantic-flight(accessed on 9 August 2022).
  22. Tracy Rucinski. United Airlines Targets 50 Percent Cut in Greenhouse Gas Emissions. 2018. Available online: https://www.reuters.com/article/us-ual-emissions-idUSKCN1LT32A (accessed on 9 August 2022).
  23. Chakraborty, D.; Kotoky, A. Oil from Seeds Helps Propel SpiceJet’s First. Bloomberg, 2018. Available online: https://www.bloomberg.com/news/articles/2018-08-27/india-s-spicejet-makes-maiden-flight-usingblended-bio-fuel(accessed on 9 August 2022).
  24. Sundararaj, R.H.; Kumar, R.D.; Raut, A.K.; Sekar, T.C.; Pandey, V.; Kushari, A.; Puri, S.K. Combustion and emission characteristics from biojet fuel blends in a gas turbine combustor. Energy 2019, 182, 689–705. [Google Scholar] [CrossRef]
  25. Suchocki, T.; Witanowski, Ł.; Lampart, P.; Kazimierski, P.; Januszewicz, K.; Gawron, B. Experimental investigation of performance and emission characteristics of a miniature gas turbine supplied by blends ofkerosene and waste tyre pyrolysis oil. Energy 2021, 215, 119125. [Google Scholar] [CrossRef]
  26. Cican, G.; Deaconu, M.; Mirea, R.; Ceatra, L.C.; Cretu, M. An Experimental Investigation to Use the Biodiesel Resulting from Recycled Sunflower Oil, and Sunflower Oil with Palm Oil as Fuels for Aviation Turbo-Engines. Int. J. Environ. Res. Public Health 2021, 18, 5189. [Google Scholar] [CrossRef]
  27. Cican, G.; Deaconu, M.; Mirea, R.; Cucuruz, A.T. Influence of Bioethanol Blends on Performances of a Micro Turbojet Engine. Rev. Chim. 2020, 71, 229–238. [Google Scholar] [CrossRef]
  28. Cican, G.; Crunteanu, D.E.; Mirea, R.; Ceatra, L.C.; Leventiu, C. Biodiesel from Recycled Sunflower and Palm Oil—A Sustainable Fuel for Microturbo-Engines Used in Airside Applications. Sustainability 2023, 15, 2079. [Google Scholar] [CrossRef]
  29. Cican, G.; Plesu, V.; Deaconu, M.; Toma, A.; Cretu, M. Performances and Emissions Evaluation of a Microturbojet Engine Running on Biodiesel Blends. ASME J. Energy Resour. Technol. 2019, 141, 072003. [Google Scholar] [CrossRef]
  30. Przysowa, R.; Gawron, B.; Białecki, T.; Łęgowik, A.; Merkisz, J.; Jasiński, R. Performance and Emissions of a Microturbine and Turbofan Powered by Alternative Fuels. Aerospace 2021, 8, 25. [Google Scholar] [CrossRef]
  31. Labeckas, G.; Slavinskas, S.; Laurinaitis, K. Effect of jet A-1/ethanol fuel blend on HCCI combustion and exhaust emissions. J. Energy Eng. 2018, 144, 04018047. [Google Scholar] [CrossRef]
  32. Shauck, M.E.; Tubbs, J.; Zanin, M.G. Certification of a Carburater Aircraft Engine on Ethanol Fuel. Available online: https://afdc.energy.gov/files/pdfs/2896.pdf (accessed on 18 September 2023).
  33. Litt, J.S.; Chin, J.C.; Liu, Y. Simulating the Use of Alternative Fuels in a Turbofan Engine; National Aeronautics and Space Administration; Glenn Research Center: Cleveland, OH, USA, 2013. [Google Scholar]
  34. Gawron, B.; Białecki, T.; Dzi˛egielewski, W.; Kaźmierczak, U. Performance and emission characteristic of miniature turbojet engine FED Jet A-1/alcohol blend. J. KONES 2016, 23, 123–130. [Google Scholar] [CrossRef]
  35. Mendez, C.J.; Parthasarathy, R.N.; Gollahalli, S.R. Performance and emission characteristics of butanol/Jet A blends in a gas turbine engine. Appl. Energy 2014, 118, 135–140. [Google Scholar] [CrossRef]
  36. Chen, L.; Zhang, Z.; Lu, Y.; Zhang, C.; Zhang, X.; Zhang, C.; Roskilly, A.P. Experimental study of the gaseous and particulate matter emissions from a gas turbine combustor burning butyl butyrate and ethanol blends. Appl. Energy 2017, 195, 693–701. [Google Scholar] [CrossRef]
  37. Cican, G.; Deaconu, M.; Mirea, R.; Ceatra, L.; Cretu, M.; Dobre, T. Investigating the Use of Recycled Pork Fat-Based Biodiesel in Aviation Turbo Engines. Processes 2020, 8, 1196. [Google Scholar] [CrossRef]
  38. SR EN ISO 3675/2003; Crude Petroleum and Liquid Petroleum Products—Laboratory Determination of Density—Hydrometer Method. ASRO: Bucharest, Romania, 2003.
  39. ASTM D92-05a; Standard Test Method for Flash and Fire Points by Cleveland Open Cup Tester. ASTM International: West Conshohocken, PA, USA, 2009.
  40. EN ISO 3104/2002; Petroleum Products. Transparent and Opaque Liquids. Determination of Kinematic Viscosity and Calculation of Dynamic Viscosity. ASRO: Bucharest, Romania, 2002.
  41. ASTM D240-17; Standard Test Method for Heat of Combustion of Liquid Hydrocarbon Fuels by Bomb Calorimeter. ASTM International: West Conshohocken, PA, USA, 2017.
  42. ASTM D5291-16; Standard Test Methods for Instrumental Determination of Carbon, Hydrogen, and Nitrogen in Petroleum Products and Lubricants. ASTM International: West Conshohocken, PA, USA, 2016.
  43. Jet Cat USA. Jet Cat Instruction Manual. U.S. Patent No. 6,216,440, 17 April 2001. [Google Scholar]
  44. Lois, A.L. Biodiesel and Biokerosenes: Production, Characterization, Soot & Pah Emissions. Ph.D. Thesis, Polytechnic University of Madrid, Madrid, Spain, 2015. [Google Scholar]
Figure 1. Fuel density measurement.
Inventions 09 00016 g001
Figure 2. Automatic Flash Point Tester Cleveland.
Inventions 09 00016 g002
Figure 3. Kinematic viscosity determination equipment.
Inventions 09 00016 g003
Figure 4. IKA WERKE C 2000 Calorimeter.
Inventions 09 00016 g004
Figure 5. FTIR Spectrum Oil Express Series 100, v 3.0 spectrometer.
Inventions 09 00016 g005
Figure 6. Engine setup for combustion experiments.
Inventions 09 00016 g006
Figure 7. The stand tests for gaseous emissions: (a) the placement of the probe for gaseous emissions and (b) MRU Vario Plus Analyzer.
Inventions 09 00016 g007
Figure 8. FTIR spectra of the blends (spectra of 100% BP-light green, spectra of 30% BP-purple, spectra of 20% BP-dark green, spectra of 10% BP-red, spectra of Ke-blue, spectra of jet-A-light blue).
Inventions 09 00016 g008
Figure 9. Rpm vs. time variation for starting procedure (until stable yield).
Inventions 09 00016 g009
Figure 10. Tcomb vs. rpm and blends for starting procedure.
Inventions 09 00016 g010
Figure 11. Qc (L/h) vs. rpm and blends for starting procedure.
Inventions 09 00016 g011
Figure 12. Tcomb vs. rpm during sudden acceleration and deceleration.
Inventions 09 00016 g012
Figure 13. Qc (L/h) vs. rpm during sudden acceleration and deceleration.
Inventions 09 00016 g013
Figure 14. F vs. rpm during sudden acceleration and deceleration.
Inventions 09 00016 g014
Figure 15. Variation of T3 (°C) depending on regime and blends.
Inventions 09 00016 g015
Figure 16. Variation of Qc [L/h] depending on the regime and blend.
Inventions 09 00016 g016
Figure 17. Variation in thrust F[N] depending on the regime and blend.
Inventions 09 00016 g017
Figure 18. CO concentration vs. regimes and blends.
Inventions 09 00016 g018
Figure 19. SO2 concentration vs. regimes and blends.
Inventions 09 00016 g019
Figure 20. NOx concentration vs. regimes and blends.
Inventions 09 00016 g020
Figure 21. Variations in specific consumption for all the tested fuel blends.
Inventions 09 00016 g021
Figure 22. Variation of the combustion efficiency for all the tested fuel blends for 3 regimes.
Inventions 09 00016 g022
Figure 23. Variation in the thermal efficiency for all the tested fuel blends for maximum regime.
Inventions 09 00016 g023
Table 1. Obtained results for the physical–chemical determinations.
SampleFlash Point
[°C]
Viscosity at 40 °C, [cSt]Density at 22 °C, [g/cm3]Low Calorific Value, [kJ/kg]Elemental Analysis, [%]
Ke42.31.390.81745.292C% = 85.17
H% = 13.31
N% = 0.07
O% = 1.45
Ke + 10% BP44.21.510.82344.403C% = 84.40
H% = 13.22
N% = 0.07
O% =2.32
Ke + 20% BP50.21.820.83043.67C% = 83.21
H% = 13.1
N% = 0.07
O% =3.62
Ke + 30% BP54.72.060.83641.99C% = 82.85
H% = 13.03
N% = 0.07
O% =4.05
100% BP1615.080.87539.323C% = 77.43
H% = 12.38
N% = 0.06
O% = 10.13
Table 2. Obtained values for 1 kg of fuel blend.
BlendMO [kg]Mair [kg]CO2 [kg]H2O [kg]
Ke3.3214.453.121.20
Ke + 10% BP3.2914.293.091.19
Ke + 20% BP3.2314.053.051.18
Ke + 30% BP3.2113.973.041.17
BP2.9512.852.841.11
Disclaimer/Publisher’s Note: The statements, opinions and data contained in all publications are solely those of the individual author(s) and contributor(s) and not of MDPI and/or the editor(s). MDPI and/or the editor(s) disclaim responsibility for any injury to people or property resulting from any ideas, methods, instructions or products referred to in the content.

