

Experimental Research on an Afterburner System Fueled with Hydrogen–Methane Mixtures
by
 , ,
, ,
Florin Gabriel Florean
*,
Andreea Mangra
,
Marius Enache
*,
Marius Deaconu
,
Razvan Ciobanu
and
Razvan Carlanescu
National Research and Development Institute for Gas Turbines COMOTI, 220D Iuliu Maniu, 061126 Bucharest, Romania
*
Authors to whom correspondence should be addressed.
Inventions 2024, 9(3), 46; https://doi.org/10.3390/inventions9030046
Submission received: 18 March 2024
/
Revised: 19 April 2024
/
Accepted: 22 April 2024
/
Published: 24 April 2024
(This article belongs to the Special Issue Thermodynamic and Technical Analysis for Sustainability (Volume 3))
Abstract
:A new afterburner installation is proposed, fueled with pure hydrogen (100%H2) or hydrogen–methane mixtures (60% H2 + 40% CH4, 80% H2 + 20% CH4) for use in cogeneration applications. Two prototypes (P1 and P2) with the same expansion angle (45 degrees) were developed and tested. P1 was manufactured by the classic method and P2 by additive manufacturing. Both prototypes were manufactured from Inconel 625. During the tests, analysis of flue gas (CO2, CO, and NO concentration), PIV measurements, and noise measurements were conducted. The flue gas analysis emphasizes that the behavior of the two tested prototypes was very similar. For all three fuels used, the CO2 concentration levels were slightly lower in the case of the additive-manufactured prototype P2. The CO concentration levels were significantly higher in the case of the additive-manufactured prototype P2 when 60% H2/40% CH4 and 80% H2/20% CH4 mixtures were used as fuel. When pure H2 was used as fuel, the measured data suggest that no additional CO was produced during the combustion process, and the level of CO was similar to that from the Garrett micro gas turbine in all five measuring points. The NO emissions gradually decreased as the percentage of H2 in the fuel mixture increased. The NO concentration was significantly lower in the case of the additive-manufactured prototype (P2) in comparison with the classic manufactured prototype (P1). Examining the data obtained from the PIV measurements of the flow within the mixing region shows that the highest axial velocity component value on the centerline was measured for the P1 prototype. The acoustic measurements showed that a higher H2 concentration led to a reduction in noise of approximately 1.5 dB for both afterburner prototypes. The outcomes reveal that the examined V-gutter flame holder prototype flow was smooth, without any perpendicular oscillations, without chaotic motions or turbulent oscillations to the flow direction, across all tested conditions, keeping constant thermal power.
1. Introduction
Since the mid-20th century, the world’s population has tripled in size, rising from about 2.5 billion in 1950 to around 8.1 billion in 2024 [1]. Taking this into account, the global energy demand is gradually increasing, resulting in an ever-increasing daily energy demand, which leads to environmental pollution. Hence, the pursuit of an environmentally friendly, dependable, and cost-efficient strategy for energy utilization is gaining heightened significance. Presently, combined heat and power (CHP) systems, capable of simultaneously generating electricity and heat, stand out as a focal point of research due to their exceptional energy efficiency. Nonetheless, a considerable number of CHP systems continue to depend on fossil fuels like oil and natural gas, contributing to significant environmental pollution and the release of greenhouse gases. Mixing hydrogen with hydrocarbon fuels expands the stable combustion range to leaner mixtures, thanks to the broader flammability limits of hydrogen. This leads to stable operation at lower temperatures within the combustion zone, consequently reducing the production of thermal nitrogen oxides (NOx). Combustion instabilities were investigated experimentally for hydrogen-rich combustion in a model afterburner installed at the end of a high-enthalpy wind tunnel [2]. The combustion instabilities were studied with the time-resolved measurements of near-infrared (NIR) emission from water molecules over 780 nm using a high-speed video camera. The transition behaviors of the instabilities were observed in the recurrence plots in detail, indicating that the flame–vortex interaction excited the fourth harmonic mode of thermoacoustic instability. Bluff-body-stabilized premixed flames have been a subject of significant technological interest in practical combustion devices. B. Wu et al. [3] performed numerical analyses to investigate the combustion dynamics in the wake of bluff bodies with DNS and LES. Velocity statistics, PLIF images of OH and CH2O, flame brush thickness, turbulent flame speed, and statistics of two-dimensional strain rates were compared against experimental data, achieving reasonably good agreement under stable burning conditions. The mechanism of hydrogen enrichment in stabilizing swirl/bluff-body CH4/air lean premixed flame is presented in that paper [4]. Large eddy simulation (LES) coupled with a thickened flame (TF) model was performed to resolve the turbulent reacting flow. PIV and OH-PLIF measurements were conducted to measure the planar velocity field and flame structure, respectively. It was found that a more robust flame was obtained and the flame brush tended to expand radially with the increase of hydrogen fraction. The flame structure [5] and lean blow-off (LBO) duration of unconfined premixed, vaporized fuel stabilized on a bluff-body burner during blow-off were investigated using OH∗ chemiluminescence, OH−, CH2O, and fuel-PLIF imaging. It was found that the flame typically extinguished first in the downstream region (near the stagnation point above the bluff body). Various types of air warmers for linked pipe testing of ramjet engines were evaluated in that paper [6]. The evaluation focused on flame-holding devices and bluff bodies for flame adjustment. The computational modelling of the combustion reaction employing the k-ε concept for turbulence in combustion as well as the eddy dissipation methodology for thermochemical modelling was completed successfully on an axisymmetric commercial combustor utilizing hydrogen as fuel. After comparing the parameters like temperature, pressure, and species mole fraction for all three cases, case 3 showed the most proficient flame-holding arrangement. The combustion characteristics of H2/CH4 fuelled with/without a multi-bluff-body setting are presented in that paper [7]. The findings highlight the interplay of fuel properties, bluff-body placement, and structural parameters in the burning process and energy conversion. Some comprehensive conclusions are that the insertion of a bluff body significantly influences the flow field and alters the distribution of temperature and OH radicals. The detailed chemical reaction mechanism of H2/O2 was used to numerically study the combustion characteristics of micro–combustors under three kinds of bluff body structures in that paper [8]. The results show that a recirculation zone was formed in the conventional bluff body (CBB) micro–combustor, while two symmetric recirculation zones were formed in the slotted bluff-body (SBB) micro-combustor and controllable slotted bluff-body (CSBB) micro-combustor. The premixed combustion of a lean hydrogen–air mixture was analyzed [9] to examine various properties and flame stabilization. A two-dimensional (2D) analysis of a microscale combustor was performed with various shapes of bluff bodies (e.g., circular and triangular) to characterize the combined effects of the bluff body, such as shape, size, and blockage ratio, on micro-combustors, playing a crucial role in enhancing flame stability, efficiency, and blow-out limit. The results demonstrated that when a wall blade was utilized as a bluff body, the greatest flame temperature occurred at an equivalence ratio of 0.5 and a low velocity of 10 m/s. Tangential stretching rate (TSR) analysis was carried [10] out using two-dimensional high-fidelity numerical simulations of bluff-body-stabilized lean premixed hydrogen flames in a square channel to examine the capabilities of different diagnostics, showing different flame dynamics, such as steadily stable, local extinction by asymmetric vortex shedding, convective blow-off, and lean blow-out conditions.
The effects of hydrogen addition on the forced response of H2/CH4 flames were analyzed in a dual-nozzle swirl-stabilized combustor in another study [11]. The flame transfer function (FTF) was used to compare the forced response of the flames. A decreasing tendency in the local maximum gain values as the hydrogen content increased, where the FTF gain had a local maximum gain, also shifted to higher frequencies. In terms of the FTF phase, hydrogen addition decreased the slope of the FTF phase. It was revealed that hydrogen addition significantly extended the lean-burn limit of the flame. An experimental study of hydrogen-enriched natural gas combustion in a radially staged DLE burner and an analysis of the effect of hydrogen addition on thermo-acoustic instability was presented in another work [12]. Numerical simulations of a hydrogen-enriched gas turbine combustor were conducted to obtain a comprehensive understanding of the effect of hydrogen enrichment on turbulent combustion. It was found that as hydrogen content increased to over 11%, the flame expanding angle increased quickly. Emissions sampled at the combustor rig outlet showed that NOx emission increased when the hydrogen content was higher than 11%. However, CO emission was not sensitive to the variation of hydrogen concentration. An investigation of a hydrogen-enriched gas turbine combustor and the effect of CH4/H2 syngas composition on the resulting flame structure and pressure oscillations occurring inside the combustor was performed [13]. The results showed that the flame structure was readily altered when changing the syngas composition; this strongly affected the flow field and therefore the pressure oscillations inside the combustor. When the hydrogen composition increased, the flame became shorter and thicker, and its effect on the outer recirculation zone was minimized. A bluff-body-stabilized CH4/H2/air flame was investigated through large eddy simulation (LES) using hydrogen ratios of up to 90% [14]. The results showed that under stable conditions, both the flame height and the inner/outer recirculation zone decreased with an increase in the hydrogen ratio, and the flame tended to attach to the bluff body more strongly. A preliminary analysis [15] of a lab-scale stabilized burner fuelled with a hydrogen–air mixture was conducted. CFD simulation was carried out to predict the thermodynamic properties and flame characteristics (i.e., time delay and heat release rate) of the mixtures in the hot regions. The CFD analysis of the hydrogen–air mixture showed a reduction in the recirculation zone near the bluff body. As a result, in the case of the H2–air mixture, the time delay decreased, and the heat release rate increased with respect to the CH4–air mixture. An experimental and numerical investigation was made into ultra-lean H2/air flames stabilized behind a cylindrical bluff body [16]. It was found that the flame displacement speed of flames stabilized beyond the lean flammability limit of a flat stretchless flame (𝜙 = 0.3) can be scaled with a relevant tubular flame displacement speed. Regarding lean limit blow-off for flames with a neck formation, such flames are quenched due to excessive local stretching. Wan et al. reviewed the recent progress made in flame stabilization methods for micro-combustors [17]. They investigated single-flame stabilization technologies including flame holders and pointed out that a bluff body is a classic flame-anchoring method that has been extensively employed in various industrial combustion devices. Hydrogen holds significant potential in gas turbine technology as part of the gradual transition toward full decarbonization of the combustion field. Stefanizzi et al. [18] conducted a review focusing on modern combustion strategies in gas turbines for aviation and power production. Their study emphasized specific elements concerning next-generation fuels, bluff body design, and combustion-induced instabilities such as thermoacoustic pressure oscillation, unsteady stabilization, and even flame extinction. The influence of the equivalence ratio on the azimuthal instabilities of an annular laboratory-scale burner fuelled by methane–hydrogen mixtures was presented in the paper [19]. The results showed that as the equivalence ratio dynamically increased, all cases were observed to feature a distinct modal trajectory, during the onset of high-amplitude instabilities. Strongly spinning counterclockwise modes were first excited before a dynamic transition to strongly spinning clockwise modes occurred. Two flame holders prototypes (P1 and P2) with same expansion angle (45 degrees) are developed and tested. The geometry of the model studied here starts from patent no RO128845B1 [20]. Based on the configuration presented in the patent a new geometry was developed capable to use as fuel blends of hydrogen/(60% H2 + 40% CH4, 80% H2 + 20% CH4) and pure hydrogen. The geometry design method and steps are presented elsewhere [21]. Previous studies [22] suggest that incorporating up to 20% hydrogen by volume is unlikely to introduce significant alterations to the risks already associated with natural gas delivery. This threshold of 20% is anticipated to be the point at which gas customers’ supply and usage will remain unaffected by the alteration in gas composition. This research aims to design, manufacture, and perform experiments on an afterburner system fueled with pure hydrogen, as well as hydrogen–methane mixtures (80% by volume and 60% by volume, respectively) in order to evaluate the flame stability. The research fits with the objectives and intelligent specializations defined in the current Romanian National Hydrogen Strategy and Action Plan 2023–2030 [23]: “New CCGT capacities” where CCGT capacities are planned to be deployed between 2022 and 2030, using hydrogen to comply with the maximum permissible CO2 emissions according to the European Union or for developing projects, and subsequently, based on confirmed economic results, industrial deployment for applications of hydrogen blended into with natural gas (at least 50% by volume hydrogen admixture) or 100% hydrogen, in natural gas combined-cycle power plants (CCGT) or cogeneration plants. The final goal is the possibility of integrating this system into a cogeneration plant.
2. Materials and Methods
2.1. Afterburner Geometry
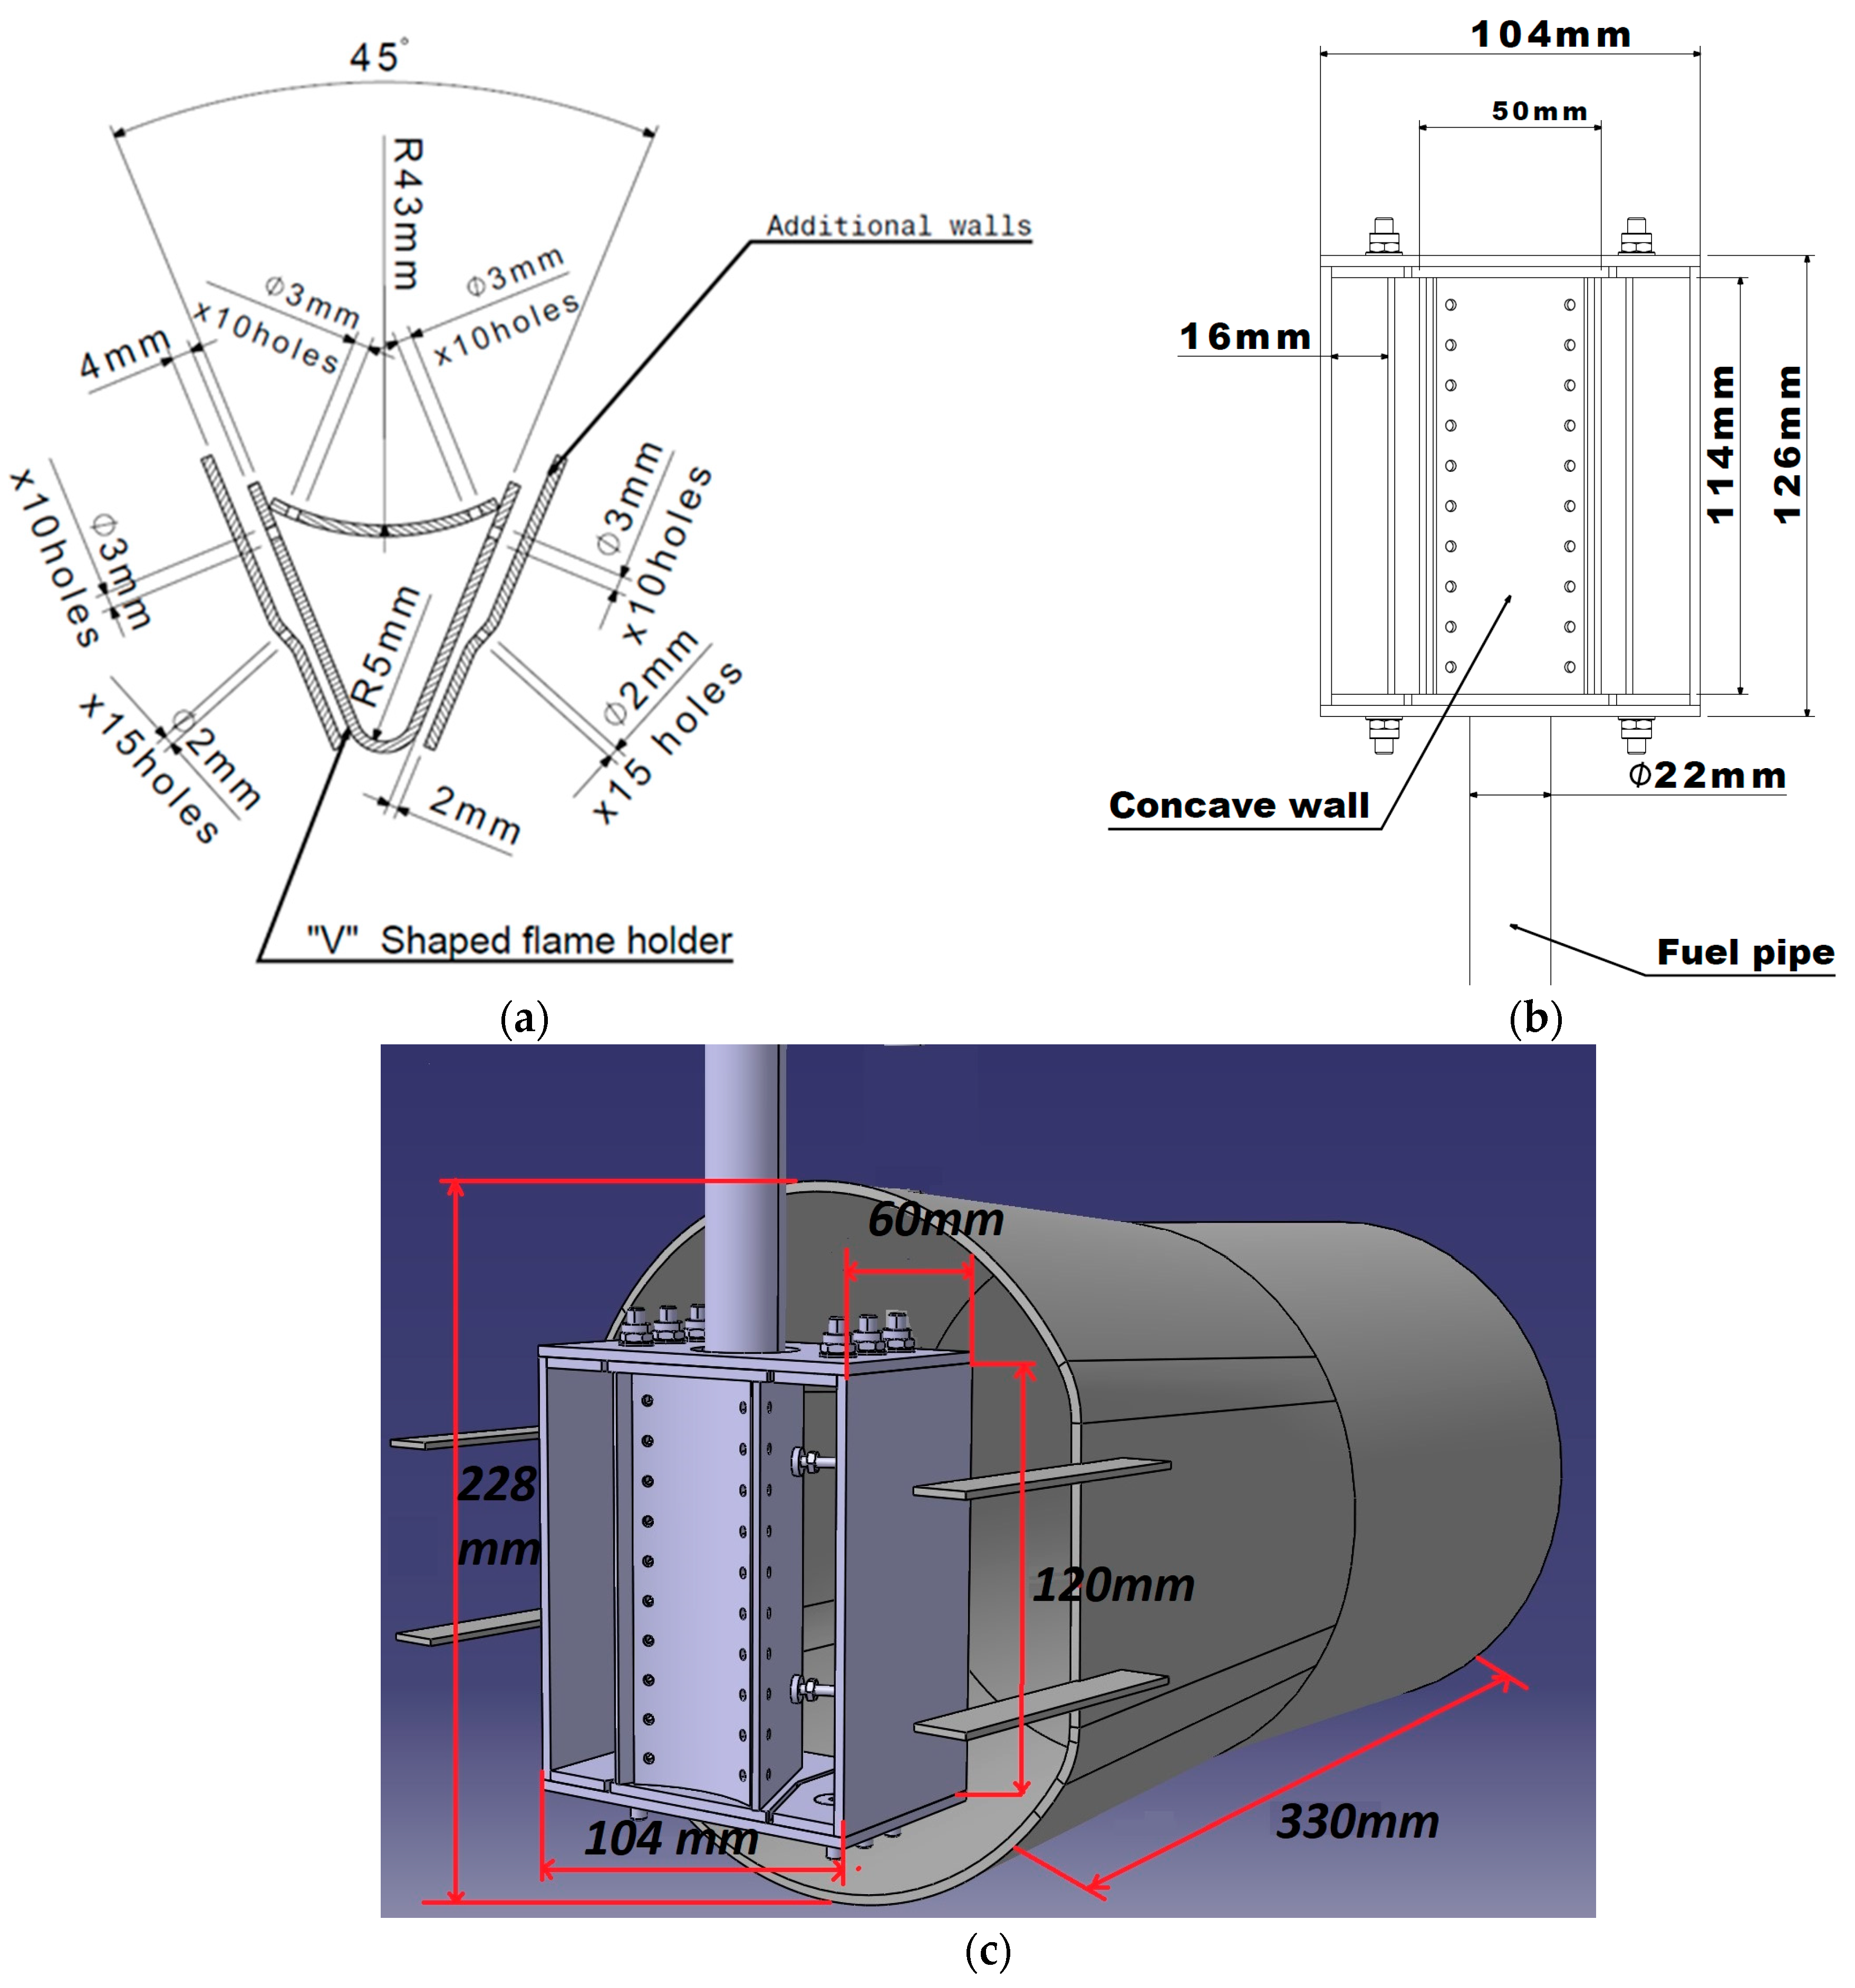
Two flame holder prototypes (P1 and P2) with the same expansion angle (45 degrees) were developed and tested. The geometry of the model studied here originated from patent no RO128845B1 [20]. Based on the configuration presented in the patent, a new geometry was developed capable of using as fuel blends of hydrogen/methane (60% H2/40% CH4, 80% H2/20% CH4) and pure hydrogen. The geometry design method and steps are presented in [21]. The afterburner system is composed of a casing and a flame holder assembly. The flame is stabilized by means of a V-shaped flame holder placed at a micro gas turbine outlet in the exhaust gas flow. Fuel is injected through the flame holder and ignited downstream of it, at a location where premixed conditions are reached. The general dimensions of the newly designed flame holder are given in Figure 1b,c. To the initial V-shaped flame holder a concave wall has been added, thus creating an enclosure. Through this enclosure, the fuel is delivered. The flame holders have 40 holes of Ø3 mm through which the fuel exits the enclosure and is injected into the gas flow; 10 holes are situated on each lateral wall of the V-shaped fame holder, and 20 holes are situated on the added concave wall. Additional walls have been placed on the sides of the flame stabilizer with the role of directing the flow of combustion gases provided by the gas turbine engine (Garrett) around the V geometry of the flame stabilizer. On each additional wall are 15 holes of Ø2 mm. The positions of the holes are shown in Figure 1a. The provided flow channel simultaneously allows the blending of combustion gases with fuel and, at the same time, cooling of the flame holder wall due to the increased speed of the flow.
2.2. Material Characterization
The material used for manufacturing both prototypes, shown in Figure 2, was INCONEL 625. The first prototype (P1) was manufactured using classic technological processes (cutting, bending, adjustment, dimensional control, welding). The second prototype (P2) was additively manufactured by selective laser melting (SLM) in a powder bed using LASERTEC 30 SLM, provided by DMG Mori, Germany. The main advantage of additive manufacturing is the possibility to manufacture the flame holder assembly during a single manufacturing operation, reducing the product’s manufacturing time.
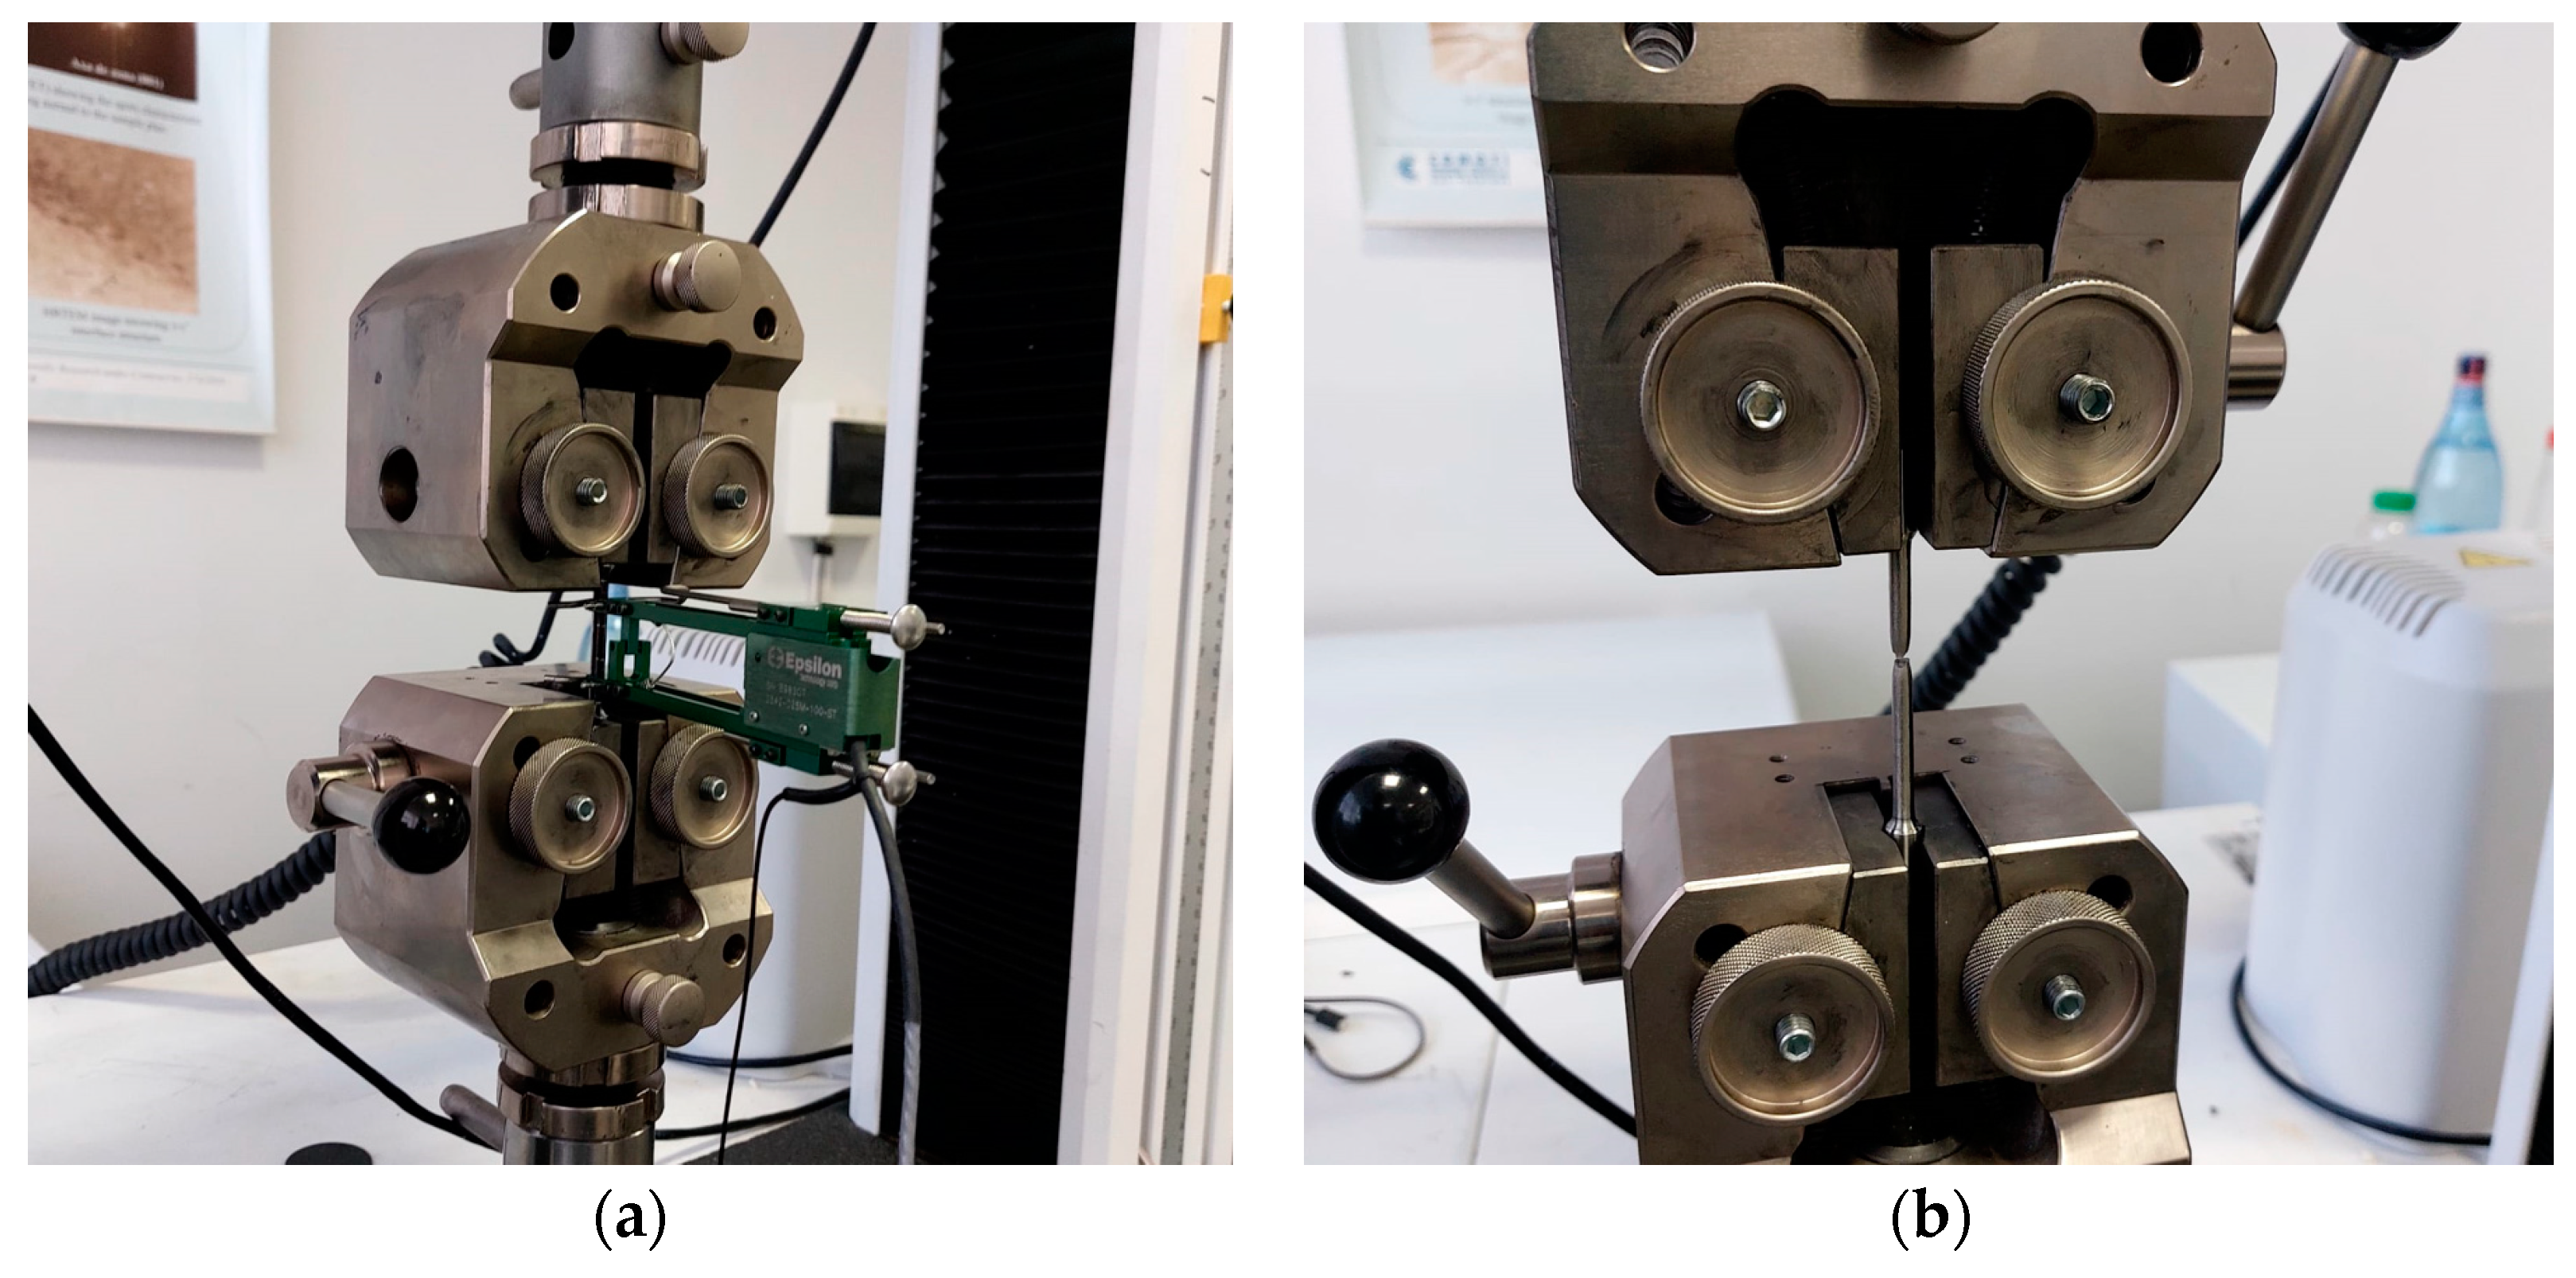
Tensile stress testing (Figure 3) of both prototypes was conducted at room temperature using an electromechanical universal testing machine, the Instron 3369 Dual Column Testing System, equipped with a 50 kN load cell and an Epsilon extensometer with a 25 mm gauge length. All tests were performed following the standard testing procedure. During tensile testing, the rate of straining for determining yield strength was set to 0.005 mm/mm/min. After determining the yield strength, the extensometer was removed, and the testing speed was set to 0.25 mm/mm/min when determining tensile strength, following ASTM E8/E8M guidelines. Surface roughness was determined using a Marsurf PS10 tester manufactured by Mahr GmbH Germany. The obtained results are presented in Table 1.
2.3. Experimental Setup
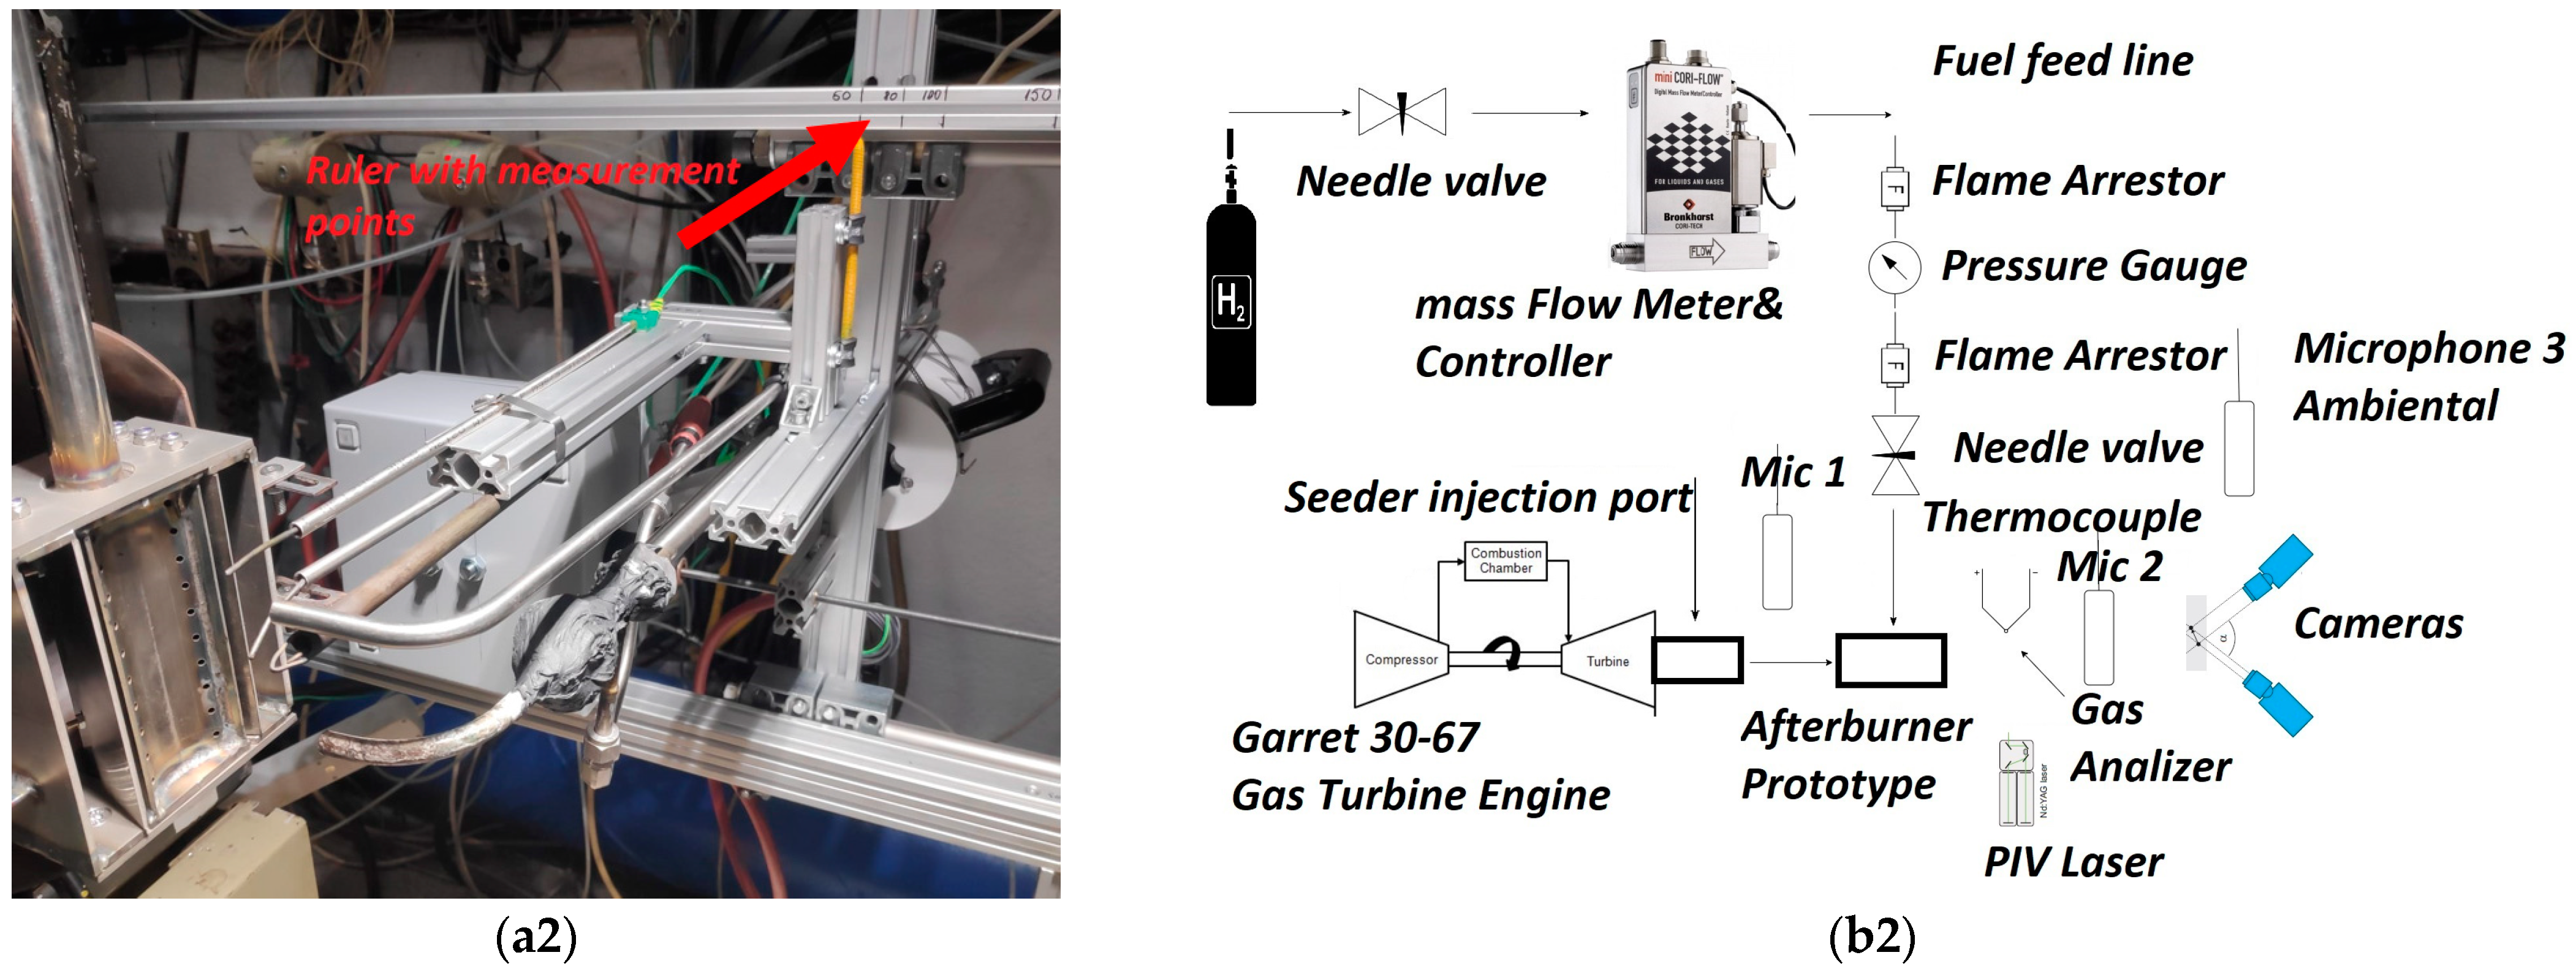
The testing facilities existent in COMOTI’s Combustion Chamber Laboratory were adapted in order to test the afterburner system designed by the authors and manufactured in INCDT COMOTI. The experimental setup and testing rig diagram are presented in Figure 4. The afterburner assembly was mounted downstream of a Garrett GTP 30–67 micro gas turbine engine, in the exhaust gas flow. The combustion tests were conducted at atmospheric pressure. During the whole testing campaign, the Garrett micro gas turbine was kept at the same functioning regime (engine speed: 52.800 ± 200 rpm (idle, no load); exhaust gas temperature at the afterburner inlet: 550 K; exhaust gas pressure at the afterburner inlet: 1.05 bar absolute). The functioning regime of the gas turbine was kept the same in order to identify whether there were eventual discrepancies between the prototypes in terms of combustion stability, flame length, and geometric functionality (especially, for the P2 prototype, whether it melted). The afterburner assembly was tested using 3 different fuels: (1) 60% H2/40% CH4 mixture, (2) 80% H2/20% CH4 mixture by volume, and (3) 100% H2. The hydrogen mixtures and pure hydrogen were ordered and received from the Linde Gas Romania special gases division. The mixture was bottled in the Linde Czech/Prague factory and delivered in 50 L and 200 bar pressure cylinders. All fuel mixtures had certificates of conformity. During the combustion tests, the concentrations of CO, CO2, and NO in the exhaust gas and the exhaust gas temperature downstream of the afterburner assembly were monitored. The gas concentrations were monitored using a gas analyzer system produced by HORIBA (model PG350), Kyoto, Japan, and the data were recorded at one-second intervals during each test stage. To limit the temperature of the gas at the gas analyzer’s entrance, for functional reasons, the sampling probe was modified in such a way as to ensure the cooling of the combustion gases through a gas–water heat exchanger (an internal pipe for the combustion gases and the outer jacket for circulating the combustion cooling water). The flue gas temperature was monitored with a thermocouple type K, Tmax = 1200 °C, accuracy ±1%, located in the center of the flame holder (Figure 4(a1,b1)). During the tests, for consistency, the gas temperature at the measuring point closest to the experimental model (60 mm) was kept constant at 1000 °C in order not to affect the integrity of the thermocouple.
The thermocouple was connected through a PLC (programmable logical controller) to the testing-line data acquisition system and the measured temperature was recorded at intervals of one second. Along the axial direction (Figure 4(a2,b2)) downstream of the flame holder, a ruler was mounted where the 5 sampling distances for the gas composition and temperature were marked. These 5 distances were set at 60 mm, 80 mm, 120 mm, 150 mm, and 200 mm from the flame holder. The movement of the probes to the sampling points was conducted using a threaded rod operated by an electric motor. For each recording, a time of approximately 120 s was allocated.
3. Results and Discussion
3.1. Comparative Analysis of Flue Gases
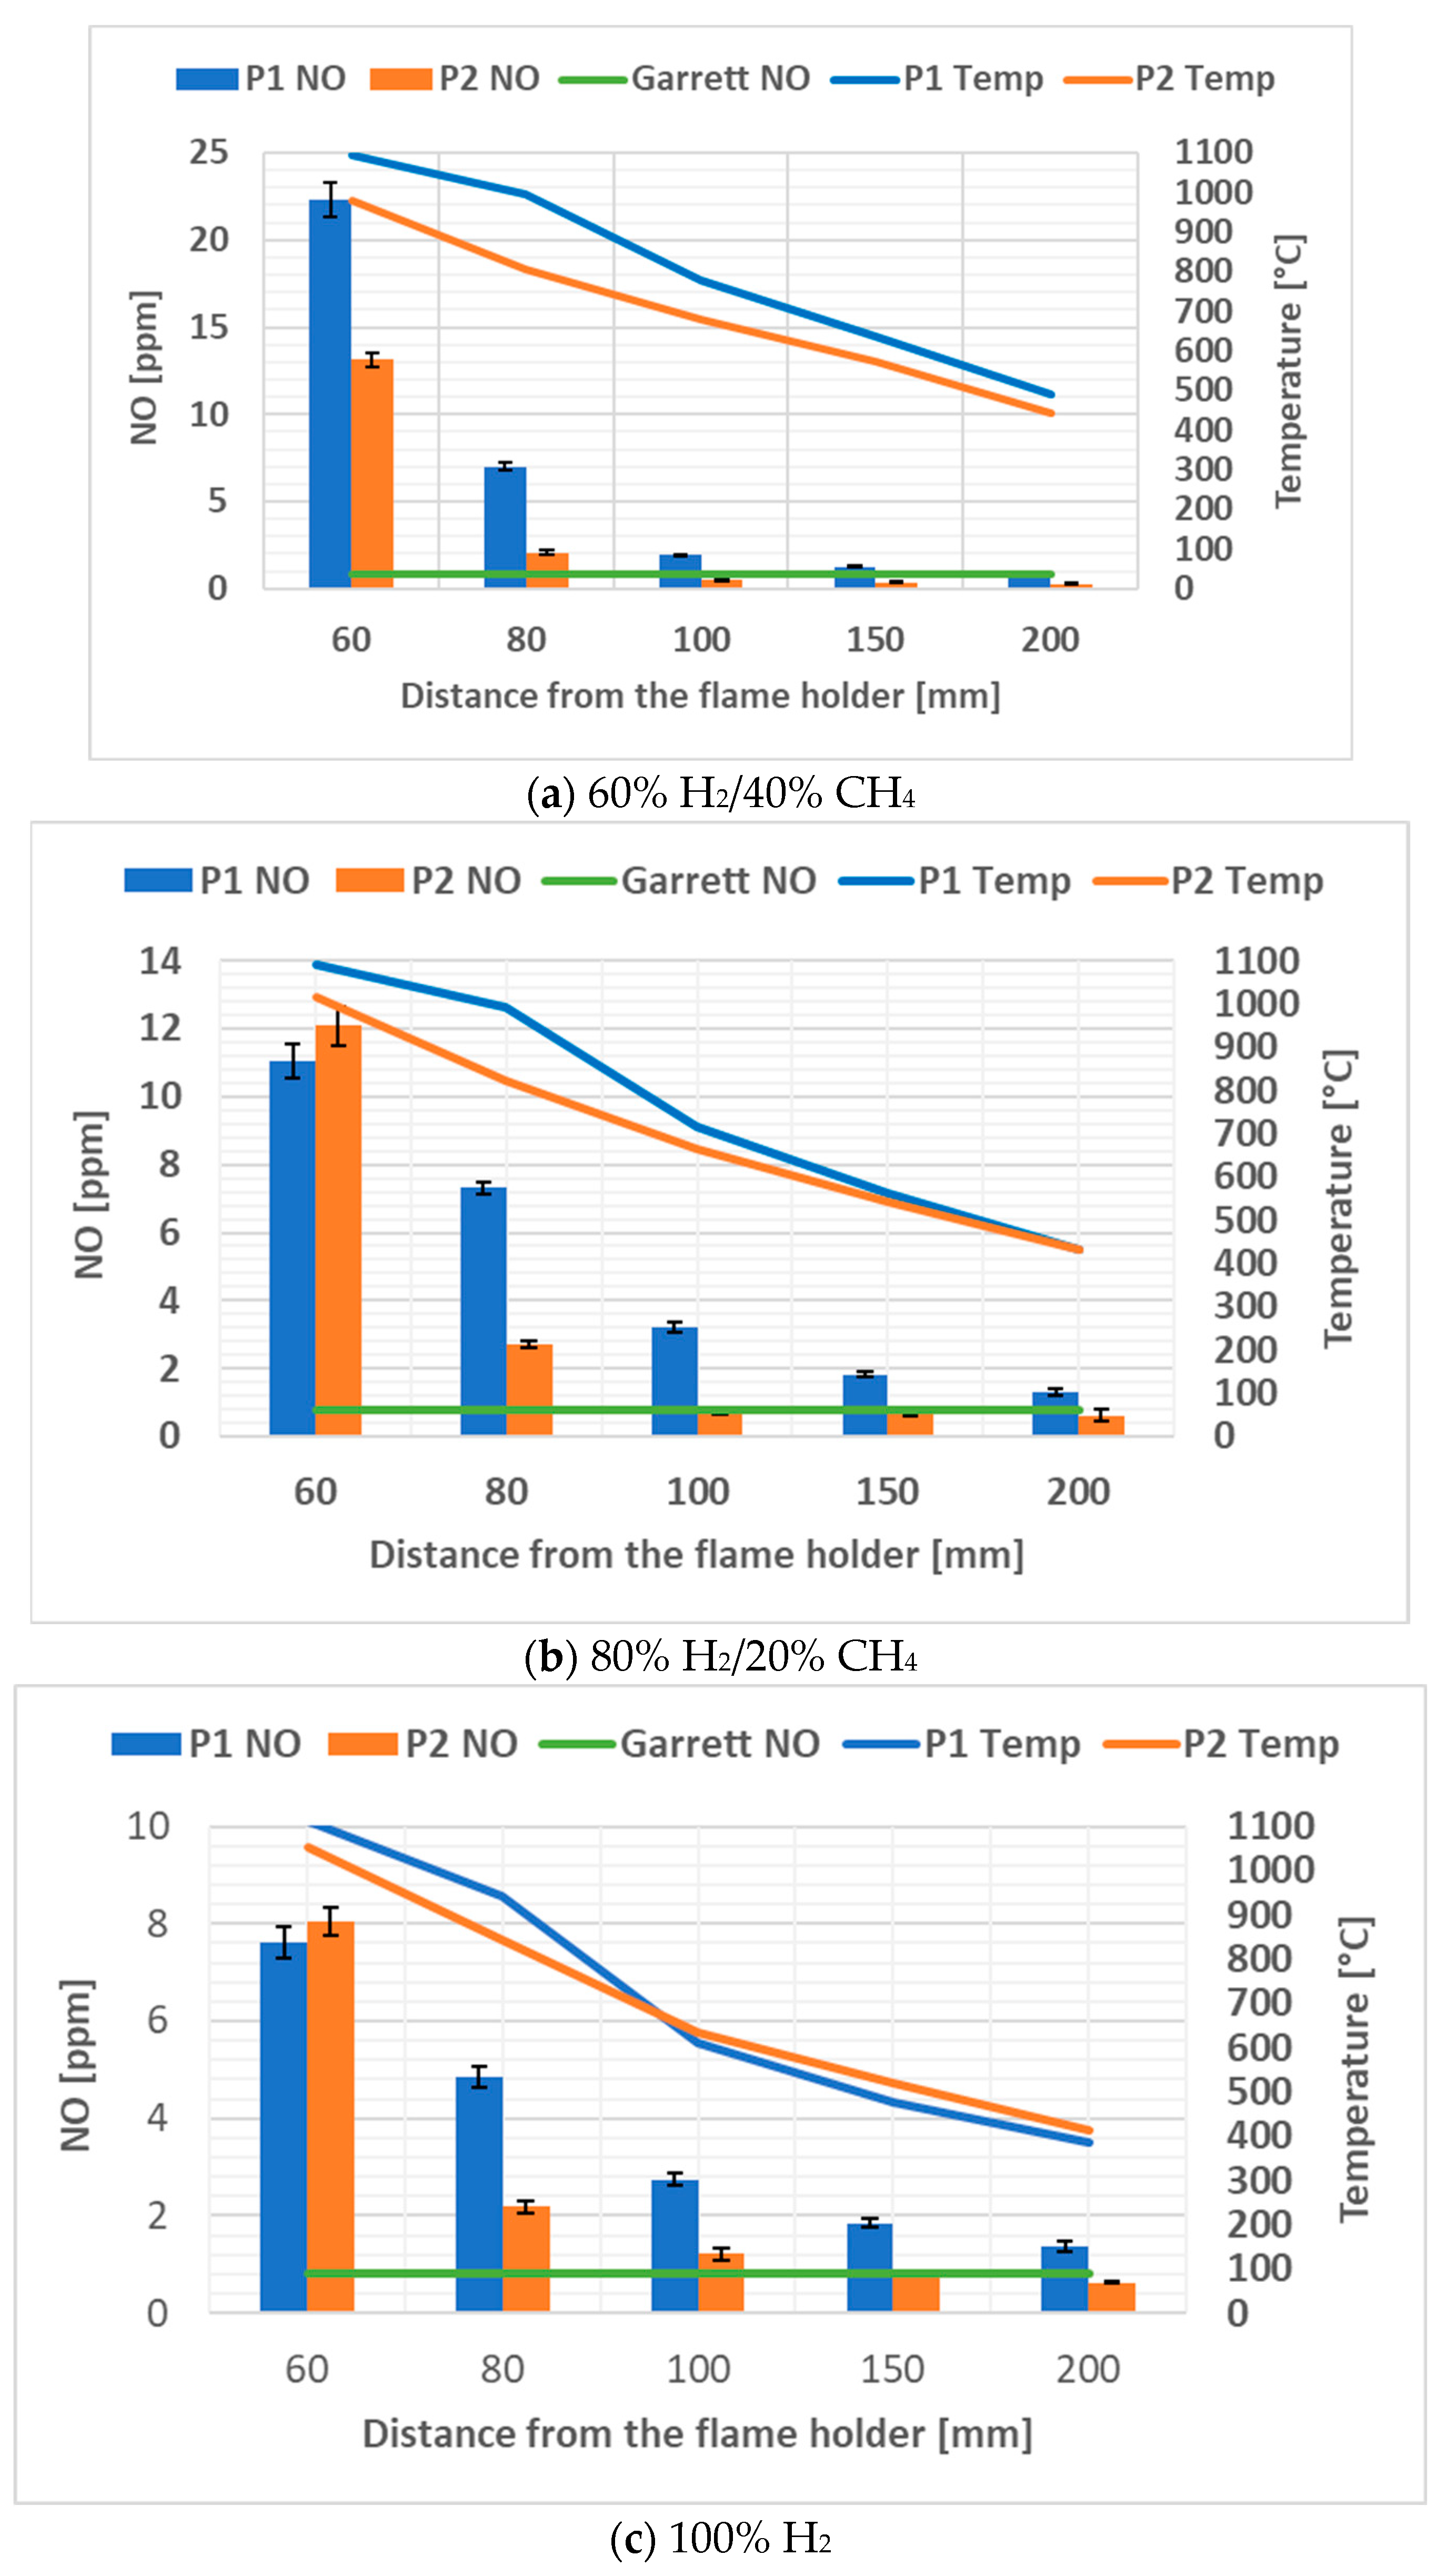
Figure 5a–c present the CO2 emissions levels and the temperature at the five measuring points downstream of the flame holder, for both tested prototypes and for all three fuel compositions considered. The green lines represent the Garrett gas turbine CO2 emission measured at a distance of 60 mm downstream of the flame holder without the afterburner installation started. The trend followed by the CO2 concentration is in good correlation with the behavior of the gas temperature, the concentration decreasing as the probe was moved further away from the flame holder and the temperature gets lower (Figure 5). For both CO2 emissions and temperature, this is an effect of the exhaust jet mixing with the clean, colder, surrounding air. The CO2 concentration was higher near the flame holder (the 60 mm and 80 mm measuring points), where the combustion process took place, and decreased, reaching at the 200 mm measuring point a level close to the CO2 level from the Garrett micro gas turbine. Assessing the graphs shown in Figure 5, Figure 6 and Figure 7 and taking into consideration the general methane burning equation:
it can be observed that the resulting CO2 emissions decreased as the H2 percentage increased in the fuel mixture. This is due to the fact that the smaller amount of CH4 in the mixture led to a decrease in the quantity of carbon in the resulting products. Moreover, as the H2 percentage increased, the temperature rose (also shown in Figure 7a–c), leading to NO formation, as this is mainly temperature-dependent but also dependent on the reaction’s efficiency. Thus, as the H2 percentage increases, the burning reaction is more efficient at lower temperatures. The behavior of the two tested prototypes was very similar. For all three fuel mixtures used, the CO2 concentration levels in the emissions were slightly lower in the case of the additive-manufactured prototype P2.
Figure 6a–c present the CO emissions and temperature at the five measuring points downstream of the flame holder for both tested prototypes and for all three fuel compositions considered. The green lines represent the Garrett gas turbine CO emission measured at a distance of 60 mm downstream of the flame holder without the afterburner installation started. When a combustion zone is operating fuel-rich, large amounts of CO are formed owing to the lack of sufficient oxygen to complete the reaction to CO2. If, however, the combustion zone mixture strength is stoichiometric or moderately fuel-lean, significant amounts of CO will also be present due to the dissociation of CO2. In principle, it should be possible to reduce the CO formed in the primary combustion zone through admission of additional air downstream to achieve a gradual reduction in burned gas temperature. However, once formed, CO is relatively resistant to oxidation, and in many practical systems, its oxidation is rate-determining with respect to the attainment of complete combustion. At high temperatures, the major reaction removing CO is CO + OH = CO2 + H. At lower temperatures, the reaction CO + H2O = CO2 + H2 is important as a means of removing CO. For all concentrations of the used mixture, the CO values increased, exceeding the initial values except for the case when the fuel used was pure hydrogen. This can be explained by CO2 dissociation and, unexpectedly, more residence time. By increasing the amount of H2 in the mixture and therefore reducing CH4, the formation rate of highly reactive OH radicals becomes greater and, therefore, the reactivity of the mixture is faster. As before, and for similar reasons, the CO levels decreased as the percentage of hydrogen in the fuel increased. From Figure 6a,b it can be observed that the CO levels were significantly higher in the case of the additive-manufactured prototype P2. This may have been caused by the higher surface roughness of prototype P2 in comparison with prototype P1. Surface roughness has a notable impact on fluid dynamics, primarily by augmenting fluid flow resistance and inducing turbulence. When a fluid traverses a surface, it undergoes frictional interactions owing to the molecular contact between the fluid and the surface. A sleek surface offers minimal hindrance to fluid motion, resulting in a laminar flow characterized by reduced turbulence. On the other hand, a rough surface intensifies the frictional forces experienced by the fluid, fostering a turbulent flow regime with heightened energy dissipation. Furthermore, surface roughness influences the boundary layer of a fluid, delineating the thin layer of fluid adjacent to the surface. A rough surface prompts the boundary layer to expand and become more turbulent, thereby amplifying drag forces and impeding flow efficiency. The influence of surface roughness on combustion and carbon monoxide (CO) emissions is multifaceted. Firstly, the increased surface area characteristic of rough surfaces provides more sites for combustion reactions to occur. Secondly, surface roughness can induce turbulence in combustion gases, which may both facilitate and disrupt combustion processes, affecting CO formation. Thirdly, irregularities in surface geometry can alter heat transfer rates during combustion, thereby influencing reaction kinetics and combustion efficiency, which in turn impact CO emissions. Finally, surface roughness can influence combustion dynamics, including flame propagation and stabilization, consequently affecting the likelihood of CO generation.
The results presented in Figure 6c suggest that when pure H2 was used as fuel, no additional CO was produced during the combustion process; the level of CO was similar to that coming from the Garrett micro gas turbine at all five measuring points. This is due to the absence of carbon atoms in the fuel and, thus, the production of CO as a by-product of the combustion process not being possible.
From a very simplistic point of view, hydrocarbon combustion can be characterized as a two-step process: (1) breakdown of fuel to CO and (2) oxidation of CO to CO2. The CO + OH → CO2 + H reaction is the key step in CO oxidation. As indicated in Figure 6a, the maximum concentration of CO recorded was situated 80 mm downstream of the flame holder. In Figure 6b, the corresponding peak can be observed at a distance of 60 mm. The shorter flame length observed at a higher hydrogen percentage in the fuel mixture is attributed to the heightened reactivity of hydrogen, leading to increased concentration of OH radicals within the flame. This heightened reactivity accelerates the combustion rates, thereby shifting the reaction zone toward the upstream vicinity of the flame holder, where the inlet fuel orifices are located. On the other hand, in the case of 100% H2, the only source of CO and CO2 was the Garrett gas turbine. Because of the locally increase of temperature due to the higher calorific power of the hydrogen gas (reported as a mass unit), the only mechanism involved in this situation is the dissociation of the CO2 into CO and O (CO2 ↔ CO + O). For hydrogen burning in air at 1 atmosphere, the Adiabatic Flame temperature is 2400 K. This leads to the temperature needed for this phenomenon to occur being obtained at several local points near to the flame holder surface.
Figure 7a–c present the NO emissions and temperature evolution in the case of both tested prototypes, for all three used fuels. The main sources of NO emissions from combustion are (a) Thermal NO, obtained through the oxidation of molecular nitrogen in the post-flame zone (Zeldovich mechanism), and (b) Prompt NO, obtained through the Fenimore mechanism in the flame zone.
Most of the proposed reaction schemes for thermal NO utilize the extended Zeldovich mechanism [24]:
O2 = 2O
N2 + O = NO + N
N + O2 = NO + O
N + OH = NO + H
NO formation is found to peak on the fuel-lean side of stoichiometric. This is a consequence of the competition between fuel and nitrogen for the available oxygen. Although the combustion temperature is higher on the slightly rich side of stoichiometric, the available oxygen is then consumed preferentially by the fuel.
For prompt NO, the initiating reaction is [24]:
N2 + CH = HCN + N
The balance of the prompt NO mechanism involves the oxidation of the HCN molecules and N atoms. Under lean-premixed conditions, the HCN oxidizes to NO mainly through a sequence of reactions involving HCN → CN → NCO → NO. The N atom reacts mainly according to the second Zeldovich reaction.
The results are in good correlation with the gas temperature behavior, with the NO levels diminishing as the temperature decreased. The high exhaust gas temperature favors the dissociation of the nitrogen molecules, which leads to the formation of nitrogen oxides. The NO levels were higher near the flame holder (the first two measuring points) due to the high combustion temperature. Then, as the probe moved further away from the flame holder, the temperature became lower and subsequently the NO concentration decreased, reaching at the 200 mm measuring point levels comparable with the NO concentration produced by the Garrett micro gas turbine. From Figure 7, it can also be observed that the NO emissions gradually decreased as the percentage of H2 in the fuel mixture increased. The NO concentration was significantly lower in the case of the additive-manufactured prototype (P2) in comparison with the classic manufactured prototype (P1), except for at the 60 mm measuring point.
3.2. PIV Experiments
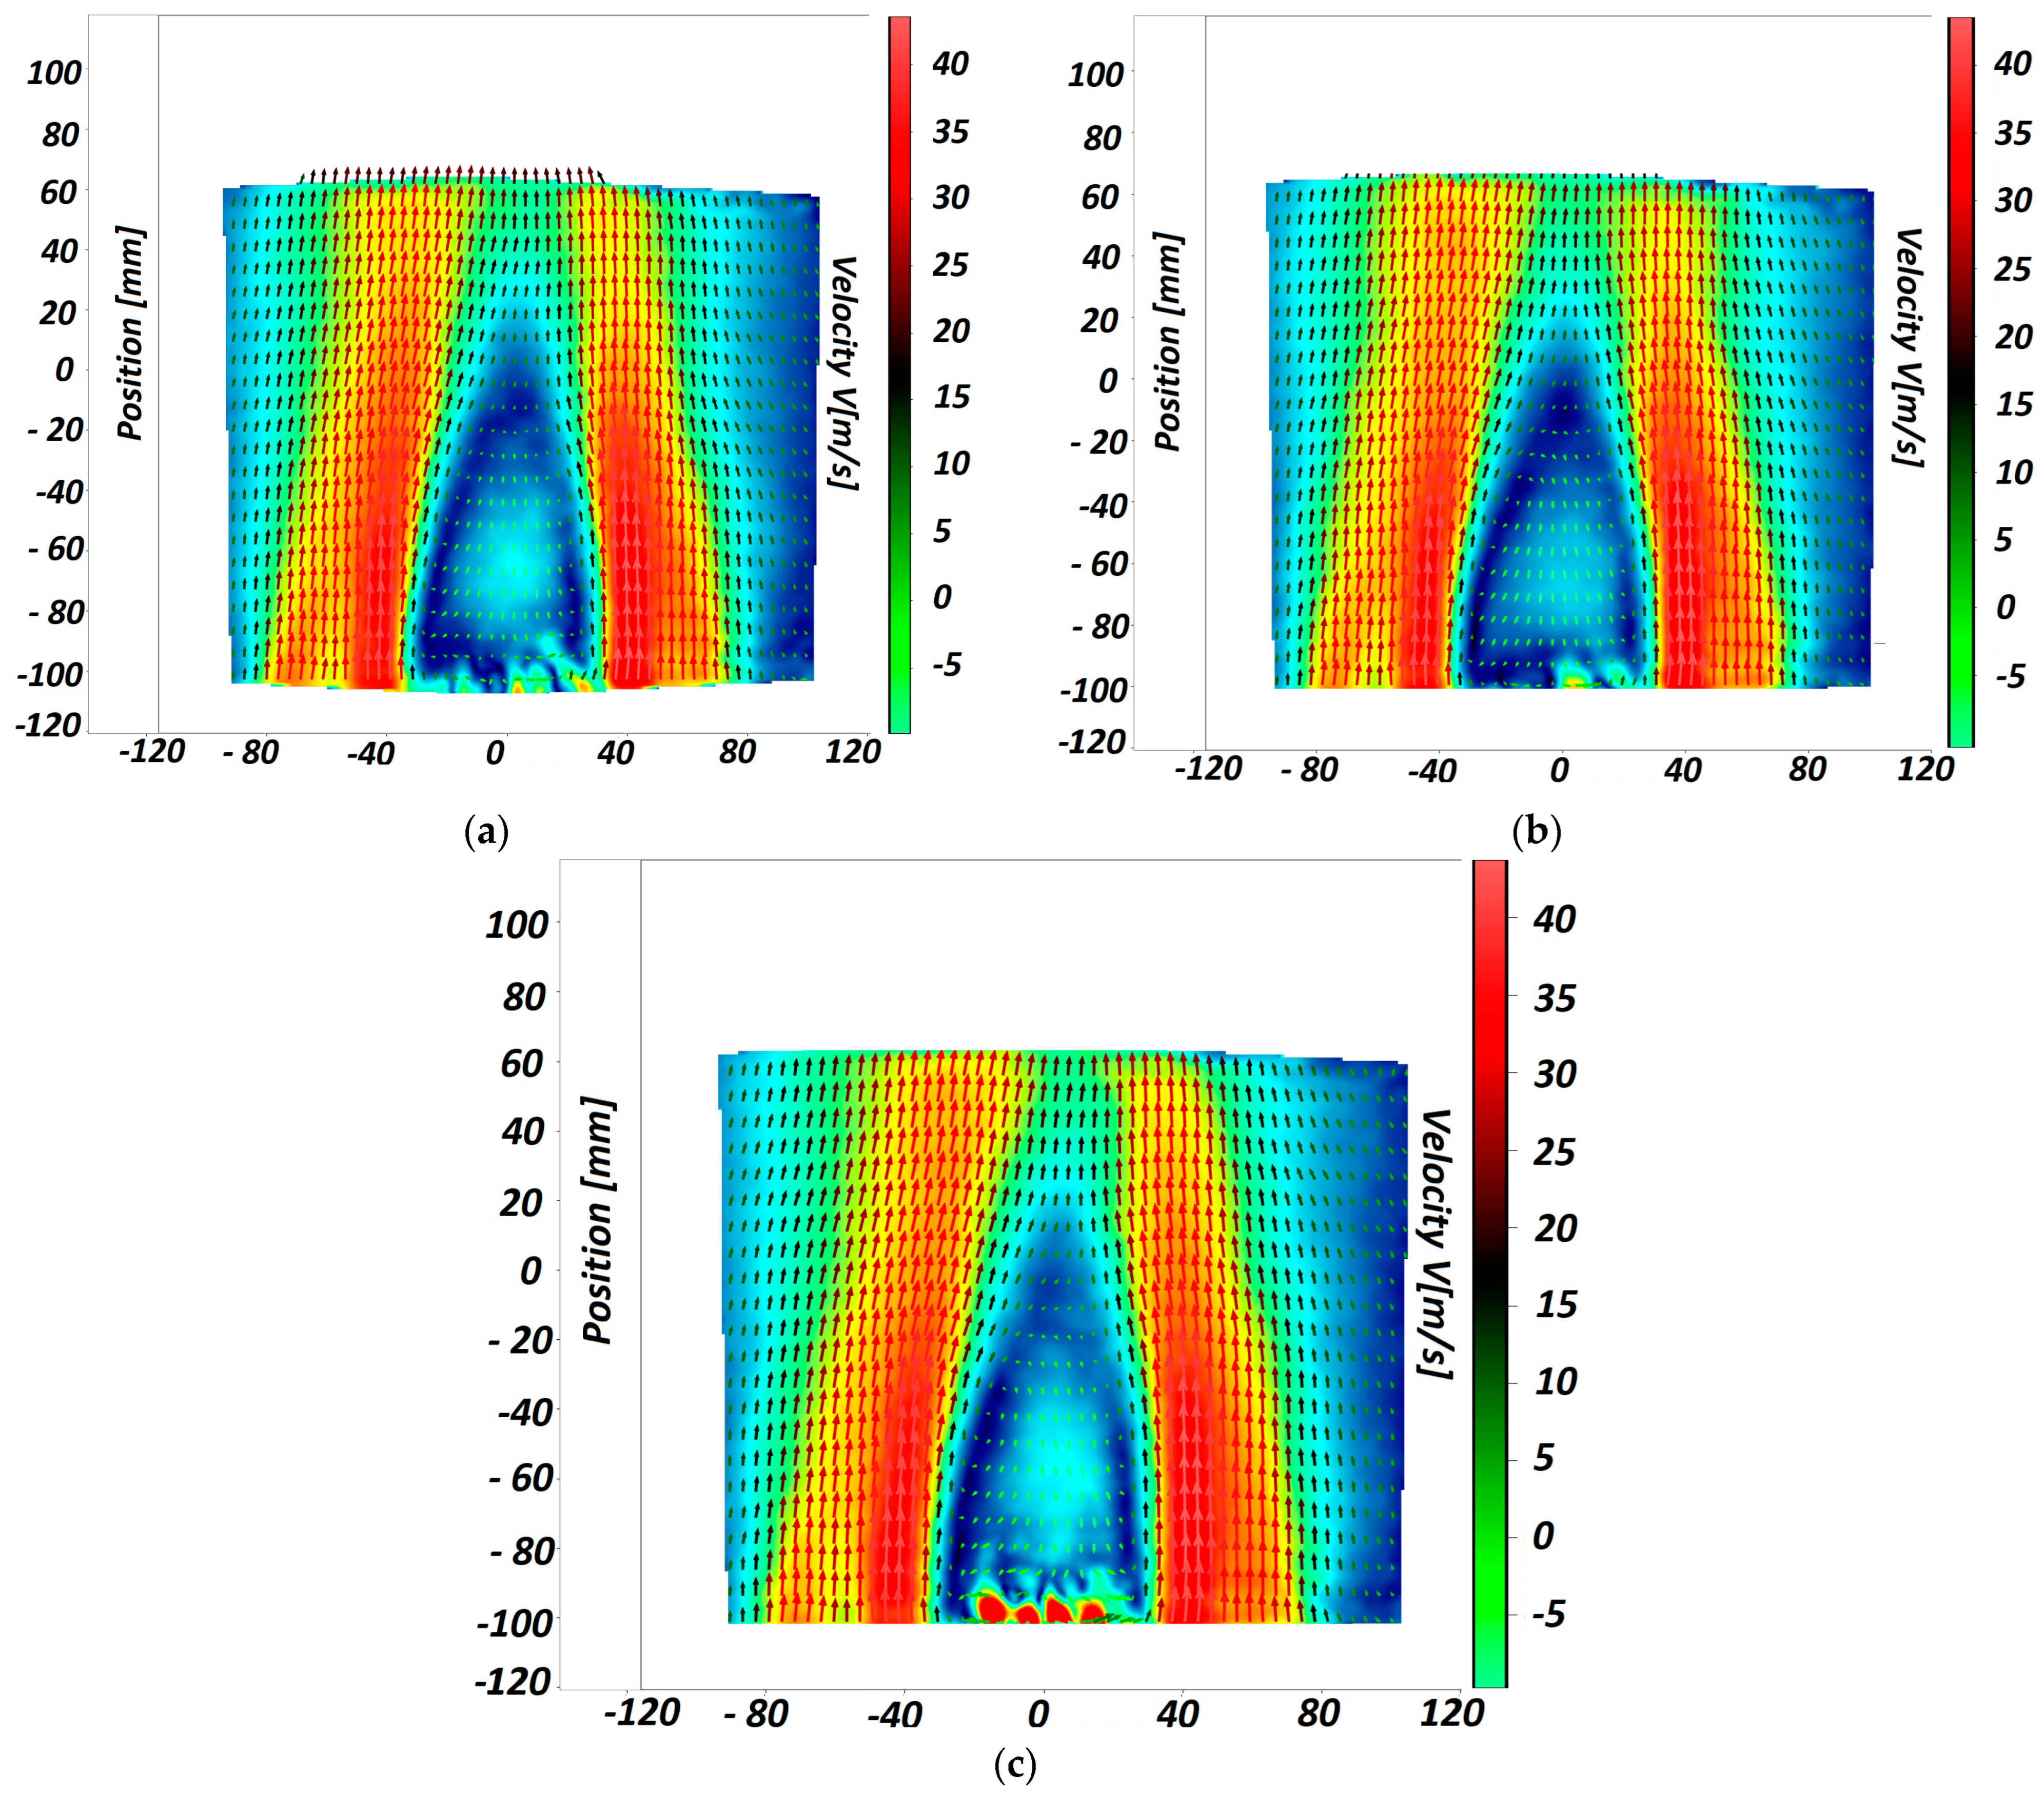
The velocity downstream of the afterburner flame stabilizer was measured by means of particle image velocimetry (Litron Nano L 200-15) with the following specifications: wavelength: 532 nm; pulse energy: 200 mJ;, pulse energy stability: 2%; pulse duration: 9 ns, repetition rate: 0–15 Hz. The experimental program presented here aimed at determining the instantaneous three-dimensional velocity field in the exhaust gas downstream of the post-combustion system. PIV assumes a so-called “seeding” of the working fluid, which consists of the insertion of fine solid particles into the flow, in this case, titanium oxide, used to track the fluid flow. The seeded flow was illuminated by an average-intensity laser beam, simultaneously emitted with the triggering of two fast cameras which recorded the image thus formed. Through the processing of these images, the displacement of the solid particles in the flow was determined, and, knowing the time interval between two snapshots, the velocity vector components were evaluated. The stereo PIV velocity measurements were carried out using maximum laser power, a delay time between the laser and the first camera triggering of 0.3689 ms, a time interval between the triggering of the two cameras of 15 µs, a camera exposure time of 100 µs for each camera, and a recording rate of 7.26 Hz. After the inlet thermodynamic parameters were achieved and stable, 10 sets of 100 double images were captured by the ICCD cameras for post-processing in order to provide the instantaneous velocity fields. The “x” direction was along the gas generator centerline, the y axis transversal to the jet direction and the z-axis in the direction of the flame holder span. The results of the experimental measurements are presented as the follows: the velocity components along these three spatial directions are denoted, respectively, as V (axial), U (transversal), and W (spanwise). The averaged velocity fields for prototype P1 and respective prototype P2 for each fuel used are presented in Figure 8 and Figure 9, respectively.
The axial velocity profiles accurately capture the recirculation region, in both shape and intensity, as well as the free stream values both in the near and the far field. Immediately downstream of the bluff body (Figure 10a–c), there is a negative velocity downstream, forming a recirculation region where the axial velocity reaches a negative peak of approximately 10 m/s at roughly 25 mm downstream of the flame holder trailing edge, and the length of the recirculation region spans about 60 mm. Beyond the reverse flow zone, the mean axial velocity increases in the upstream direction, gradually approaching the free stream value as the velocity deficit induced by the flame holder diminishes. Regarding the transversal (Figure 10d–f) and spanwise (Figure 10g–i) velocities, their values are small since the primary flow at the centerline is predominantly axial. The decline in the mean transversal velocity is probably attributable to the impact of ambient wind currents in the experimental surroundings. A significant spread in the spanwise mean velocity data can also be observed. It is important to note that the spanwise velocity is the most error-prone velocity due to the PIV measurement technology (being calculated not measured).
The mean velocity profiles along the transversal direction are presented in Figure 11 (at a distance L = 60). The mean axial velocity profile (Figure 11a–c) describes the recirculation region where values turn negative. As can be seen, downstream, the intensity and the recirculation region area decrease. This reduction is a result of the decreasing velocity deficit behind the bluff body, indicating the difference between the axial velocity immediately behind the obstacle and that of the stream flowing around it. As the axial location increases, the impact of the viscous forces becomes more pronounced, facilitating momentum transfer along the velocity gradient effect. Beyond the recirculation region, the free stream velocity, initially accelerated in the convergent section formed by the prismatic surfaces of the flame holder, gradually diminishes. Consequently, far downstream, the free stream velocity converges to a uniform value of approximately 40 m/s, highlighting the overall energy conservation. Moving away from the centerline, the mean axial velocity decreases as the exhaust jet mixes with the surrounding air. Furthermore, the expansion of the jet is amplified as a result of quiescent air being entrained into the jet. Further on, in Figure 11d–f are presented the transversal components for each fuel mixture. The magnitude of the mean transversal velocity was similar for all studied cases. The intensity of the flow was significantly lower than at the centerline due to the averaging process. The situation was similar for the spanwise velocity component profile, presented in Figure 11g–I, at the centerline and in the shear layer.
3.3. Noise Measurements
Noise measurements were carried out to assess and compare the noise generated by two afterburner prototypes while maintaining consistent operational parameters on the testing bench. Acoustic measurements were conducted using the Dewesoft multi-channel acquisition system Siriusi, enabling simultaneous recording on eight channels. The acquisition rate was set at 20 kHz, allowing spectral analysis up to 10 kHz, along with a high-pass filter at 10 Hz, effectively filtering out all frequencies below 10 Hz. Post-processing involved performing FFT analysis on the raw acoustic signals (using a Hanning window with a spectral line resolution of 2048 or df = 4.88 Hz and an overlap of 66.7%) and calculating the overall noise value for each measurement point. To perform the measurements, three 40 AQ microphones were installed. The acoustic sound pressure signals were captured using a ½ 40 AQ microphone produced by G.R.A.S., Holte, Denmark. This highly precise condenser microphone adheres to IEC 61094-4 standards, designed for precise sound measurements in random, diffuse, and reverberant sound environments. Engineered for durability and reliability, it can measure sound pressure levels from 3.15 Hz to 16 kHz, reaching a maximum of 148 dB.
Each 40 AQ microphone had undergone individual factory calibration and came with a calibration chart specifying its unique open-circuit sensitivity and pressure frequency response. Tailored for accurate sound level measurements in random (diffuse) sound fields, such as those created by multiple sound sources or reflective surfaces, each 40 AQ was mounted on a GRAS ½-inch Preamplifier Type 26 CA with a frequency range of 2 Hz–200 kHz. The entire measurement setup was calibrated using a Sound Calibrator Type 42 AB, manufactured by G.R.A.S., Holte, Denmark. This type of calibrator generates a sound pressure level of 114 dB (re. 20 μPa) ± 0.2 dB at 1 kHz, meeting the IEC 942 (1988) Class 1 standard. The raw signals were then processed using the commercial software Dewesoft (Version: 2024.1, RELEASE-240220- 64-bit) from Dewesoft, Slovenia.
Microphone 1 was installed to record the noise generated upstream of the afterburner at a distance of 0.08 m. Microphone 2 was installed in order to record the noise downstream of the flame holder (where the combustion took place) at five specific points along the length of the flame (60 mm, 80 mm, 120 mm, 150 mm, 200 mm). Microphone 3 was placed near the exhaust section, at a distance of 0.7 m from the afterburner in order to record the far-field acoustic field, the acoustic field that includes all acoustic sources. Throughout the signal-processing phase, logarithmic averaging of the global noise levels was performed to gain a comprehensive overview of the noise variation produced by each configuration or different concentrations of H2 mixed with methane gas. This approach of spectra averaging follows the principles outlined in ISO 3744 [25].
where Lp is the average sound pressure level, n is the number of microphones, Li is the sound pressure level in dB. Owing to significant noise fluctuations in the five positions of Microphone 2, the noise values were averaged to derive a single representative value.
The measured noise values for the P1 and P2 afterburner prototypes for each concentration of H2 and microphone are illustrated in Figure 12.
In Figure 12a, it can be observed that the noise levels in microphone 1 varied with the H2 concentration. An increase in concentration led to a reduction of approximately 1.5 dB for both afterburners, with P2 obtaining higher noise values except at 60% concentration.
Figure 12b indicates that the variation in H2 concentration did not result in noise variation. Instead, the difference between P2 and P1 became more pronounced, reaching up to 2.5 dB.
The noise levels from the third microphone, as depicted in Figure 12c, followed a similar trend, with P2 obtaining higher values. Similar to microphone 1, a higher H2 concentration led to a reduction in noise.
Figure 12d summarizes the noise variation depending on the H2 concentration for both afterburners by averaging the noise values from each microphone. The graph illustrates that the P2 model had approximately 1.6 dB more than the P1. Additionally, it shows that increasing the H2 concentration tended to decrease the noise levels.
For a clearer investigation of the noise produced by hydrogen combustion at various concentrations and the noise generated by each burner, it was necessary to conduct a spectral analysis of the noise signals. This analysis revealed the frequencies or frequency domains where burner P1 produced less noise. Figure 13 displays the spectral analyses of the averaged signals presented in Figure 12d.
As depicted in Figure 12d, the noise differences between concentrations for each afterburner model were minimal. Consequently, the acoustic spectra closely resembled each other in terms of values.
It was observed that the noise reduction in model P1 compared with P2 occurred in the low-frequency range between 10 and 400 Hz, where the difference between P2 and P1 was up to 2.5 dB at a frequency of 100 Hz.
Considering that the micro gas turbine engine operated similarly in all tested configurations, with noise characterized as stationary, and the only variable parameter being the hydrogen concentration, Figure 13 highlights the spectral component of the noise produced by combustion in the previously specified frequency range. The increase in reaction efficiency may have been the main reason for the noise decrease, due to the fact that the burning reaction was more stable. The fact that the noise was higher for P2 is probably due to the manufacturing technique (additive manufacturing), which may produce a higher roughness than the other manufacturing solution.
4. Conclusions
A testing campaign was conducted in order to validate the proper functioning of a newly developed afterburner. Starting from a geometry of the afterburner presented in the patent [9] and previously developed and validated for use with natural gas as fuel, a new flame holder geometry was developed and tested. Two flame holder prototypes were manufactured, one through classic manufacturing techniques (P1) and one using additive manufacturing (P2). H2/CH4 mixtures and pure H2 were used as fuel. During the combustion tests, the concentrations of CO, CO2, and NO in the exhaust gas and the exhaust gas temperature after the afterburner assembly were monitored at five points downstream of the flame holder. The velocity downstream of the afterburner flame stabilizer was measured by means of particle image velocimetry. Noise measurements were also carried out to assess and compare the noise generated by the two afterburner prototypes while maintaining consistent operational parameters on the test bench.
The data gathered through experimental measurements show:
- A stable functioning of the afterburner assembly for all used fuels, in the case of both prototypes.
- The CO2 concentration became lower as the percentage of H2 in the fuel mixture increased. This was expected due to the fact that as the H2 percentage in the fuel increased, the presence of carbon atoms in the fuel diminished. Thus, less CO2 was produced as the fuel burned. The behavior of the two tested prototypes was very similar. For all three fuels used, the CO2 concentration levels were slightly lower in the case of the additive-manufactured prototype (P2);
- Similar to the CO2 concentration, the CO levels decreased as the percentage of H2 in the fuel increased. The CO levels were significantly higher in the case of the additive-manufactured prototype P2 when 60% H2/40% CH4 and 80% H2/20% CH4 mixtures were used as fuel. When pure H2 was used as fuel, the measured data suggest that no additional CO was produced during the combustion process; the level of CO was similar to that coming from the Garrett micro gas turbine at all five measuring points. This is due to the absence of carbon atoms in the fuel, thus the production of CO as a by-product of the combustion process not being possible.
- The NO emissions gradually decreased as the percentage of H2 in the fuel mixture increased. The NO concentration was significantly lower in the case of the additive-manufactured prototype P2 in comparison with the classic manufactured prototype P1, except for at the 60 mm measuring point.
- Examining the data obtained from PIV experimental measurements of the flow within the mixing region shows that the differences between the tested prototypes are marginal. The highest axial velocity component value on the centerline was measured for the P1 prototype. Downstream of the bluff body, a negative velocity was observed, creating a recirculation region where the axial velocity reached a nadir of approximately 10 m/s, located approximately 25 mm downstream of the flame holder’s trailing edge. The length of the recirculation region spanned about 60 mm. In the transversal direction, the axial velocity profile along the transversal direction was roughly parabolic for all the presented cases. For all cases, the central, high-velocity region of the flow expanded downstream, due to the spreading of the jet. The mean velocity profiles along the transversal direction at distance L = −60, indicate that the negative velocity region measured approximately 80 mm. Downstream, the velocity deficit caused by the flame holder diminished, with the axial gradient influenced by the rate of volumetric expansion due to chemical heat release.
- The acoustic measurements showed that a higher H2 concentration led to a reduction in noise of approximately 1.5 dB for both afterburner prototypes. Also, in the case of prototype P2, the noise level was slightly higher. The noise reduction of prototype P1 compared with prototype P2 occurred in the low-frequency range between 10 and 400 Hz, where the difference between P2 and P1 was up to 2.5 dB at a frequency of 100 Hz.
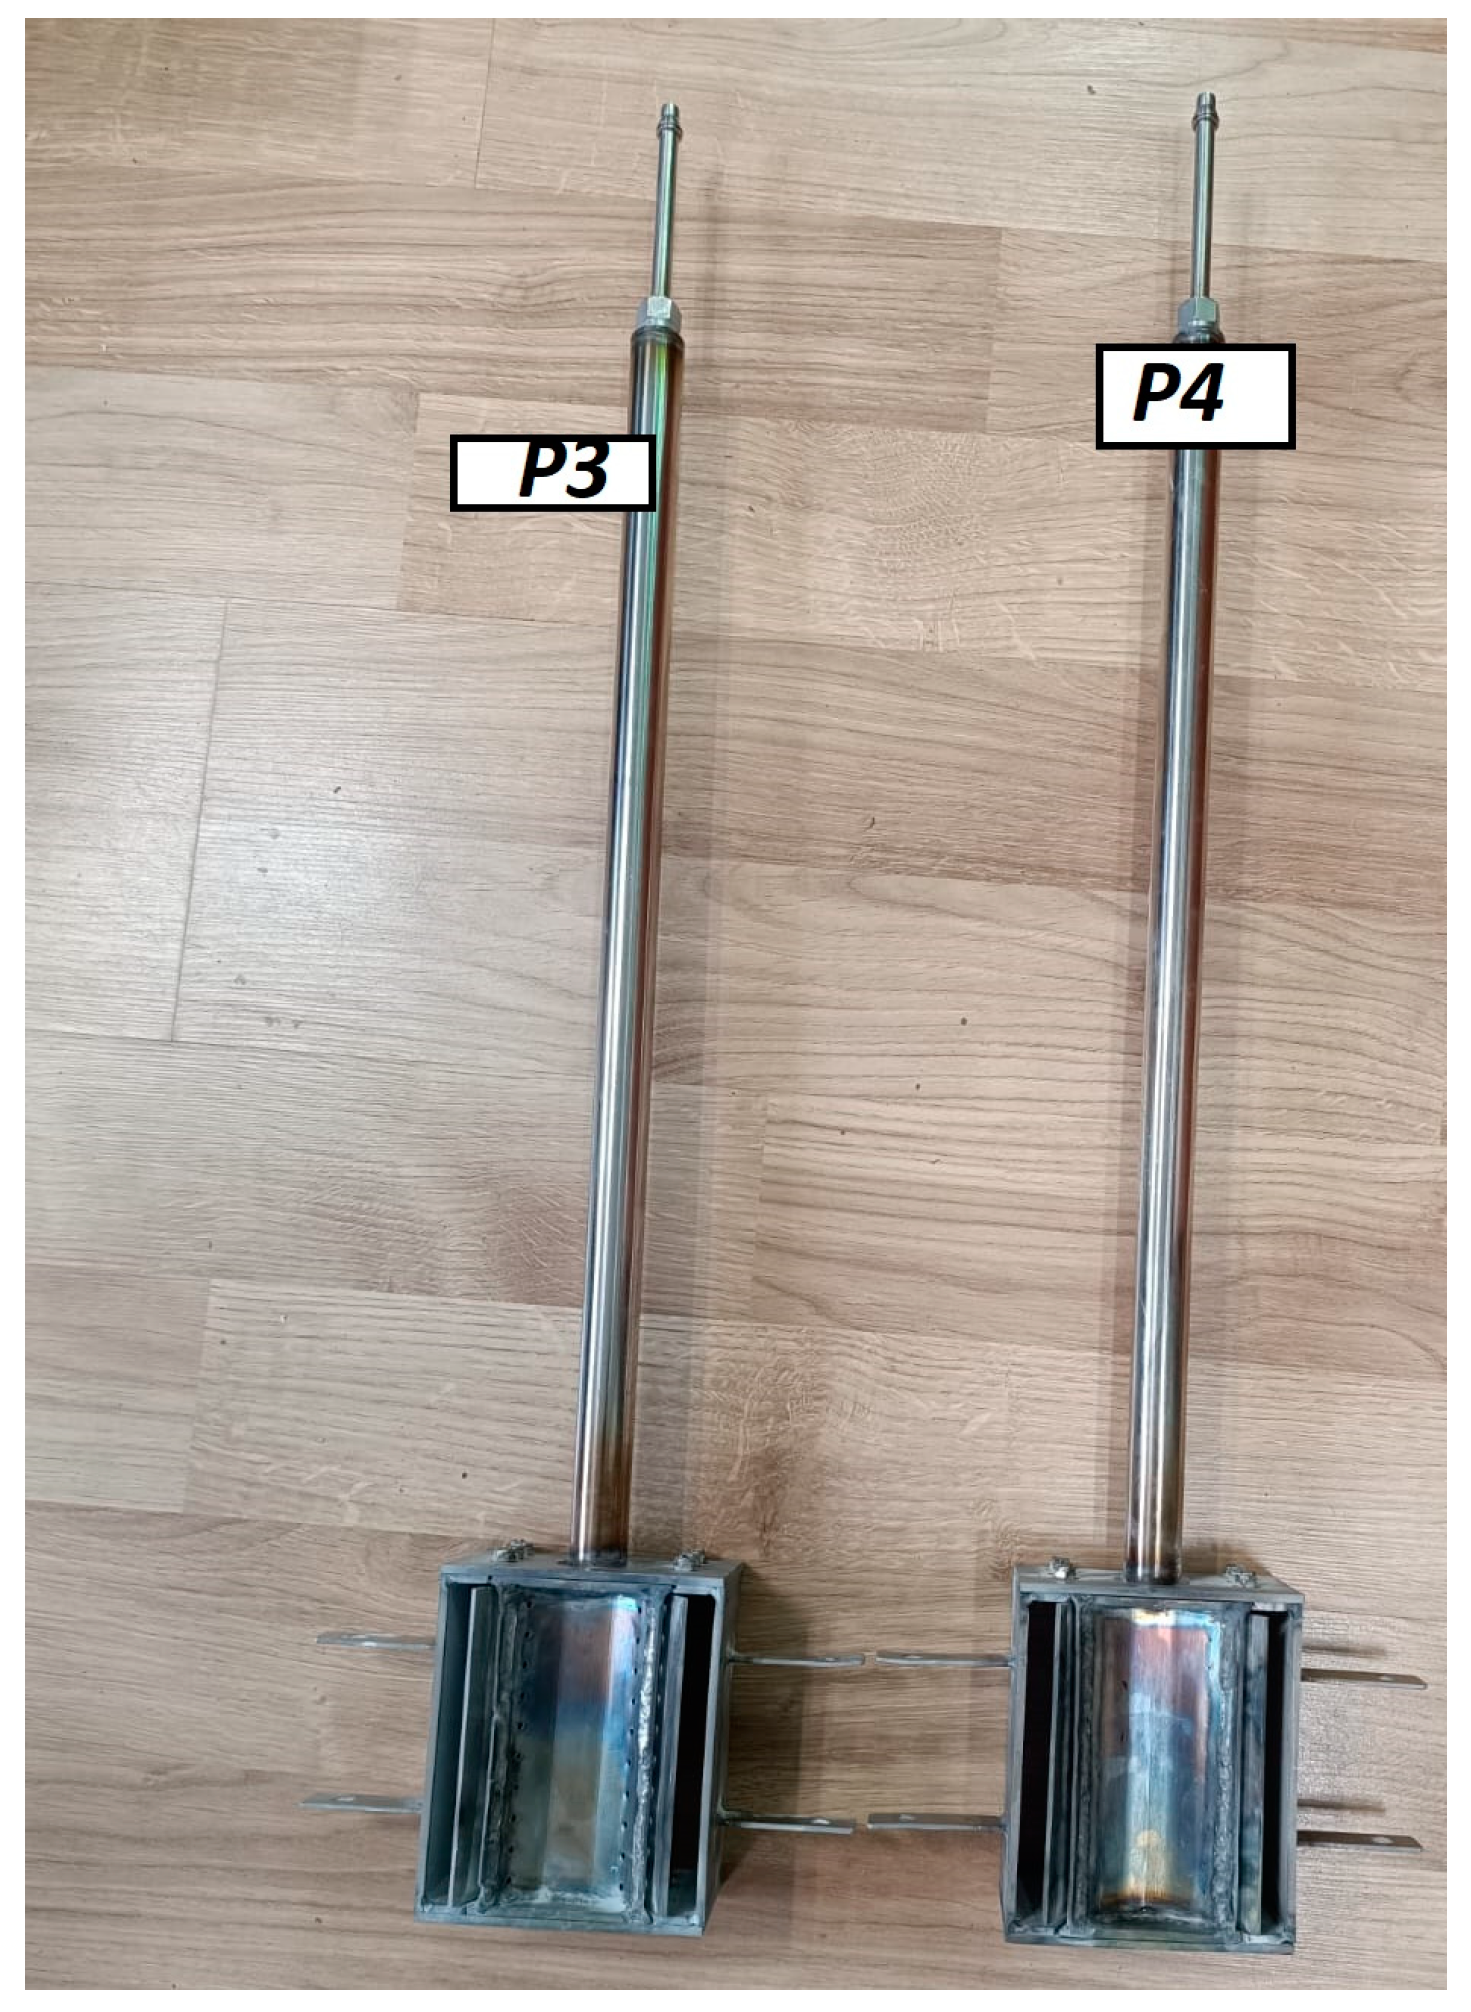
For further improvements (Figure 14) in the process of stable afterburner operation, the testing of two other flame holder prototypes (P3 and P4) is planned. Using the same experimental testing rig with same instrumentation and fuel blends, two new V-gutter flame holders with the same expansion angle (60 degrees) will be tested. The P3 flame holder has 40 holes of Ø1 mm diameter, while the P4 flame holder has 40 holes of Ø3 mm diameter through which the fuel is injected. The experimental models have already been manufactured. Thus, the experimental measurements will start as soon as possible. The results of this research will be published in future work.
Author Contributions
Conceptualization: F.G.F., A.M. and M.E.; methodology: F.G.F.; software: R.C. (Razvan Ciobanu) and R.C. (Razvan Carlanescu); investigation: F.G.F. and R.C. (Razvan Carlanescu); writing—review and editing: F.G.F. and A.M.; supervision, M.D. All authors have read and agreed to the published version of the manuscript.
Funding
Financial support for this research was provided by the Ministry of Research, Innovation, and Digitization through the following contract: 722PED/21.06.2022—Experimental and numerical research on afterburner fueled with premixed methane-hydrogen mixtures.
Data Availability Statement
The raw data supporting the conclusions of this article will be made available by the authors on request.
Acknowledgments
The authors would like to acknowledge INCDT COMOTI for administrative and technical support. They would also like to thank Porumbel Ionut, Valeriu Vilag, and Cristian Carlanescu for their help and advice during this research. The data presented and analyzed in this report were obtained with the help of COMOTI’s Research and Experiments Center in the field of Acoustic and Vibrations staff and facility. Also, for the experiments, the testing facilities of IOSIN TURBOEXP were used. This work was carried out through the Nucleu Program within the National Research Development and Innovation Plan 2022–2027, carried out with the support of the Ministry of Research, Innovation and Digitalization (MCID), project No. PN23.12.02.02.
Conflicts of Interest
The authors declare no conflicts of interest.
References
- Sustainable Development Goals. Available online: https://www.un.org/development/desa/pd/sites/www.un.org.development.desa.pd/files/undesa_pd_2022_global_population_growth.pdf (accessed on 10 March 2024).
- Nakaya, S.; Omi, K.; Okamoto, T.; Ikeda, Y.; Zhao, C.; Tsue, M.; Taguchi, H. Instability and mode transition analysis of a hydrogen-rich combustion in a model afterburner. Proc. Combust. Inst. 2020, 38, 5933–5942. [Google Scholar] [CrossRef]
- Wu, B.; Zhao, X.; Chowdhury, B.R.; Cetegen, B.M.; Xu, C.; Lu, T. A numerical investigation of the flame structure and blowoff characteristics of a bluff-body stabilized turbulent premixed flame. Combust. Flame 2019, 202, 376–393. [Google Scholar] [CrossRef]
- Guo, S.; Wang, J.; Zhang, W.; Zhang, M.; Huang, Z. Effect of hydrogen enrichment on swirl/bluff-body lean premixed flame stabilization. Int. J. Hydrogen Energy 2020, 45, 10906–10919. [Google Scholar] [CrossRef]
- Pathania, R.; Skiba, A.; Ciardiello, R.; Mastorakos, E. Blow-off mechanisms of turbulent premixed bluff-body stabilised flames operated with vapourised kerosene fuels. Proc. Combust. Inst. 2020, 38, 2957–2965. [Google Scholar] [CrossRef]
- Kore, R.; Patil, S.; Victor, V.; Suresh, S.; Bajaj, D.K.; Jain, S. CFD approach to predict the significance of the shape bluff body on flame stabilisation in lean premixed combustion of hydrogen-air mixtures. Mater. Today Proc. 2023, 72, 1181–1189. [Google Scholar] [CrossRef]
- Huang, Z.; Peng, Q.; Shi, Z.; Fu, G.; Xiao, H.; Huang, C. Numerical and experimental investigation of H2/CH4/Air combustion characteristics and thermal performance in the combustor with multi-bluff-body. Fuel 2024, 367, 131435. [Google Scholar] [CrossRef]
- Yan, Y.; Liu, Y.; Li, L.; Cui, Y.; Zhang, L.; Yang, Z.; Zhang, Z. Numerical comparison of H2/air catalytic combustion characteristic of micro–combustors with a conventional, slotted or controllable slotted bluff body. Energy 2019, 189, 116242. [Google Scholar] [CrossRef]
- Jha, V.; Velidi, G.; Emani, S. Optimization of flame stabilization methods in the premixed microcombustion of hydrogen–air mixture. Heat Transf. 2022, 51, 5896–5918. [Google Scholar] [CrossRef]
- Kim, Y.J.; Song, W.; Pérez, F.E.H.; Im, H.G. Explosive dynamics of bluff-body-stabilized lean premixed hydrogen flames at blow-off. Proc. Combust. Inst. 2021, 38, 2265–2274. [Google Scholar] [CrossRef]
- Kwak, S.; Choi, J.; Ahn, M.; Yoon, Y. Effects of hydrogen addition on the forced response of H2/CH4 flames in a dual-nozzle swirl-stabilized combustor. Int. J. Hydrogen Energy 2022, 47, 28139–28151. [Google Scholar] [CrossRef]
- Ge, B.; Ji, Y.; Zhang, Z.; Zang, S.; Tian, Y.; Yu, H.; Chen, M.; Jiao, G.; Zhang, D. Experiment study on the combustion performance of hydrogen-enriched natural gas in a DLE burner. Int. J. Hydrogen Energy 2019, 44, 14023–14031. [Google Scholar] [CrossRef]
- Nam, J.; Lee, Y.; Joo, S.; Yoon, Y.; Yoh, J.J. Numerical analysis of the effect of the hydrogen composition on a partially premixed gas turbine combustor. Int. J. Hydrogen Energy 2019, 44, 6278–6286. [Google Scholar] [CrossRef]
- Cheng, L.; Zhang, M.; Peng, S.; Wang, J.; Huang, Z. Large Eddy Simulation of the Effect of Hydrogen Ratio on the Flame Stabilization and Blow-Off Dynamics of a Lean CH4/H2/Air Bluff-Body Flame. Appl. Sci. 2024, 14, 1846. [Google Scholar] [CrossRef]
- Ceglie, V.; Stefanizzi, M.; Capurso, T.; Fornarelli, F.; Camporeale, S.M. Thermoacoustic Combustion Stability Analysis of a Bluff Body-Stabilized Burner Fueled by Methane–Air and Hydrogen–Air Mixtures. Energies 2023, 16, 3272. [Google Scholar] [CrossRef]
- Vance, F.H.; Shoshin, Y.; de Goey, P.; van Oijen, J. Flame Stabilization and Blow-Off of Ultra-Lean H2-Air Premixed Flames. Energies 2021, 14, 1977. [Google Scholar] [CrossRef]
- Wan, J.; Fan, A. Recent progress in flame stabilization technologies for combustion-based micro energy and power systems. Fuel 2020, 286, 119391. [Google Scholar] [CrossRef]
- Stefanizzi, M.; Capurso, T.; Filomeno, G.; Torresi, M.; Pascazio, G. Recent Combustion Strategies in Gas Turbines for Propulsion and Power Generation toward a Zero-Emissions Future: Fuels, Burners, and Combustion Techniques. Energies 2021, 14, 6694. [Google Scholar] [CrossRef]
- Ahn, B.; Indlekofer, T.; Dawson, J.; Worth, N. Transient Thermo-Acoustic Responses of Methane/Hydrogen Flames in a Pressurized Annular Combustor. J. Eng. Gas Turbines Power 2022, 144, 011018. [Google Scholar] [CrossRef]
- Florean, F.G.; Petcu, A.C.; Carlanescu, R.; Porumbel, I.; Sandu, C.; Carlanescu, C. “Instalaţie de Postcombustie, Multietajată în Skyd Turbomotor Autoventilat” [Buletinul Oficial de Propietate Industrial nr. 7/2016]. RO128845B1/2016. Available online: http://pub.osim.ro/publication-server/pdf-document?PN=RO128845%20RO%20128845&iDocId=8631&iepatch=.pdf (accessed on 28 March 2024).
- Florean, F.; Mangra, A.; Enache, M.; Carlanescu, R.; Kuncser, R. Design and numerical investigations of an afterburner system using methane-hydrogen blends. Int. J. Mod. Manuf. Technol. 2023, 15, 39–46. [Google Scholar] [CrossRef]
- RR1047 Injecting Hydrogen into the Gas Network—A Literature Search. Available online: https://www.hse.gov.uk/research/rrhtm/rr1047.htm (accessed on 28 March 2024).
- Romania’s Recovery and Resilience Plan. Available online: https://mfe.gov.ro/wp-content/uploads/2021/06/0c2887df42dd06420c54c1b4304c5edf.pdf (accessed on 28 March 2024).
- Lefebvre, A.H.; Ballal, D.R. Gas Turbine Combustion—Alternative Fuels and Emissions, 3rd ed.; CRC Press: Boca Raton, FL, USA, 2014; ISBN 9780429141041. [Google Scholar] [CrossRef]
- ISO 3744: 2010; Acoustics—Determination of Sound Power Levels and Sound Energy Levels of Noise Sources Using Sound Pressure—Engineering Methods for an Essentially Free Field over a Reflecting Plane. International Organization for Standardization: Geneva, Switzerland, 2010.
Figure 1.
(a) transversal section of the flame holder, (b) global dimensions of the flame holder, (c) global dimensions of the afterburner system.
Figure 1.
(a) transversal section of the flame holder, (b) global dimensions of the flame holder, (c) global dimensions of the afterburner system.
Figure 2.
Prototype P1 (left) manufactured via classic technological processes and prototype P2 (right) via additive manufacturing.
Figure 2.
Prototype P1 (left) manufactured via classic technological processes and prototype P2 (right) via additive manufacturing.
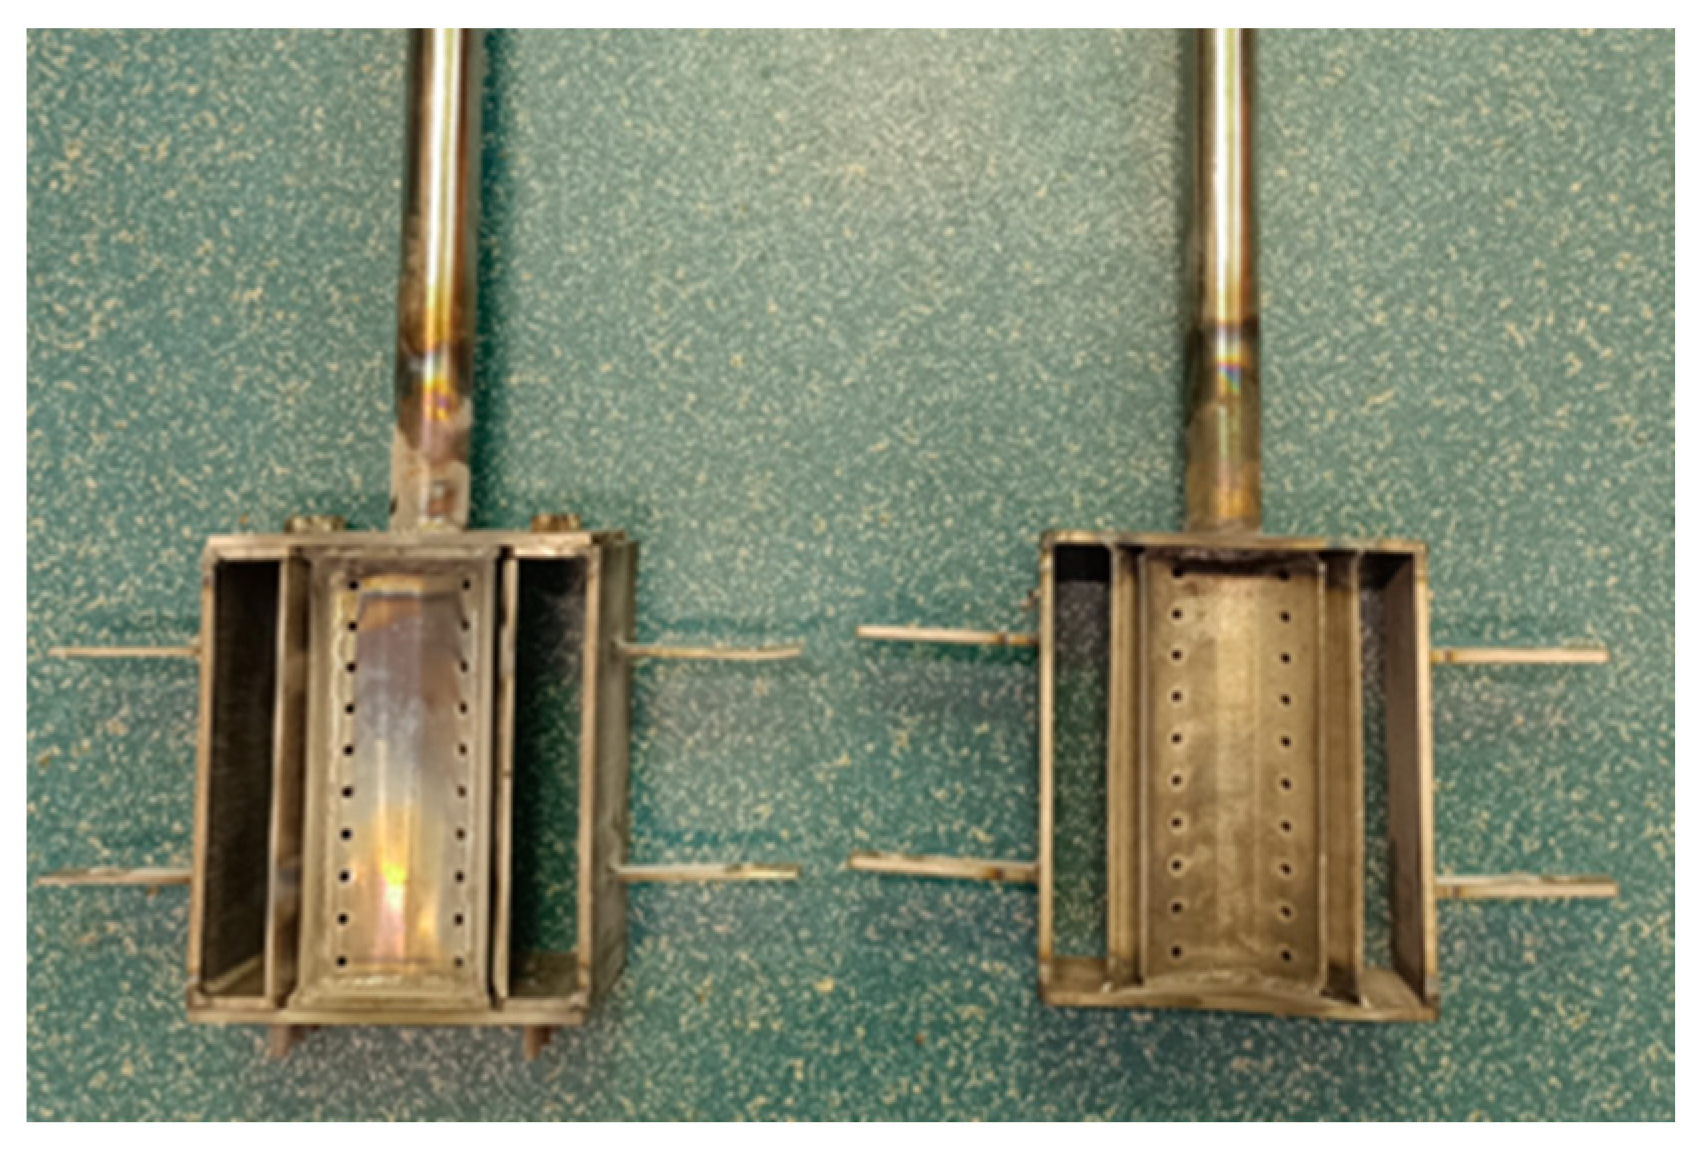
Figure 3.
Tensile testing at room temperature: (a) during tensile testing and (b) after rupture.
Figure 4.
Images during experiments: (a1) prototype P1, (b1) prototype P2; (a2) experimental setup, (b2) testing rig diagram.
Figure 4.
Images during experiments: (a1) prototype P1, (b1) prototype P2; (a2) experimental setup, (b2) testing rig diagram.

Figure 5.
CO2 concentration.
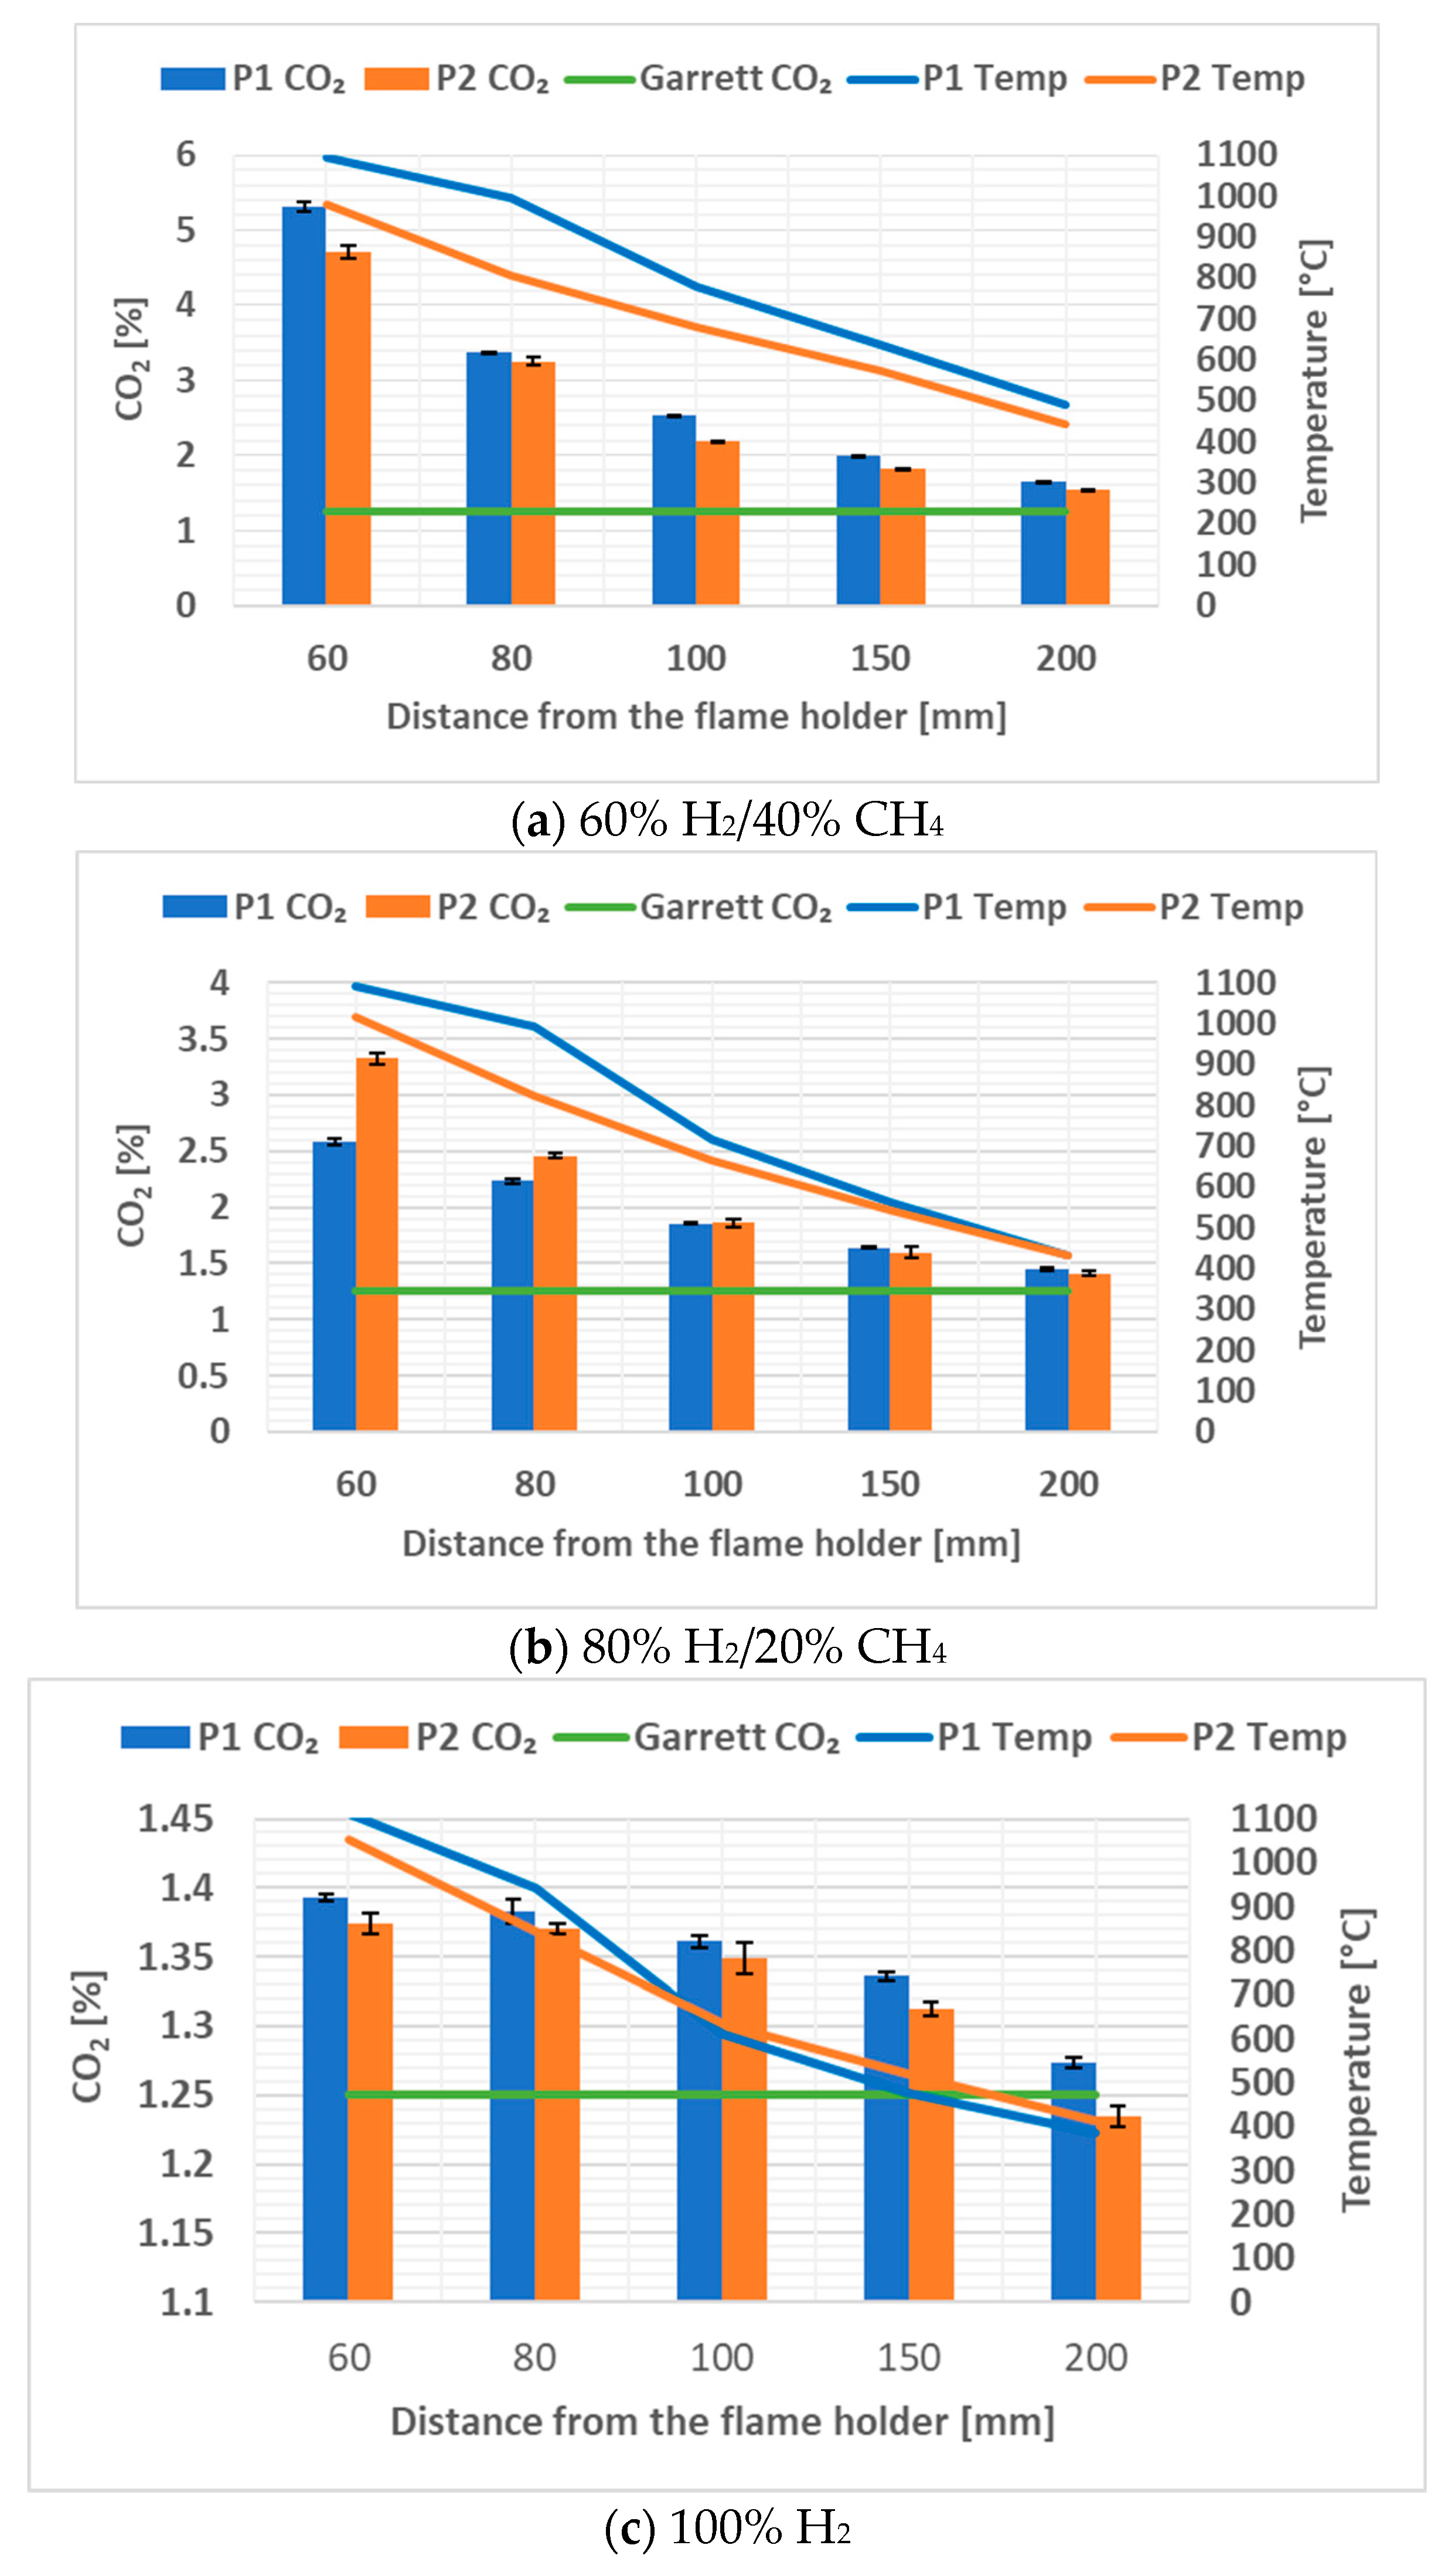
Figure 6.
CO concentration: (a) 60% H2; (b) 80% H2; (c)100% H2.
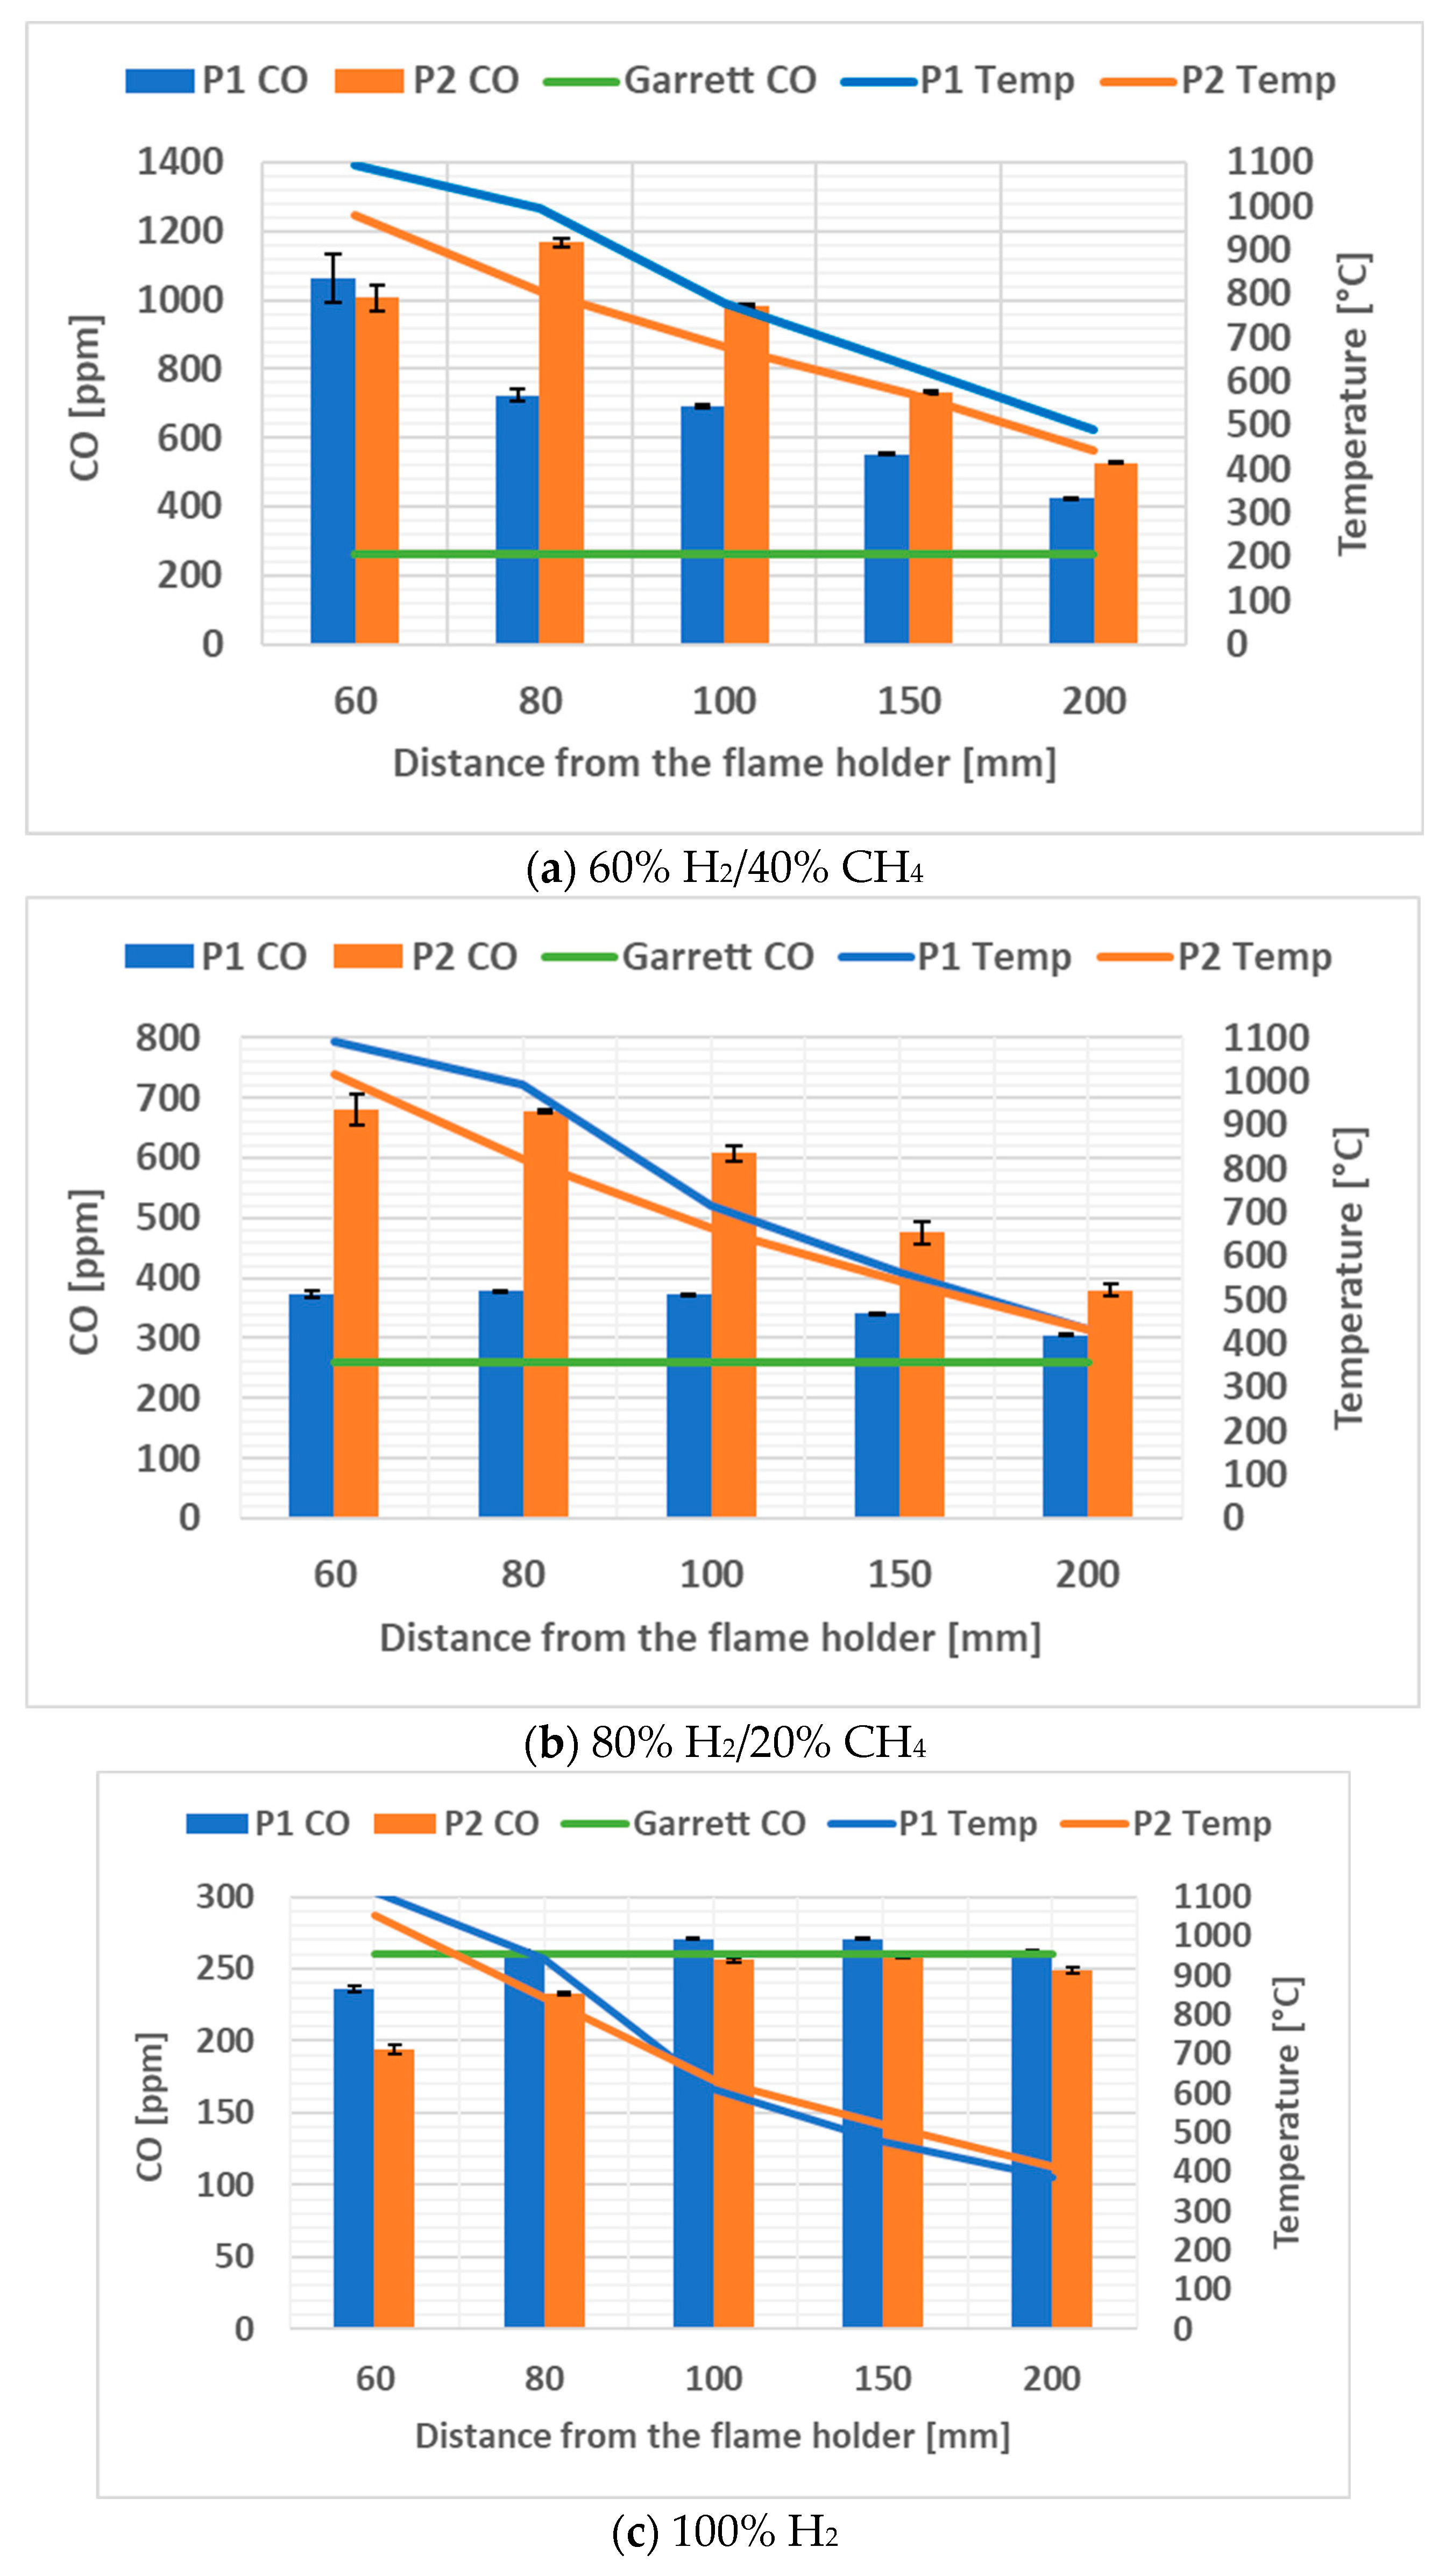
Figure 7.
NO concentration: (a) 60% H2; (b) 80% H2; (c) 100% H2.

Figure 8.
Averaged velocity field for prototype 1: (a) 60% H2; (b) 80% H2; (c) 100% H2.
Figure 9.
Averaged velocity field for prototype 2: (a) 60% H2; (b) 80% H2; (c) 100% H2.

Figure 10.
Axial velocity for axial component (a–c); transversal component (d–f), and spanwise component (g–i).
Figure 10.
Axial velocity for axial component (a–c); transversal component (d–f), and spanwise component (g–i).
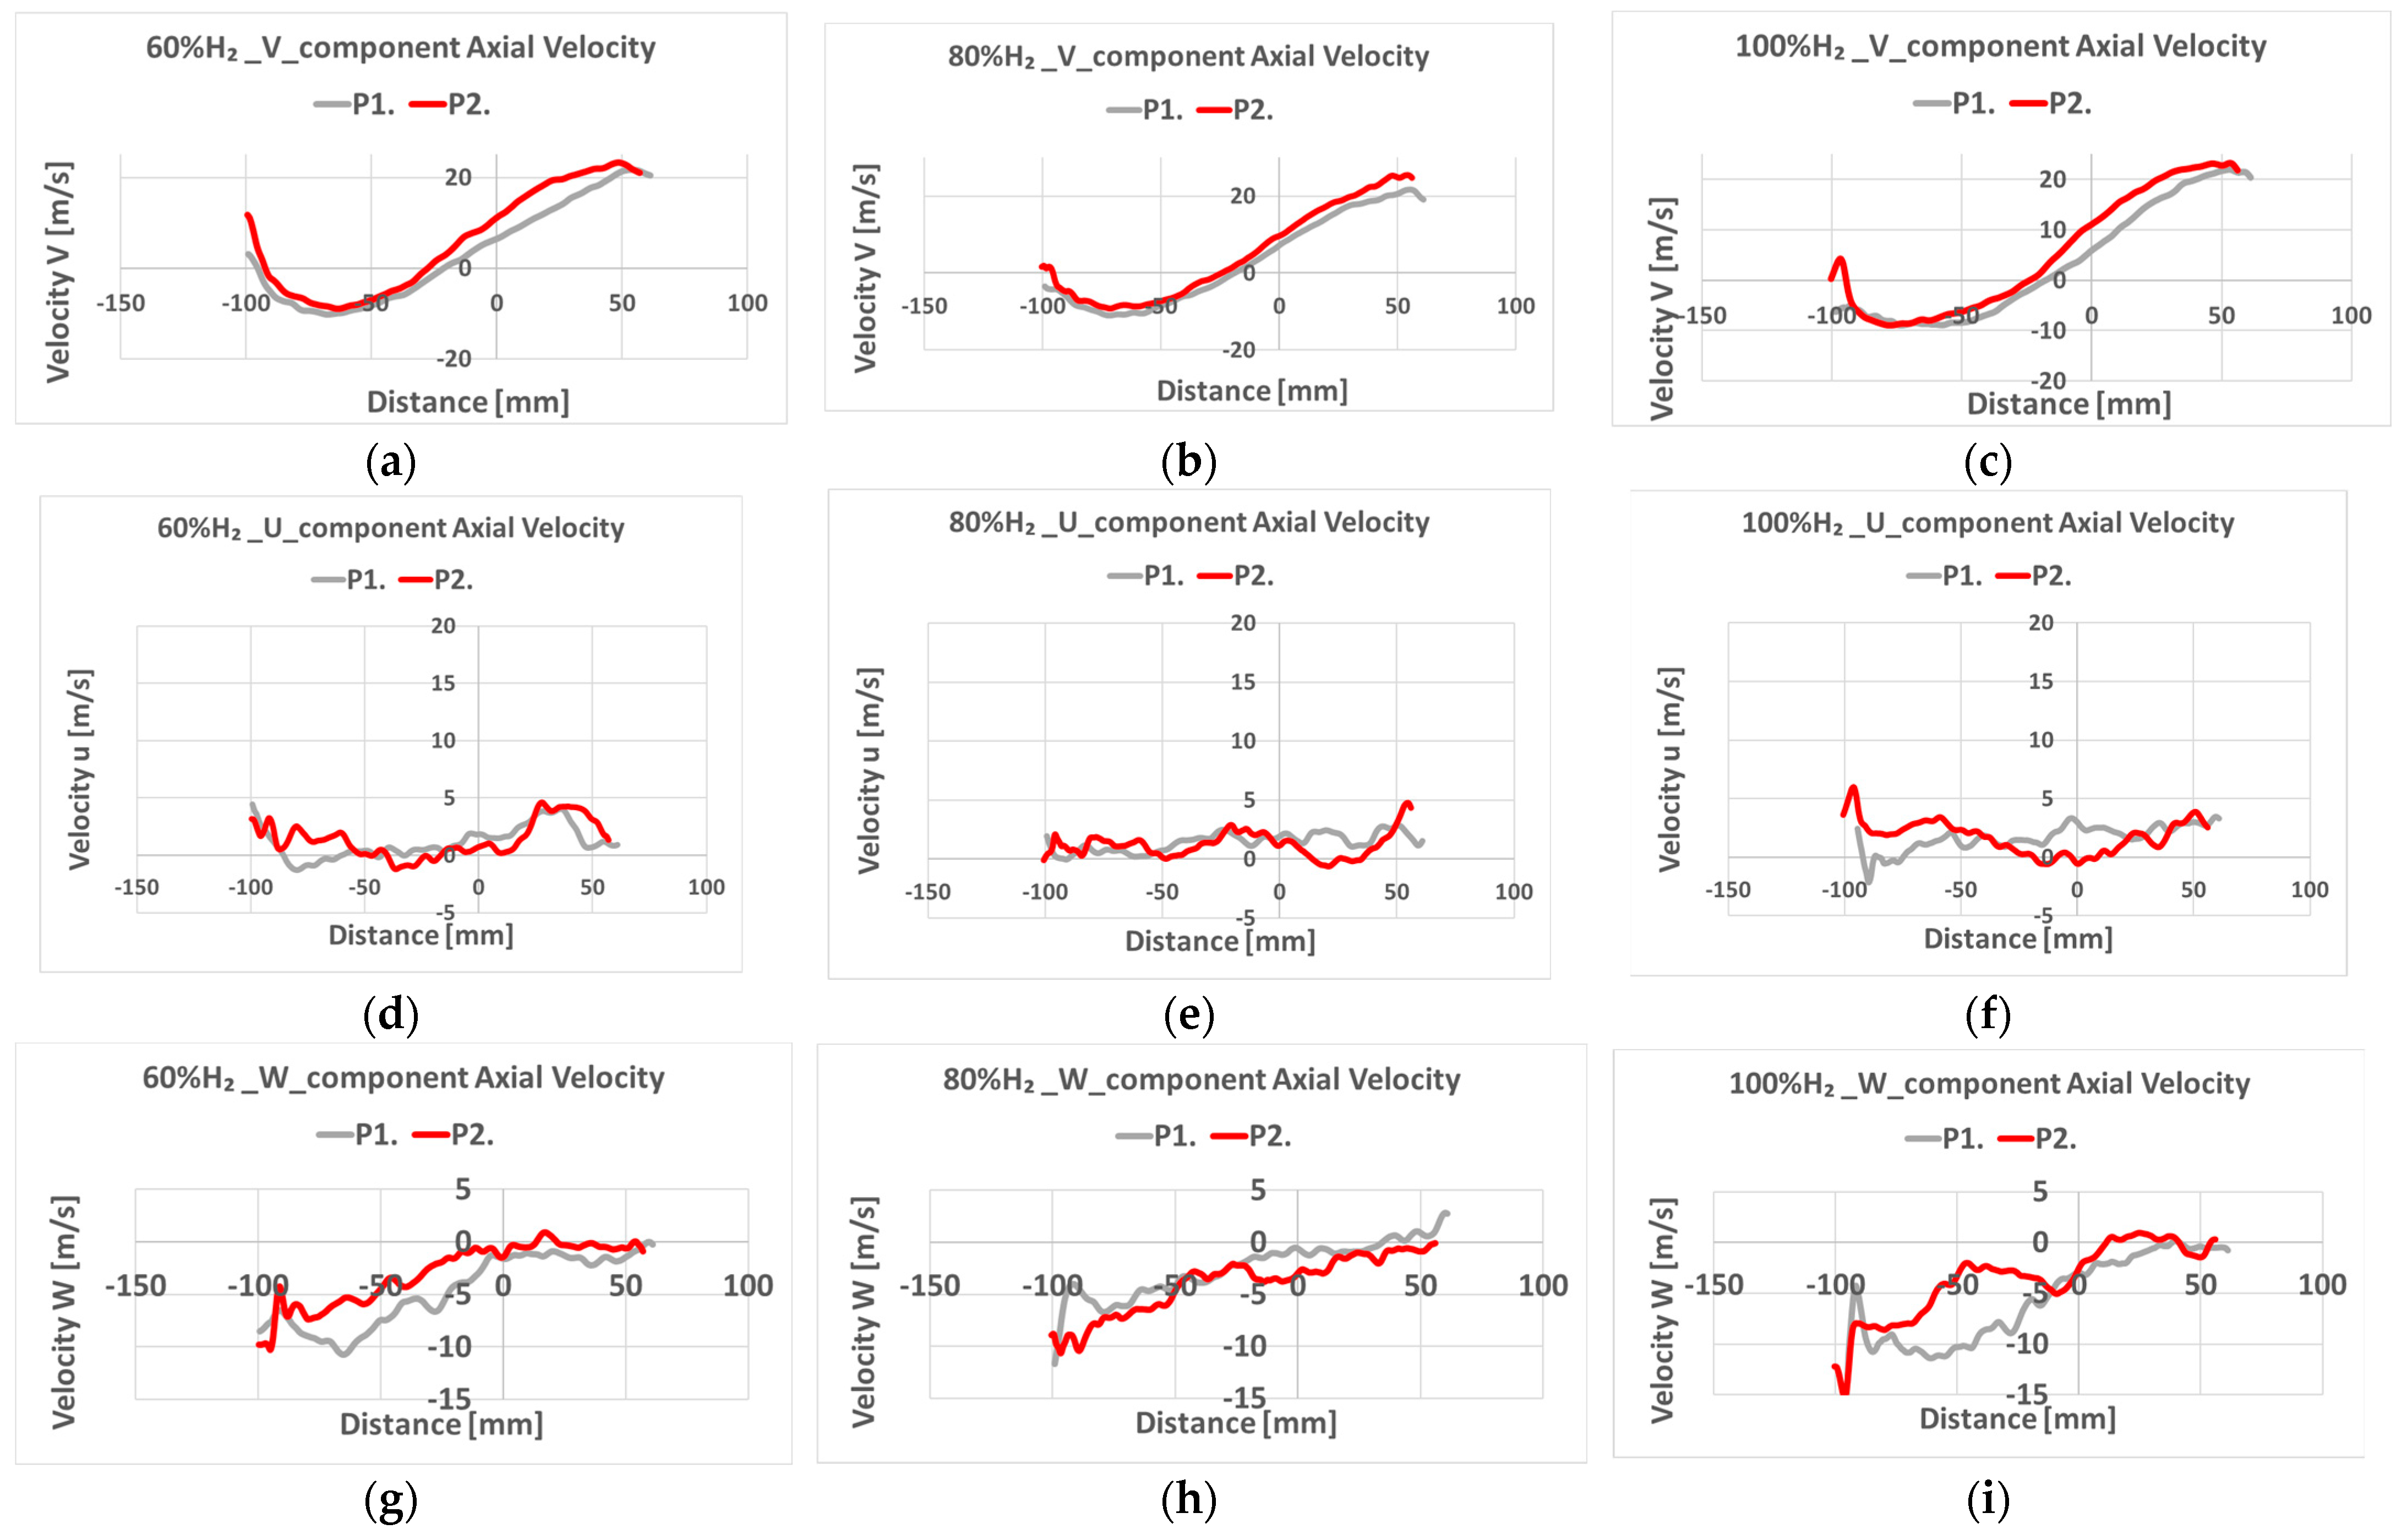
Figure 11.
Radial velocity at a distance of −60 mm from the flame holder edge for: axial component (a–c); transversal component (d–f), and spanwise component (g–i).
Figure 11.
Radial velocity at a distance of −60 mm from the flame holder edge for: axial component (a–c); transversal component (d–f), and spanwise component (g–i).
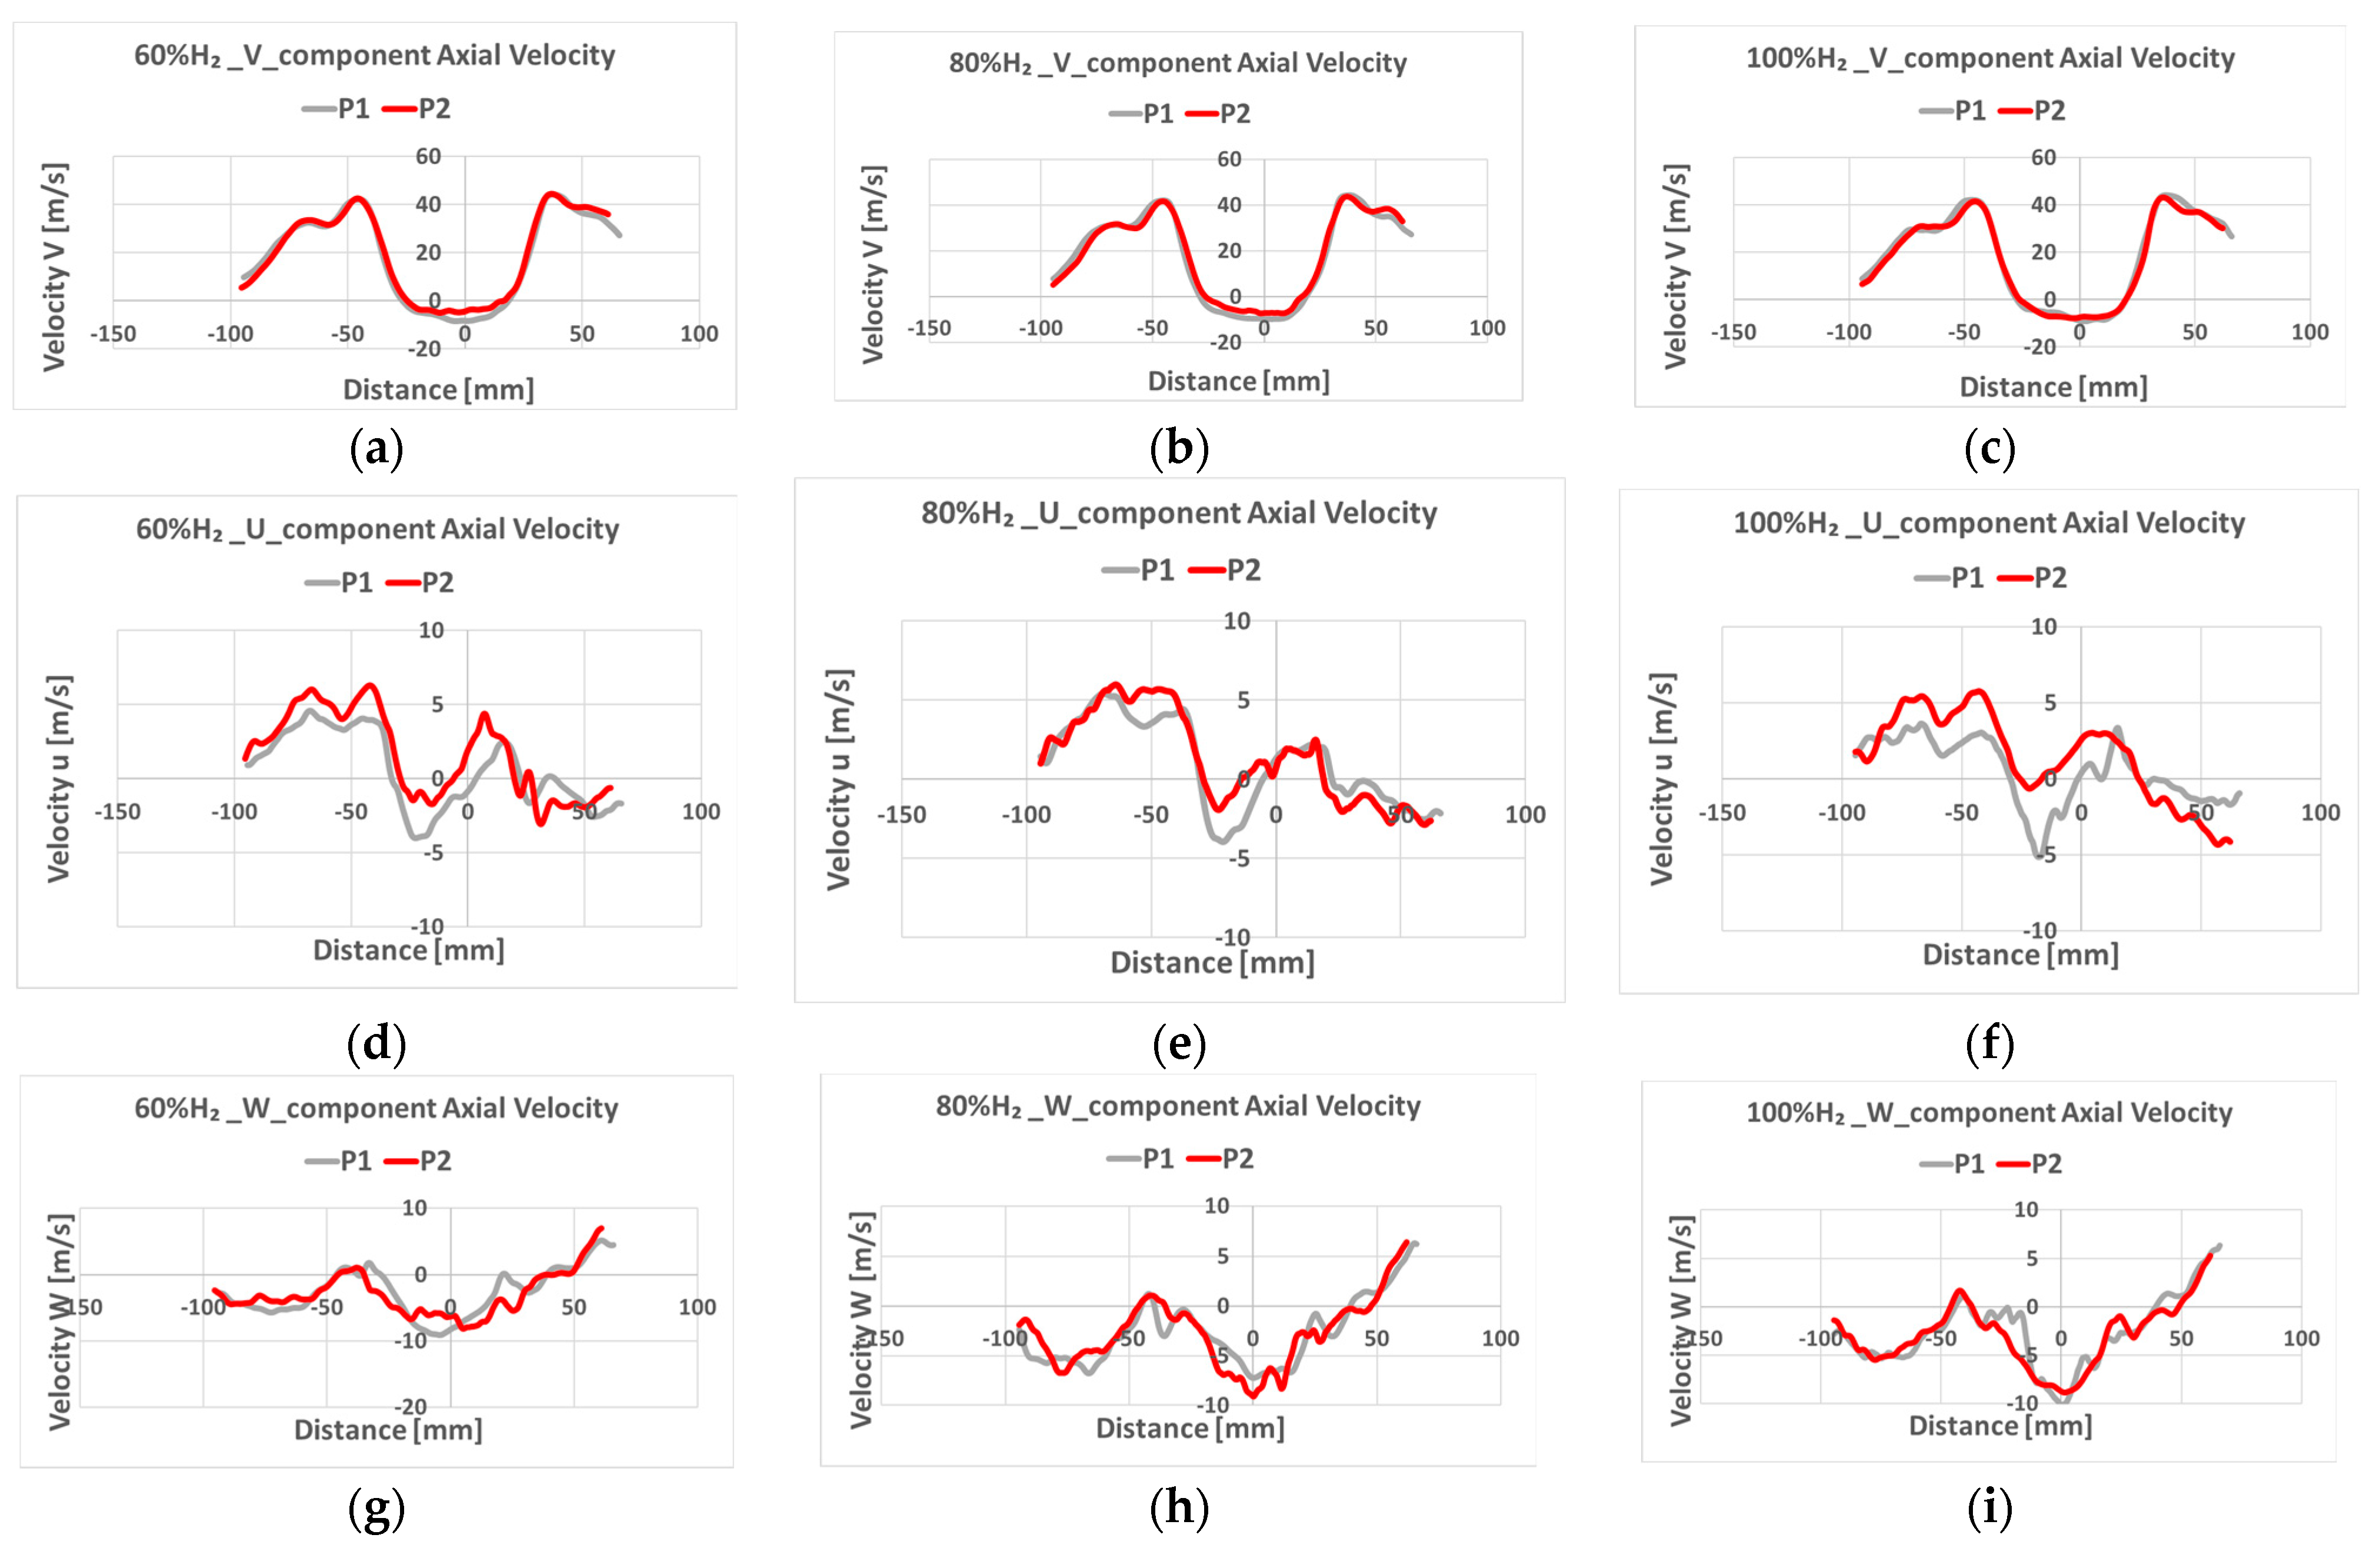
Figure 12.
Noise level variation in each microphone, for each afterburner prototype, and for each H2 concentration: (a) microphone 1, (b) microphone 2, (c) microphone 3, (d) averaged noise levels.
Figure 12.
Noise level variation in each microphone, for each afterburner prototype, and for each H2 concentration: (a) microphone 1, (b) microphone 2, (c) microphone 3, (d) averaged noise levels.
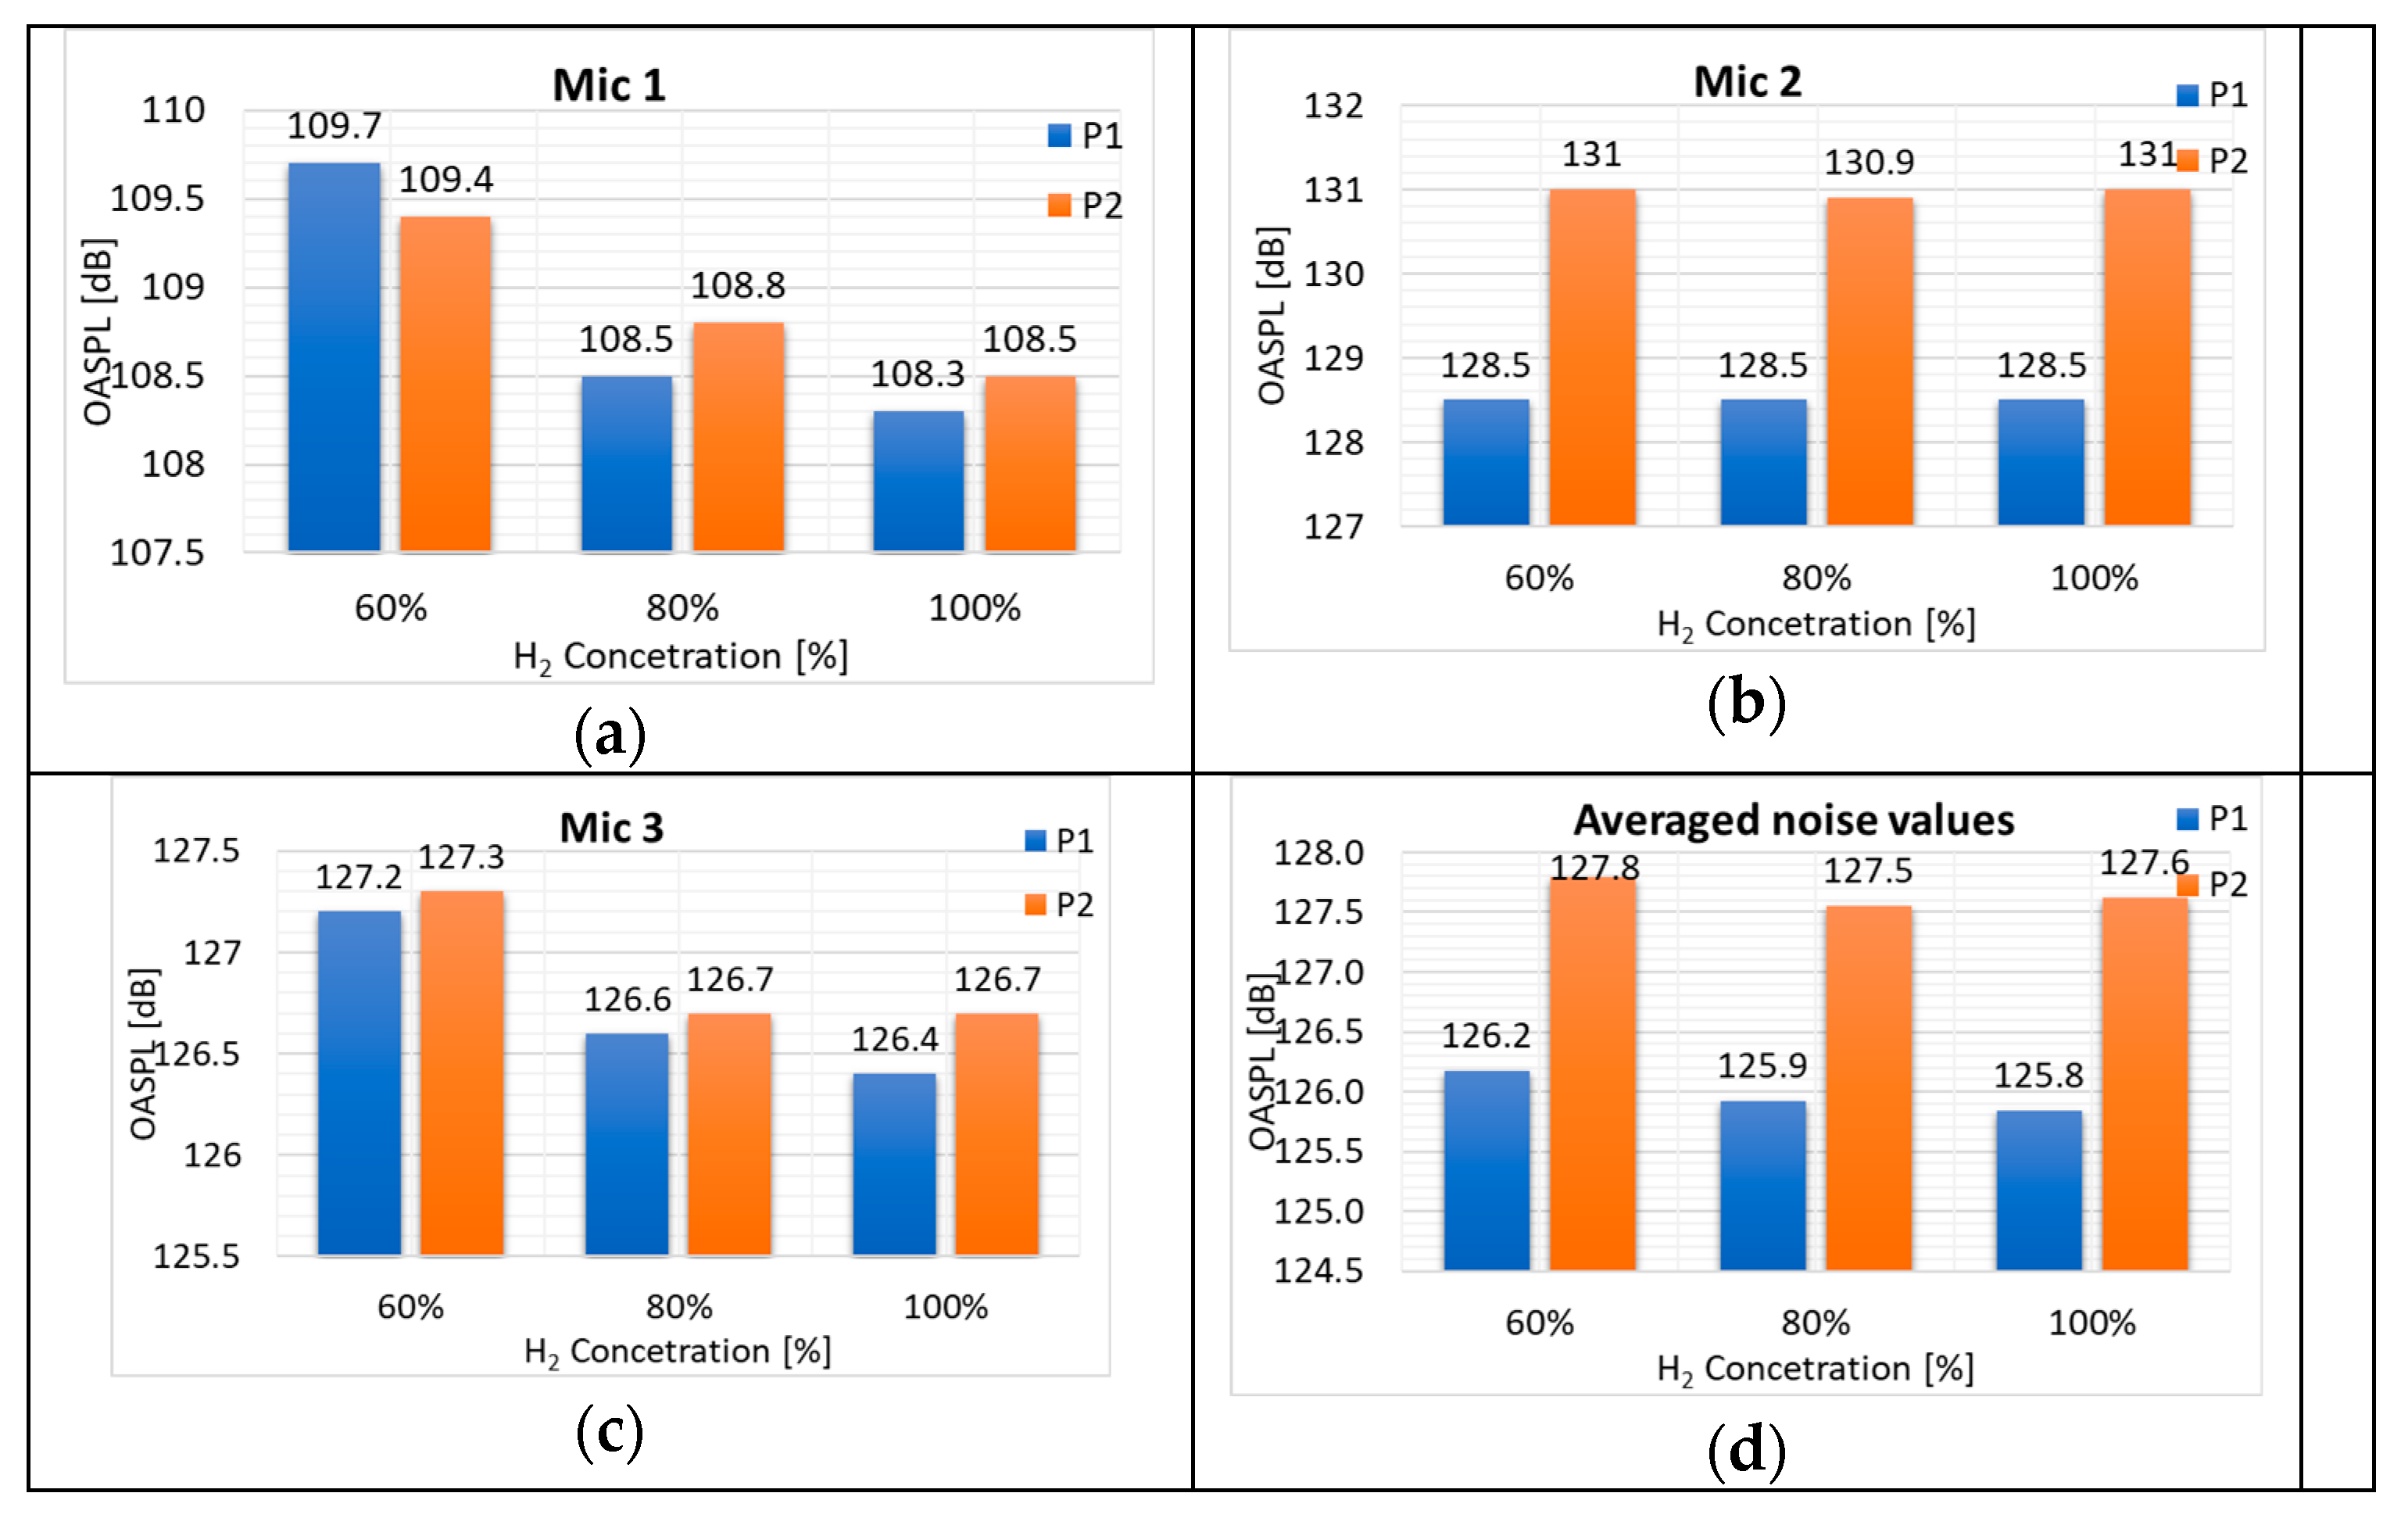
Figure 13.
Comparative spectral analysis between P1 and P2 for different H2 concentrations.
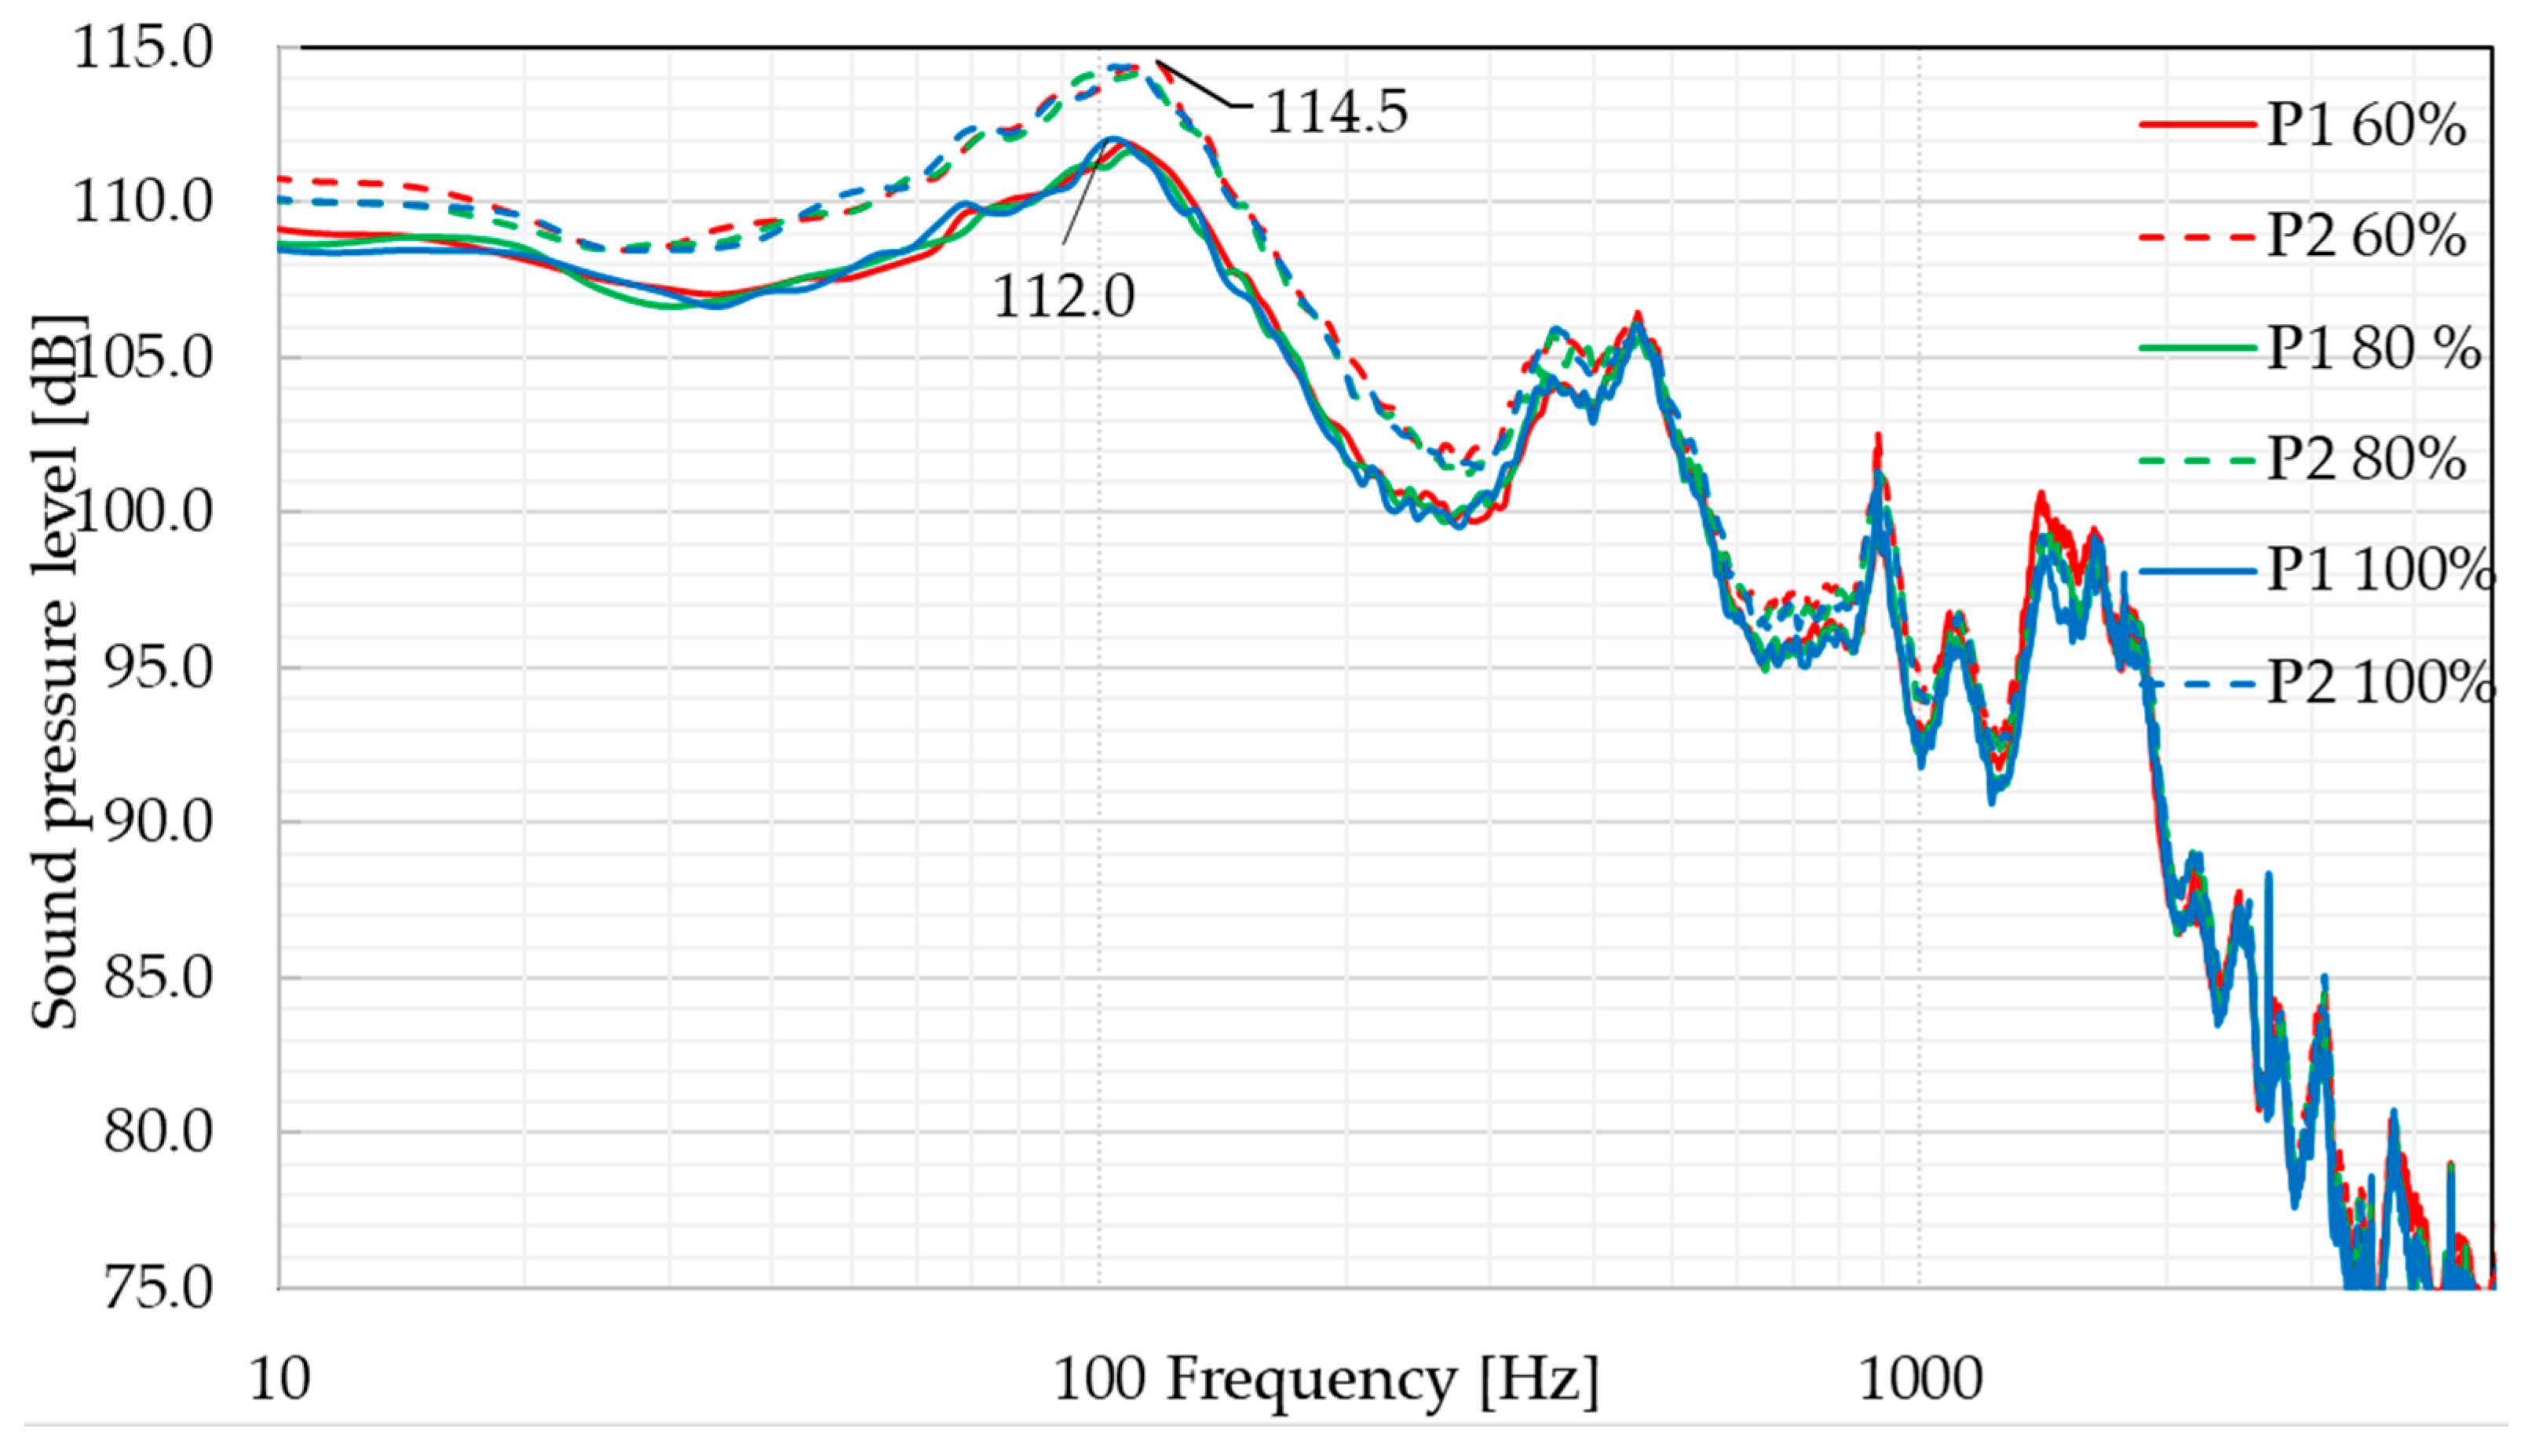
Figure 14.
Manufactured prototypes P3 (left) and P4 (right).

Table 1.
Material characteristics.
| Prototype P1 | Prototype P2 | ||
|---|---|---|---|
| Ultimate tensile strength (UTS) | 992.8 | 867 | MPa |
| Yield strength (0.2% offset) | 528.8 | 591 | MPa |
| Elongation at fracture (α) | 34 | 37 | % |
| Modulus of elasticity (E) | 147.5 | 145 | GPa |
| Mean roughness value (Ra) | 0.616 | 8.442 | µm |
| Peak-to-valley roughness depth (Rz) | 4.996 | 56.571 | µm |
Disclaimer/Publisher’s Note: The statements, opinions and data contained in all publications are solely those of the individual author(s) and contributor(s) and not of MDPI and/or the editor(s). MDPI and/or the editor(s) disclaim responsibility for any injury to people or property resulting from any ideas, methods, instructions or products referred to in the content. |
© 2024 by the authors. Licensee MDPI, Basel, Switzerland. This article is an open access article distributed under the terms and conditions of the Creative Commons Attribution (CC BY) license (https://creativecommons.org/licenses/by/4.0/).
Share and Cite
MDPI and ACS Style
Florean, F.G.; Mangra, A.; Enache, M.; Deaconu, M.; Ciobanu, R.; Carlanescu, R. Experimental Research on an Afterburner System Fueled with Hydrogen–Methane Mixtures. Inventions 2024, 9, 46. https://doi.org/10.3390/inventions9030046
AMA Style
Florean FG, Mangra A, Enache M, Deaconu M, Ciobanu R, Carlanescu R. Experimental Research on an Afterburner System Fueled with Hydrogen–Methane Mixtures. Inventions. 2024; 9(3):46. https://doi.org/10.3390/inventions9030046
Chicago/Turabian StyleFlorean, Florin Gabriel, Andreea Mangra, Marius Enache, Marius Deaconu, Razvan Ciobanu, and Razvan Carlanescu. 2024. "Experimental Research on an Afterburner System Fueled with Hydrogen–Methane Mixtures" Inventions 9, no. 3: 46. https://doi.org/10.3390/inventions9030046