
Effects of Perforated Plates on Shock Structure Alteration for NACA0012 Airfoils
1
Romanian Research and Development Institute for Gas Turbines COMOTI, 061126 Bucharest, Romania
2
Faculty of Aerospace Engineering, National University of Science and Technology POLITEHNICA Bucharest, 011061 Bucharest, Romania
*
Author to whom correspondence should be addressed.
Inventions 2024, 9(2), 28; https://doi.org/10.3390/inventions9020028
Submission received: 24 January 2024
/
Revised: 27 February 2024
/
Accepted: 1 March 2024
/
Published: 5 March 2024
(This article belongs to the Special Issue New Sights in Fluid Mechanics and Transport Phenomena)
Abstract
:This research investigated a passive flow control technique to mitigate the adverse effects of shock wave–boundary layer interaction on a NACA 0012 airfoil. A perforated plate with a strategically positioned cavity beneath the shock wave anchoring spot was employed. Airfoils with perforated plates of varying orifice sizes (ranging from 0.5 to 1.2 mm) were constructed using various manufacturing techniques. Experimental analysis utilized an “Eiffel”-type open wind tunnel and a Z-type Schlieren system for flow visualization, along with static pressure measurements obtained from the bottom wall. Empirical observations were compared with steady 3D density-based numerical simulations conducted in Ansys FLUENT for comprehensive analysis and validation. The implementation of the perforated plate induced a significant alteration in shock structure, transforming it from a strong normal shock wave into a large lambda-type shock. The passive control case exhibited a 0.2% improvement in total pressure loss and attributed to the perforated plate’s capability to diminish the intensity of the shock wave anchored above. Significant fluctuations in shear stress were introduced by the perforated plate, with lower stress observed in the plate area due to flow detachment from cavity blowing. Balancing shock and viscous losses proved crucial for achieving a favorable outcome with this passive flow control method.
1. Introduction
Strong shock waves coupled with high-intensity adverse pressure gradients negatively impact the performance of airfoils in external aerodynamics or the flow behavior within inlet ducts, nozzles or turbomachinery channels for internal flows. The shock wave alone is responsible for total pressure loss, and therefore entropy generation and wave drag. Moreover, the shock system might strongly interact with the boundary layer leading to larger viscous dissipation. Shock and boundary layer active or passive control methods [1], including vortex generators [2,3], single or double slots, bumps [4] and perforated strips [5,6,7,8], have been investigated throughout the years to mitigate the detrimental effects of shock-induced phenomena.
In recent studies, various approaches [9,10,11,12] have been explored to understand and control shock wave–boundary layer interactions (SBLIs) and their impact on aerodynamic performance. One such study conducted by Genç et al. [13] focuses on passive flow control methods for UAVs and MAVs operating at low Reynolds numbers, aiming to address issues related to SWBLI. Another investigation by Zhou et al. [14] targets SWBLI in supersonic/transonic compressors, proposing a Combined Flow Control Device (CFCD) to mitigate its effects. By stabilizing shock waves and reducing flow separation, the CFCD enhances rotor performance. Szulc et al. [15] propose an innovative method involving a tangentially moving wall to control normal shock wave–turbulent boundary layer interactions, significantly improving airfoil aerodynamic performance. Additionally, micro-vortex generators have emerged as effective SBLI control devices, although their optimization and effectiveness depend on various factors [16].
Research efforts have been dedicated to perforated plates with cavities underneath in the context of Euroshock I and II European projects [17,18]. With this passive control strategy, a self-adjusting passive control process [19] is achieved in the shock anchoring region by downstream suction and upstream blowing through the shallow cavity. This reduces the wave drag component by spreading the shock induced rapid pressure increase. However, the passive blowing-suction phenomena combined with the augmented roughness introduced by the perforated surface might lead to an increase in friction drag, which ultimately can exceed the wave drag reduction [20,21].
The passive control method of a perforated plate with a cavity beneath the shock boundary layer interaction region was numerically and experimentally studied by [22,23] on nozzle flat walls, nozzle curved walls and airfoils. For the flat nozzle test case, a 70 mm shallow cavity was employed shielded by a 1 mm thick perforated plate with 6700 normal holes of 0.3 mm nominal diameter. The experimental apparatus included the Schlieren and LDV system for both qualitative and quantitative measurements in the shallow cavity region. This was complemented by static pressure taps on the wind tunnel wall for both ‘no control’ and passive control cases. The use of the perforated plate altered the shock structure from a normal shock to an oblique λ-foot structure with reduced wave losses. However, this was achieved with simultaneous boundary layer thickening and increased viscous losses, being detrimental for the overall loss budget on the surface. Doerffer et al. [24] also confirm the effectiveness of the passive flow control. Their comprehensive analysis not only highlights the constraints affecting airfoil performance but also illustrates the potential to diminish the impulsive noise linked to the airfoil.
For numerical studies, a dedicated transpiration boundary condition for the perforated area was developed by Doerffer and Bohning [25], similar to other porous modelling attempts in the literature [26]. The transpiration law included in a RANS in-house flow solver yielded accurate numerical results in terms of streamwise pressure distribution, streamwise velocity profiles, boundary layer thickness or Mach contours compared to the experimental data. Roy et al. [27] performed a 2D computational study on a porous medium as an alternative passive control strategy to the above-mentioned cavity with a perforated plate. By means of state-state RANS computations with Menter’s SST turbulence closure model, the study revealed a maximum of 13% reduction in total drag. Moreover, the authors confirmed that the higher the medium porosity, the higher the viscous drag. The applicability of transpiration models was also confirmed by [28] through CFD simulations conducted for comparison with experiments carried out in EUROSHOCK projects [25].
Aldheeb et al. [29] investigated the aerodynamic impact of porosity on thin airfoils and half wings, finding that increased porosity enhances performance by reducing drag and transforming vortex structures, particularly at 20 PPI. Lower densities worsen performance, while higher densities may hinder aerodynamic power [30]. Hanna et al. [31] studied a NACA 0012 airfoil at moderate Reynolds numbers, showing that introducing small holes between pressure and suction surfaces removes anomalous behavior without penalties in drag or lift-to-drag ratios. Another study used large-eddy simulation to explore partially porous airfoils, revealing improved lift-to-drag ratios with low-porosity unidirectional porous media [32]. Additionally, a novel filling configuration for airfoil trailing edges, using porous material exclusively on the suction side, demonstrated promising noise reduction capabilities, achieving up to 4.3 dB reduction at low frequencies while maintaining good performance at higher angles of attack [33].
The aim of the current paper is twofold. On one side, several manufacturing techniques for rapid prototyping of airfoils with perforated plates are investigated. Based on the manufacturing quality, two methods are eventually selected for the final experimental campaign. On the other side, NACA0012 airfoils with different orifice sizes for the perforated plate are tested in a transonic/supersonic wind tunnel with a Schlieren system aligned for shock structure visualization. The experimental results in terms of static pressure distribution on the wind tunnel bottom wall and shock structure alteration by the passive control method are compared against the numerical ones from Ansys Fluent.
2. Materials and Methods
2.1. Perforated Plate Manufacturing
Various methods were tested for the production of the NACA0012 single airfoil, while the final selection of manufacturing technology was based on a trade-off in terms of accuracy [34], ease of manufacturing [35,36] and surface roughness. The NACA 0012 airfoil features a 7.5 cm chord, whereas the perforated plate measures 20 mm in length. The shallow cavity is 3.5 mm deep. The manufacturing investigation primarily focused on four different approaches:
- Model 1 (Figure 1)—Employing PLA 3D printing on an Anycubic S 3D printer. This model comprises two printed components: the airfoil with the ‘omega’-type joint and the perforated plate featuring 0.5 mm circular holes. While the surface roughness of the airfoil meets acceptable standards, the quality of the holes falls short due to inherent limitations of the printer.
- Model 2 (Figure 2)—Inconel 3D metal printing. The design entails a singular block intended for producing perforations through direct laser drilling. However, the surface roughness is notably high, necessitating additional post-processing steps like sanding. To address this, the process requires repetition with extra material beyond the nominal dimensions. Given the complexity of these operations, the method has been temporarily suspended.
- Model 3 (Figure 3)—Metal cutting using a water jet. Similar to PLA 3D printing, the model comprises two printed components: the airfoil featuring a cavity with an ‘omega’-type joint, and the perforated plate with 0.5 mm circular holes. However, the perforated plate is constructed from a 2 mm thick aluminum plate, with 0.5 mm circular holes created through laser drilling. Precision decreases for holes smaller than 0.5 mm with laser drilling. The assembly utilizes an ‘omega’ type joint, which is both manufacturing-friendly and safe for operation in a wind tunnel. Nevertheless, this approach raises concerns as it affects the curvature of the airfoil.
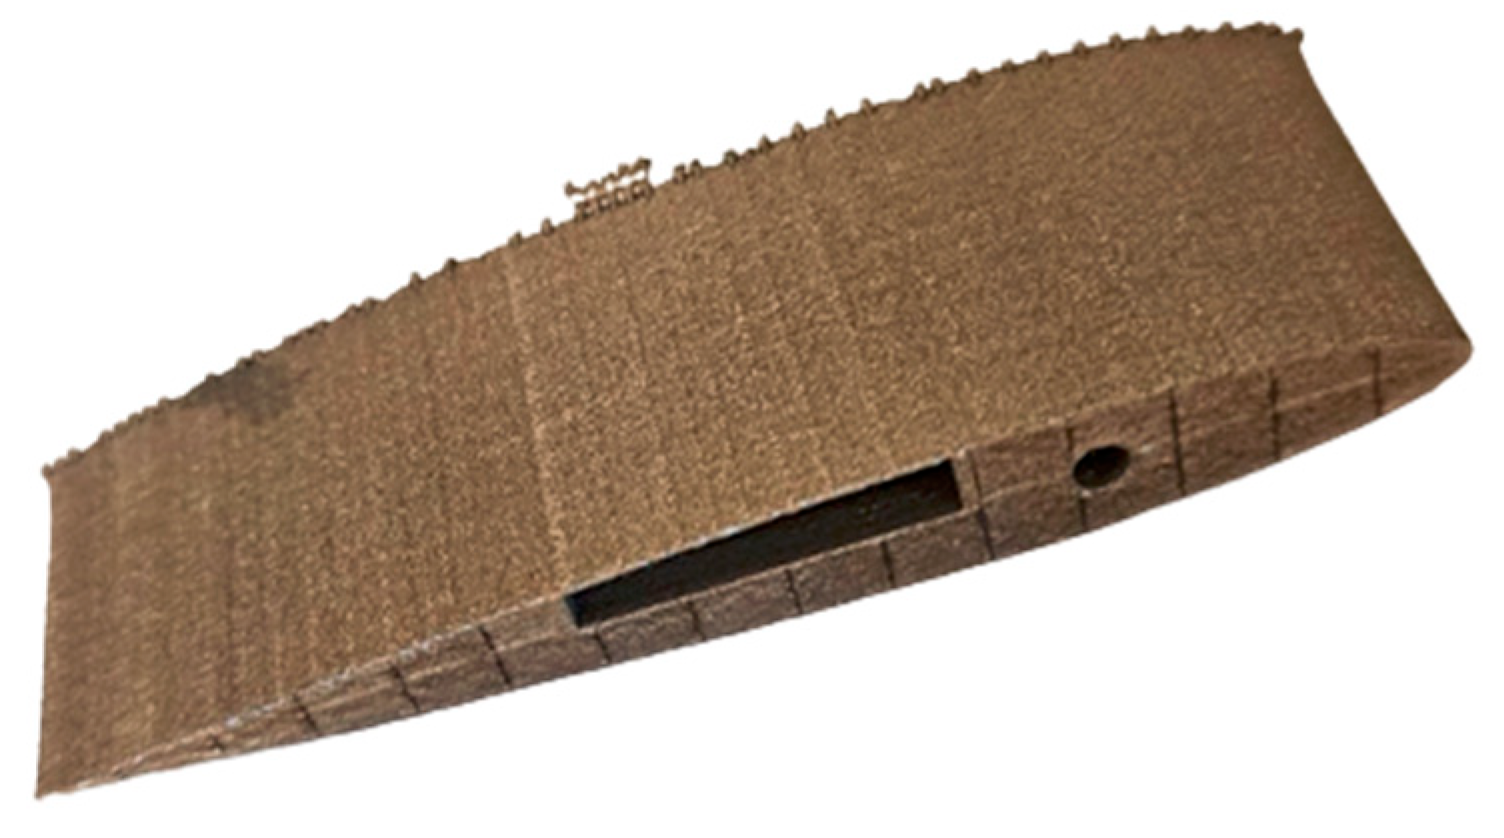
- Model 4 (Figure 4)—PLA 3D printing by a Bamboo lab 3D printer. The model is composed of a single printed part, exhibiting significantly improved print quality in comparison to Model 1. Numerous airfoils were printed, featuring hole diameters ranging from 0.5 to 1.2 mm. To facilitate the installation in the wind tunnel, threaded nuts were employed for the 3D printed models made from plastics, as illustrated in Figure 4b.
Model 3 and Model 4 airfoils were chosen for the experimental campaign primarily based on considerations related to surface quality.
2.2. Experimental Facility
The airfoils with perforated plate passive control included were tested at the Faculty of Aerospace Engineering’s high-speed flow facility. The available facility is an “Eiffel”-type open wind tunnel by Gunt (HM 172 [37]), designed for investigating the aerodynamic characteristics of different bodies under subsonic or supersonic flow conditions. The facility features three interchangeable top walls with distinct contours, enabling the generation of flow velocities up to Mach 1.8. The test section has a width of 25 mm, while the wind tunnel itself has a height of 100 mm.
The open wind tunnel is equipped with a fan that draws air from the surroundings. A built-in honeycomb-type flow straightener is integrated into the convergent inlet section, ensuring a uniform velocity distribution with minimal turbulence in the subsequent measuring section. In the enclosed measuring section, the bottom wall is equipped with 18 static pressure probes of 0.5 mm, enabling the recording of pressure distribution along the tunnel through a digital scanning valve. These pressures are directly transmitted to a PC via USB and analyzed using the supplied software. Further along the high-speed section, the airflow is decelerated in diffusers and passes through a suction filter into the fan. An outlet sound damper is incorporated to reduce the sound level in the facility. The tunnel’s continuous operation method provides enough time for observation and measurements.
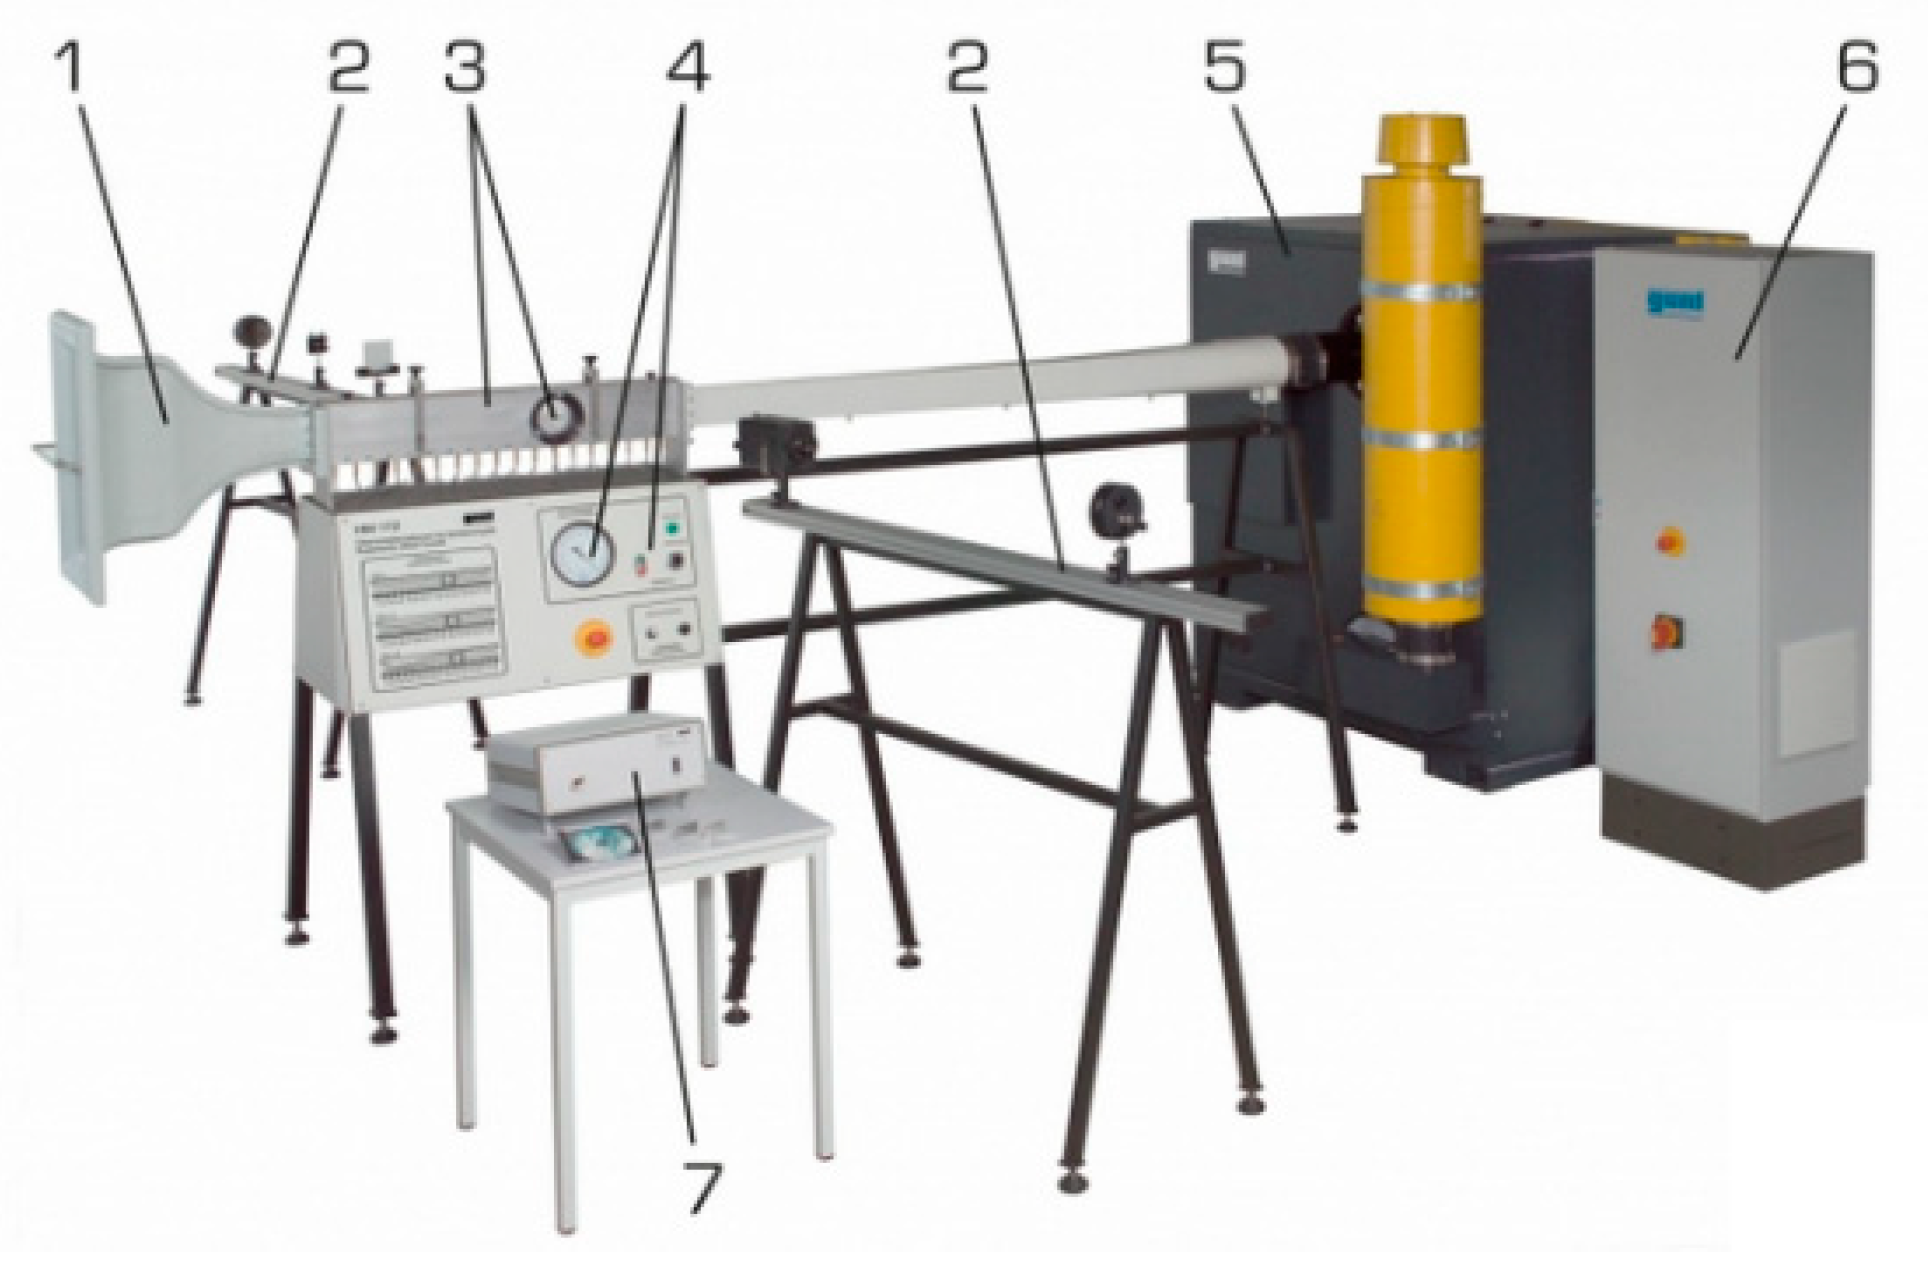
The facility comprises the following components as presented in Figure 5: a wind tunnel duct, air inlet and inlet honeycomb (1); Schlieren optics system (2); measuring section with optical access by two 11 cm quartz windows (3); control panel with a safety shut down button and manometer (4); fan (5); switch power supply cabinet (6); digital scanning valve for pressure profile along the bottom wall of the wind tunnel (7).
The provided Schlieren optics, in conjunction with a high-speed camera, enable the direct observation of flow and the resulting shock phenomena. A Z-type Schlieren setup [38], illustrated in Figure 6, is configured to visualize the airflow over the airfoils positioned in the optical access area of the wind tunnel. This setup comprises two 11 cm diameter parabolic mirrors, an adjustable slit diaphragm (knife) for light cutoff, a point light source, and a Phantom VEO710 high-speed camera. The light source and the knife are positioned one focal length apart from mirrors 1 and 2, respectively, with off-axis beam angles set below 20° to minimize optical distortions [39]. Mirror 1 transforms the incoming beam into a parallel one, while mirror 2 focuses the light onto the knife. The distance between the two mirrors is limited by the alignment constraints of the wind tunnel.
The airfoils are fixed using two 3 mm screws through the quartz windows, along with two sealing gaskets. To ensure consistent angle of attack for all tests, a jig was created through 3D printing, featuring a 2 mm inner channel that replicates the airfoil contour.
The optical diagnostics, in conjunction with pressure measurements, enables exploration of the effects of the passive flow control method on flow behavior. To further validate the findings, Computational Fluid Dynamics (CFD) simulations were conducted, with boundary conditions directly derived from the wind tunnel’s inlet and outlet experimental conditions.
For numerical simulation validation, the wind tunnel was operated without any airfoil (empty wind tunnel) at four different regimes. The first regime (Regime 1) corresponds to the idle of the wind tunnel, while the fourth one (Regime 4) corresponds to the same regime where all the airfoil tests were performed. This latter regime was determined based on the precisely controllable rotational speed setup of the vacuum pump. To compare the static pressure distributions on the bottom wall with the numerical results, 3D numerical simulations were run.
The computational domain was discretized into 527,000 elements using ICEM CFD, employing a structured approach with local wall refinement and a first cell thickness of 1 micrometer to achieve y+~1 values. A Fluent density-based solver was utilized to solve the flow equations along with the k-omega SST turbulence model transport equations [40].
The atmospheric pressure during the experimental campaign was 101,656 Pa. Using a Pitot probe, attempts were made to measure the total pressure loss introduced by the inlet honeycomb. The averaged measurements indicated a total pressure loss of about 1%, resulting in an imposed total pressure of 100,639 Pa at the wind tunnel inlet in the numerical simulation. The CFD outlet static pressure was set to correspond to the average experimental outlet static pressure measurements: 91,912 Pa for regime 1; 85,387 Pa for regime 2; 77,145 for regime 3 and 61,346 Pa, respectively, for regime 4. The same total temperature condition of 24.7 °C was applied as a boundary condition on both the inlet and outlet of the computational domain. The turbulence intensity on both inlet and outlet patches was set to 1%. The estimated turbulent length scale was 0.2 cm. The estimation is based on the relationship between the turbulence model constant, turbulent kinetic energy and specific dissipation rate.
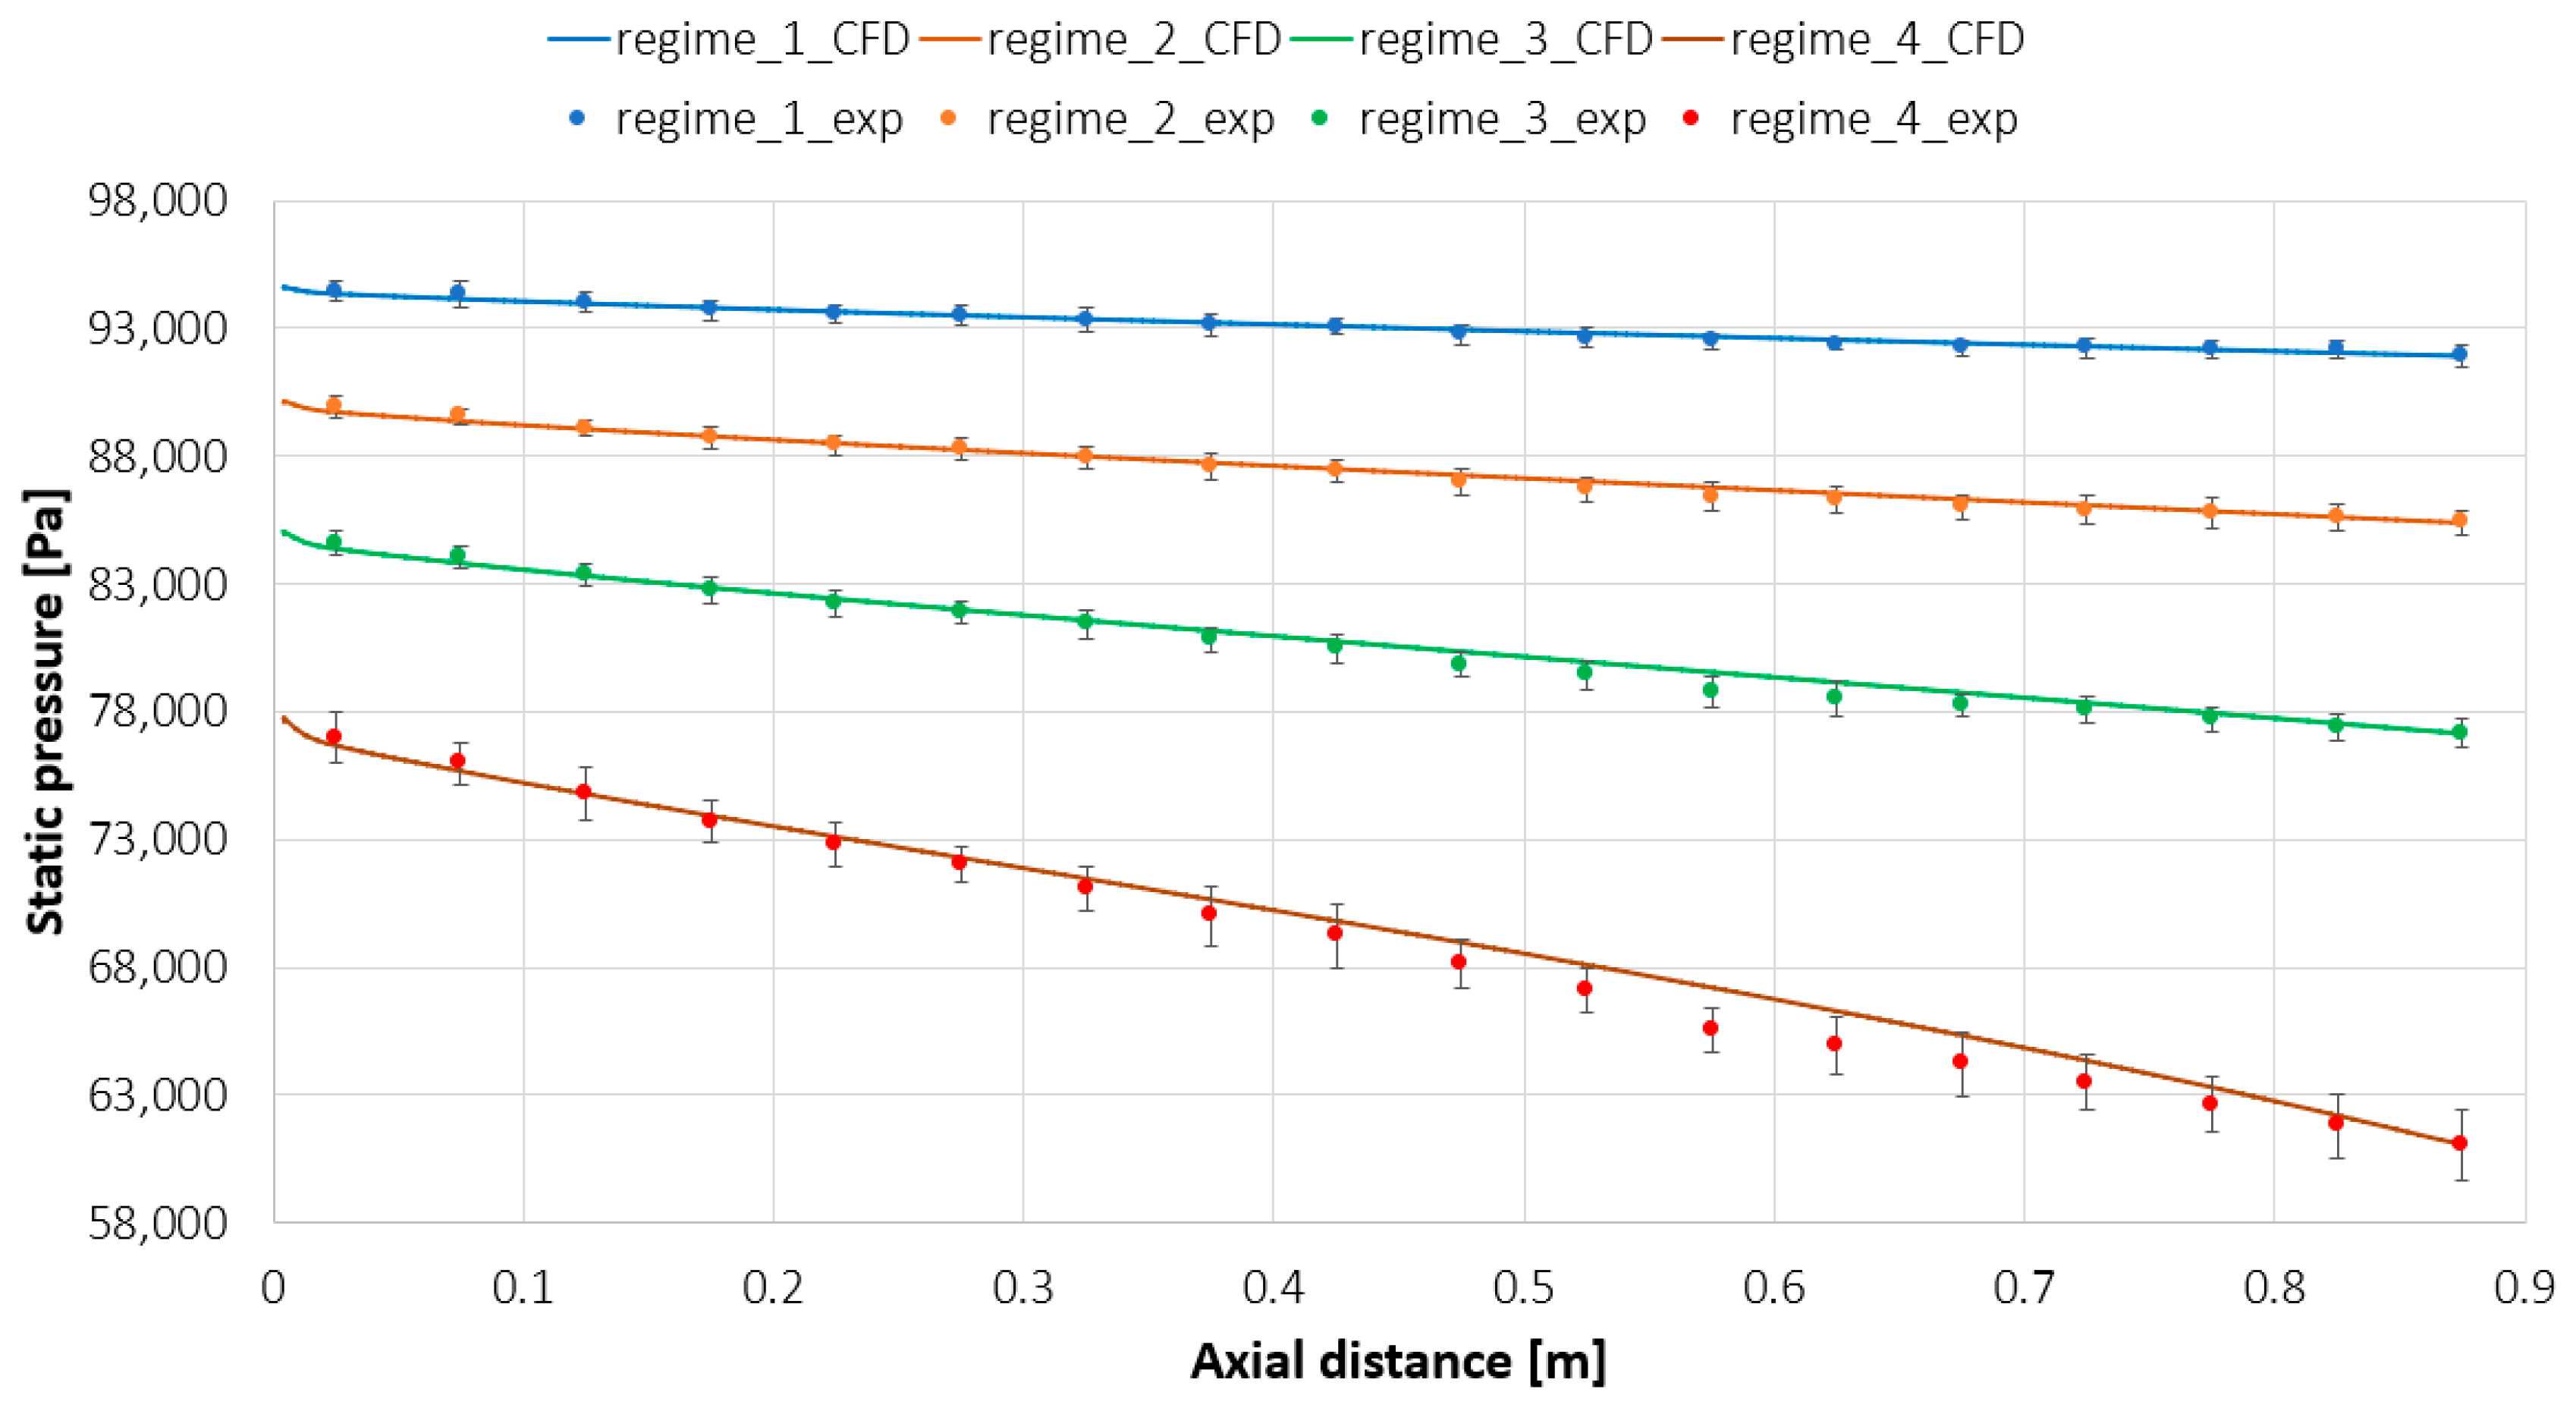
In Figure 7, a comparison is presented between the experimental and numerical results for the bottom wall static pressure for the four regimes. The experimental pressure measurements were averaged over 20 s (20 samples at a 1 Hz acquisition rate). Utilizing the t-student distribution table for 20 samples, a t-student coefficient of 1.725 was applied for estimating a 90% confidence interval [41].
Looking at Figure 7, the numerical simulation correctly predicts the slope, with a slight deviation in the range of 0.55–0.65 m for regimes 3 and 4. In this particular zone, which corresponds to the optical access region, even slight deviations in the manufacturing of the closing lids could lead to localized acceleration. Additionally, the confidence intervals become larger not only moving downstream, but also throttling the wind tunnel, possibly attributed to unsteadiness introduced in the wind tunnel by various downstream gaps or connections. Apart from ports 12 and 13 for regime 4 and port 12 for regime 3, the CFD results lie within the covered range of the confidence interval computed based on the experimental data. For regime 4, the wind tunnel operates at an inlet Mach number of 0.62 with 208 m/s flow velocity, while for regime 1, an inlet Mach number of 0.29 is obtained with 101 m/s flow velocity.
3. Results
Six distinct airfoils were mounted and subjected to testing in the wind tunnel as outlined in Table 1. For all airfoils, one side remained unaltered, while the other side incorporated the passive control method with a perforated plate and a cavity underneath. The tests were all performed at null angle of attack. To assure these conditions, a PLA additive manufactured jig was used for airfoil installation in the wind tunnel before the final tightening.
Consistency in the wind tunnel operating regime was maintained throughout all the tests. This was ensured by utilizing the throttling feature of the wind tunnel vacuum pump. The high-speed camera operated at 7500 frames per second (fps) with a resolution of 1280 × 800 pixels. The time interval between two consecutive frames was set at 133.32 μs, and the exposure time was fixed at 25 μs.
As shown in Figure 8, the high pressure and high density are displayed in dark shades (evident at the stagnation point of the airfoil), while low density and low pressure are depicted in lighter tones (observed in areas of local acceleration near the leading edge). Across all examined airfoils, the aerodynamic surface on the lower side remains unaltered, displaying a normal shock wave with high intensity attached (Figure 8). In specific instances (A1, A3, and A4), a distinct shock wave on the lower side is not evident. Instead, a secondary shock wave, stronger but more dissipative, follows the primary shock wave. This occurrence is attributed to manufacturing imperfections. Consequently, an additional shock wave arises due to the blade tip gap between the optical access quartz plate and the airfoil. Another factor might be the excessively long exposure time, but reducing it would necessitate a more powerful light source, which is currently unavailable.
On the upper side, where perforated plates with varying hole diameters were installed, a consistent characteristic can be observed in Figure 8: a ‘lambda’ foot shock wave structure emerges. With an increase in hole size, the singular ‘lambda’ feature evolves into a sequence of compression waves. However, apart from the A6 case, all other instances exhibit an additional normal shock wave downstream of the ‘lambda’ structure. This normal shock is precisely located at the point where the perforated plate ends, and the continuous airfoil surface is restored.
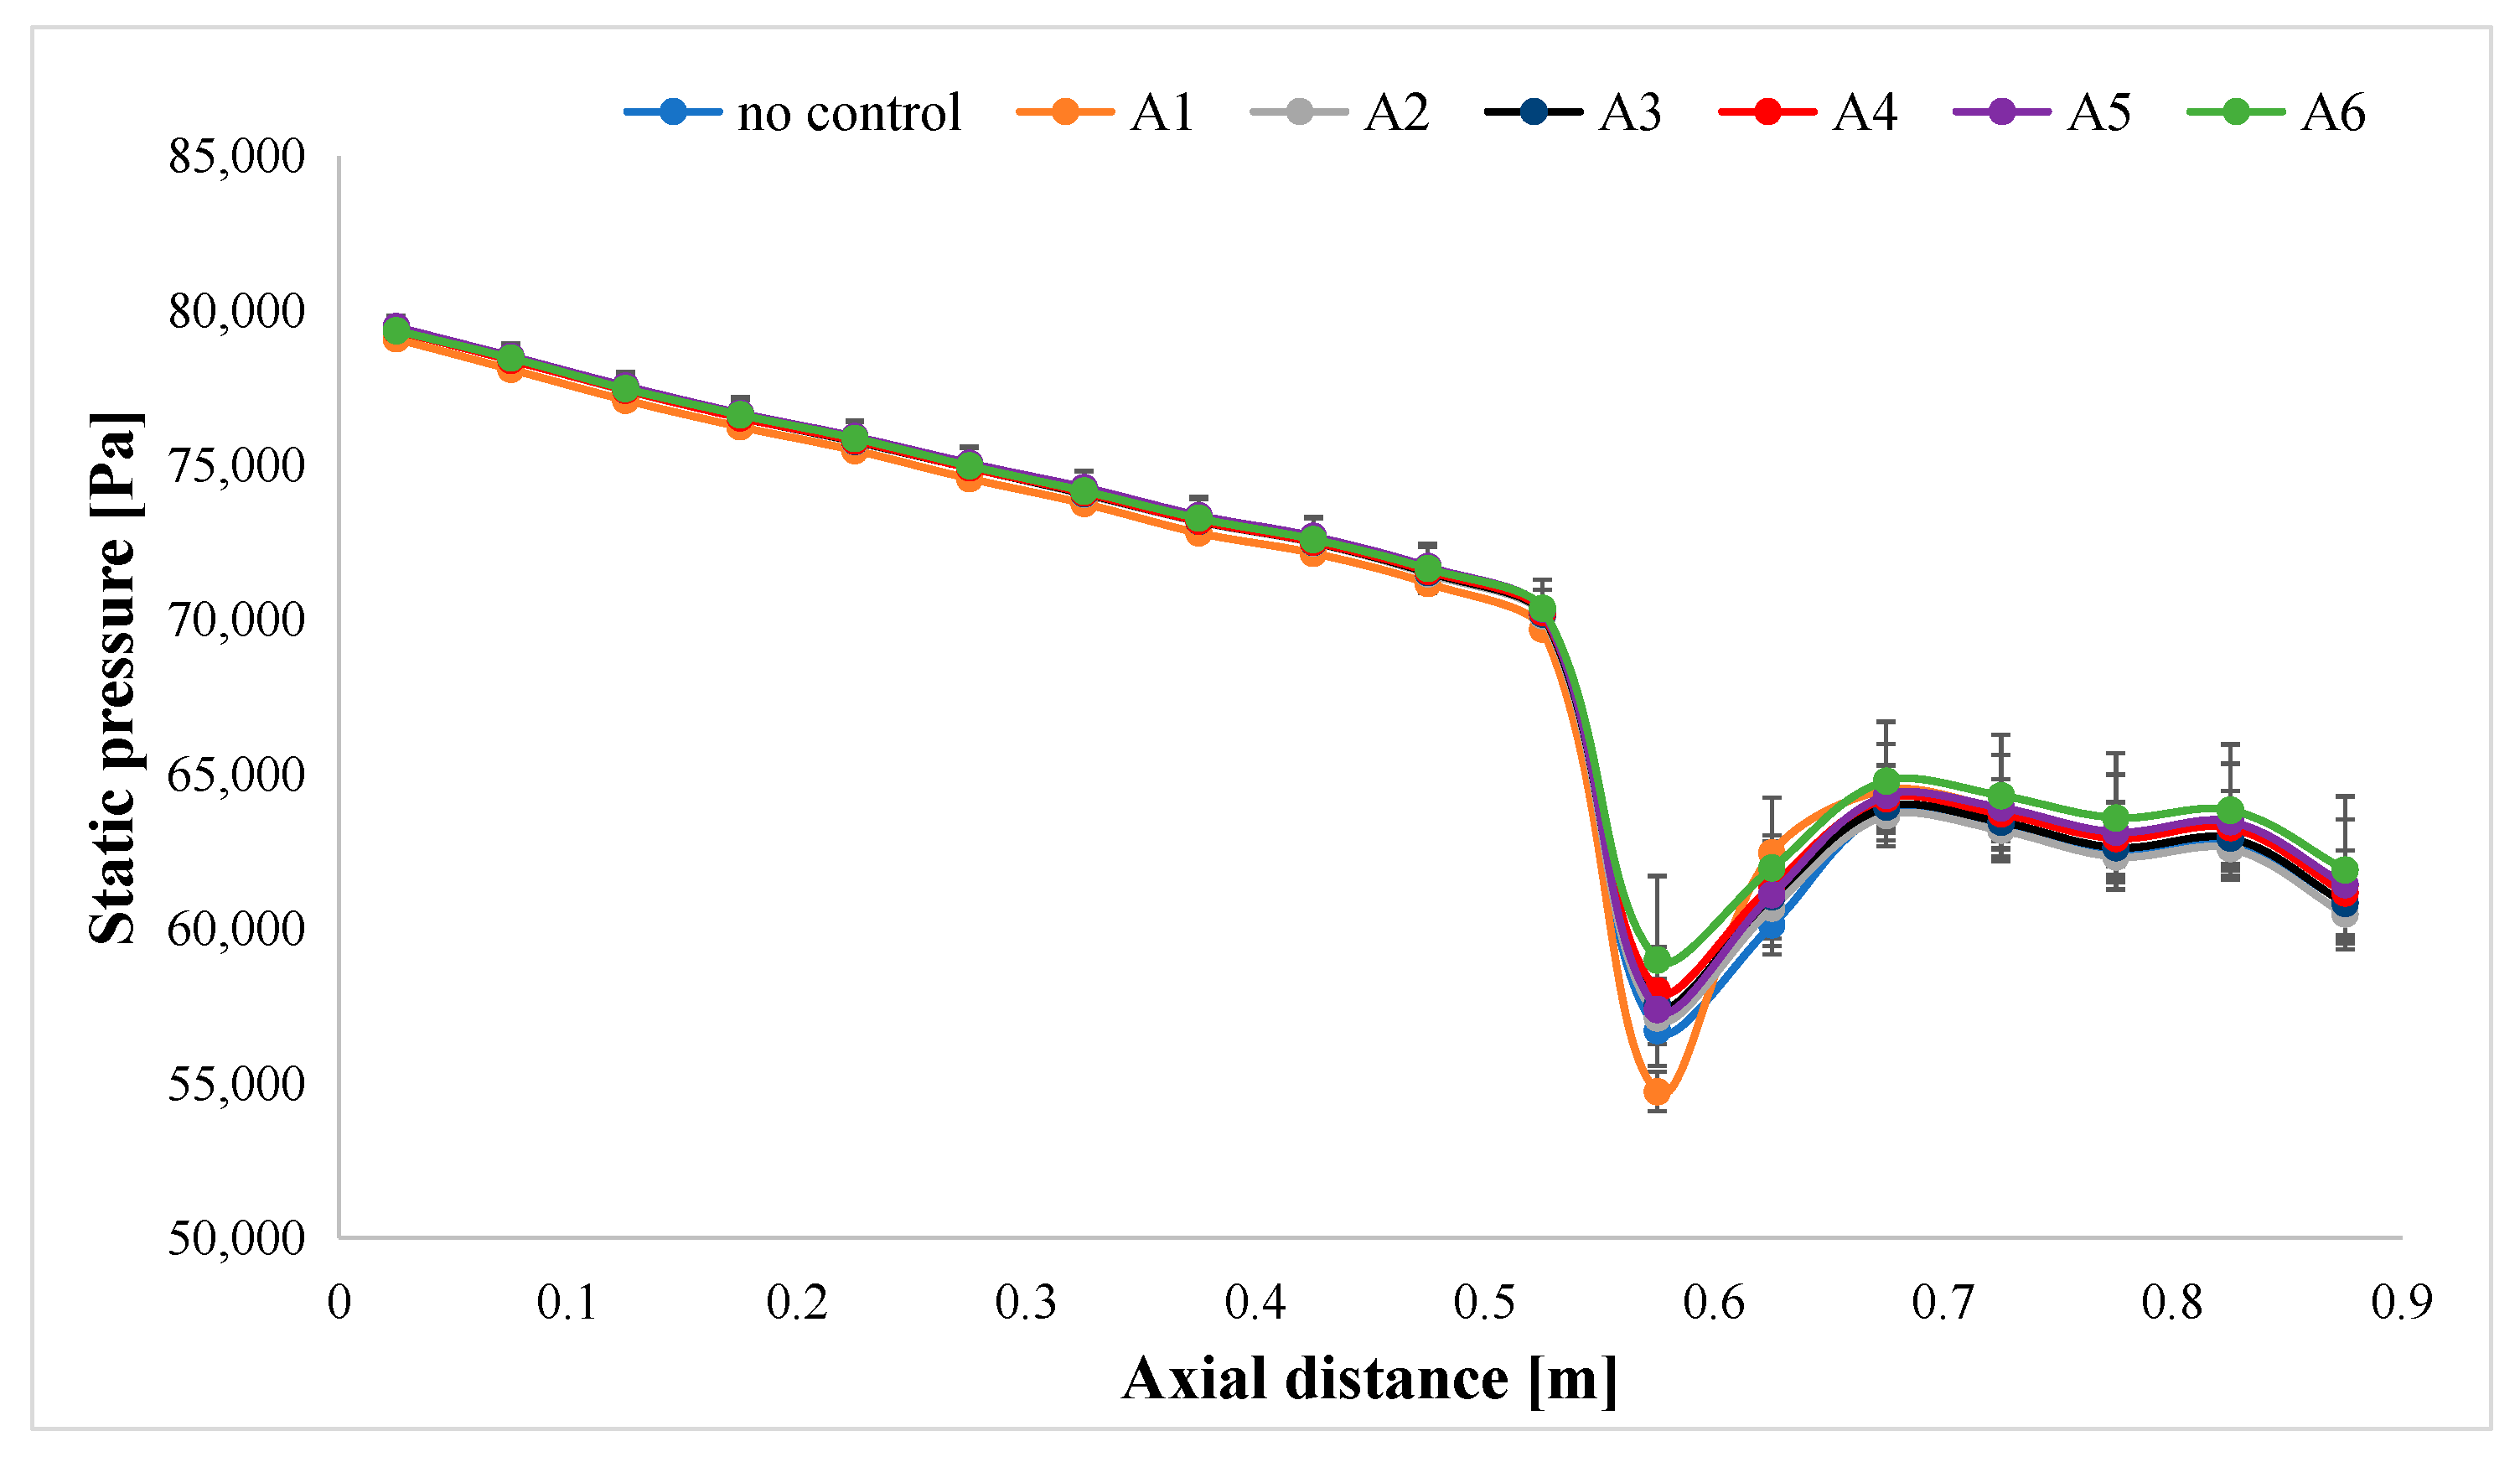
The static pressure distribution on the bottom wall of the wind tunnel is illustrated in Figure 9 and Figure 10 for seven distinct experiments. In the ‘no control’ scenario, the unaltered airfoil surface on the lower side is oriented towards the bottom wall of the wind tunnel, where static pressure taps are installed. For the other six tests, labeled A according to Table 1, the perforated plate with varying hole sizes is also placed on the lower side, facing the bottom wall. This configuration facilitates a comparison of the static pressure distribution on the bottom wall with and without the incorporation of the passive control method.
In the A1 case (metal perforated plate with 0.5 mm holes), the static pressure is notably lower than even the ‘no control’ case. This can be attributed to the absence of curvature on the metal perforated plate, altering the flow behavior and resulting in stronger local acceleration on the airfoil. The order of minimum static pressure in the control region (pressure tap no. 12), from lowest to highest, is as follows: A1, ‘no control’, A2, A5, A3, A4, and A6. According to the literature [14], the introduction of passive control with a perforated plate tends to limit local acceleration, resulting in slightly higher static pressure in the control region compared to the baseline ‘no control’ case. This effect is also observed in the current study, with the values summarized in Table 2. It is evident that as the hole size increases, the minimum static pressure attained is higher. The observed trend is not precisely followed by A5, which is attributed to limitations in the current experimental infrastructure.
For numerical validation, the A2 model was simulated in Ansys FLUENT utilizing a steady-state density-based solver to solve the flow equations, coupled with the k-ω SST turbulence closure model. Given the intricate nature of the computational domain, particularly regarding the passive control implementation (small diameter holes requiring discretization), Ansys Meshing was used for unstructured grid generation. Blade wall and wind tunnel wall inflation techniques were applied to locally refine the mesh, aiming for an accurate representation of the boundary layer, targeting a y+ value of 1. The Body of Influence method was employed to further refine the mesh in the airfoil proximity, while a sizing feature was used to enhance the grid resolution in the vicinity of the holes to accurately capture the induced recirculation flow in the cavity beneath the blade surface. Specifically, a fixed number of 50 elements was imposed on the hole diameter. The static pressure at the outlet patch was set to the value measured experimentally in the wind tunnel. Starting from the ambient pressure, the inlet total pressure was estimated using the total pressure loss on the honeycomb. The detailed figures for the imposed boundary conditions are reported in Table 3. The turbulence intensity on both inlet and outlet patches was set to 1%, while the estimated turbulent length scale was 0.2 cm using the same approach as before for the empty wind tunnel simulations. The computational grid, consisting of 35 million elements, is shown in Figure 11.
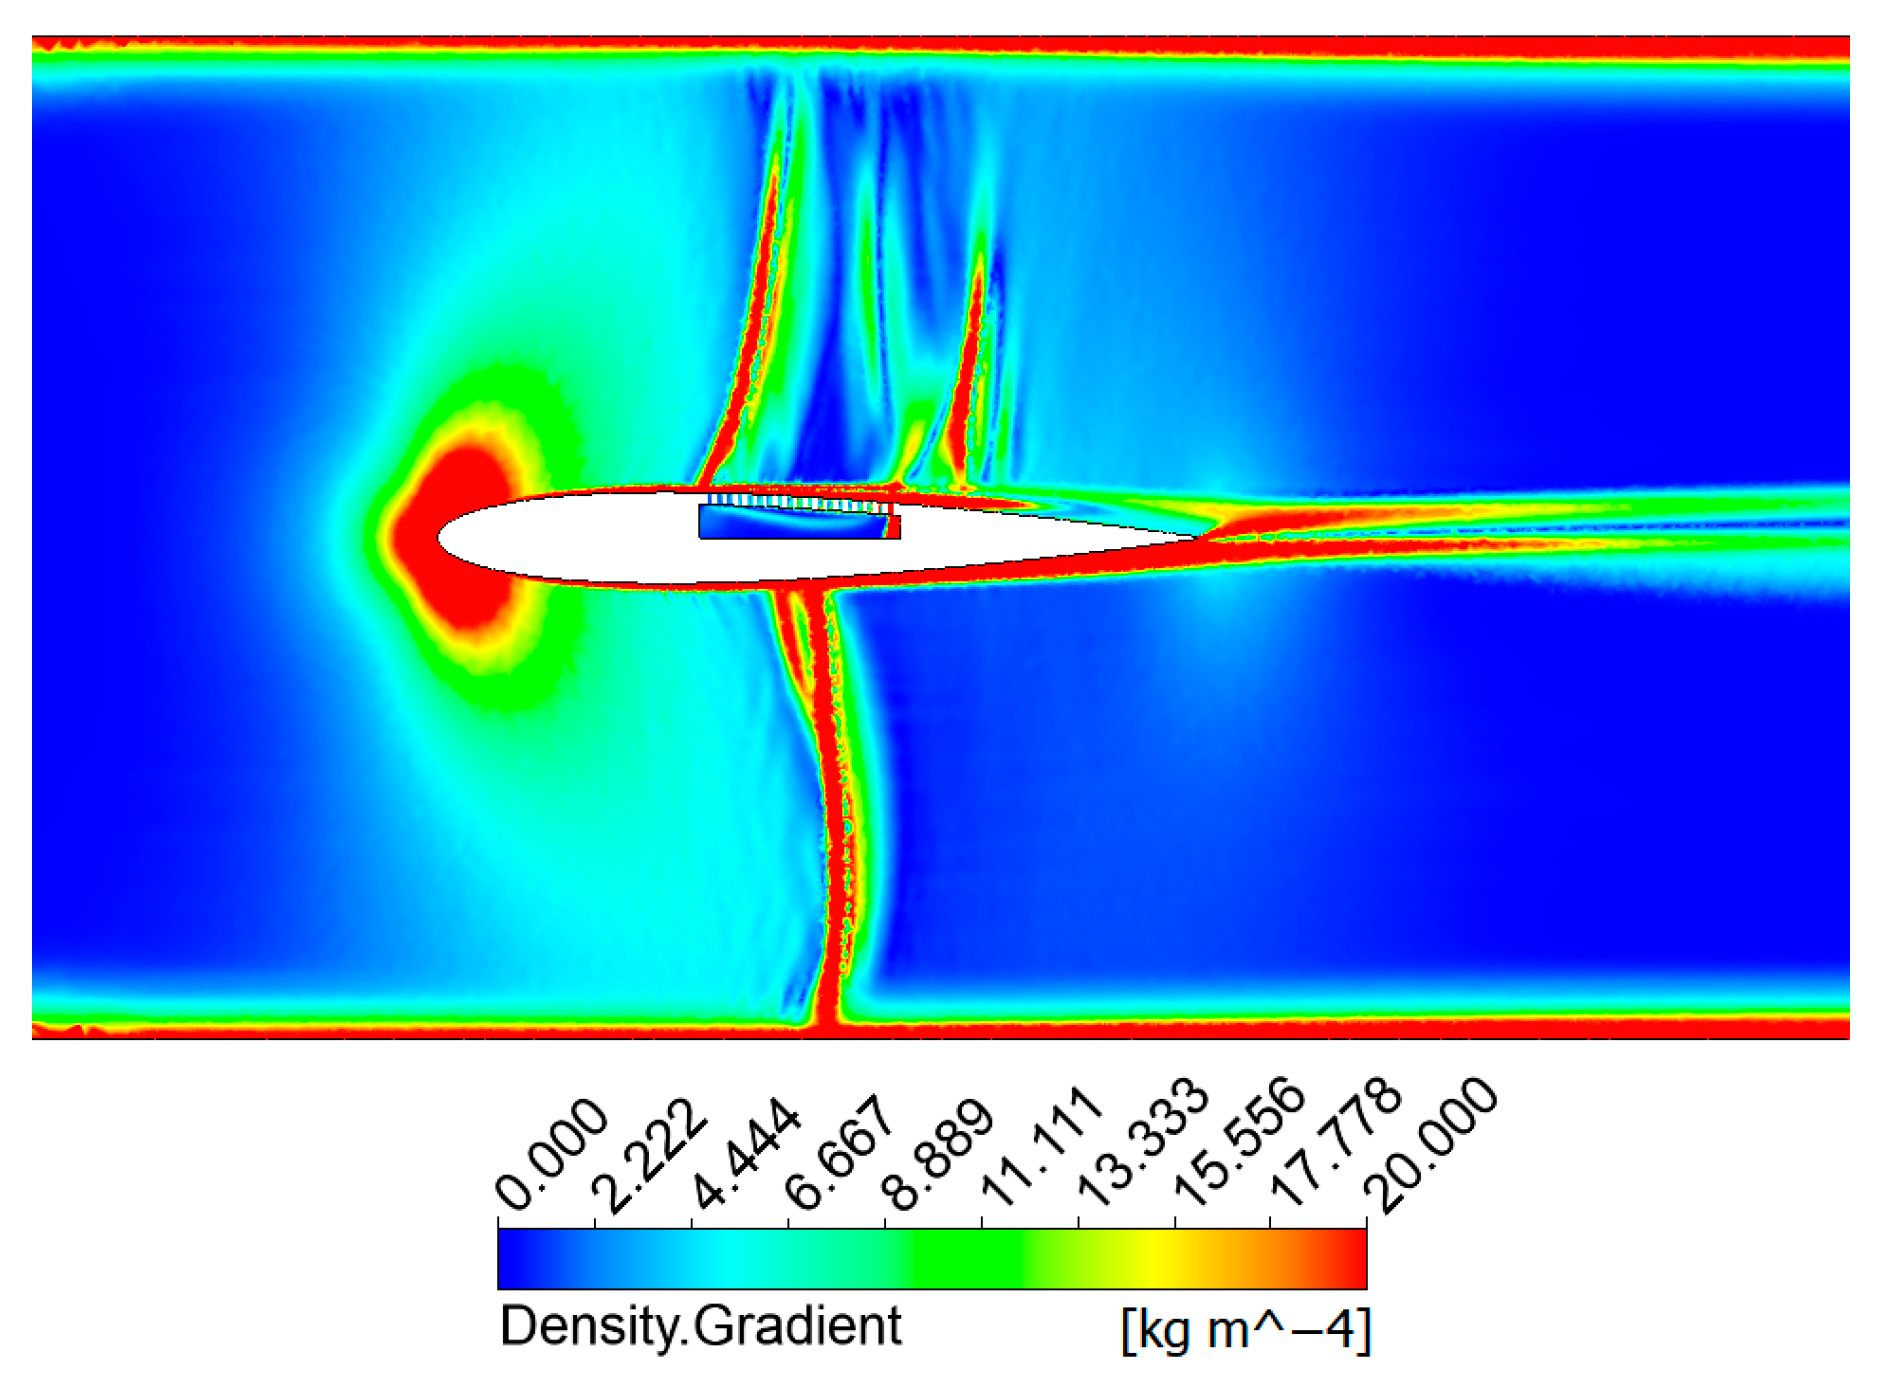
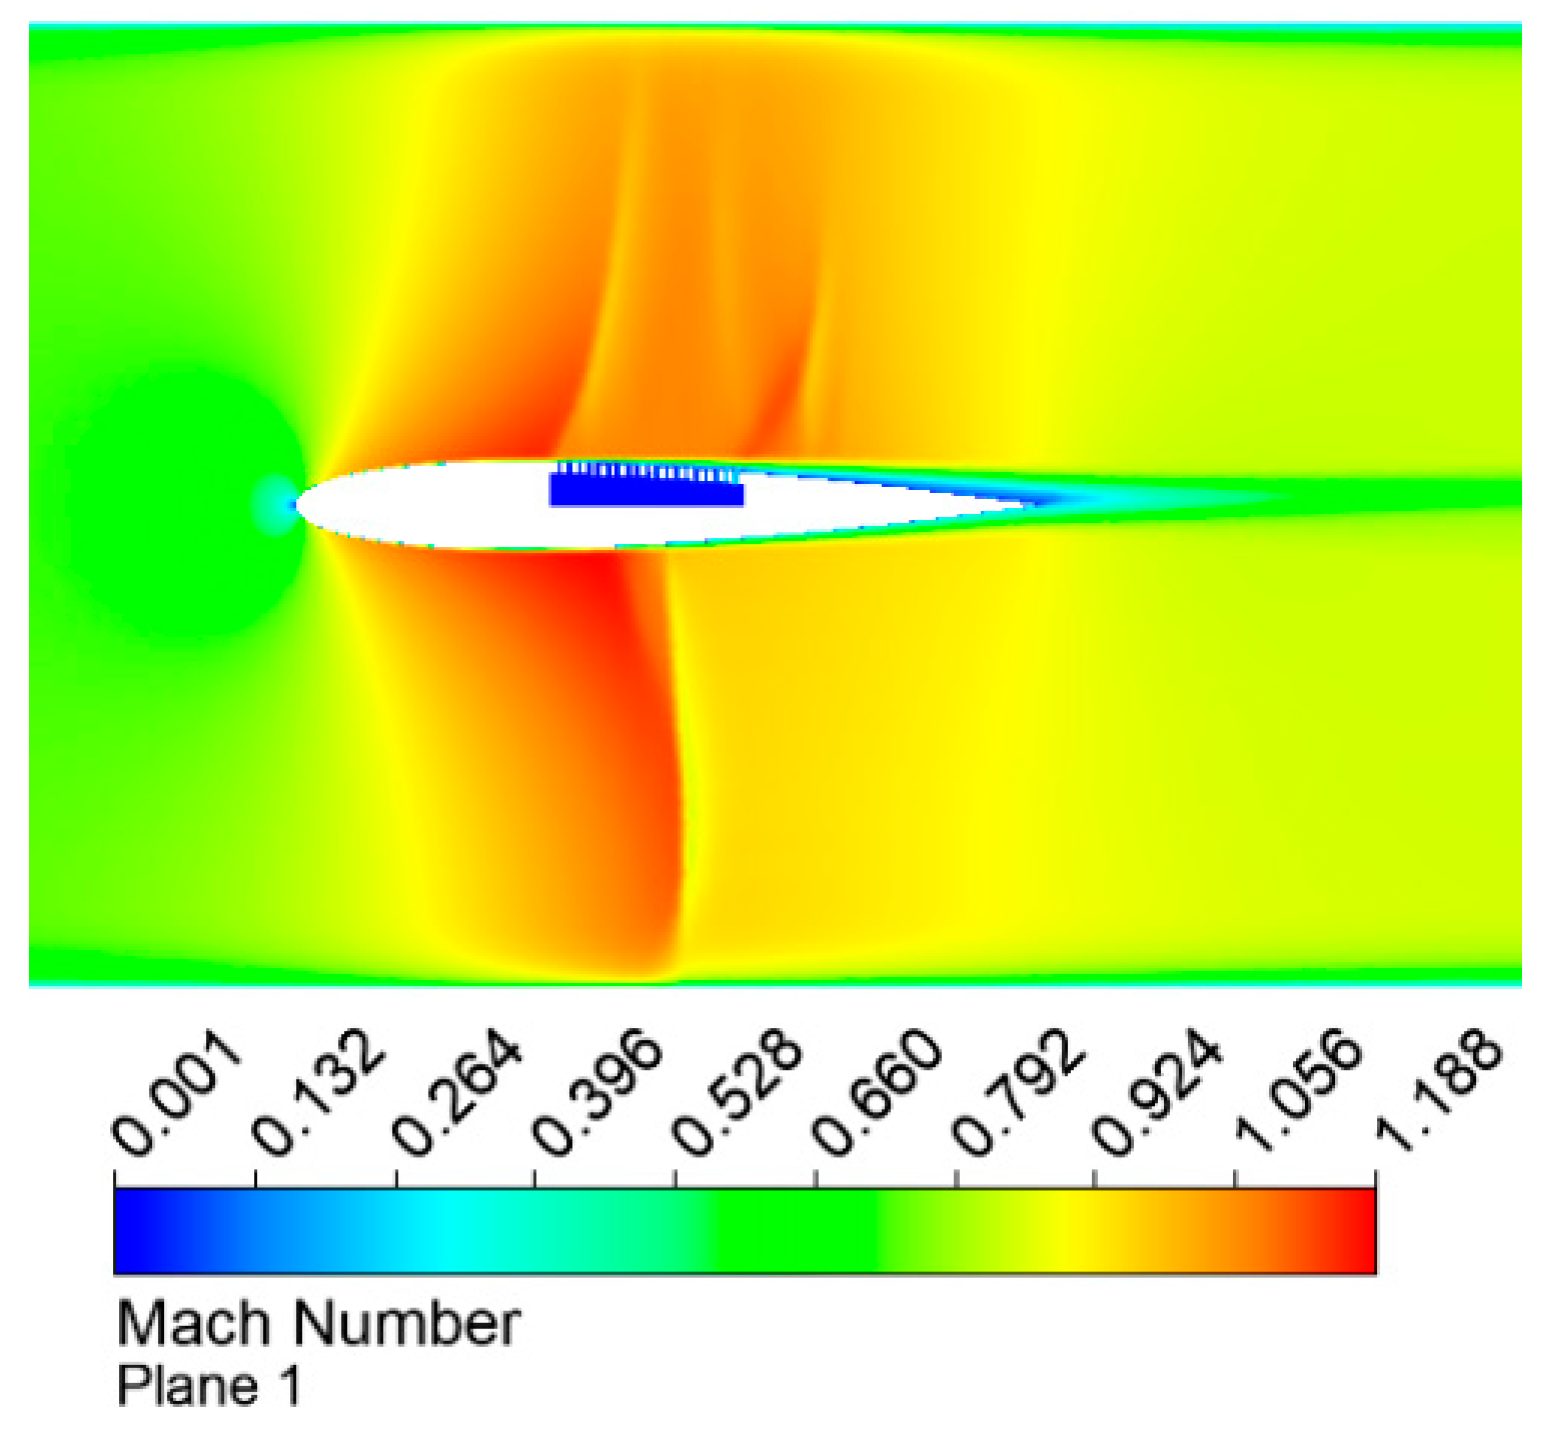
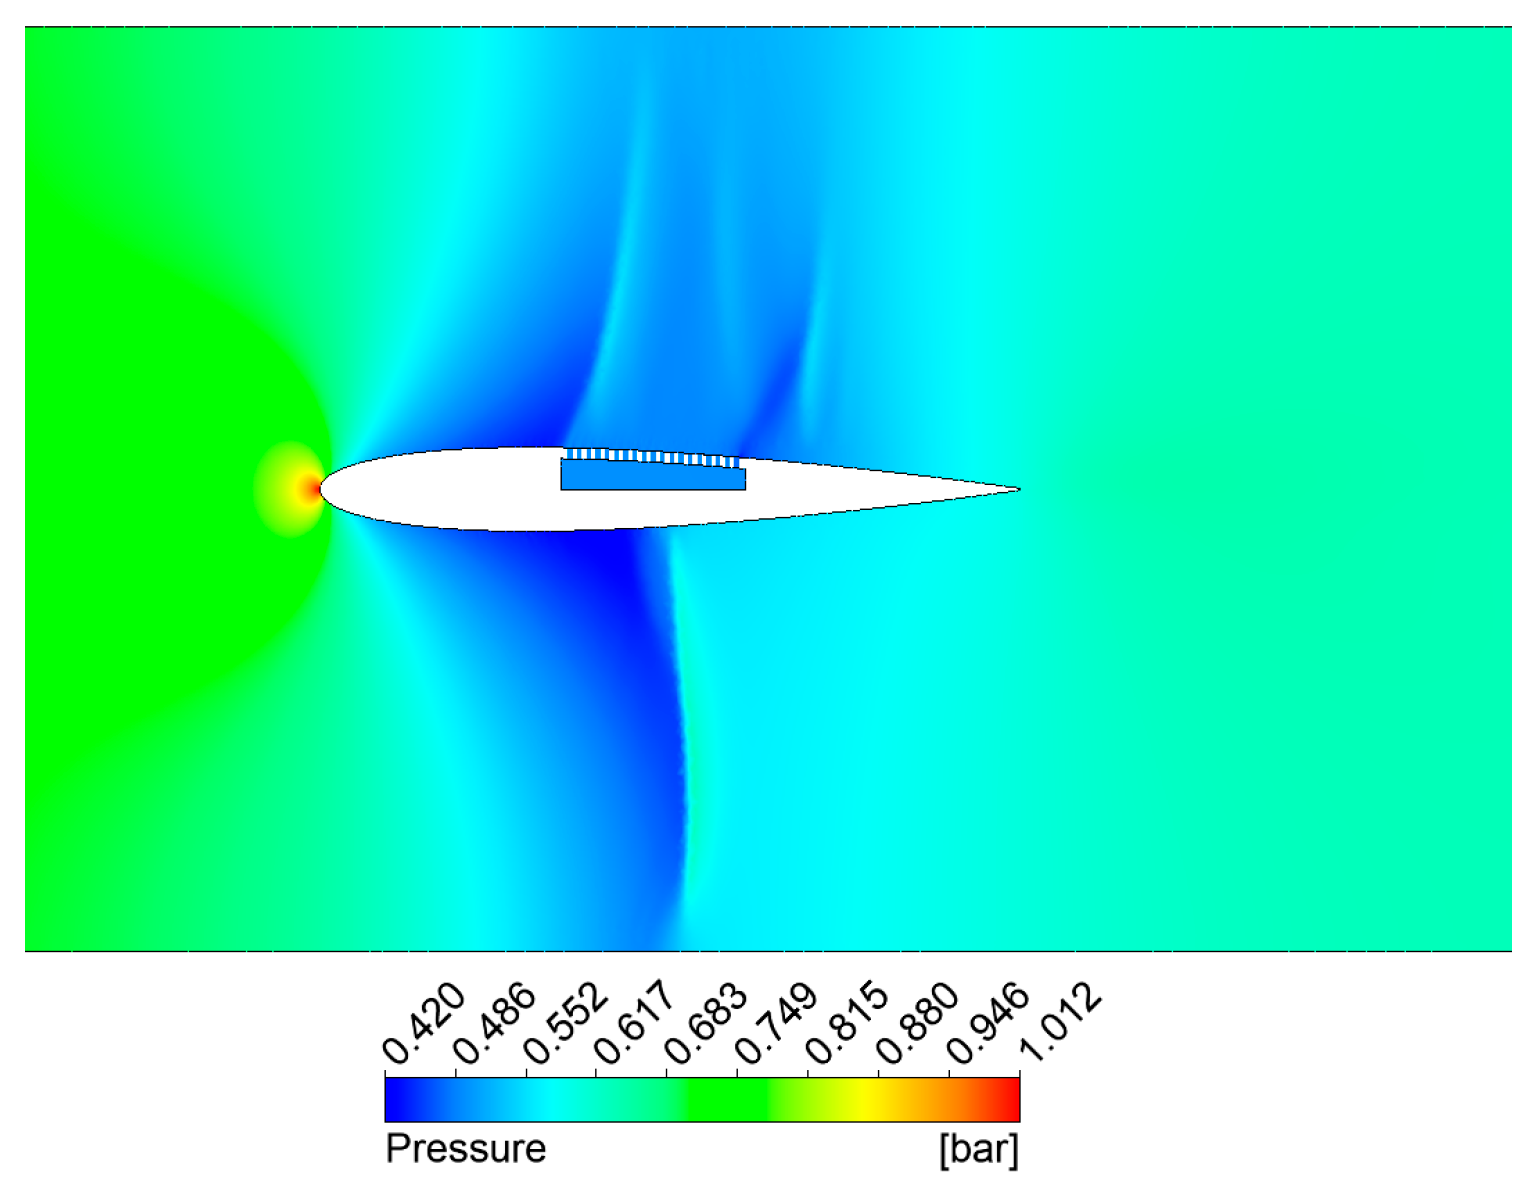
Figure 12, Figure 13 and Figure 14 depict the density gradient, Mach number, and static pressure distributions in proximity to the airfoil. One has to mention that for this simulation, the lower side surface is unaltered and will be referred to as ‘no control’, while the upper side incorporates the perforated plate with a cavity underneath (0.5 mm holes), referred to as ‘passive control’.
In Figure 12, the density gradient plot reveals a normal shock wave for the lower side (no control), and an emerging ‘lambda’-type shock structure on the upper side (passive control applied). Additionally, on the upper side, an additional shock wave appears at the end of the perforated cavity. The presence of a shear inside the cavity confirms the existence of a recirculation flow inside. An observed boundary layer thickening above the perforated plate suggests potential additional viscous losses due to localized increased apparent roughness. The normal shock on the lower side and its ‘lambda’-type alteration on the upper side are highlighted by the Mach number in Figure 13 and the static pressure in Figure 14. From the total pressure plotted in Figure 15, it can be observed that the porous wall leads to minor pressure losses. This implies that the porous material has minimal impact on energy loss within the airflow. This is a promising result as it indicates that the porous walls effectively serve their purpose without substantially compromising the airfoil’s aerodynamic performance.
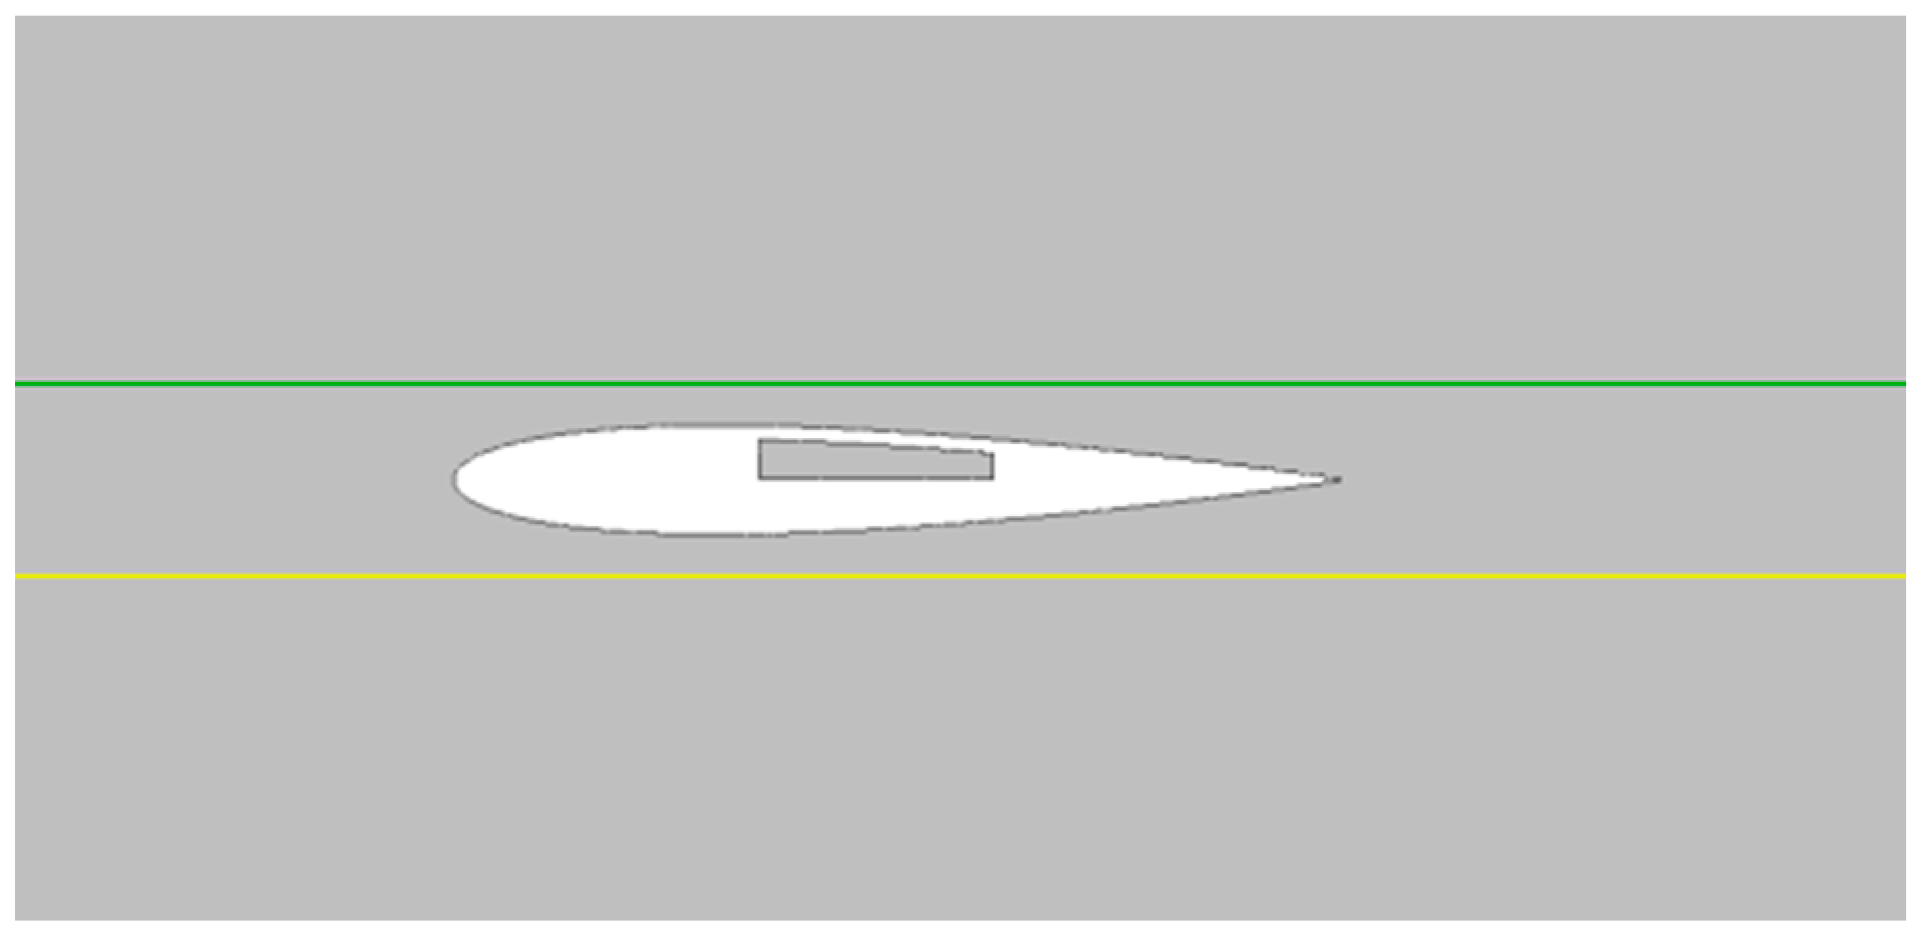
Reference lines are depicted in Figure 16 to facilitate the plotting of flow quantities in the axial direction. The yellow line (lower side) is indicative of the ‘no control’ case, while the green line (upper side) is representative of the ‘passive control’ case.
Examining the static pressure in Figure 17, the minimum pressure in the passive control scenario is slightly higher (around 2000 Pa) compared to the ‘no control’ region of the airfoil. Additionally, the substantial pressure gradient observed in the ‘no control’ case is replaced by a series of recompressions in the passive control case. These recompressions exhibit weaker magnitudes and smaller slopes. The same trend is highlighted in the Mach number plots in Figure 18, where the passive control exhibits reduced slopes and magnitudes for the Mach number decrease.
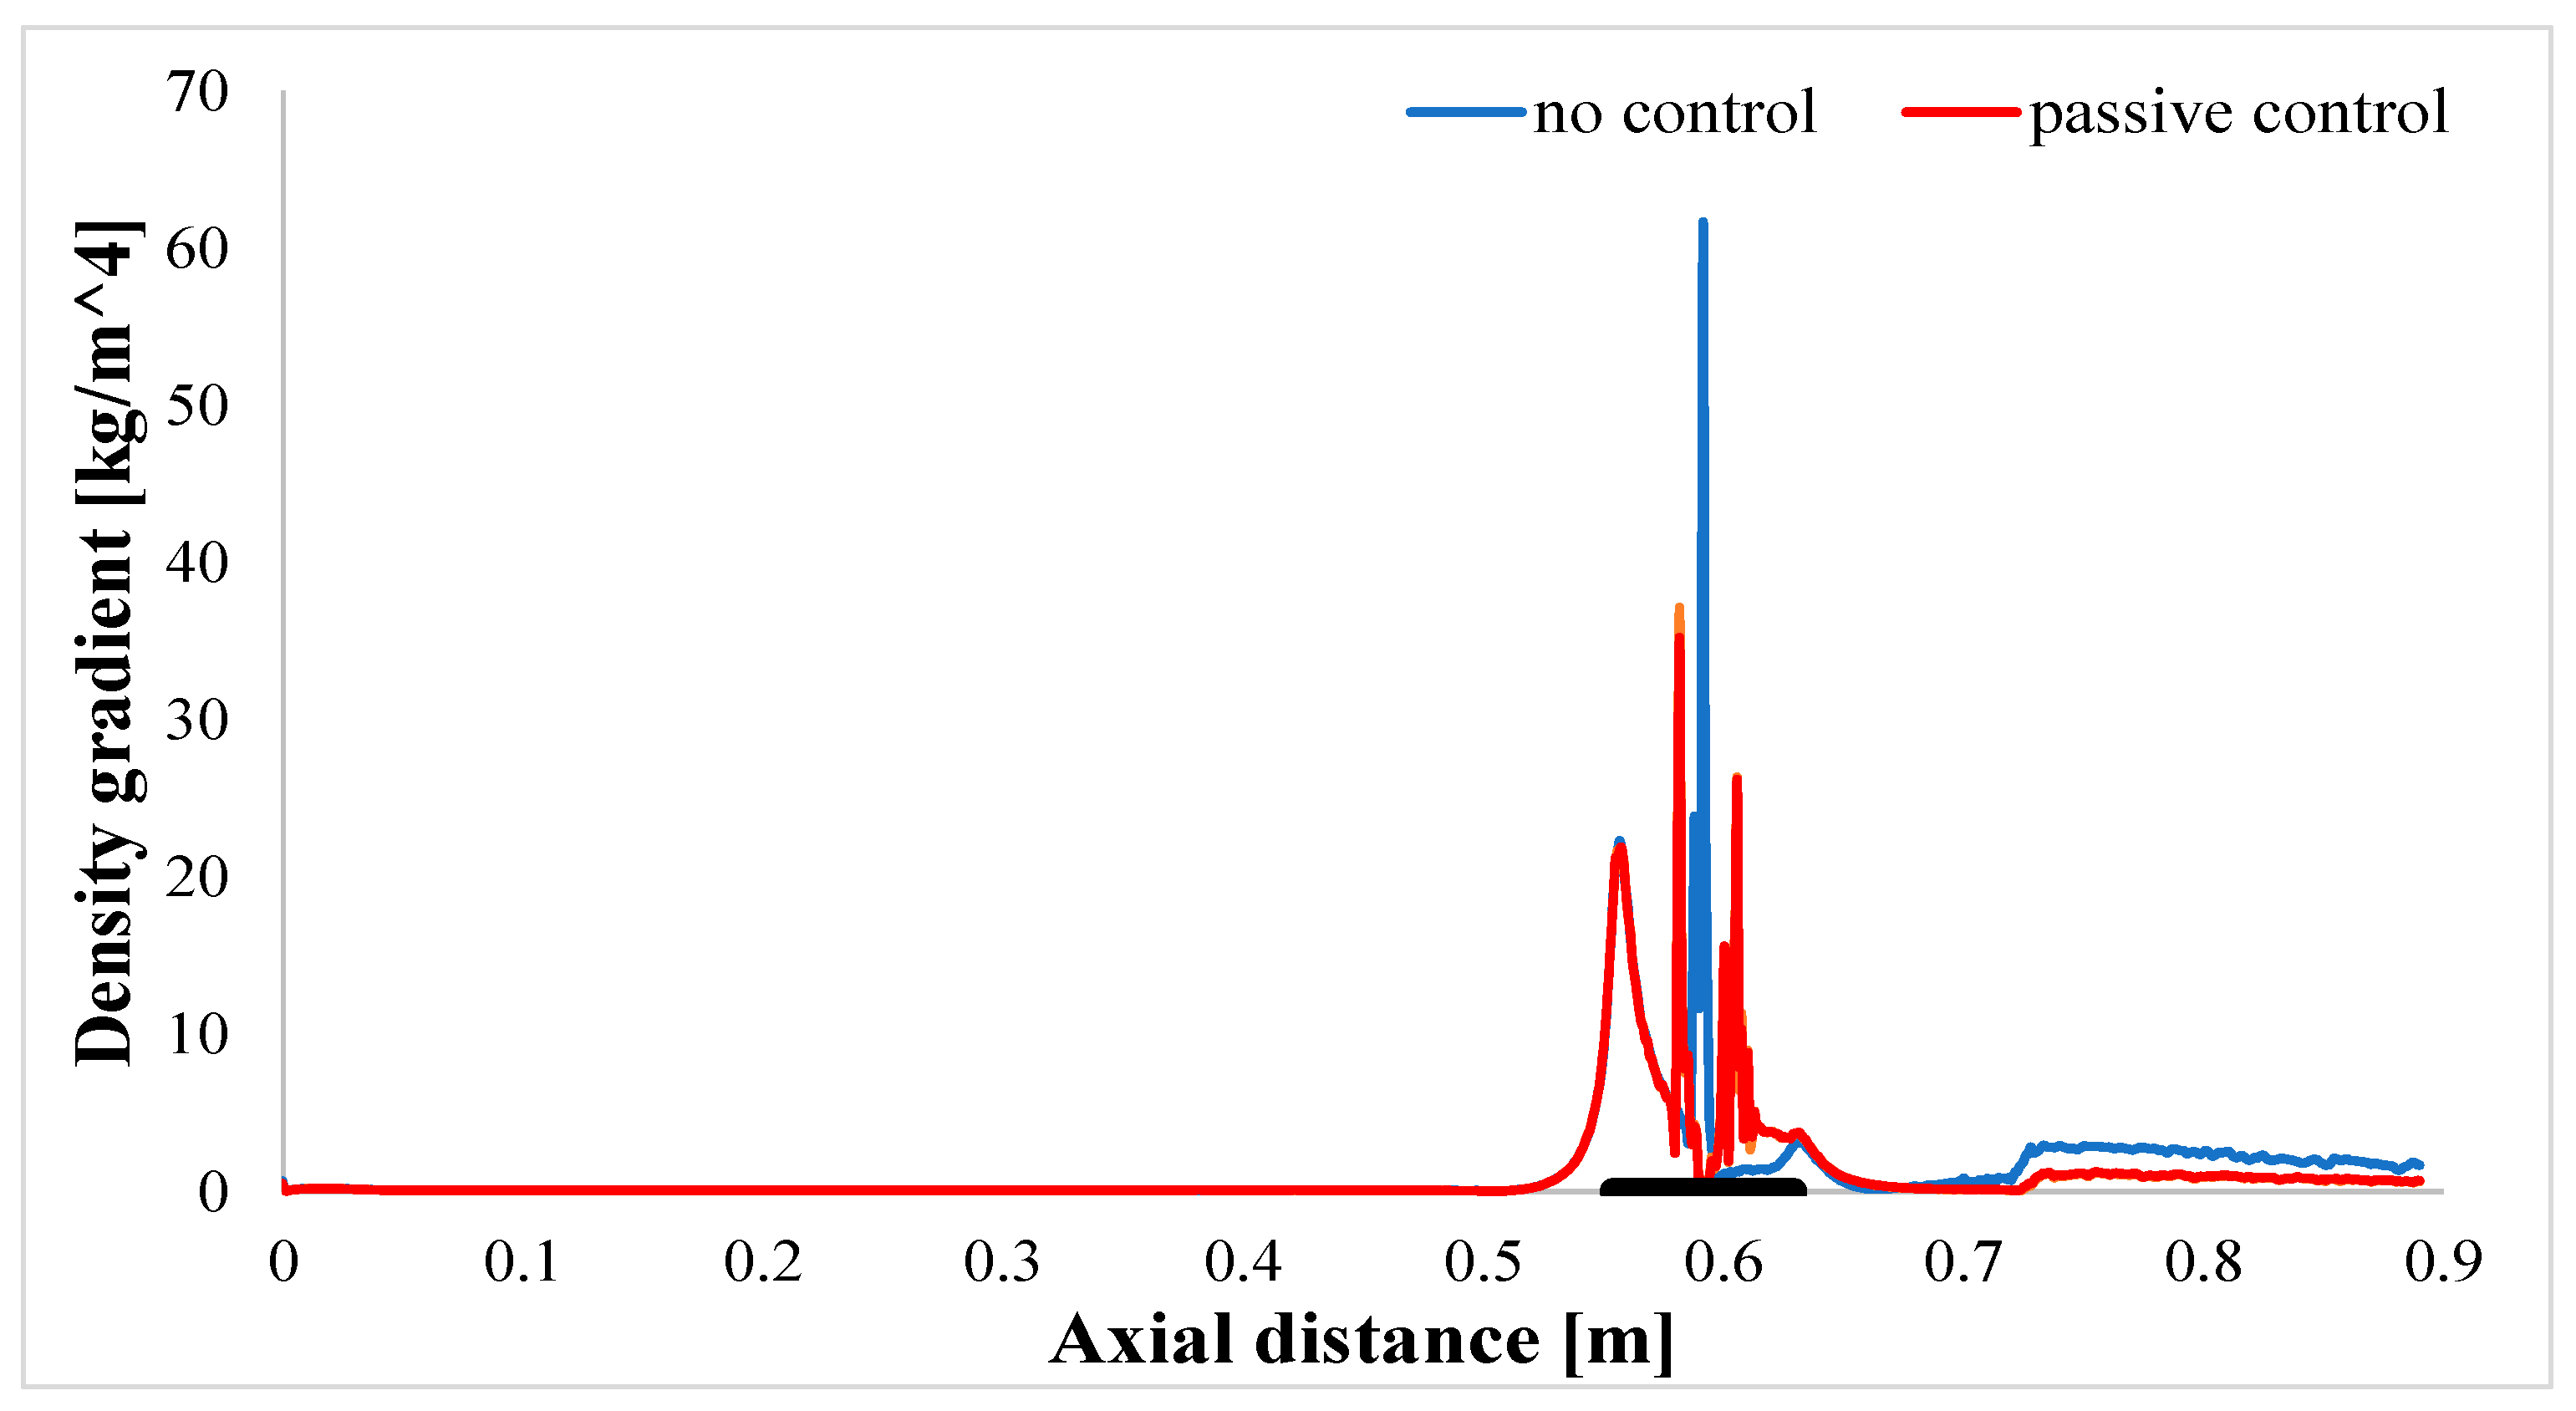
In the density gradient plot (Figure 19), the incorporation of the perforated plate reduces the maximum density gradient in the ‘no control’ case by over 30%. The presence of the second shock wave at the end of the perforated plate, as explained in Figure 12, is corroborated by the Mach and density plots in Figure 18 and Figure 19. The magnitude of this second shock is comparatively reduced.
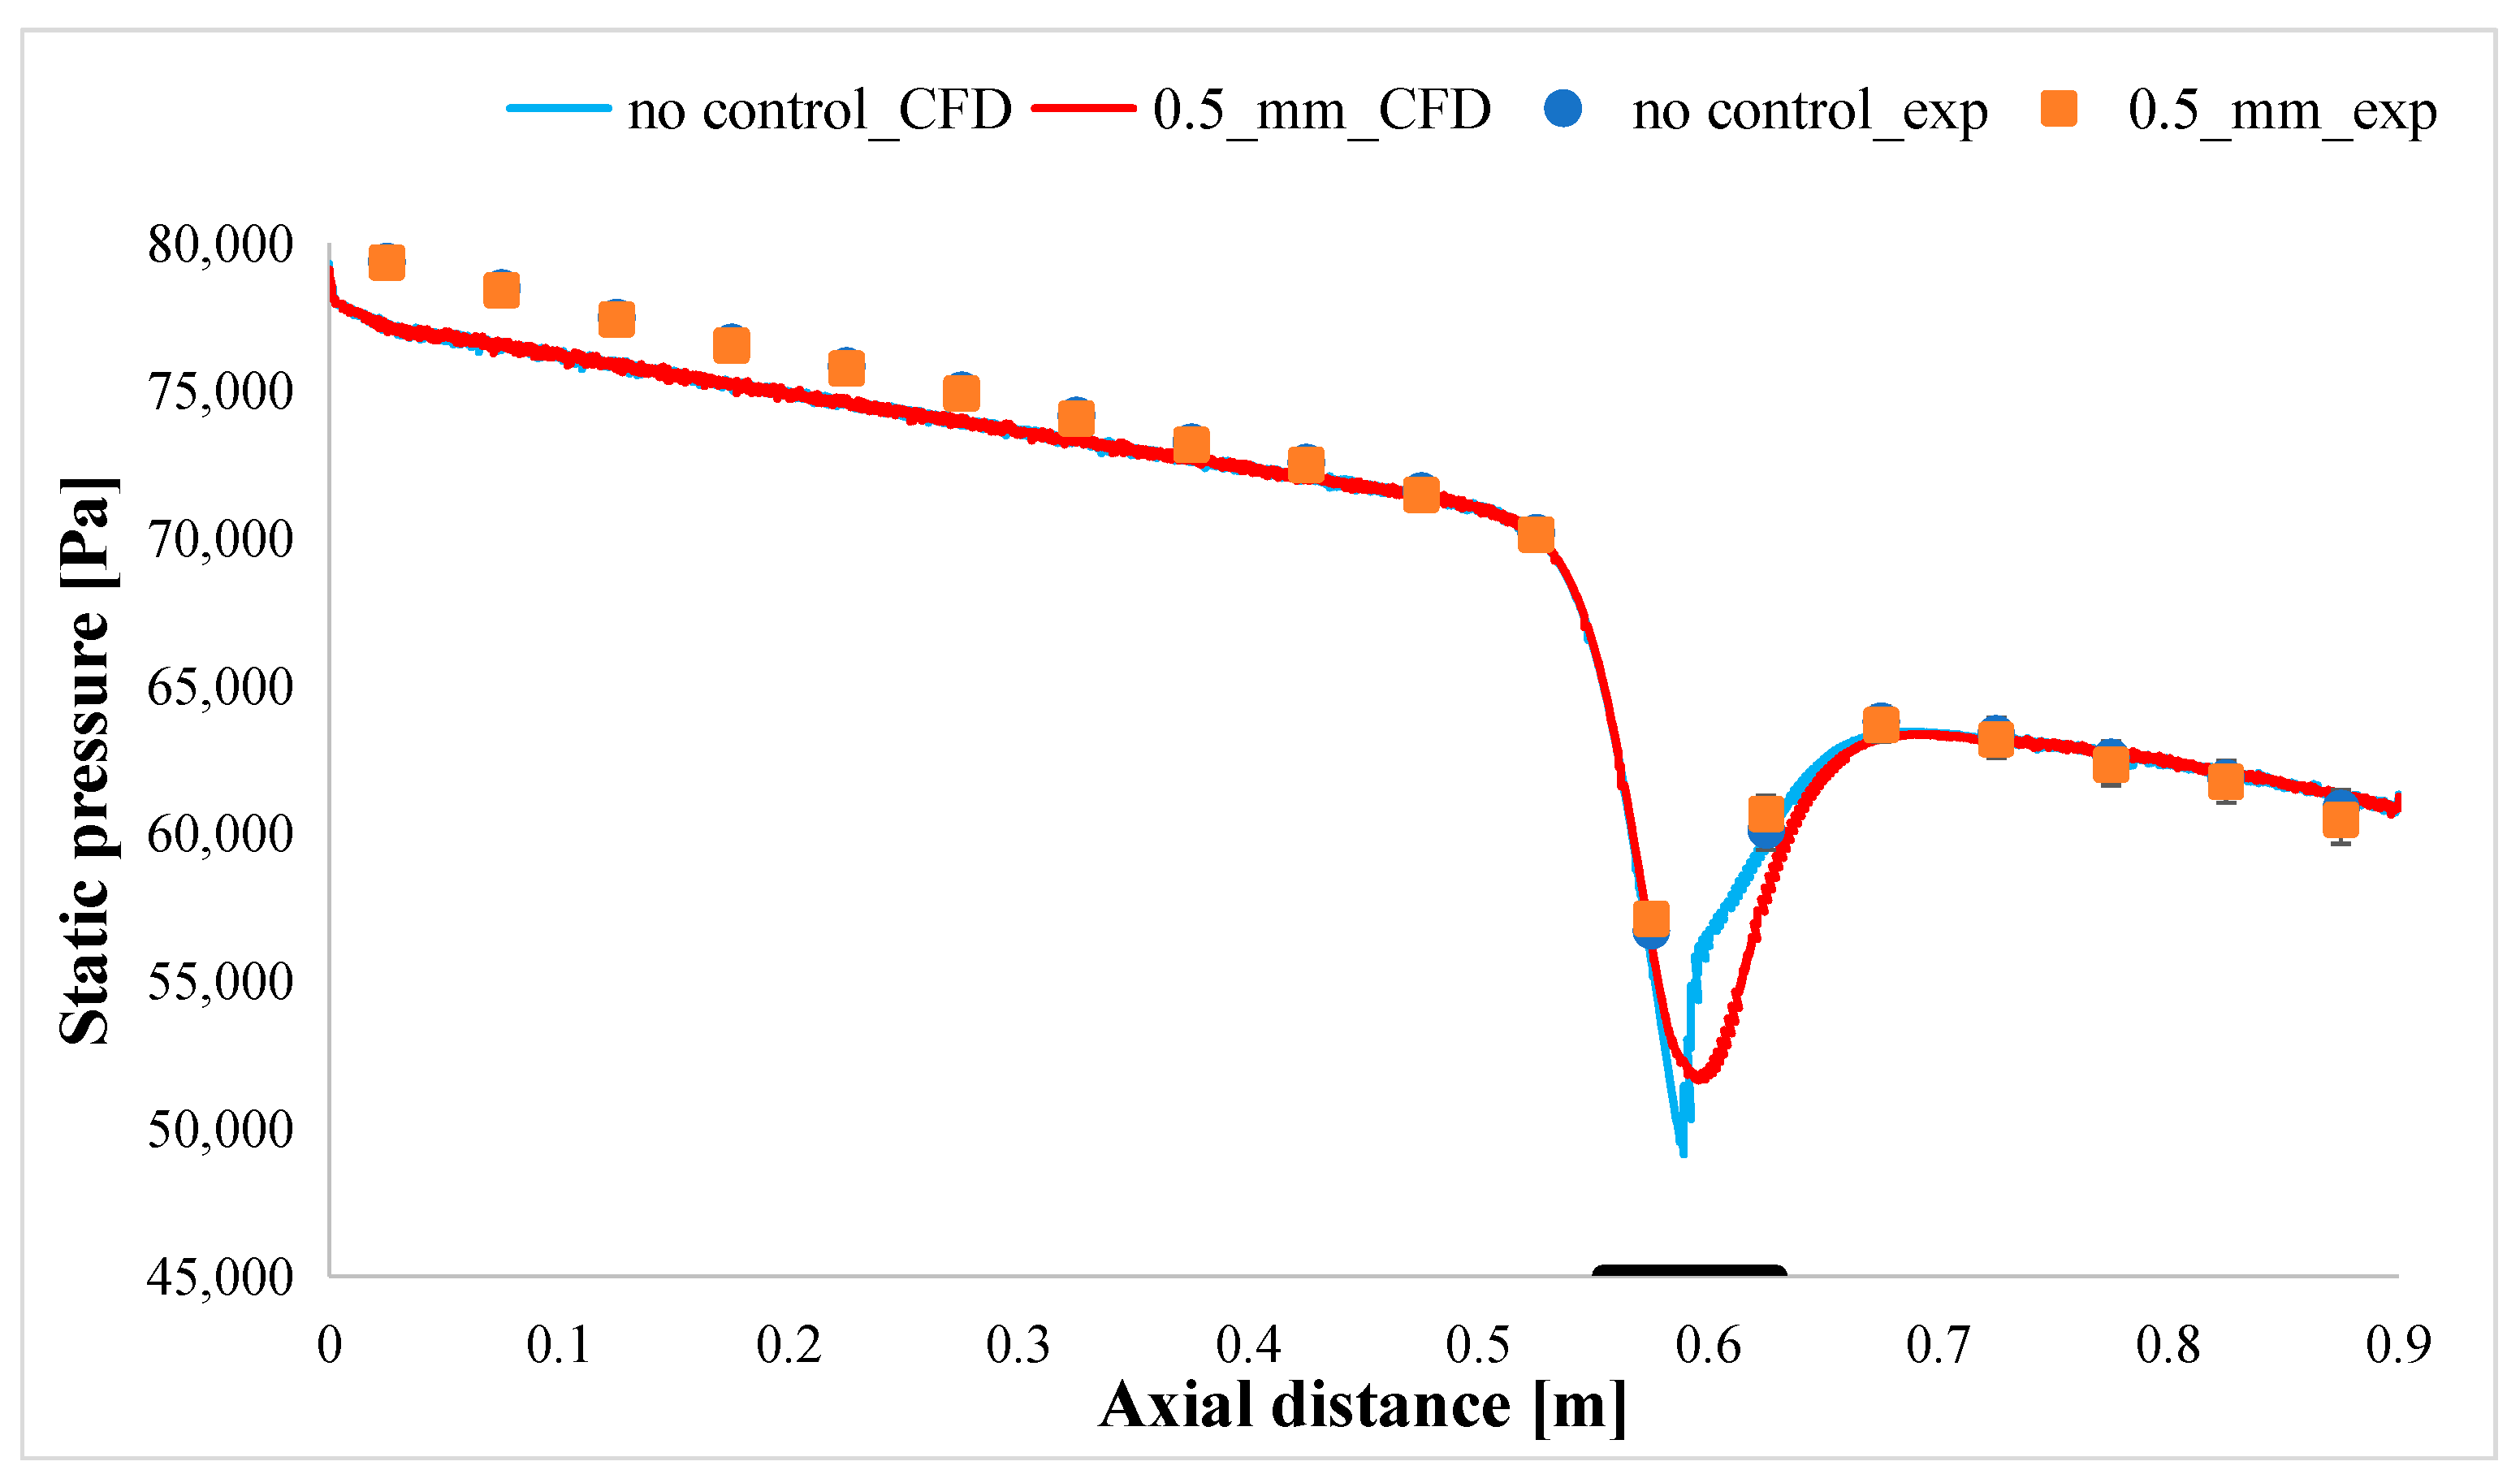
In Figure 20, the static pressure distribution obtained from A2 model airfoil experimental measurements on the wind tunnel’s bottom wall is juxtaposed with the corresponding CFD results for both the ‘no control’ and ‘passive control’ cases featuring 0.5 mm holes. The initial ten experimental points show slight deviations from the CFD results, with a maximum difference of 2.5% observed at the wind tunnel inlet. This is motivated by the inherent imprecision in experimentally determining the total pressure loss introduced by the honeycomb. However, the last eight experimental points, along with their computed confidence interval, faithfully replicate the CFD results. Notably, in the airfoil region, the experimental pressure from the ‘passive control’ case slightly exceeds that of the ‘no control’ case, aligning with the earlier findings in Figure 17. Subsequently, Figure 21 offers a comparison between the experimental and numerical Schlieren results. The findings qualitatively align, depicting a normal shock on the lower side and a ‘lambda’ structure shock wave on the upper side with a second shock downstream.
For a comprehensive analysis, a 3D CFD simulation of the NACA0012 airfoil with no control (upper and lower sides are not altered), referred to as the ‘baseline’, was conducted. The simulation setup and boundary conditions remained identical to those in previous simulations. Table 3 presents a comparison of the mass-averaged results between the baseline and the passive control case with 0.5 mm holes. Maintaining identical total pressure at the inlet patch and static pressure at the outlet patch, the passive control case exhibits a 0.2% improvement in total pressure loss. This improvement is attributed to the perforated plate’s capability to diminish the intensity of the shock wave anchored above. Ultimately, the trade-off between increased viscous losses due to additional roughness and reduced shock losses results in an overall decrease in total pressure loss from the inlet to the outlet.
Since this is a symmetrical profile, lift and drag components are quite small and susceptible to unsteady fluctuations and shockwave–boundary layer interactions. Table 4 shows a breakdown of the viscous and pressure components of the two forces, which result from the pressure and shear stress distribution depicted in Figure 22 and Figure 23. A first remark is that even for the symmetrical airfoil, there still is a residual pressure lift fluctuation due to a relatively low Reynolds number and the fluctuations in the wake—not unlike the von Karman vortex street (albeit much less discernible).
Comparing overall drag of the baseline against the passive control airfoil, the latter fared slightly worse because of the pressure component. There are two distinctive regions that can be identified in Figure 22: the first, the front region of the porous wall in which the static pressure is lower on the baseline; and a second region spanning from the middle of the porous wall to the trailing edge, in which the static pressure is higher for the baseline. The significance of these two regions is that the second region has a much greater effect on the drag because of the angle of the airfoil wall, whereas the first region has virtually no influence on drag since the pressure differences apply to a horizontal oriented region of the airfoil.
Therefore, the drag increase is circumstantial and can be eliminated if the airfoil is placed at a different angle of attack. However, the benefit is that the viscous drag is actually reduced from the beginning of the porous region all the way to the trailing edge. It must be said also that this metric is skewed by a small separation region following the porous region and so the values after 0.05 m should not be factored in as “improvements”. Lift is also affected and the asymmetric geometry of the passive control airfoil leads to a zero angle of attack lift force when compared to the baseline. However, the two zones mentioned earlier also come into focus since they behave antagonistically. The first region negatively contributes and the second more extended region positively contributes. The two zones display a sharp transition and have application points very close to each other. This means a negligible impact on the momentum coefficient.
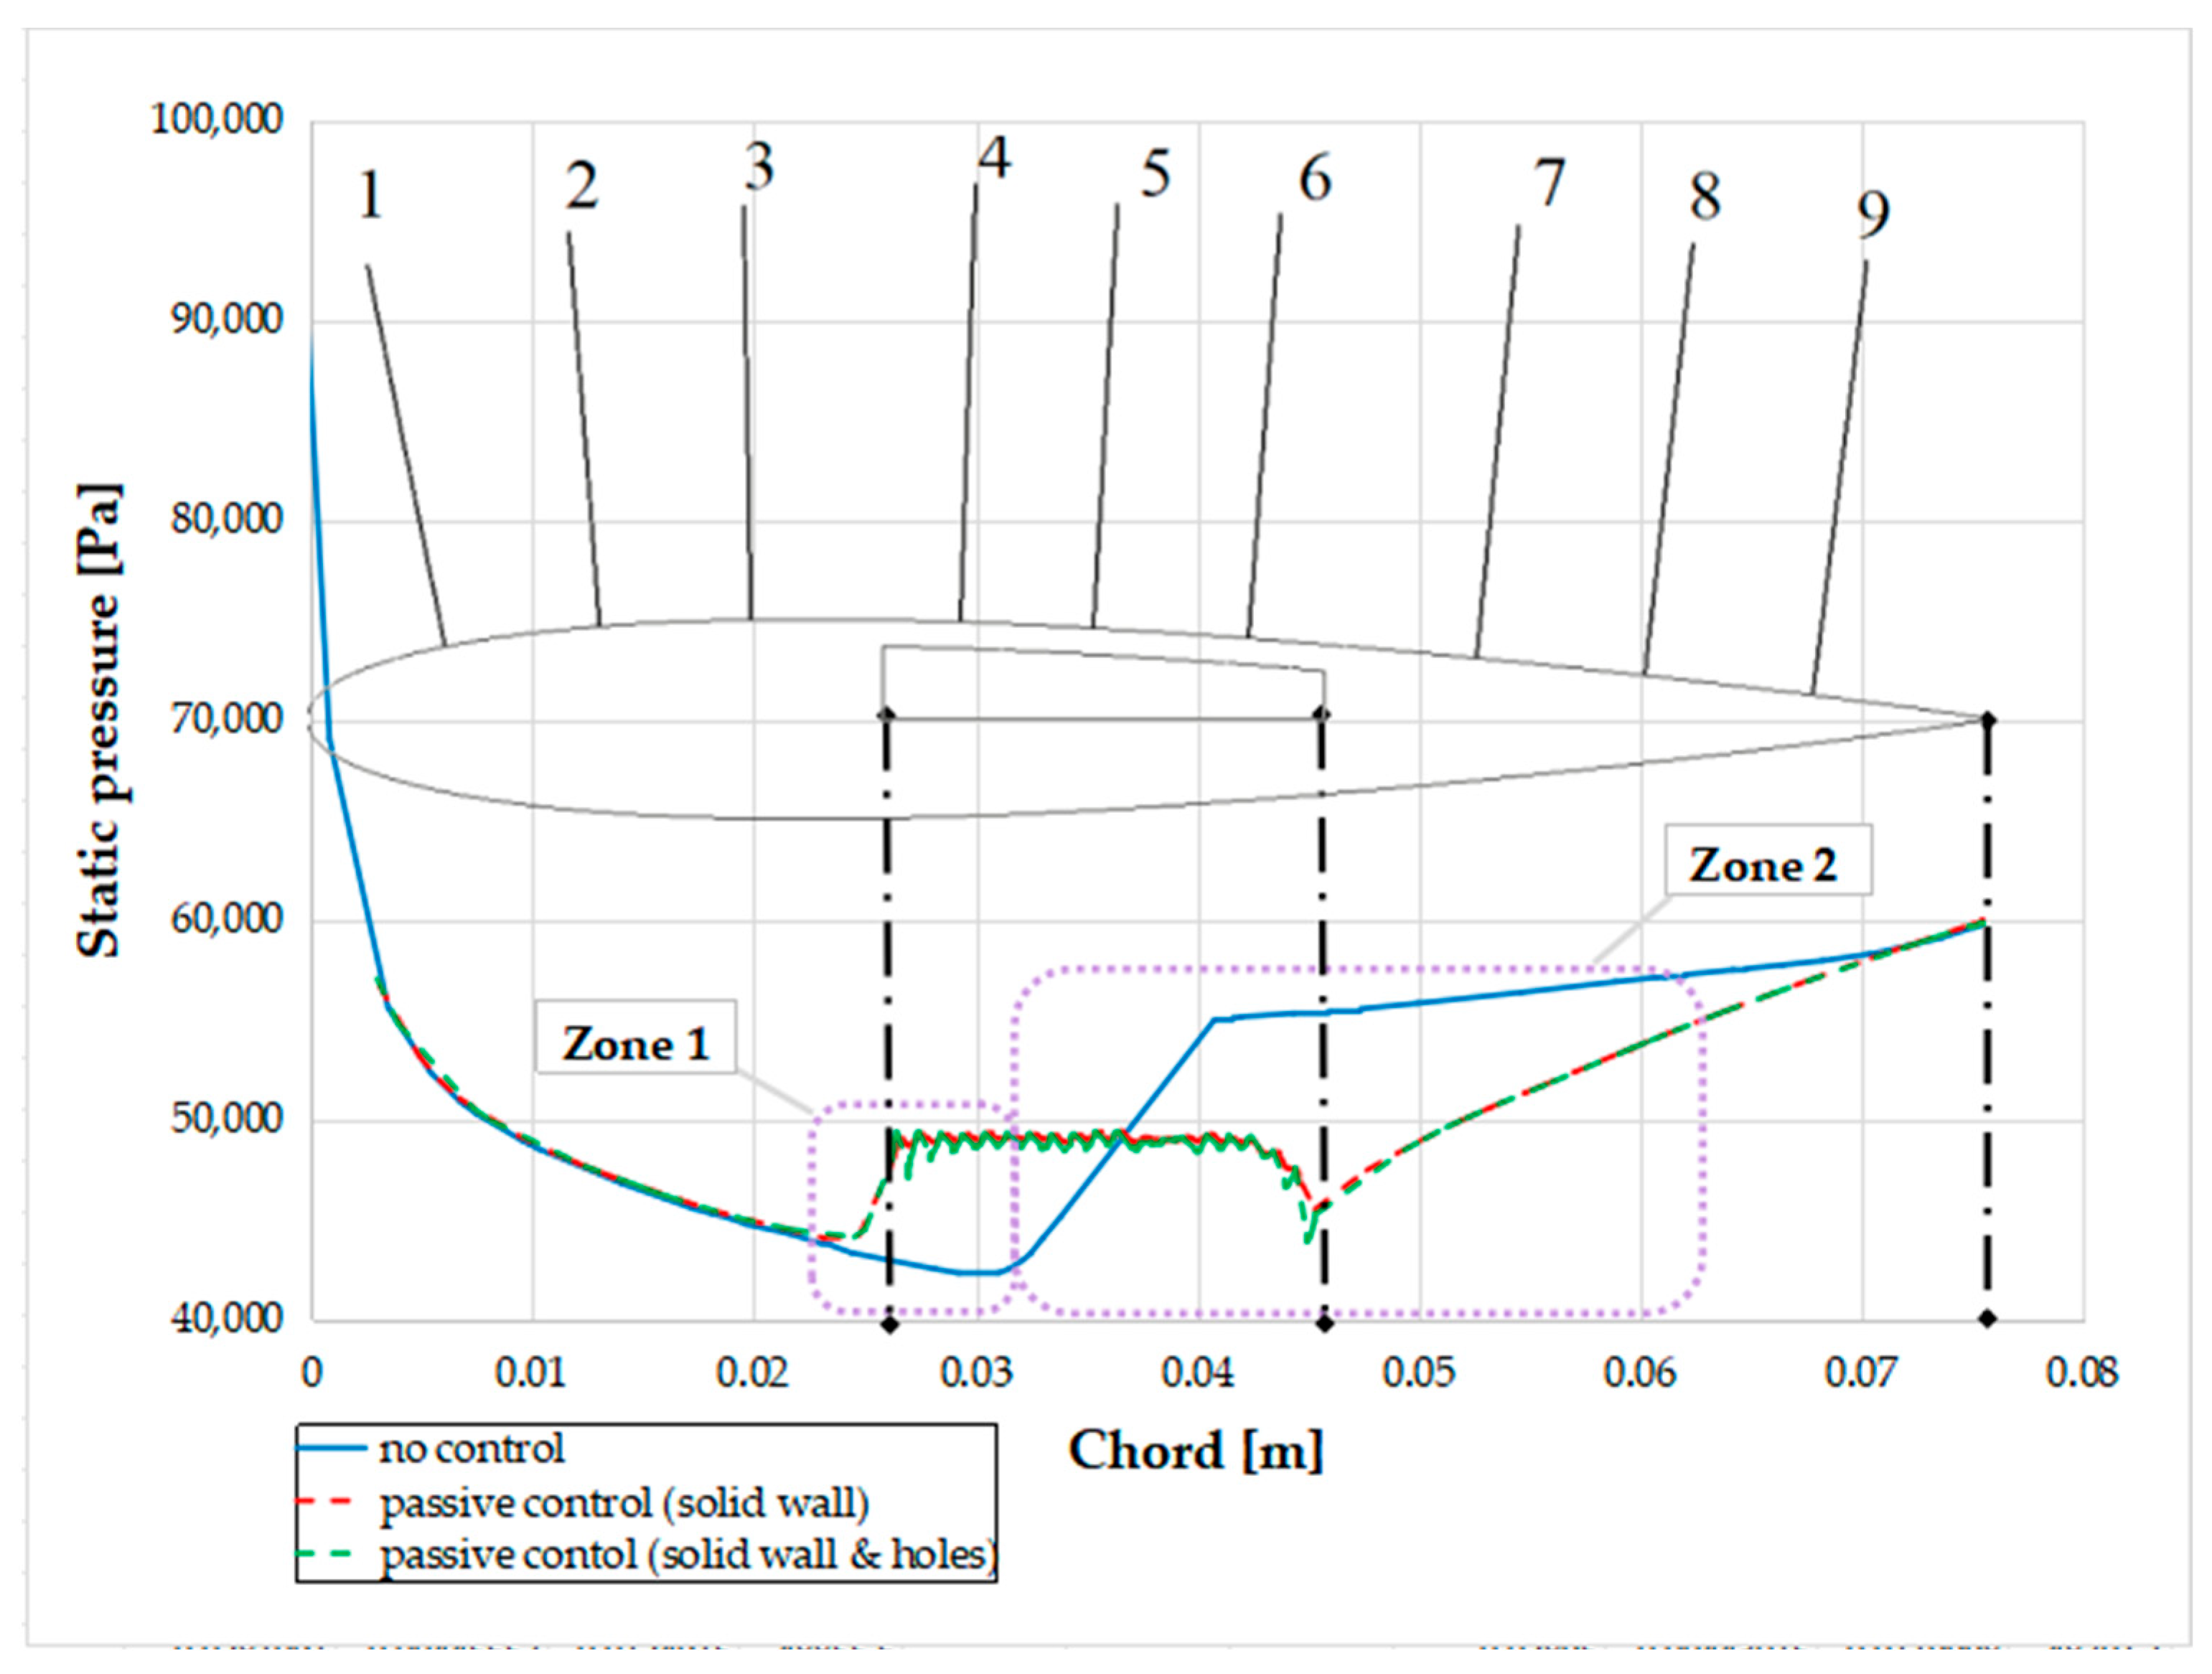
The CFD static pressure distribution on the airfoil is plotted in Figure 22. The ‘no control’ curve refers to the upper side of the baseline airfoil, while the ‘passive control’ curve refers to the upper side of the airfoil with a 0.5 mm hole passive control perforated plate. By ‘solid wall’, one understands the distribution in between the holes’ rows, while by ‘solid wall & holes’, one refers to the mid row of holes. There is very little difference in the passive control curves, especially at the edges of the perforated plate. The position of the shock wave in the baseline case is identified by the large gradient close to 0.03 m coupled by a strong static pressure drop. For the passive control case, the perforated plate introduces a plateau in static pressure. The cavity also changes the structure and the position of the previous normal shock towards the leading edge.
The wall shear stress is plotted in Figure 23 with the same legend nomenclature as before in Figure 22. The perforated plate length for the ‘passive control’ case is highlighted in black. The perforated plate introduces significant fluctuations in the shear stress. In the perforated plate area, the stress is lower compared to the baseline case due to the onset of a flow detachment due to the blowing effect from the cavity. A local maximum is present at the aft part of the cavity, followed by a very low shear stress region corresponding to a flow detachment area. For the baseline case, the stress decreases in the shock region and reaches a plateau at the aft part of the airfoil.
The dimensionless streamwise velocity profiles were extracted from CFD in Figure 24 for nine rakes along the airfoil chord for both the upper side of the baseline airfoil and the upper side of the passive control airfoil. The relative position of the rakes with respect to the airfoil is presented in Figure 24j where three rakes are upstream of the cavity, three rakes are within the cavity and three rakes are downstream of the cavity. The reference value for the velocity is 208 m/s (taken from Table 3). For the first three rakes positioned upstream the perforated plate (Figure 24a–c), no significant differences can be observed in the velocity profiles between the baseline and the passive control case. For the three rakes within the cavity region, the velocity profiles have different slopes as the cavity blowing phenomena thickens the boundary layer in the passive control case. The flow is slightly slowed down in the passive control case due to the interaction with the blowing cross flow in the fore part of the cavity. Downstream of the cavity, the flow in the passive control case slightly accelerates as an effect of the boundary layer thickening and a reduced effective cross section flow area. The passive control profile is less ‘filled’, which is another indication of the boundary layer thickening.
4. Conclusions
In this study, four manufacturing approaches for single NACA0012 airfoils with a perforated plate passive control strategy were examined, leading to the selection of the water jet cut approach and single block PLA additive manufacturing for experimental investigation. However, the use of aluminum perforated plates with the water jet cut approach resulted in alterations to the airfoil curvature, affecting local flow behavior as confirmed by static pressure measurements from the wind tunnel bottom wall.
Five single block PLA airfoils with perforated plate orifice sizes ranging from 0.5 to 1.2 mm were produced. Schlieren optical diagnosis revealed a transition in shock structure from a single normal shock to a λ-type shock structure or a series of oblique recompression waves as the hole diameter increased. Static pressure measurements indicated an increase in minimum static pressure with larger hole diameters.
For the perforated airfoil with 0.5 mm holes, a CFD study was performed with boundary conditions directly imposed from the wind tunnel inlet and outlet pressure measurements. The numerical static pressure distribution on the bottom wall showed good agreement with the experimental one with a maximum 2.5% deviation close to the inlet section. Both experimental and numerical Schlieren visualizations concurred on the shock structure alteration induced by the perforated plate. Additionally, a 0.2% improvement in total pressure loss was observed in the passive control case, credited to the perforated plate’s ability to mitigate shock wave intensity.
Furthermore, the perforated plate introduced significant fluctuations in shear stress, resulting in lower levels within the plate area due to flow detachment from cavity blowing. Velocity profiles within the cavity region exhibited varied slopes due to boundary layer thickening induced by cavity blowing. The flow experiences slight deceleration in the fore part of the cavity due to interaction with blowing crossflow, followed by acceleration downstream as a result of boundary layer thickening and a reduced effective cross-sectional flow area.
Comparison between the baseline and passive control airfoil revealed a slight increase in drag for the latter, primarily due to pressure components. Two distinct regions affecting drag were identified: one near the porous wall with lower static pressure on the baseline, and another extending from the middle of the porous wall to the trailing edge with higher static pressure on the baseline. Viscous drag was reduced along the porous region to the trailing edge, offering potential for overall drag reduction. Regarding lift force, the analysis underscores the significance of the two aforementioned drag-influencing regions, which exhibited antagonistic behavior. The first region contributes adversely to lift, while the second, more extensive region contributes positively. These regions exhibited a sharp transition and closely spaced application points, resulting in a negligible impact on the momentum coefficient.
Future research aims to extend this passive control strategy to turbomachinery flow channels, with linear cascades designed for further validation, emphasizing the practical implications and potential applications of the perforated plate passive control strategy in aerodynamics research.
Author Contributions
Conceptualization, M.G. and V.D.; methodology, M.G. and O.D.; software, M.G., O.D. and V.D.; validation, M.G. and V.D.; formal analysis, M.G.; investigation, D.E.C.; resources, M.G. and O.D.; data curation, M.G.; writing—original draft preparation, M.G.; writing—review and editing, M.G. and V.D.; supervision, D.E.C.; project administration, O.D.; funding acquisition, O.D. All authors have read and agreed to the published version of the manuscript.
Funding
This research was supported by a grant of the Ministry of Research, Innovation and Digitization, CCCDI—UEFISCDI, project number PN-III-P2-2.1-PED-2021-4204, within PNCDI III and project “Operating range augmentation system through porous walls for centrifugal compressors”, acronym SPACELESS, grant no. 717PED.
Data Availability Statement
The original contributions presented in the study are included in the article.
Conflicts of Interest
The authors declare no conflicts of interest.
References
- Yagiz, B.; Kandil, O.; Pehlivanoglu, Y.V. Drag minimization using active and passive flow control techniques. Aerosp. Sci. Technol. 2012, 17, 21–31. [Google Scholar] [CrossRef]
- Varma, D.; Ghosh, S. Flow control in Mach 4.0 inlet by slotted wedge-shaped vortex generators. J. Propuls. Power 2017, 33, 1428–1438. [Google Scholar] [CrossRef]
- McCormick, D. Shock/boundary-layer interaction control with vortex generators and passive cavity. AIAA J. 1993, 31, 91–96. [Google Scholar] [CrossRef]
- Bruce, P.; Colliss, S. Review of research into shock control bumps. Shock Waves 2015, 25, 451–471. [Google Scholar] [CrossRef]
- Lee, B. Self-sustained shock oscillations on airfoils at transonic speeds. Prog. Aerosp. Sci. 2001, 37, 147–196. [Google Scholar] [CrossRef]
- Savu, G.; Trifu, O. Porous airfoils in transonic flow. AIAA J. 1984, 22, 989–991. [Google Scholar] [CrossRef]
- Savu, G.; Trifu, O. Numerical prediction of the aerodynamic behaviour of porous airfoils. In Proceedings of the Tenth International Conference on Numerical Methods in Fluid Dynamics, Beijing, China, 23–27 June 1986; Lecture Notes in Physics. Springer: Berlin/Heidelberg, Germany, 1986. [Google Scholar]
- Zhou, L.; Chen, D.; Tao, Y.; Liu, G.; Song, S.; Zhong, S. Passive shock wave/boundary layer control of wing at transonic speeds. Theor. Appl. Mech. Lett. 2017, 7, 325–330. [Google Scholar] [CrossRef]
- Sabnis, K.; Babinsky, H. A review of three-dimensional shock wave–boundary-layer interactions. Prog. Aerosp. Sci. 2023, 143, 100953. [Google Scholar] [CrossRef]
- Boychev, K.; Barakos, G.; Steijl, R.; Shaw, S. Parametric study of multiple shock-wave/turbulent-boundary-layer interactions with a Reynolds stress model. Shock Waves 2021, 31, 255–270. [Google Scholar] [CrossRef]
- Wang, Z.-Y.; Sun, S.; Zhang, Y.; Tan, H.-J.; Chen, L. Experimental investigation of terminal shock/boundary-layer interaction with and without upstream lateral confinement. AIAA J. 2023, 61, 37–47. [Google Scholar]
- Jones, C.; Bolton, J.; Clifford, C.; Thurow, B.; Arora, N.; Alvi, F. Single-camera three-dimensional velocity measurement of a fin-generated shock-wave/boundary-layer interaction. AIAA J. 2020, 58, 4438–4450. [Google Scholar] [CrossRef]
- Genç, M.S.; Koca, K.; Demir, H.; Açıkel, H.H. Traditional and New Types of Passive Flow Control Techniques to Pave the Way for High Maneuverability and Low Structural Weight for UAVs and MAVs, Chapter 7. In Autonomous Vehicles 2020; Dekoulis, G., Ed.; IntechOpen: London, UK, 2020. [Google Scholar] [CrossRef]
- Zhou, X.; Zhao, Q.; Zhao, B.; Xu, Q.; Zhao, W. Combined application of passive and active boundary layer aspiration in a transonic compressor rotor for shock wave/boundary layer interaction control. Proc. Inst. Mech. Eng. Part G J. Aerosp. Eng. 2022, 236, 3243–3260. [Google Scholar] [CrossRef]
- Szulc, O.; Doerffer, P.; Flaszynski, P.; Braza, M. Moving wall effect on normal shock wave–turbulent boundary layer interaction on an airfoil. Int. J. Numer. Methods Heat Fluid Flow, 2023; online ahead-of-print. [Google Scholar] [CrossRef]
- Huang, W.; Wu, H.; Yang, Y.; Yan, L.; Li, S. Recent advances in the shock wave/boundary layer interaction and its control in internal and external flows. Acta Astronaut. 2020, 174, 103–122. [Google Scholar] [CrossRef]
- Egon, S.; Delery, J.; Fulker, J.; Wolfgang, G. EUROSHOCK—Drag Reduction by Passive Shock Control, Results of the Project EUROSHOCK, AER2-CT92-0049 Supported by the European Union, 1993–1995; European Union: Brussels, Belgium, 1997; Volume 56, ISBN 978-3-322-90713-4. [Google Scholar]
- Egon, S.; Delery, J.; Fulker, J.; Matteis, P. Drag Reduction by Shock and Boundary Layer Control, Results of the Project EUROSHOCK II. Supported by the European Union 1996–1999; European Union: Brussels, Belgium, 2002; Volume 80, ISBN 978-3-642-07762-3. [Google Scholar]
- Srinivasan, K.; Loth, E.; Dutton, J. Aerodynamics of Recirculating Flow Control Devices for Normal Shock/Boundary-Layer Interactions. AIAA J. 2006, 44, 751–763. [Google Scholar] [CrossRef]
- Bur, R.; Corbel, B.; Delery, J. Study of passive control in a transonic shock wave/boundary-layer interaction. AIAA J. 1998, 36, 394–400. [Google Scholar] [CrossRef]
- Delery, J.; Bur, R. The Physics of Shock Wave/Boundary Layer Interaction Control: Last Lessons Learned. In Proceedings of the European Congress on Computational Methods in Applied Sciences and Engineering, Barcelona, Spain, 11–14 September 2000. [Google Scholar]
- Szulc, O.; Doerffer, P.; Flaszynski, P.; Suresh, T. Numerical modelling of shock wave-boundary layer interaction control by passive wall ventilation. Comput. Fluids 2020, 200, 104435. [Google Scholar] [CrossRef]
- Doerffer, P.; Szulc, O. Shock wave strength reduction by passive control using perforated plates. J. Therm. Sci. 2007, 16, 97–104. [Google Scholar] [CrossRef]
- Doerffer, P.; Szulc, O.; Bohninh, R. Shock wave smearing by passive control. J. Therm. Sci. 2006, 15, 43–47. [Google Scholar] [CrossRef]
- Doerffer, P.; Bohning, R. Modelling of perforated plate aerodynamics performance. Aerosp. Sci. Technol. 2000, 4, 525–534. [Google Scholar] [CrossRef]
- Frink, N.; Bonhaus, D.; Vatsa, V.; Bauer, S.; Tinetti, A. Boundary Condition for Simulation of Flow Over Porous Surfaces. J. Aircr. 2003, 40, 692–698. [Google Scholar] [CrossRef]
- Roy, S.; Sandhu, J.; Ghosh, S. Drag reduction in transonic shock-wave/boundary-layer interaction using porous medium: A computational study. Shock Waves 2021, 31, 117–132. [Google Scholar] [CrossRef]
- Lewandowski, T.; Doerffer, P. Determination of an aerodynamic perforation of plates by means of numerical simulations. Aerosp. Sci. Technol. 2012, 22, 58–63. [Google Scholar] [CrossRef]
- Aldheeb, M.; Asrar, W.; Sulaeman, E.; Omar, A.A. Aerodynamics of porous airfoils and wings. Acta Mech. 2018, 229, 3915–3933. [Google Scholar] [CrossRef]
- Kong, W.; Dong, H.; Wu, J.; Zhao, Y.; Jin, Z. Experimental Study on the Effect of Porous Media on the Aerodynamic Performance of Airfoils. Aerospace 2023, 10, 25. [Google Scholar] [CrossRef]
- Hanna, Y.; Spedding, G. Aerodynamic Performance Improvements Due to Porosity in Wings at Moderate Re. In Proceedings of the AIAA AVIATION Forum, Dallas, TX, USA, 17–21 June 2019. [Google Scholar] [CrossRef]
- Jinyu, L.; Koji, N.; Tomoaki, W. Large-Eddy Simulation of Low-Reynolds-Number Flow Around Partially Porous Airfoils. J. Aircr. 2023, 60, 1998–2009. [Google Scholar] [CrossRef]
- Zhu, W.; Liu, J.; Sun, Z.; Cao, J.; Guo, G.; Shen, W. Numerical Study on Flow and Noise Characteristics of an NACA0018 Airfoil with a Porous Trailing Edge. Sustainability 2023, 15, 275. [Google Scholar] [CrossRef]
- Ligrani, P.; McNabb, E.; Collopy, H.; Anderson, M. Recent investigations of shock wave effects and interactions. Adv. Aerodyn. 2020, 2, 4. [Google Scholar]
- Grzelak, J.; Szwaba, R. Influence of Holes Manufacture Technology on Perforated Plate Aerodynamics. Materials 2021, 14, 6624. [Google Scholar] [CrossRef] [PubMed]
- Golovastov, S.; Mikushkin, A.; Mikushkina, A.; Zhilin, Y. Interaction of weak shock waves with perforated metal plates. Exp. Fluids 2022, 63, 97. [Google Scholar] [CrossRef]
- GUNT HM. Available online: https://www.gunt.de/en/products/fluid-mechanics/steady-flow/steady-flow-of-compressible-fluids/supersonic-wind-tunnel-with-schlieren-optics/070.17200/hm172/glct-1:pa-148:ca-155:pr-802 (accessed on 8 January 2024).
- Prisacariu, E.; Vilag, V.; Nicoara, R.; Suciu, C.; Dobromirescu, C.; Dombrovschi, M. Calculating and setting up a Schlieren system. Turbo 2020, II, 25–34. [Google Scholar]
- Settles, G. Schlieren and Shadowgraph Techniques; Springer: Berlin/Heidelberg, Germany; New York, NY, USA, 2001. [Google Scholar]
- Menter, F.; Kuntz, M.; Laugtry, R. Ten years of industrial experience with the SST turbulence model. Turbul. Heat Mass Transf. 2003, 4, 625–632. [Google Scholar]
- Benedict, R. Fundamentals of Temperature, Pressure and Flow Measurements; Wiley-Interscience Publication; Wiley: Hoboken, NJ, USA, 1991. [Google Scholar]
Figure 1.
Model 1—PLA 3D-printed airfoil.

Figure 2.
Model 2—metal 3D-printed airfoil.

Figure 3.
Model 3—Water jet cut model with Al perforated plate. (a) Isometric view; (b) sideview.

Figure 4.
Model 4—PLA additive manufacturing airfoils with different orifice sizes (0.5 mm, 0.65 mm, 0.8 mm, 1 mm, 1.2 mm). (a) Isometric view; (b) threaded nuts for wind tunnel mounting.
Figure 4.
Model 4—PLA additive manufacturing airfoils with different orifice sizes (0.5 mm, 0.65 mm, 0.8 mm, 1 mm, 1.2 mm). (a) Isometric view; (b) threaded nuts for wind tunnel mounting.

Figure 5.
Supersonic wind tunnel facility overview [37].
Figure 5.
Supersonic wind tunnel facility overview [37].

Figure 6.
Schlieren system sketch.

Figure 7.
Static pressure distribution on the bottom wall of the wind tunnel.

Figure 8.
Schlieren images: (a) Model A1; (b) Model A2; (c) Model A3; (d) Model A4; (e) Model A5; (f) Model A6.
Figure 8.
Schlieren images: (a) Model A1; (b) Model A2; (c) Model A3; (d) Model A4; (e) Model A5; (f) Model A6.

Figure 9.
Static pressure distribution on the bottom wall.

Figure 10.
Static pressure distribution on the bottom wall—detail.

Figure 11.
Computation grid. (a) Blade, (b) leading edge details; (c) perforated plate details.

Figure 12.
Density gradient—mid plane.

Figure 13.
Mach number—mid plane.

Figure 14.
Static pressure—mid plane.

Figure 15.
Total pressure—mid plane.

Figure 16.
Reference lines.

Figure 17.
Static pressure distribution on the reference lines.

Figure 18.
Mach number distribution on the reference lines.

Figure 19.
Density gradient distribution on the reference lines.

Figure 20.
Static pressure distribution on the bottom wall of the wind tunnel.

Figure 21.
A2 model airfoil—experiment vs numerical simulation. (a) Experimental Schlieren; (b) numerical Schlieren.
Figure 21.
A2 model airfoil—experiment vs numerical simulation. (a) Experimental Schlieren; (b) numerical Schlieren.

Figure 22.
CFD results for static pressure distribution on the airfoil.

Figure 23.
CFD results for wall shear stress on the airfoil. The perforated plate length for the ‘passive control’ case is highlighted in black.
Figure 23.
CFD results for wall shear stress on the airfoil. The perforated plate length for the ‘passive control’ case is highlighted in black.

Figure 24.
Dimensionless CFD streamwise velocity profiles for different rakes. (a) Rake 1; (b) rake 2; (c) rake 3; (d) rake 4; (e) rake 5; (f) rake 6; (g) rake 7; (h) rake 8; (i) rake 9; (j) sketch of the measuring rakes.
Figure 24.
Dimensionless CFD streamwise velocity profiles for different rakes. (a) Rake 1; (b) rake 2; (c) rake 3; (d) rake 4; (e) rake 5; (f) rake 6; (g) rake 7; (h) rake 8; (i) rake 9; (j) sketch of the measuring rakes.


Table 1.
Perforated airfoils’ geometrical features.
| Name | Material | Hole Diameter | No of Holes |
|---|---|---|---|
| A1 | OLC + Aluminum | 0.5 mm | 19 × 19 |
| A2 | PLA | 0.5 mm | 19 × 24 |
| A3 | PLA | 0.65 mm | 15 × 18 |
| A4 | PLA | 0.8 mm | 12 × 15 |
| A5 | PLA | 1 mm | 10 × 12 |
| A6 | PLA | 1.2 mm | 8 × 10 |
Table 2.
Minimum static pressure recorded within the control region.
| Case | Hole Size [mm] | Static Pressure [Pa] | Confidence Interval 90% [Pa] |
|---|---|---|---|
| No control | - | 56,708.57 | 41.40393 |
| A1—metal | 0.5 mm | 54,729.09 | 636.7645 |
| A2—PLA | 0.5 mm | 57,113.33 | 246.4044 |
| A3—PLA | 0.65 mm | 57,553.13 | 841.2032 |
| A4—PLA | 0.8 mm | 57,992.73 | 1436.002 |
| A5—PLA | 1 mm | 57,390.83 | 1837.476 |
| A6—PLA | 1.2 mm | 58,991.82 | 2710.088 |
Table 3.
Mass averaged results (baseline vs passive control).
| Baseline | Passive Control (0.5 mm) | |
|---|---|---|
| Static pressure inlet [Pa] | 78,157.925 | 78,062.291 |
| Static pressure outlet [Pa] | 61,346 | 61,346 |
| Total pressure inlet [Pa] | 100,639 | 100,639 |
| Total pressure outlet [Pa] | 93,373.069 | 93,555.245 |
| Inlet Mach number | 0.62 | 0.62 |
| Inlet velocity [m/s] | 208 | 208 |
| Inlet total temperature [K] | 297.85 | 297.85 |
| Outlet total temperature [K] | 297.85 | 297.85 |
| Total pressure loss | 7.84% | 7.66% |
| Cavity mass flow rate [kg/s] | 0 | 0.00122 |
Table 4.
Lift and drag forces (baseline vs. passive control).
| Baseline | Passive Control (0.5 mm) | |
|---|---|---|
| Lift (pressure) [N] | 0.016 | −0.09 |
| Lift (viscous) [N] | −3 × 10⁻⁵ | 0.003 |
| Total Lift [N] | 0.016 | 0.087 |
| Drag (pressure) [N] | 1.97 | 2.45 |
| Drag (viscous) [N] | 0.43 | 0.3 |
| Total drag [N] | 2.4 | 2.75 |
Disclaimer/Publisher’s Note: The statements, opinions and data contained in all publications are solely those of the individual author(s) and contributor(s) and not of MDPI and/or the editor(s). MDPI and/or the editor(s) disclaim responsibility for any injury to people or property resulting from any ideas, methods, instructions or products referred to in the content. |
© 2024 by the authors. Licensee MDPI, Basel, Switzerland. This article is an open access article distributed under the terms and conditions of the Creative Commons Attribution (CC BY) license (https://creativecommons.org/licenses/by/4.0/).
Share and Cite
MDPI and ACS Style
Gall, M.; Dumitrescu, O.; Drăgan, V.; Crunțeanu, D.E. Effects of Perforated Plates on Shock Structure Alteration for NACA0012 Airfoils. Inventions 2024, 9, 28. https://doi.org/10.3390/inventions9020028
AMA Style
Gall M, Dumitrescu O, Drăgan V, Crunțeanu DE. Effects of Perforated Plates on Shock Structure Alteration for NACA0012 Airfoils. Inventions. 2024; 9(2):28. https://doi.org/10.3390/inventions9020028
Chicago/Turabian StyleGall, Mihnea, Oana Dumitrescu, Valeriu Drăgan, and Daniel Eugeniu Crunțeanu. 2024. "Effects of Perforated Plates on Shock Structure Alteration for NACA0012 Airfoils" Inventions 9, no. 2: 28. https://doi.org/10.3390/inventions9020028