


Predictive Maintenance in Industry 4.0 for the SMEs: A Decision Support System Case Study Using Open-Source Software


1
Department of Informatics, Faculty of Economics and Business, University of Zagreb, 10000 Zagreb, Croatia
2
Aisma srl, 20122 Milan, Italy
3
Department of Physics, Faculty of Science, University of Zagreb, 10000 Zagreb, Croatia
*
Author to whom correspondence should be addressed.
Designs 2023, 7(4), 98; https://doi.org/10.3390/designs7040098
Submission received: 21 March 2023
/
Revised: 14 July 2023
/
Accepted: 2 August 2023
/
Published: 7 August 2023
(This article belongs to the Special Issue Mixture of Human and Machine Intelligence in Digital Manufacturing)
Abstract
:Predictive maintenance is one of the most important topics within the Industry 4.0 paradigm. We present a prototype decision support system (DSS) that collects and processes data from many sensors and uses machine learning and artificial intelligence algorithms to report deviations from the optimal process in a timely manner and correct them to the correct parameters directly or indirectly through operator intervention or self-correction. We propose to develop the DSS using open-source R packages because using open-source software such as R for predictive maintenance is beneficial for small and medium enterprises (SMEs) as it provides an affordable, adaptable, flexible, and tunable solution. We validate the DSS through a case study to show its application to SMEs that need to maintain industrial equipment in real time by leveraging IoT technologies and predictive maintenance of industrial cooling systems. The dataset used was simulated based on the information on the indicators measured as well as their ranges collected by in-depth interviews. The results show that the software provides predictions and actionable insights using collaborative filtering. Feedback is collected from SMEs in the manufacturing sector as potential system users. Positive feedback emphasized the advantages of employing open-source predictive maintenance tools, such as R, for SMEs, including cost savings, increased accuracy, community assistance, and program customization. However, SMEs have overwhelmingly voiced comments and concerns regarding the use of open-source R in their infrastructure development and daily operations.
1. Introduction
Maintenance in general is critical to achieving operational priorities and strategies [1], especially within the context of smart factories, as indicated by Jerman et al. [2]. Mobley [3] points out that maintenance expenditures represent a large portion of the operating costs of a manufacturing or processing facility. Depending on the industry, maintenance costs can represent between 15% and 60% of the cost of goods produced.
A good maintenance mechanism helps reduce equipment and machinery downtime, improve efficiency, and increase productivity [1]. Since maintenance management is dynamic and complex and maintenance performance is difficult to evaluate and enumerate, choosing the right maintenance strategy is crucial [1], especially for the fulfillment of sustainability goals within the context of Industry 4.0, as indicated by Roblek et al. [4]. However, Moore and Starr [5] emphasize that inadequate maintenance leads to further unplanned plant and equipment failures, which are associated with a number of costs to the company, including labor, spare parts, rework, scrap, late order charges, and lost orders due to dissatisfied customers.
In this paper, we focus on SMEs. Implementing predictive maintenance can be difficult for SMEs due to the high cost of proprietary software and hardware solutions. However, by using open-source tools, SMEs can create predictive maintenance applications at a fraction of the cost of proprietary solutions. One of these is R. R is a robust programming language that is freely available for statistical computing and data analysis. It provides access to various statistical and machine learning methods required for predictive maintenance. R has a large community of users and developers who collaborate to further develop the programming language and the many packages it offers, making it easy to find support and other useful resources.
The paper consists of the following parts: After the introduction, in the second chapter, we outline the state of the art of predictive maintenance, provide an overview of the field, and discuss the benefits of predictive maintenance and its role in Industry 4.0. In the third chapter, we focus on IoT devices and sensors as a pillar of predictive maintenance. The fourth chapter presents the prototype of a DSS for predictive maintenance. It explains the architecture and purpose of the application, the machine learning engine, and the graphical user interface, and concludes with an example of how to use the platform. The last chapter contains a concluding remark.
2. State of the Art of Predictive Maintenance
2.1. Predictive Maintenance Overview
Although predictive maintenance has been around since 1940 [6], it has recently gained popularity and is being used by many companies [7,8]. Ahmad and Kamaruddin [9], (p. 140) even refer to predictive maintenance as “the most advanced and popular maintenance technique discussed in the literature”. Many industries have adopted predictive maintenance, including those where reliability is critical, such as infrastructure, emergency services, transportation networks, power plants, and communication systems. The popularity of predictive maintenance is reflected in the Market Research Future Report forecast [10], which projects that the global predictive maintenance market will grow at a compound annual growth rate of 25.5% during the forecast period from 2019 to 2024, reaching 23 billion by 2025.
Turgis et al. [11] emphasize that predictive maintenance is often considered a subclass of preventive maintenance, which is defined by Chen and Trivedi [12] as an action performed on a system at predetermined intervals to minimize or eliminate cumulative degradation while maintaining satisfactory operation. Predictive maintenance as a maintenance strategy is driven by predictive analytics technologies whose solutions are installed to track and identify system faults or failures [10]. However, such solutions are activated only when a critical failure is possible. This contributes to the efficient use of available resources and capital, the maximization of system or equipment uptime, the improvement of quality and supply chain systems, and the overall satisfaction of all stakeholders [10].
It is important to note that some authors, such as Parpala and Iacob [13], understand condition-based maintenance as a precursor to predictive maintenance. In contrast, others, such as Ahmad and Kamaruddin [9], as mentioned earlier, equate these two terms. According to Parpala and Iacob [13], condition-based maintenance was a well-known method of industrial maintenance before the widely adopted IoT concept. In contrast, predictive maintenance includes the help of the IoT when it comes to maintenance. Jardine et al. [14] define condition-based maintenance as a maintenance program that provides maintenance recommendations and decisions based on the information obtained through condition monitoring and works in three steps, namely
- Data acquisition,
- Data processing, and
- Maintenance decision making.
It is important to note that some authors, such as Parpala and Iacob [13], understand condition-based maintenance as a precursor to predictive maintenance. In contrast, others, such as Ahmad and Kamaruddin [9], as mentioned earlier in this report, equate these two terms. According to Parpala and Iacob [13], condition-based maintenance was a well-known method of industrial maintenance before the IoT concept was widely adopted. In contrast, predictive maintenance includes the help of the IoT when it comes to maintenance. Jardine et al. [14] define condition-based maintenance as a maintenance program that provides maintenance recommendations and decisions based on the information obtained through condition monitoring and operates in three steps.
The predictive maintenance techniques market can be divided into traditional and advanced techniques, with advanced techniques additionally divided into two segments [10]:
- IoT and Big Data techniques and
- Machine learning-based techniques.
The Market Research Future Report [10] also shows that the traditional techniques segment held the largest market share in 2018. Nevertheless, the advanced techniques segment is expected to grow. In this context, Chuang et al. [15] state that most maintenance approaches rely on traditional routine maintenance to keep a system running smoothly. However, the cost of replacing components and oils during maintenance cannot be ignored. Therefore, more and more companies are turning to predictive maintenance, in which the system makes decisions individually and schedules the appropriate time for maintenance according to the requirements [15]. Chuang et al. [15] also point out that Big Data analytics and machine learning can help determine when assets are most likely to fail and when it is the right time to repair and replace components before they fail. IoT platforms also greatly support predictive maintenance as they can combine data from different machines and production processes [13].
Christiansen [7] argues that predictive maintenance will increase as technology costs decrease, mainly due to the shift from wired to wireless sensors.
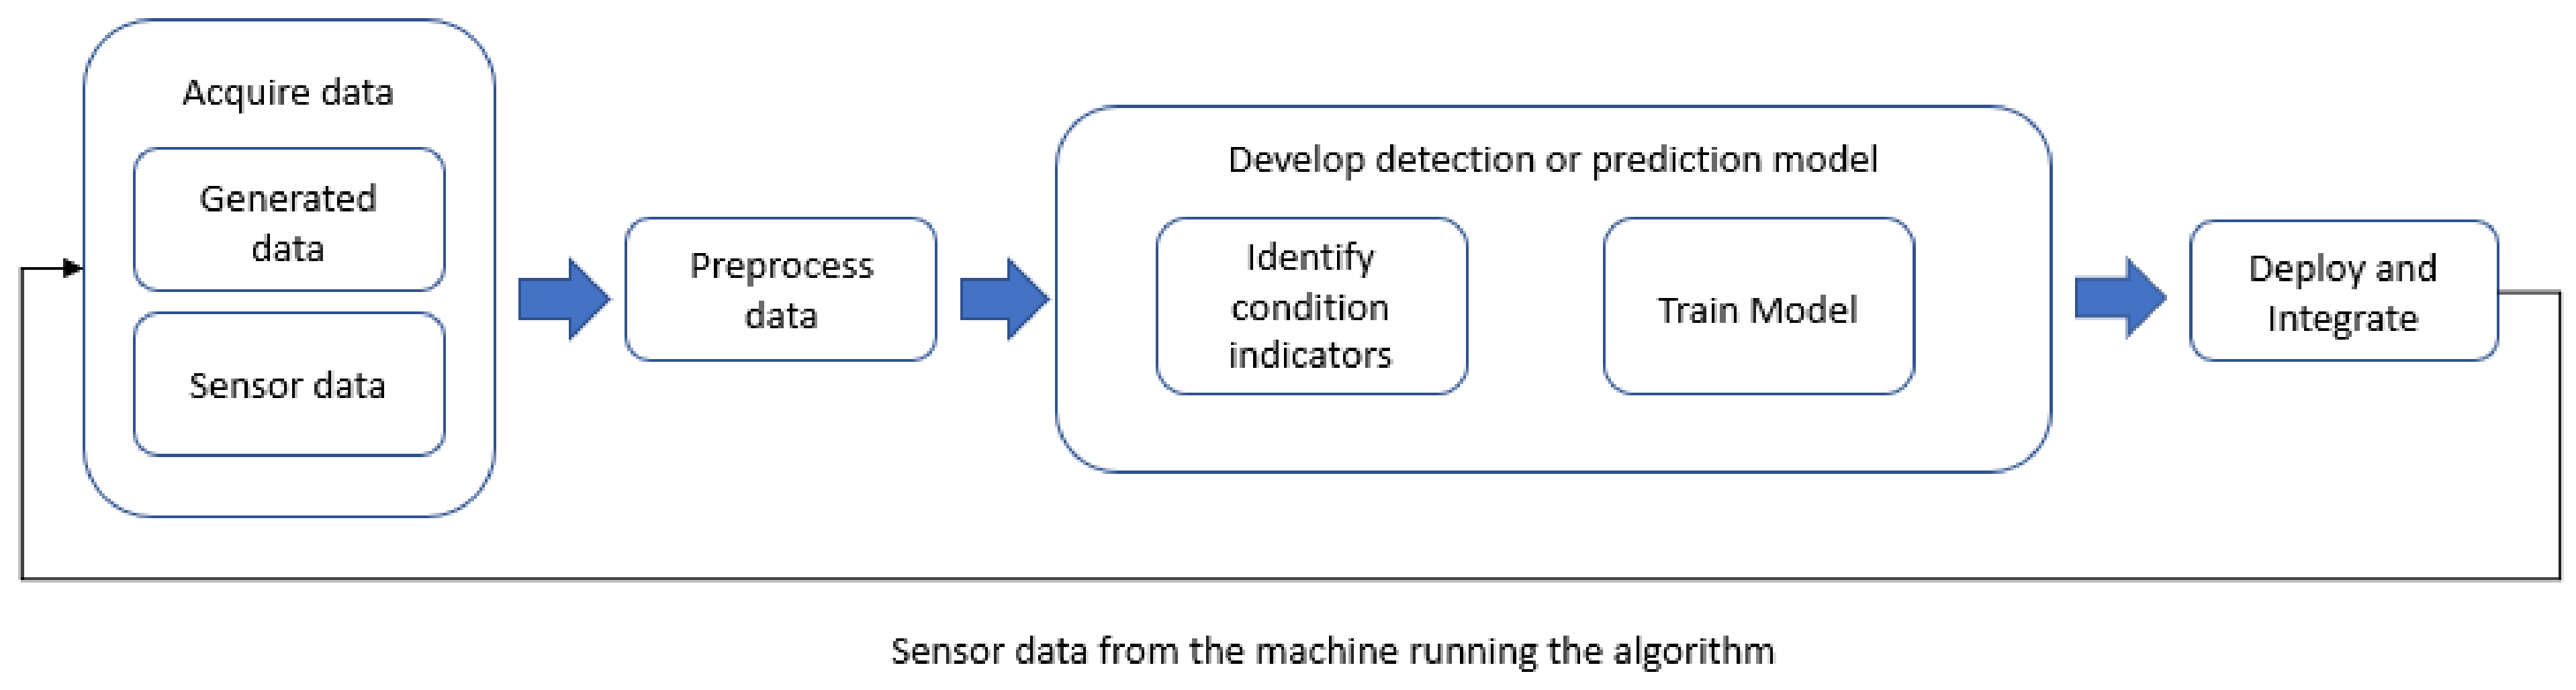
The main component of a predictive maintenance strategy is the monitoring of machinery and equipment. This involves the use of traditional and advanced monitoring methods that enable the scheduling of machine maintenance before a malfunction occurs [10]. These monitoring methods include the use of various monitoring or testing tools such as infrared thermography, vibration monitoring, oil analysis, electrical isolation, ultrasonic leak detection, and temperature monitoring [7]. Based on the calculations provided by predictive maintenance and the monitoring and testing results with the appropriate tools and instruments, the company can run pre-programmed predictive algorithms to determine when a piece of equipment might fail so that repairs can be initiated only when a failure occurs [7]. In addition, predictive maintenance data provide diagnostic and prognostic information that indicates what is wrong, where the problem is, why the problem is occurring, whether it is a malfunction or just a failure, and when the failure will occur, if ever [6]. Similarly, Ahmad and Kamaruddin [9] argue that the main purpose of predictive maintenance is to review and assess the requirements and condition of devices, systems, and machines in real time to make maintenance decisions, resulting in less excessive maintenance and associated costs. Therefore, condition monitoring is the heart of predictive maintenance that leads to decision making [7]. In Figure 1, a graphical representation of the general process of predictive maintenance is proposed, showing that a control loop exists between the two elements of predictive maintenance.
The Market Research Future Report [10] also shows that the traditional techniques segment held the largest market share in 2018. Nevertheless, the advanced techniques segment is expected to grow. In this context, Chuang et al. [15] state that most maintenance approaches rely on traditional routine maintenance to keep a system running smoothly. However, the cost of replacing components and oils during maintenance cannot be ignored. Therefore, more and more companies are turning to predictive maintenance, in which the system makes decisions individually and schedules the appropriate time for maintenance according to the requirements [15,16]. Big Data analytics and machine learning can help determine when assets are most likely to fail and when it is the right time to repair and replace components before they fail [15,17]. IoT platforms also greatly support predictive maintenance by:
- Condition monitoring technology and predictive maintenance techniques;
- Internet of Things (IoT) technology;
- Predictive algorithms.
Condition monitoring and predictive maintenance technology refers to installed condition monitoring sensors that transmit real-time performance and system health data [7]. In this sense, Ahmad and Kamaruddin [9] explain that state monitoring is a tool used to specify the state of devices in a system with a dual purpose:
- Collection of condition data on the equipment;
- Increase in knowledge about failure reasons and causes;
- About the effects and deterioration patterns of equipment.
Condition monitoring equipment and devices can be mounted or retrofitted in a variety of ways so that they can measure [9,18]: electrical currents, vibration, temperature, pressure, oil, noise, and corrosion levels.
Predictive maintenance is based on the data analyzed for condition monitoring, from which various patterns emerge that indicate that a machine or asset may be beginning to malfunction or deteriorate [18]. In addition, the analysis provided by condition monitoring allows the company to plan maintenance activities to avoid failures and prevent emergency breakdowns [18,19]. As argued in Hodge et al. [20], condition monitoring also helps the enterprise reduce the need for human inspection through automated monitoring, reduce repair costs by detecting defects early before they escalate, and increase protection and safety as well as efficiency and reliability. In addition, Christiansen [18] argues that another benefit of condition monitoring sensors is that they can provide an accurate picture of what is going on inside the plant without compromising efficiency, i.e., the plant does not have to be interrupted and disassembled to perform physical inspections.
Ahmad and Kamaruddin [9] argue that state monitoring can be performed in two ways:
- Online—refers to the monitoring process performed during the operational state of the machine, system, or equipment, i.e., during its running state.
- Offline—refers to the monitoring process performed during the phase when the machine, system, or equipment is not in operation.
Ahmad and Kamaruddin [9] also point out that condition monitoring with respect to time can be conducted in the following two ways:
- Periodic—refers to the monitoring process conducted at specified intervals, such as every 30 min, every hour, at the end of a work shift, etc., and conducted using portable indicators such as vibration pens, acoustic emission devices, handheld meters, etc.
- Continuous—refers to the monitoring process that is performed automatically and continuously based on specialized measuring devices, such as vibration and acoustic sensors.
There are two main limitations to continuous monitoring: (i) the high costs associated with continuous monitoring, which arise because many specialized machines are needed; and (ii) the possibility of obtaining inaccurate information because the continuous flow of data leads to increased noise [14].
Based on the sensors used for condition monitoring and related testing, there are a variety of condition monitoring, i.e., predictive maintenance, methods and techniques that can be used, such as the following [6,7,9]:
- vibration monitoring and dynamic analysis,
- oil analysis and lubricant monitoring,
- sound, ultrasonic, and acoustic monitoring,
- motor circuit analysis,
- different variations of thermography and thermal analysis,
- electromagnetic measurements,
- radiography and radiation analysis,
- laser interferometry, and
- different performance measurements.
Internet of Things (IoT) technology enables communication between machines and computers, software solutions, and cloud technologies, thus enabling the collection and analysis of large amounts of data [21,22,23]. IoT technology, in combination with the aforementioned sensors, helps collect and share data that predictive maintenance relies heavily on to connect assets to a central system that stores incoming information and from which assets (i.e., machine systems and devices) can communicate, perform data analysis, collaborate, recommend remedial actions, or take direct action, depending on how the systems are set up [7,21,22,23]. Christiansen [7] notes that such centralized systems are operated using cloud technology, WLAN, or LAN-based connectivity.
Predictive algorithms refer to the most important part of predictive maintenance: building predictive algorithms where all processed data are fed into predictive data models that then provide failure predictions, meaning that the model must take into account a large number of variables and how they interact and affect each other, with the goal of predicting system failures [7,24,25,26]. The more variables included in the models, the more reliable they are. Therefore, building predictive models is an iterative process [7,27,28]. Initial models would need to be based on equipment history in a Computerized Maintenance Management System or file cabinets, personal impressions, failure analysis, already usable internal sensors such as flow meters and accelerometers, and other related sources. In addition, it may be necessary to initially mount condition monitoring sensors and run them for a period of time to collect baseline data and complete initial predictive models [7].
The final product is a fully automated system, as shown in Figure 1, which:
- monitors working conditions using installed sensors,
- detects and predicts patterns characterized by data anomalies,
- generates warnings when deviations from established thresholds occur.
2.2. Predictive Maintenance Advantages and Disadvantages
There are many different types of maintenance, i.e., methods of maintenance management, such as run-to-failure management [1,3,6,9], also called corrective maintenance, reactive maintenance, unplanned maintenance, failure-based maintenance, failure-controlled maintenance, fail-to-fix maintenance, or failure maintenance, which usually takes place in companies and is the most expensive method of maintenance management because it means that there is no maintenance approach in the company but actions are taken to restore the failed equipment. This is a reactive and unplanned occurrence of equipment failure, meaning the company does not spend a budget on maintenance until a system, machine, or device fails.
Predictive maintenance has many benefits. For example, its implementation and application help companies identify product failures and customer dissatisfaction in advance so that they can be proactive and thus achieve significant cost savings, reduce product downtime, and improve customer service [29]. Moreover, predictive maintenance improves productivity, product quality, and the overall effectiveness of production and manufacturing organizations [3]. On the other hand, Christiansen [7] points out that the main advantage of predictive maintenance is the ability to plan and perform work based on the current condition of the plant and equipment.
Selcuk [6] summarizes the benefits of predictive maintenance in the following list:
- improved safety for workers and the environment,
- increased availability,
- increased reliability,
- reduced cost of parts and labor,
- improved product quality,
- reduced waste of raw materials and consumables such as lubricants,
- energy savings from quieter machines (e.g., alignment, which in some cases is reported as 3–5%; balancing, 1–2%).
In addition, Selcuk [6] also provide data on average industrial savings from predictive maintenance, as shown in Table 1.
Christiansen [7] also provides a list of benefits of predictive maintenance, as follows:
- Minimizes the occurrence of unplanned downtime and maximizes the uptime of machines, equipment, and systems;
- Provides the company with a real-time view of the current condition of its plant, machinery, equipment, and systems;
- Ensures minimal disruption to productivity by allowing some predictive maintenance activities to be performed on running assets;
- Optimizes the amount of time the company spends on maintenance activities;
- Optimizes the use of spare parts;
- Improves equipment reliability.
The implementation of a predictive maintenance program plays an important role in the benefits that an organization can derive from predictive maintenance technologies [3]. If the predictive maintenance program is limited to avoiding catastrophic failures in specific plant systems, then this is the outcome that will result from such an implementation, but it also indicates that focusing solely on avoiding failures could lead to a significant increase in maintenance costs for the company [3]. In this vein, Mobley [3] argues that the benefits of predictive maintenance are virtually unlimited when properly applied and cautions that these benefits could be significantly limited if the scope of the program is artificially limited by the scope of work or if the business enforces certain constraints.
However, Christiansen [7] states that the main disadvantage of predictive maintenance is the complexity of its use and application, caused primarily by the high upfront costs and time required for implementation, the requirements for condition monitoring equipment, sensors, and software to be implemented and operated, and the expertise required for someone to understand and analyze the data collected by condition monitoring.
2.3. Predictive Maintenance in Industry 4.0
Considering the increasing importance of technology and the rapid development of Industry 4.0, as well as the main objective of asset management, which is to transform available data into valuable information, Demoly and Kiritsis [30] believe that asset management requires technology in two main areas:
- Data collection, storage, and analysis can be accomplished using powerful data servers and software; and
- Presenting and communicating the results of these analyses to decision-makers inside and outside the organization.
Using an IoT platform to collect usage data from various production equipment is the first step in developing a general cloud-based predictive maintenance system that facilitates factory maintenance [13]. In this sense, Noura et al. [31] argue that in recent years, many smart devices in the real world have become interconnected and communicate over established Internet networks, resulting in a massive network infrastructure known as the Internet of Things (IoT).
However, Parpala and Iacob [13] also emphasize that connectivity architecture is the key drawback in integrating and combining production systems with IoT platforms since most industrial communication protocols are not compatible with the current communication protocols introduced on IoT platforms. In this sense, they propose a modern and convenient approach for real-time control and maintenance of industrial machines, focusing on two features of networked manufacturing: (i) process monitoring that ensures consistent quality assurance, and (ii) condition monitoring that prevents unplanned downtime [13].
Gregersen [32] also states that while the current Internet framework is open to and can be used by all IoT devices, it is too bulky and power-hungry for most IoT applications, resulting in the HyperText Transfer Protocol (HTTP) being considered an inappropriate protocol for IoT. Moreover, IoT implementation requires advances in networking technologies necessary to realize the vision of reaching physical objects and connecting them to the Internet [33].
According to Ferretti and Schiavone [34], there is a very wide range of industrial IoT applications, with transportation and logistics being the central areas of IoT applications. Predictive maintenance is usually introduced in a company for one of the following reasons [3]:
- As a maintenance management tool—when its use is limited to preventing spontaneous downtime and/or catastrophic failures;
- As a business optimization tool—when its use relates to establishing best production practices and procedures for all critical production systems within an organization;
- As a reliability improvement tool—when its use is to quantify even the smallest deviations from standard operating parameters. This enables company personnel (e.g., reliability engineers, repair planners) to prepare and plan for minor changes to prevent machine and equipment failures, thus avoiding extensive rebuilds and associated downtime.
Ahmad and Kamaruddin [9] point out that applications of predictive maintenance cover many problems in different fields, such as structures, industrial machines, and medical devices. On the other hand, Parpala and Iacob [13] argue that IoT technology was first applied to consumer devices such as washing machines, air conditioners, and smart home control systems that could connect directly to the Internet through smartphones or private networks. However, as the IoT has evolved, other products have been equipped with the necessary technology. Many companies are trying to integrate the IoT into existing production processes [13].
3. IoT Devices and Sensors as a Pillar of Predictive Maintenance
3.1. IoT Concept
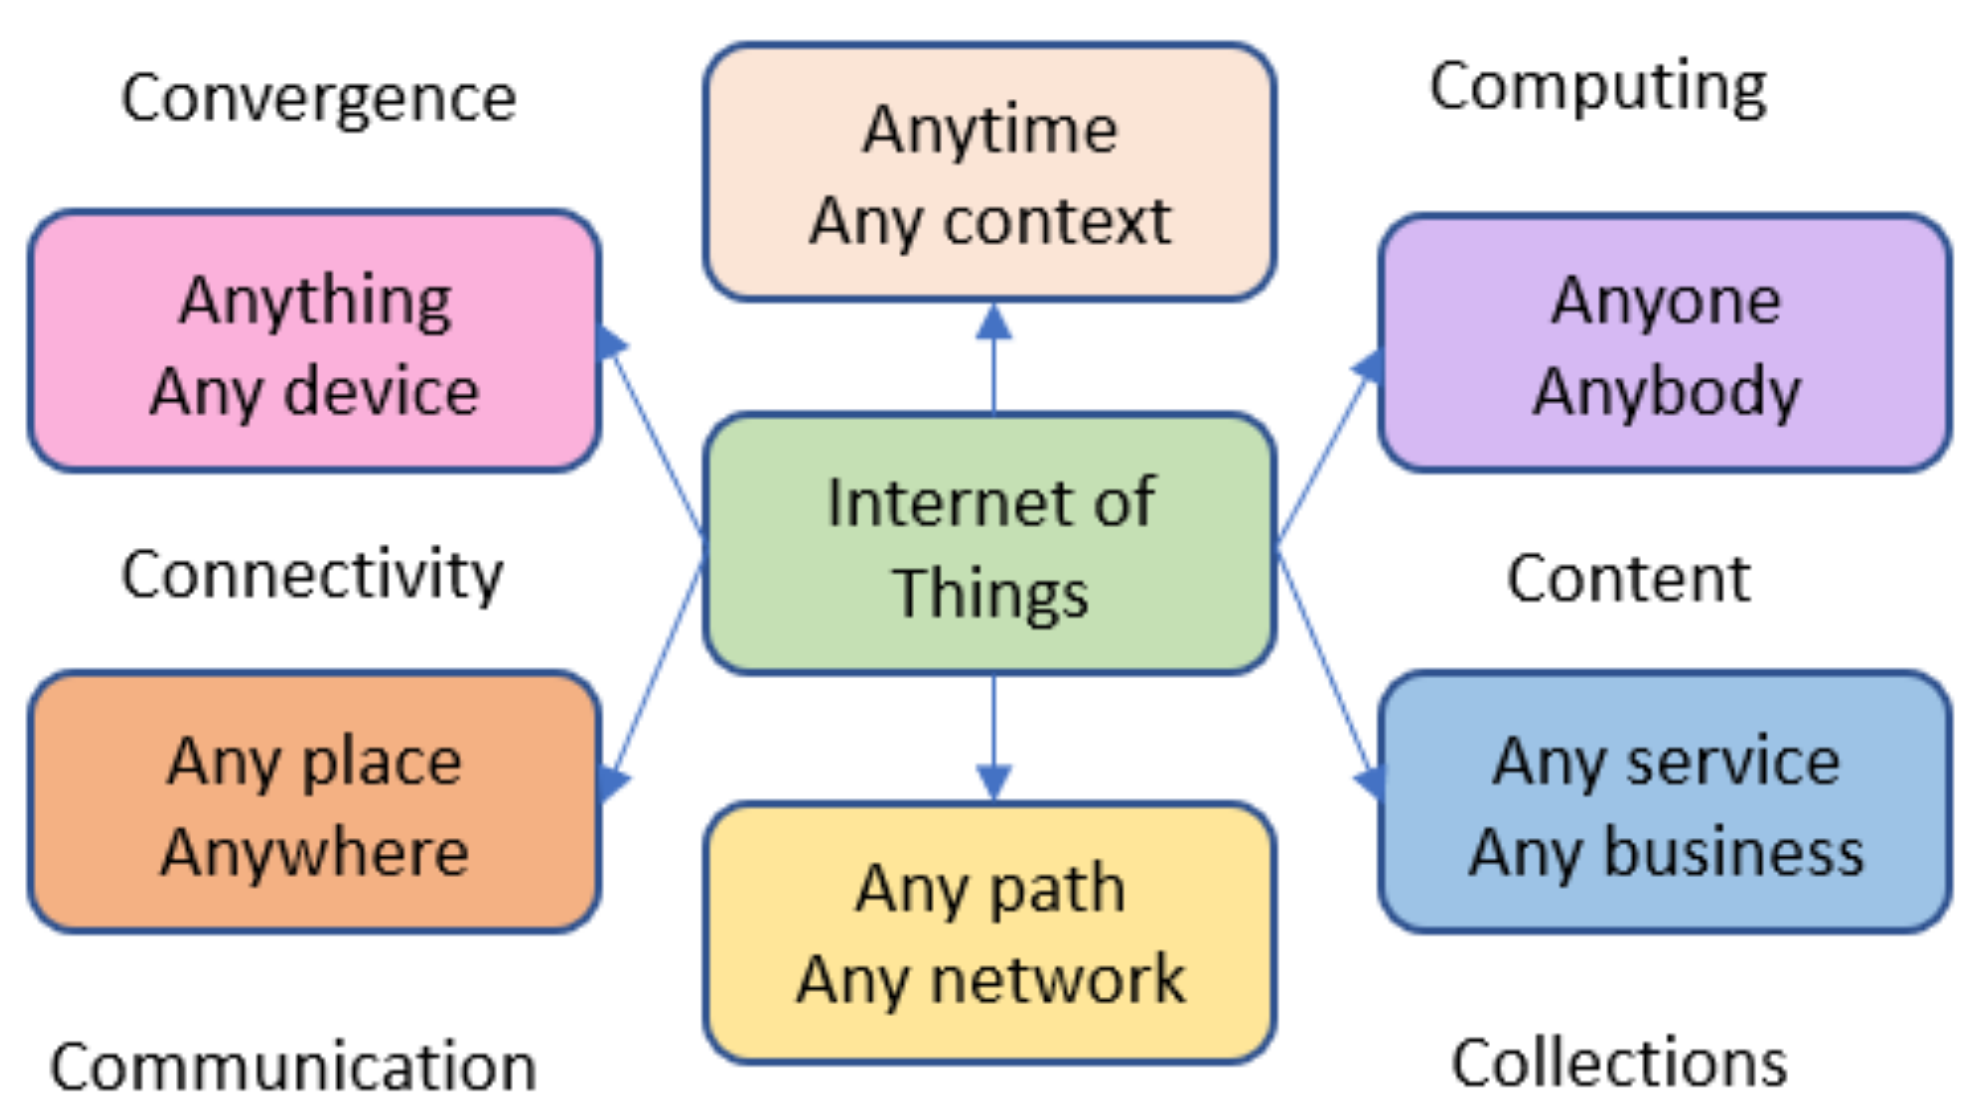
Vermesan et al. [33] provide the simplest definition of IoT, defining it as a symbiotic interaction between the real/physical and digital/virtual worlds. The Internet of Things enables people and things to connect to anything and everything at any time and in any place, ideally over any path/network, or service. This requires that elements such as convergence, content, collections (repositories), computing, communication, and connectivity are addressed in a context where there is a seamless connection between people and things and/or between things and things, as graphically depicted in Figure 3.
The Internet of Things (IoT) is a term that describes a modern environment where virtually all machines and devices used by humans are connected to a network. They could work together to accomplish difficult tasks that require high levels of intelligence. To achieve such a level of intelligence and interconnectivity, IoT systems contain integrated sensors, actuators, processors, and transceivers [35].
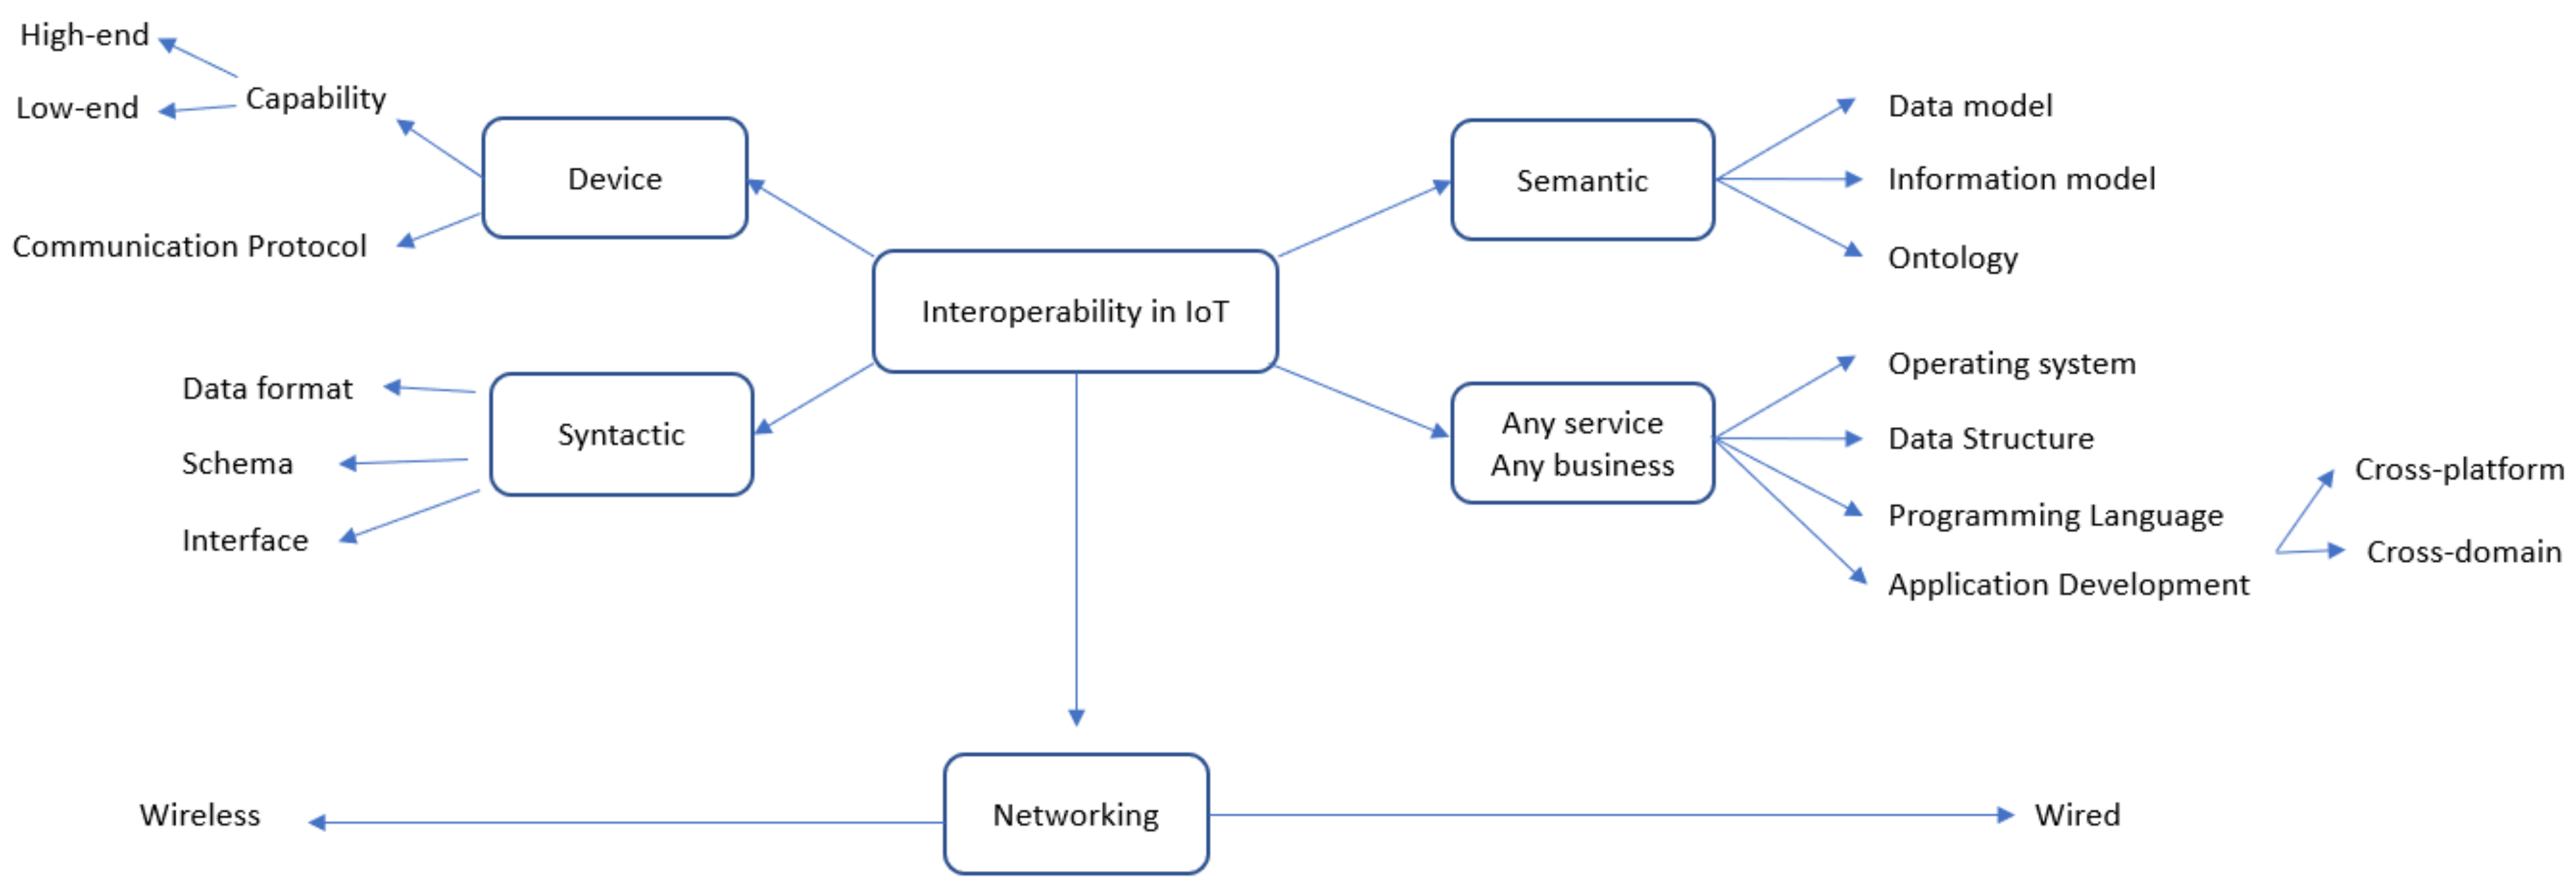
Noura et al. [31] argue that the IoT refers to a global network infrastructure of interconnected devices that communicate over the existing Internet infrastructure. However, interoperability issues arise when each solution has IoT networks, applications, APIs, and data formats. They also note that interoperability issues arise for several critical reasons, such as vendor lock-in, the inability to develop IoT applications that expose cross-platform and/or cross-domain data, and the complexity of integrating non-interoperable IoT devices into separate IoT systems, which ultimately hinders the widespread adoption of IoT technology [31]. In this sense, Vermesan et al. [33] point out that protection, scalability, and cross-platform connectivity between different networked systems are critical in the IoT. In this context, the network infrastructure must have cost-effective solutions that allow virtually anyone to connect to the network. This ubiquitous connectivity can change the way information is handled.
Moreover, Noura et al. [31] emphasize that academia and practitioners have highlighted the value of the IoT interoperability problem. In this sense, practitioners are trying to solve IoT interoperability problems through standardization [31]. Moreover, Noura et al. [31] explain that there are different perspectives on IoT interoperability (Figure 4), such as:
- device interoperability
- network interoperability
- syntactic interoperability
- semantic interoperability
- platform interoperability
There are many approaches and technologies to improve the state of IoT interoperability [31]:
- Adapters and gateways—they take care of interoperability by developing a method known as a mediator to increase interoperability between IoT devices. Among other things, they aim to establish a connection between different specifications, data, standards, and middleware;
- Virtual networks or overlay-based solutions—the main idea is to build a virtual network on top of a physical network that can communicate with other types of devices, such as sensor nodes. The main goal is to seamlessly connect sensors and actuators, as well as other smart IP objects, to the Internet to enable end-to-end communication that is possible within each virtual network using different protocols;
- Network technologies—include various network technologies and protocols such as IP-based approaches, software-defined networking (SDN), network functions virtualization, and Fog computing;
- Open API—refers to an interface provided by service providers that exposes functions or data to an application written in a high-level language;
- Service-Oriented Architecture (SOA)—interaction with the end operations of various wireless devices is divided into different service components, and application layer software can access resources provided by the devices as services;
- Semantic Web Technologies—refers to the Semantic Web of Things (swot) paradigm, which is proposed to integrate the semantic web with the Web of Things (wot), with the further goal of achieving a common understanding of the various entities that make up the IoT;
- Open standard—nowadays numerous standardization bodies, consortia, and alliances are trying to find a solution to the IoT standard problems, such as IPSO, OIC, seen Alliance, etc.
Protocols for IoT data exchange are communication and security protocols that serve as forms of communication and ensure that data exchanged between connected devices is protected as much as possible [36]. Gregersen [32] emphasizes that the IoT infrastructure stack is incomplete without IoT protocols, as IoT hardware would be considered useless. Gregersen [32] further explains how IoT protocols enable hardware to communicate with each other so that end users can derive valuable information from this exchanged data.
Typically, IoT devices are connected to the Internet via an Internet Protocol (IP) network. However, they can also be connected locally via Bluetooth and radio frequency identification (RFID), which leads to differences in the range, power, and storage of such IoT devices [36]. Uppalapati [36] points out that while range is not a problem, connections over IP networks are more difficult and require more memory and power from IoT devices. In contrast, non-IP networks require less power and memory but have a shorter range. In this sense, there are two main categories of IoT protocols and standards [32,36]:
- IoT network protocols—used to connect devices over a network, usually the Internet;
- IoT data protocols—used to connect to low-power IoT devices by allowing users to communicate with hardware over a cellular or wired network without requiring an Internet connection.
All IoT technology requires the handling of immense data volumes to realize its full potential [37,38]. To deal with this, increasingly complex systems and frameworks are being constructed, and new approaches are constantly being developed to tackle this open problem [37,39,40,41]. The key issue is not the quantity but the quality of the data used for model input, i.e., how to successfully clean and preprocess data from ever more abundant data sources [42,43,44,45,46]. For example, Alharam et al. [47] discuss one facet of IoT complexity in the healthcare industry, and Pappas et al. [48] in the tourist accommodation industry.
3.2. Analysis and Identification of IoT Devices and Sensors Available in the Market
According to Gartner [49], IoT is one of “the “most hyped technologies that could transform the way businesses operate”.” Therefore, this chapter analyzes and identifies the IoT devices and sensors available on the market and defines the protocols for IoT data exchange.
Nowadays, many IoT devices and sensors are available in the global market. According to the Arm Glossary [50], examples of IoT devices are sensors, actuators, hardware, equipment, gadgets, or devices designed for specific purposes that can transmit data over the Internet or other networks and can be integrated into a variety of products, including cell phones, industrial machines, medical devices, home appliances, environmental sensors, and more.
Sharma [51] provides a list of the 15 most common types of IoT sensors used in various industries, namely:
- temperature sensors,
- proximity sensors,
- pressure sensors,
- water quality sensors,
- chemical sensors,
- gas sensors,
- smoke sensors,
- infrared sensors,
- level sensors,
- image sensors,
- motion detection sensors,
- accelerometers,
- gyroscope sensors,
- humidity sensors,
- optical sensors.
Temperature sensors measure the amount of thermal energy and convert the data for a device or consumer to detect a physical temperature difference from a specific source [51]. Proximity sensors refer to devices that can sense the absence or presence of a surrounding object or its characteristics and convert the information into a signal that can be easily read by a consumer or simple electronic instrument without coming into contact with it [51]. Pressure sensors sense pressure and convert it into an electrical signal, with the amount of pressure determining the amount applied. A more detailed overview of sensors can be found in [51].
4. Prototyping a Decision Support System (DSS) for Predictive Maintenance
4.1. Case Study Description
The DSS was developed for the case study as a proof of concept for predictive maintenance of industrial air conditioning systems. These systems operate 24/7 throughout the year and collect various types of data that we can use thanks to IoT and sensors. The SME has several storage facilities, which are connected in a network using innovative IoT technologies. The following information is collected for the monitoring and maintenance of these facilities: location, device, energy, temperature, humidity, region, age, and cost. The study presents an improved predictive maintenance DSS for Industry 4.0. The proposed DSS analyzes data from multiple sensors. It uses machine learning and artificial intelligence algorithms to report deviations from the ideal process and correct them to the best settings, directly or indirectly through operator involvement or self-collection. The program also predicts certain variables over time, such as energy consumption.
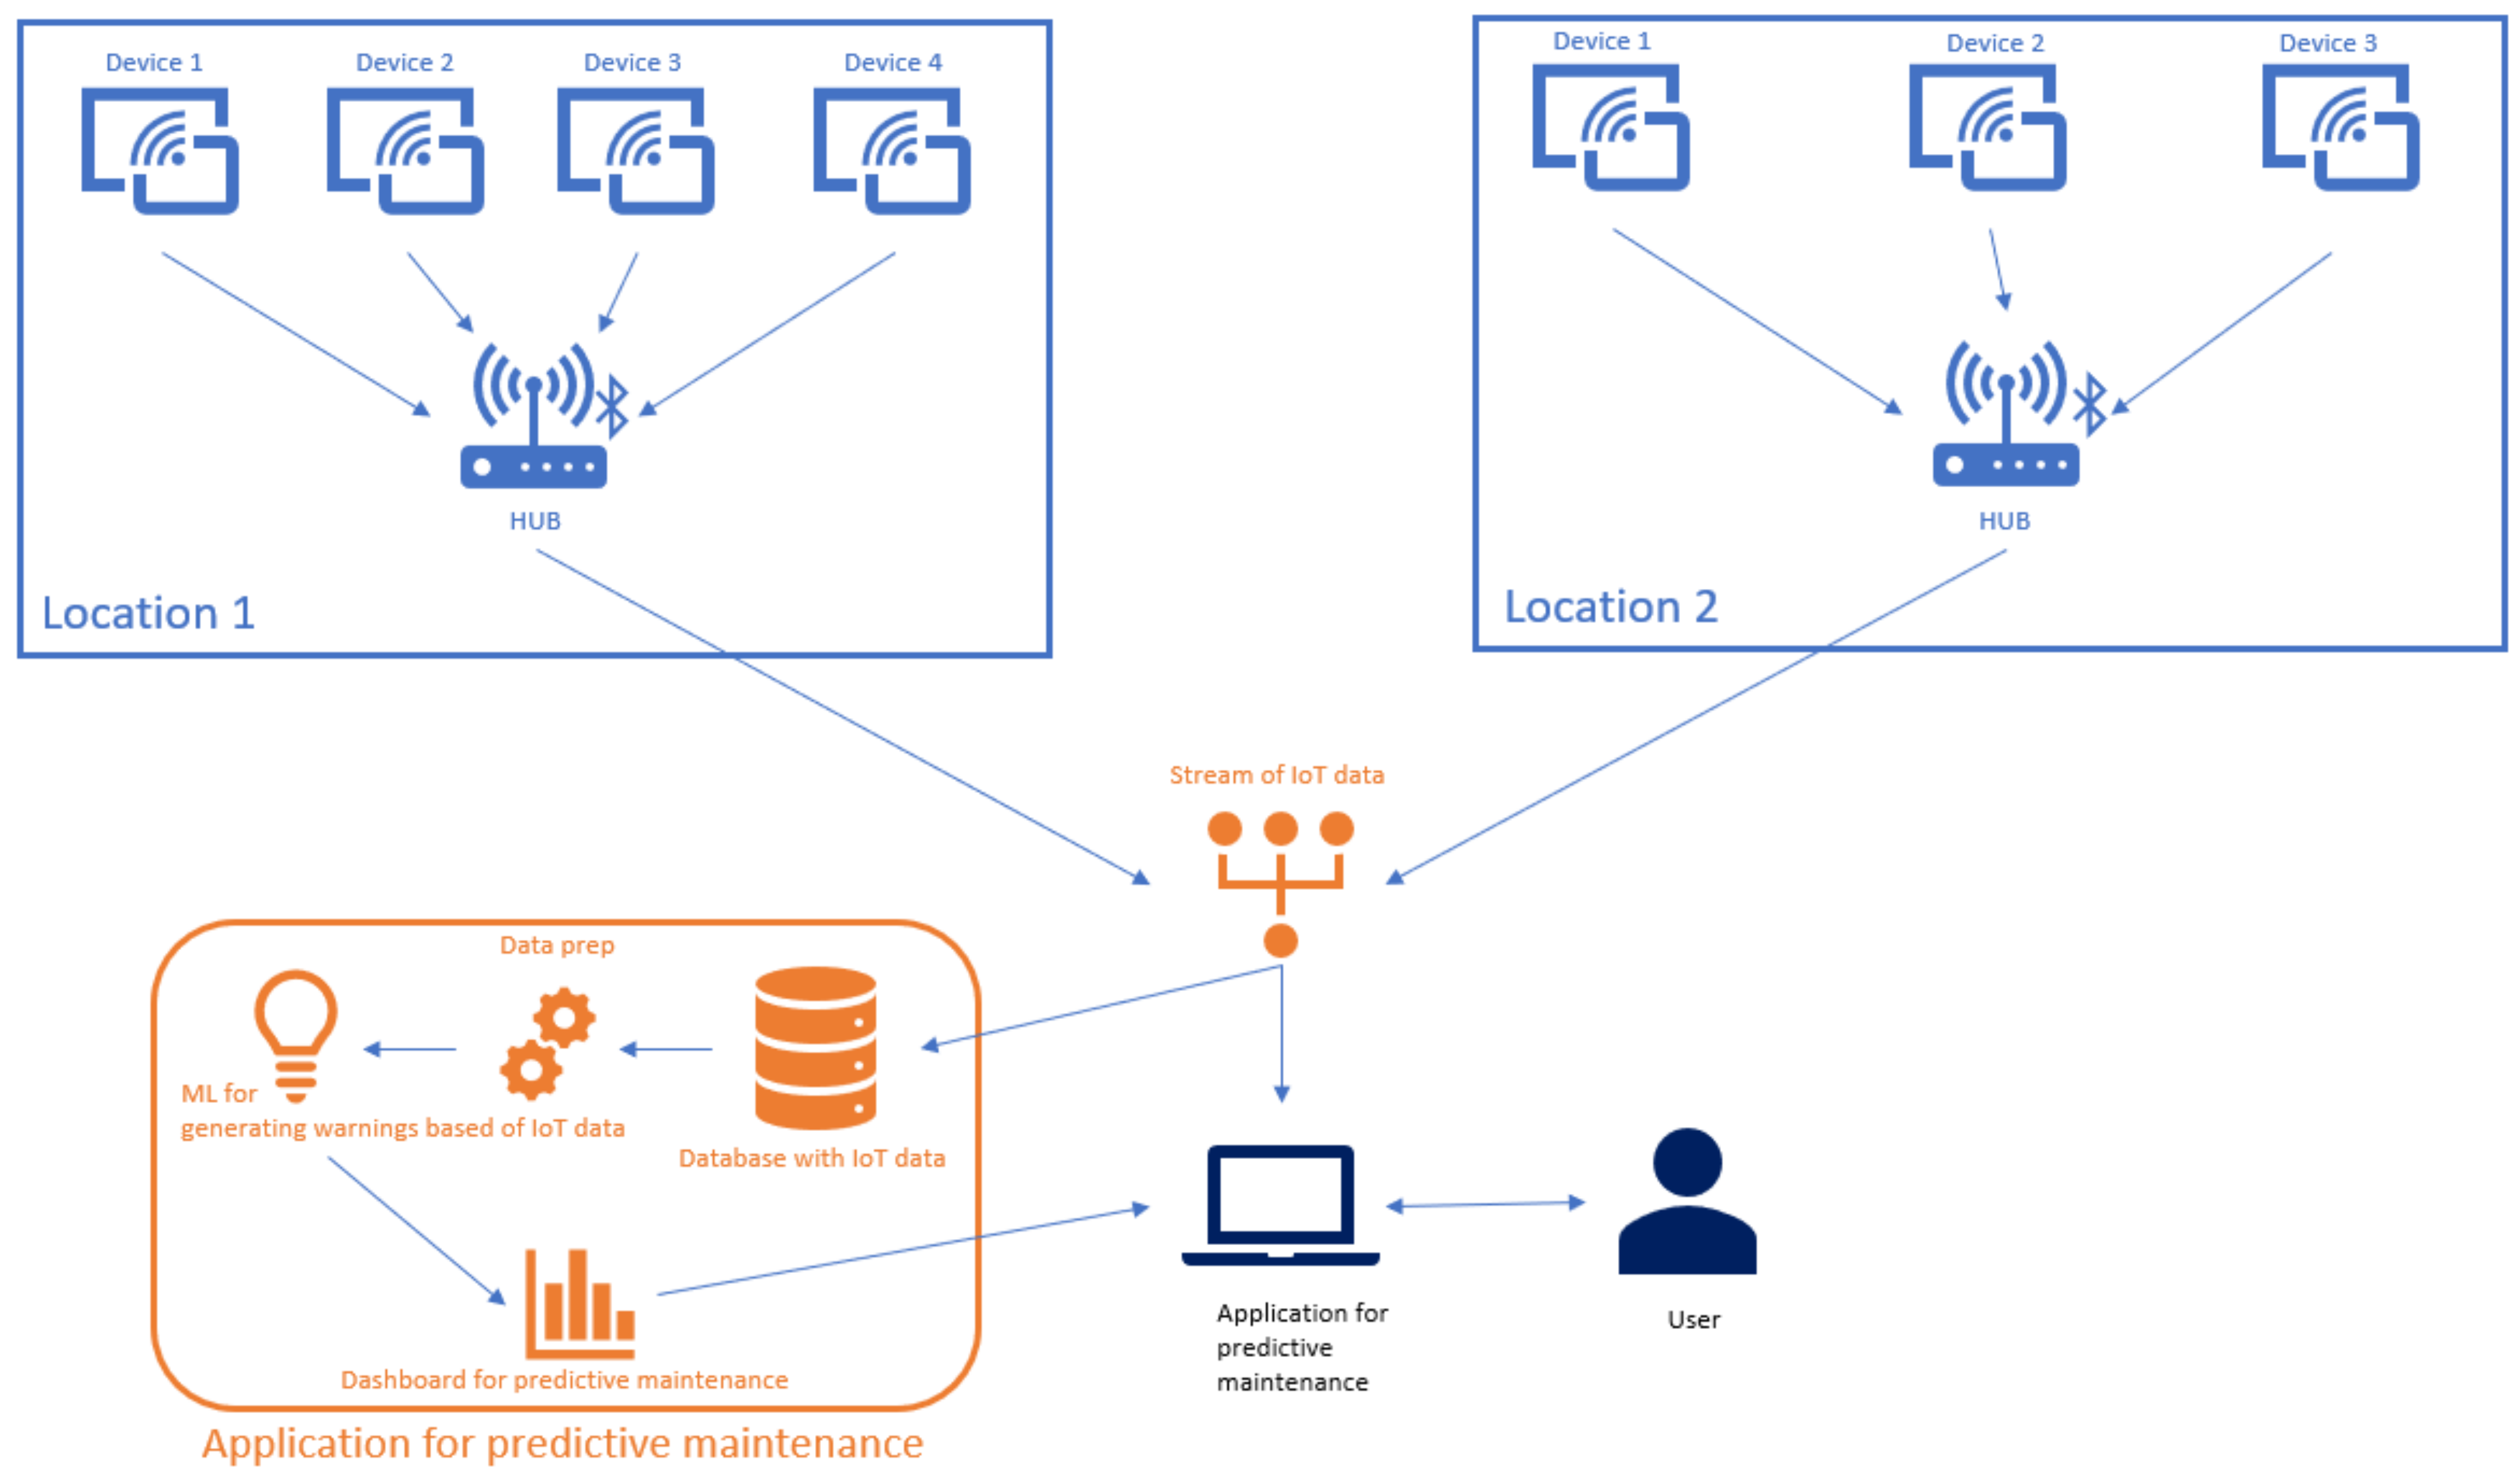
4.2. Architecture of the Application
The architecture of the application was developed following the predictive maintenance framework [7]. Figure 5 shows the DSS architecture. Data is collected from different devices at different locations. The DSS is fed by the stream of IoT data that is analyzed using the machine learning application for predictive maintenance. This consists of the IoT data database, the data preparation module, the machine learning for predicting IoT data, and the predictive maintenance dashboard.
The application was developed using the open-source software R [52]. The packages and libraries used in the development are:
- Shiny—Shiny is an open-source R package that provides an elegant and powerful framework for building web applications with R [55].
- shinyWidgets—the family of pre-built widgets in the Shiny package, each created with a transparently named R function.
- Shinycustomloader—a custom file for loading the screen in the R Shiny package.
- bs4Dash—the R package for developing modern dashboards in R Shiny.
- echarts4r—a package for interactive charts.
- echarts4r.maps—a dataset with the latitude and longitude of all cities used for interactive charts.
- Reactable—creates a table from tabular data with default sorting and pagination. The data table is an HTML widget that can be used in R Markdown documents and Shiny applications or displayed via an R console.
- Fresh—used for Custom ‘Bootstrap” themes in Shiny.
4.3. Machine Learning Deployment
Machine learning has been used for three purposes:
- Dataset creation—The small company for which the DSS was developed chose to keep its data anonymous. Therefore, we created an illustrative dataset.
- Prediction of data—The DSS predicts the observed data for the selected time period in the future.
- Warnings for devices—The DSS generates warnings for the devices in the future based on the observed data in the past and the predicted data.
4.3.1. Dataset Generation
To complete our case study, we simulated the dataset to be collected by networking storage facilities based on innovative IoT technologies. The dataset used was simulated based on the information on the indicators measured as well as their ranges collected by the in-depth interviews, as is common in the field [56,57]. For data simulation and prediction, the following R function was used: rnorm function—for generating the simulated dataset using the normal distribution for a given integer sequence (depending on the metric) for a synthetic site/device string. A normal distribution has been selected since the synthetic dataset has been used for demonstration purposes. Such an approach has been often used in machine learning research, as indicated by Bolón-Canedo et al. [58]. More specifically, normal Gaussian distributions have been used by Camacho [59] and Panagiotakis et al. [60] for generating synthetic datasets for recommender systems. Simulated datasets that mimic real datasets well can either augment or entirely remove the need for training on real sensor data [61,62,63,64,65].
The complete list of variables included in the dataset, as well as their format and modalities as nominal variables, can be found in Table 2.
The simulated dataset was created using the normal distribution for a given integer sequence (depending on the metric) for a synthetic site/device chain. The dataset includes nine variables, including device location, device ID, energy, temperature, warnings, etc.
4.3.2. Forecasting Data
Second, the aggregate daily averages of the data are used to make predictions using the Prophet algorithm implemented in R, a method for predicting time series data based on an implemented additive model. This model fits non-linear trends with annual, weekly, and daily seasonality and vacation influences. It works best when applied to time series with significant seasonal effects and historical data from many seasons. The Prophet algorithm is resilient to missing data and fluctuations in trends, and it usually copes well with outliers.
The program uses the historical simulated data from the last 100 days to predict the next 100 days. The data were forecasted using the Prophet algorithm. Prophet is a forecasting technique that can be implemented in R and Python. It is fast and provides automated predictions, although data scientists and analysts can still post-process the predictions by hand if they wish. Prophet is a technique for predicting time series data based on an additive model and involves fitting nonlinear trends with annual, monthly, and daily seasonality and vacation influences. It works most effectively for time series with significant seasonal influences and historical data that spans many seasons. The Prophet algorithm is resilient to missing data and fluctuations in trends, and it usually handles outliers well. Prophet has been used for forecasting in many fields, such as energy [66], sales [67], and the stock market [68].
4.3.3. Warning for Devices
To generate warnings about devices that need urgent maintenance, we apply the following Recommenderlab algorithm: The package is used to apply the Recommender algorithm, more precisely the collaborative filtering algorithm, which generates predictions for each device based on observed patterns and predicted data.
The data must be sufficiently prepared to apply the collaborative filtering algorithm in R using the “Recommender” function from the “recommenderlab” package. This package provides a research platform for developing and evaluating collaborative filtering and recommender algorithms [69]. This includes a sparse representation of user-element matrices, many well-known methods, top-N recommendations, and cross-validation.
First, we transform the dataset into a matrix useful for machine learning using the Devic X metric function. We performed cleanup and preparation steps and transformed the matrix into a binarized matrix for faster computation. The matrix was split into a training set and a test set. Using the training set and the test set, we generate the recommendation algorithm for device alerts using item-based collaborative filtering [70]. The recommendation algorithm is trained to generate warnings for the future based on the warnings in the past. In this illustrative example, energy, temperature, and humidity were input variables while the warning was issued. The portion of the training data that was used as the basis for the prediction is shown in Table 3.
Recommendations are generated for each device. The recommendations are displayed in the graphical user interface on the Analysis Table.
4.4. Graphical User Interface
The purpose of the graphical user interface is to provide insight into device behavior based on past data and discover patterns that improve device maintenance by predicting the future state of the devices.
The graphical user interface for the Predictive Maintenance application is shown below (Figure 6).
5. Use Case of the DSS Platform Usage
The following use case demonstrates the validation of the platform and data collection functions through the various sensors and operational actions.
An example of how to use the platform is presented in the following steps, which illustrate the functionalities of the application:
- Step 1: Location selection
- Step 2: Checking devices based on energy consumption
- Step 3: Checking devices based on temperature
- Step 4: Overview of key performance indicators
- Step 5: Inspecting devices by age and cost
- Step 6: Inspecting devices by age and cost
- Step 7: Forecasting data
- Step 8: User feedback
5.1. Step 1: Location Selection
First, the user selects the location to be monitored. Once a location is selected, all charts for that specific location are filtered. We obtain the three most important Key Performance Indicators (KPIs) for that location: number of devices, energy consumption (kWh—expected), and alerts (today), as shown above in Figure 7. You can filter the entire dashboard using a synthetic site group. Depending on the selection, different devices and readings will be displayed to simulate the real situation.
There are five active devices at this site with a current expected energy consumption of 5.93 kWh and one warning (Figure 8).
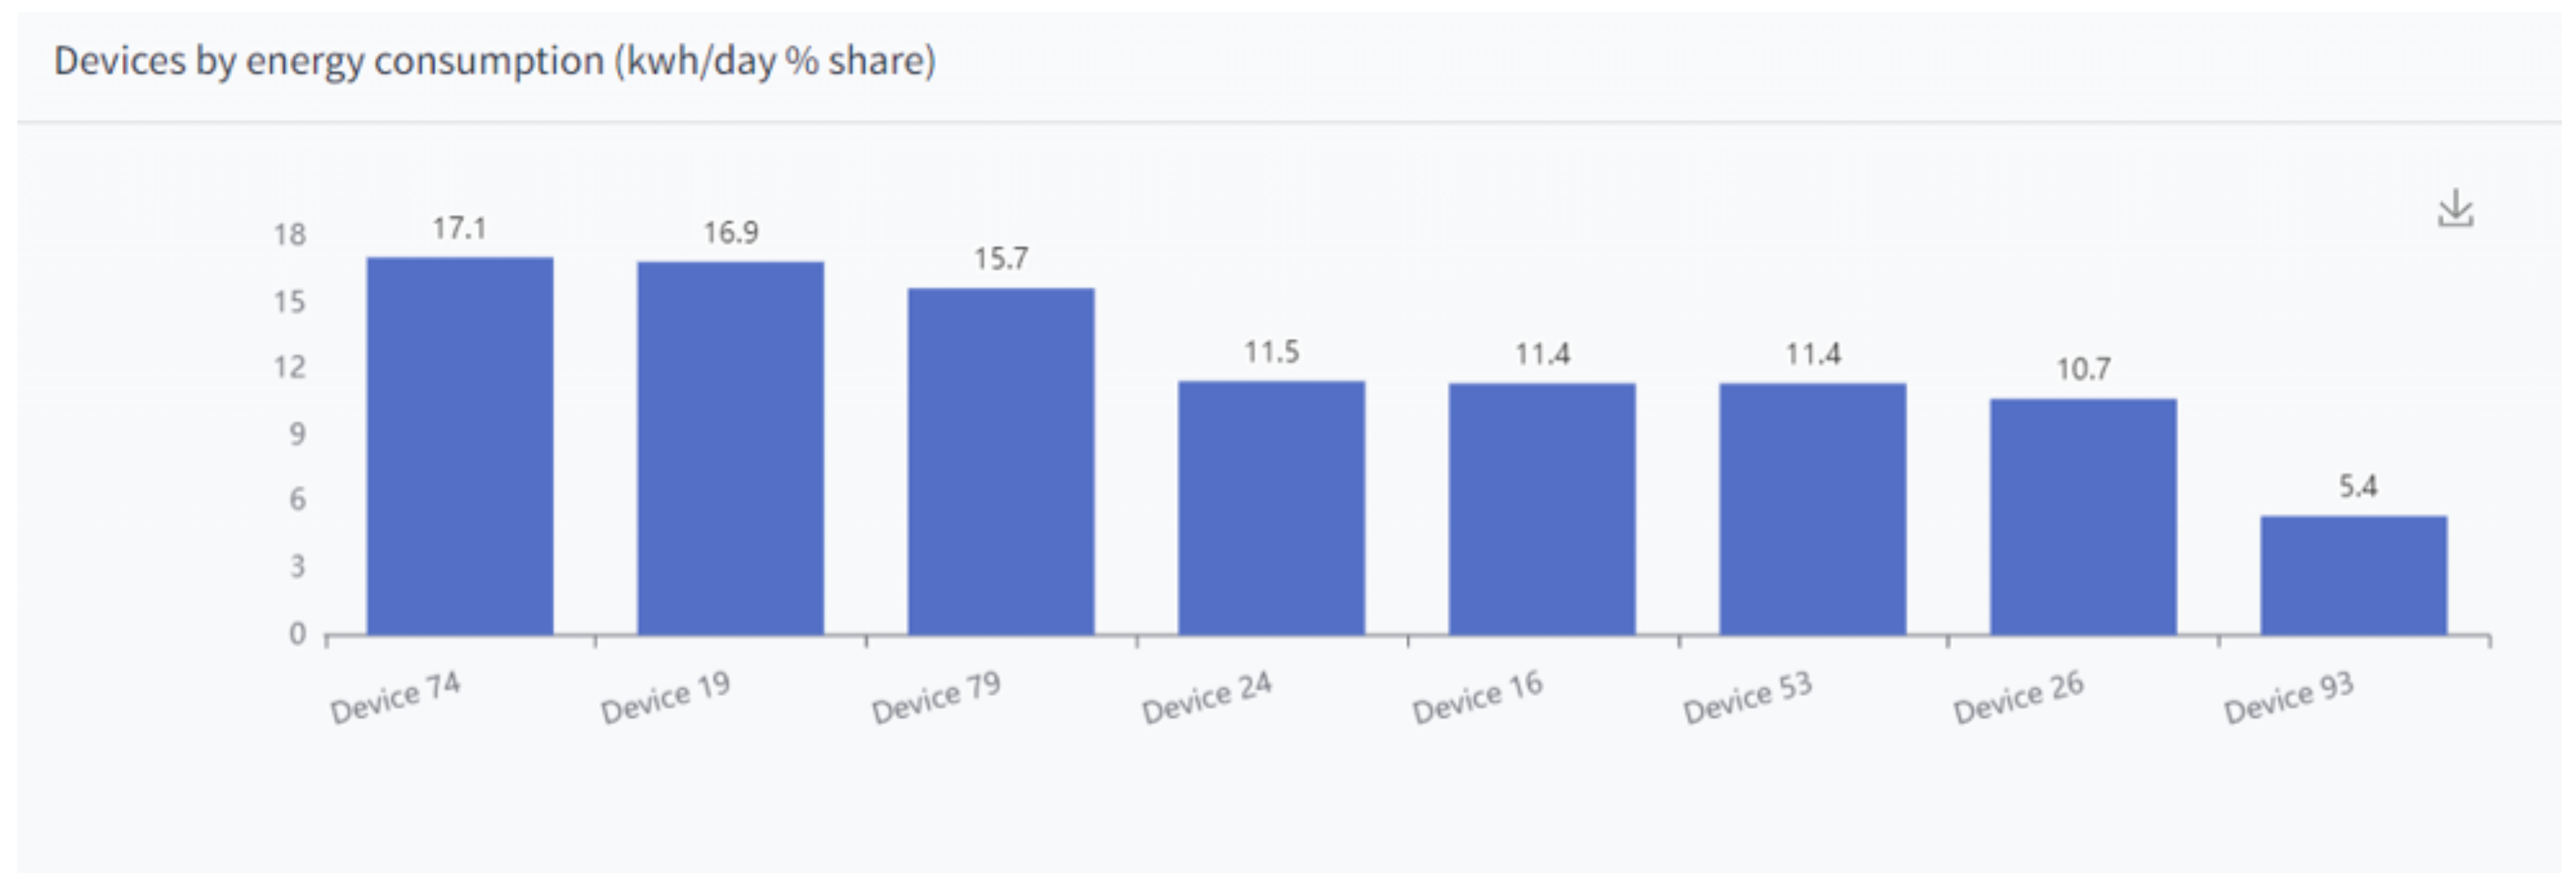
5.2. Step 2: Checking Devices Based on Energy Consumption
Below the KPIs is a graph showing the energy consumption of the devices, sorted by percentage of total energy consumption for the selected site. The real-time energy consumption for units 29, 46, 42, 36, and 22 at the time of writing is shown in Figure 7. When you hover over a particular device, a pop-up window appears with the device name and the percentage of total energy consumption for the selected location. In this particular example, the real-time energy consumption at the time of writing was:
- Device 29—29.4 kWh/day % share
- Device 46—20.9 kWh/day % share
- Device 42—20.7 kWh/day % share
- Device 36—19.6 kWh/day % share
- Device 22—9.5 kWh/day % share
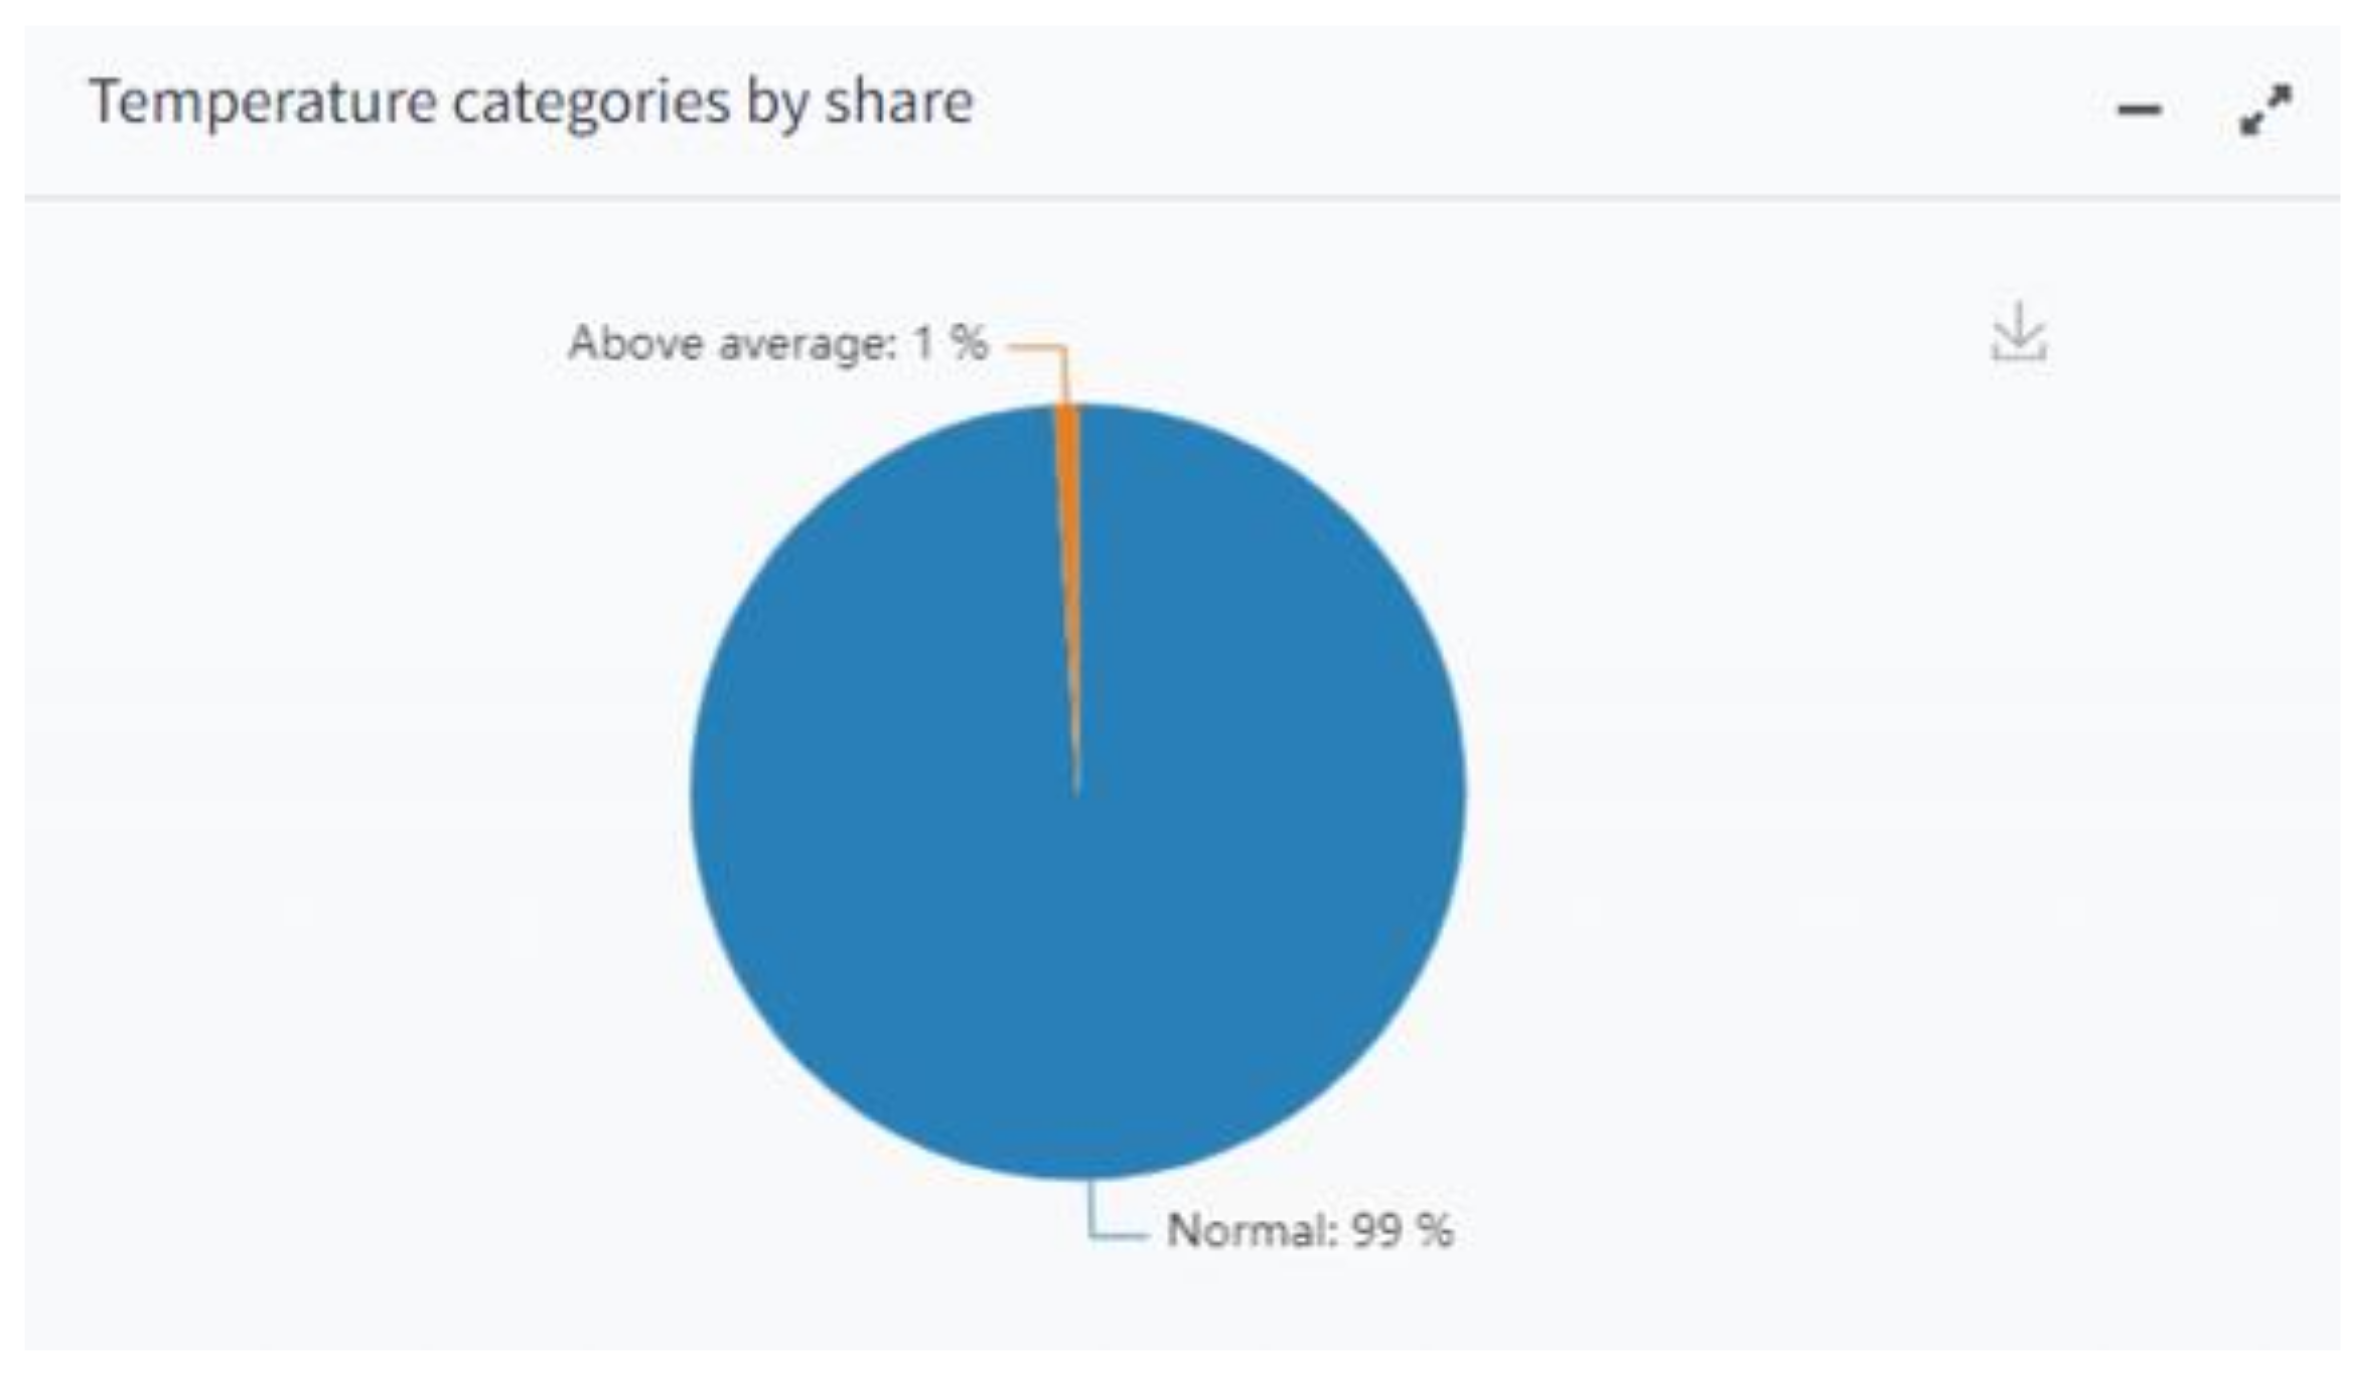
5.3. Step 3: Checking Devices Based on Temperature
On the right, under Temperature Categories by Proportion of Daily Occurrence, is a doughnut chart showing the detection of anomalies in temperature and all warnings in a day, as shown in Figure 8, which represents the warnings for Site 8.
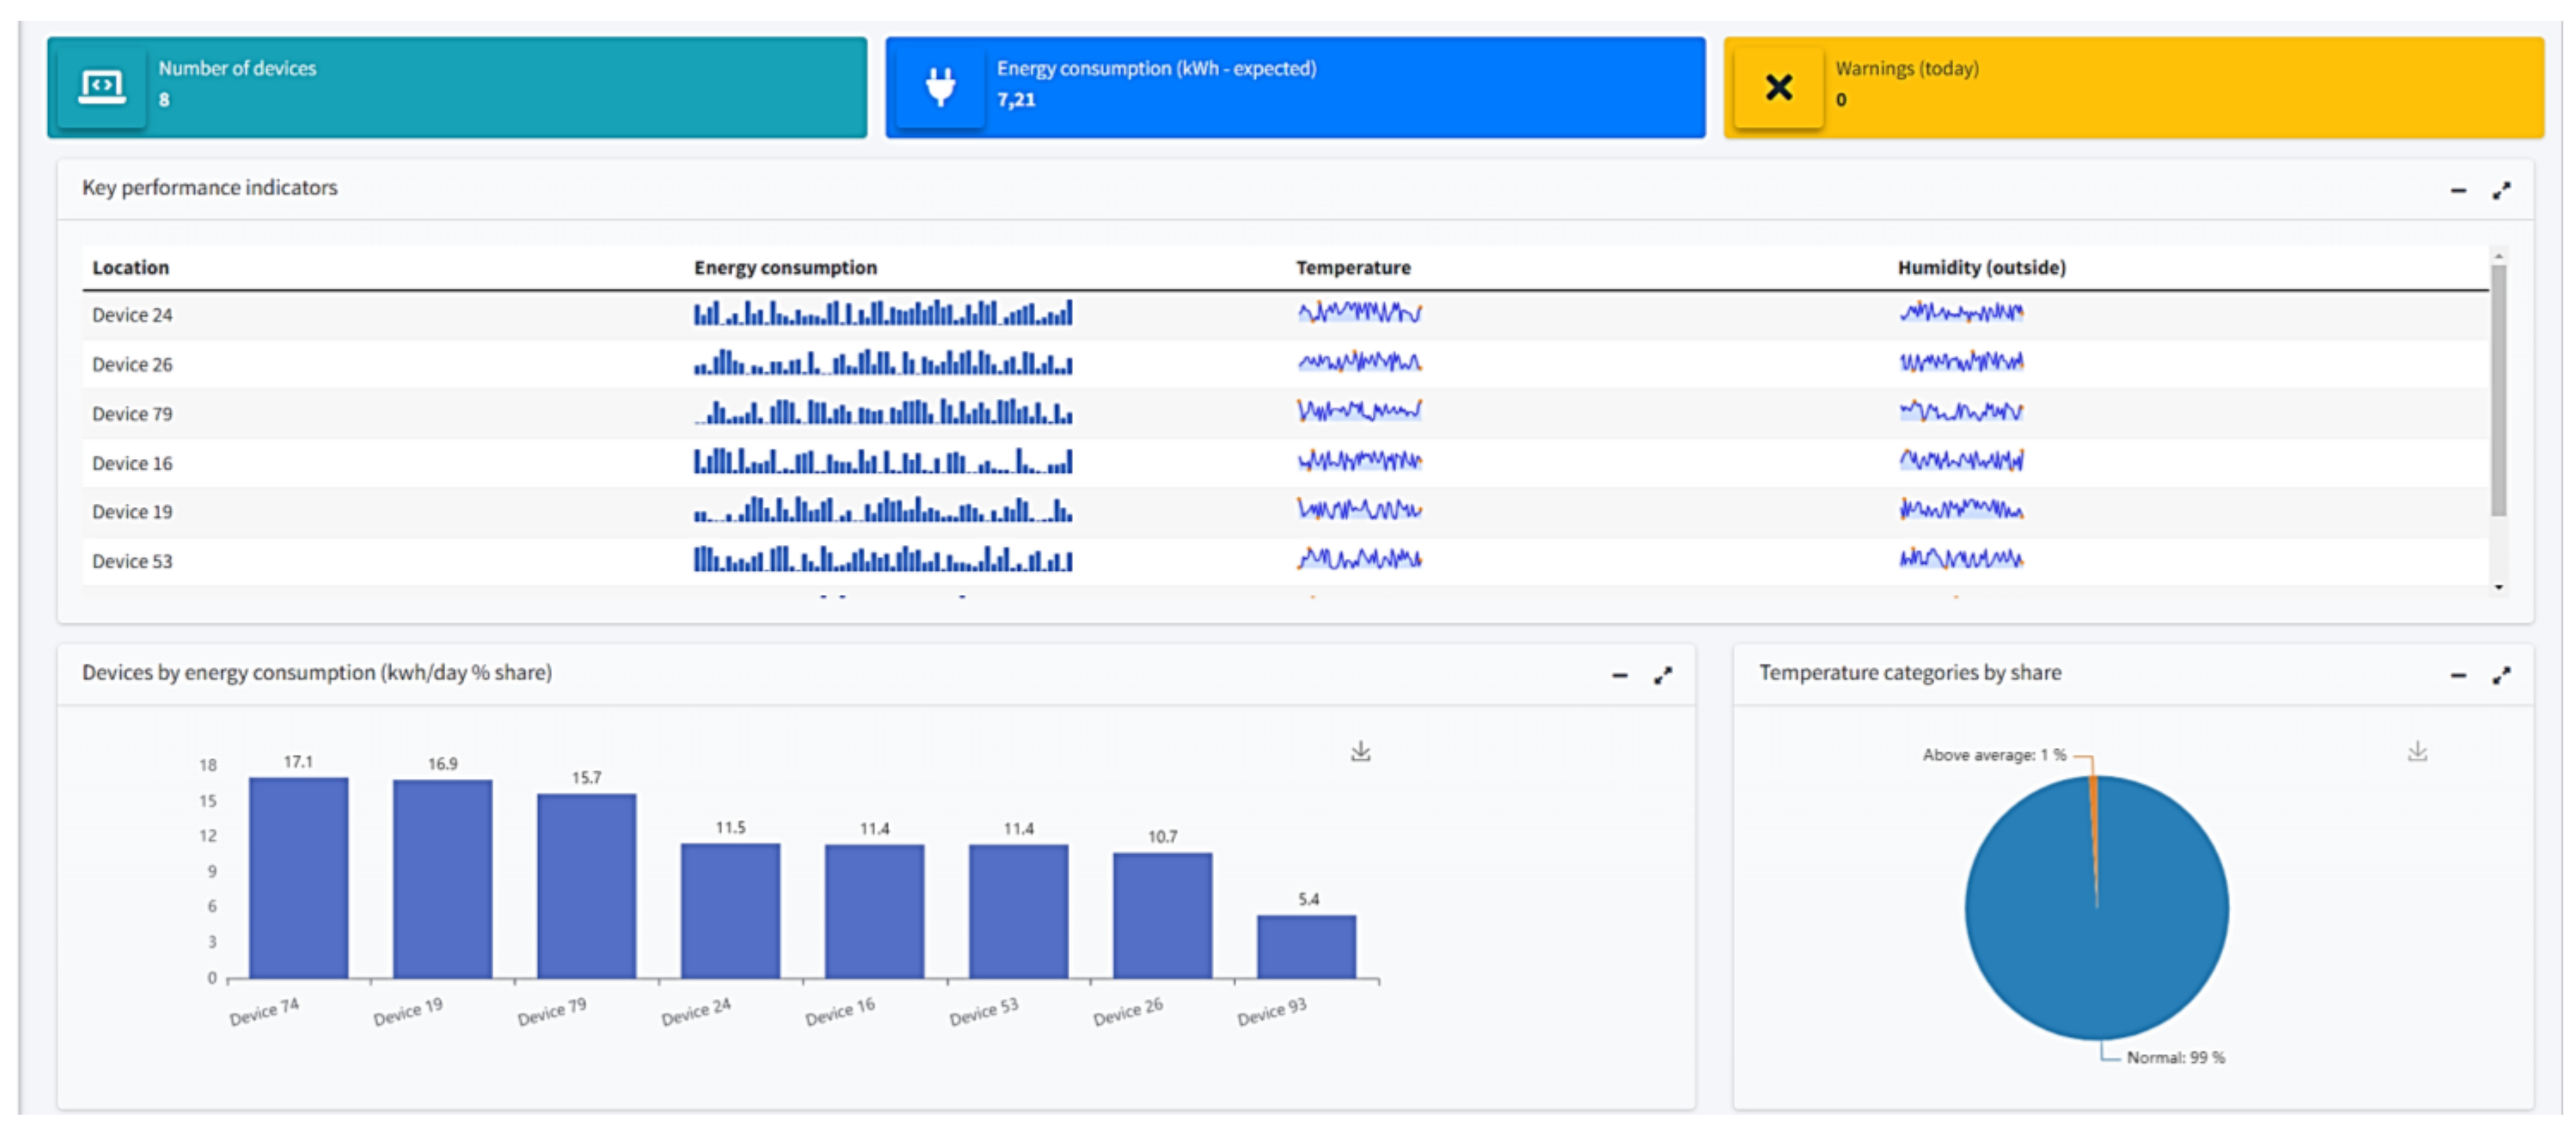
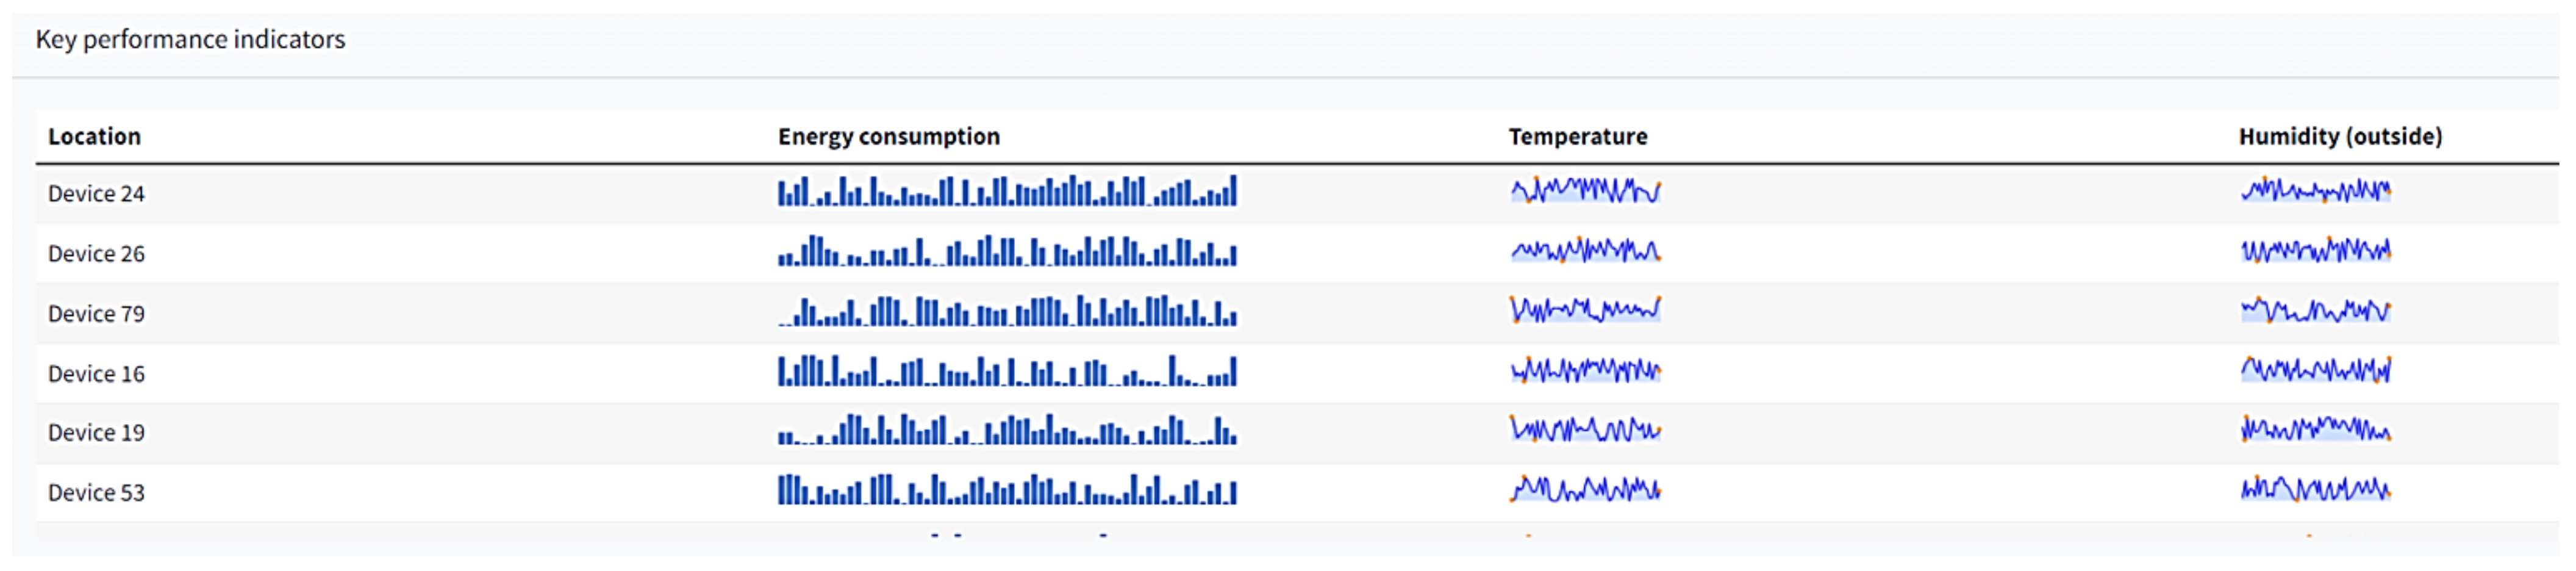
5.4. Step 4: Overview of Key Performance Indicators
The final table is the key performance indicator table, which lists the devices with three main graphs for each metric: energy consumption, temperature, and humidity. The final table is shown in Figure 9.
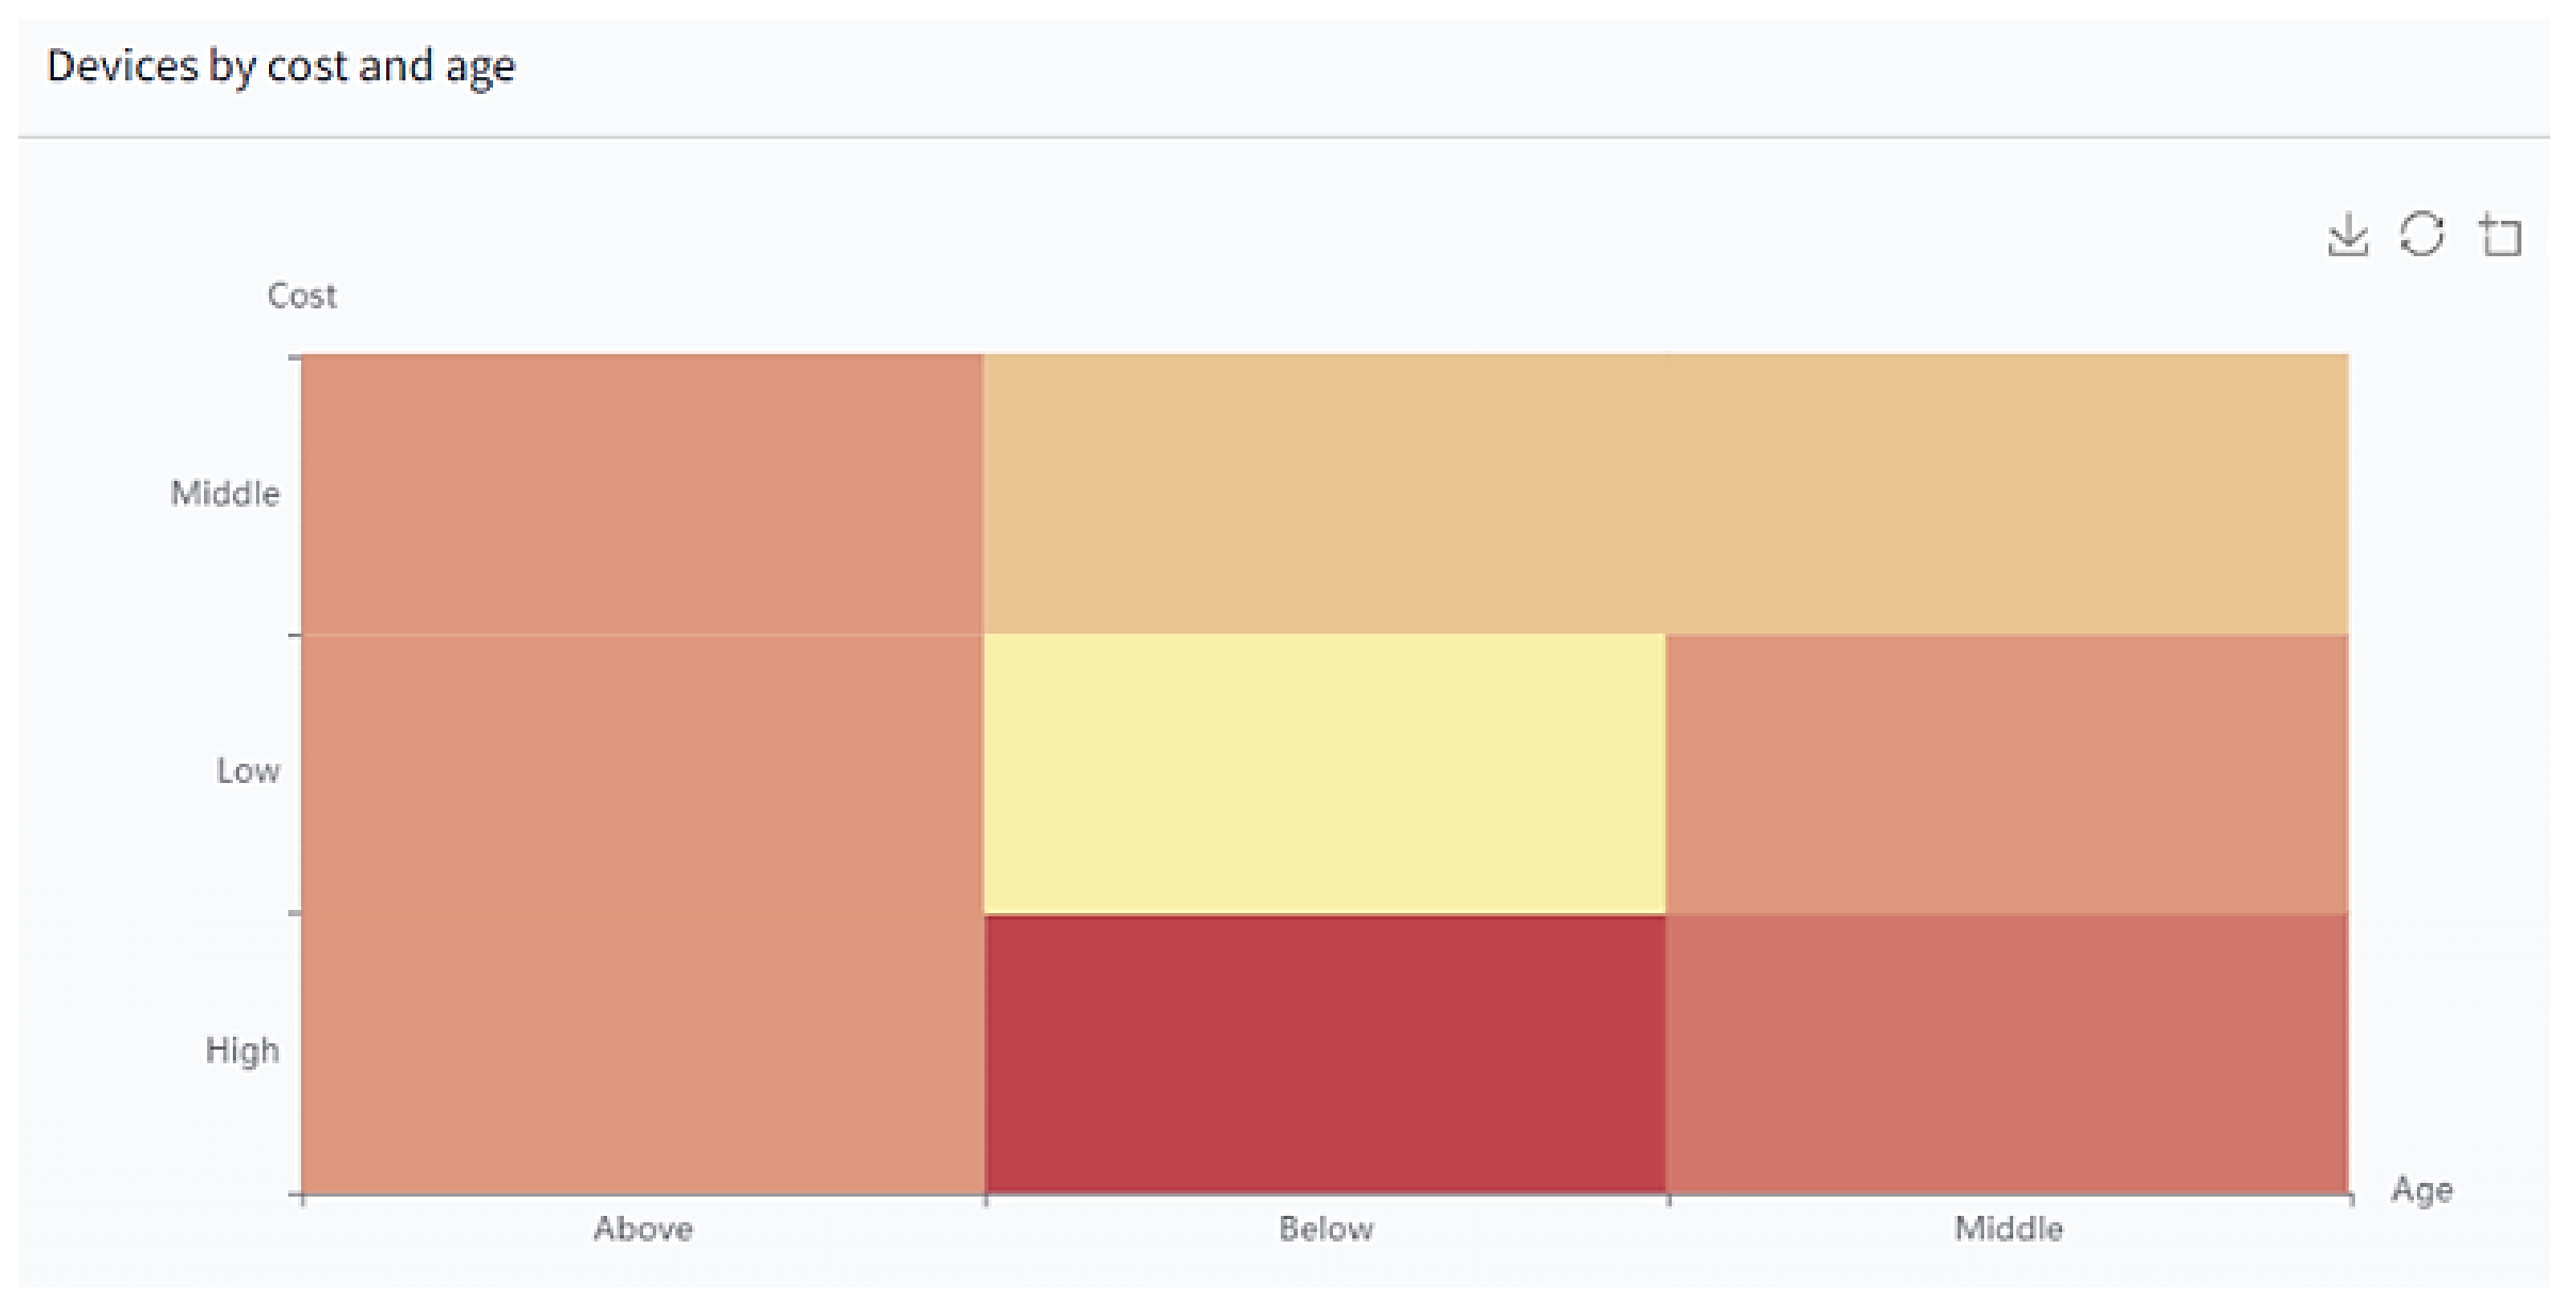
5.5. Step 5: Inspecting Devices by Age and Cost
The Devices by Cost and Age chart allows us to look at the correlation between age and cost for each device to see possible patterns, as shown in Figure 10. In this example, no interesting patterns are observed, which is to be expected since simulated data were used. Hovering over a specific point on the graph will display the exact data for that device.
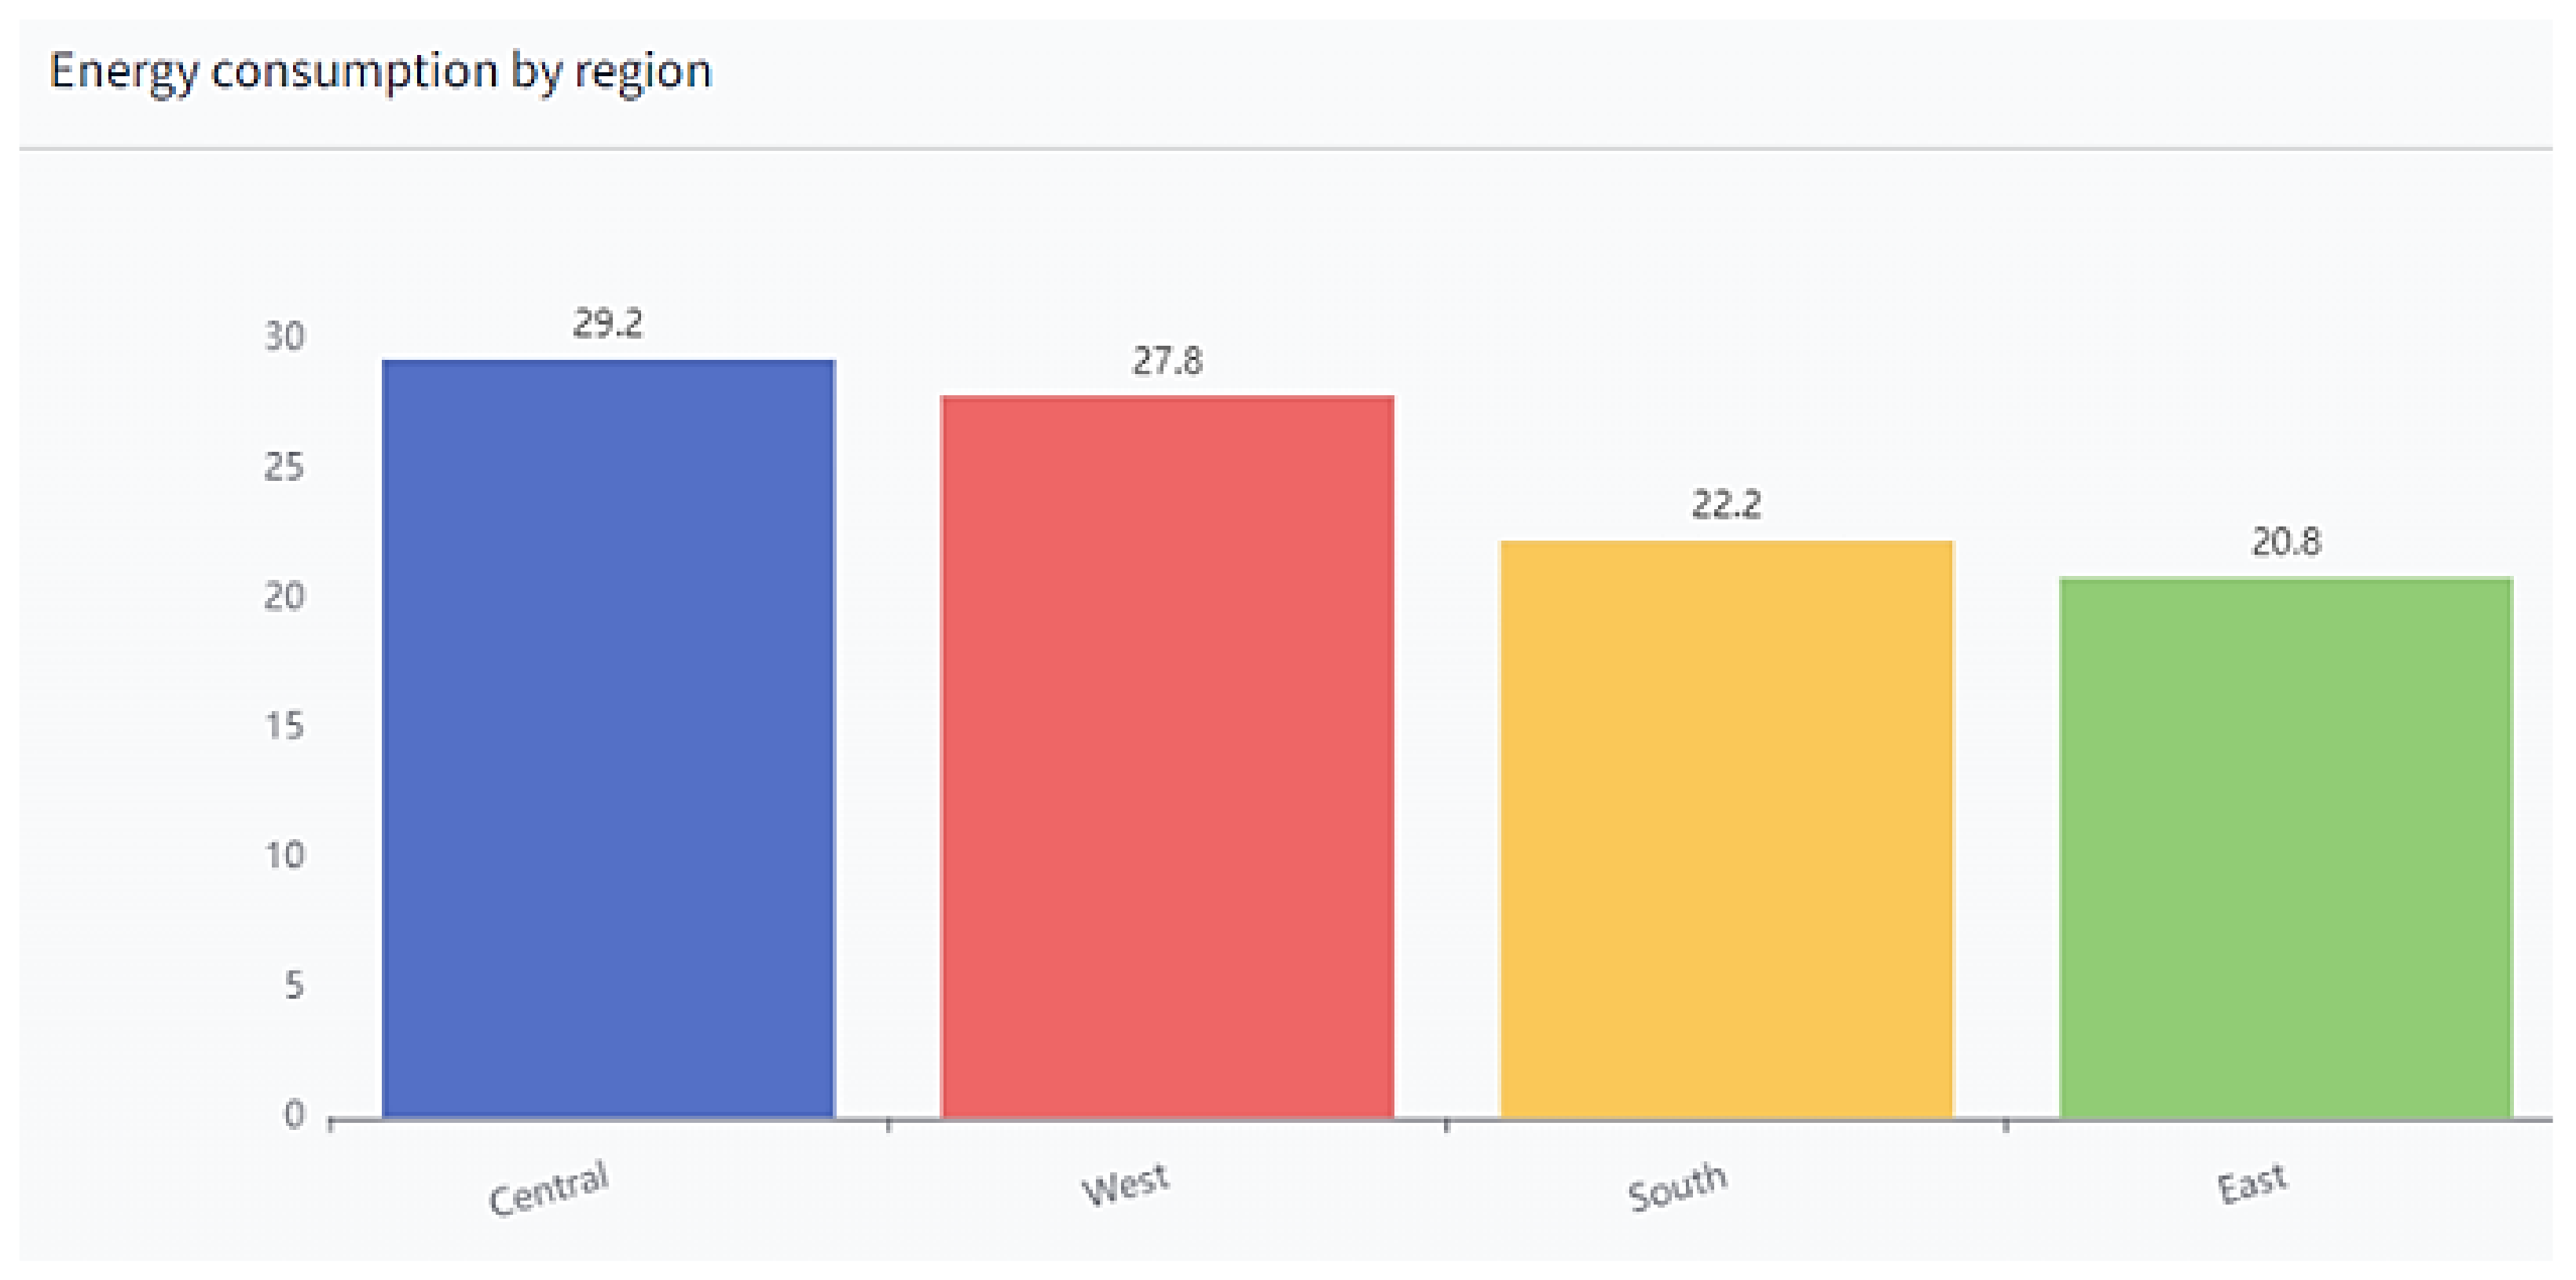
5.6. Step 6: Inspecting Devices by Regions
Energy consumption by region is a doughnut chart that shows us the energy consumption of the different regions in the dataset. In this case, these are the west, central, south, and east regions. The exact energy consumption data (% share) for each region in this example is as follows:
- West—45 (30.82%)
- Central—45 (30.82%)
- South—34 (23.29%)
- East—21 (14.38%)
The Energy consumption by region doughnut chart can be viewed in Figure 11.
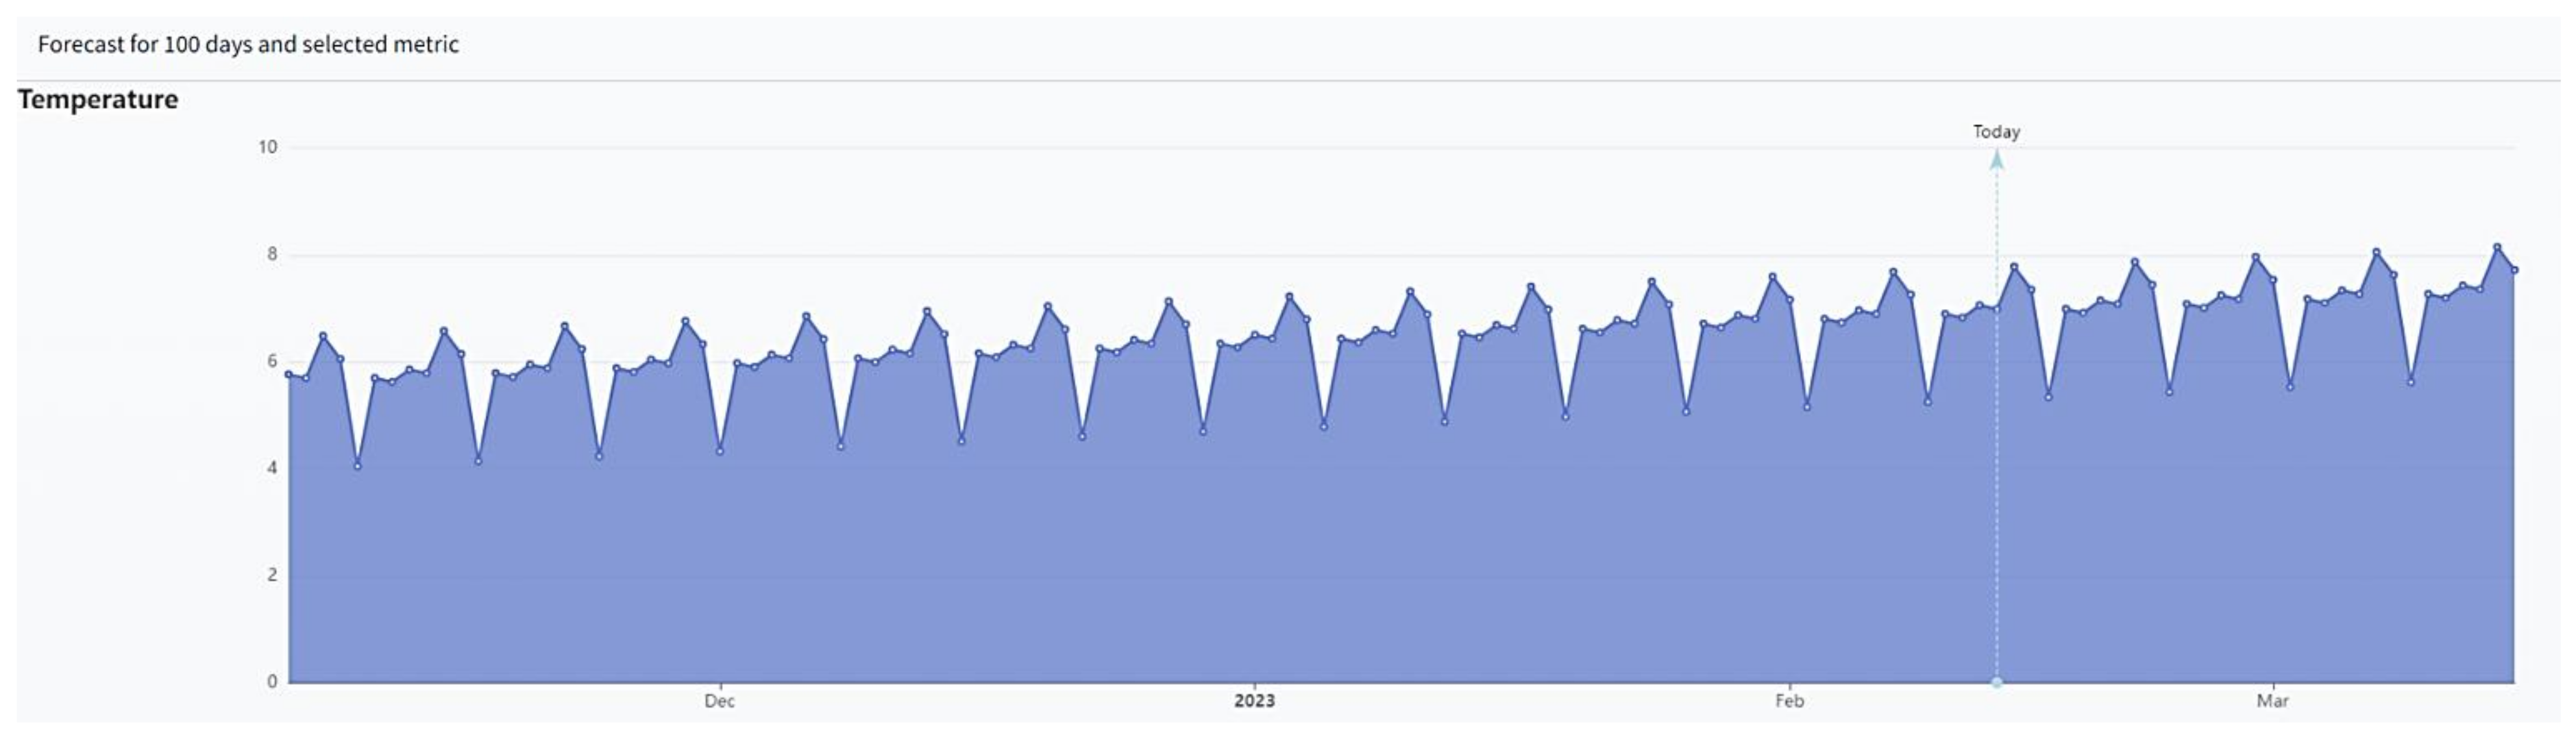
5.7. Step 7: Forecasting Data
To demonstrate the use of the DSS for scenario planning, we employ the prediction algorithm, the Prophet algorithm [71]. The advantage of this approach is that it avoids the opaque nature of other common machine learning algorithms [72]. The data to be predicted are the aggregate average data for each day. The algorithm uses historical simulated data from the last 100 days to forecast 100 days into the future.
Once 100 days of data are generated for each metric, the data are sent to the ML function, which receives the data, cleans and processes it, and trains it with the Prophet algorithm to predict 100 days into the future.
In this example, the user has selected the energy forecast for site 10. As we can see in Figure 12, a slight increase in energy consumption is expected over the next 100 days.
5.8. Step 8: Generating Warnings for Devices
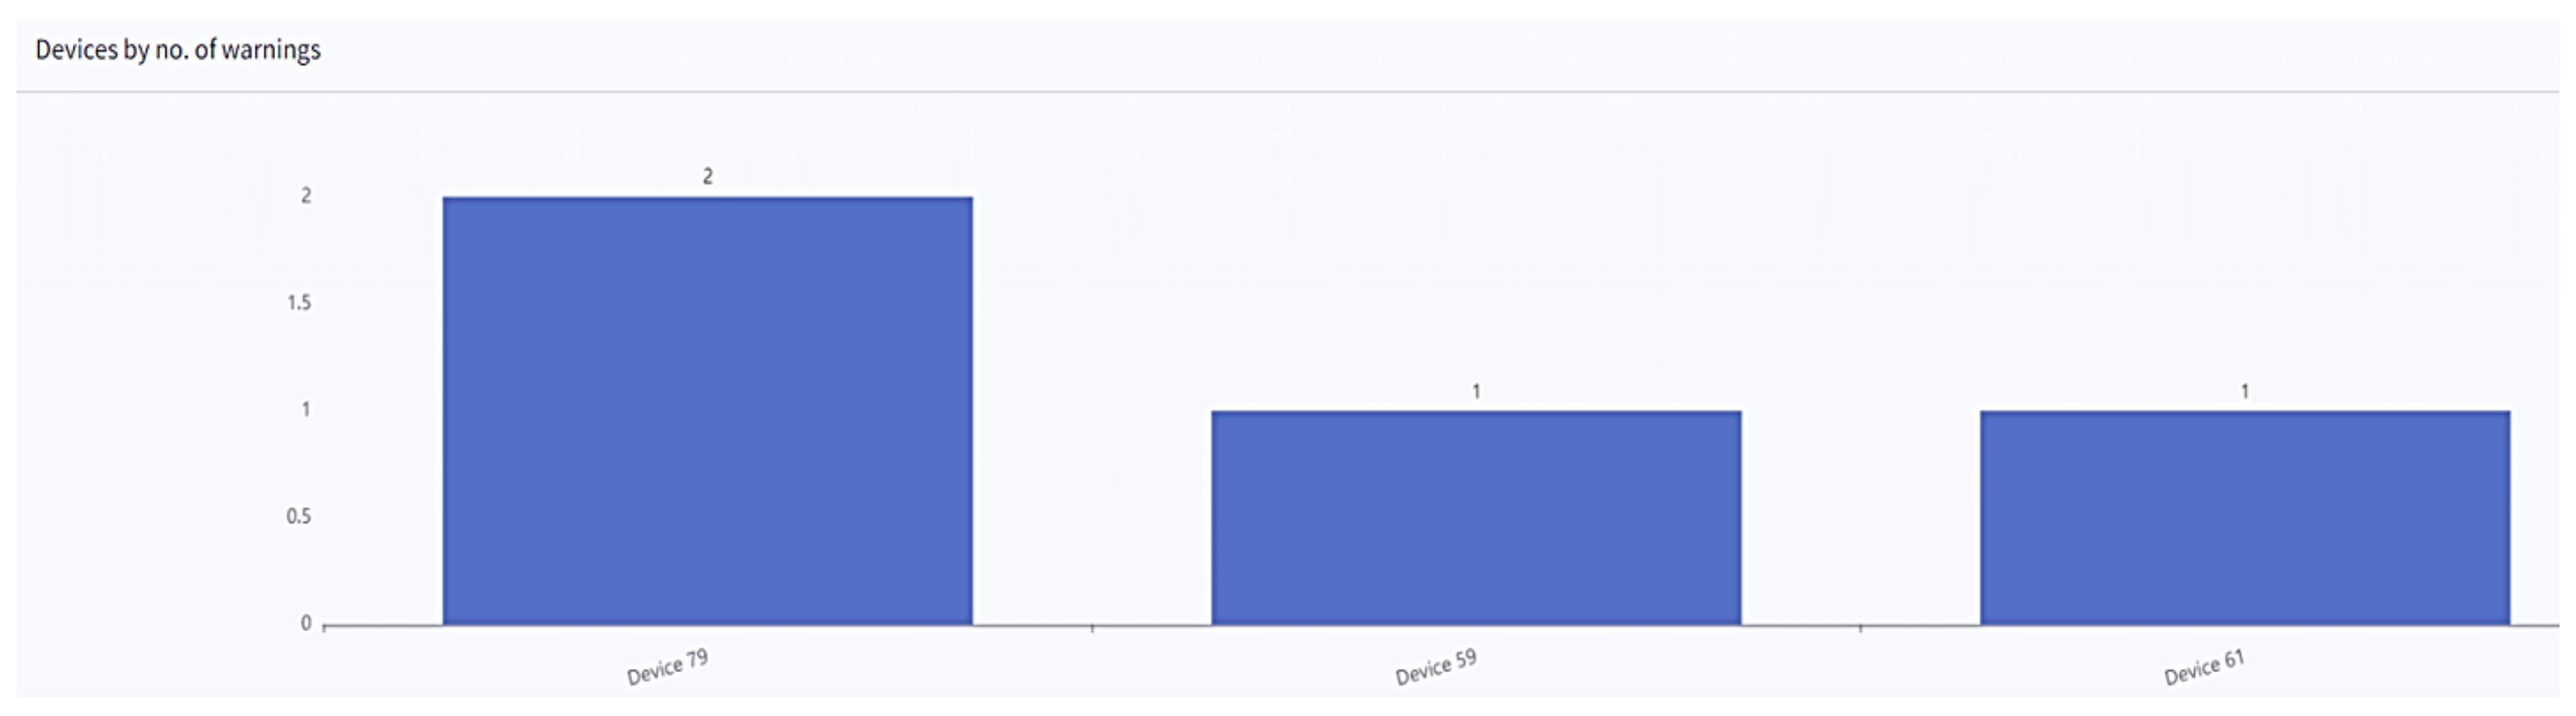
Finally, the recommendation algorithm is used to generate the device warnings. Future alerts are generated based on the trained algorithm and predicted data. Devices by number of alerts is a bar chart with multiple alerts for each device to identify potential outliers and problems. The bar chart can be seen in Figure 13. In this example, we have four devices with one warning.
5.9. Step 8: User Feedback
The application was tested with four potential users: SMEs in the manufacturing sector. The respondents were in the positions of Chief Technology Officer and Chief Information Officer or involved in monitoring air conditioning and heating systems.
The positive comments highlighted that using open-source predictive maintenance software, such as R, can be beneficial to SMEs, including cost savings, greater accuracy, community support, and the ability to customize the program. The following positive comments were made:
- “… looking for a cost-effective and efficient solution, and R was able to deliver just that … helped us save a significant amount of money compared to proprietary alternatives.”
- “…… a wide range of statistical and machine learning methods, we are now able to make more accurate predictions about equipment failure and significantly reduce downtime ……”
- “…The open-source community, of which R is a part, is an extremely useful resource...”
- “… the integration of the predictive maintenance solution into our existing infrastructure, which allows us to make it a seamless part of our business processes ……”
Negative comments referred to the following issues users may encounter when using open-source software such as R:
- “… People who have no experience in programming or statistics may find the learning curve to be quite high...”
- “… is constantly evolving and changing, which can be both beneficial and annoying… the solution became more difficult to maintain and keep up to date ……”
In summary, SMEs overwhelmingly expressed comments and concerns about the use of open-source R in their infrastructure development and day-to-day operations. These conclusions are consistent with the findings of McCredie et al. [73], who emphasized that flexible support, licensing cost savings, community support, and functionality are the positive drivers and complexity is the negative driver for SME adoption of open source software within the theory-based framework.
6. Open-Source Predictive Maintenance Playbook for SMEs
We suggest that emerging SMBs adopt open-source predictive maintenance solutions using the following steps:
- Define the problem—Determine which devices or systems need predictive maintenance and clearly define the maintenance goals.
- Data collection—Identify the necessary data sources for the system and set up a data collection infrastructure to collect real-time data.
- Data pre-processing—Remove outliers, missing numbers, and discrepancies from the data and normalize or scale the data to ensure consistency and comparability between features. Develop new features.
- Flagging and anomaly detection—Define criteria for flagging errors and maintenance events. Label historical data to indicate normal operation or specific failure scenarios. Identify aberrant data points.
- Model selection—Evaluate different machine learning algorithms suitable for predictive maintenance, considering tradeoffs between accuracy, interpretability, scalability, and real-time capabilities.
- Model Training—Split the labeled dataset into two parts: Training and Validation. Train the selected machine learning model on the labeled data, modifying hyperparameters and the model architecture as necessary.
- Model evaluation—Select metrics to evaluate the model, such as F1 score, accuracy, precision, recall, or similar, and evaluate the model.
- Integration and deployment—Integrate the trained model into the Industry 4.0 ecosystem by creating an inference API to obtain real-time predictions.
- Monitoring and maintenance—Continuously monitor the performance of the predictive maintenance system, including data quality, model accuracy, and false positive/negative rates. Retrain models as needed using updated data.
- Continuous Improvement—Analyze feedback from the installed predictive maintenance system, including maintenance activities performed and their consequences. Incorporate findings into future iterations of the system to increase accuracy, efficiency, and effectiveness.
7. Conclusions
The paper demonstrates the DSS we developed and the results of a predictive maintenance case study using a simulated IoT climate dataset. The DSS allows users to make these predictions without advanced knowledge of the underlying machine learning algorithms via its easy-to-use graphical user interface. The paper discusses technologies relevant to the horizontal approach to predictive maintenance. The authors consider the application of the methodology used in this research relevant, especially for SMEs. We have presented the use of the DSS step by step so that it is relevant to other industrial applications due to the benefits of an appropriate predictive maintenance strategy.
This work has important implications for business management, particularly in relation to the adoption of predictive maintenance using the open-source software R in SMEs, which provides advanced features that can be used for predictive maintenance in the context of Industry 4.0. Users concluded that R has an intuitive user interface and is easily customizable, allowing the predictive maintenance solution to be tailored to their individual needs. In addition, SMEs can further streamline their operations by integrating the application with their existing systems and tools, such as their enterprise resource planning (ERP) system. Negative impacts of open-source software, such as a lack of support, should also be considered and remedial actions planned.
The study presented here has some limitations because the hypothetical case was developed to test the DSS prototype and used a limited number of machine algorithms and a use case based on only one measurement device. These limitations call for future research directions. First, real datasets should be collected from multiple facilities in the field so that multiple algorithms can be tested. Such real-world cases would also allow further testing of the theoretically-based framework for explaining the adoption of open-source software. Second, future research should apply multiple machine learning algorithms to real-world datasets to recommend which algorithms would be best suited for predictive maintenance. Carvalho et al. [74] suggest the following algorithms as best suited for predictive maintenance: Random Forest [75], Artificial Neural Networks [63,64,74,76,77,78], Support Vector Machines [79,80], and k-means [81], as well as others such as Decision Trees [82].
Therefore, in future efforts to test DSS for predictive maintenance, these algorithms should be tested with both simulated and real datasets and then compared to the approach proposed by Nardo [83,84] for their effectiveness. Third, since the use case was developed only for the measurement devices, future use cases should focus on the upstream functions relevant to Industry 4.0, as indicated by Irsa et al. [85], e.g., self-optimizing processes, productivity improvements, the development of novel services, and additive manufacturing.
Author Contributions
Conceptualization, M.P.B. and A.T.; methodology, M.P.B. and Ž.K.; software, Ž.K.; validation, A.T., M.P.B. and Ž.K.; formal analysis, A.T.; investigation, Ž.K.; resources, A.T. and A.I.; data curation, Ž.K. and A.I.; writing—original draft preparation, A.I., Ž.K., and M.P.B.; writing—review and editing, A.I. and M.P.B.; visualization, A.I. and Ž.K.; supervision, A.T.; project administration, A.T. All authors have read and agreed to the published version of the manuscript.
Funding
This research received no external funding.
Conflicts of Interest
The authors declare no conflict of interest.
References
- Shyjith, K.; Ilangkumaran, M.; Kumanan, S. Multi-criteria decision-making approach to evaluate optimum maintenance strategy in textile industry. J. Qual. Maint. Eng. 2008, 14, 375–386. [Google Scholar] [CrossRef]
- Jerman, A.; Bertoncelj, A.; Erenda, I. The influence of critical factors on business model at a smart factory: A case study. Bus. Syst. Res. Int. J. Soc. Adv. Innov. Res. Econ. 2019, 10, 42–52. [Google Scholar]
- Mobley, R.K. An Introduction to Predictive Maintenance; Elsevier: Amsterdam, The Netherlands, 2002. [Google Scholar]
- Roblek, V.; Thorpe, O.; Bach, M.P.; Jerman, A.; Meško, M. The fourth industrial revolution and the sustainability practices: A comparative automated content analysis approach of theory and practice. Sustainability 2020, 12, 8497. [Google Scholar] [CrossRef]
- Moore, W.; Starr, A. An intelligent maintenance system for continuous cost-based prioritisation of maintenance activities. Comput. Ind. 2006, 57, 595–606. [Google Scholar] [CrossRef] [Green Version]
- Selcuk, S. Predictive maintenance, its implementation and latest trends. Proc. Inst. Mech. Eng. Pt. B J. Eng. Manuf. 2017, 231, 1670–1679. [Google Scholar] [CrossRef]
- Christiansen, B. A Complete Guide to Predictive Maintenance. Limble CMMS. Available online: https://limblecmms.com/predictive-maintenance/ (accessed on 21 March 2023).
- Nunes, P.; Santos, J.; Rocha, E. Challenges in predictive maintenance—A review. CIRP J. Manuf. Sci. Technol. 2023, 40, 53–67. [Google Scholar] [CrossRef]
- Ahmad, R.; Kamaruddin, S. An overview of time-based and condition-based maintenance in industrial application. Comput. Ind. Eng. 2012, 63, 135–149. [Google Scholar] [CrossRef]
- Market Research Future. Global Predictive Maintenance (PdM) Market Research Report. 2020. Available online: https://www.marketresearchfuture.com/reports/predictive-maintenance-market-2377 (accessed on 21 March 2023).
- Turgis, F.; Auder, P.; Coutadeur, Q.; Verdun, C. Industrialization of condition based maintenance for complex systems in a complex maintenance environment, example of NAT. In Proceedings of the 12th World Congress on Railway Research, Tokyo, Japan, 28 October 2019. [Google Scholar]
- Chen, D.; Trivedi, K.S. Closed-form analytical results for condition-based maintenance. Reliab. Eng. Syst. Saf. 2002, 76, 43–51. [Google Scholar] [CrossRef]
- Parpala, R.C.; Iacob, R. Application of IoT concept on predictive maintenance of industrial equipment. In Proceedings of the MATEC Web of Conferences, Bucharest, Rumania, 9 August 2017; p. 02008. [Google Scholar]
- Jardine, A.K.; Lin, D.; Banjevic, D. A review on machinery diagnostics and prognostics implementing condition-based maintenance. Mech. Syst. Signal Process. 2006, 20, 1483–1510. [Google Scholar] [CrossRef]
- Chuang, S.-Y.; Sahoo, N.; Lin, H.-W.; Chang, Y.-H. Predictive maintenance with sensor data analytics on a Raspberry Pi-based experimental platform. Sensors 2019, 19, 3884. [Google Scholar] [CrossRef] [Green Version]
- Pech, M.; Vrchota, J.; Bednář, J. Predictive maintenance and intelligent sensors in smart factory. Sensors 2021, 21, 1470. [Google Scholar] [CrossRef]
- Kanawaday, A.; Sane, A. Machine learning for predictive maintenance of industrial machines using IoT sensor data. In Proceedings of the 2017 8th IEEE international conference on software engineering and service science (ICSESS), Beijing, China, 24–26 November 2017; pp. 87–90. [Google Scholar]
- Christiansen, B. Complete List of Condition Monitoring Techniques. Machinery and Equipment MRO. Available online: https://www.mromagazine.com/features/complete-list-of-condition-monitoring-techniques (accessed on 21 March 2023).
- Davies, A. Handbook of Condition Monitoring: Techniques and Methodology; Springer Science & Business Media: Berlin/Heidelberg, Germany, 2012. [Google Scholar]
- Hodge, V.J.; O’Keefe, S.; Weeks, M.; Moulds, A. Wireless sensor networks for condition monitoring in the railway industry: A survey. IEEE Trans. Intell. Transp. Syst. 2014, 16, 1088–1106. [Google Scholar] [CrossRef]
- Mukhopadhyay, S.C.; Suryadevara, N.K. Internet of things: Challenges and Opportunities; Springer: Berlin/Heidelberg, Germany, 2014; pp. 2347–4718. [Google Scholar]
- Khalil, N.; Abid, M.R.; Benhaddou, D.; Gerndt, M. Wireless sensors networks for Internet of Things. In Proceedings of the 2014 IEEE ninth international conference on Intelligent sensors, sensor networks and information processing (ISSNIP), Singapore, Singapore, 21–24 April 2014; pp. 1–6. [Google Scholar]
- Kocakulak, M.; Butun, I. An overview of Wireless Sensor Networks towards internet of things. In Proceedings of the 2017 IEEE 7th annual computing and communication workshop and conference (CCWC), Las Vegas, NV, USA, 9–11 January 2017; pp. 1–6. [Google Scholar]
- Civerchia, F.; Bocchino, S.; Salvadori, C.; Rossi, E.; Maggiani, L.; Petracca, M. Industrial Internet of Things monitoring solution for advanced predictive maintenance applications. J. Ind. Inf. Integr. 2017, 7, 4–12. [Google Scholar] [CrossRef]
- Dong, L.; Mingyue, R.; Guoying, M. Application of internet of things technology on predictive maintenance system of coal equipment. Procedia Eng. 2017, 174, 885–889. [Google Scholar] [CrossRef]
- Passlick, J.; Dreyer, S.; Olivotti, D.; Grützner, L.; Eilers, D.; Breitner, M.H. Predictive maintenance as an internet of things enabled business model: A taxonomy. Electron. Mark. 2021, 31, 67–87. [Google Scholar] [CrossRef]
- Chehri, A.; Jeon, G. The industrial internet of things: Examining how the IIoT will improve the predictive maintenance. In Proceedings of the Innovation in Medicine and Healthcare Systems, and Multimedia: Proceedings of KES-InMed-19 and KES-IIMSS-19 Conferences, Berlin/Heidelberg, Germany, 6 June 2019; pp. 517–527. [Google Scholar]
- Lade, P.; Ghosh, R.; Srinivasan, S. Manufacturing analytics and industrial internet of things. IEEE Intell. Syst. 2017, 32, 74–79. [Google Scholar] [CrossRef]
- Grambau, J.; Hitzges, A.; Otto, B. Predictive Maintenance in the Context of Service. In Proceedings of the 20th International Conference on Enterprise Information Systems (ICEIS 2018), Dortmund, Germany, 21–24 March 2018; pp. 223–230. [Google Scholar]
- Demoly, F.; Kiritsis, D. Asset optimization and predictive maintenance in discrete manufacturing industry. IFAC Proc. Vol. 2012, 45, 1–6. [Google Scholar] [CrossRef]
- Noura, M.; Atiquzzaman, M.; Gaedke, M. Interoperability in internet of things: Taxonomies and open challenges. Mob. Netw. Appl. 2019, 24, 796–809. [Google Scholar] [CrossRef] [Green Version]
- Gregersen, C. A Complete Guide to IoT Protocols & Standards in 2021. Available online: https://www.nabto.com/guide-iot-protocols-standards/ (accessed on 21 March 2023).
- Vermesan, O.; Friess, P.; Guillemin, P.; Gusmeroli, S.; Sundmaeker, H.; Bassi, A.; Jubert, I.S.; Mazura, M.; Harrison, M.; Eisenhauer, M. Internet of things strategic research roadmap. In Internet of Things-Global Technological and Societal Trends from Smart Environments and Spaces to Green ICT; River Publishers: Aalborg, Denmark, 2022; pp. 9–52. [Google Scholar]
- Ferretti, M.; Schiavone, F. Internet of Things and business processes redesign in seaports: The case of Hamburg. Bus. Process Manag. J. 2016, 22, 271–284. [Google Scholar] [CrossRef]
- Sethi, P.; Sarangi, S.R. Internet of things: Architectures, protocols, and applications. J. Electr. Comput. Eng. 2017, 2017, 9324035. [Google Scholar]
- Uppalapati, K. How IoT Protocols and Standards Support Secure Data Exchange in the IoT Ecosystem? Available online: https://www.kelltontech.com/kellton-tech-blog/internet-of-things-protocols-standards (accessed on 21 March 2023).
- Alkhalil, A.; Ramadan, R.A. IoT data provenance implementation challenges. Procedia Comput. Sci. 2017, 109, 1134–1139. [Google Scholar] [CrossRef]
- Udoh, I.S.; Kotonya, G. Developing IoT applications: Challenges and frameworks. IET Cyber-Phys. Syst. Theory Appl. 2018, 3, 65–72. [Google Scholar] [CrossRef]
- Cheruvu, S.; Kumar, A.; Smith, N.; Wheeler, D.M.; Cheruvu, S.; Kumar, A.; Smith, N.; Wheeler, D.M. IoT frameworks and complexity. Demystifying Internet of Things Security: Successful IoT Device/Edge and Platform Security Deployment; Springer: Berlin/Heidelberg, Germany, 2020; pp. 23–148. [Google Scholar]
- Gil, D.; Johnsson, M.; Mora, H.; Szymański, J. Review of the complexity of managing big data of the internet of things. Complexity 2019, 4592902. [Google Scholar] [CrossRef] [Green Version]
- Zhang, K.; Han, D.; Feng, H. Research on the complexity in Internet of Things. In Proceedings of the 2010 International Conference on Advanced Intelligence and Awarenss Internet (AIAI 2010), Beijing, China, 23–25 October 2010; pp. 395–398. [Google Scholar]
- Song, S.; Zhang, A. IoT data quality. In Proceedings of the 29th ACM International Conference on Information & Knowledge Management, Virtual Event Ireland, 19 October 2020; pp. 3517–3518. [Google Scholar]
- Ding, X.; Wang, H.; Li, G.; Li, H.; Li, Y.; Liu, Y. IoT data cleaning techniques: A survey. In Intelligent and Converged Networks 2022, 3, 325–339. [Google Scholar] [CrossRef]
- Jane, V. Survey on iot data preprocessing. Turk. J. Comput. Math. Educ. 2021, 12, 238–244. [Google Scholar]
- Chu, X.; Ilyas, I.F.; Krishnan, S.; Wang, J. Data cleaning: Overview and emerging challenges. In Proceedings of the 2016 international conference on management of data, San Francisco, CA, USA, 26 June–1 July 2016; pp. 2201–2206. [Google Scholar]
- Khare, S.; Totaro, M. Big data in IoT. In Proceedings of the 2019 10th International Conference on Computing, Communication and Networking Technologies (ICCCNT), Kanpur, India, 6–8 July 2019; pp. 1–7. [Google Scholar]
- Alharam, A.K.; Elmedany, W. Complexity of cyber security architecture for IoT healthcare industry: A comparative study. In Proceedings of the 2017 5th international conference on future internet of things and cloud workshops (FiCloudW), Prague, Czech Republic, 21–23 August 2017; pp. 246–250. [Google Scholar]
- Pappas, N.; Caputo, A.; Pellegrini, M.M.; Marzi, G.; Michopoulou, E. The complexity of decision-making processes and IoT adoption in accommodation SMEs. J. Bus. Res. 2021, 131, 573–583. [Google Scholar] [CrossRef]
- Gartner. Internet of Things: Unlocking True Digital Business Potential. Available online: https://www.gartner.com/en/information-technology/insights/internet-of-things (accessed on 21 March 2023).
- Arm. Arm Glossary. IoT devices. Available online: https://www.arm.com/glossary/iot-devices (accessed on 21 March 2023).
- Sharma, R. Top 15 Sensor Types Being Used Most by IoT Application Development Companies. Available online: https://www.finoit.com/blog/top-15-sensor-types-used-iot/ (accessed on 21 March 2023).
- Ihaka, R.; Gentleman, R. R: A language for data analysis and graphics. J. Comput. Graph. Stat. 1996, 5, 299–314. [Google Scholar]
- Wickham, H.; Averick, M.; Bryan, J.; Chang, W.; McGowan, L.D.A.; François, R.; Grolemund, G.; Hayes, A.; Henry, L.; Hester, J. Welcome to the Tidyverse. J. Open Source Softw. 2019, 4, 1686. [Google Scholar] [CrossRef] [Green Version]
- Wickham, H.; Wickham, M.H. Package Tidyverse, Easily Install and Load the ‘Tidyverse, Version 1.2.0. Available online: https://tidyverse.tidyverse.org/ (accessed on 21 March 2023).
- Chang, W.; Cheng, J.; Allaire, J.; Xie, Y.; McPherson, J. Package Shiny, Version 1.7.4.1. Available online: https://cran.r-project.org/web/packages/shiny/index.html (accessed on 21 March 2023).
- Anderson, J.W.; Kennedy, K.E.; Ngo, L.B.; Luckow, A.; Apon, A.W. Synthetic data generation for the internet of things. In Proceedings of the 2014 IEEE International Conference on Big Data (Big Data), Washington, DC, USA, 27–30 October 2014; pp. 171–176. [Google Scholar]
- Kannan, S. Synthetic time series data generation for edge analytics. F1000Research 2022, 11, 67. [Google Scholar] [CrossRef]
- Bolón-Canedo, V.; Sánchez-Maroño, N.; Alonso-Betanzos, A. A review of feature selection methods on synthetic data. Knowl. Inf. Syst. 2013, 34, 483–519. [Google Scholar] [CrossRef]
- Camacho, V.T. Synthetic dataset generation methodology for Recommender Systems using statistical sampling methods, a Multinomial Logit model, and a Fuzzy Inference System. arXiv 2022, arXiv:14350.2212. [Google Scholar]
- Panagiotakis, C.; Papadakis, H.; Fragopoulou, P. Unsupervised and supervised methods for the detection of hurriedly created profiles in recommender systems. Int. J. Mach. Learn. Cybern. 2020, 11, 2165–2179. [Google Scholar] [CrossRef]
- La Russa, F.M.; Santagati, C. An AI-based DSS for preventive conservation of museum collections in historic buildings. J. Archaeol. Sci. Rep. 2021, 35, 102735. [Google Scholar] [CrossRef]
- Li, D.-C.; Lin, L.-S.; Peng, L.-J. Improving learning accuracy by using synthetic samples for small datasets with non-linear attribute dependency. Decis. Support Syst. 2014, 59, 286–295. [Google Scholar] [CrossRef]
- Agarwal, P.; Gao, B.; Huo, S.; Reddy, P.; Dechu, S.; Obeidi, Y.; Muthusamy, V.; Isahagian, V.; Carbajales, S. A Process-Aware Decision Support System for Business Processes. In Proceedings of the 28th ACM SIGKDD Conference on Knowledge Discovery and Data Mining, Washington, DC, USA, 14 August 2022; pp. 2673–2681. [Google Scholar]
- Jabbari, M.; Sheikh, S.; Rabiee, M.; Oztekin, A. A collaborative decision support system for multi-criteria automatic clustering. Decis. Support Syst. 2022, 153, 113671. [Google Scholar] [CrossRef]
- Piri, S.; Delen, D.; Liu, T. A synthetic informative minority over-sampling (SIMO) algorithm leveraging support vector machine to enhance learning from imbalanced datasets. Decis. Support Syst. 2018, 106, 15–29. [Google Scholar] [CrossRef]
- Forootan, M.M.; Larki, I.; Zahedi, R.; Ahmadi, A. Machine learning and deep learning in energy systems: A review. Sustainability 2022, 14, 4832. [Google Scholar] [CrossRef]
- Jha, B.K.; Pande, S. Time series forecasting model for supermarket sales using FB-prophet. In Proceedings of the 2021 5th International Conference on Computing Methodologies and Communication (ICCMC), Erode, India, 8–10 April 2021; pp. 547–554. [Google Scholar]
- Saiktishna, C.; Sumanth, N.S.V.; Rao, M.M.S.; Thangakumar, J. Historical Analysis and Time Series Forecasting of Stock Market using FB Prophet. In Proceedings of the 2022 6th International Conference on Intelligent Computing and Control Systems (ICICCS), Madurai, India, 25–27 May 2022; pp. 1846–1851. [Google Scholar]
- Schafer, J.B.; Frankowski, D.; Herlocker, J.; Sen, S. Collaborative filtering recommender systems. In The Adaptive Web: Methods and Strategies of Web Personalization; Springer: Berlin/Heidelberg, Germany, 2007; pp. 291–324. [Google Scholar]
- Deshpande, M.; Karypis, G. Item-based top-n recommendation algorithms. ACM Trans. Inf. Syst. 2004, 22, 143–177. [Google Scholar] [CrossRef]
- Gong, F.; Han, N.; Li, D.; Tian, S. Trend analysis of building power consumption based on prophet algorithm. In Proceedings of the 2020 Asia Energy and Electrical Engineering Symposium (AEEES), Chengdu, China, 29–31 May 2020; pp. 1002–1006. [Google Scholar]
- Pearl, J. The limitations of opaque learning machines. Possible Minds 2019, 25, 13–19. [Google Scholar]
- D Macredie, R.; Mijinyawa, K. A theory-grounded framework of Open Source Software adoption in SMEs. Eur. J. Inf. Syst. 2011, 20, 237–250. [Google Scholar] [CrossRef]
- Carvalho, T.P.; Soares, F.A.; Vita, R.; Francisco, R.d.P.; Basto, J.P.; Alcalá, S.G. A systematic literature review of machine learning methods applied to predictive maintenance. Comput. Ind. Eng. 2019, 137, 106024. [Google Scholar] [CrossRef]
- Paolanti, M.; Romeo, L.; Felicetti, A.; Mancini, A.; Frontoni, E.; Loncarski, J. Machine Learning approach for Predictive Maintenance in Industry 4.0. In Proceedings of the 2018 14th IEEE/ASME International Conference on Mechatronic and Embedded Systems and Applications (MESA), Oulu, Finland, 2–4 July 2018; pp. 1–6. [Google Scholar]
- Wu, S.-j.; Gebraeel, N.; Lawley, M.A.; Yih, Y. A neural network integrated decision support system for condition-based optimal predictive maintenance policy. IEEE Trans. Syst. Man Cybern. -Part A Syst. Hum. 2007, 37, 226–236. [Google Scholar] [CrossRef]
- Kellner, D.; Lowin, M.; von Zahn, M.; Chen, J. Towards designing a user-centric decision support system for predictive maintenance in SMEs. INFORMATIK 2021 2021, 1255–1260. [Google Scholar] [CrossRef]
- Carnero, M.C. Selection of diagnostic techniques and instrumentation in a predictive maintenance program. A case study. Decis. Support Syst. 2005, 38, 539–555. [Google Scholar] [CrossRef]
- Susto, G.A.; Schirru, A.; Pampuri, S.; Pagano, D.; McLoone, S.; Beghi, A. A predictive maintenance system for integral type faults based on support vector machines: An application to ion implantation. In Proceedings of the 2013 IEEE International Conference on Automation Science and Engineering (CASE), Madison, WI, USA, 17–20 August 2013; pp. 195–200. [Google Scholar]
- Chaudhuri, A. Predictive maintenance for industrial iot of vehicle fleets using hierarchical modified fuzzy support vector machine. arXiv 2018, arXiv:1806.09612. [Google Scholar]
- Yoo, J.-H.; Park, Y.-K.; Han, S.-S. Predictive maintenance system for wafer transport robot using k-means algorithm and neural network model. Electronics 2022, 11, 1324. [Google Scholar] [CrossRef]
- Arena, S.; Florian, E.; Zennaro, I.; Orrù, P.F.; Sgarbossa, F. A novel decision support system for managing predictive maintenance strategies based on machine learning approaches. Saf. Sci. 2022, 146, 105529. [Google Scholar] [CrossRef]
- Di Nardo, M.; Murino, T.; Osteria, G.; Santillo, L.C. A New Hybrid Dynamic FMECA with Decision-Making Methodology: A Case Study in An Agri-Food Company. Appl. Syst. Innov. 2022, 5, 45. [Google Scholar] [CrossRef]
- Nardo, M.; Converso, G.; Castagna, F.; Murino, T. Development and implementation of an algorithm for preventive machine maintenance. Eng. Solid Mech. 2021, 9, 347–362. [Google Scholar] [CrossRef]
- Irsa, W.; Dalaqmeh, N. Impact of Additive Manufacturing on the Strategic Alignment of Business Processes in the Logistics Industry in Europe. ENTRENOVA-ENTerprise REsearch InNOVAtion 2022, 8, 188–199. [Google Scholar]
Figure 1.
The process of applying predictive algorithms.

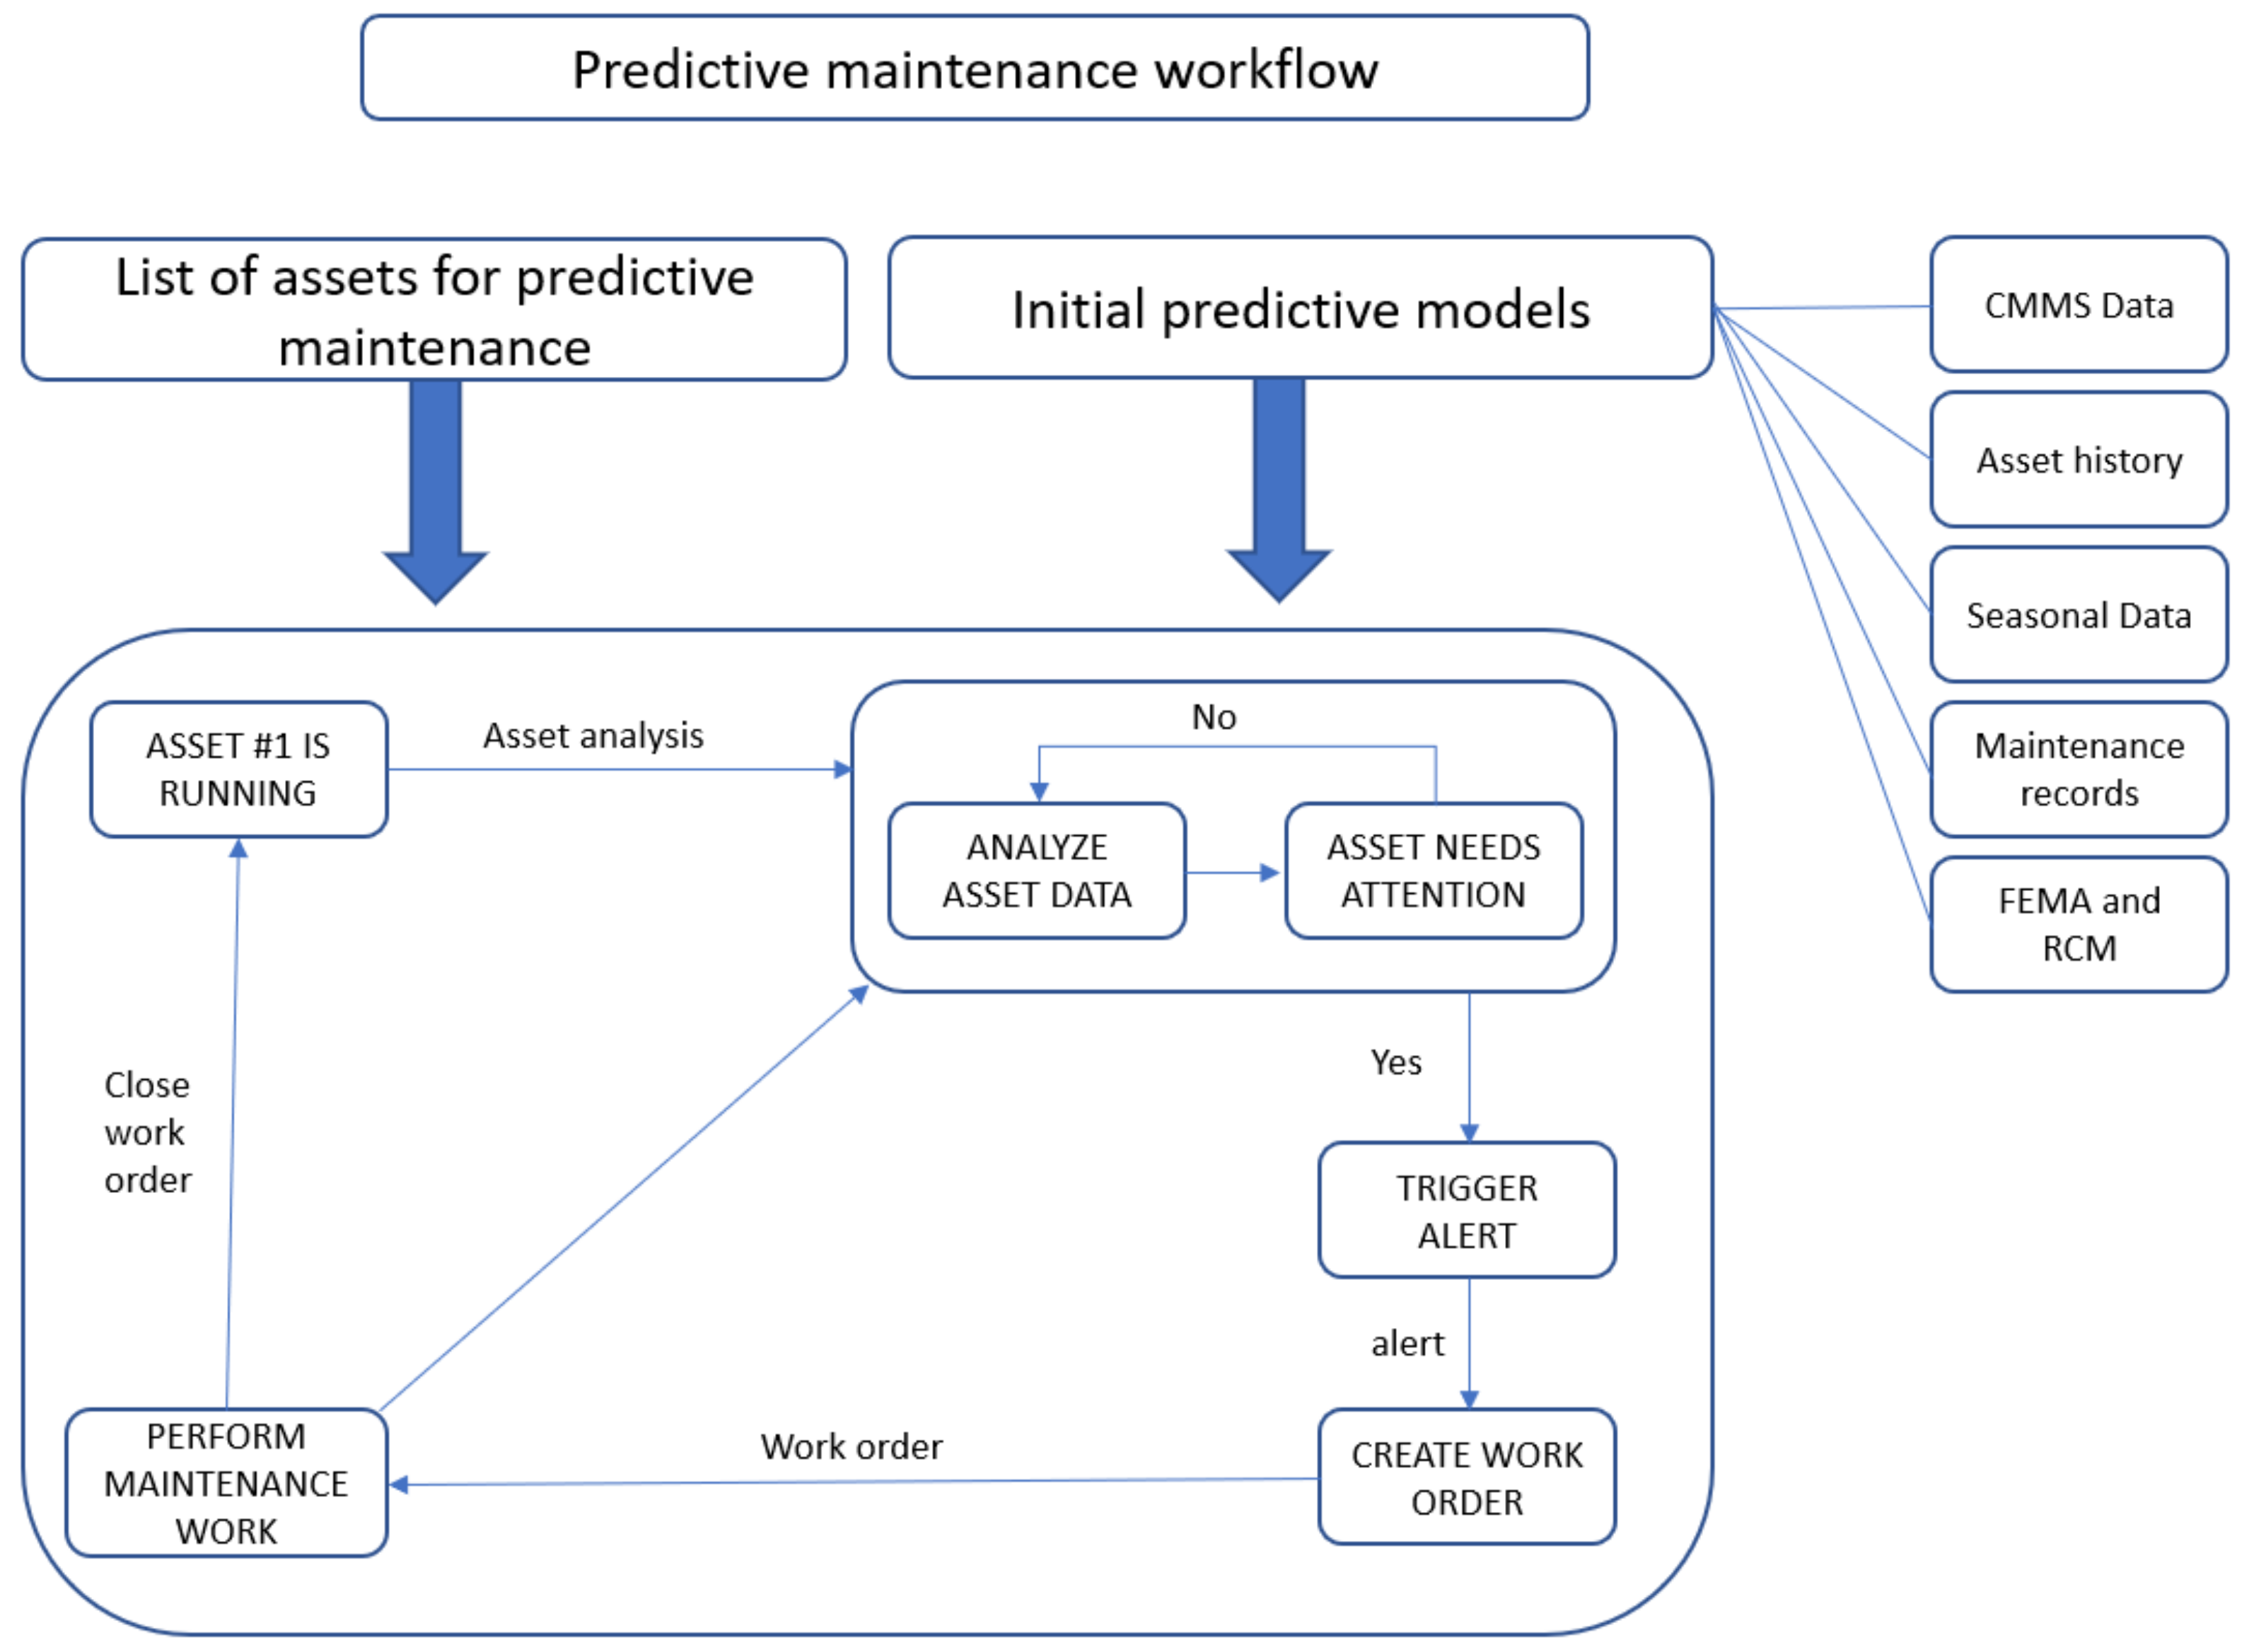
Figure 2.
Predictive maintenance workflow.

Figure 3.
The IoT concept.

Figure 4.
The IoT taxonomy and its different perspectives.

Figure 5.
DSS architecture; Source: Authors’ work.

Figure 6.
Application Overview opened on the Real-time tab.

Figure 7.
Real-time energy consumption of the devices for the selected location.

Figure 8.
Temperature categories by share of daily occurrences.

Figure 9.
Key performance indicators data.

Figure 10.
Devices by cost and age; UI is in eye-saving night mode.

Figure 11.
Energy consumption by region.

Figure 12.
Forecast for 100 days for the selected metric (Energy).

Figure 13.
Devices by number of warnings. The y-axis shows the number of warnings, and the x-axis is the device’s name.
Figure 13.
Devices by number of warnings. The y-axis shows the number of warnings, and the x-axis is the device’s name.


Table 1.
Industrial average savings. Adapted from [6].
Table 1.
Industrial average savings. Adapted from [6].
| Savings Area | Savings |
|---|---|
| Return on investment (ROI) | 10 times |
| Reduction in maintenance costs | 25–30% |
| Elimination of breakdowns | 70–75% |
| Reduction in downtime | 35–45% |
| Increase in production | 20–25% |
Table 2.
Variables—Formats and Modality.
| Variable | Description of the Variable | Format | Modality of (Nominal) Variables |
|---|---|---|---|
| Location | Location of the device | Numeric | |
| Device | Device number id | Numeric | |
| Energy | Energy consumption of the device | Numeric | |
| Temperature | The temperature of the device | Numeric | |
| Humidity | The humidity of the device | Numeric | |
| Region | Region of the device | Nominal | South, Central, West, East |
| Age | Device age | Numeric | |
| Cost | The average cost of maintenance for the device | Numeric | Home Office, Corporate, Consumer… |
| Warnings | Detected warnings on the device | Numeric |
Table 3.
Training data.
| no | ds | Energy | Temperature | Humidity | Warnings |
|---|---|---|---|---|---|
| <int> | <date> | <int> | <int> | <int> | <dbl> |
| 1 | 11 February 2022 | 32.5 | 13 | 67.6 | 0 |
| 2 | 12 February 2022 | 16.9 | 10.4 | 70.2 | 0 |
| 3 | 13 February 2022 | 14.3 | 7.8 | 78 | 0 |
| 4 | 14 February 2022 | 13 | 7.8 | 67.6 | 0 |
| 5 | 15 February 2022 | 24.7 | 5.2 | 76.7 | 0 |
| 6 | 16 February 2022 | 32.5 | 13 | 58.5 | 0 |
| 7 | 17 February 2022 | 36.4 | 7.8 | 67.6 | 1 |
| 8 | 18 February 2022 | 16.9 | 2.6 | 59.8 | 0 |
| 9 | 19 February 2022 | 36.4 | 6.5 | 63.7 | 0 |
| 10 | 20 February 2022 | 26 | 6.5 | 65 | 0 |
Note: Data types are presented in the second row of the table.
Disclaimer/Publisher’s Note: The statements, opinions and data contained in all publications are solely those of the individual author(s) and contributor(s) and not of MDPI and/or the editor(s). MDPI and/or the editor(s) disclaim responsibility for any injury to people or property resulting from any ideas, methods, instructions or products referred to in the content. |
© 2023 by the authors. Licensee MDPI, Basel, Switzerland. This article is an open access article distributed under the terms and conditions of the Creative Commons Attribution (CC BY) license (https://creativecommons.org/licenses/by/4.0/).
Share and Cite
MDPI and ACS Style
Pejić Bach, M.; Topalović, A.; Krstić, Ž.; Ivec, A. Predictive Maintenance in Industry 4.0 for the SMEs: A Decision Support System Case Study Using Open-Source Software. Designs 2023, 7, 98. https://doi.org/10.3390/designs7040098
AMA Style
Pejić Bach M, Topalović A, Krstić Ž, Ivec A. Predictive Maintenance in Industry 4.0 for the SMEs: A Decision Support System Case Study Using Open-Source Software. Designs. 2023; 7(4):98. https://doi.org/10.3390/designs7040098
Chicago/Turabian StylePejić Bach, Mirjana, Amir Topalović, Živko Krstić, and Arian Ivec. 2023. "Predictive Maintenance in Industry 4.0 for the SMEs: A Decision Support System Case Study Using Open-Source Software" Designs 7, no. 4: 98. https://doi.org/10.3390/designs7040098