
Design Improvement Using Topology Optimization for the Structural Frame Design of a 40 Ft LNG ISO Container Tank
 ,
,
Abstract
:1. Introduction
2. Materials and Methods
2.1. Topology Optimization Framework
2.2. ISO Tank Design Requirement
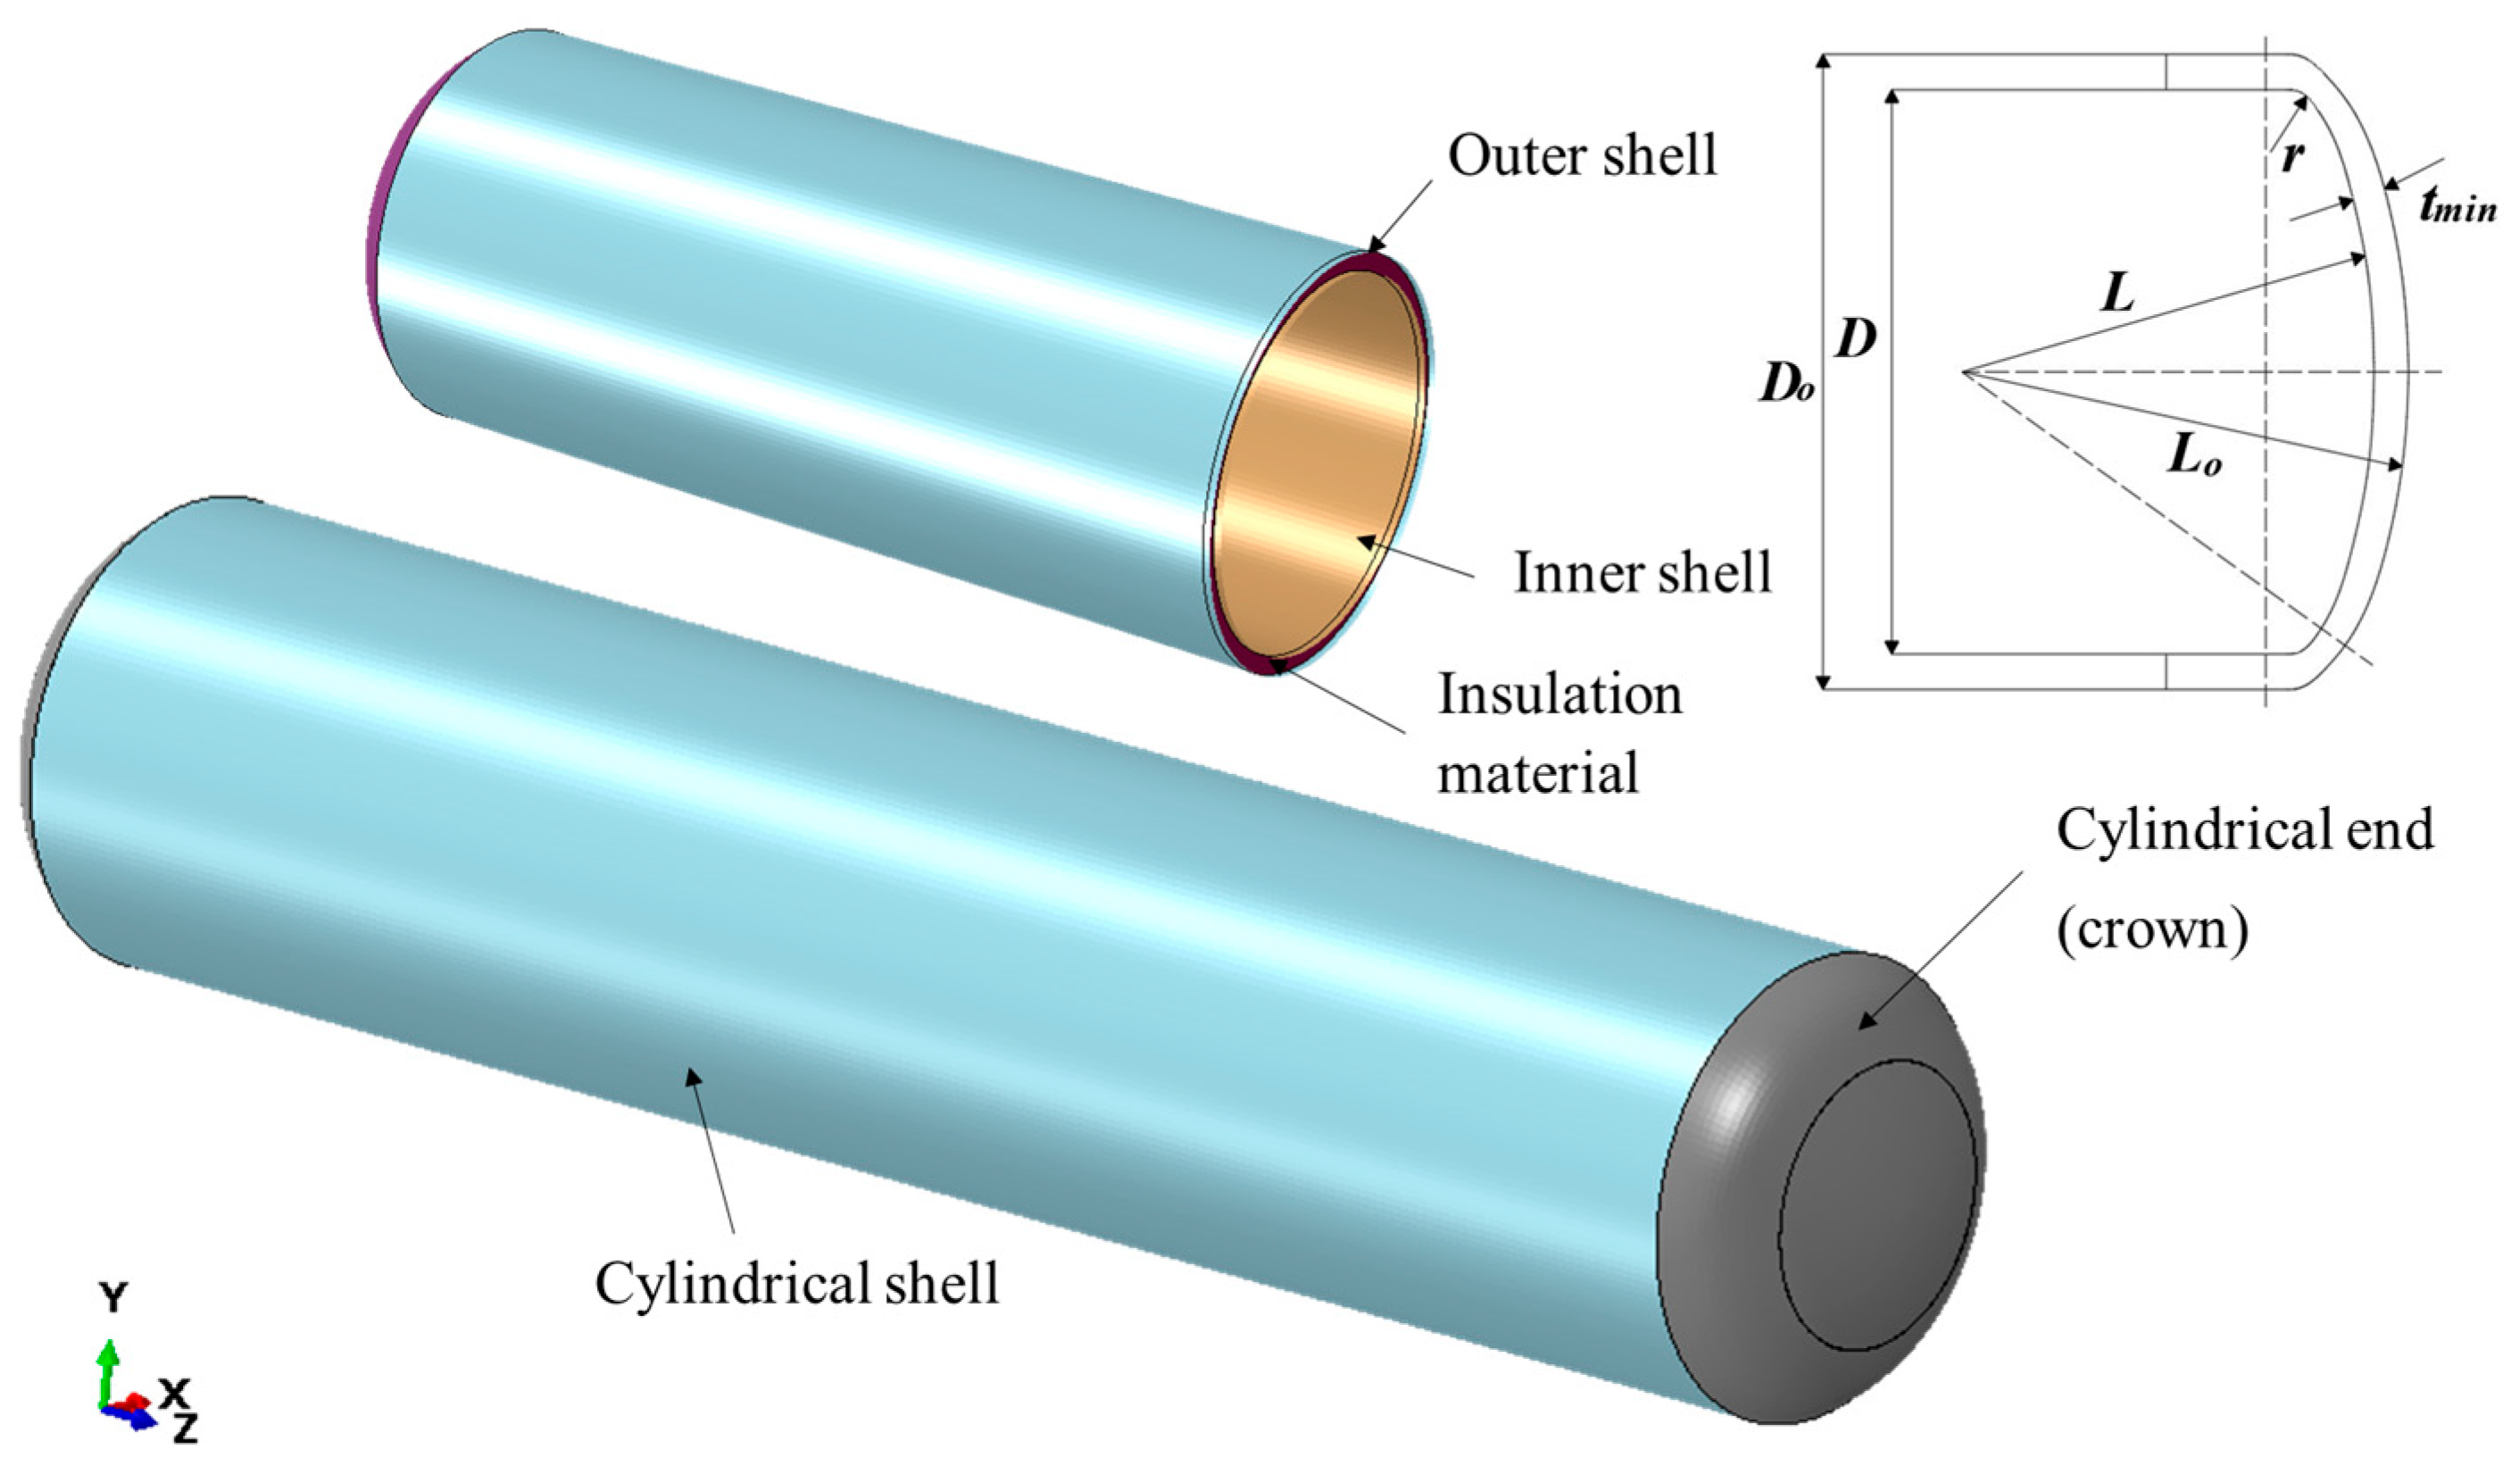
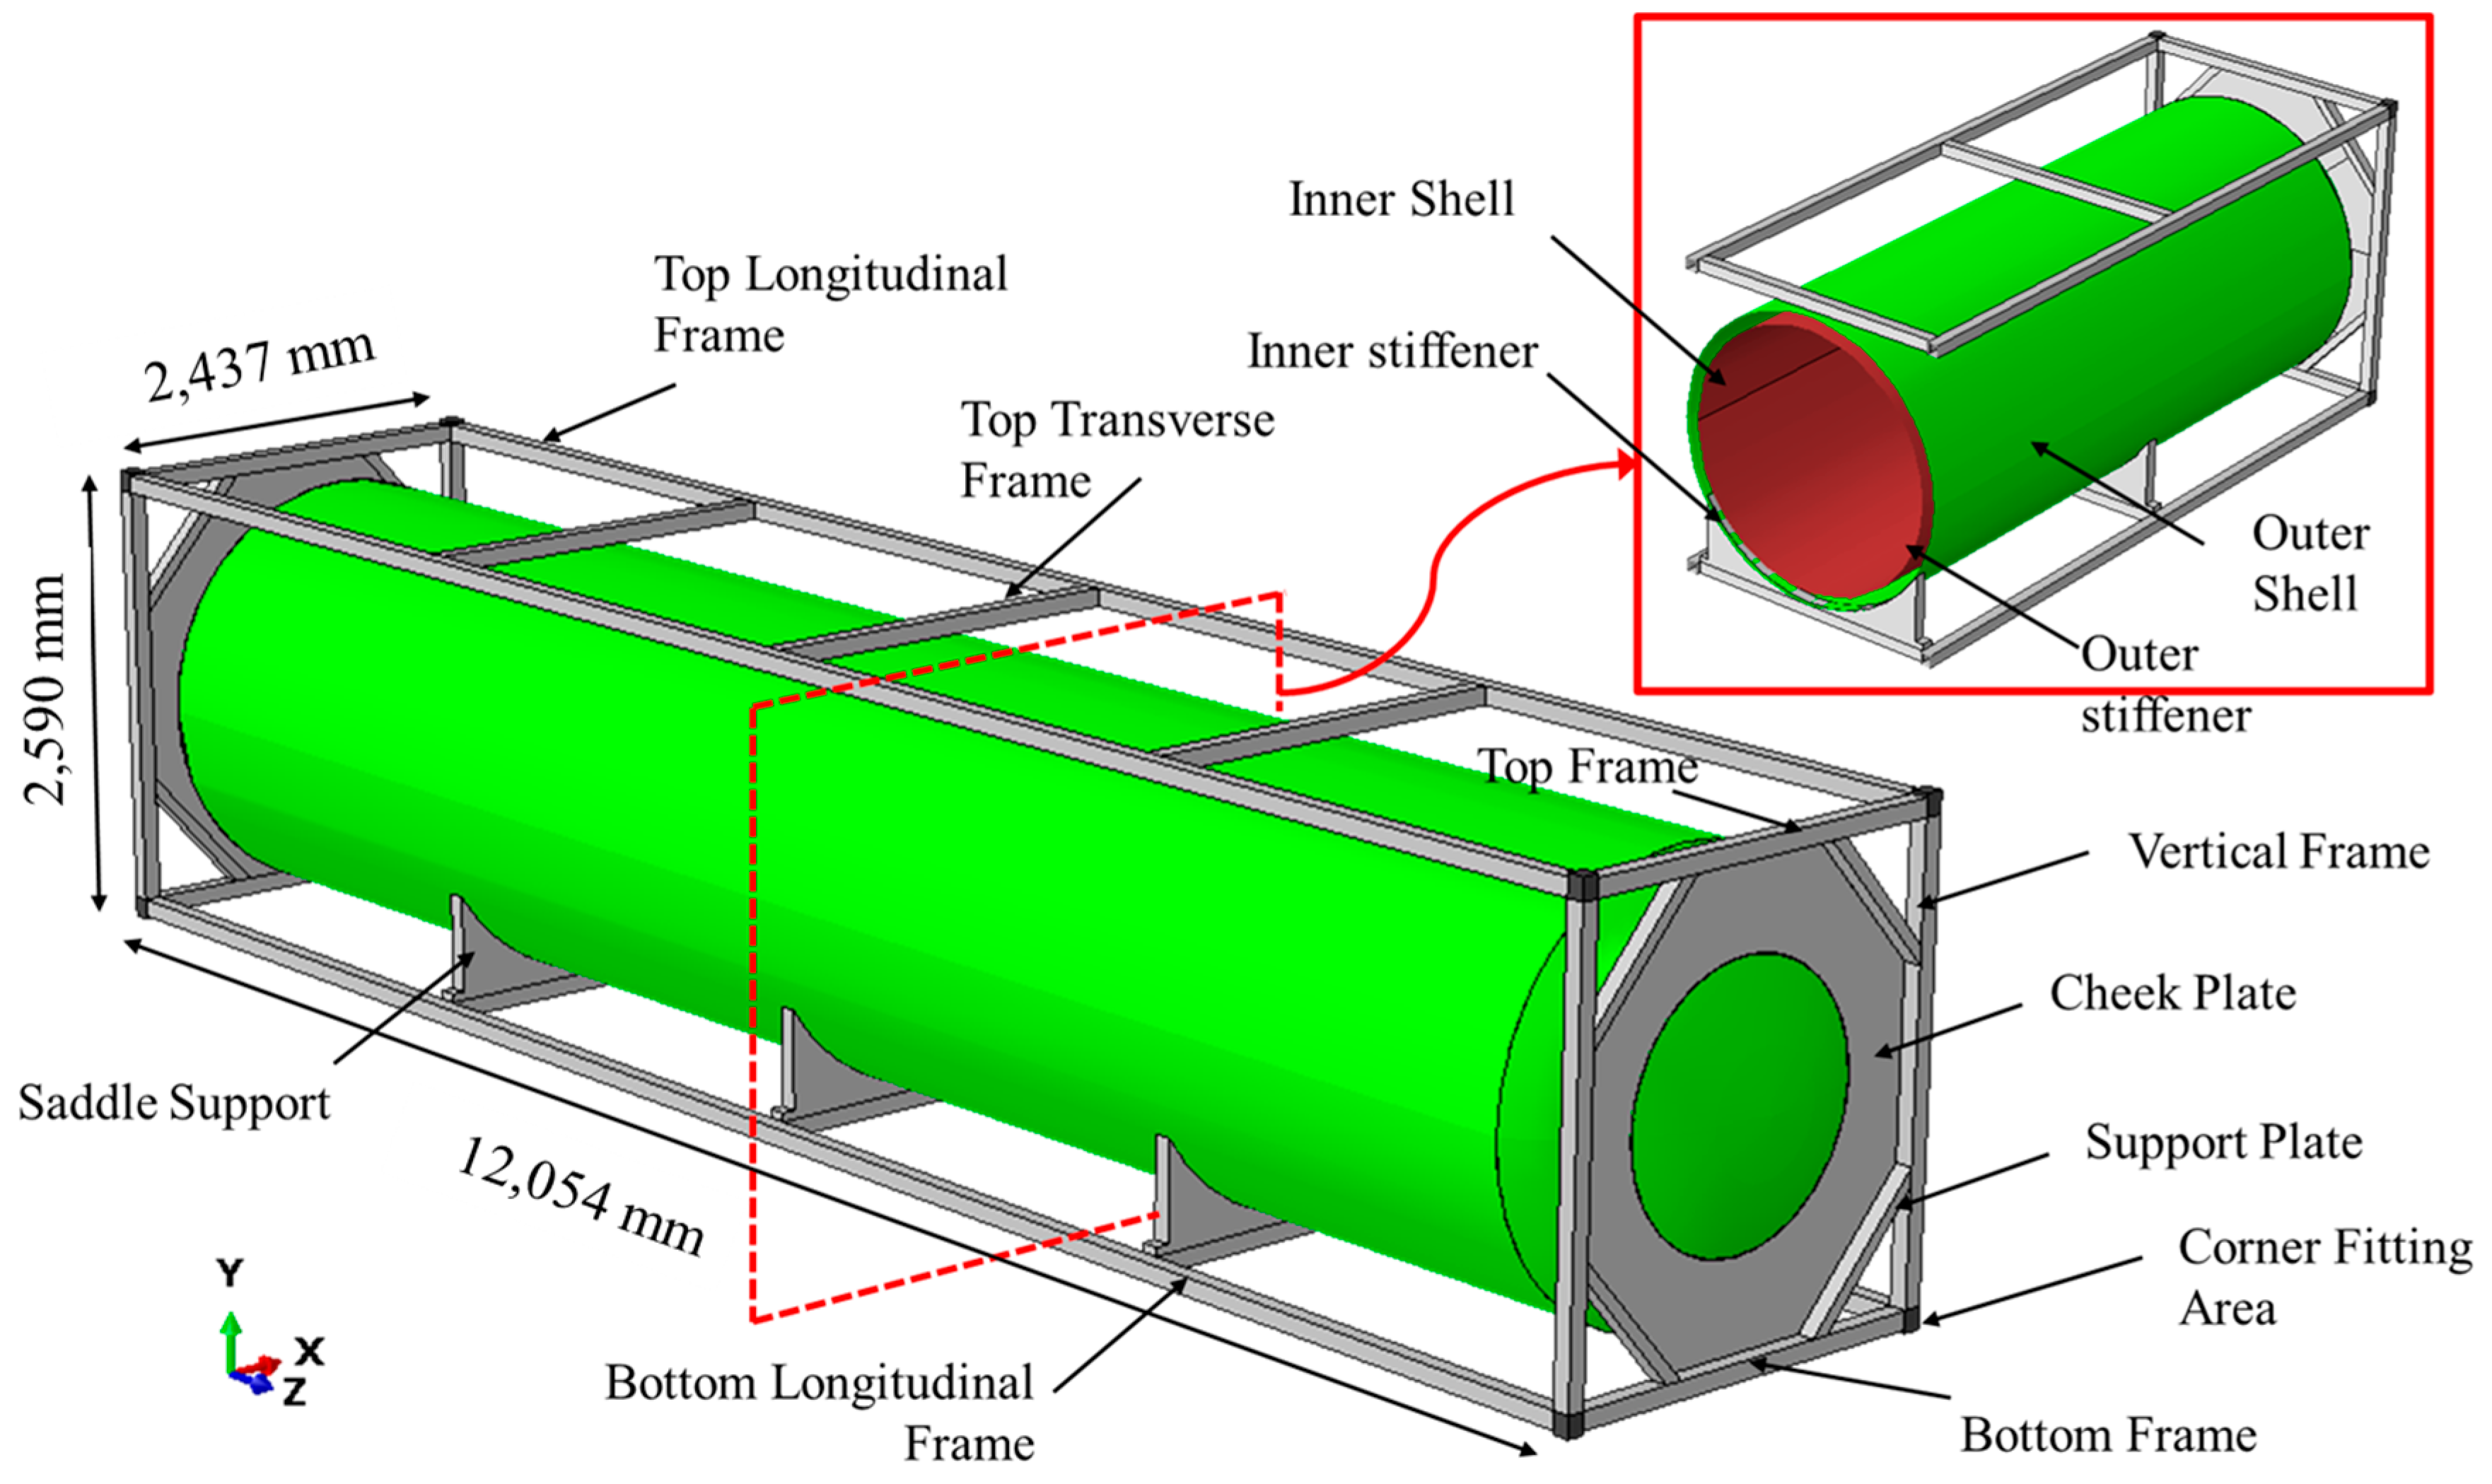
2.2.1. Design Parameter of ISO Tank
2.2.2. ISO Tank Loading Parameter
2.3. Finite Element Analysis (FEA) Setup
2.3.1. Computational Domain and Material Selection
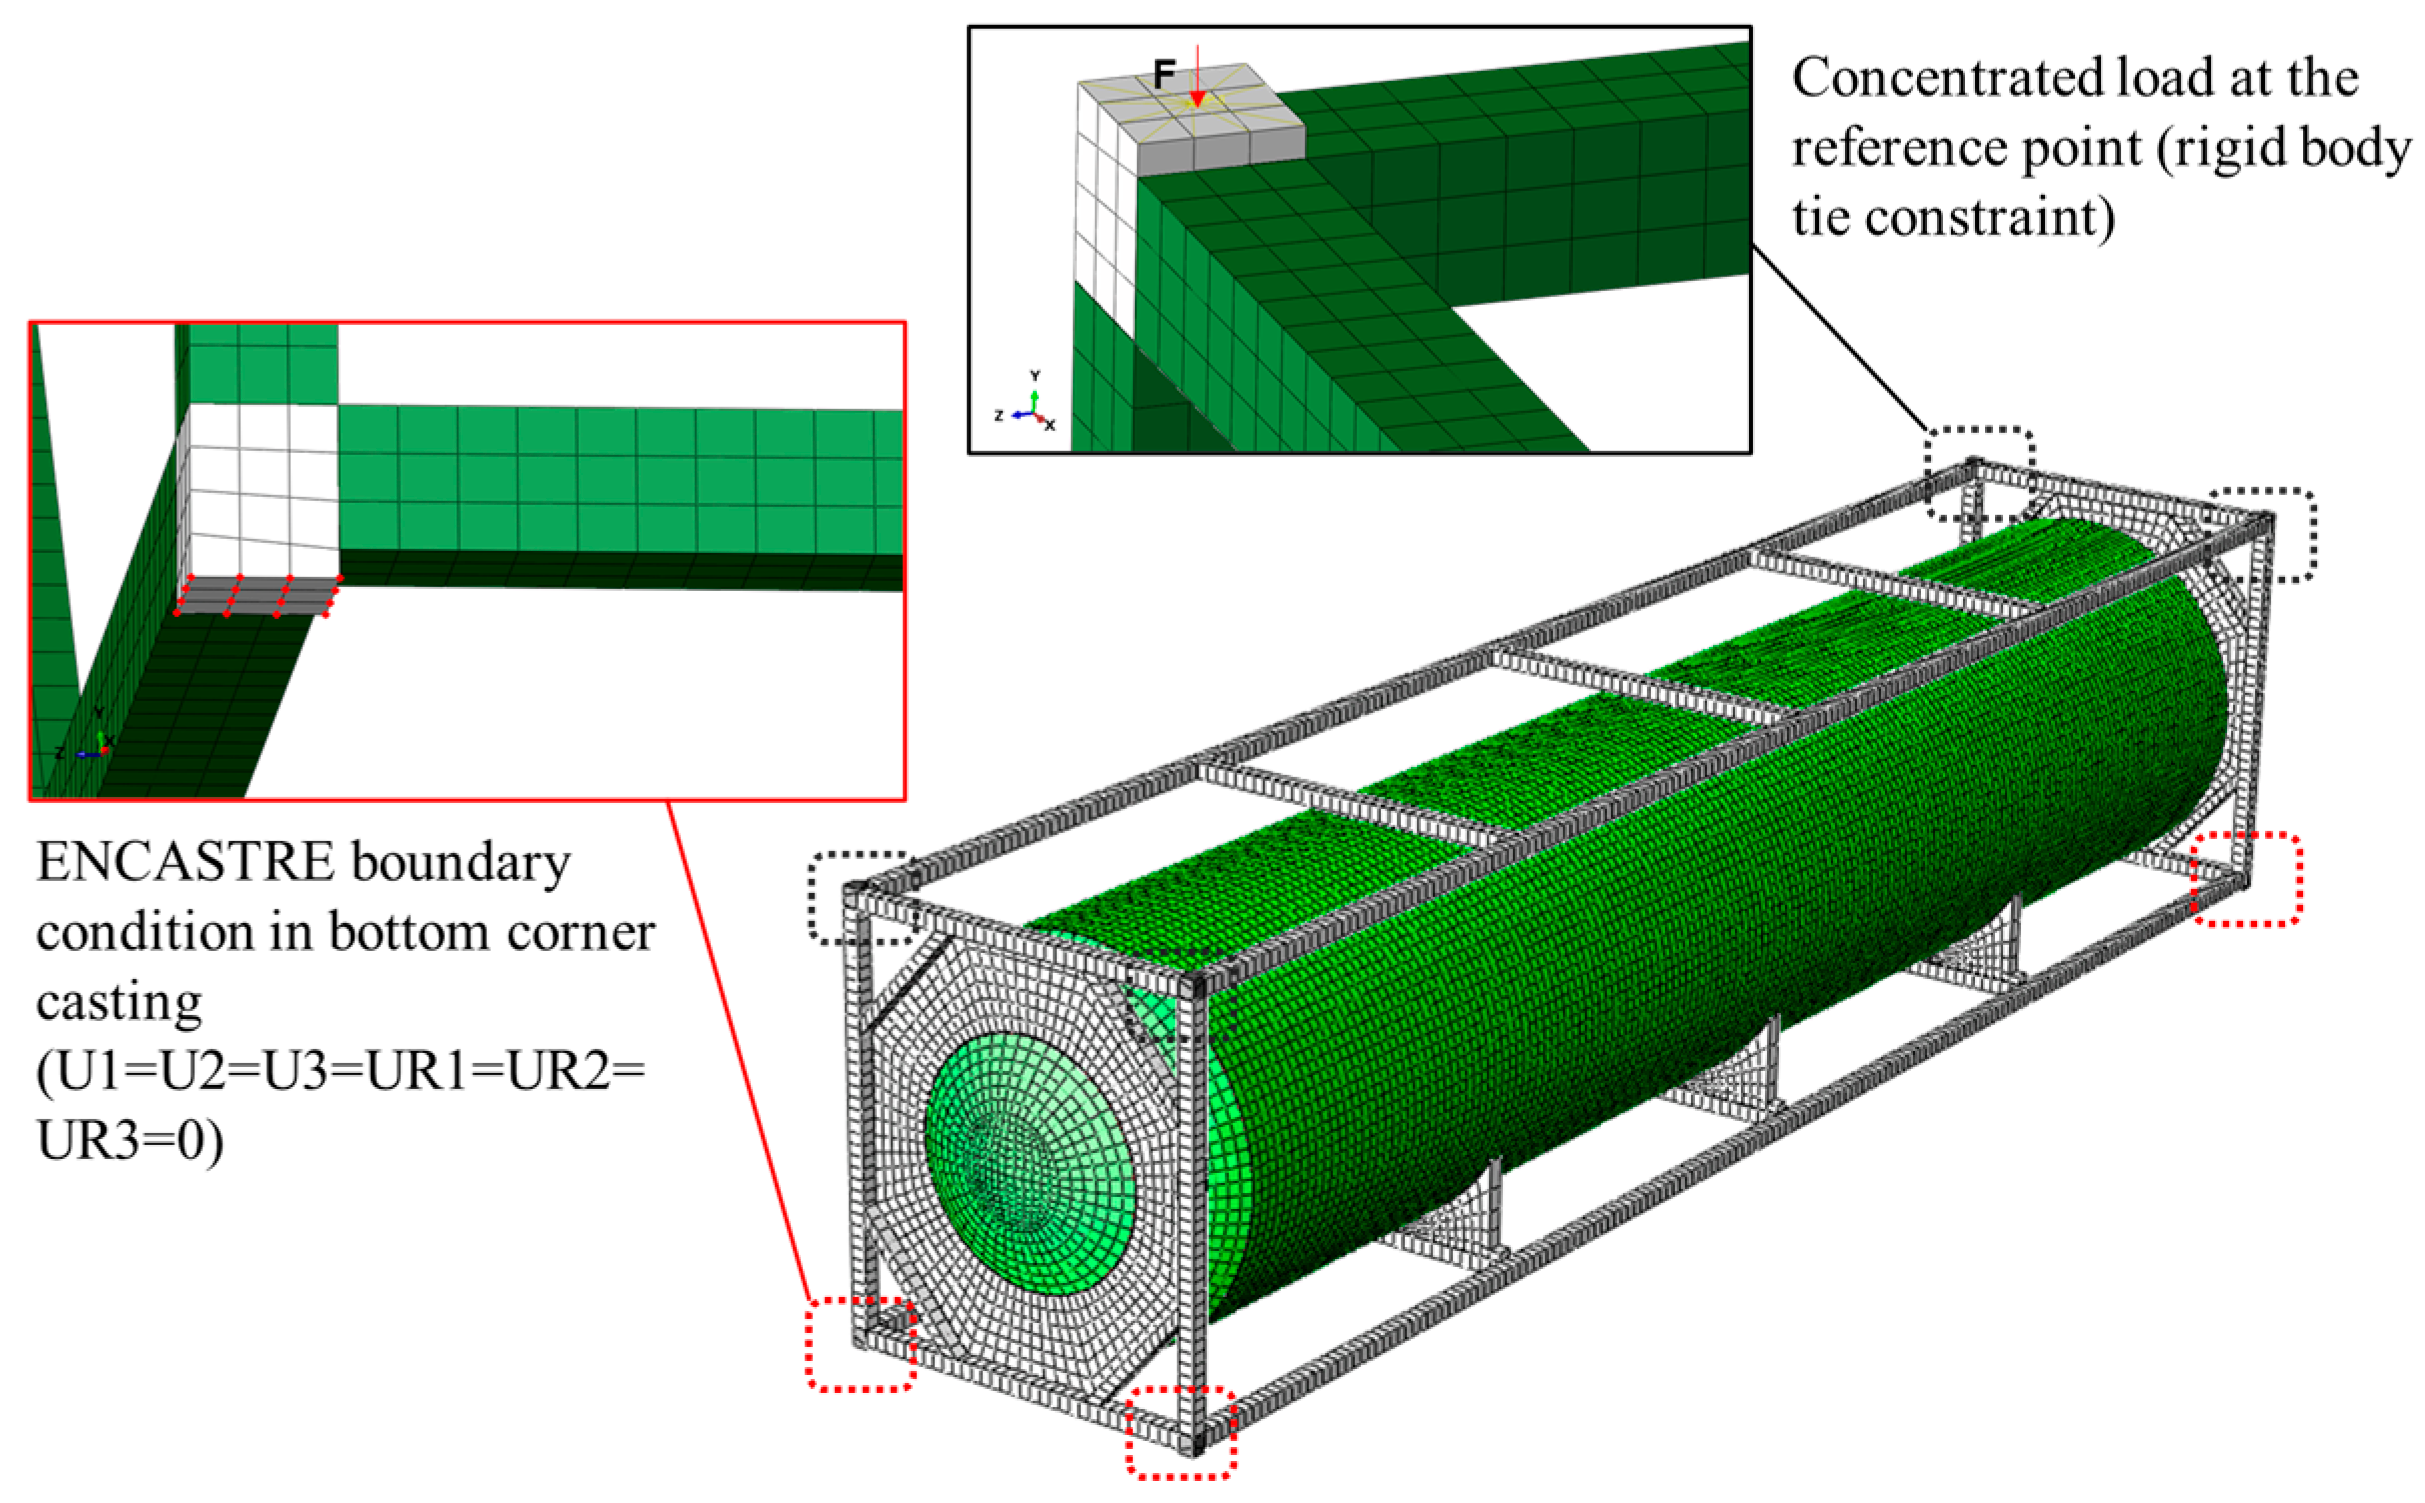
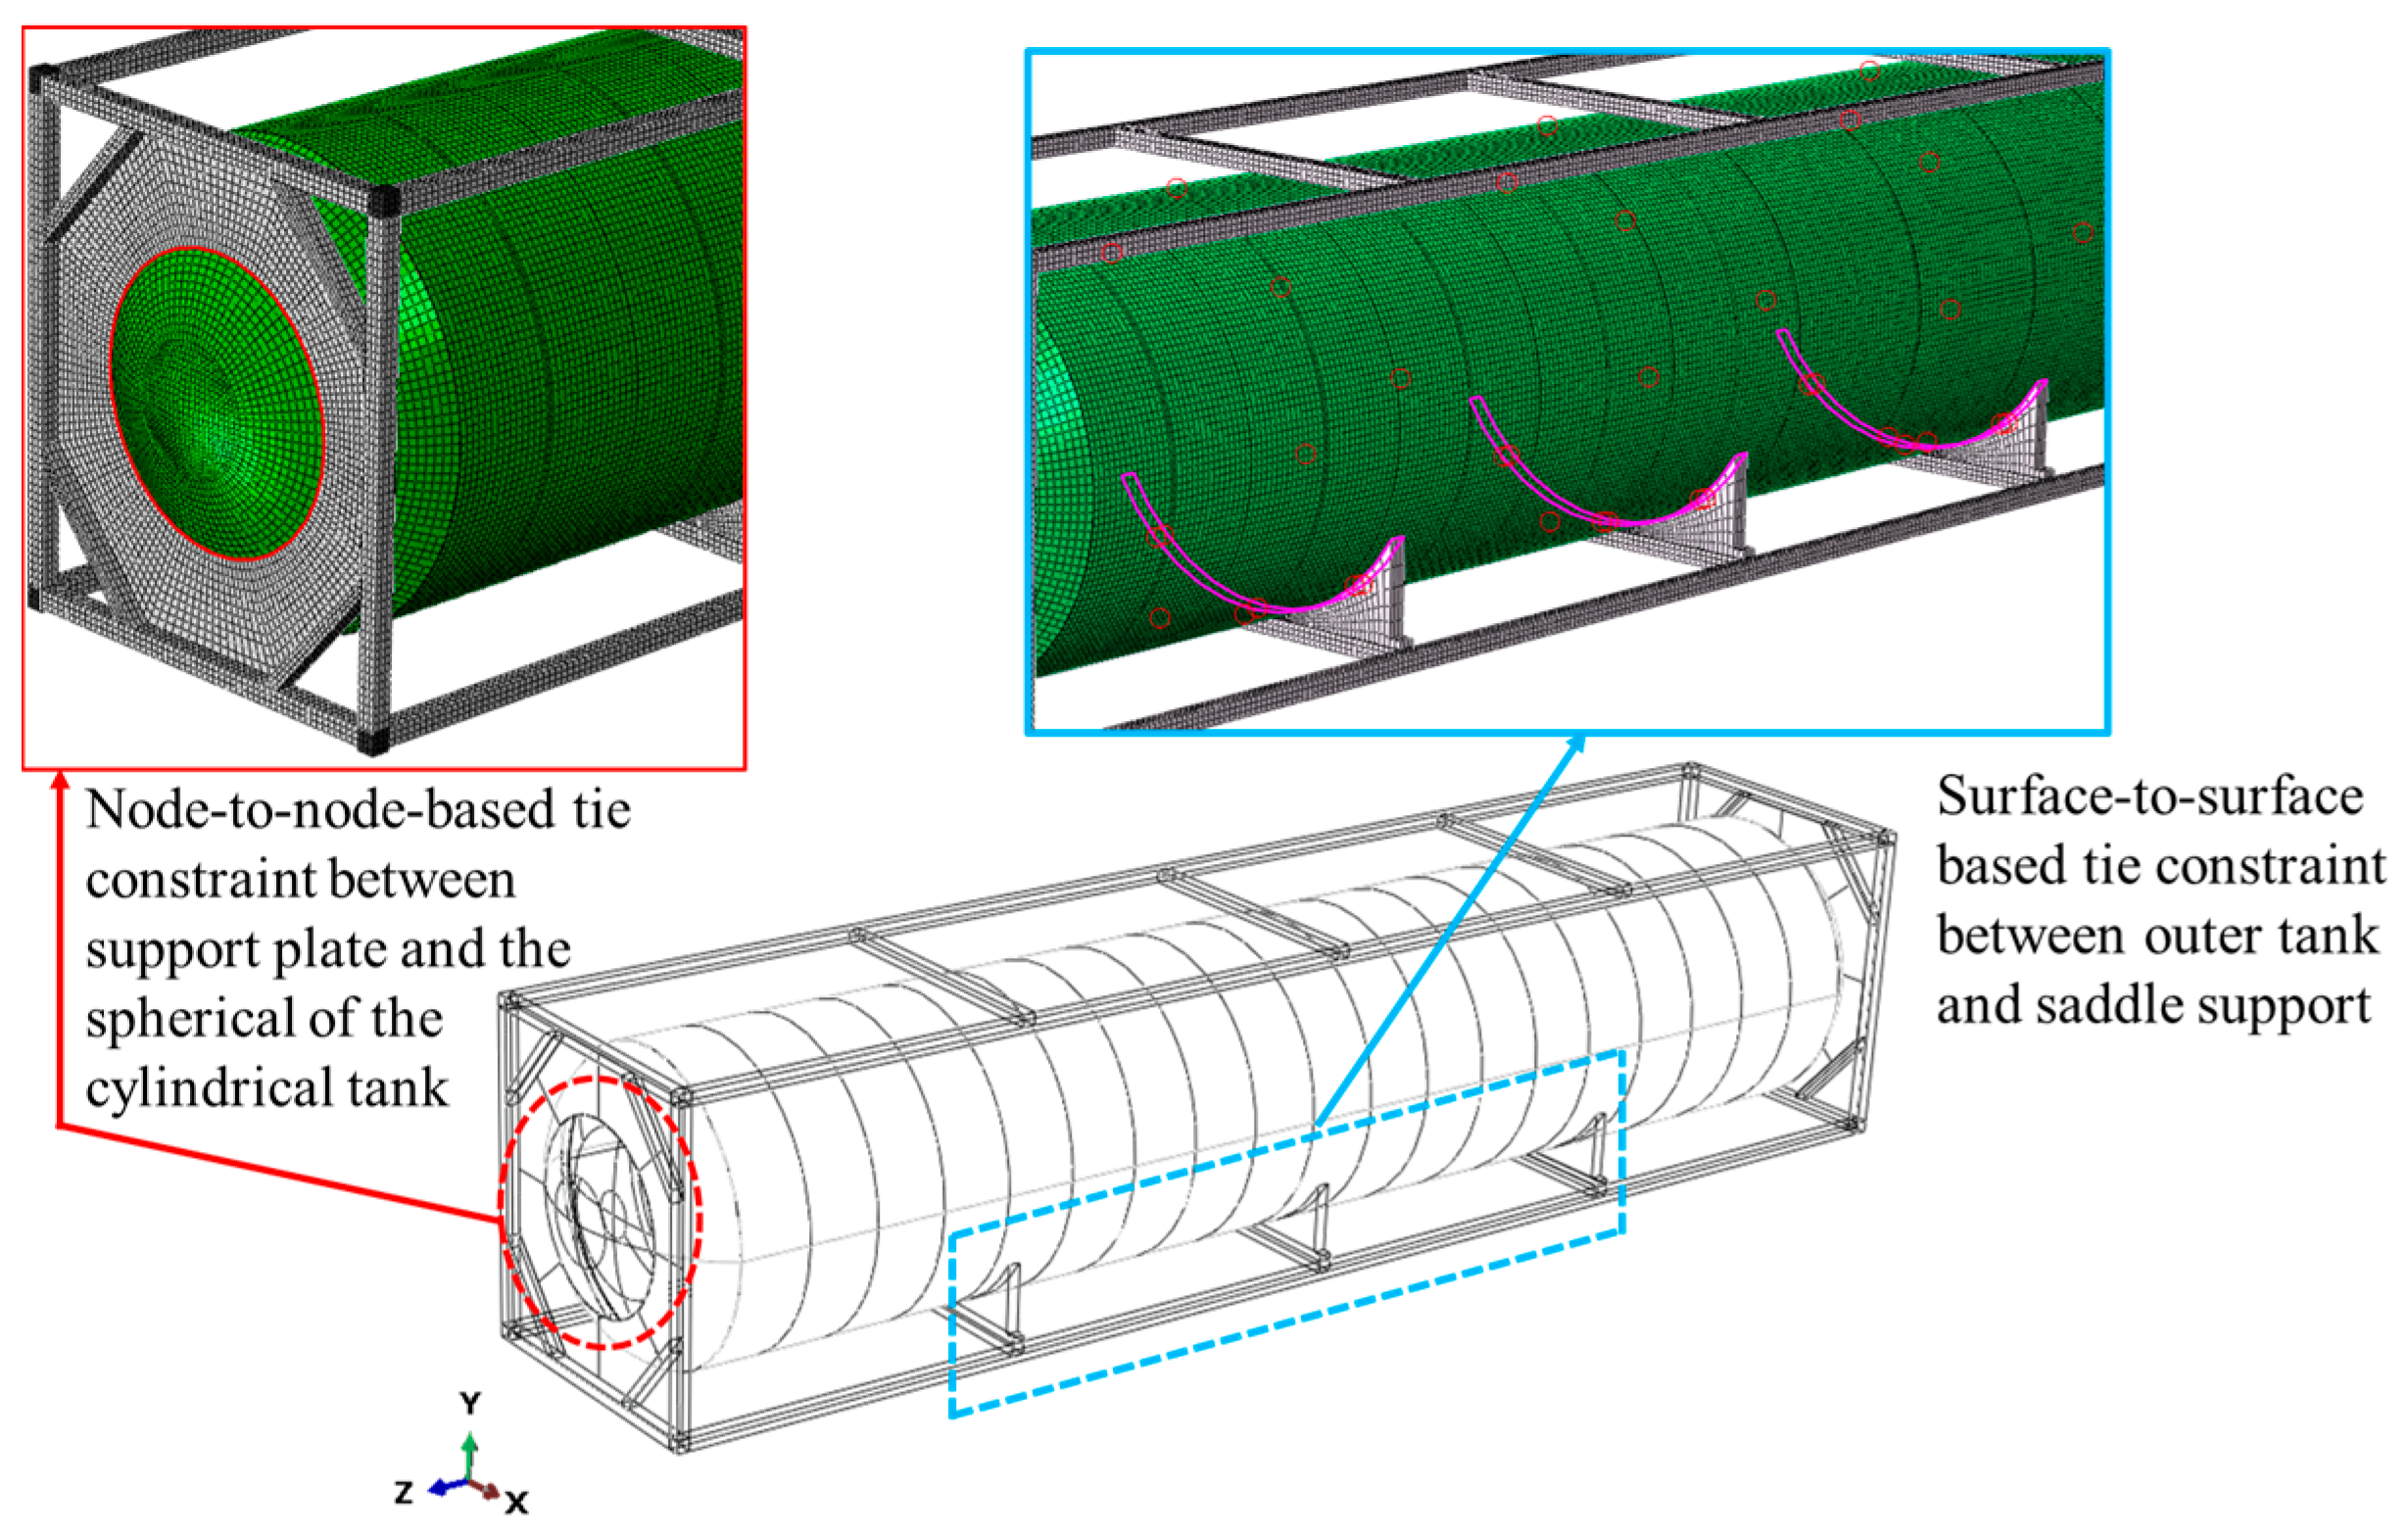
2.3.2. Applied Boundary Condition and Contact Interaction
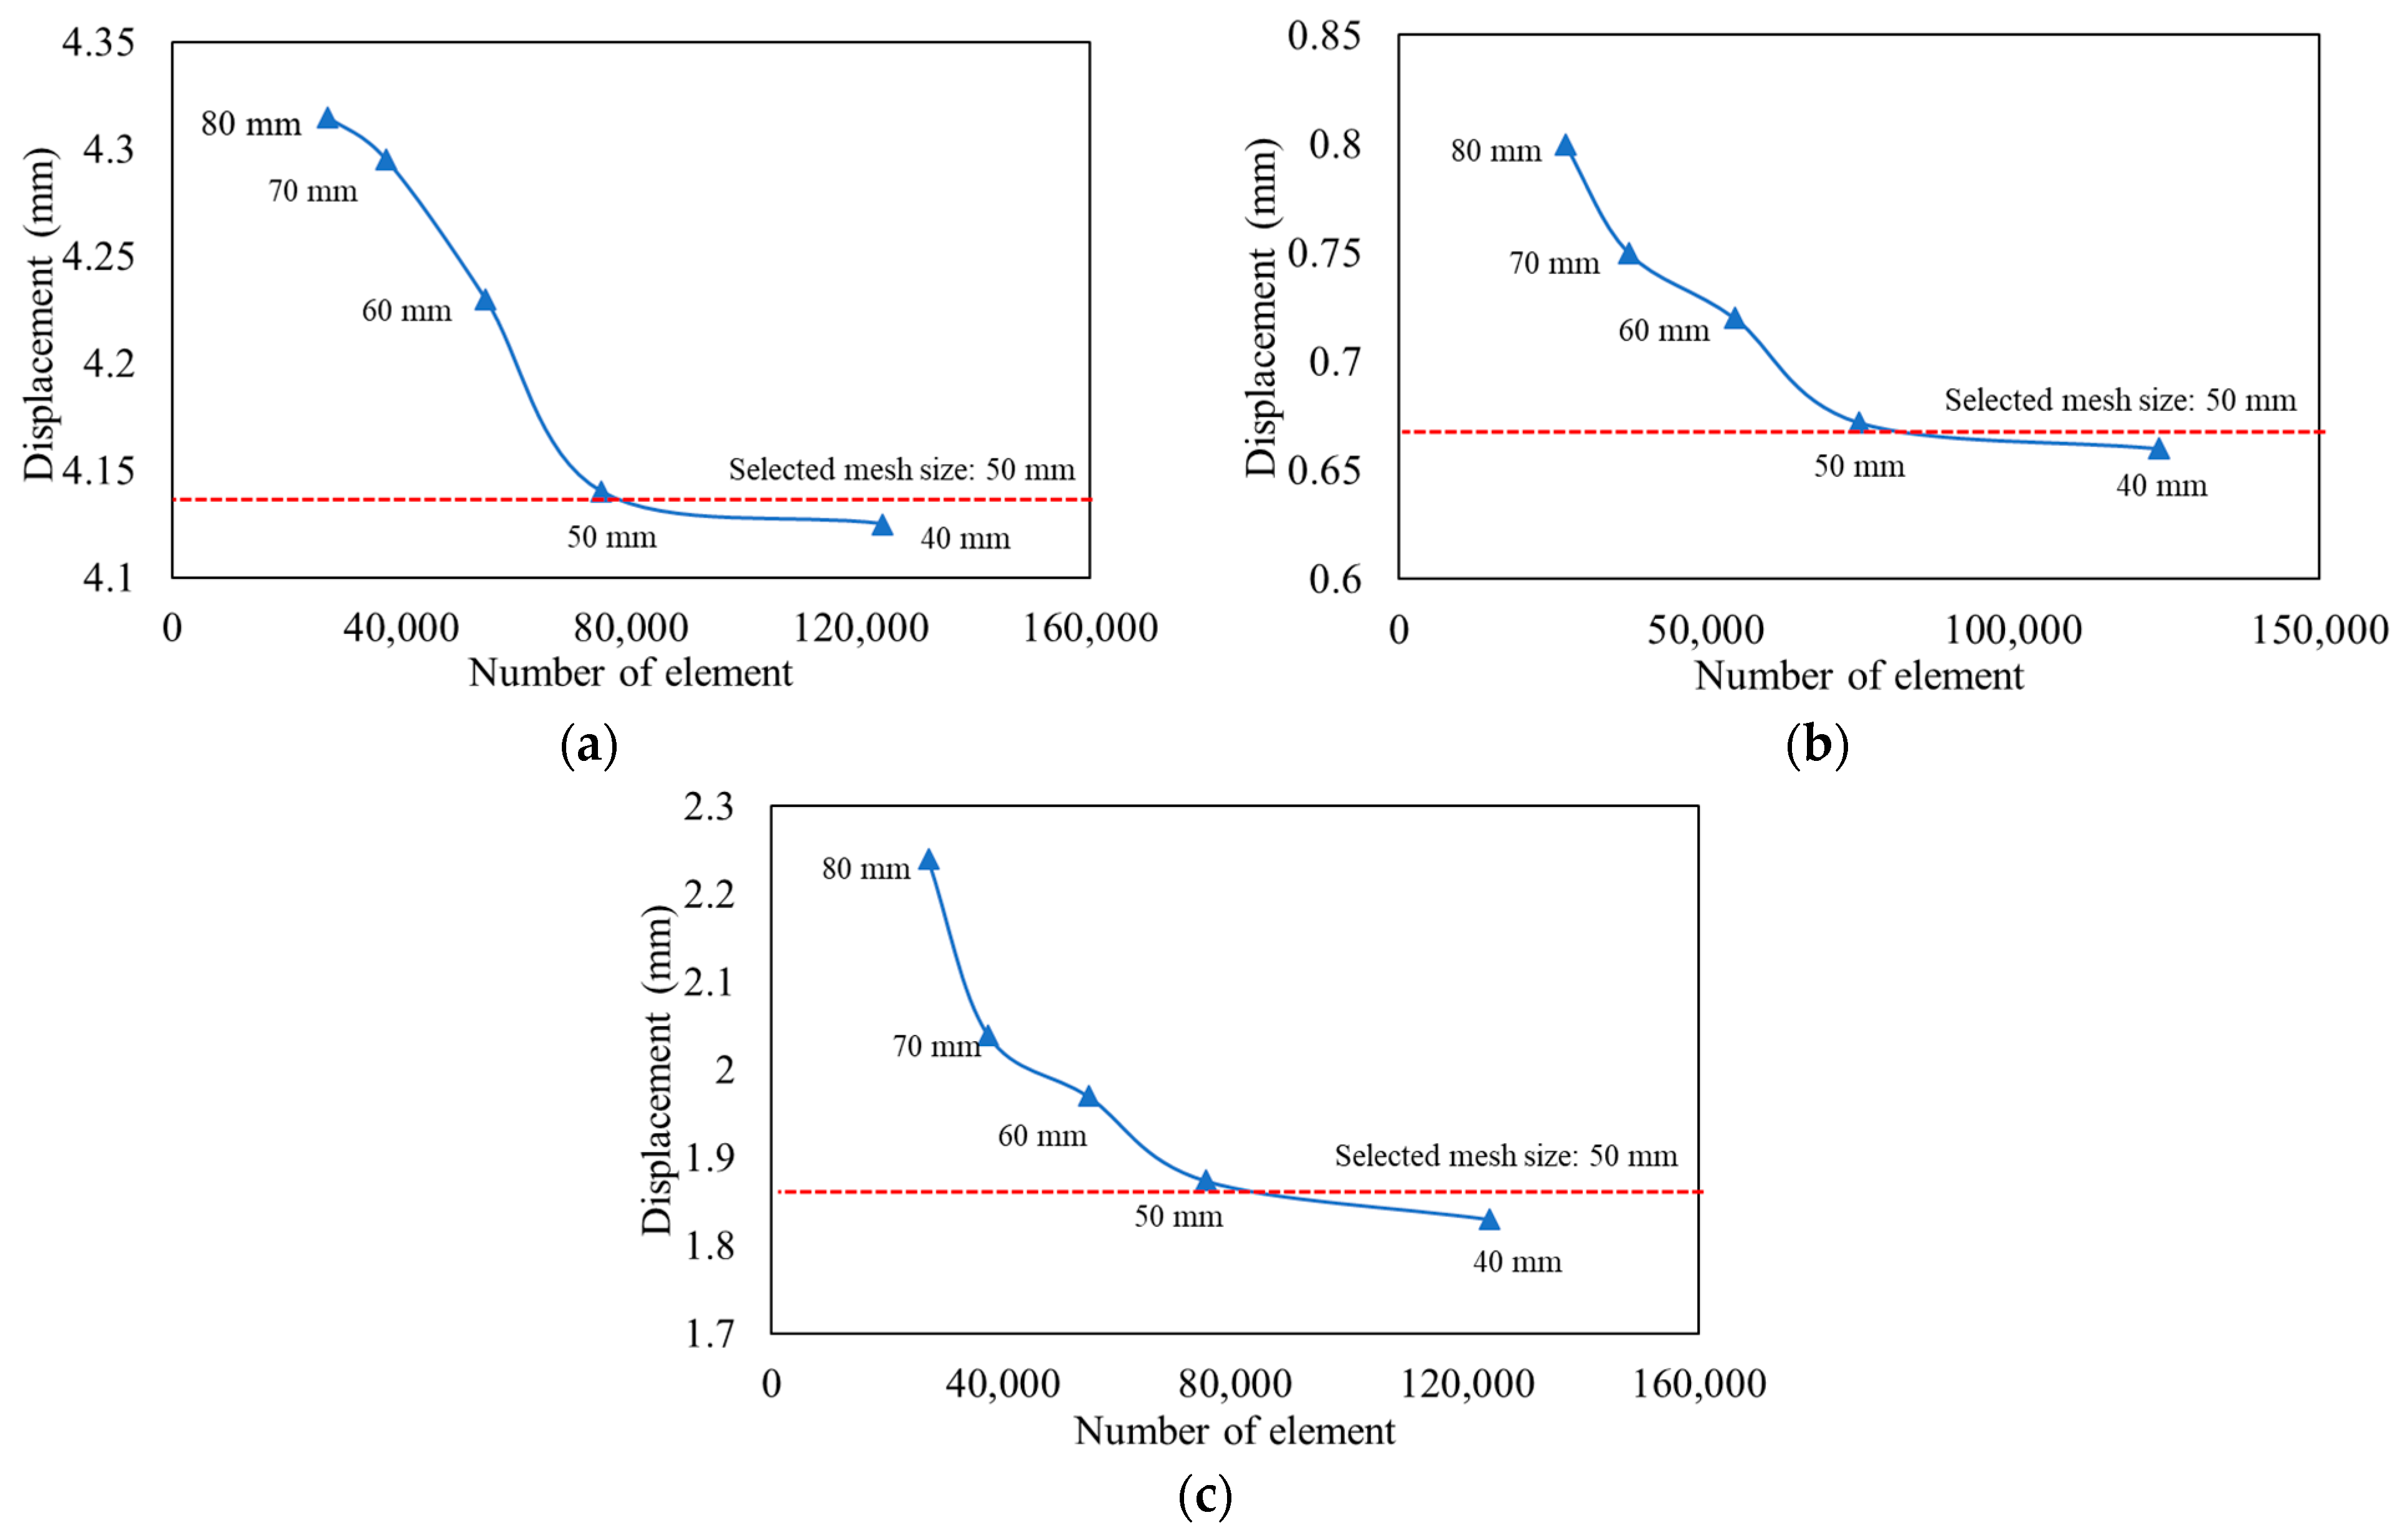
2.3.3. Mesh Convergence Test
2.3.4. Design Variable
3. Results and Discussion
3.1. Result of Initial LNG ISO Tank Design
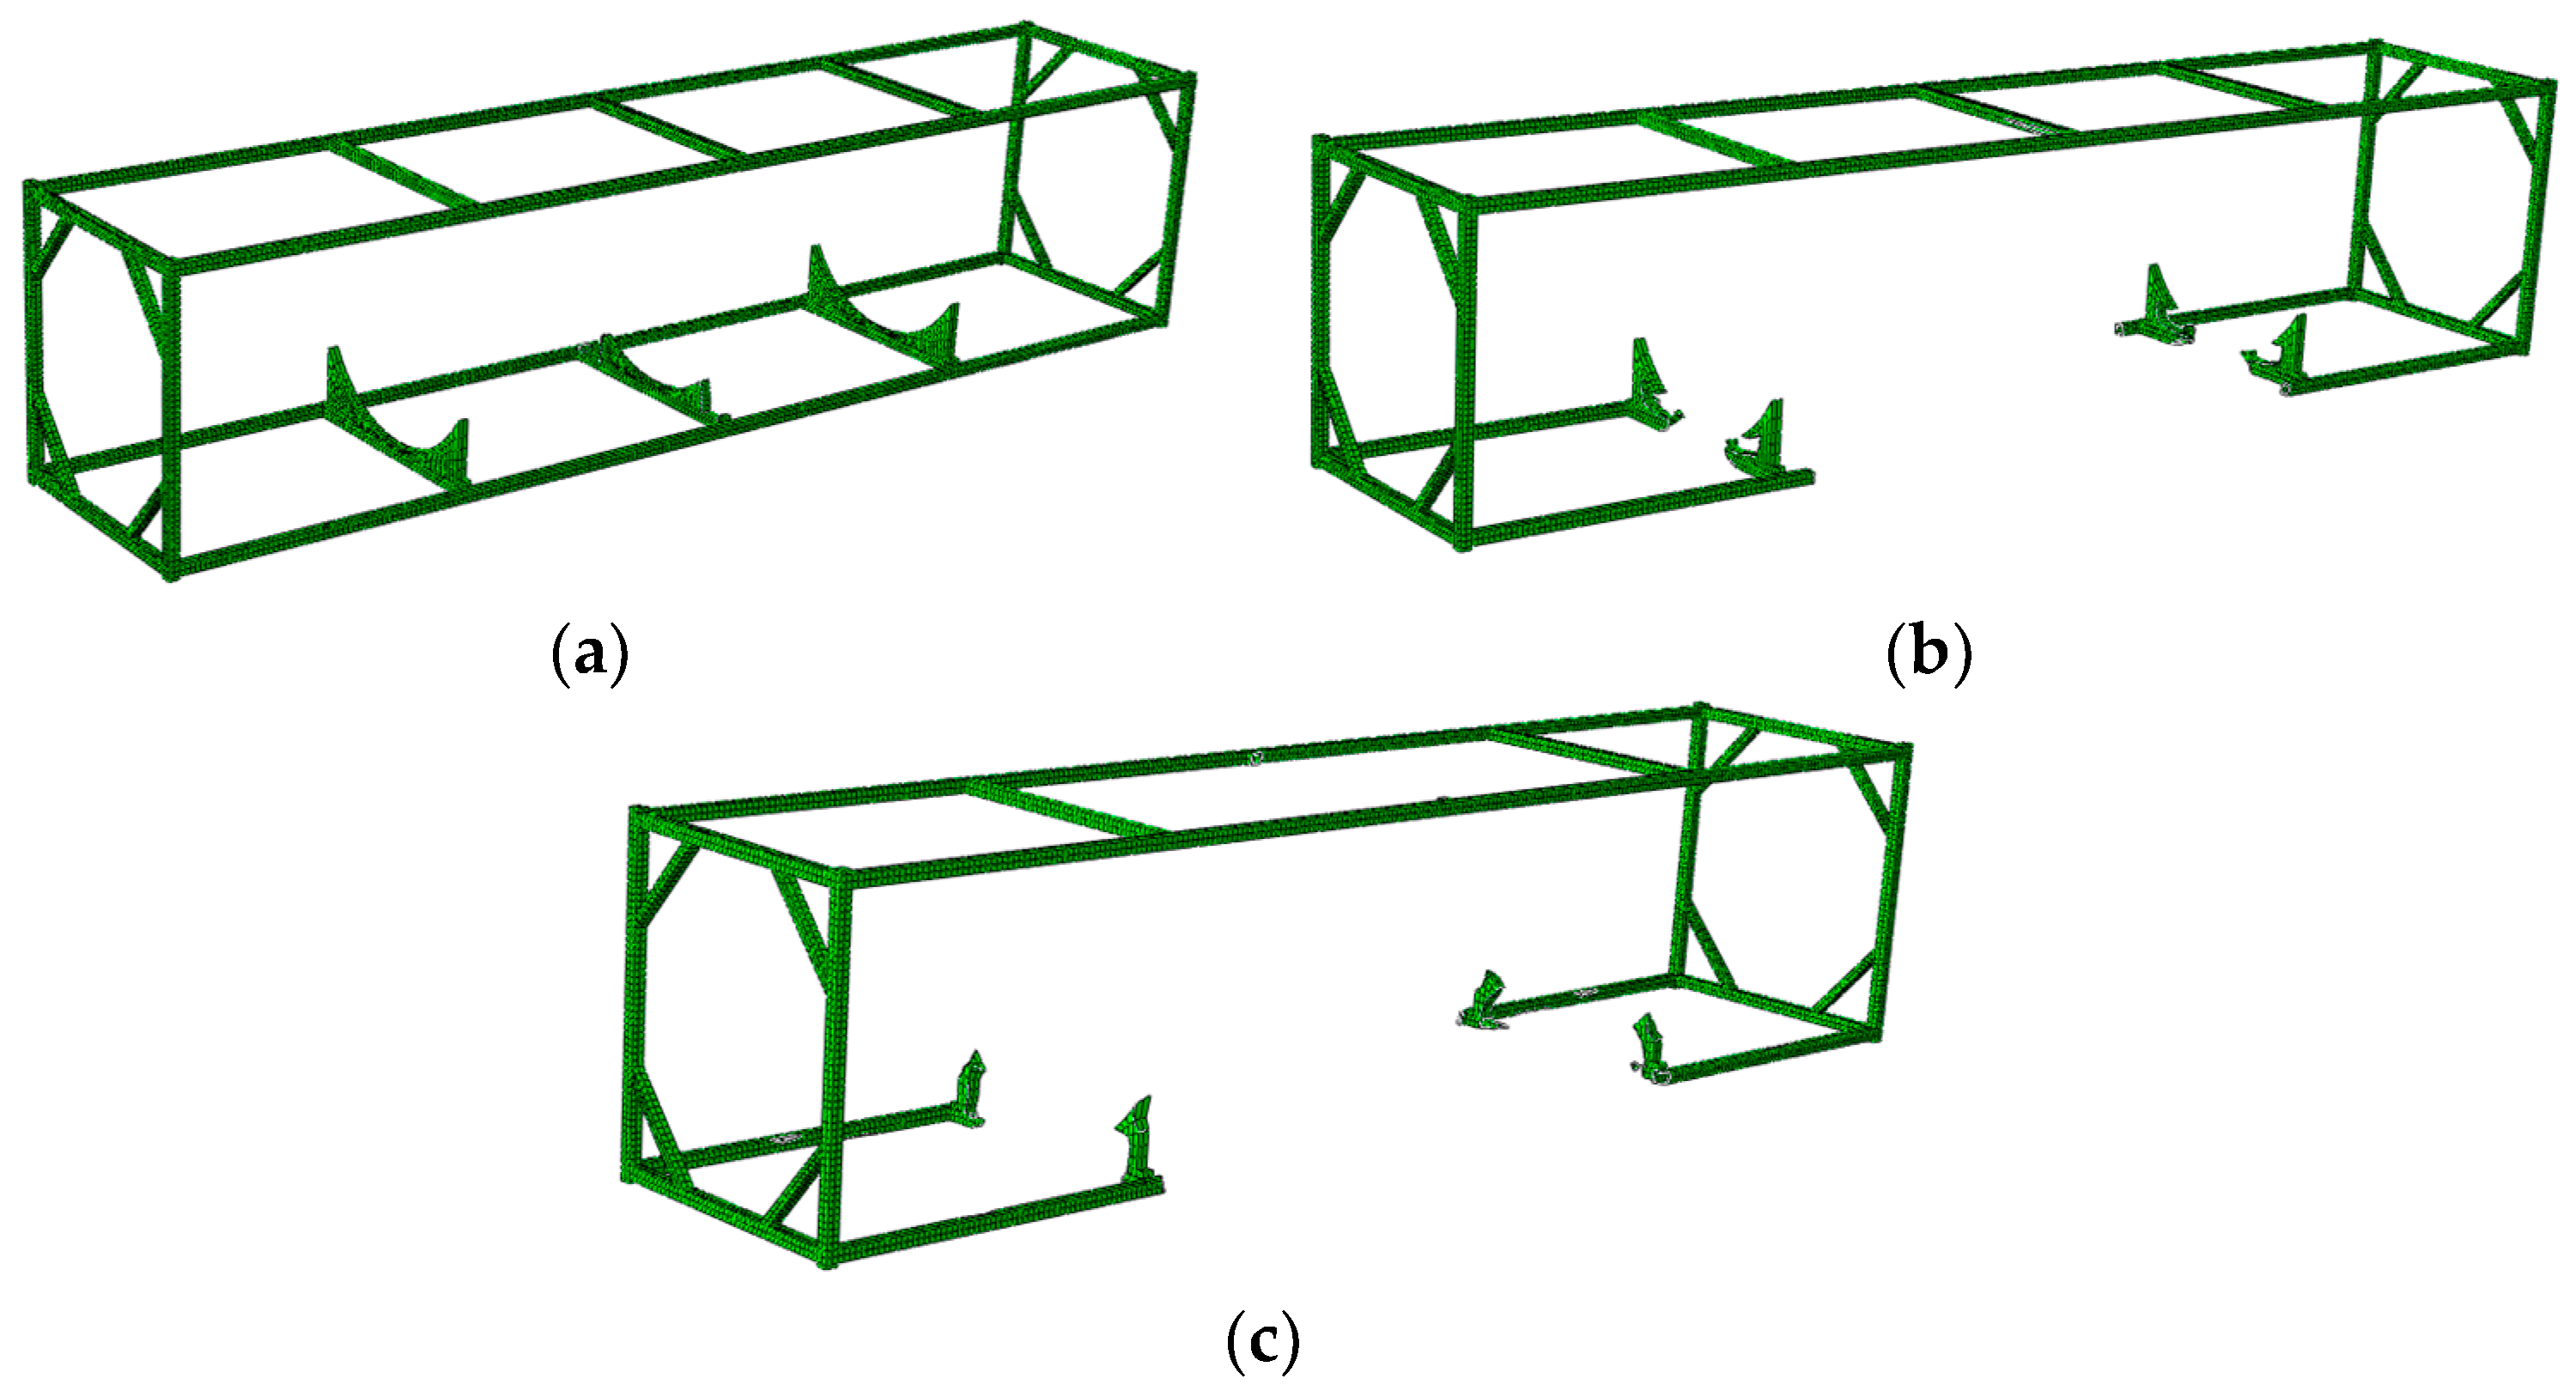
3.2. Result of Topology Optimization of LNG ISO Tank Design
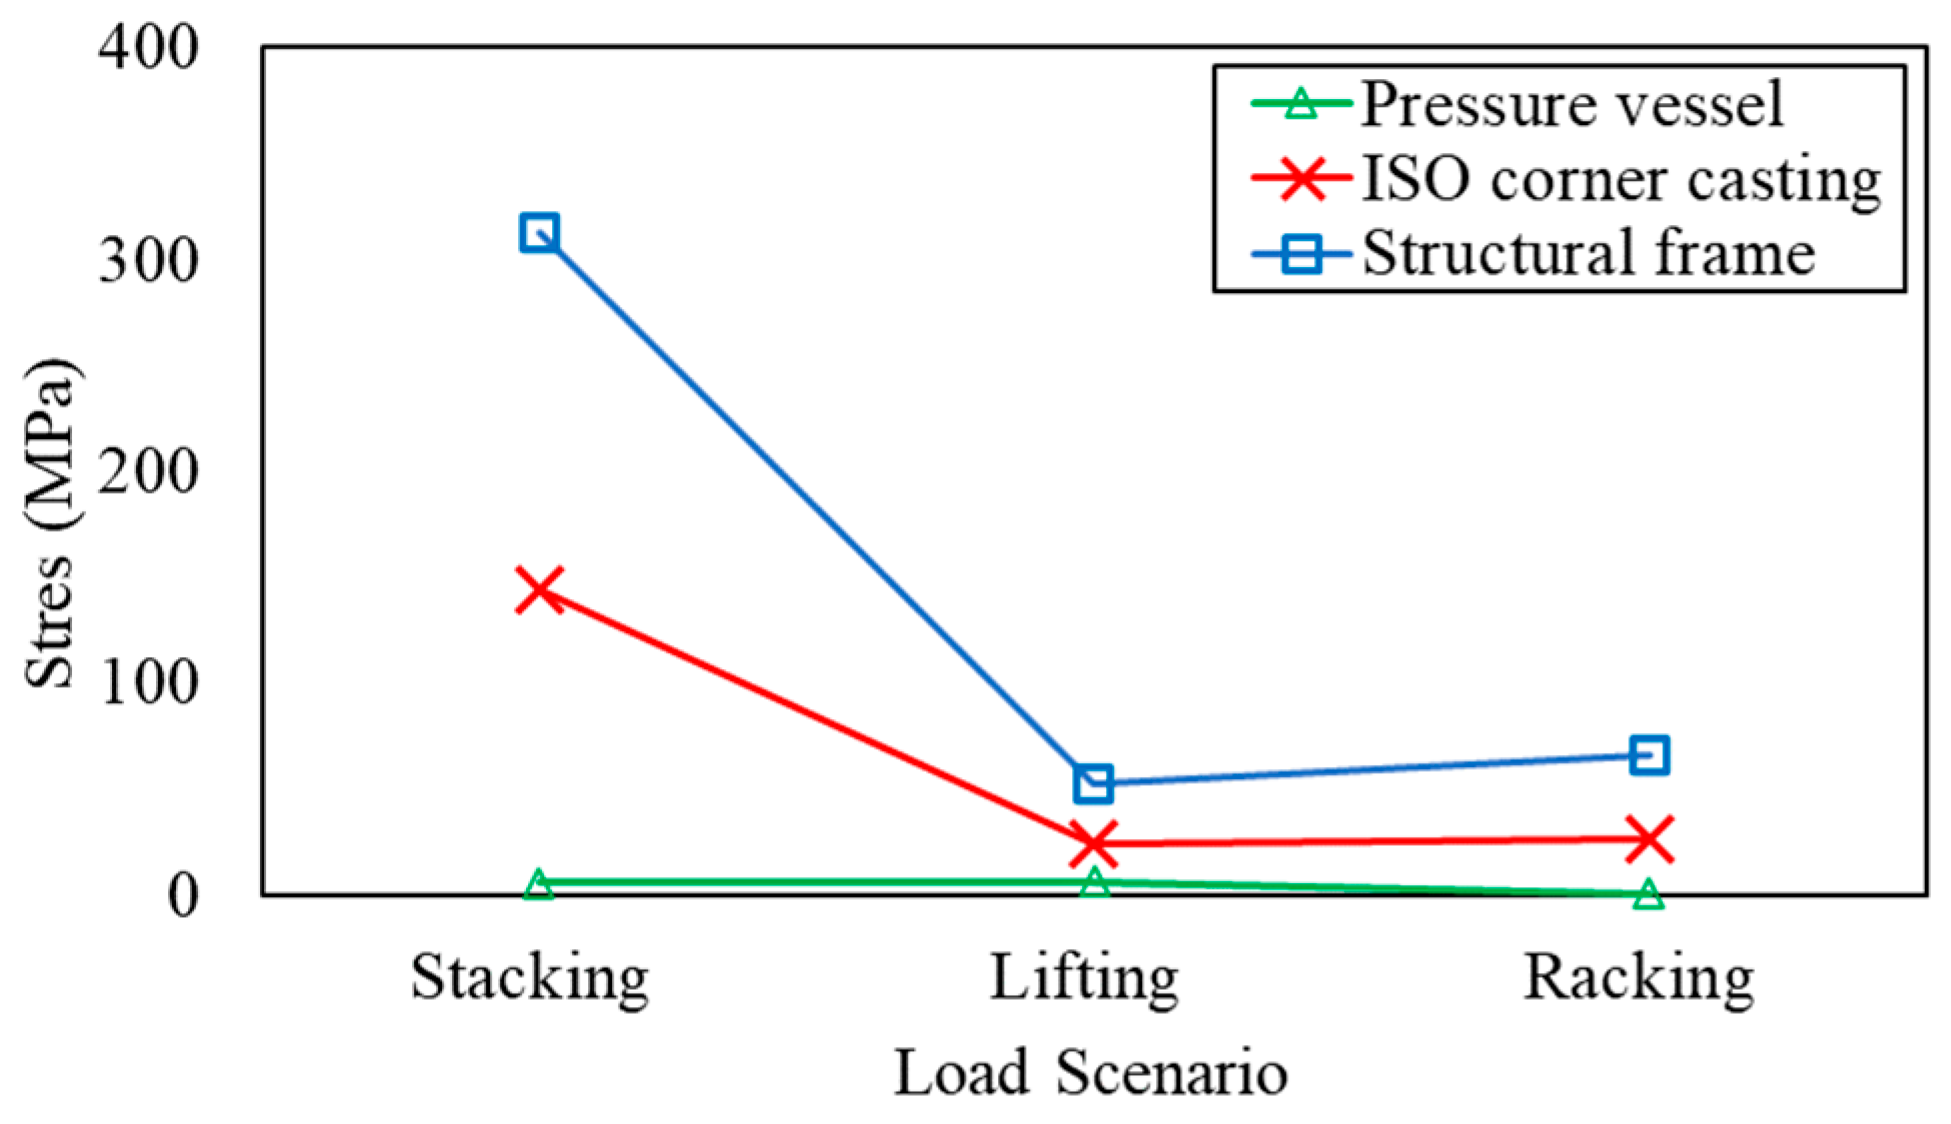
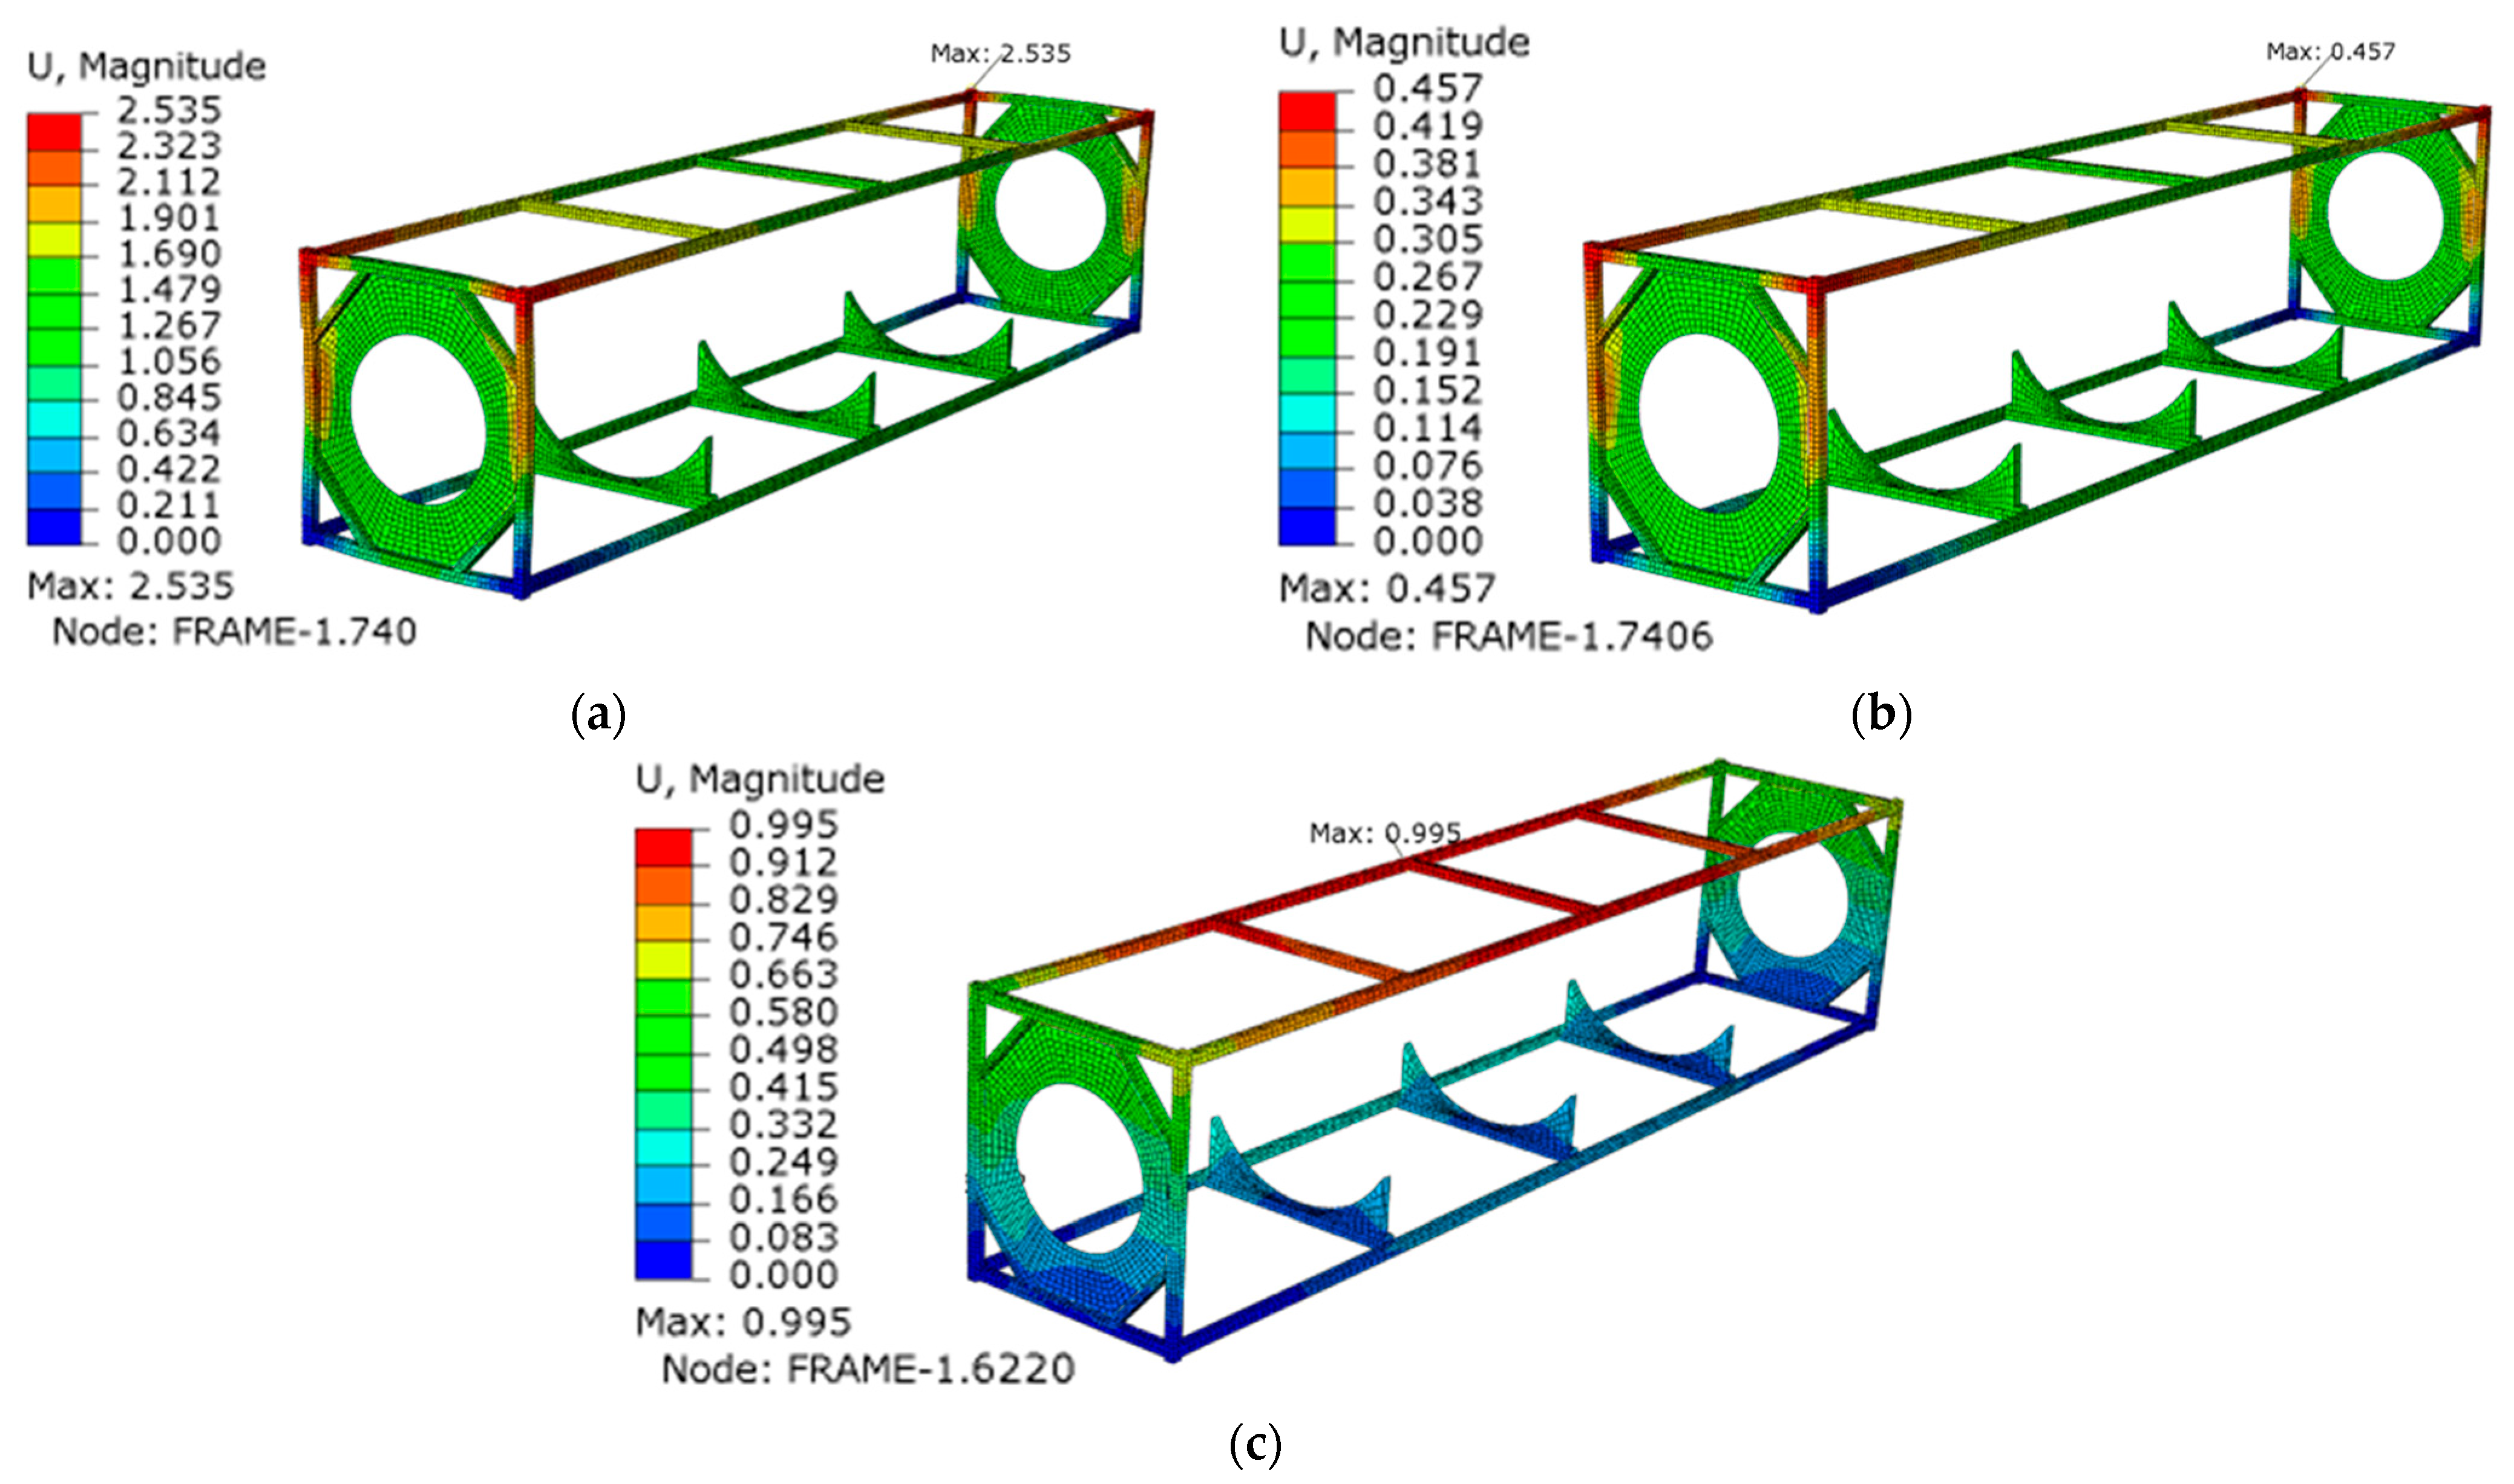
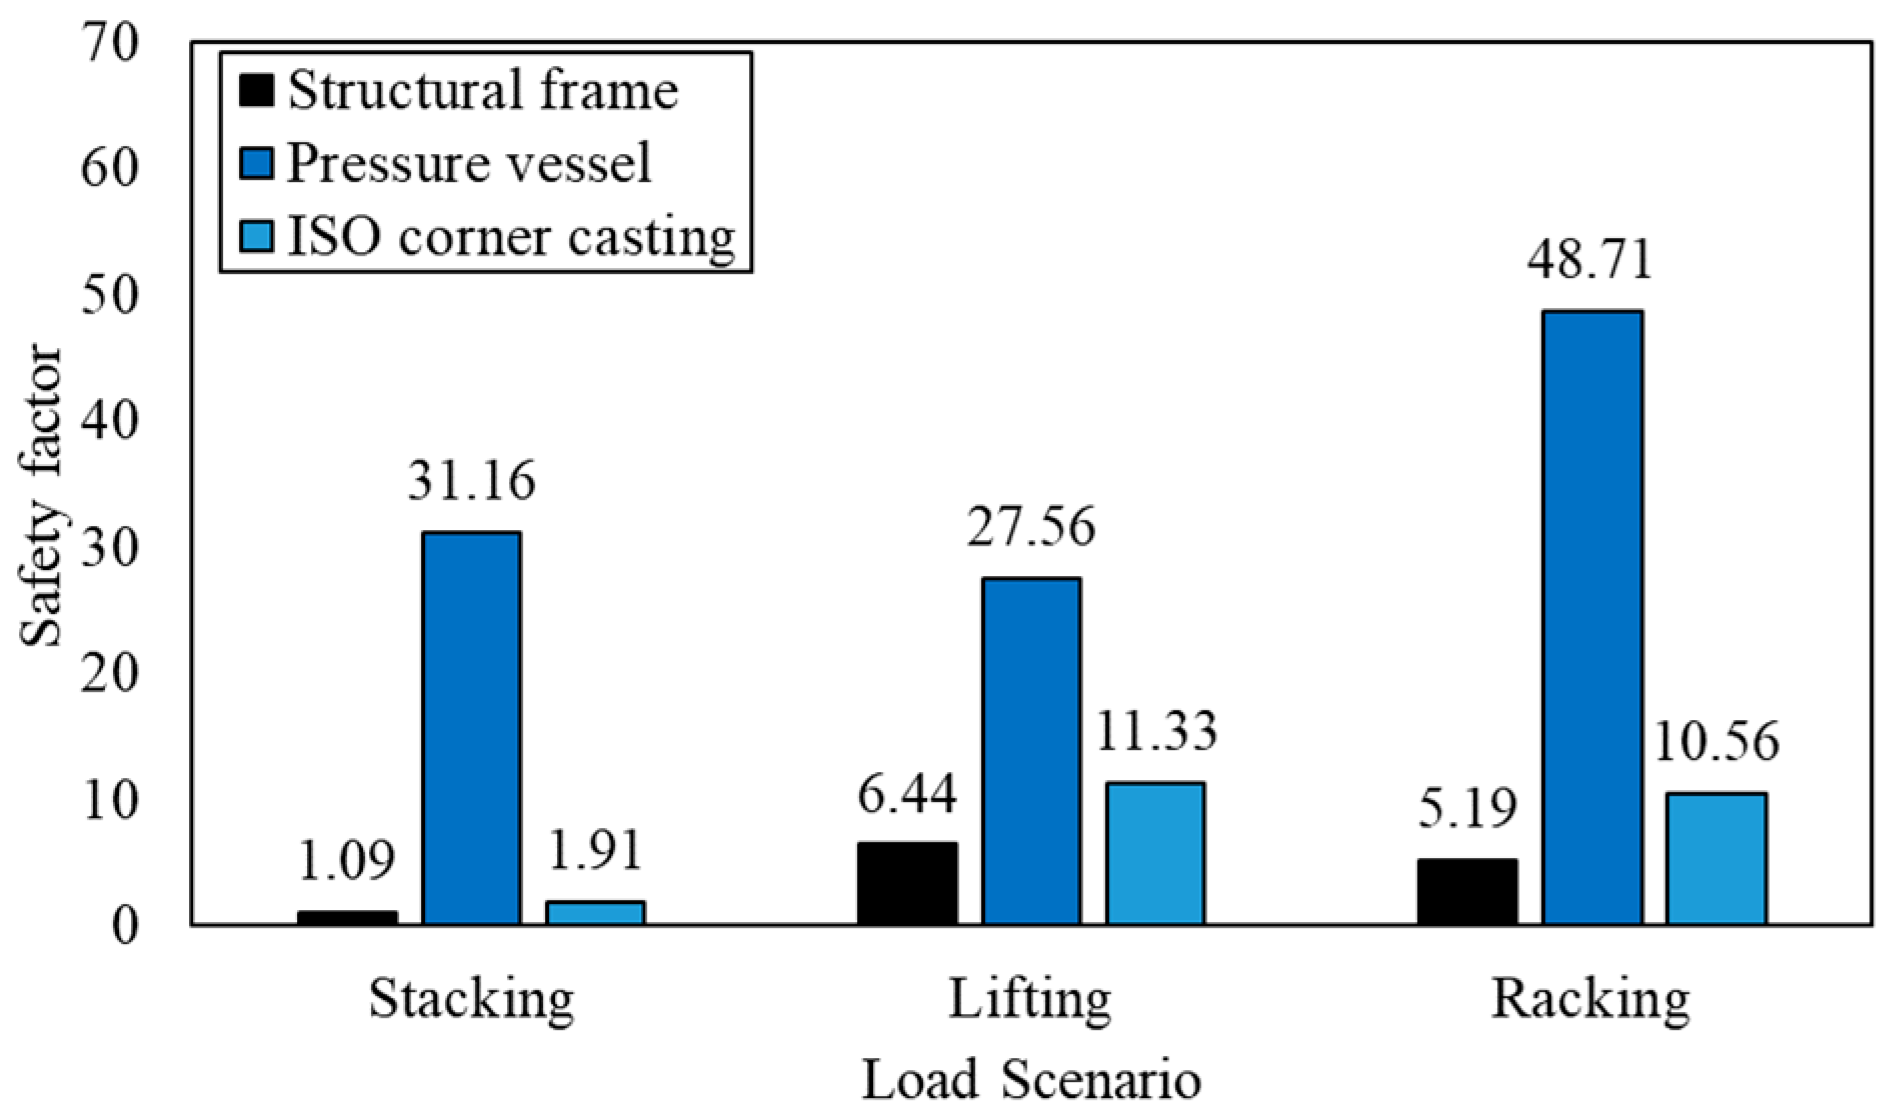
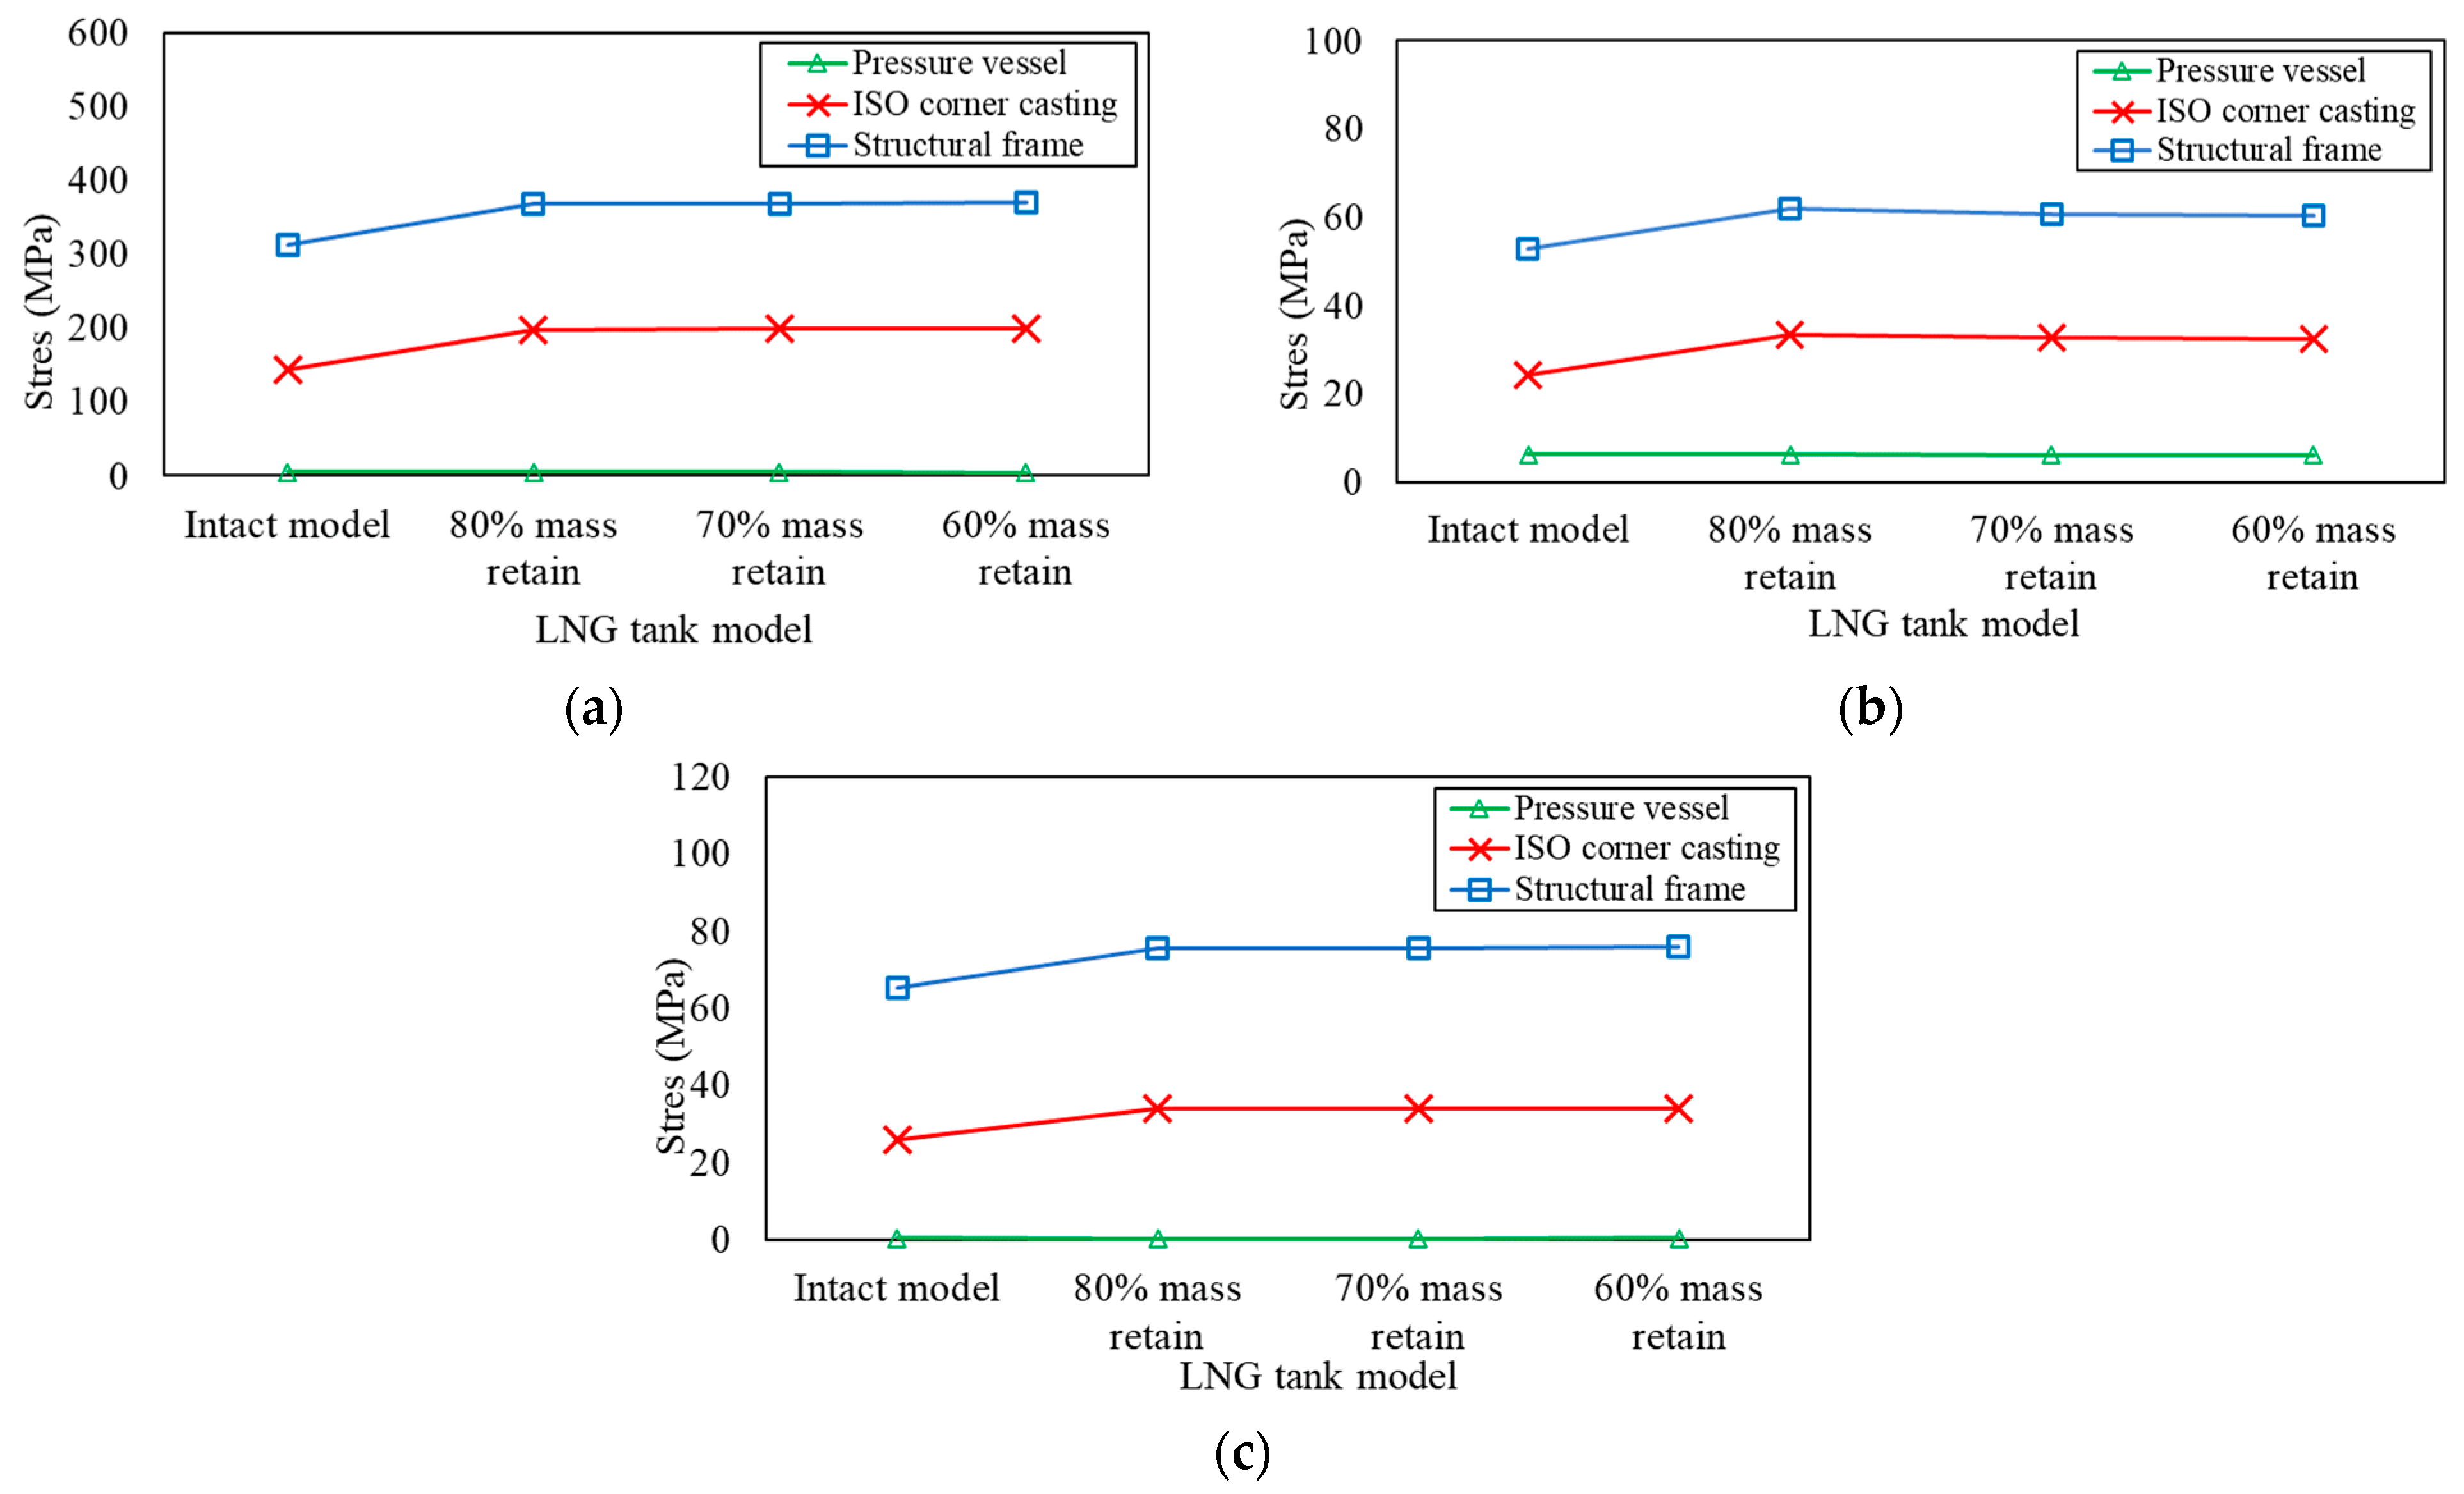
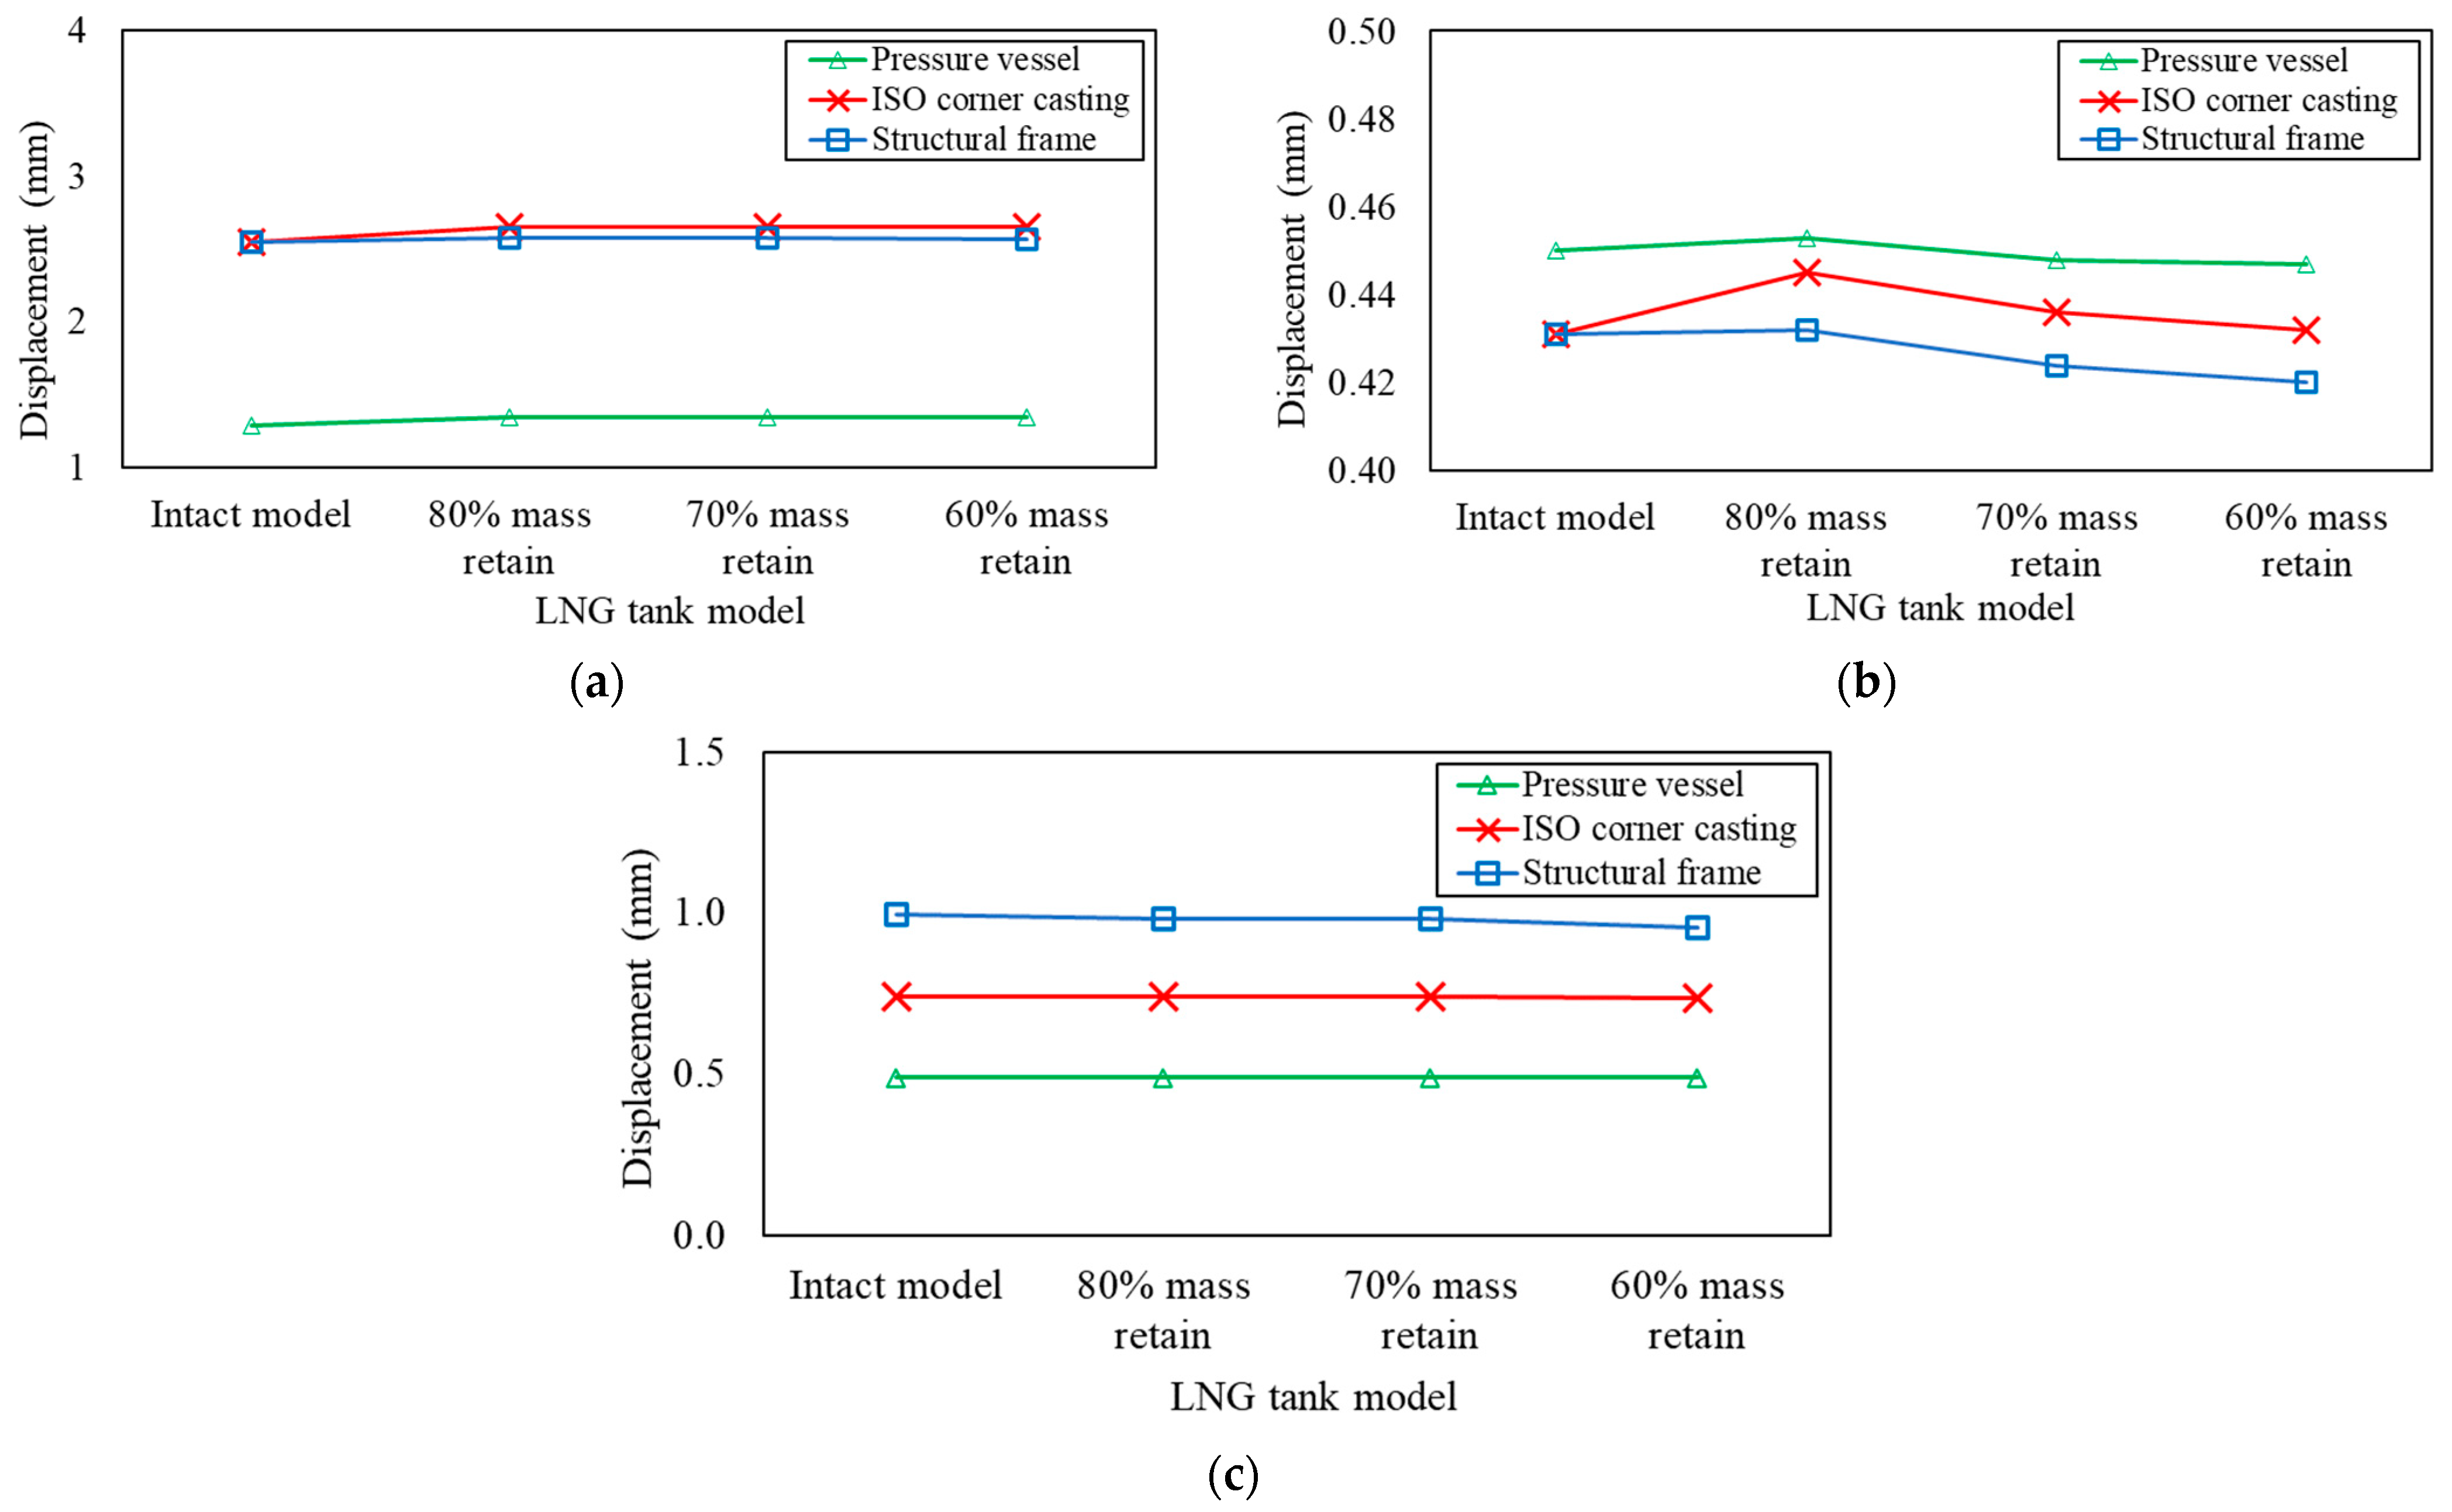
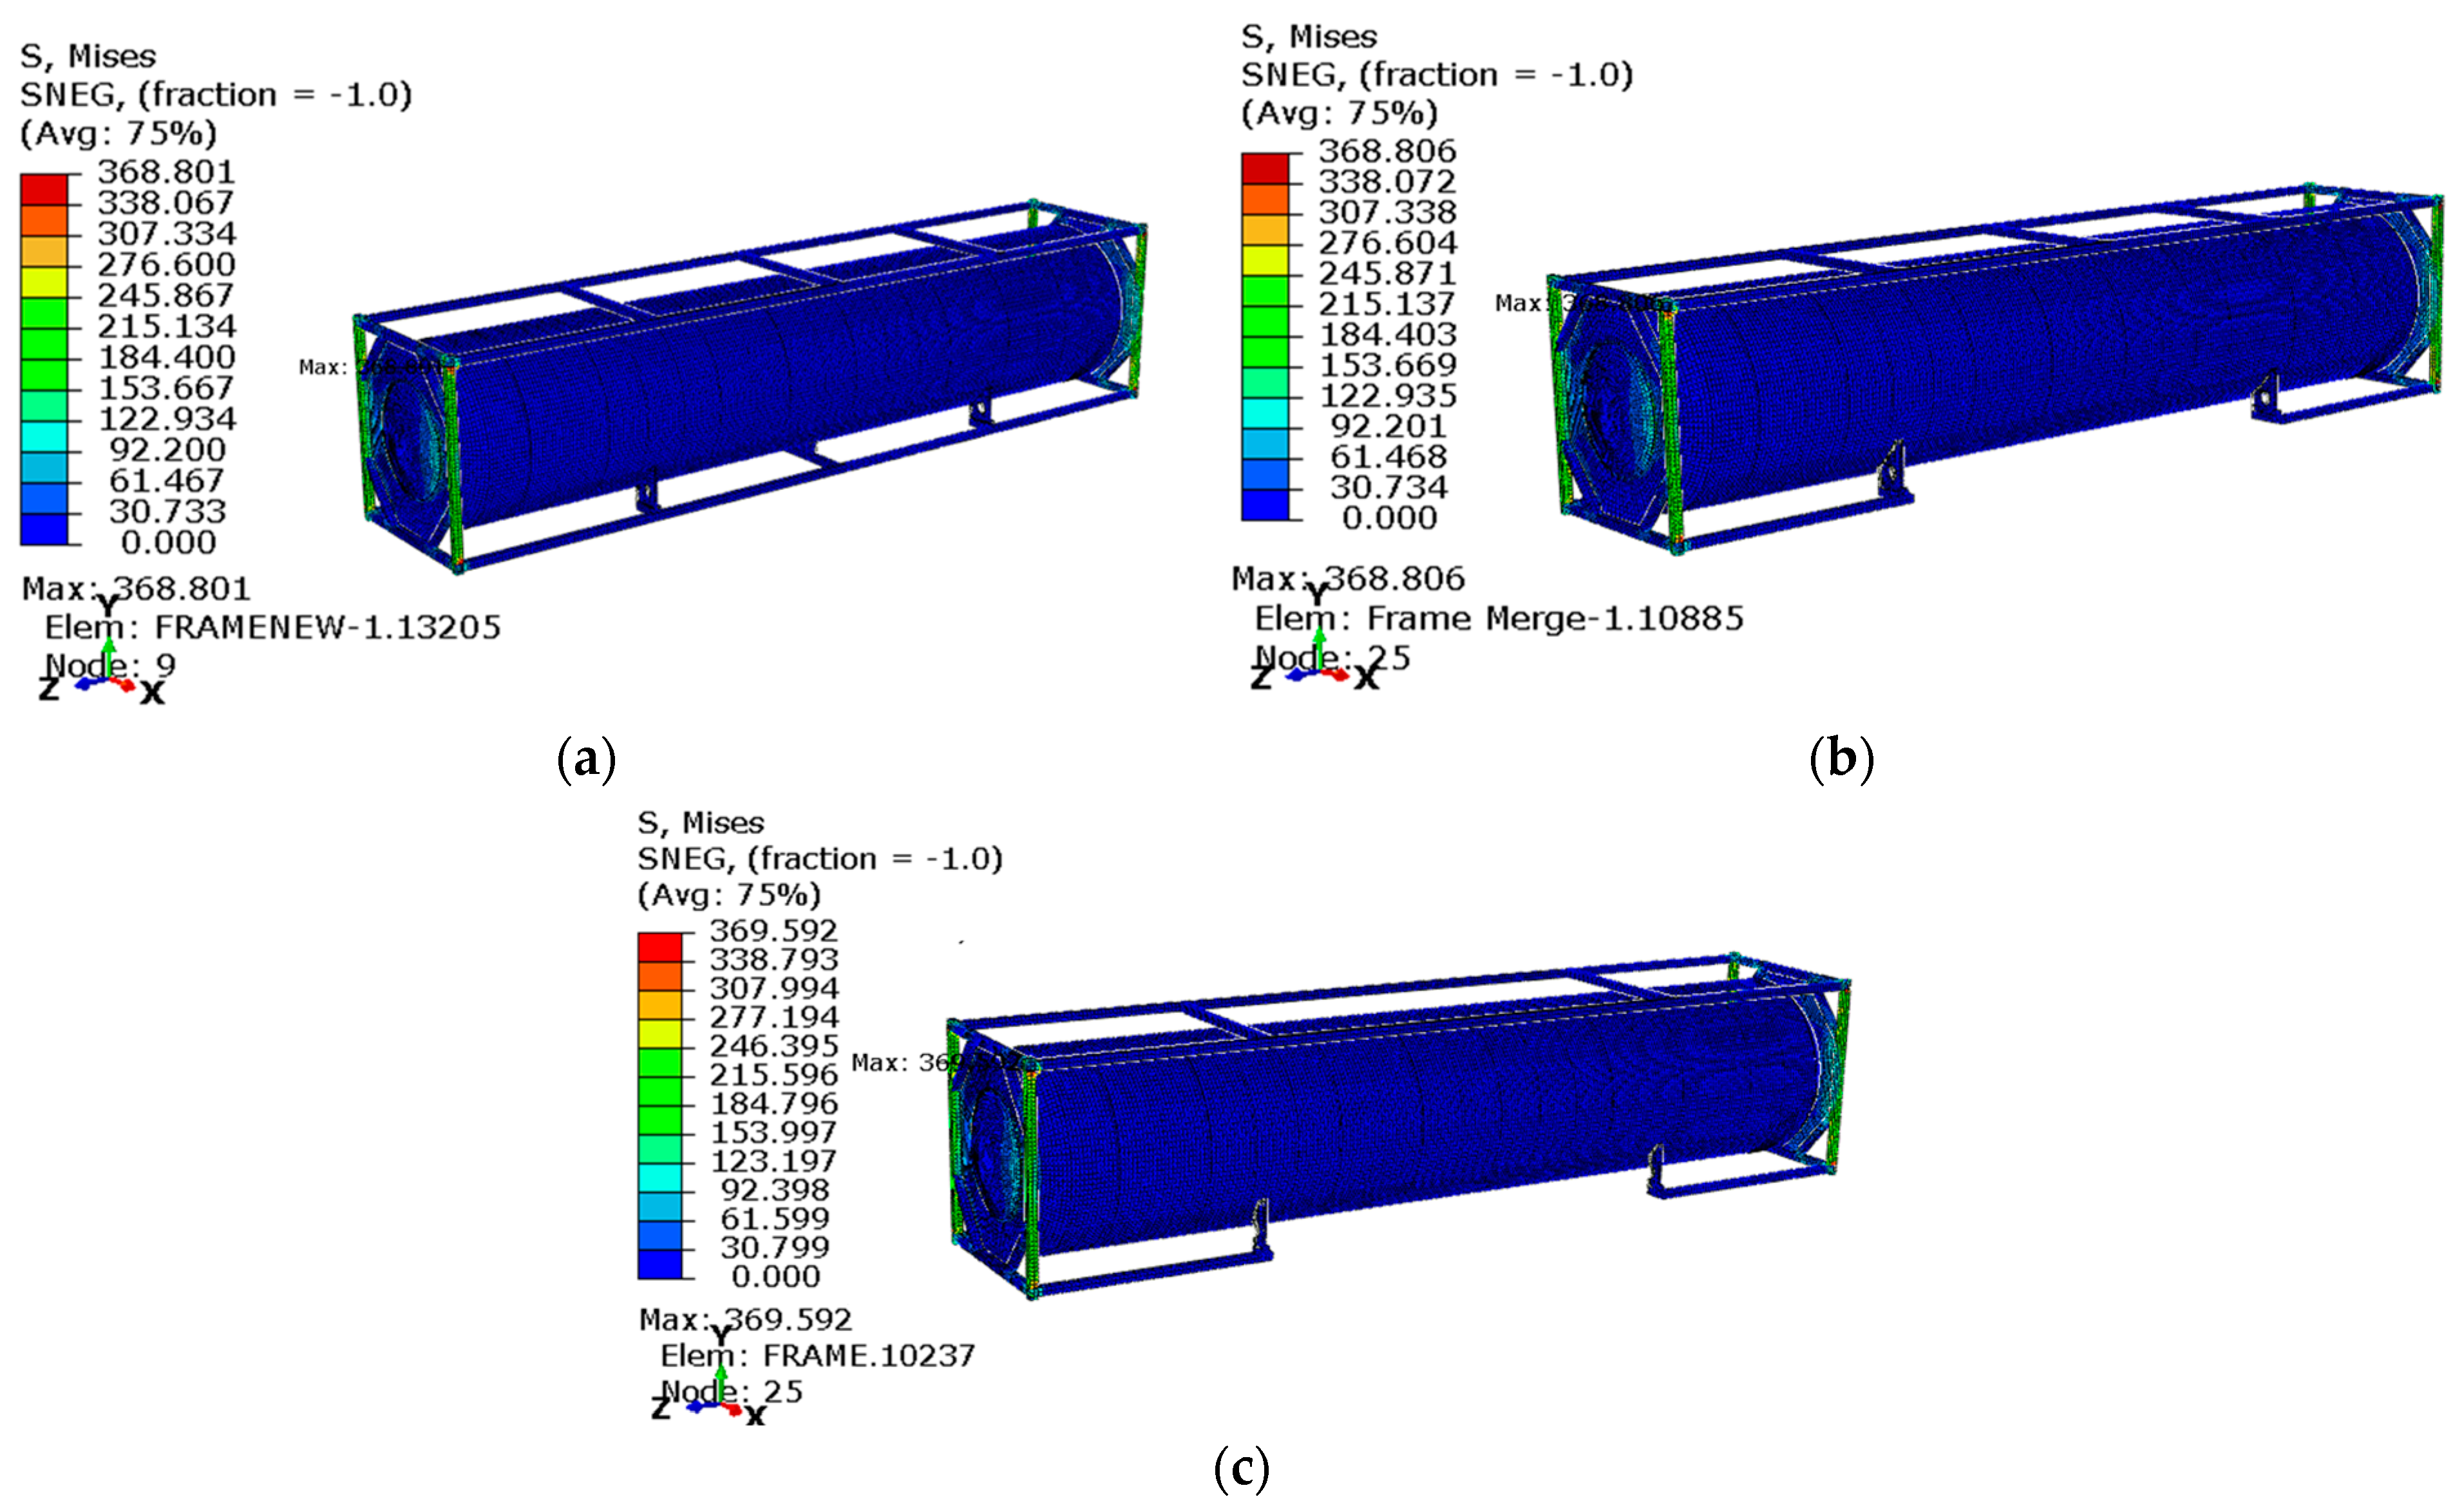
3.3. Structural Performance of Optimized Design
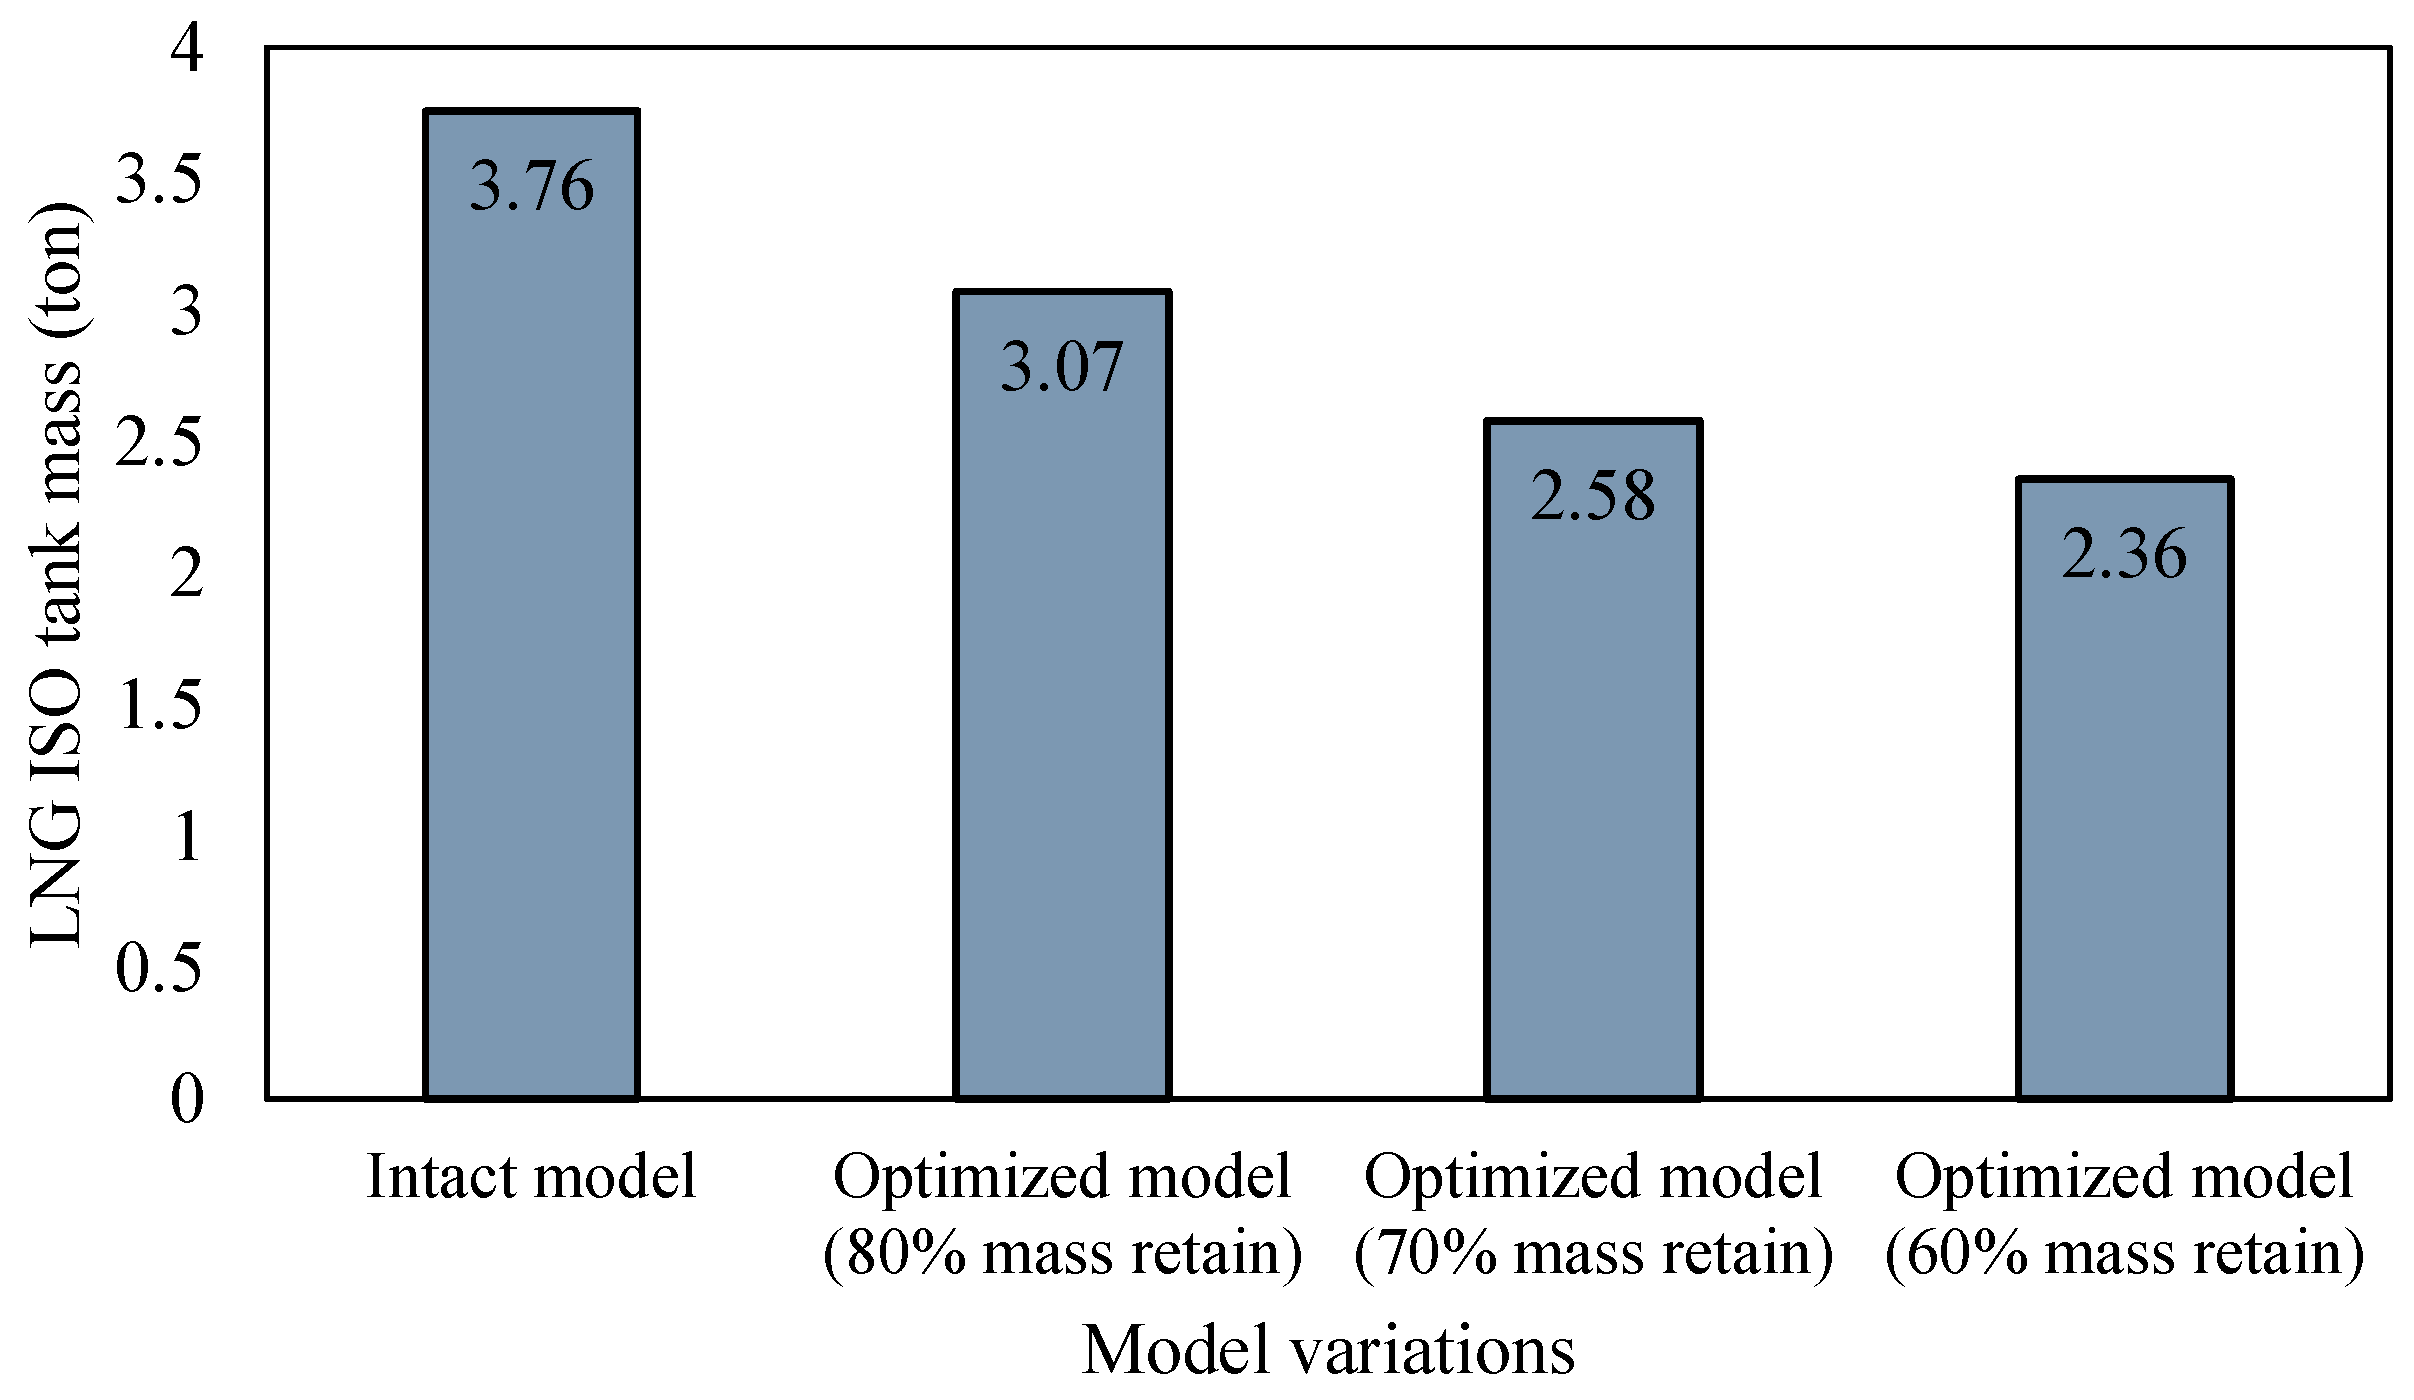
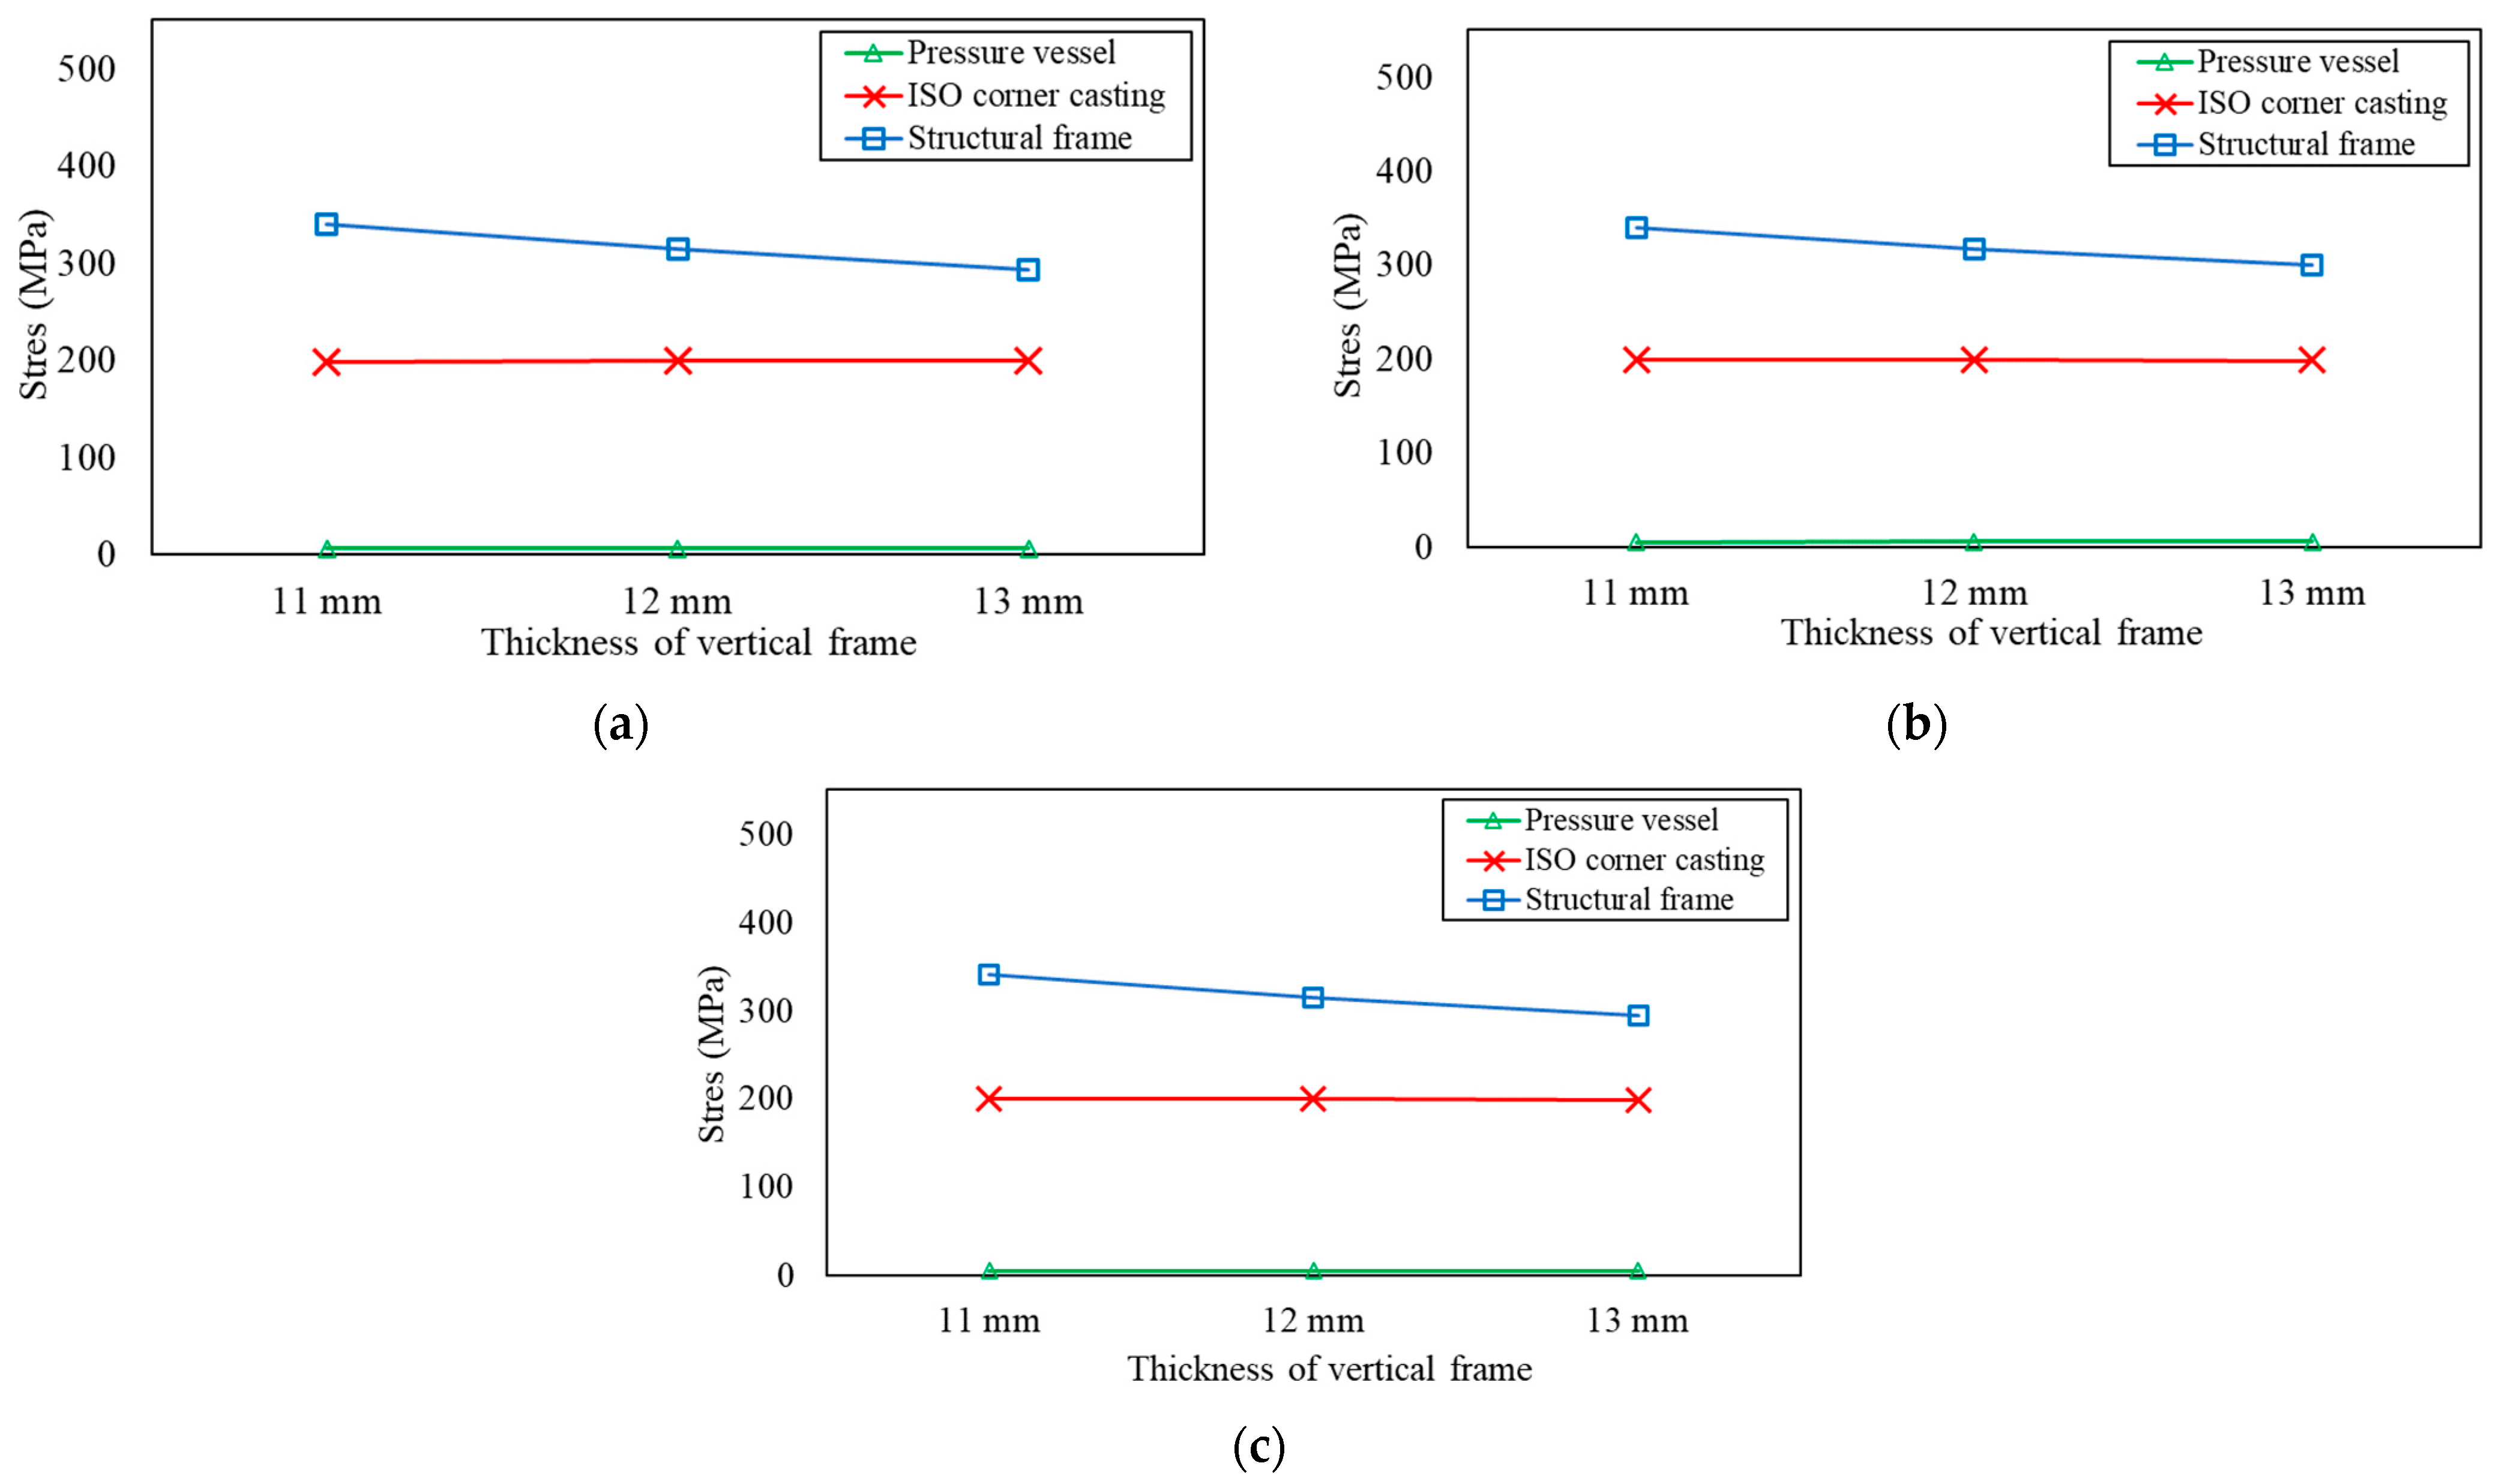
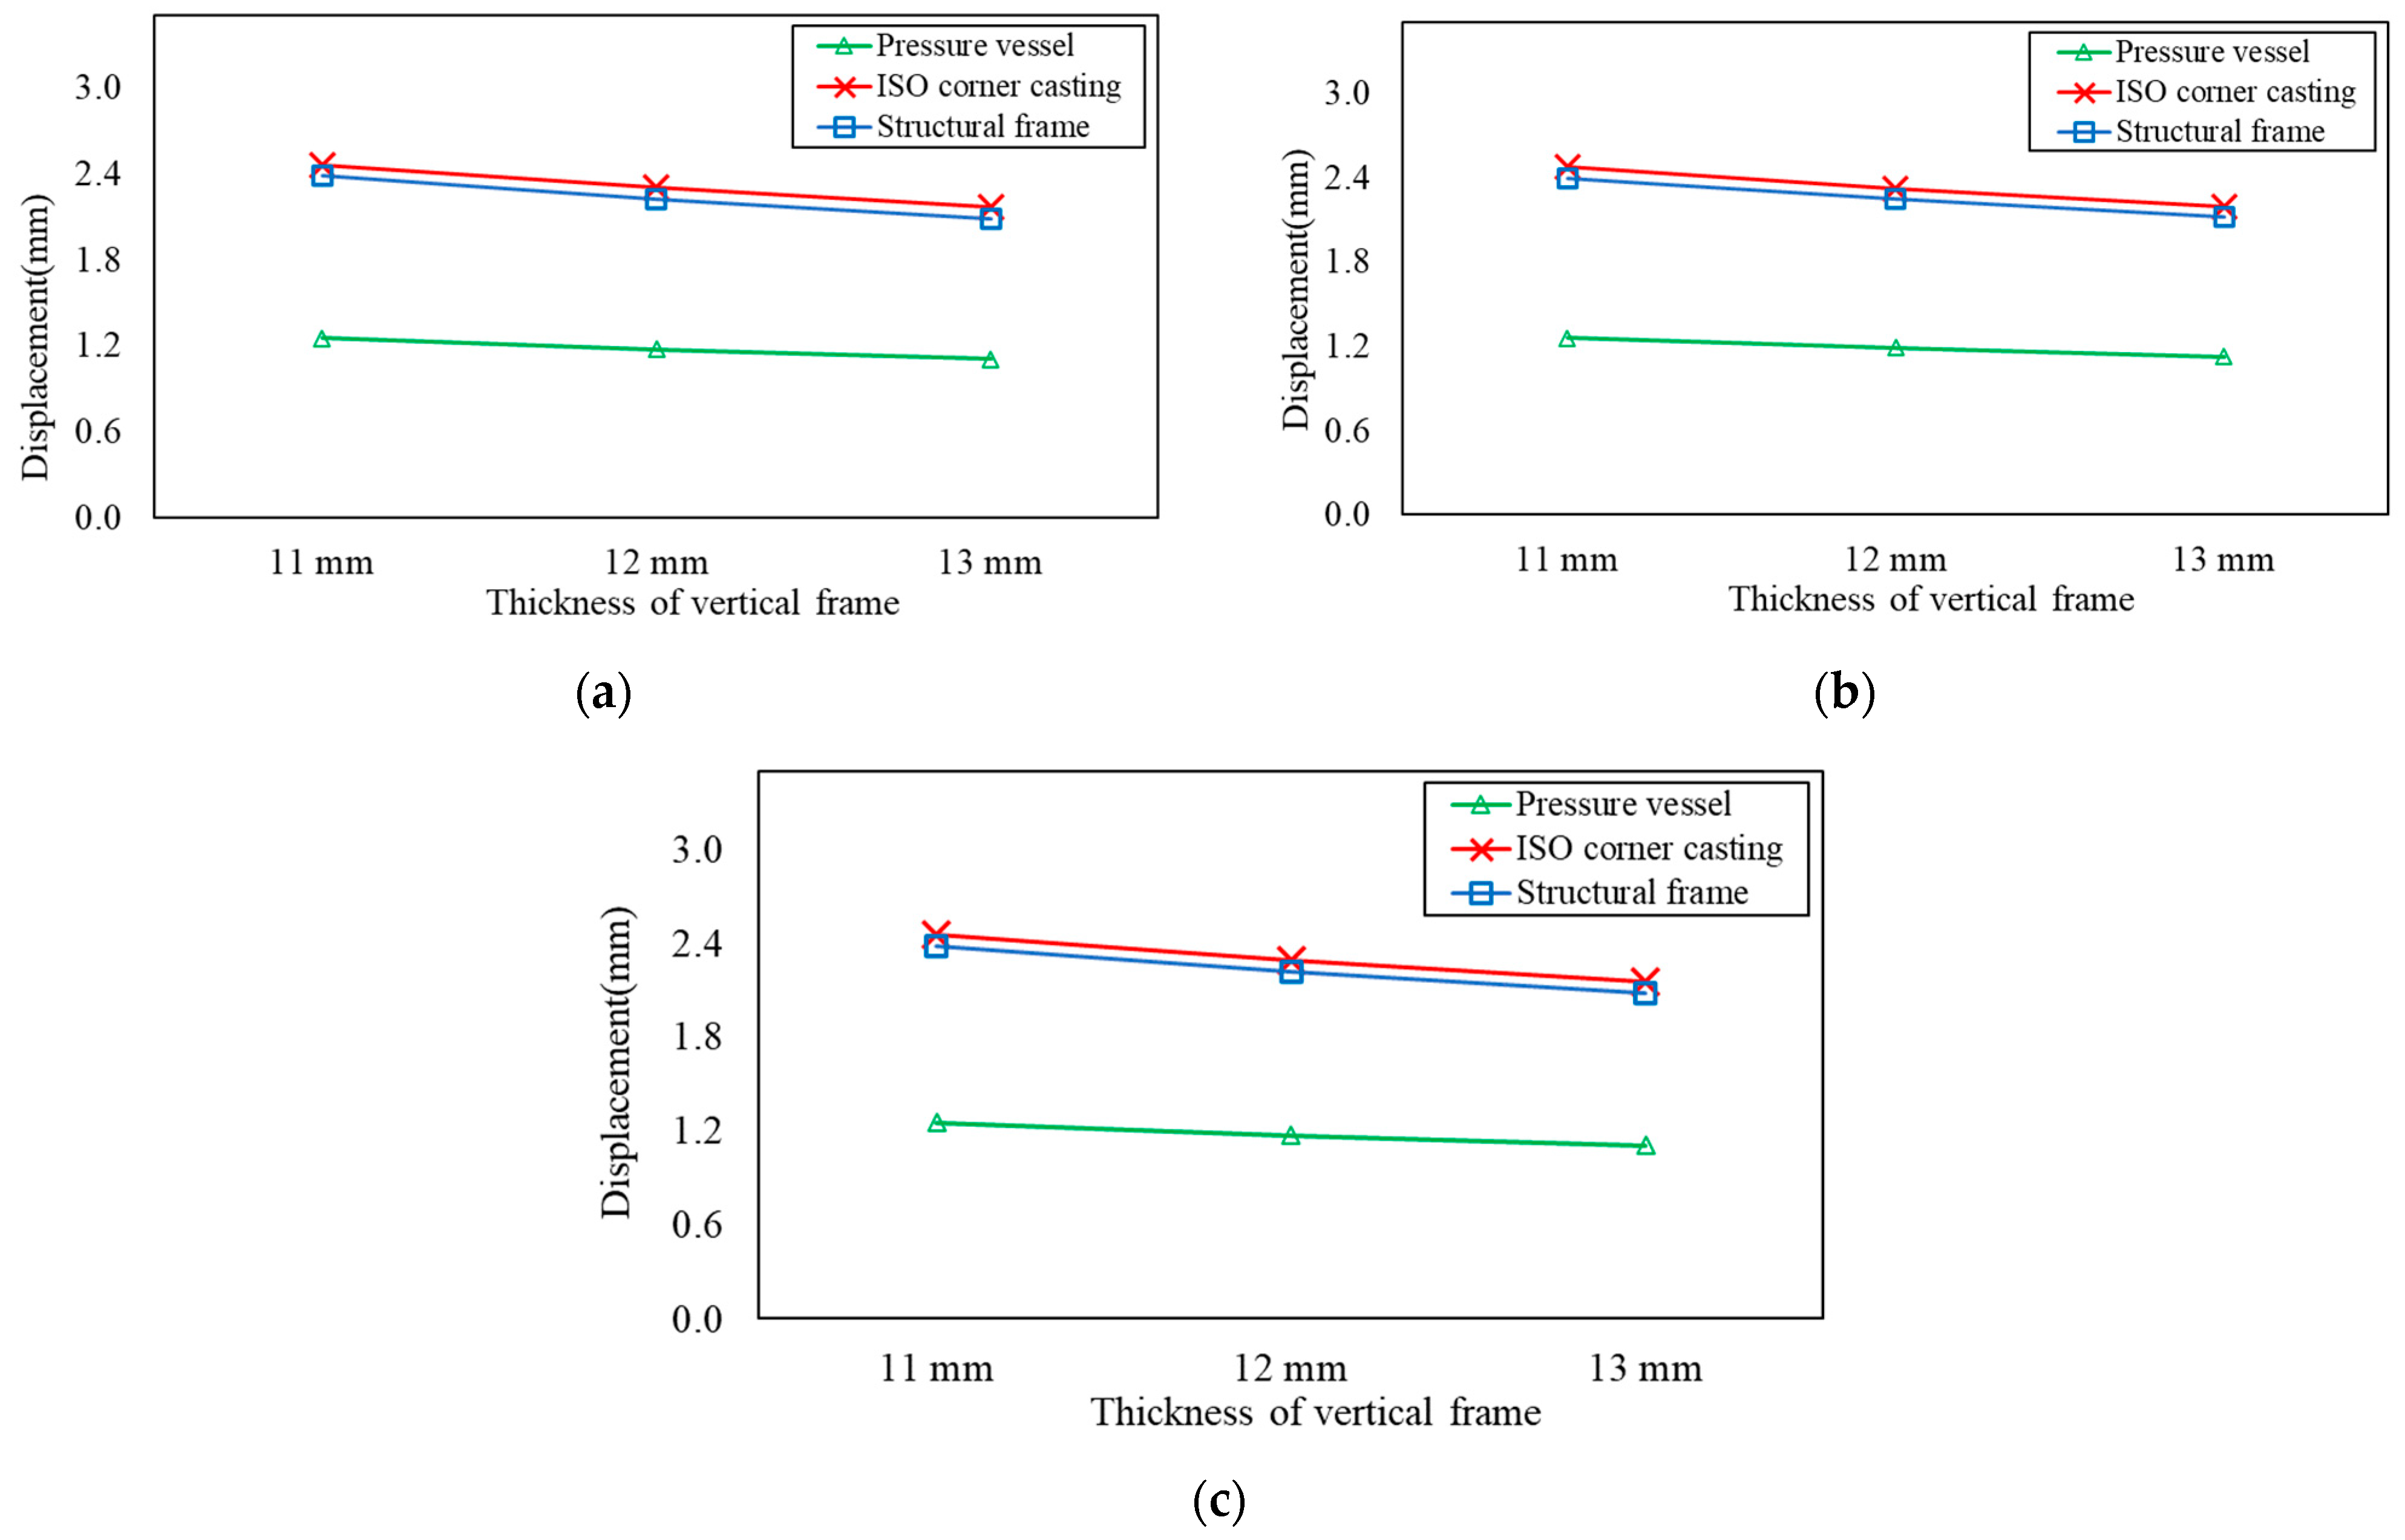
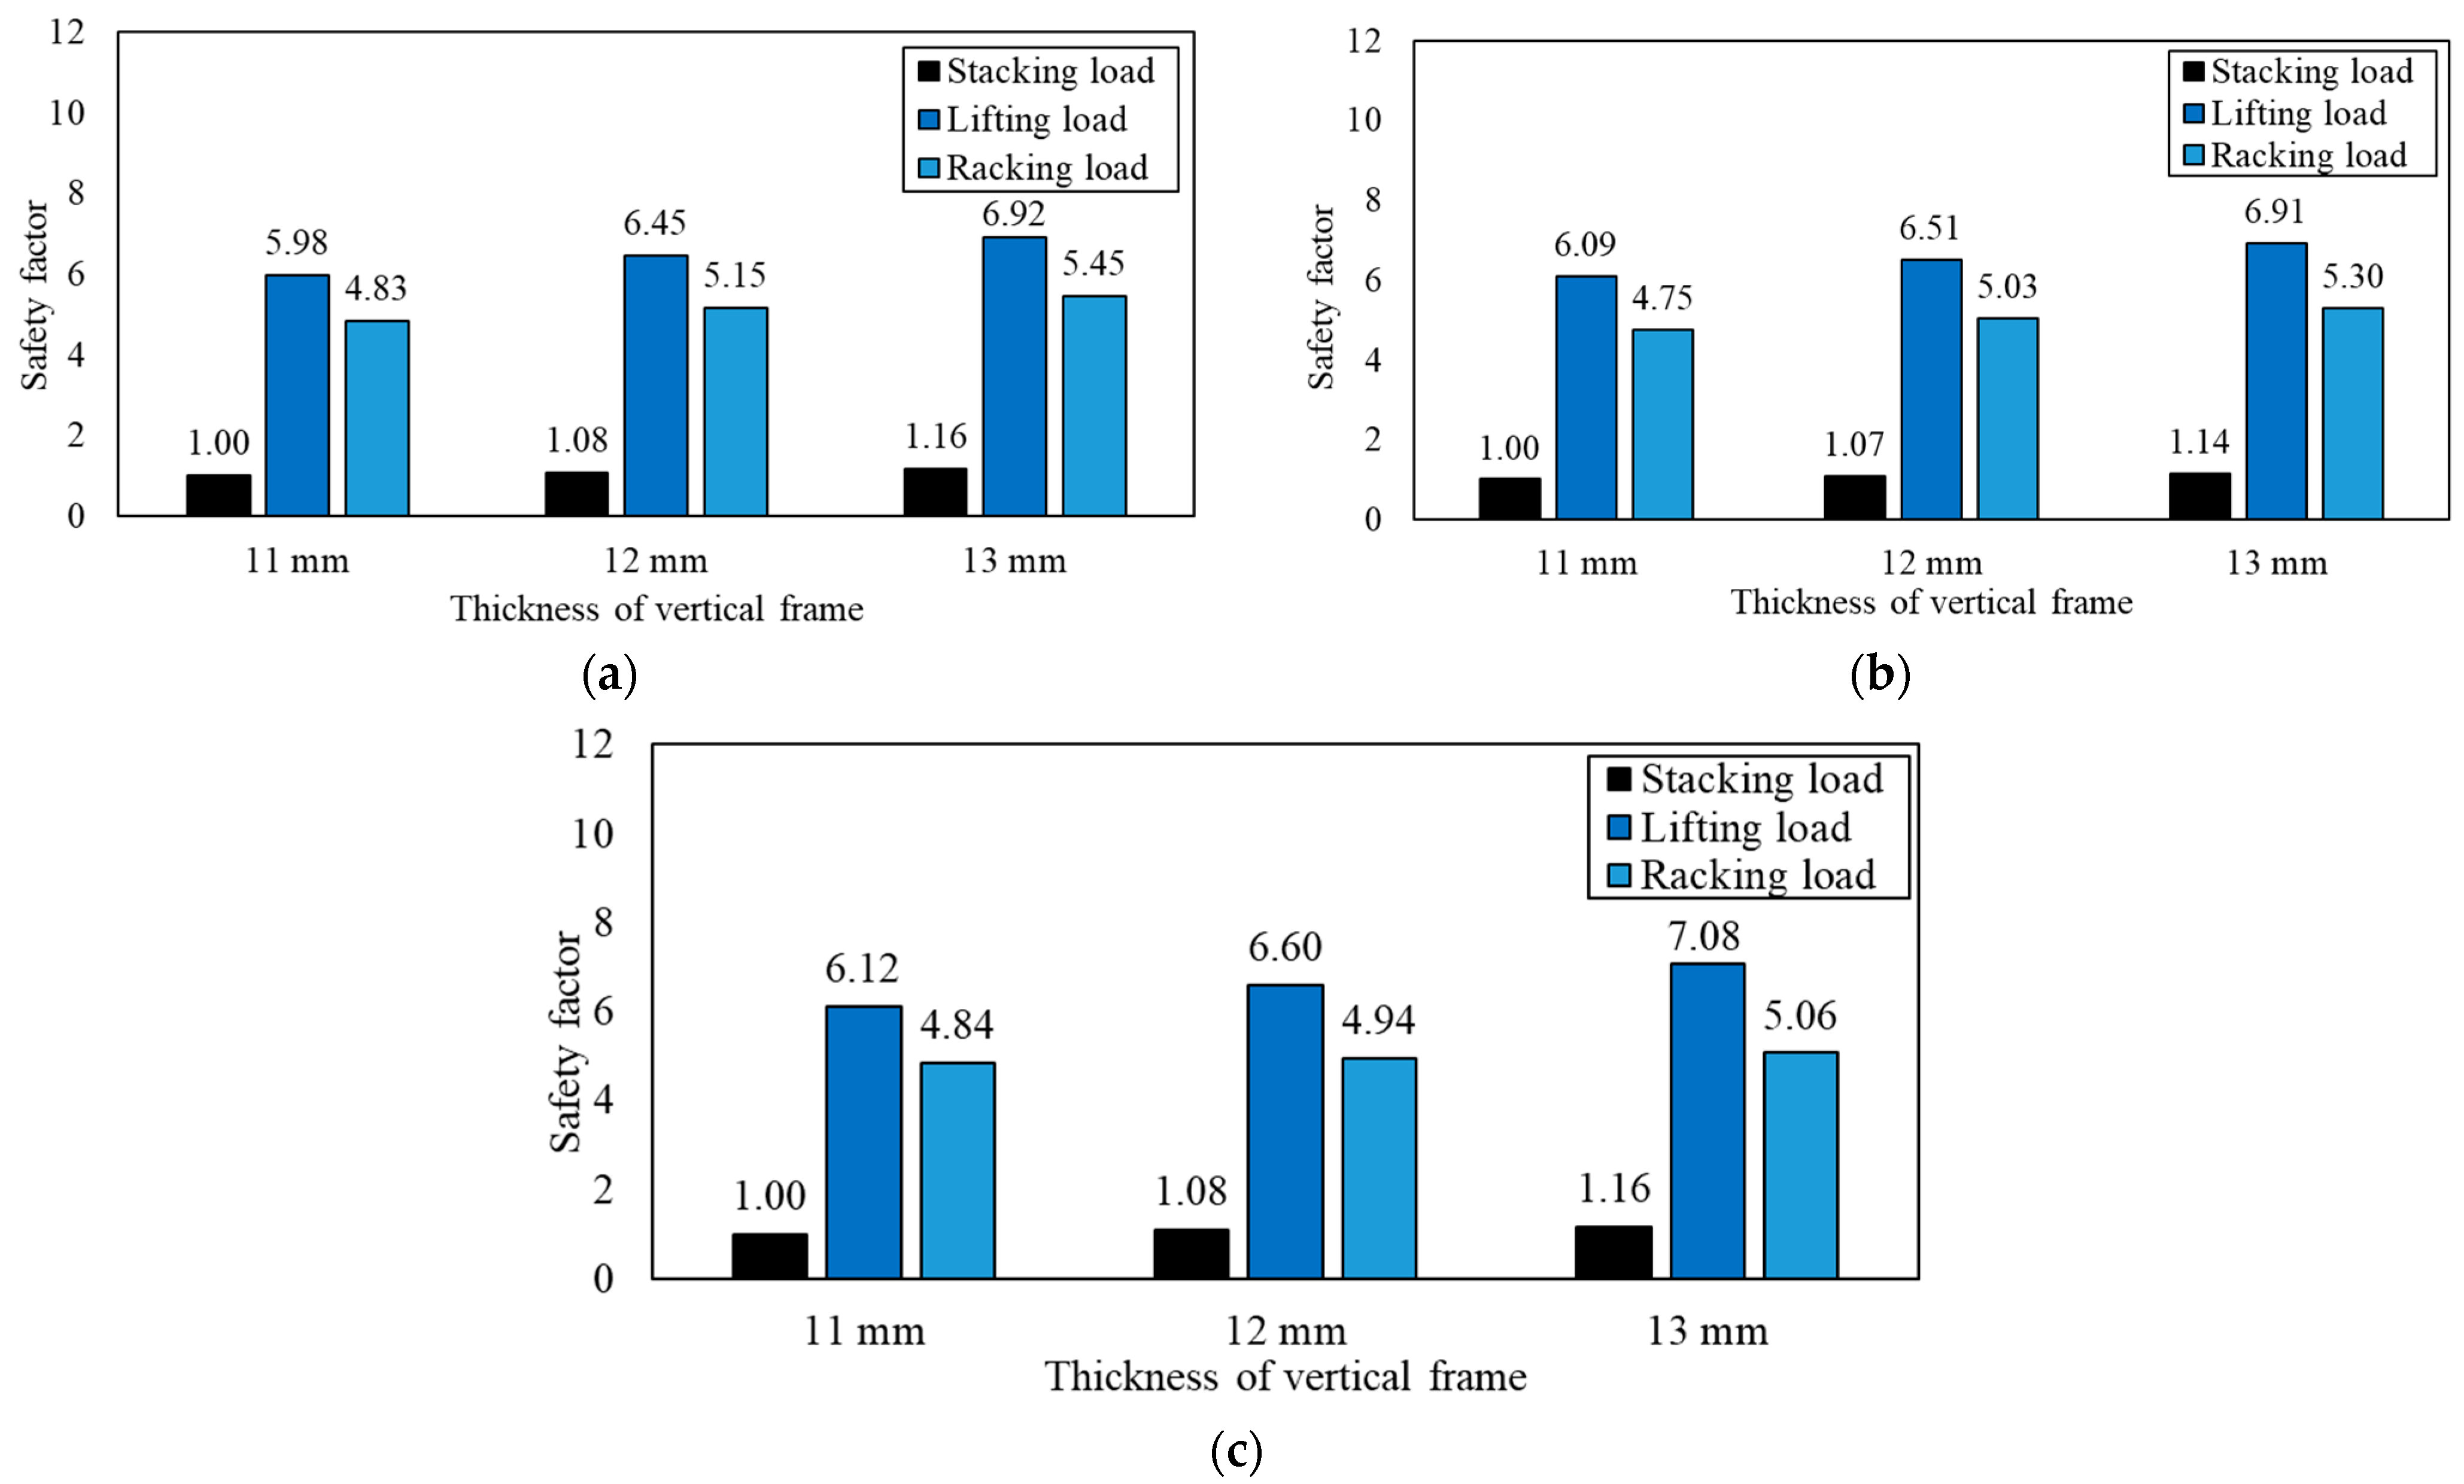
3.4. Structural Performance by Increasing Thickness of Vertical Frame
4. Conclusions
Author Contributions
Funding
Data Availability Statement
Acknowledgments
Conflicts of Interest
References
- Purwanto, W.W.; Muharam, Y.; Pratama, Y.W.; Hartono, D.; Soedirman, H.; Anindhito, R. Status and outlook of natural gas industry development in Indonesia. J. Nat. Gas Sci. Eng. 2016, 29, 55–65. [Google Scholar] [CrossRef]
- Wahyuddin, W. Design of Blowdown Line LNG Filling Station ISO Tank. J. Vocat. Stud. Appl. Res. 2019, 1, 11–16. [Google Scholar] [CrossRef]
- Lee, D.Y.; Jo, J.S.; Nyongesa, A.J.; Lee, W.J. Fatigue Analysis of a 40 ft LNG ISO Tank Container. Materials 2023, 16, 428. [Google Scholar] [CrossRef]
- ASME. ASME Boiler and Pressure Vessel Code Section VIII Division 1; ASME: New York, NY, USA, 2019. [Google Scholar]
- Muttaqie, T.; Sasmito, C.; Iskendar; Kadir, A. Structural Strength Assessment of 20-ft LNG ISO Tank: An Investigation of Finite Element Analysis and ASME Design Guidance. IOP Conf. Ser. Earth Environ. Sci. 2022, 972, 012015. [Google Scholar] [CrossRef]
- Bhattacharyya, R.; Hazra, A. A study on stress analysis of ISO tank container. In Proceedings of the 58th Congress of the Indian Society of Theoretical and Applied Mechanics, Kolkata, India, 18–21 December 2013. [Google Scholar]
- Kim, T.W.; Kim, S.K.; Park, S.B.; Lee, J.M. Design of independent type-B LNG fuel tank: Comparative study between finite element analysis and international guidance. Adv. Mater. Sci. Eng. 2018, 2018, 5734172. [Google Scholar] [CrossRef]
- Wang, B.; Shin, Y.S.; Wang, X. Structural integrity assessment of independent type ‘C’ LNG carriers. In Proceedings of the 33rd International Conference on Ocean, Offshore and Arctic Engineering, San Francisco, CA, USA, 8–13 June 2014. [Google Scholar] [CrossRef]
- Pei, Y.Q.; Lu, S.; Liu, W.H. Structural design and research of type-C independent tank on small scale LNG ship. J. Ship Prod. Des. 2012, 2, 28–34. [Google Scholar]
- Watanabe, M.; Takada, R.; Okafuji, T.; Tsujii, H.; Kashiwagi, M.; Kamitani, Y. Structural design and construction method for “apple-shaped liquefied natural gas cargo tank” for LNG carriers. Mitsubishi Heavy Ind. Tech. Rev. 2016, 53, 11–18. [Google Scholar]
- Wang, Z.; Qian, C. Strength analysis of LNG tank container for trains under inertial force. J. Phys. Conf. Ser. 2020, 1549, 032107. [Google Scholar] [CrossRef]
- Zhaochun, R.; Ying, L.; Chao, H. Stress analysis of LNG tank container. Ref. Chem. Ind. 2018, 29, 42–43. [Google Scholar]
- Paul, P.R.; Chowdary, V.L. Design and Static Analysis of Different Pressure Vessels and Materials Using FEM Method. Int. J. Sci. Res. Eng. Trends 2020, 5, 93–99. [Google Scholar]
- Islam, M.S.; Paul, S.C. Topology Optimization of an Oiltanker Bulkhead Subjected to Hydrostatic Loads. J. Nav. Archit. Mar. Eng. 2021, 18, 207–215. [Google Scholar] [CrossRef]
- Wang, Q.; Chu, G.; Li, S.; Renjie, L. Research on Topology optimization Method for Tanker Structures in Cargo Tank Region. In Proceedings of the TSCF 2016 Shipbuilders Meeting, Busan, Republic of Korea, 26–27 October 2016; pp. 1–18. [Google Scholar]
- Zhang, C.; Zeng, Z.; Ji, C. Structure design of the ship pedestal based on topology optimization. In Proceedings of the VIII International Conference on Computational Methods in Marine Engineering, Göteborg, Sweden, 13–15 May 2019; pp. 754–770. [Google Scholar]
- Kendibilir, A.; Motlagh, P.L.; Kefal, A. Three-Dimensional Topology Optimization for Marine Structure Components Using Non-Local Methods. In Proceedings of the 34th Asian-Pacific Technical Exchange and Advisory Meeting on Marine Structures (TEAM 2020/21), Istanbul, Turkey, 6–8 December 2021. [Google Scholar]
- Pingale, H.; Patel, N. Topology Optimization and Manufacturing Aspects. In Proceedings of the IRAJ International Conference, Pune, India, 15 April 2018; Volume 6, pp. 65–68. [Google Scholar]
- Aribowo, A.; Adhynugraha, M.; Megawanto, F.; Hidayat, A.; Muttaqie, T.; Wandono, F.; Nurrohmad, A.; Chairunnisa; Saraswati, S.; Wiranto, I.; et al. Finite element method on topology optimization applied to laminate composite of fuselage structure. Curved Layer. Struct. 2023, 10, 20220191. [Google Scholar] [CrossRef]
- Kim, H.S.; Kim, H.S.; Park, B.; Lee, K. 3D Topology Optimization of Fixed Offshore Structure and Experimental Validation. J. Ocean Eng. Technol. 2020, 34, 263–271. [Google Scholar] [CrossRef]
- Deng, W.; Tian, X.; Han, X.; Liu, G.; Xie, Y.; Li, Z. Topology optimization of jack-up offshore platform leg structure. Proc. Inst. Mech. Eng. Part M J. Eng. Marit. Environ. 2021, 235, 165–175. [Google Scholar] [CrossRef]
- Nugroho, A.C.P.T.; Sunaryo; Noor, F.M. A Technical Study of Vessel Fleet Requirements for LNG Logistic Systems using ISO Tank Container in the Maluku Region. Wave J. Ilm. Teknol. Marit. 2020, 14, 33–42. [Google Scholar]
- ISO 1496-3:2019-4; Series 1 Freight Containers-Specification and Testing—Part 3: Tank Containers for Liquids Gases and Pressurized Dry Bulk. ISO: Geneva, Switzerland, 2019.
- ASME. ASME Boiler and Pressure Vessel Code Section II Part D Properties; ASME: New York, NY, USA, 2019. [Google Scholar]
- Mansour, W.; Li, W.; Wang, P.; Badawi, M. Experimental and numerical evaluations of the shear performance of recycled aggregate RC beams strengthened using CFRP sheets. Eng. Struct. 2024, 301, 117368. [Google Scholar] [CrossRef]
- Giriunas, K.; Sezen, H.; Dupaix, R. Evaluation, modeling, and analysis of shipping container building structures. Eng. Struct. 2012, 43, 48–57. [Google Scholar] [CrossRef]
- Fahy, M.; Tiernan, S. Finite element analysis of ISO tank containers. J. Mater. Process. Technol. 2001, 119, 293–298. [Google Scholar] [CrossRef]
- Prabowo, A.R.; Laksono, F.B.; Sohn, J.M. Investigation of structural performance subjected to impact loading using finite element approach: Case of ship-container collision. Curved Layer. Struct. 2020, 7, 17–28. [Google Scholar] [CrossRef]
- Purnamasari, D.; Tuswan, T.; Muttaqie, T.; Sandjaja, I.; Machfudin, A.; Rizal, N.; Rahadi, S.; Sasmito, A.; Zakki, A.F.; Mursid, O. Structural assessment of 40 ft mini LNG ISO tank: Effect of structural frame design on the strength performance. Curved Layer. Struct. 2024, 11, 20220219. [Google Scholar] [CrossRef]
- Algarra, G.A.M.; Tovar, A. Integrating topology and shape optimization: A way to reduce weight in structural ship design. Ship Sci. Technol. 2009, 3, 83–92. [Google Scholar]


| Parameter | Value (Unit) |
|---|---|
| Pressure of internal design (Pint) | 1 Mpa |
| Pressure of external design (Pext) | 0.8 Mpa |
| Cylindrical length of inner tank (Lcyl) | 11,018 mm |
| Radius of inner crown (L) | 2218 mm |
| Radius of inner knuckle corner (r) | 221.8 mm |
| Thickness of inner shell (t) | 7.1 mm |
| Thickness of inner head (t) | 11.22 mm |
| Inner tank diameter (D) | 2218 mm |
| Cylindrical length of outer tank (Lcyl) | 11,018 mm |
| Radius of outer crown (L) | 1950.4 mm |
| Radius of outer knuckle corner (r) | 243.8 mm |
| Thickness of outer shell (t) | 3.95 mm |
| Thickness of outer head (t) | 6.28 mm |
| Outer tank diameter (D) | 2438 mm |
| Load Scheme | Load Description | Loading Configuration |
|---|---|---|
| Stacking strength test | F = 942 kN 1.8 R − T = 444 kN 942+ () = 1085 kN | 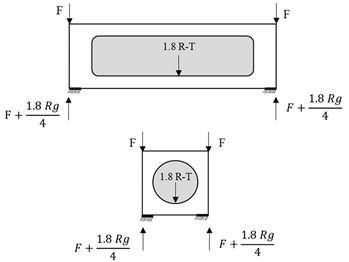 |
| Lifting strength test | 2R − T = 127 kN | 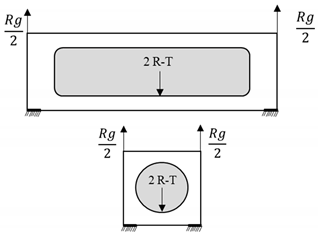 |
| Racking (transverse) test | F = 150 kN |  |
| Materials | Density | Young Modulus | Poisson’s Ratio | Yield Strength |
|---|---|---|---|---|
| ton/mm3 | MPa | - | MPa | |
| Steel frame [26] | 7.85 × 10⁻⁹ | 210,000 | 0.3 | 340 |
| SA240Gr304L-PV [24] | 7.85 × 10⁻⁹ | 193,000 | 0.3 | 175 |
| ISO corner casting [23] | 7.85 × 10⁻⁹ | 215,800 | 0.3 | 275 |
| Carbon steel ASTM A516 [27] | 7.75 × 10⁻⁹ | 200,000 | 0.3 | 248 |
| Load Scenarios | Mass Retained (%) | Von Mises Stress (MPa) | Displacement (mm) | ||||
|---|---|---|---|---|---|---|---|
| Structural Frame | Pressure Vessel | ISO Corner Casting | Structural Frame | Pressure Vessel | ISO Corner Casting | ||
| Stacking | 80 | 368.80 | 5.58 | 198.45 | 2.58 | 1.34 | 2.65 |
| 70 | 368.81 | 5.54 | 198.65 | 2.58 | 1.34 | 2.65 | |
| 60 | 369.59 | 5.51 | 198.89 | 2.57 | 1.34 | 2.65 | |
| Lifting | 80 | 61.86 | 6.30 | 33.28 | 0.43 | 0.45 | 0.45 |
| 70 | 60.69 | 6.24 | 32.69 | 0.42 | 0.45 | 0.44 | |
| 60 | 60.42 | 6.21 | 32.51 | 0.42 | 0.45 | 0.43 | |
| Racking | 80 | 75.66 | 0.41 | 34.08 | 0.98 | 0.49 | 0.74 |
| 70 | 75.67 | 0.41 | 34.09 | 0.98 | 0.49 | 0.74 | |
| 60 | 76.16 | 0.41 | 34.17 | 1.00 | 0.49 | 0.74 | |
| Vertical Frame Thickness (mm) | Mass Retained (%) | Frame Mass (Ton) | Structural Frame | |||||
|---|---|---|---|---|---|---|---|---|
| Stacking Load | Lifting Load | Racking Load | ||||||
| Stress (MPa) | Displacement (mm) | Stress (MPa) | Displacement (mm) | Stress (MPa) | Displacement (mm) | |||
| 10 | 80 | 3.07 | 368.80 | 2.58 | 61.86 | 0.43 | 75.66 | 0.98 |
| 70 | 2.58 | 368.81 | 2.58 | 60.69 | 0.42 | 75.67 | 0.98 | |
| 60 | 2.36 | 369.59 | 2.57 | 60.42 | 0.42 | 76.16 | 0.96 | |
| 11 | 80 | 3.1 | 339.23 | 2.38 | 56.90 | 0.4 | 70.46 | 0.93 |
| 70 | 2.61 | 339.30 | 2.39 | 55.83 | 0.39 | 71.57 | 0.94 | |
| 60 | 2.39 | 340.08 | 2.38 | 55.60 | 0.39 | 70.20 | 0.91 | |
| 12 | 80 | 3.13 | 314.29 | 2.22 | 52.72 | 0.37 | 66.08 | 0.89 |
| 70 | 2.64 | 317.27 | 2.24 | 52.21 | 0.37 | 67.60 | 0.90 | |
| 60 | 2.42 | 315.07 | 2.22 | 51.51 | 0.36 | 68.82 | 0.87 | |
| 13 | 80 | 3.16 | 292.85 | 2.09 | 49.12 | 0.35 | 62.33 | 0.86 |
| 70 | 2.67 | 299.11 | 2.11 | 49.22 | 0.35 | 64.12 | 0.86 | |
| 60 | 2.45 | 293.56 | 2.08 | 47.99 | 0.34 | 67.18 | 0.84 | |
Disclaimer/Publisher’s Note: The statements, opinions and data contained in all publications are solely those of the individual author(s) and contributor(s) and not of MDPI and/or the editor(s). MDPI and/or the editor(s) disclaim responsibility for any injury to people or property resulting from any ideas, methods, instructions or products referred to in the content. |
© 2024 by the authors. Licensee MDPI, Basel, Switzerland. This article is an open access article distributed under the terms and conditions of the Creative Commons Attribution (CC BY) license (https://creativecommons.org/licenses/by/4.0/).
Share and Cite
Tuswan, T.; Andrian, M.; Amiruddin, W.; Muttaqie, T.; Sari, D.P.; Bisri, A.; Yuniati, Y.; Soetarjo, M.; Utina, M.R.; Harmadi, R. Design Improvement Using Topology Optimization for the Structural Frame Design of a 40 Ft LNG ISO Container Tank. Designs 2024, 8, 21. https://doi.org/10.3390/designs8020021
Tuswan T, Andrian M, Amiruddin W, Muttaqie T, Sari DP, Bisri A, Yuniati Y, Soetarjo M, Utina MR, Harmadi R. Design Improvement Using Topology Optimization for the Structural Frame Design of a 40 Ft LNG ISO Container Tank. Designs. 2024; 8(2):21. https://doi.org/10.3390/designs8020021
Chicago/Turabian StyleTuswan, Tuswan, Muhammad Andrian, Wilma Amiruddin, Teguh Muttaqie, Dian Purnama Sari, Ahmad Bisri, Yuniati Yuniati, Meitha Soetarjo, Muhammad Ridwan Utina, and Rudias Harmadi. 2024. "Design Improvement Using Topology Optimization for the Structural Frame Design of a 40 Ft LNG ISO Container Tank" Designs 8, no. 2: 21. https://doi.org/10.3390/designs8020021