Article

Joint Behavior of Full-Scale Precast Concrete Pipe Infrastructure: Experimental and Numerical Analysis

by
Abdul Basit
1,
Safeer Abbas
1,
Muhammad Mubashir Ajmal
2,
Ubaid Ahmad Mughal
1,
Syed Minhaj Saleem Kazmi
3,* and
Muhammad Junaid Munir
3,*
1
Civil Engineering Department, University of Engineering and Technology, Lahore 54890, Pakistan
2
Department of Civil Engineering, University of Sargodha, Sargodha 40162, Pakistan
3
Guangdong Provincial Key Laboratory of Durability for Marine Civil Engineering, Shenzhen University, Shenzhen 518060, China
*
Authors to whom correspondence should be addressed.
Infrastructures 2024, 9(4), 69; https://doi.org/10.3390/infrastructures9040069
Submission received: 1 January 2024 / Revised: 29 February 2024 / Accepted: 2 April 2024 / Published: 3 April 2024

Abstract

:
This study undertakes a comprehensive experimental and numerical analysis of the structural integrity of buried RC sewerage pipes, focusing on the performance of two distinct jointing materials: cement mortar and non-shrinkage grout. Through joint shear tests on full-scale sewer pipes under single point loading conditions, notable effects on the crown and invert of the joint were observed, highlighting the critical vulnerability of these structures to internal and external pressures. Two materials—cement–sand mortar and non-shrinkage grout—were used in RC pipe joints to experimentally evaluate the joint strength of the sewerage pipes. Among the materials tested, cement–sand mortar emerged as the superior choice, demonstrating the ability to sustain higher loads up to 25.60 kN, proving its cost-effectiveness and versatility for use in various locations within RC pipe joints. Conversely, non-shrinkage grout exhibited the lowest ultimate failure load, i.e., 21.50 kN, emphasizing the importance of material selection in enhancing the resilience and durability of urban infrastructure. A 3D finite element (FE) analysis was also employed to assess the effect of various factors on stress distribution and joint deformation. The findings revealed a 10% divergence between the experimental and numerical data regarding the ultimate load capacity of pipe joints, with experimental tests indicating a 25.60 kN ultimate load and numerical simulations showing a 23.27 kN ultimate load. Despite this discrepancy, the close concordance between the two sets of data underscores the utility of numerical simulations in predicting the behavior of pipe joints accurately. This study provides valuable insights into the selection and application of jointing materials in sewerage systems, aiming to improve the structural integrity and longevity of such critical infrastructure.

1. Introduction

Sewer systems, frequently referred to as effluent networks, are crucial to urban environments, serving as the backbone for public health and environmental protection [1]. These extensive networks, spanning thousands of kilometers, are responsible for the efficient conveyance of wastewater to treatment facilities, thereby mitigating the spread of diseases and maintaining sanitary conditions [2]. The critical nature of these systems is highlighted by their vast scale and economic value; for instance, the United States boasts over 2,080,000 km of sewer pipes, representing an asset worth approximately $1 trillion [3]. Similarly, in China, a network of 511,200 km serves around 444 million people, illustrating the global reliance on these infrastructures [4]. Other countries, including Australia, New Zealand, and the United Kingdom, also demonstrate significant investments in sewer networks, reflecting their importance in urban planning and public health [5,6].
Sewer systems depend on a variety of specialized components to efficiently manage wastewater. Pipes are made of PVC, HDPE, concrete, or clay for transporting wastewater, with concrete pipes known for their durability and strength, especially in underground applications. Reinforced concrete (RC) pipes are a cornerstone in these networks due to their strength, durability, and resilience under the harsh conditions of wastewater systems [7]. Particularly in urban and industrial areas, the toughness of RC pipes ensures the durability and reliability of sewer systems [8]. However, the integrity of a sewer network is not only dependent on the durability and strength of individual pipes. The main causes of sewer failures in structural deformations and shortening of service life may also be corrosion and excessive loading. The rough conditions in sewer systems accelerate concrete erosion, and unexpected stresses from construction and traffic increase the pressure on the pipes [9]. Huang et al. [4] investigated the degradation of concrete pipes in urban drainage systems, revealing the correlation between crack characteristics and load-bearing capacity and offering insights into the phases of pipe behavior under various loads and the influence of existing cracks on ultimate failure. Makar et al. [10] revealed that the causes of failure in cast iron water mains are more varied than previously understood, attributing a significant number of annual failures to a range of factors including corrosion, manufacturing flaws, human mistakes, and excessive loading of pipes. The research emphasized the need for a deeper understanding of these failure modes to enhance the reliability of cast iron water mains. Ramadan et al. [11] found that single elliptical (SE) steel wire reinforcement in RC pipes exhibited poorer performance in larger diameters, advocating a reevaluation of SE RCP standards and underscoring the need for additional studies on sewer pipe stability factors.
Song et al. [12] investigated the corrosive effects of hydrogen sulfide on sewer system concrete, emphasizing its role in rebar corrosion and highlighting the crucial involvement of chloride ions in steel corrosion. Their research significantly advances knowledge on sewer system durability, forming effective corrosion prevention strategies. Obropta et al. [13] investigated urban sewer network water quality issues, advocating for the exploration of hybrid models and enhanced model transferability to improve predictions and effectively address identified problems. Zhang et al. [14] conducted lab experiments and finite element analysis to investigate pipe structural failures, finding insights into factors like soil erosion and aging affecting load-bearing capacity. Their work enhances the understanding of RC pipes. Abel [15] investigated the mechanical characteristics of restored pipes through lab tests and finite element analysis, enhancing the understanding of close-fit liners’ potential and aiding in evaluating pipe capacity and strength in diverse technical states. Alzraiee et al. [16] addressed the lack of studies on the performance and expected lifespan of sewer liners rehabilitated using the cured-in-place pipe (CIPP) technique in Quebec. The study conducted destructive testing on liner samples extracted from sewers rehabilitated using CIPP, examining their physical, flexural, and tensile properties. The results revealed that the liners had excellent current structural properties and were expected to have a long lifespan, with deterioration occurring at a low rate as long as the current influencing factors remained stable over time. Zamanian et al. [17] examined the effects of aging on buried sewer pipes, using a 3D finite element model to study the effect of corrosion and external loads. The research stressed the importance of accurately simulating soil interactions and the vulnerability of RC pipes, especially at joints, to internal and external pressures, which can cause sewage leaks and road failures. Proper joint techniques are vital for the durability of the system and to mitigate infrastructure risks [18].
The susceptibility of pipe joints to breakdowns, such as joint failure, can reduce the lifespan of the entire sewer system. Such failures often result from a combination of factors, including the aggressive chemical environment within sewers that accelerates concrete erosion and unexpected stresses from construction activities and traffic loads [19]. Therefore, understanding the behavior of these joints under different conditions is paramount to enhancing the resilience and efficiency of sewer networks.
Sewer pipe connection problems, caused by installation mistakes and low-quality materials, can harm the environment and public health. To improve reliability, there is a need for better predictive models and construction methods. Researchers are studying concrete pipe joints, especially bell-and-spigot joints, to understand how they perform in labs, despite differences from real buried conditions. Garcia et al. [20] conducted real-scale tests on concrete pipes under traffic loads, observing minimal vertical displacement and joint rotation. The research used 3D finite element simulations to study joint behavior in RC pipelines, leveraging data from full-scale lab tests.
Rakitin et al. and Sheldon et al. [21,22] tested jointed RC pipelines under load, noting that vertical movements stabilized after several cycles with minimal joint rotation. Balkaya et al. [23] performed a 3D FEA on an underground PVC pipeline to study stress and deformation, focusing on the performance of gasketed joints and the risk of RC pipe failure due to cracking and corrosion.
Despite extensive studies focusing on the structural integrity, design, application, and durability of reinforced concrete (RC) pipes, there remains a significant gap in understanding the optimal performance of jointing materials, particularly under single point loading conditions. Existing literature often overlooks the detailed behavior of RC sewer pipe joints, especially when filled with binding materials and subjected to these specific loading conditions. This study aims to address a critical gap in current research by evaluating the shear behavior of joints in full-scale precast reinforced concrete (RC) pipes using two distinct materials: cement mortar and non-shrinkage grout, under single-point loading conditions. This approach, combined with three-dimensional numerical simulation, is expected to contribute novel insights into the behavior and effectiveness of these jointing materials in RC pipes.

2. Materials and Methodology

2.1. Materials

In this study, the joint behavior of precast RC pipes was examined using two distinct locally procured materials: commercially available non-shrinkage grout and ordinary portland cement (OPC). The cement mortar was prepared following a precise 1:2 ratio of cement to Lawrencepur sand, a well-regarded aggregate known for its consistent quality and suitability for high-strength mortar mixes. The mixture was further optimized by maintaining a water-to-cement (w/c) ratio of 0.4, a decision grounded in established practices to balance workability with strength. To evaluate the performance of the mortar, particularly its compressive strength at the critical 28-day mark—a standard benchmark for cement-based materials—50 mm cubic specimens were cast. These specimens were then subjected to a controlled water-curing process, a method chosen for its effectiveness in simulating optimal hydration conditions and promoting strength development.
The outcomes of these tests were both promising and consistent, with the mortar achieving an average compressive strength of 19.7 MPa. This result not only demonstrates the robustness of the mixture but also its reliability, as evidenced by a coefficient of variation (COV) of just 2.9%. These findings align with the guidelines set forth by ASTM C109 [24].
The chemical properties of sand and ordinary portland cement constituents are detailed in Table 1. A similar methodology was applied to evaluate the compressive strength of non-shrinkage grout, where 50 mm cubes were prepared with a 40% water addition by weight. This resulted in an average compressive strength of 20.1 MPa and a COV of 1.5%.
Despite the primary focus on precast concrete pipes, the necessity of a parallel investigation into the inherent compressive strength of concrete was also recognized. To this end, concrete cylinders were produced, following the exact mix design utilized for the precast pipes. This design was carefully formulated to include 1 part cement, 2 parts Chenab sand, and 4 parts Sargodha crush, a composition chosen for its proven effectiveness in achieving desired mechanical properties. The resulting concrete mix not only adhered to the specifications but also demonstrated a commendable average compressive strength of 27.5 MPa. This strength indicator, coupled with a coefficient of variation (COV) of 3.9%, reflects both the strength and the consistency of the mix, aligning with the standards set forth in ASTM C39 [25], which outlines the methodology for testing the compressive strength of cylindrical concrete specimens.
Furthermore, the structural integrity of the precast pipes was reinforced through the incorporation of both longitudinal and transverse reinforcement bars, each with a diameter of 4 mm. The selection of reinforcement material and design was in strict compliance with ASTM A615 [26]. Through testing, the reinforcement bars exhibited an average yield strength of 260 MPa and an ultimate strength of 380 MPa. The low coefficients of variation, 2.7% for yield strength and 2.2% for ultimate strength, underscore the high degree of reliability and predictability in the material performance.

2.2. Casting of Pipes

The manufacturing of precast concrete pipes (PCP) was diligently carried out at a modern industrial facility, adhering to precise full-scale dimensions, i.e., 450 mm in diameter and 2400 mm in length. The concrete mix utilized ordinary portland cement, fine aggregate (Chenab sand with a fineness modulus of 2.3), well graded locally procured coarse aggregate (Sargodha crush, Sargodha Pakistan) with a nominal maximum size of 12.5 mm, and potable water. The reinforcement included six longitudinal steel rebars of 4 mm diameter, complemented by circumferential bars of the same diameter, spaced 82 mm center to center.
The mixing process employed a tilting drum-type mixer, with components measured accurately by weight. Initially, the rotating mixer was loaded with half of the coarse aggregate, followed by the addition of the fine aggregate. Then, the remaining coarse aggregate and cement were incorporated. The process concluded with the introduction of water, spanning a duration of about 5 min. The resulting concrete was then conveyed to the pipe casting area and manually filled into rotating molds using shovels, achieving a slump of about 25 mm.
Figure 1 illustrates the essential structural features of a concrete pipe, highlighting critical areas including the invert (the lowest point inside the pipe), the obvert (the highest interior point), and the spring lines (the points where the pipe walls start to curve). Moving forward, Figure 2 offers a comprehensive visual guide through the entire production process of precast concrete pipes (PCPs), from the initial mixing of materials to the final stages of curing. Additionally, the precise concrete mix design utilized in the manufacturing of PCPs is specified in Table 2.
The steel reinforcement, delivered in coil form, was straightened and cut to the required lengths. Circular rings were then formed from the steel bars using a bending machine to reinforce the circumference of the pipe. These rings were systematically welded to the longitudinal bars, creating a robust steel framework that provided substantial support against bending and evenly distributed the load throughout the structure. This meticulous assembly ensured enhanced strength and durability for the precast concrete pipes.
Spacer bars were incorporated into the steel framework to maintain a gap between the reinforcing cage and the interior of the surface mold. The casting of RC pipes utilized steel molds, which were pre-coated with oil to facilitate easier demolding. Once the steel cage was securely positioned inside, the mold was set on rollers to initiate rotation. During the initial phase of casting, the mold rotated slowly, typically at 160 to 180 revolutions per minute, to allow the concrete mix to adhere and build up to the desired wall thickness, usually achieved within 5 min.
As the wall reached the requisite thickness, the rotation speed increased to approximately 250 rpm for an additional 5 min to enhance compaction. A steel rod was employed throughout to maintain uniform wall thickness and eliminate any surplus concrete. The rotation of the mold generated centrifugal force, pressing the concrete against the mold walls, thereby increasing its density and structural integrity. This rotation phase continued for approximately 10 min. Following this, the inner surface of the pipe was coated with a sealant and manually smoothed to achieve a polished finish.
Once the rotation stopped, the molds were taken off the rollers and set aside to rest. The pipes were then demolded after a 24 h setting period and placed in a water pond for curing. This curing process, lasting 28 days, was essential to attaining the optimal strength and durability of the finished pipes.
For the study, two full-scale precast RC pipes were manufactured specifically for testing. Each pipe featured an internal diameter of 228 mm and a wall thickness of 25 mm, extending to a total length of 2.44 m. One end of each pipe was designed with an enlarged diameter to accommodate the joint. The pipes were distinct in their reinforcement details, as outlined in Table 3. The concrete used in casting these full-scale pipes had a compressive strength of approximately 30 MPa, measured at 28 days post-casting.

2.3. Test Procedure and Methodology

The investigation of the joint behavior of RC pipes utilizing various jointing materials was conducted via a joint shear test, adhering to ASTM C497 standards [27]. The experimental setup for the joint shear test is detailed in Figure 3. Figure 4 depicts the schematic diagram of the joint shear test, with three supports strategically placed during the test: two at extreme ends and one near the joint below the bell. A single-point load was applied near the joint to simulate realistic conditions.
The precast pipe assembly was positioned on three reaction frames, each comprising two long, stiff 125 × 125 mm wooden beams and two long steel 8 × 125 mm plates. Steel rods were utilized to secure the pipe within this frame. Timber blocks were placed under each reaction frame to provide additional support. A rubber pad was introduced between the curved face of the pipe and the timber cradle block to ensure uniform load distribution. Rubber pad was also reported elsewhere [28] for uniform distribution of loading and remove any irregularities on the top surface.
To facilitate testing of joints located within 25 mm of the bell, one reaction frame was employed to affix the assembly, necessitating two additional frames for pipe elevation. A point load was applied to the pipe joints at a rate of 0.5 mm/min using a hydraulic jack mechanism, with a stiff wooden beam incorporating an elastic pad acting as the upper bearing. A load cell was placed between the loading jack and the steel beam to monitor applied loads, with the steel I section linked to a steel beam for load transmission.
Four 50 mm linear variable differential transformers (LVDTs) were affixed to the joints of the pipe to measure both vertical and horizontal pipe movements under loading. Additionally, two LVDTs were utilized to gauge the vertical displacement of the crown at the joint. An automated data-acquisition system was employed to consistently record data throughout the testing procedure, with all LVDTs and the load cell connected to a data logger. Real-time load and deflection values were displayed on a computer screen.
For crack formation and propagation analysis, pipe specimens were appropriately marked. Crack width was assessed using a graduated ruler specifically designed for this purpose. The force was incrementally increased until either the joint could no longer bear it or signs of failure, such as a decrease in the applied load or the concrete beginning to fracture, were observed. The maximum force was applied for a minimum of one minute to accurately assess joint strength and flexibility.

2.4. Finite Element Analysis

2.4.1. Modeling Technique

A numerical analysis was conducted to simulate the joint shear test on precast RC pipes using a three-dimensional finite element model. The analysis employed the commercially available finite element software ANSYS APDL 15.0 [29,30,31,32]. Various techniques have been utilized in past studies to analyze the structural response of pipe joints numerically, with the choice of technique depending on the desired accuracy in predicting failure mechanisms. These include detailed micro-modeling, macro-modeling, and simplified micro-modeling.
Detailed micro-modeling is particularly useful for analyzing a comprehensive range of failure mechanisms. In this approach, mortar and pipe joints are treated as continuum elements with specific failure criteria, while the pipe joint interface is modeled using distinct elements to represent discontinuities. This method involves modeling each part of the pipe, including the bell and spigot, mortar, and their interfaces, separately with their characteristics, leading to longer data processing times due to the complexity and detail of the model.
In contrast, macro modeling considers the entire pipe joint as a homogeneous element, simplifying the mesh to match that of concrete and assigning characteristics to the pipe as a whole rather than to the mortar and joint separately. This method is favored for its shorter data processing time but is generally less accurate. It is typically used where high precision is not paramount, such as in larger structures.
Simplified micro-modeling maintains the overall geometry of the pipe with the steel cage, as in comprehensive micro-modeling. However, it models mortar joints and interface elements as distinct elements to represent the contact area. The compressive and shear stress properties are assigned to the mortar using spring elements, while joint mortar bond contact elements are utilized for the interface. This technique strikes a balance between accuracy and processing time, being less time-consuming than detailed micro-modeling.
In this investigation, following prior research suggestions, a simplified micro-modeling approach was employed [33,34].

2.4.2. Elements Used for Modeling

The modeling of reinforced concrete and steel units utilized three-dimensional hexahedral elements, each with eight nodes and three degrees of freedom, enabling translational movement along the x, y, and z axes in ANSYS. For simulating the behavior of reinforced concrete, the SOLID65 element was used, known for its ability to model compression crushing and tension cracking, with reinforcement rebar distributed throughout. The steel rebar itself was represented by the LINK180 element, designed for uniaxial tension-compression with three degrees of freedom at each node.
The cement sand mortar and non-shrinkage grout were modeled using a pair of nonlinear spring elements (COMBIN39) and contact elements (CONTA178) arranged sequentially with the spring elements, as illustrated in Figure 5 [35,36,37]. This modeling considers both the material properties and the interaction between the mortar and adjoining pipe structures. The finite element model incorporates these two primary types of elements to accurately depict the behavior of the mortar joint:
1. Nonlinear Spring Elements (COMBIN39): These elements are utilized to simulate the axial and shear behavior of the cement–sand mortar. COMBIN39 is a unidirectional element that provides nonlinear force-deflection characteristics, making it suitable for a broad range of analyses. It offers both linear and rotational capabilities, accommodating three degrees of freedom at every node, which correspond to movements in the x, y, and z directions. This element is particularly adept at handling large displacements, supporting either two or three degrees of freedom at each node, thus enabling the accurate simulation of structures under significant deformation.
2. Contact Element (CONTA178): This element is used to model the bond between the mortar and the adjoining brick or pipe. CONTA178 facilitates contact and sliding interactions between any pair of nodes, equipped with two nodes each having three degrees of freedom for translations along the x, y, and z axes. It handles compression along the normal direction of contact and exhibits Coulomb friction in the tangential direction, enabling accurate simulations of contact and sliding behaviors. The element also supports user-defined friction and interaction, offering flexibility for various modeling scenarios.
This comprehensive modeling approach aimed to accurately simulate the behavior of the precast RC pipe joints under shear stress, contributing valuable insights into their structural integrity.
The nonlinear springs in the model are designed to simulate the shear and axial behaviors of mortar, and the contact element simulates the bonding interaction between the mortar and joint, incorporating frictional effects. The characteristics of both the spring and contact elements were derived from the material properties, with the force-deflection relationship established based on the stress–strain curve of the material. Here, the force is calculated by multiplying the stress with the area contributing to each node, and deflection is determined by the product of strain and the spring length, which is configured to be 90% of the thickness of the joint. Conversely, the length of the contact element is set at 10% of the thickness of the joint. The properties of finite element analysis are defined in Table 4.

2.4.3. Constitutive Models

The constitutive relationships utilized in the numerical simulation were sourced from various studies. Specifically, for concrete pipes, the tension and compression models proposed by Hordijk and Thorenfeldt [38], respectively, were employed. Meanwhile, the constitutive model for cement–sand mortar was adopted from Cambell’s research [39]. The implementation of these models necessitated a thorough examination of the fundamental stress–strain relationships for both concrete and cement–sand mortar, as depicted in Figure 6.
In tension, the cement–sand mortar exhibits a linear-elastic response until the stress reaches 1/10 of its peak compressive strength, maintaining the same initial modulus of elasticity observed in compression. Beyond this threshold, the material transitions to perfect plastic deformation. Regarding the tensile behavior of mortar, it follows a linear-elastic trajectory until the stress equals 1/10 of its peak compressive strength, utilizing the same initial elastic modulus as in compression. Upon surpassing this level, the material undergoes perfect plastic deformation. Due to limited data on the shear stress–strain response of mortar, it is approximated in proportion to the compression curve. The maximum shear strength is set at 1/10 of the highest compressive strength, beyond which the response transitions to ideal plastic behavior.

2.4.4. Simulation of RC Pipes

The pipe elements in the study were meshed using a sweep meshing technique with a smart size setting at fine level 2. This approach ensured a detailed and efficient representation of the geometry for the finite element analysis, optimizing the balance between accuracy and computational resource requirements. Figure 7 illustrates the numerical model of pipes for the joint shear test as well as the meshing of steel reinforcement. In the model, nodes at the pipe joints were linked using a combination of two parallel spring elements and a series contact element to simulate the binding material joint and the interaction between the joint and mortar. The spring elements were allocated properties to reflect the longitudinal and transversal behaviors of mortar, whereas the contact elements were given properties related to the characteristics of mortar and friction to depict the bond between the joint and mortar. The concrete component of the pipes was represented using the SOLID65 element, with the steel reinforcement incorporated into the concrete modeled via the LINK180 element.

3. Results and Discussion

3.1. Experimental Results

3.1.1. Load Deflection Curve

The load versus deflection curves for each pipe, differentiated by jointing materials, are illustrated in Figure 8. These curves can be categorized into three distinct stages, reflecting the progressive response of the pipe joints to increasing loads. The initial stage is the linear elastic stage, where the internal pore structure of the pipe joint compresses and closes further as the load is applied. During this phase, the pipe specimens exhibit a proportional increase in deflection with the applied load, characteristic of elastic behavior.
As the load continues to increase, the specimens transition from the linear elastic stage to the plastic damage stage. This second stage is marked by the appearance of hairline cracks near the loading zone and at the anchorage points of the pipes. With further load increments, the number and width of these cracks increase, reaching up to the peak load. The slope of the load-deflection curve initially increases up to this peak load, indicating a buildup of internal stresses, and then continuously decreases, signifying a significant reduction in the stiffness of the pipe joint. Near the peak load, a rapid expansion and intersection of cracks occur, forming longer and more pronounced fractures.
After the peak load, the curve enters a descending branch, characterized by a continuous decrease in load with increased vertical deflection. This stage is indicative of the deteriorating structural integrity of the pipe joint, with an increased number and spread of cracks, particularly near the loading zones, pipe bell, and joint location. The descending branch reflects the inability of the material to sustain further load, leading to a gradual failure [40].
The peak and ultimate behaviors of the pipes denote different phases of the joint response. The peak behavior encapsulates the initial reaction of the joint to applied loads, including elastic deformation, yielding, and other potentially reversible deformations. In contrast, the ultimate behavior represents the response of the joint under extreme load levels, often culminating in irreversible deformations or complete structural failure.
The load-deflection curves of the shear joint test, as depicted in the figure, are divided into ascending, yielding, and descending parts. This graphical representation provides a clear visualization of the applied vertical shear load versus the corresponding vertical deflection at a specific location, six inches away from the bell, highlighting the critical stages of joint behavior under shear stress.
In the comparative analysis of two individual tests using different jointing materials, the responses at the upper sides of the pipe joints were distinctly marked by black lines for cement–sand mortar and red lines for non-shrinkage grout. The cement
Initially, both materials exhibited a linear ascending portion in the load-deflection curve, with crack initiation occurring at a load of around 21 kN for the cement–sand mortar, a value higher than that observed for the non-shrinkage grout, as detailed in Table 5.
As the load increased, more cracks formed in the joints, and cracks widened, leading to elevated stresses (Figure 9 and Figure 10). The load was then transferred to the reinforced steel bar at the crack location, continuing until the steel yielded at a load of 23 kN. The stresses in the joints intensified, culminating in a peak load of 25.59 kN. Following this peak, the curve entered a descending branch, marking the progression towards complete joint failure. The commercial non-shrinkage grout, in comparison, demonstrated a lower load-bearing capacity, i.e., 21.5 kN, and a higher propensity for cracking, with crack initiation points closely clustered. Additionally, the yielding points for this material were observed to be lower than those of the cement–sand mixture.
In comparing both materials, cement–sand mortar emerged as the superior option for jointing material. The denser composition of cement–sand mortar, achieved through a higher ratio of cement to sand, typically results in higher pipe joint strength. This increased strength not only enhanced its load-bearing capacity but also contributed to superior bonding properties. Cement–sand mortar is specifically engineered to adhere effectively to various surfaces, including concrete, forming a strong bond facilitated by the hydration process of cement. Conversely, non-shrinkage grout, designed primarily for void filling and structural support, places less emphasis on achieving high joint strength. Therefore, in applications necessitating both substantial compressive strength and reliable bonding, cement–sand mortar stood out as the preferred jointing material in RC pipes.
The descending portion of the curve reflects the relative flexibility of the RC joints during the peak load phase. The failure pattern was predominantly influenced by the steel reinforcement cage. The yielding of the reinforced steel within the concrete contributed significantly to the capacity of the joint to resist deformation under stress, thereby enhancing energy absorption. As the joints approached peak load, micro-cracks began to develop, reducing the stiffness of the joint materials and increasing the rate of deformation [41].
The use of different jointing materials, despite no variation in pipe thickness and diameter, led to non-uniform damage progression on the bell or joint, causing divergent responses at the joints. To summarize the shear joint test results for all materials, the first crack load is identified as the point where the initial elastic slope of the load-deflection plot ends, while the peak load represents the maximum load observed in the curve.
Specifically, the load corresponding to the first crack initiation for the cement–sand mortar in the RC joint was approximately 22% higher than that for the non-shrinkage grout. Additionally, the cement–sand mortar joints exhibited around 7% higher deflection than the non-shrinkage grout at the cracking load. In terms of crack width, the initial cracks in the cement–sand mortar joints were less than 0.19 mm (0.007 in) on average when the initial slope of the load changed. Conversely, the non-shrinkage grout exhibited an increase in crack width, with an average of 0.22 mm (0.009 in) observed at the end of the linear slope of the load-deflection plot. These differences highlight the varying performance characteristics and structural responses of the two jointing materials under load.

3.1.2. Pipe Joint Behavior

The study of crack shapes and patterns played a crucial role in understanding the evolution of fractures in the reinforced concrete pipes under examination [42]. During the elastic stage of the joint shear test, the tested pipes exhibited elastic deformation, accompanied by the development of internal micro-cracks within the joint material. Notably, no hairline cracks were visible on the surface of the pipe and joint material during the initial linear stage of loading [43]. Figure 9 illustrates the evolution of hairline crack patterns measured in the RC sewer pipe under the joint shear test.
As the load on the structure progressively increased, initial signs of distress manifested as hairline cracks at locations critically affected by bending and shear stresses. Specifically, in instances where non-shrinkage grout was utilized, the emergence of these cracks was first noted at the mid-support and bell sections adjacent to the pipe joint (Figure 9a). This initial cracking is particularly significant as it signals the points of maximum stress concentration where the material begins to fail under the applied load.
In contrast, when cement–sand mortar was employed, the initial cracks made their appearance at similarly critical sections of the pipe joint. However, these cracks exhibited a distinct pattern, propagating in an inclined direction downward at approximately 42–60 degrees from their point of origin (Figure 9b). This propagation pattern is indicative of the directional stresses impacting the structure, highlighting the different ways materials respond under load.
Upon further increasing the load, additional cracks began to appear at other structurally significant points, such as the spigot and directly at the load application point. The development of these cracks can primarily be attributed to bending stress, although some cracks also formed at an angle within the shear joint area, suggesting a complex interplay of bending and shear stresses. The critical juncture at which these cracks began to form is a direct result of the tensile forces induced by the increasing load exceeding the tensile strength of the concrete. This moment of initiation is crucial for understanding the structural limits of the materials used, as it marks the threshold beyond which the material can no longer withstand the applied stresses without undergoing damage. This phenomenon underscores the importance of considering both the material properties and the types of stresses a structure will face in its design and analysis phases. Subsequent to the onset of cracking, the pipes underwent a redistribution of bending forces and compressive stress [44].
The proximity of this critical crack to the support, relative to the shear span, remained consistent across all tests. As the load approached 90% of its maximum capacity, the progression of this critical crack halted. Concurrently, at around 85% of the maximum load, additional shorter cracks emerged, indicative of damage to the bond between materials [45].
The failure of the tested pipes was characterized by the development of two primary types of cracks. Initially, horizontal splitting cracks formed along the bars towards the support, indicative of the tensile forces acting parallel to the longitudinal axis of the pipes. Secondly, inclined cracks emerged, moving towards the load application point and often following the trajectory of pre-existing fractures. Additionally, circular cracks were observed encircling the pipes, contributing to the overall weakening of the reinforced concrete structure. This proliferation of cracks across various zones significantly impaired the pipes’ ability to resist bending forces, leading to increased deflections and eventual failure [46].
Figure 10 provides a detailed visualization of the crack patterns observed in pipes with non-shrinkage grout and cement–sand mortar, following the application of the fracture load. In the scenario involving non-shrinkage grout, a localized failure was immediately noticeable at the point where the load was applied. This was accompanied by significant, inclined cracks that had widened substantially at the mid-support section of the pipe (Figure 10a). The distribution of cracks across the joint of the pipe was remarkably uniform, showcasing a combination of both vertical and inclined fractures. While the majority of these cracks extended over long distances, there was also a presence of shorter cracks. As the applied load was incrementally increased, there was a noticeable proliferation in the number of both long and short cracks, indicating a progressive deterioration in the structural integrity of the pipe.
Conversely, in the pipes filled with cement–sand mortar, the failure pattern diverged notably. No localized failure was observed in these instances. Instead, the most significant signs of failure were predominantly located at the mid-support and bell sections of the pipe, particularly near the joint. The cracks in this scenario widened to such an extent that they almost completely separated the pipe into parts, leading to a near-total structural separation (Figure 10b).
The severe failure mode, characterized by the extensive separation and widening of cracks, especially near the mid-support and bell sections of the pipe, suggests a critical point of structural integrity was reached. However, this critical point was achieved under a significantly higher load, indicating that the cement–sand mortar mixture provided a stronger bond at the joint, capable of sustaining greater stresses. This observation highlights the complex interplay between material composition, structural performance, and failure mechanisms.
In the joint test series, a pattern of multiple long cracks accompanied by a few shorter ones was observed. The maximum width of all cracks measured at failure on the tensile side of the joint varied between 0.2 and 0.5 mm, while in the pipe joint test series, the crack widths ranged between 10 and 30 mm. The cracks typically appeared at an angle, resulting in an irregular crack pattern on both sides of the pipe joint. The rotation angle of the joint was determined by summing the angles on both sides. On the right side, the pipe exhibited a rotation in the anticlockwise direction around the joint, whereas on the left side, the rotation was clockwise. The most significant rotation consistently occurred at the central joint (Jc), irrespective of whether the load was applied directly or at a distance from the center. This detailed observation of crack patterns and joint rotations provides a comprehensive understanding of the failure mechanisms in the reinforced concrete pipes under joint shear stress.

3.2. Validation of Numerical Results

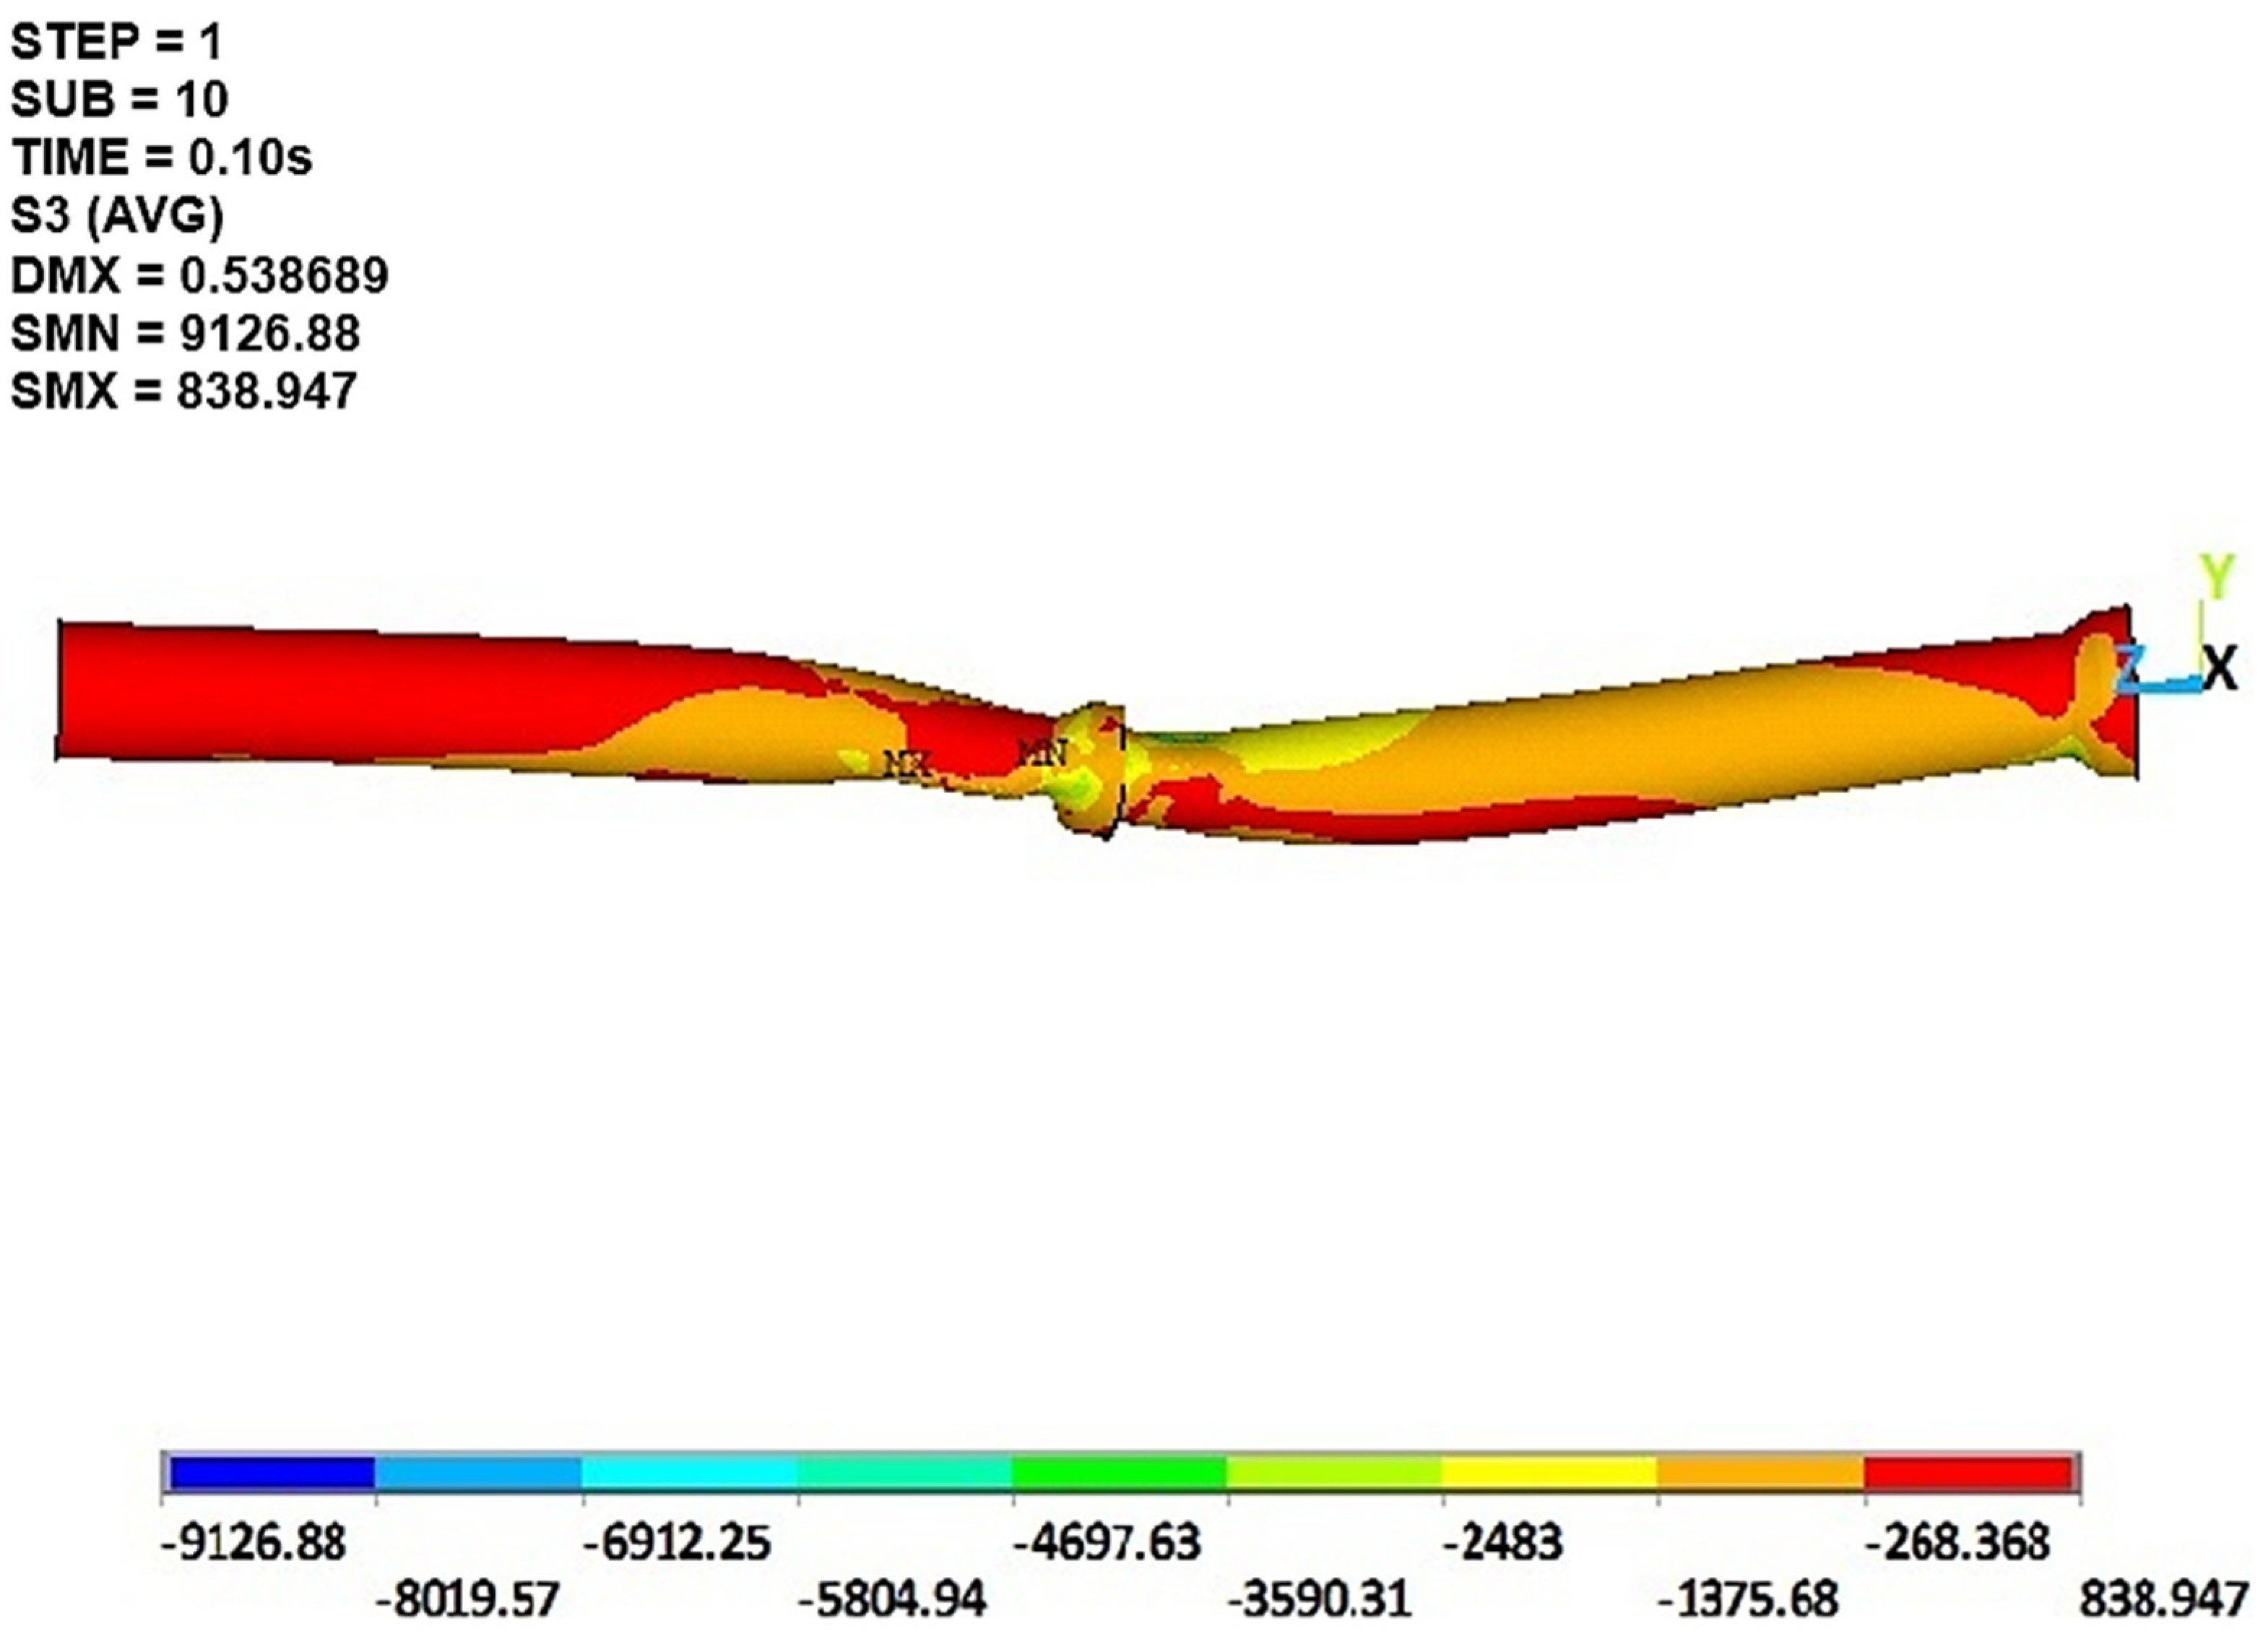
Load–Displacement Response and Fracture Pattern

In the field of Civil Engineering, numerical modeling has become indispensable for analyzing the structural behavior of various materials and configurations. Moreover, validating these numerical models through empirical testing is essential in FEA-centric research to ensure the accuracy of simulated factors. In this context, the experimental evaluations were conducted on two 228 mm diameter RC sewerage pipes, one with cement and mortar and the other with non-shrinkage grout, to validate the computational models utilized in our study. The experimental comparison revealed that the cement–sand mortar yielded superior results in terms of maximum shear joint strength and deflection. Therefore, the present study focused on numerical simulations only on the RC pipe with cement–sand mortar jointing material, as it demonstrated better performance.
The numerical model demonstrated a reasonable approximation of the experimental outcomes, as depicted in Figure 11. For instance, while the ascending portion of the experimental curve exhibits an almost linear trend, the numerical counterpart displays a bilateral trend with two distinct but slightly different slopes. The experimental results revealed a maximum shear strength of 25.59 kN for cement–sand mortar joints in reinforced concrete (RC) pipes at a deflection of 3.5 mm, with the fracture load reaching 25.59 kN at a maximum deflection of approximately 7 mm. In comparison, the numerical simulation approximately mirrored these findings, indicating an ultimate shear joint strength of 23.27 kN at a maximum deflection of 4.5 mm, utilizing cement–sand mortar as the jointing material in RC pipes. The comparison between the numerical simulation and the experimental data shows a moderate correlation with a noted discrepancy of 9.5% in peak shear joint strength, which further supports the validity of the numerical approach.
Moreover, the initial stiffness of the experimentally tested RC pipe was measured at 7.5 kN/mm. Conversely, the numerical simulation reported an initial stiffness of 6.75 kN/mm for the same characteristic, resulting in a percentage difference of approximately 10.5%. This difference underscores a comparative representation of the initial stiffness derived from both methodologies, underscoring the consistency and reliability of the numerical simulations in replicating the experimental findings.
The study further extended to the parametric study of numerical simulation of RC pipes with varying internal diameters. Figure 12 showcases the load–displacement response for pipes with varying internal diameters and thicknesses—specifically, pipes with dimensions of 228 mm by 25 mm, 300 mm by 50 mm, and 450 mm by 63 mm. The responses for these dimensions are represented by orange, green, and red lines, respectively. The graph plots the vertical loading (Fv) against the vertical deflection (δv), providing a visual representation of the behavior of the pipe under load.
The comparison of the horizontal load–displacement response of the pipe joints is akin to the vertical response, suggesting a consistent behavior across different orientations and therefore not separately detailed. The agreement between the results for different diameters of RC pipes is generally good, indicating that the numerical models are capturing the essential behavior of the pipes under load.
The initial elastic response of the sewer pipe joint, a critical phase in understanding the structural behavior of the pipe, is accurately captured by the FEM models. The vertical crack loads for 228 mm, 300 mm, and 450 mm diameter pipes are recorded as 18.2 kN, 69.4 kN, and 95 kN, respectively, as detailed in Table 6. These values are indicative of the resistance of pipes to cracking under vertical loads and are crucial for understanding the structural integrity and resilience of the sewer pipe joints. The substantial alignment of these values with experimental observations underscores the validity and applicability of the numerical models in simulating real-world scenarios.
Upon reaching the peak load, the computer simulation indicates a decrease in force as displacement increases, eventually stabilizing at approximately 0.3 times the initial crack load. This reduction reflects the structural softening behavior typically observed in materials post-peak load.
In the initial analysis, the experimental setup was designed to simulate controlled load conditions, anticipating a direct and proportional load-to-deformation response without explicitly highlighting a softening behavior. Contrary to expectations, the experimental results depicted in Figure 11 exhibit a notable softening phase beyond peak load, which is more pronounced than that observed in the numerical simulations. This discrepancy underscores the complexity of real-world conditions and the challenges of perfectly modeling the intricate behavior of reinforced concrete structures.
In the post-peak phase, macroscopic failure cracks develop, significantly impacting the structural integrity of the pipes. Notably, the deformation range for the 450 mm diameter pipe is larger than that of the other two pipes in the load–displacement diagram. This suggests a higher level of flexibility or a greater capacity to undergo deformation before reaching failure. As the sewer pipes reach their load-bearing capacity, macroscopic failure cracks typically manifest at the outer top and bottom parts of the sewer pipe. These cracks correspond to areas where the maximum principal stress has reached the tensile strength of the material of 1.84 N/mm2. As cracks begin to propagate, adjacent micro-cracks start to close, leading to a more localized crack pattern. Zhangabay et al. [47] explored the impact of fluid velocity on crack growth and fracture development in gas pipelines, combining classical fracture mechanics, ANSYS finite element analysis, and experimental tests. Their work resulted in a detailed methodology to evaluate pipeline resilience against extended fractures, offering insights for enhancing pipeline safety.
The formation of these cracks results in a decrease of the highest external force by about 20%, indicative of structural softening behavior. Subsequently, the sewer pipe attains its residual strength. As the cracks widen, the external force slightly increases due to the bending of the pipe, marking the transition to the next stage, where additional cracks form on the sides of the sewer pipe.
The numerical failure pattern, as illustrated in Figure 13, defines the behavior of RC pipes with varying diameters under single-point loading. During loading, the principal stresses exhibited variations, depicted through various stress contours. The highest compressive stresses were concentrated at the midpoint support, while the greatest tensile stresses were observed near the bell. This visualization aids in understanding the distinct responses and failure mechanisms of the pipes under load, providing valuable insights into the structural behavior and resilience of sewer pipes. The ability of numerical models to capture these complex behaviors and compare them with experimental results is crucial for validating the accuracy and reliability of the simulations in predicting real-world scenarios.
The results of the present study stem from a detailed experimental and numerical analysis of RC sewer pipes using cement mortar and non-shrinkage grout, highlighting the effectiveness of an integrated approach in assessing structural integrity under stress. Compared to existing methods, the study uniquely combines joint shear tests with 3D finite element analysis, offering new insights into the performance of jointing materials and enhancing the predictive accuracy of structural behavior in sewer systems. The limitations of the study include a focus on specific jointing materials and loading conditions, which could be expanded in future research to encompass a wider range of materials, pipe diameters, and environmental factors. Shortcomings, such as the limited generalizability of findings to different pipe sizes and joint types, could be addressed by broadening the scope of the research to include more varied configurations and conducting long-term durability studies. Future developments could explore alternative jointing materials and assess the impact of environmental conditions on joint integrity, although these endeavors may face challenges in simulating complex environmental interactions and validating laboratory findings through long-term field studies. This research paves the way for improving urban infrastructure resilience, with potential industrial benefits including extended infrastructure lifespan and reduced maintenance costs.

4. Conclusions

This study investigated the joint shear behavior of reinforced concrete (RC) pipes using various jointing materials, employing conventional rebar cage RC pipes. The materials tested included a cement–sand mixture and non-shrinkage grout, with each test aimed at evaluating joint strength. Additionally, finite element analysis was conducted on different diameters of pipe joints using Ansys. The investigation led to the following conclusions:
  • Specific jointing materials, notably a cement–sand mixture and non-shrinkage grout significantly improved the shear behavior of RC pipe joints under pressure.
  • For both jointing materials, the behavior of RC pipes’ joints was largely similar, distinguished primarily by variations in cracking strength values. Under pressure, the joints exhibited resilience, bending without fracturing, and displaying a more robust response as cracks widened. Additionally, shear cracks were evident at the joints, signaling a reduction in both ultimate capacity and cracking capacity.
  • Maximum deflection occurred at the crown of the joint, with spring line deflection being approximately 30% less, highlighting the importance of understanding shear forces and joint geometry in pipe design.
  • Cement–sand mortar emerged as the superior jointing material compared to non-shrinkage grout in terms of load sustainability and cost-effectiveness, thus becoming the preferred choice for RC pipe jointing. The ultimate shear joint strength of RC pipes utilizing cement–sand mortar reached 25.60 kN, while the same parameter with non-shrinkage grout stood at 21.50 kN, resulting in a significant difference of nearly 16%.
  • The study validated the utility of a three-dimensional finite element model for accurately simulating the structural performance of precast concrete pipes for design and analysis purposes. This was evidenced by an approximately 9% discrepancy between the experimental and numerical findings on the ultimate load capacity, indicating a strong concordance between the two approaches. The initial stiffness of the experimentally tested RC pipe was measured at 7.50 kN/mm. In contrast, the numerical simulation yielded a value of 6.75 kN/mm for the same characteristic, resulting in a percentage difference of nearly 10%.
  • The pipe model effectively predicted vertical deformation along the longitudinal axis of a jointed RC pipe, supporting its use in reliable and efficient design methodologies.
This research not only enhances the current structural reliability of RC pipes in sewer systems but also paves the way for future advancements in infrastructure durability. By identifying superior jointing materials and employing advanced finite element analysis, this study lays the groundwork for the development of even more resilient sewer networks. The insights gained from this experimental study offer invaluable guidance for municipalities and other stakeholders, empowering them to make informed decisions not only on current maintenance and replacement but also on the future upgrade of sewer networks. Ultimately, these findings contribute to the realization of more sustainable and efficient public works, fostering urban resilience, and ensuring the longevity of critical infrastructure in the face of evolving challenges.

Author Contributions

Conceptualization, S.A. and M.J.M.; methodology, S.A., A.B. and S.M.S.K.; software, A.B., M.M.A. and U.A.M.; validation, M.M.A. and U.A.M.; formal analysis, A.B. and S.A.; resources, A.B. and S.A.; data curation, A.B., M.M.A. and U.A.M.; writing—original draft preparation, A.B. and M.M.A.; supervision, S.A.; writing—review and editing, S.A., S.M.S.K. and M.J.M.; project administration, S.A., S.M.S.K. and M.J.M. All authors have read and agreed to the published version of the manuscript.

Funding

This research received no external funding.

Data Availability Statement

Data are contained within the article.

Conflicts of Interest

The authors declare no conflicts of interest.

References

  1. Nguyen, H.; Peche, A.; Venohr, M. Modelling of Sewer Exfiltration to Groundwater in Urban Wastewater Systems: A Critical Review. J. Hydrol. 2021, 596, 126130. [Google Scholar] [CrossRef]
  2. Jia, Y.; Zheng, F.; Maier, H.; Ostfeld, A.; Creaco, E.; Savic, D.; Langeveld, J.; Kapelan, Z. Water Quality Modeling in Sewer Networks: Review and Future Research Directions. Water Res. 2021, 202, 117419. [Google Scholar] [CrossRef] [PubMed]
  3. Mhammadi, M.; Najafi, M.; Kermanshachi, S.; Kashaul, V.; Serajiantehrani, R. Factors Influencing the Condition of Sewer Pipes: State-of-the-art review. J. Pipeline Syst. Eng. Pract. 2020, 11, 3120002. [Google Scholar] [CrossRef]
  4. Huang, D.; Liu, X.; Jiang, S.; Wang, H.; Wang, J.; Zhang, Y. Current State and Future Perspectives of Sewer Networks in Urban China. Front. Environ. Sci. Eng. 2018, 12, 2. [Google Scholar] [CrossRef]
  5. Davies, J.; Clarke, B.; Whiter, J.; Cunningham, R. Factors Influencing the Structural Deterioration and Collapse of Rigid Sewer Pipes. Urban Water 2001, 3, 73–89. [Google Scholar] [CrossRef]
  6. The Australasian Corrosion Association, Cost of Corrosion Part 3—Water and Wastewater. Available online: https://www.corrosion.com.au/water-and-wastewater-part-3/ (accessed on 24 December 2023).
  7. Mohammad, N.; Nehdi, M. Rational Finite Element Assisted Design of Precast Steel Fibre Reinforced Concrete Pipes. Eng. Struct. 2016, 124, 196–206. [Google Scholar] [CrossRef]
  8. Zhuge, Y.; Fan, W.; Duan, W.; Liu, Y. The Durability and Rehabilitation Technologies of Concrete Sewerage Pipes: A state-of-the-art review. J. Asian Concr. Fed. 2021, 7, 1–16. [Google Scholar] [CrossRef]
  9. Kuliczkowska, E. Risk of Structural Failure in Concrete Sewers Due to Internal Corrosion. Eng. Fail. Anal. 2016, 66, 110–119. [Google Scholar] [CrossRef]
  10. Makar, J.; Desnoyers, R.; McDonald, S. Failure Modes and Mechanisms in Gray Cast Iron Pipes. In Underground Infrastructure Research; CRC Press: Boca Raton, FL, USA, 2020; pp. 303–312. [Google Scholar]
  11. Ramadan, A.; Younis, A.; Wong, L.; Nehdi, M. Investigation of Structural Behavior of Precast Concrete Pipe with Single Elliptical Steel Cage Reinforcement. Eng. Struct. 2020, 219, 110881. [Google Scholar] [CrossRef]
  12. Song, Y. Corrosion of Reinforcing Steel in Concrete Sewers. Sci. Total Environ. 2019, 649, 739–748. [Google Scholar] [CrossRef]
  13. Obropta, C.; Kardos, J. Review of Urban Stormwater Quality Models:Deterministic, Stochastic, and Hybrid Approaches 1. Jawra J. Am. Water Resour. Assoc. 2007, 43, 1508–1523. [Google Scholar] [CrossRef]
  14. Zhang, P.; Gong, C.; Wu, Q.; Zeng, C. Experimental Study on the Bearing Capacity of Reinforced Concrete Pipes with Corrosion-Thinning Defects Repaired by UHP-ECC Mortar Spraying. Appl. Sci. 2023, 13, 7800. [Google Scholar] [CrossRef]
  15. Abel, T. Changes in Strength Parameters of Pipelines Rehabilitated with Close-Fit Trolining Liners—Numerical Analysis Based on Laboratory Tests. Arch. Civ. Mech. Eng. 2016, 16, 30–40. [Google Scholar] [CrossRef]
  16. Alzraiee, H.; Bakry, I.; Zayed, T. Destructive Analysis-Based Testing for Cured-In-Place Pipe. J. Perform. Constr. Facil. 2014, 29, 4014095. [Google Scholar] [CrossRef]
  17. Zamanian, S.; Hur, J.; Shafieezadeh, A. A High-Fidelity Computational Investigation of Buried Concrete Sewer Pipes Exposed to Truckloads and Corrosion Deterioration. Eng. Struct. 2020, 221, 111043. [Google Scholar] [CrossRef]
  18. Water, New England Interstate. Optimizing Operation, Maintenance, and Rehabilitation of Sanitary Sewer Collection Systems; Ricki Pappo, Enosis—The Environmental Outreach Group: Lowell, MA, USA, 2003. [Google Scholar]
  19. Haq, S. Water Supply and Drainage for Buildings. Nova Science. 2023. Available online: https://novapublishers.com/shop/water-supply-and-drainage-for-buildings/ (accessed on 28 December 2023).
  20. Garcia, D.; Moore, D. Behaviour of Bell and Spigot Joints in Buried Reinforced Concrete Pipelines. Can. Geotech. J. 2014, 52, 609–625. [Google Scholar] [CrossRef]
  21. Rakitin, B.; Xu, M. Centrifuge testing to simulate buried reinforced concrete pipe joints subjected to traffic loading. Can. Geotech. J. 2015, 52, 1762–1774. [Google Scholar] [CrossRef]
  22. Sheldon, T.; Sezen, H.; Moore, D. Joint Response of Existing Pipe Culverts under Surface Live Loads. J. Perform. Constr. Facil. 2015, 29, 4014037. [Google Scholar] [CrossRef]
  23. Balkaya, M.; Moore, D.; Sağlamer, A. Study of Non-Uniform Bedding Support Under Continuous PVC Water Distribution Pipes. Tunn. Undergr. Space Technol. 2013, 35, 99–108. [Google Scholar] [CrossRef]
  24. ASTM C109; ASTM C109/C109M-20b; Standard Test Method for Compressive Strength of Hydraulic Cement Mortars (Using 2-in. or [50 mm] Cube Specimens). Annual Book of ASTM Standards. American Society for Testing and Materials: West Conshohocken, PA, USA, 2020; Volume 4, p. 9.
  25. ASTM C39/C39M; Standard Test Method for Compressive Strength of Cylindrical Concrete Specimens 1. ASTM Standards B. American Society for Testing and Materials: West Conshohocken, PA, USA, 2003; Volume 4, pp. 1–5.
  26. ASTM A615; Standard Specification for Deformed and Plain Carbon-Steel Bars for Concrete. American Society for Testing and Materials: West Conshohocken, PA, USA, 2020.
  27. ASTM C497; Standard Test Methods for Concrete Pipe, Concrete Box Sections, Manhole Sections, or Tile. American Society for Testing and Materials: West Conshohocken, PA, USA, 2020.
  28. Abbas, S.; Nehdi, M. Mechanical Behavior of Ultrahigh-Performance Concrete Tunnel Lining Segments. Materials 2021, 14, 2378. [Google Scholar] [CrossRef]
  29. Lourenco, B.P. Computational Strategies for Masonry Structures: Multi-scale modelling, dynamics, engineering applications and other challenges. In Proceedings of the Congreso de Metodos Numericos en Ingenieria, Bilbao, Spain, 25–28 June 2013; pp. 1–17. [Google Scholar]
  30. Komurco, S.; Gedikli, A. Macro and Micro Modelling of the Unreinforced Masonry Shear Walls. Eur. J. Eng. Nat. Sci. 2019, 3, 116–123. [Google Scholar]
  31. Mynarz, M.; Mynarzova, L. Non-Linear Approaches to the Response of Brick Masonry Wall to Lateral Loading. Int. J. Geomate 2018, 14, 76–82. [Google Scholar] [CrossRef]
  32. Dhanasekar, M.; Elsalakawy, T. Numerical Simulation of Masonry Prism Test using ANSYS and ABAQUS. Int. J. Eng. Res. Technol. (IJERT) 2015, 4, 1019–1027. [Google Scholar]
  33. Kanıt, R.; Döndüren, S. Investıgatıon of usıng Ansys Software ın the Determınatıon of Stress Behavıours of Masonry Walls under out of Plane Cyclıng Load. Int. J. Phys. Sci. 2010, 5, 97–108. [Google Scholar]
  34. Vanin, A.; Foraboschi, P. Modelling of Masonry Panels by Truss Analogy-Part 1. Mason. Int. 2009, 22, 1. [Google Scholar]
  35. Ajmal, M.; Qazi, A.; Ahmed, A.; Mughal, U.; Abbas, S.; Kazmi, S.; Munir, M. Structural Performance of Energy Efficient Geopolymer Concrete Confined Masonry: An Approach towards Decarbonization. Energies 2023, 16, 3579. [Google Scholar] [CrossRef]
  36. Naseer, A.; Qazi, A.; Mughal, U.A.; Ajmal, M.; Ahmed, A. Characteristics of Unconfined Masonry Walls under in-Plane Static and Reverse-Cyclic Loading: A Comparative Numerical Study. Eur. J. Environ. Civ. Eng. 2023, 28, 150–175. [Google Scholar] [CrossRef]
  37. Mughal, U.; Qazi, A.; Ahmed, A.; Ajmal, M.; Danish, M. Investigation of Torsion in Confined Masonry Structures Originating Due to Unsymmetric Openings. Eur. J. Environ. Civ. Eng. 2023, 1–20. [Google Scholar] [CrossRef]
  38. Kim, H.; Yun, H.; Jang, S.; Park, W.; Jang, Y. Nonlinear Finite Element Analysis of Steel Fiber-Reinforced Concrete Coupling Beams. In Computational Modelling of Concrete Structures; CRC Press: Boca Raton, FL, USA, 2018; pp. 889–893. [Google Scholar]
  39. Campbell, J.; Duran, M. Numerical Model for Nonlinear Analysis of Masonry Walls. J. Constr. 2017, 16, 2. [Google Scholar] [CrossRef]
  40. Ansys Inc. Element Reference. 2010, p. 9. Available online: http://inside.mines.edu/~apetrell/ENME442/Documents/SOLID187.pdf (accessed on 14 December 2023).
  41. Li, P.; Zhang, W.; Ye, Z.; Wang, Y.; Yang, S.; Wang, L. Analysis of Acoustic Emission Energy from Reinforced Concrete Sewage Pipeline under Full-Scale Loading Test. Appl. Sci. 2022, 12, 8624. [Google Scholar] [CrossRef]
  42. Fayyad, T.; Lees, J. Experimental investigation of Crack Propagation and Crack Branching in Lightly Reinforced Concrete Beams Using Digital Image Correlation. Eng. Fract. Mech. 2017, 182, 487–505. [Google Scholar] [CrossRef]
  43. Faisal, A.; Abbas, S.; Kazmi, S.; Munir, M. Development of Concrete Mixture for Spun-Cast Full-Scale Precast Concrete Pipes Incorporating Bundled Steel and Polypropylene Fibers. Materials 2023, 16, 512. [Google Scholar] [CrossRef] [PubMed]
  44. Faisal, A.; Abbas, S.; Ahmed, A. Mechanical performance of Spun-Cast Full-Scale Precast Pipes Incorporating Hybrid Conventional Rebar Cage and Steel Fibers. Structures 2023, 52, 104–116. [Google Scholar] [CrossRef]
  45. Korol, E.; Tejchman, J. Experimental Investigations of Size Effect in Reinforced Concrete Beams Failing by Shear, Engineering. Structures 2014, 58, 63–78. [Google Scholar]
  46. Scheperboer, I.; Luimes, R.; Suiker, A.; Bosco, E.; Clemens, F. Experimental-Numerical Study on the structural failure of Concrete Sewer pipes. Tunn. Undergr. Space Technol. 2021, 116, 104075. [Google Scholar] [CrossRef]
  47. Zhangabay, N. Factors Affecting Extended Avalanche Destructions on Long-Distance Gas Pipelines. Case Stud. Constr. Mater. 2023, 19, 2376. [Google Scholar]
Figure 1. Steel reinforcement in conventional RC pipe.
Infrastructures 09 00069 g001
Figure 2. Pipe casting procedure; (a) steel fixing; (b) mold preparation with steel cage; (c) feeding concrete; (d) filled pipe in mold; (e) demolded concrete pipe; (f) pipe curing.
Infrastructures 09 00069 g002
Figure 3. Experimental setup for joint shear pipe testing.
Infrastructures 09 00069 g003
Figure 4. Schematic diagram of shear joint test.
Infrastructures 09 00069 g004
Figure 5. Numerical simulation of an RC pipe joint.
Infrastructures 09 00069 g005
Figure 6. Constitutive relationships (a) Hordijk model for tension of concrete; (b) Thorenfeldt model for compression of concrete; (c) Campbell model for compression of mortar; (d) Campbell model for shear of mortar.
Infrastructures 09 00069 g006
Figure 7. FEM pipes for joint shear test concrete modeling, with steel reinforcement meshing.
Infrastructures 09 00069 g007
Figure 8. Load-deflection curves of pipe joint tests.
Infrastructures 09 00069 g008
Figure 9. Schematic hairline crack location on pipe joint (a) upper side of the bell and (b) inclined side.
Infrastructures 09 00069 g009
Figure 10. Joint failure behavior of pipes with (a) non-shrinkage grout, and (b) cement–sand mortar.
Infrastructures 09 00069 g010
Figure 11. Validation of the numerical model with experimental results.
Infrastructures 09 00069 g011
Figure 12. Comparison of Load-Deflection Curves.
Infrastructures 09 00069 g012
Figure 13. Stress distribution on the pipe model.
Infrastructures 09 00069 g013
Table 1. Chemical properties of materials used as joint materials.
ComponentsCement (%)Sand (%)
CaO61.650.011
Al2O33.60.04
Fe2O33.50.039
SiO218.998
MgO2.3-
SO33.97-
K2O1.13-
Na2O0.14-
LoI1.750.12
Table 2. Concrete mix proportion for precast pipes.
Cement (ft3)Fine Aggregate (ft3)Coarse Aggregate (ft3)Water–Cement Ratio
0.4800.7471.4970.40
Table 3. Test matrix for full-scale precast concrete pipe.
RC PipesReinforcement DetailRemarks
9″ diameter pipe6–ϕ 4 mm longitudinal ϕ 4 mm @ 84 mm c/c circumferentialConventional concrete and rebar cage
Table 4. Properties of FEM models.
ParametersSymbolsValuesUnits
Compressive strengthCc30.7MPa
Tensile strengthTu11.84MPa
Modulus of elasticityEc26,401MPa
Density of cement–sand mortarD2300kg/m3
Poisson’s ratioVc0.2
Table 5. Shear load test results with different jointing materials.
RC 9″ Diameter
Pipe Joint
Crack Load (kN)Ultimate Load
(kN)
Deflection
(mm)
Cement-sand mortar2125.594.2
Non-shrinkage grout1721.503.9
Table 6. FEM results of joint load tests for different sizes of RC pipes.
RC PipeCrack Load (kN)Ultimate Load
(kN)
Deflection
(mm)
9″ diameter18.223.273.5
12″ diameter69.4904
18″ diameter95129.73.9
Disclaimer/Publisher’s Note: The statements, opinions and data contained in all publications are solely those of the individual author(s) and contributor(s) and not of MDPI and/or the editor(s). MDPI and/or the editor(s) disclaim responsibility for any injury to people or property resulting from any ideas, methods, instructions or products referred to in the content.

