
Evolution of Realistic Organic Mixtures for the Origins of Life through Wet–Dry Cycling


1
Department of Chemistry and Biochemistry, Central Connecticut State University, New Britain, CT 06010, USA
2
Department of Chemistry and Biochemistry, Georgia Institute of Technology, Atlanta, GA 30332, USA
*
Author to whom correspondence should be addressed.
Sci 2022, 4(2), 22; https://doi.org/10.3390/sci4020022
Submission received: 21 February 2022
/
Revised: 29 April 2022
/
Accepted: 23 May 2022
/
Published: 27 May 2022
(This article belongs to the Special Issue Feature Papers—Multidisciplinary Sciences 2022)
Abstract
:One of the challenges in understanding chemical evolution is the large number of starting organics and environments that were plausible on early Earth. Starting with realistic organic mixtures and using chemical analyses that are not biologically biased, understanding the interplay between organic composition and environment can be approached using statistical analysis. In this work, a mixture of 73 organics was cycled through dehydrating conditions five times, considering environmental parameters of pH, salinity, and rehydration solution. Products were analyzed by HPLC, amide and ester assays, and phosphatase and esterase assays. While all environmental factors were found to influence chemical evolution, salinity was found to play a large role in the evolution of these mixtures, with samples diverging at very high sea salt concentrations. This framework should be expanded and formalized to improve our understanding of abiogenesis.
1. Introduction
Organics from both interstellar and terrestrial syntheses are proposed to have blanketed the early Earth [1,2,3,4]. These chemicals would have mixed into the ocean or perhaps landed on transient volcanic islands. Often referred to as the “prebiotic soup”, these organic mixtures would have served as the building blocks and early metabolic components for chemical systems to emerge and evolve into biology [5,6,7].
These organics were mostly generated from high energy systems interacting with small molecules (e.g., H2O, CO2, and N2), and produce a range of organics with huge molecular diversity [8]. Analysis of both spark discharge and carbonaceous meteorites by mass spectrometry found hundreds of thousands of compounds in both types of samples [9,10,11]. Moreover, these sources, with similar starting molecules produced a suite of compounds that are represented in extant biology, such as amino acids, hydroxy acids, and purines. While most of the material by mass is not present in modern biology, it has been proposed that the evolution of these organic mixtures could lead to selection of specific sets of compounds [12,13,14,15].
The study of chemical evolution is hardly new; for example, some of the forces of selection that previously have been explored include interactions with mineral surfaces [16,17], ionizing radiation [18,19,20,21,22,23,24], and wet–dry cycling [25,26,27]. Many of these studies have focused on formation of biopolymers (e.g., oligonucleotides or peptides) exclusively. Specifically, the formation of peptides through ester–amide exchange has been the focus of many recent works [27,28,29,30,31] and indicates a growing popularity of wet–dry cycling in hypothesized prebiotic reactions. Other products of condensation reactions, such as lipids or oligonucleotides, during wet–dry cycling make a compelling case for the process or a similar driver of condensation reactions during the origins of life [25,32,33].
In addition to the starting organic inventory, the environmental conditions are expected to play a role in the evolution of chemical mixtures. Previous work has explored the effect of solution pH [34,35,36], the role of ionic strength and composition, the effect of temperature on chemical evolution [37,38,39], and pressure on the reactivity of prebiotically relevant mixtures [40]. Indeed, recent results by Surman et al. show that mineral surfaces during drying result in a differentiation of spark-discharge type chemical mixtures [41]. Using a similar framework, this paper evaluates the role of ionic strength and pH in the evolution of chemical mixtures through dehydrating conditions.
Much of the published literature uses a biologically biased lens to evaluate chemical evolution (i.e., how much does this look like modern biochemistry?). Additionally, most experiments have worked with a tractable number of organic compounds (often <10), and those compounds are generally biased towards extant biology. With the improvement in instrument sensitivity, the development of high throughput methods for analysis and the increased accessibility of data analysis software, previously “intractable” mixtures can be understood more effectively [42]. While preparing such compositionally diverse mixtures can pose a challenge, we have assembled a synthetic soup to mimic the chemical groups commonly produced through prebiotic chemistry, specifically in mass ratios comparable to the Muchison meteorite [43].
While more focused and biologically based approaches can be informative, more generalized metrics may be necessary as early life could have been fairly dissimilar from extant biology. For example, the extent of condensation reactions within a dehydration sample can be evaluated through the formation of ester and amide bonds without specifically looking for peptides. Here, in addition to esters and amides, we evaluated the ability to hydrolyze ester and phosphoester bonds as a functional/catalytic component, and the changes in molecular polarity within the mixture through HPLC separation using a C18 column. Using this method, we find that in addition to starting organic composition, ionic strength of the solution plays a large role in the evolution of these mixtures.
2. Materials and Methods
Soup Preparation. The prebiotic soup was made from a mixture of sulfonic acids (102.9 mol), N-heterocycles (8.784 mol), pyridine carboxylic acids (7.104 mol), amides (5.850 mol), dicarboxylic acids (2.246 mol), amino acids (1.828 mol), monocarboxylic acids (0.9150 mol), polyols (0.8185 mol), polar hydrocarbons (0.6625 mol), and hydroxy acids (0.1191 mol), and diluted to a final volume of 500 mL with ultrapure water [43]. This mixture was developed to model the organic composition of the Murchison Meteorite from commercially available chemicals. For a complete list of components see Table S1. Chemicals were purchased through Fisher Scientific using TCI brand when available. Sodium bicarbonate, sulfuric acid, and phosphoric acid were added in 10, 10, and 1 mM concentrations, respectively [44].
From this solution, 5 mL samples were prepared in triplicate for each pH/salt condition. The nine sample types represent a matrix of three different salt concentrations: low sea salt (1.8 g/L), modern sea salt (35 g/L), and 2x modern sea salt (70 g/L) [45], and solution pHs: acidic (pH 2–3), neutral (pH 6–8), and basic (pH 9–10). The 27 samples were then put in an oven at 100 °C for 4–8 days. At the end of each drying period, the samples were removed from the oven and rehydrated with 5 mL of ultrapure water. The pH of each sample was checked and adjusted to the original pH range. After the fifth cycle, the samples were rehydrated with 5 mL of 1:1 methanol water and analyzed.
Using the same starting soup, a similar experiment was prepared with three starting salt concentrations at the acidic pH. The samples were “fed” using dilute organics in each cycle. The rehydration solution was varied to contain one of the three following conditions: 0.3 g/L organics (1/200 dilution of the starting organic mixture), 6 g/L organics (1/10 dilution of the starting organic mixture), and 6 g/L organics with 35 g/L sea salt (1:10 dilution of the starting organics with modern ocean water). All 27 samples were adjusted to have a pH between 2 and 3. The samples were heated in an oven at 100 °C for 20 h. When removed from the oven, the samples were rehydrated with their respective diluted soup. After five wet–dry cycles, the samples were rehydrated with deionized water and analyzed.
Analysis was also performed to determine the role of the concentration of starting organics on the evolution of mixtures. A 100 g/L organic soup was prepared (a 3.3× solution of the starting soup) and analyzed under three pH conditions: acidic (pH 2–3), neutral (pH 6–8), and basic (pH 9–10) and two starting salt conditions: 0 g/L sea salt and 35 g/L sea salt. The rehydration solution was water through five rounds of dehydration/rehydration.
Chemical Analysis.HPLC. Chromatographic analysis was completed on a Thermo Fisher UltiMate 3000 HPLC system using a C18 column (Thermo Scientific Accucore C18 2.6 µm, 2.1 × 100 mm). A 10 µL injection was analyzed, using the following gradient: ultrapure water/acetonitrile (90:10) for 2 min, then a linear gradient to 10:90 at 12 min, held until 15 min, then a return to starting conditions at 15.1 min held to 18 min. Separations were analyzed using 210 nm on the diode array detector. Peak areas were determined for three time ranges as total area above baseline through the time given: void volume (“polar” 0.5–0.8 min), small polar molecules (“polar2” 0.8–2 min), and oligomers (4.7–5.8 min). These regions had the greatest variability between samples. Other regions were examined but had similar peak areas for all samples.
Amide Assay. A 25 µL aliquot of each sample was put into a 96-well plate. A working solution 50:1 BCA (Pierce, ThermoFisher Scientific, Waltham, MA, USA) to 4% copper sulfate (w/v) was made and 175 µL was added to each sample well. The well plate was put in an incubator at 37 °C for 30 min to allow color to develop. The absorbance of the samples was taken at 562 nm.
Ester Assay [46]. A 25 µL aliquot of each sample was put into a 96-well plate. A 1:1 solution of 2.5% (w/v) hydroxylamine in ethanol and 2.5% (w/v) NaOH in ethanol was prepared as the working reagent. The working solution was centrifuged and 75 µL of the supernatant was added to each sample well. After 30 min at room temperature, 100 µL of a 0.4% (w/v) ferric chloride in 50% H2SO4 was added to each well. The absorbance of the samples was taken at 510 nm.
Functional Assays. A para-nitrophenyl acetate (pNPA) or para-nitrophenyl phosphate (pNPP) were used to test esterase [47] or phosphatase activity, respectively. Samples were buffered with 20 mM HEPES at pH 7.2. A 100 µL aliquot of each sample was placed into a 96-well plate. Each soup received a 100 µL addition of a 7 mM pNPA or pNPP solution. Production of para-nitrophenol in the soups was evaluated at 405 nm.
Data Analysis. For each analysis above, averages of the triplicate samples were found (Table S2). Samples were analyzed in R Studio version 4.0.3 with the packages factoextra, ggbiplot, and tidyverse using principal component analysis by correlation.
3. Results
Realistic organic mixtures composed of 73 different commercially available compounds were evolved through five cycles of dehydration. The effects of pH, ionic strength, rehydration solution, and starting organic content were evaluated using principal component analysis. We observed the evolved mixtures through colorimetric assays to evaluate function (esterase and phosphatase activity) and condensation reactions (amide and ester bond formation). HPLC analysis with UV detection was also used to identify “groups” of molecules that change over time, without following specific peaks.
3.1. Evolution of Function
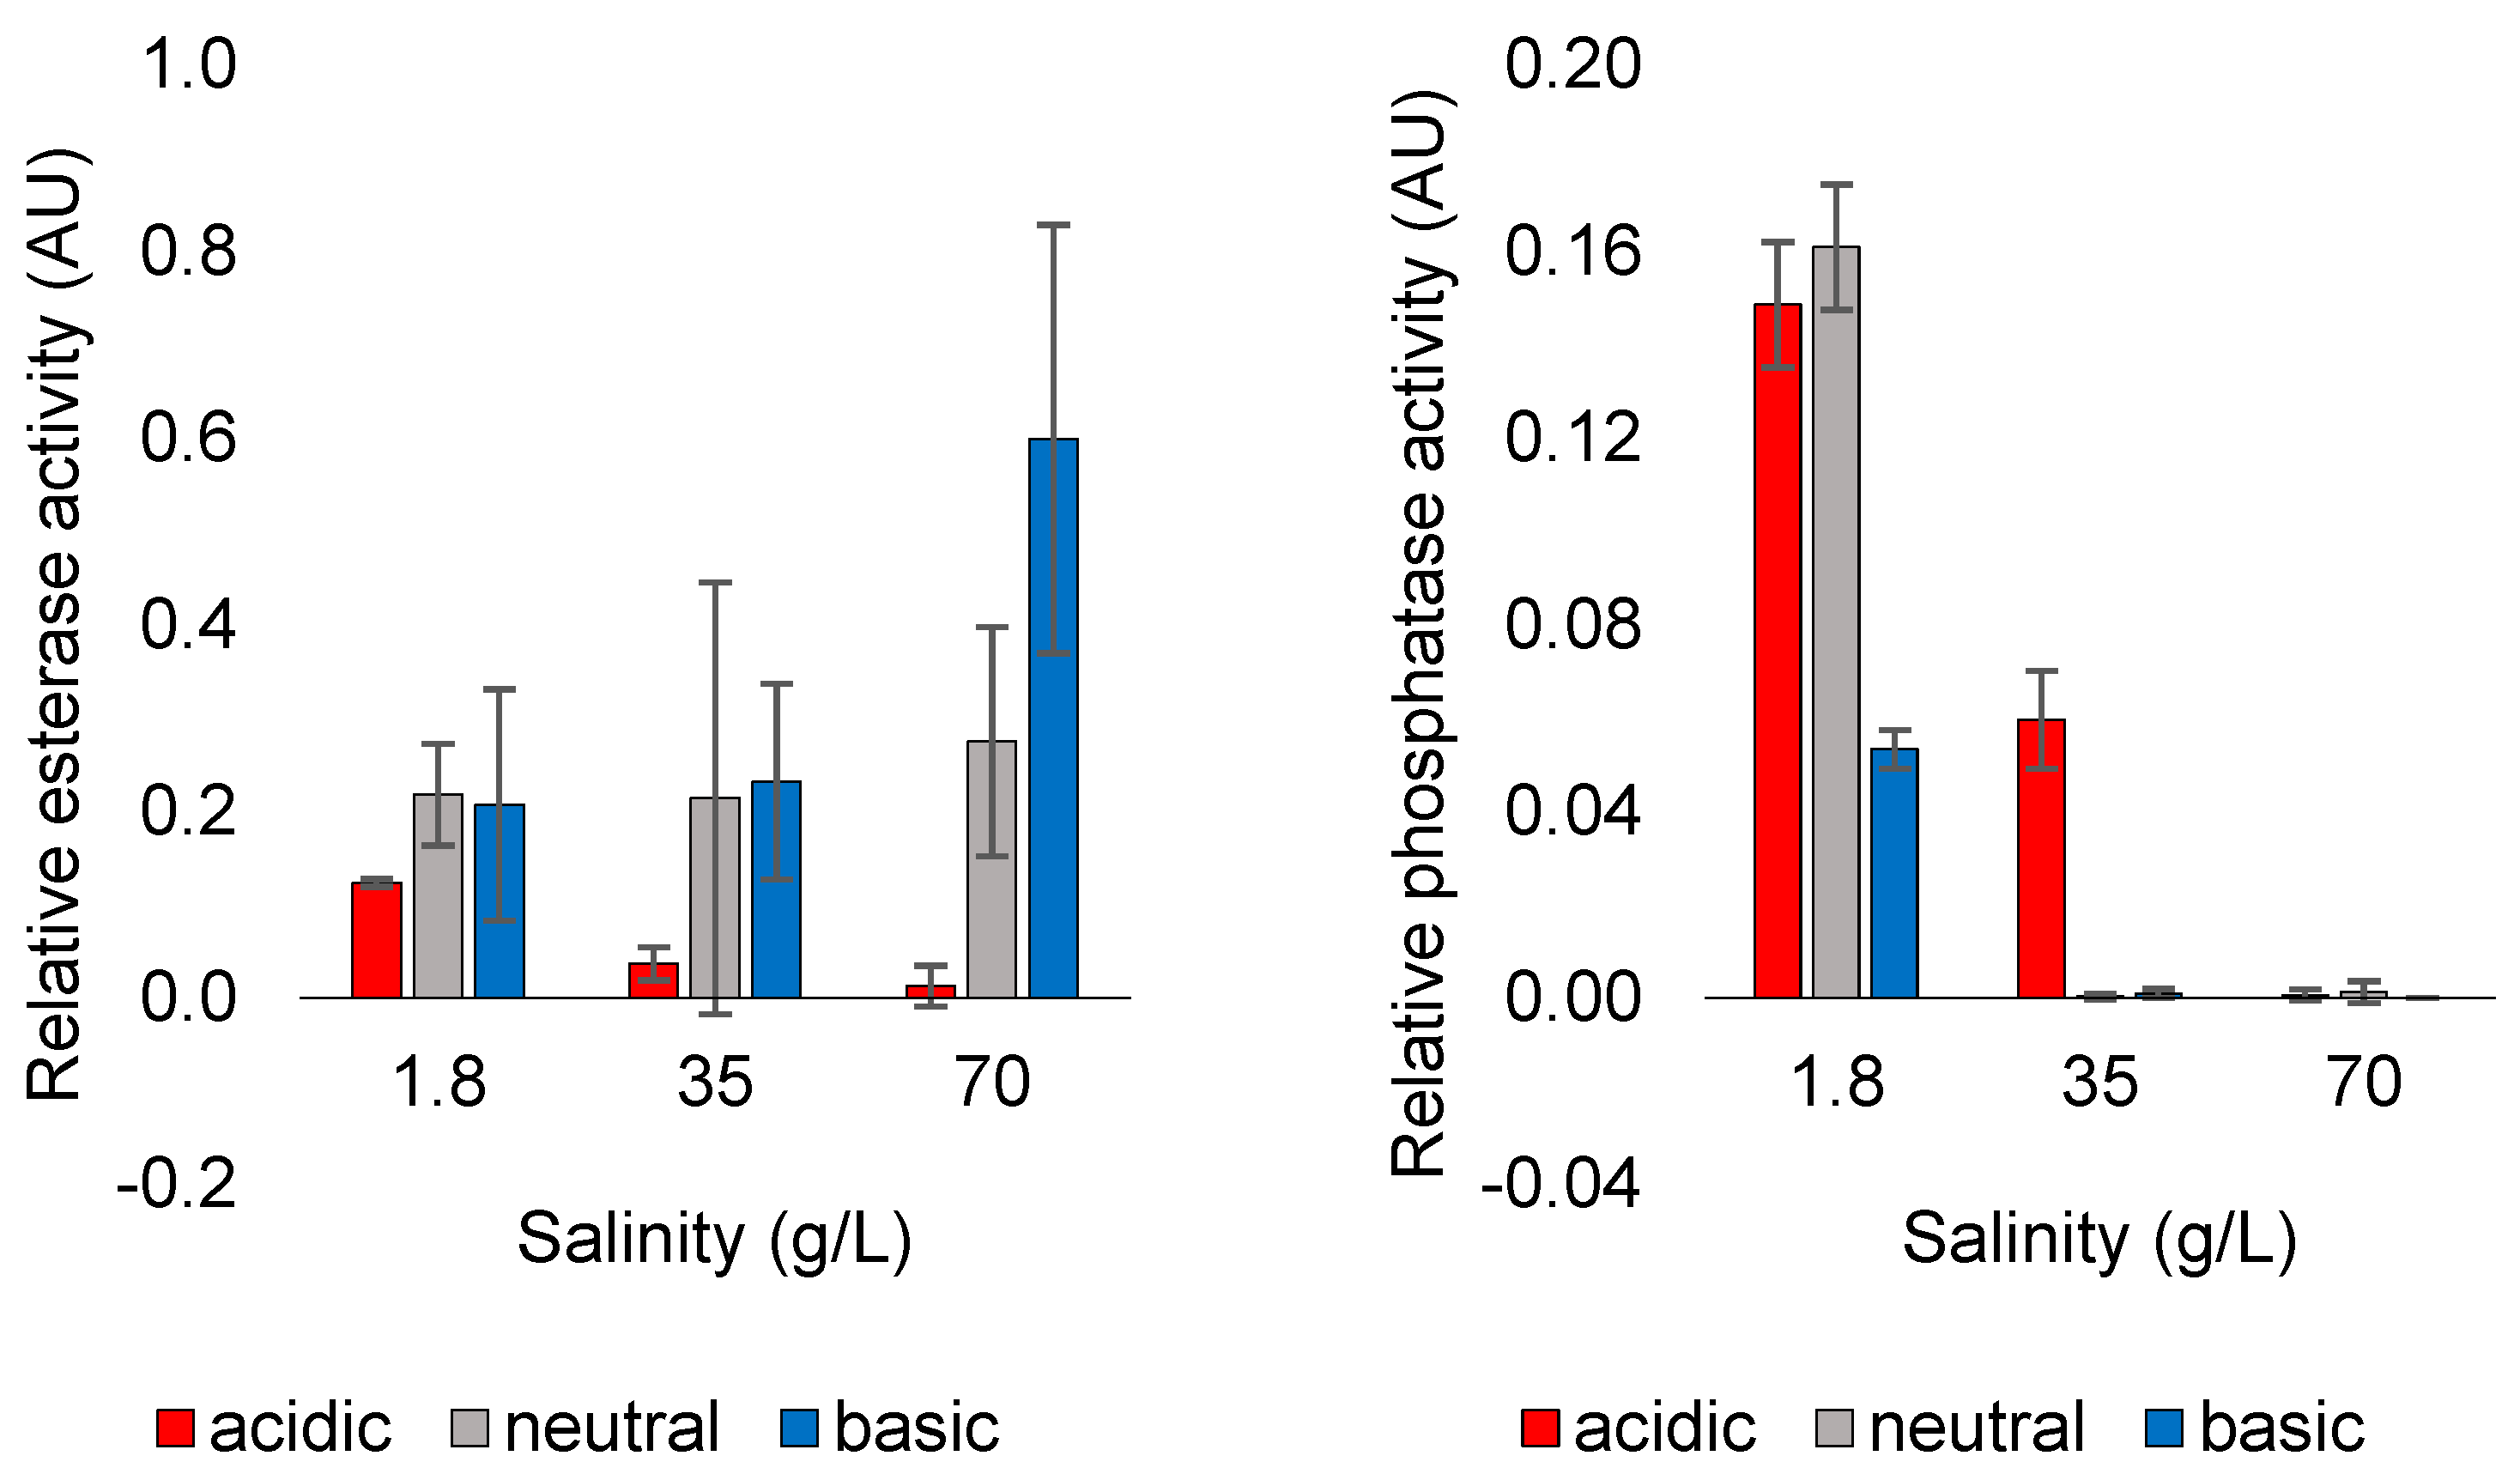
Two different assays were developed to test for function within the evolved mixtures: (1) esterase activity as determined by the hydrolysis of p-nitrophenol from p-nitrophenyl acetate; (2) phosphatase activity as determined by the hydrolysis of p-nitrophenol from p-nitrophenyl phosphate. The esterase and phosphatase assays formed product in some, but not all of the samples, indicating that functionality evolves differently depending on environment (Figure 1). Unevolved soups, without dehydration cycles, did not produce any product.
The esterase activity was moderately dependent on pH, where acidic samples showed less p-nitrophenol hydrolysis than both basic and neutral samples. Note that the pH is referring to the pH at the time of evolution. All samples were pH adjusted to 7.2 prior to the assay. There was a large deviation between samples within the same set, preventing the determination of significance.
Interestingly, in the phosphatase samples, the activity was largely dependent on salinity, with very little to no product formation in the 70 g/L samples. It was also surprising that samples that performed well in the esterase assay had little overlap with the performance of the phosphatase assay, even though the substrates are fairly similar. Additionally, when compared to E. coli extracts esterase and phosphatase activity of evolved soups was very low (data not shown). This indicates that while environment plays a role in evolving chemical mixtures into reactive or catalytic systems, biological evolution has produced far superior mechanisms for these functions.
3.2. Effect of Dissolved Solutes in Starting and Rehydration Solution
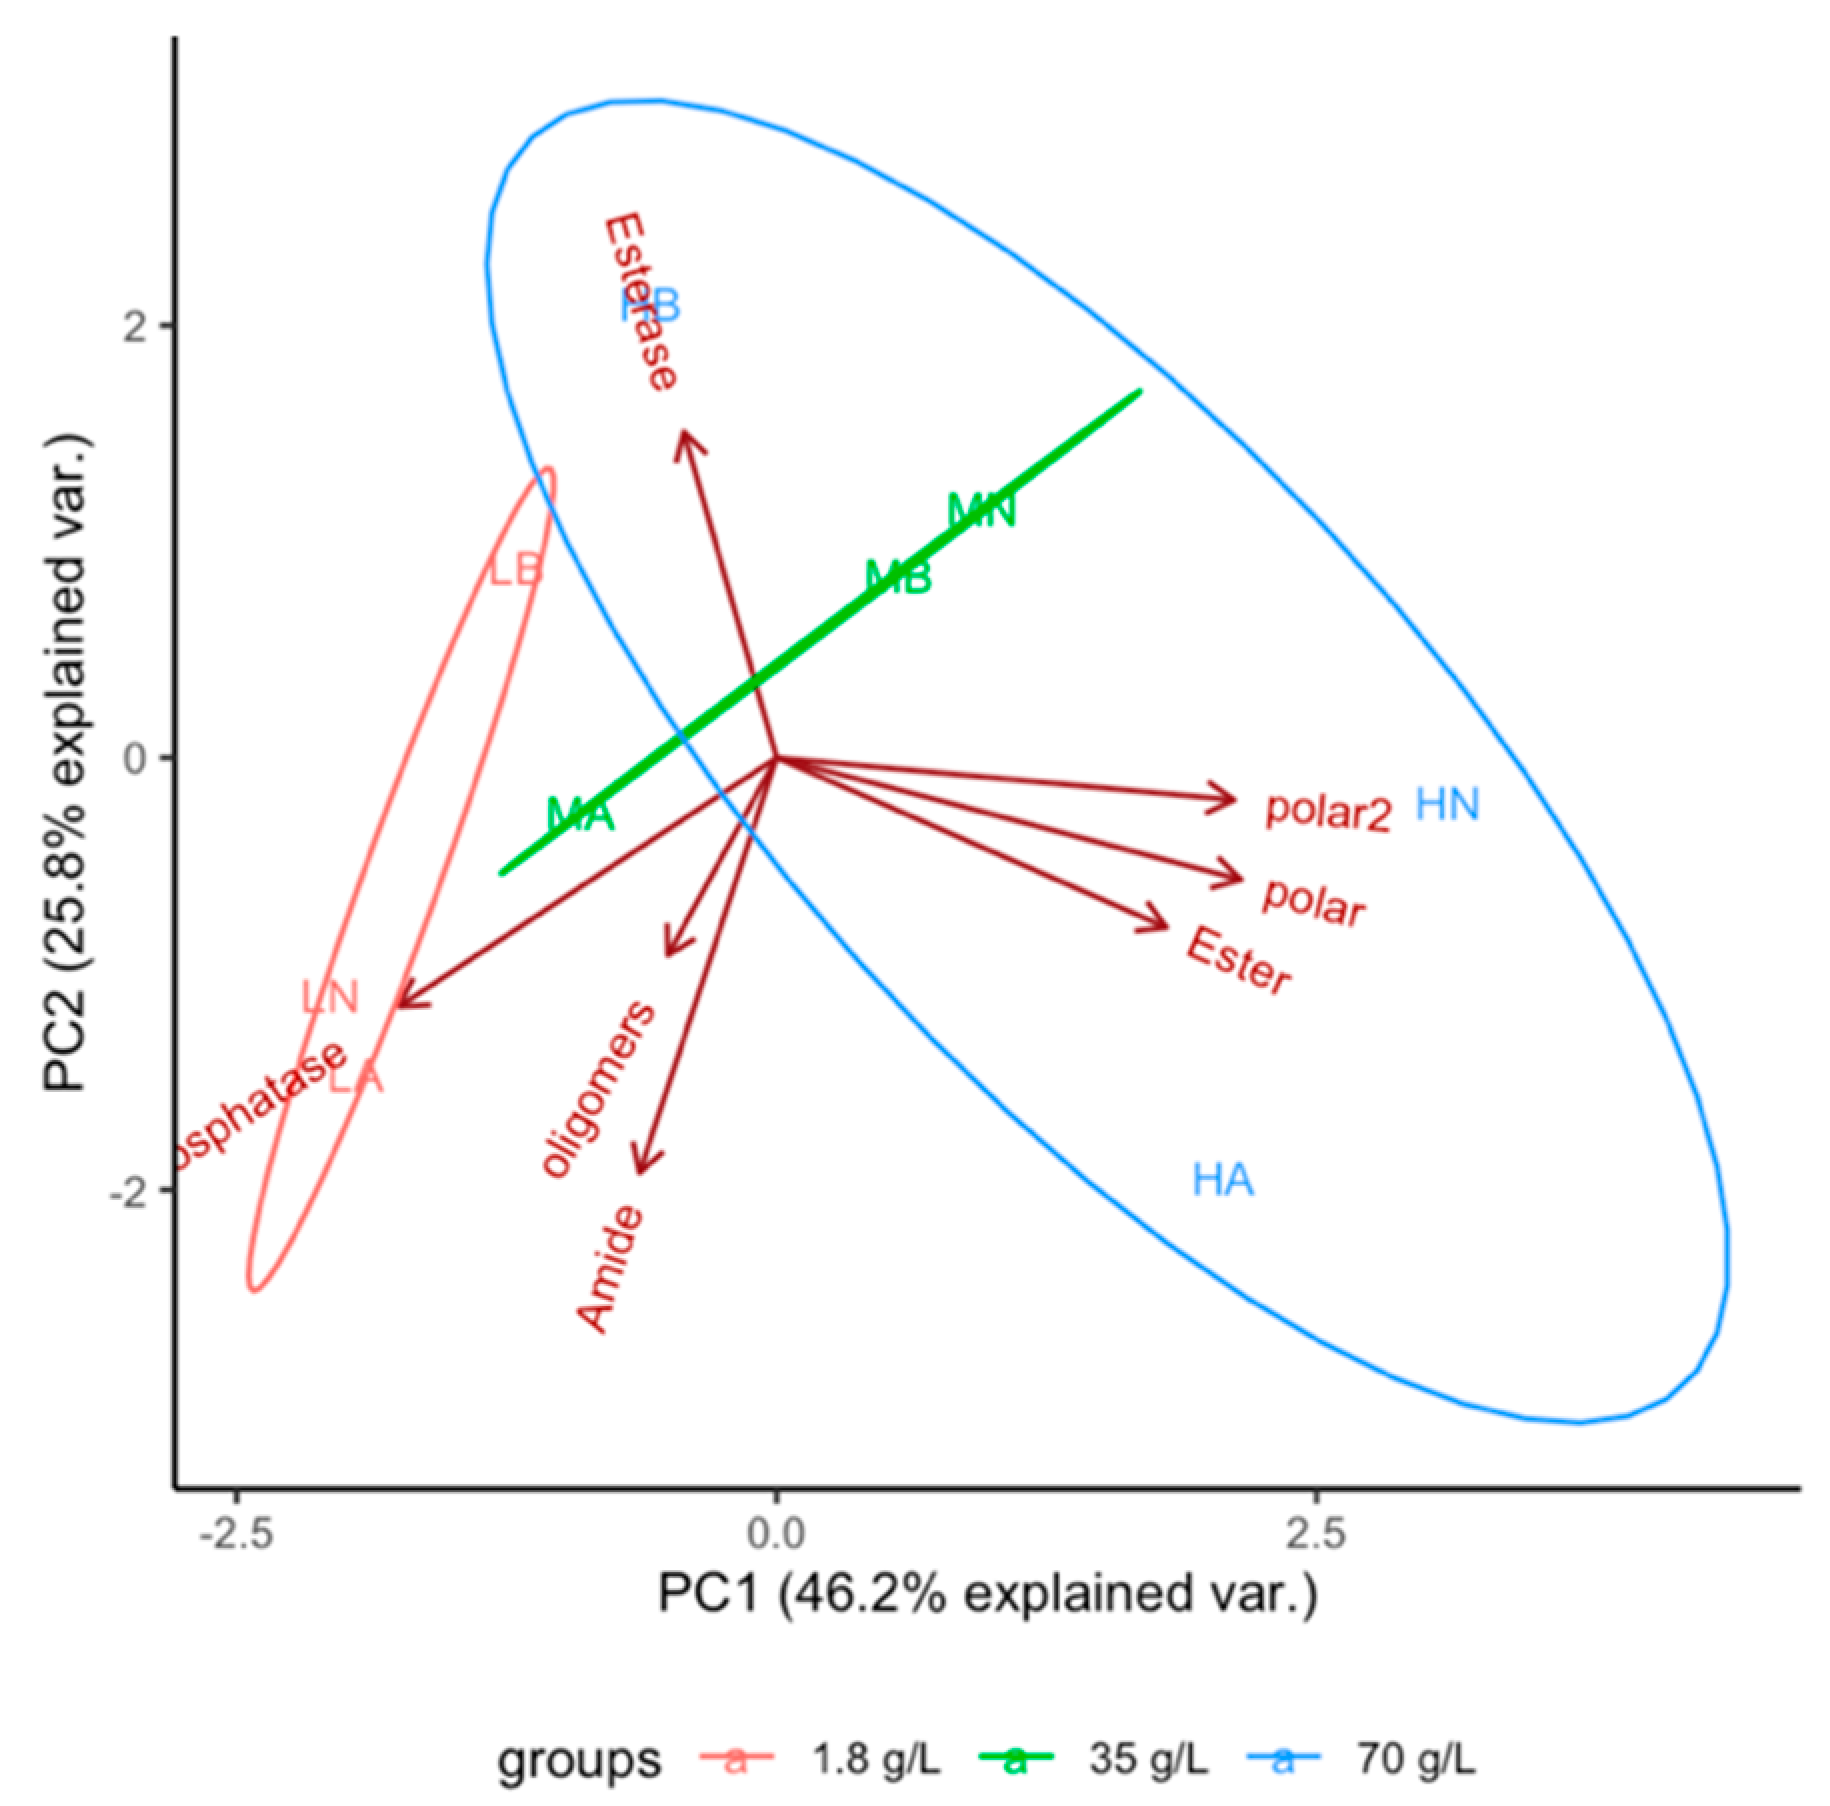
Samples were prepared and rehydrated in acidic (pH 2–3), neutral (pH 6–8), and basic (pH 9–10) conditions. Starting salinity was 1.8 g/L (as a 1/20 dilute ocean), 35 g/L (modern ocean salinity), and 70 g/L (2× modern ocean). These samples were analyzed using the four assays and liquid chromatographic separation then evaluated using principal component analysis (Figure 2).
Figure 2 shows the PCA biplot of the evolved 30 g/L organic mixture rehydrated with ultrapure water. The samples are grouped by initial salt concentration. The first principal component (PC1) trends somewhat with salt concentration, as the three groups increase in salt concentration from left to right, with the exception of HB samples. PC1 was in part determined by the values for small polar molecules on the LC which could indicate that added salts are influencing the retention of organics in those peak areas. The second principal component (PC2) trends somewhat with pH of the sample and is influenced in-part by the esterase values (Figure 1). It is also well established in the literature that the formation of polyesters, depsipeptides, and peptides by condensing hydroxy acids and amino acids is favored under acidic conditions, also driving the variation seen in the acidic samples. Interestingly, the largest ellipsoid is the highest concentration of salts, which is consistent across most of our results.
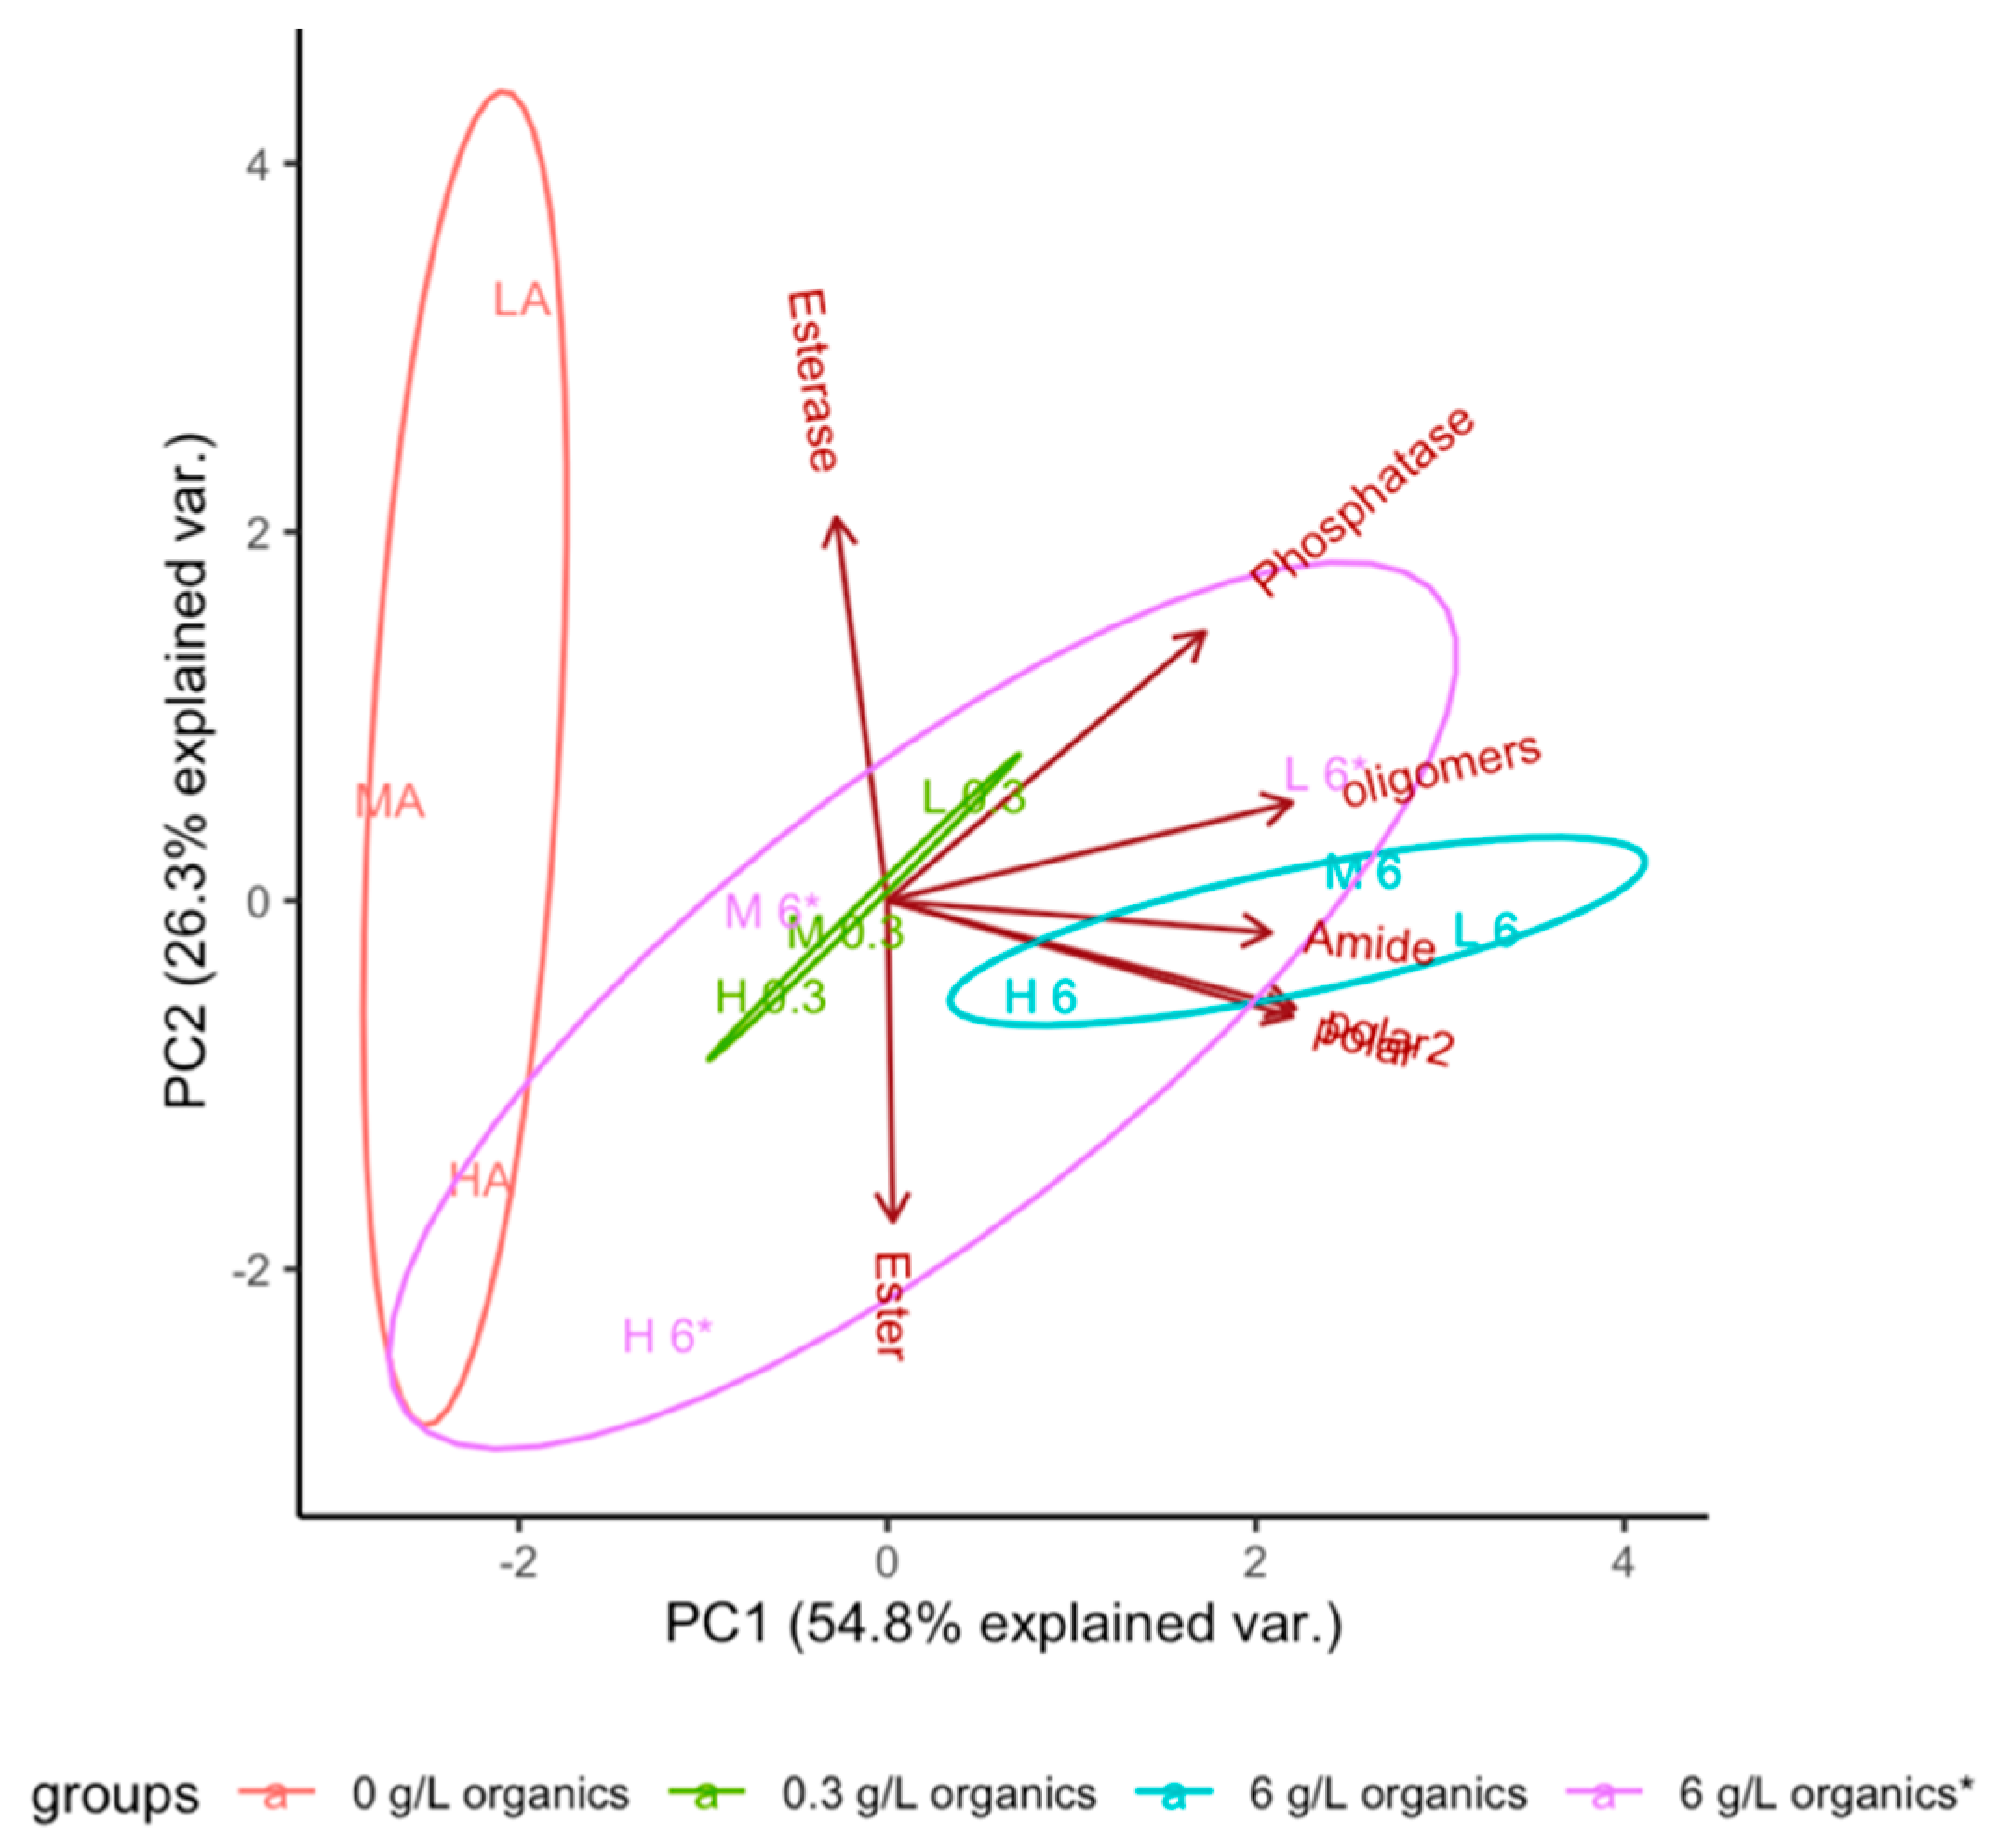
To better model tidal pool type conditions likely found on the transient volcanic islands proposed as early land masses, rehydration solutions with varying amounts of salts and organics were tested: 200-fold dilution of organic starting mixture (0.3 g/L), 10-fold dilution of organic starting mixture (6 g/L), or 10-fold dilution of organic starting mixture with 35 g/L sea salt (6* g/L) were used for rehydrating samples (Figure 3). Samples also varied the starting condition for salinity as above and started with 30 g/L organic material. All samples were between pH 2 and 3 throughout the experiment.
The samples are grouped by the concentration of soup used to rehydrate the samples during the wet–dry cycles in Figure 3. The first principal component is somewhat dependent on the concentration of soup in the rehydration solution. The water-rehydrated samples have lower PC1 values, and the 6 g/L organics samples have high PC1 values. In this “feeding” experiment, for the 6 g/L solutions after five rehydration cycles, a total of 15 g/L of organics were added, influencing the evolution of the mixtures.
The second principal component in Figure 3 appears to trend with the starting concentration of salt, even when salt was present in 35 g/L quantities in the rehydration solution (6* samples). This may indicate that the first round of dehydration plays a large role in the evolution of these soups. The rehydration solution containing 35 g/L sea salt was not tightly grouped, reinforcing the previous observation that salinity plays an important role in chemical evolution.
Figure 4 shows the PCA biplot of three different evolved soups, grouped by the concentration of organics in the starting soup and/or the presence of mineral oil. The starting organic composition unsurprisingly impacts the chemical evolution of these mixtures. The addition of about 5% by weight of mineral oil resulted in variation in both principal components (Figure 4, green vs. blue grouping). The group with the largest variation is the 100 g/L organics + oil samples, suggesting that higher starting concentrations of organics may allow for greater divergence of the products of chemical evolution based on environment.
These three PCA biplots show how the salt concentration, concentration of organics in the rehydration solution, and concentration of organics in the starting soup affect the evolution of these mixtures. When evaluating all three plots as a whole, high salinity samples (either H or * samples) showed large variations in measurements across the groupings, indicating that salinity is playing a role in the chemical evolution of these mixtures.
4. Discussion
This work demonstrates the role of starting mixtures and environmental conditions on the evolution of prebiotic soups. Often, the principal components showed variation by salinity, and high salinity caused larger divergence of samples within other variables (e.g., rehydration solution composition with higher salt has a larger ellipsoid). Many prebiotic reactions previously proposed do not consider salt as part of the reaction mixture; some papers go as far as indicating distilled solutions would be likely due to rainwater on early landmasses. Our results suggest that the outcomes of chemical evolution would be heavily influenced by salts in both the starting solutions and the rehydration solutions, and that functionality could be a direct result of having salt, for example, for esterase activity.
The effect of pH seemed to be less important in distinguishing groups, based on the metrics used here for evaluation. While extremes of pH due to geothermal activity are likely on early Earth, and have been proposed to drive chemical evolution, the weak effect of pH within these samples indicates the divergence between samples was more dependent on other environmental parameters.
Finally, both the starting organics and the organic content of the rehydration solution caused divergence of sample properties to allow for non-overlapping grouping. This finding emphasizes the challenge of exploring chemical evolution: the products of an energetic selection, like wet–dry cycling, are largely dependent on the organic inputs, which cannot be known. Further, even small changes in the inputs, here as the 5% w/w addition of an oil phase, generated non-overlapping outcomes.
Much of the work to date using wet–dry cycling has focused on the formation of polymers or lipids through condensation reactions, specifically targeting those molecules for analysis. This paper, while attempting to quantitate evolution, used the formation of esters and amides of any type, not just polymers, these metrics also need iteration. For example, the ester assay used does not have the same response for all esters; this could result in sample differences being attributed to the formation of a single high-abundance product in certain samples. Additionally, while the metrics used here were appropriate for fast analysis using a 96-well plate and relatively inexpensive reagents, it would be ideal to develop a larger set of evaluations that could be completed quickly and reliably to automate this process and measure a larger set of properties. For example, the redox state of the molecules may be a good indicator of the energetic capacity of the evolved samples. Other functional assays would also be helpful in understanding the evolution of these soups. Finally, using circular dichroism, microscopy, gel permeation chromatography, or other measurements may also aid in understanding the evolution of structures within these samples.
Finally, while wet–dry cycling is a simple mechanism to drive these reactions, other forces may be more relevant to the origins of life. Continental land masses are likely a later geological development and early Earth was a “water world” when biology first appeared. Therefore, other mechanisms for chemical evolution such as high energy radiation, redox chemistry, surface chemistry of both minerals and water/air interfaces, and others could have been more important for chemical evolution. In this work, we established a starting point for the exploration of these spaces, but imagine that expansion, standardization, and technology will be needed to truly probe its depths.
Supplementary Materials
The following supporting information can be downloaded at: https://www.mdpi.com/article/10.3390/sci4020022/s1, Table S1: Soup composition; Table S2.csv: PCA dataset.
Author Contributions
Conceptualization, S.M. and K.F.; methodology, S.M., V.R., K.F. and B.H.; formal analysis, S.M., K.F., B.H. and K.S.; investigation, S.M., K.F., B.H. and K.S.; data curation, K.F.; writing—original draft preparation, S.M.and K.F.; writing—review and editing, S.M., K.F. and V.R.; supervision, S.M. All authors have read and agreed to the published version of the manuscript.
Funding
This research was funded by the National Science Foundation, grant numbers 1724274 and 1723572.
Institutional Review Board Statement
Not applicable.
Informed Consent Statement
Not applicable.
Data Availability Statement
Data is available through the Supplementary Materials.
Conflicts of Interest
The authors declare no conflict of interest.
References
- Miller, S.L.; Urey, H.C. Organic Compound Synthesis on the Primitive Earth. Science 1959, 130, 7. [Google Scholar] [CrossRef] [PubMed]
- Schlesinger, G.; Miller, S.L. Prebiotic synthesis in atmospheres containing CH4, CO, and CO2. J. Mol. Evol. 1983, 19, 376–382. [Google Scholar] [CrossRef] [PubMed]
- Chyba, C.; Sagan, C. Endogenous Production, Exogenous Delivery and Impact-Shock Synthesis of Organic Molecules—An Inventory for the Origins of Life. Nature 1992, 355, 125–132. [Google Scholar] [CrossRef] [PubMed]
- Mehta, C.; Perez, A.; Thompson, G.; Pasek, M. Caveats to Exogenous Organic Delivery from Ablation, Dilution, and Thermal Degradation. Life 2018, 8, 13. [Google Scholar] [CrossRef] [Green Version]
- Sutherland, J.D. The Origin of Life—Out of the Blue. Angew. Chem. Int. Ed. 2016, 55, 104–121. [Google Scholar] [CrossRef]
- Islam, S.; Powner, M.W. Prebiotic Systems Chemistry: Complexity Overcoming Clutter. Chem 2017, 2, 470–501. [Google Scholar] [CrossRef] [Green Version]
- Smith, H.H.; Hyde, A.S.; Simkus, D.N.; Libby, E.; Maurer, S.E.; Graham, H.V.; Kempes, C.P.; Sherwood Lollaret, B.; Chou, L.; Ellington, A.D. The Grayness of the Origin of Life. Life 2021, 11, 498. [Google Scholar] [CrossRef]
- McCollom, T.M. Miller-Urey and Beyond: What Have We Learned About Prebiotic Organic Synthesis Reactions in the Past 60 Years? Annu. Rev. Earth Planet. Sci. 2013, 41, 207–229. [Google Scholar] [CrossRef]
- Schmitt-Kopplin, P.; Gabelica, Z.; Gougeon, R.D.; Fekete, A.; Kanawati, B.; Harir, M.; Gebefuegi, I.; Eckel, G.; Hertkorn, N. High molecular diversity of extraterrestrial organic matter in Murchison meteorite revealed 40 years after its fall. Proc. Natl. Acad. Sci. USA 2010, 107, 2763–2768. [Google Scholar] [CrossRef] [Green Version]
- Wollrab, E.; Scherer, S.; Aubriet, F.; Carré, V.; Carlomagno, T.; Codutti, L.; Ott, A. Chemical Analysis of a “Miller-Type” Complex Prebiotic Broth. Orig. Life Evol. Biosph. 2016, 46, 149–169. [Google Scholar] [CrossRef]
- Scherer, S.; Wollrab, E.; Codutti, L.; Carlomagno, T.; da Costa, S.G.; Volkmer, A.; Bronja, A.; Schmitz, O.J.; Ott, A. Chemical Analysis of a “Miller-Type” Complex Prebiotic Broth. Orig. Life Evol. Biosph. 2017, 47, 381–403. [Google Scholar] [CrossRef] [PubMed] [Green Version]
- Branciamore, S.; Gallori, E.; Szathmáry, E.; Czárán, T. The Origin of Life: Chemical Evolution of a Metabolic System in a Mineral Honeycomb? J. Mol. Evol. 2009, 69, 458–469. [Google Scholar] [CrossRef] [PubMed] [Green Version]
- Griffith, E.C.; Tuck, A.F.; Vaida, V. Ocean & Atmosphere Interactions in the Emergence of Complexity in Simple Chemical Systems. Acc. Chem. Res. 2012, 45, 2106–2113. [Google Scholar] [PubMed]
- Tena-Solsona, M.; Wanzke, C.; Riess, B.; Bausch, A.R.; Boekhoven, J. Self-selection of dissipative assemblies driven by primitive chemical reaction networks. Nat. Commun. 2018, 9, 2044. [Google Scholar] [CrossRef] [PubMed]
- Vincent, L.; Berg, M.; Krismer, M.; Saghafi, S.T.; Cosby, J.; Sankari, T.; Vetsigian, K.; Cleaves, H.J., II; Baum, D.A. Chemical Ecosystem Selection on Mineral Surfaces Reveals Long-Term Dynamics Consistent with the Spontaneous Emergence of Mutual Catalysis. Life 2019, 9, 80. [Google Scholar] [CrossRef] [PubMed] [Green Version]
- Hazen, R.M.; Sverjensky, D.A. Mineral Surfaces, Geochemical Complexities and the Origins of Life. Cold Spring Harb. Perspect. Biol. 2010, 2, a002162. [Google Scholar] [CrossRef] [Green Version]
- Gillams, R.; Jia, T. Mineral Surface-Templated Self-Assembling Systems: Case Studies from Nanoscience and Surface Science towards Origins of Life Research. Life 2018, 8, 10. [Google Scholar] [CrossRef] [Green Version]
- Kobayashi, K.; Kaneko, T.; Saito, T.; Oshima, T. Amino Acid Formation in Gas Mixtures by High Energy Particle Irradiation. Orig. Life Evol. Biosph. 1998, 28, 155–165. [Google Scholar] [CrossRef]
- Scattergood, T.W.; McKay, C.P.; Borucki, W.J.; Giver, L.P.; van Ghyseghem, H.; Parris, J.E.; Miller, S.L. Production of organic compounds in plasmas: A comparison among electric sparks, laser-induced plasmas, and UV light. Icarus 1989, 81, 413–428. [Google Scholar] [CrossRef]
- Airapetian, V.S.; Glocer, A.; Gronoff, G.; Hébrard, E.; Danchi, W. Prebiotic chemistry and atmospheric warming of early Earth by an active young Sun. Nat. Geosci. 2016, 9, 452–455. [Google Scholar] [CrossRef]
- Pearce, B.K.D.; Pudritz, R.E.; Semenov, D.A.; Henning, T.K. Origin of the RNA World: The Fate of Nucleobases in Warm Little Ponds. Proc. Natl. Acad. Sci. USA 2017, 114, 11327–11332. [Google Scholar] [CrossRef] [PubMed] [Green Version]
- Bonfio, C.; Valer, L.; Scintilla, S.; Shah, S.; Evans, D.J.; Jin, L.; Szostak, J.V.; Sasselov, D.D.; Sutherland, J.D.; Mansy, S.S. UV-light-driven prebiotic synthesis of iron–sulfur clusters. Nat. Chem. 2017, 9, 1229. [Google Scholar] [CrossRef] [PubMed]
- Saladino, R.; Bizzarri, B.M.; Botta, L.; Šponer, J.; Šponer, J.E.; Georgelin, T.; Jaber, M.; Rigaud, B.; Kapralov, M.; Tmoshenko, G.N.; et al. Proton irradiation: A key to the challenge of N-glycosidic bond formation in a prebiotic context. Sci. Rep. 2017, 7, 14709. [Google Scholar] [CrossRef] [PubMed] [Green Version]
- Lim, R.W.J.; Fahrenbach, A.C. Radicals in prebiotic chemistry. Pure Appl. Chem. 2020, 92, 1971–1986. [Google Scholar] [CrossRef]
- Simoneit, B.R.T.; Rushdi, A.I.; Deamer, D.W. Abiotic formation of acylglycerols under simulated hydrothermal conditions and self-assembly properties of such lipid products. Adv. Space Res. 2007, 40, 1649–1656. [Google Scholar] [CrossRef]
- Toppozini, L.; Dies, H.; Deamer, D.W.; Rheinstädter, M.C. Adenosine Monophosphate Forms Ordered Arrays in Multilamellar Lipid Matrices: Insights into Assembly of Nucleic Acid for Primitive Life. PLoS ONE 2013, 8, e62810. [Google Scholar] [CrossRef] [Green Version]
- Yu, S.-S.; Krishnamurthy, R.; Fernández, F.M.; Hud, N.V.; Schork, F.J.; Grover, M.A. Kinetics of prebiotic depsipeptide formation from the ester–amide exchange reaction. Phys. Chem. Chem. Phys. 2016, 18, 28441–28450. [Google Scholar] [CrossRef]
- Frenkel-Pinter, M.; Haynes, J.W.; Martin, C.; Petrov, A.S.; Burcar, B.T.; Krishnamurthy, R.; Hud, N.V.; Leman, L.J.; Williams, L.D. Selective incorporation of proteinaceous over nonproteinaceous cationic amino acids in model prebiotic oligomerization reactions. Proc. Natl. Acad. Sci. USA 2019, 116, 16338–16346. [Google Scholar]
- Yu, S.-S.; Solano, M.D.; Blanchard, M.K.; Soper-Hopper, M.T.; Krishnamurthy, R.; Fernández, F.M.; Hud, N.V.; Schork, F.J.; Grover, M.A. Elongation of Model Prebiotic Proto-Peptides by Continuous Monomer Feeding. Macromolecules 2017, 50, 9286–9294. [Google Scholar] [CrossRef]
- Campbell, T.D.; Febrian, R.; McCarthy, J.T.; Kleinschmidt, H.E.; Forsythe, J.G.; Bracher, P.J. Prebiotic condensation through wet–dry cycling regulated by deliquescence. Nat. Commun. 2019, 10, 4508. [Google Scholar] [CrossRef]
- Chandru, K.; Mamajanov, I.; Cleaves, H.J.; Jia, T.Z. Polyesters as a Model System for Building Primitive Biologies from Non-Biological Prebiotic Chemistry. Life 2020, 10, 6. [Google Scholar] [CrossRef] [PubMed] [Green Version]
- Hargreaves, W.R.; Mulvihill, S.J.; Deamer, D.W. Synthesis of Phospholipids and Membranes in Prebiotic Conditions. Nature 1977, 266, 78–80. [Google Scholar] [CrossRef] [PubMed]
- Rajamani, S.; Vlassov, A.; Benner, S.; Coombs, A.; Olasagasti, F.; Deamer, D.W. Lipid-assisted synthesis of RNA-like polymers from mononucleotides. Orig. Life Evol. Biosph. 2008, 38, 57–74. [Google Scholar] [CrossRef] [PubMed]
- Barge, L.M.; Flores, E.; Baum, M.M.; VanderVelde, D.G.; Russell, M.J. Redox and pH gradients drive amino acid synthesis in iron oxyhydroxide mineral systems. Proc. Natl. Acad. Sci. USA 2019, 116, 4828–4833. [Google Scholar] [CrossRef] [PubMed] [Green Version]
- Keller, M.A.; Zylstra, A.; Castro, C.; Turchyn, A.V.; Griffin, J.L.; Ralser, M. Conditional iron and pH-dependent activity of a non-enzymatic glycolysis and pentose phosphate pathway. Sci. Adv. 2016, 2, e1501235. [Google Scholar] [CrossRef] [Green Version]
- Maurer, S.E.; Tølbøl Sørensen, K.; Iqbal, Z.; Nicholas, J.; Quirion, K.; Gioia, M.; Monnard, P.-A.; Hanczyc, M.M. Vesicle Self-Assembly of Monoalkyl Amphiphiles under the Effects of High Ionic Strength, Extreme pH, and High Temperature Environments. Langmuir 2018, 34, 15560–15568. [Google Scholar] [CrossRef]
- Liu, R.; Orgel, L.E. Polymerization of beta-amino acids in aqueous solution. Orig. Life Evol. Biosph. 1998, 28, 47–60. [Google Scholar] [CrossRef]
- Simoneit, B.R.T. Prebiotic organic synthesis under hydrothermal conditions: An overview. Adv. Space Res. 2004, 33, 88–94. [Google Scholar] [CrossRef]
- Rushdi, A.I.; Simoneit, B.R.T. Lipid formation by aqueous Fischer-Tropsch-type synthesis over a temperature range of 100 to 400 degrees C. Orig. Life Evol. Biosph. 2001, 31, 103–118. [Google Scholar] [CrossRef]
- Ying, J.; Chen, P.; Wu, Y.; Yang, X.; Yan, K.; Xu, P.; Zhao, Y. Effect of high hydrostatic pressure on prebiotic peptide synthesis. Chin. Chem. Lett. 2019, 30, 367–370. [Google Scholar] [CrossRef]
- Surman, A.J.; Rodriguez-Garcia, M.; Abul-Haija, Y.M.; Cooper, G.J.T.; Gromski, P.S.; Turk-MacLeod, R.; Mullin, M.; Mathis, C.; Walker, S.I.; Cronin, L. Environmental control programs the emergence of distinct functional ensembles from unconstrained chemical reactions. Proc. Natl. Acad. Sci. USA 2019, 116, 5387–5392. [Google Scholar] [CrossRef] [PubMed] [Green Version]
- Rogers, K.; Pedreira-Segade, U.; Fox, P.; Shelley, J.T.; Steele, A.; Trail, D. Reimagining Origins of Life Research: Innovation and Synthesis via Experimentation, Instrumentation, and Data Analytics. Bull. Am. Astron. Soc. 2021, 43, 215. [Google Scholar]
- Vincent, L.; Colón-Santos, S.; Cleaves, H.J., II; Baum, D.A.; Maurer, S.E. The Prebiotic Kitchen: A Guide to Composing Prebiotic Soup Recipes to Test Origins of Life Hypotheses. Life 2021, 11, 1221. [Google Scholar] [CrossRef] [PubMed]
- Cooper, G.W.; Onwo, W.M.; Cronin, J.R. Alkyl phosphonic acids and sulfonic acids in the Murchison meteorite. Geochim. Cosmochim. Acta 1992, 56, 4109–4115. [Google Scholar] [CrossRef]
- Knauth, L.P. Temperature and salinity history of Precambrian ocean: Implications for the course of microbial evolution. Palaeogeogr. Palaeoclimatol. Palaeoecol. 2005, 219, 53–69. [Google Scholar] [CrossRef]
- Thompson, A.R. A Colorimetric Method for the Determination of Esters. Aust. J. Chem. 1950, 3, 128–135. [Google Scholar] [CrossRef]
- Doran, D.; Abul-Haija, Y.M.; Cronin, L. Emergence of Function and Selection from Recursively Programmed Polymerisation Reactions in Mineral Environments. Angew. Chemie Int. Ed. 2019, 58, 11253–11256. [Google Scholar] [CrossRef]
Figure 1.
Evaluation of functional activity of evolved soups by pH and salinity. Left graph shows esterase activity; right graph shows phosphatase activity. Activity is reported as the absorbance (AU) at 405 nm as the formation of para-nitrophenol. Error bars are the standard deviation (n = 3) from independently dehydrated/rehydrated samples from a single starting soup.

Figure 2.
PCA biplot of evolved soups grouped by starting salinity. Low salinity (L, 1.8 g/L sea salt) is in red; medium salinity (M, 35 g/L sea salt) is in green; high salinity (H, 70 g/L sea salt) is in blue. Samples are also identified by acidic (A), neutral (N), or basic (B) labels within the graph. Brown arrows indicate the contribution by each chemical analysis measurement to components 1 and 2.

Figure 3.
PCA of evolved soups grouped by rehydration solution. Samples rehydrated with ultrapure water (A, 0 g/L organics) are in red; samples rehydrated with 200-fold diluted soup (0.3 g/L organics) are in green; samples rehydrated with 10-fold diluted soup (6 g/L organics) are in cyan; samples rehydrated with 10-fold diluted soup containing 35 g/L sea salt (6*, 6 g/L organics*) are in purple. Starting salinity indicated with L, M, or H (as in Figure 1). All sample pH values were prepared and maintained between 2 and 3.

Figure 4.
PCA of evolved soups grouped by starting organic composition. Samples containing 100 g/L organics including mineral oil are in red, 30 g/L organics not including mineral oil are in green, and 30 g/L including mineral oil are in blue.
Figure 4.
PCA of evolved soups grouped by starting organic composition. Samples containing 100 g/L organics including mineral oil are in red, 30 g/L organics not including mineral oil are in green, and 30 g/L including mineral oil are in blue.

Publisher’s Note: MDPI stays neutral with regard to jurisdictional claims in published maps and institutional affiliations. |
© 2022 by the authors. Licensee MDPI, Basel, Switzerland. This article is an open access article distributed under the terms and conditions of the Creative Commons Attribution (CC BY) license (https://creativecommons.org/licenses/by/4.0/).
Share and Cite
MDPI and ACS Style
Foster, K.; Hillman, B.; Rajaei, V.; Seng, K.; Maurer, S. Evolution of Realistic Organic Mixtures for the Origins of Life through Wet–Dry Cycling. Sci 2022, 4, 22. https://doi.org/10.3390/sci4020022
AMA Style
Foster K, Hillman B, Rajaei V, Seng K, Maurer S. Evolution of Realistic Organic Mixtures for the Origins of Life through Wet–Dry Cycling. Sci. 2022; 4(2):22. https://doi.org/10.3390/sci4020022
Chicago/Turabian StyleFoster, Kiernan, Brooke Hillman, Vahab Rajaei, Kimsorn Seng, and Sarah Maurer. 2022. "Evolution of Realistic Organic Mixtures for the Origins of Life through Wet–Dry Cycling" Sci 4, no. 2: 22. https://doi.org/10.3390/sci4020022