Pixel-Wise vs. Object-Based Impervious Surface Analysis from Remote Sensing: Correlations with Land Surface Temperature and Population Density


1
Department of Remote Sensing, University of Würzburg, Würzburg 97070, Germany
2
Department of Geoinformatics-Z_GIS, University of Salzburg, Salzburg 5020, Austria
*
Author to whom correspondence should be addressed.
Urban Sci. 2018, 2(1), 2; https://doi.org/10.3390/urbansci2010002
Submission received: 21 November 2017
/
Revised: 22 December 2017
/
Accepted: 27 December 2017
/
Published: 2 January 2018
Abstract
:Impervious surface areas (ISA) are heavily influenced by urban structure and related structural features. We examined the effects of object-based impervious surface spatial pattern analysis on land surface temperature and population density in Guangzhou, China, in comparison to classic per-pixel analyses. An object-based support vector machine (SVM) and a linear spectral mixture analysis (LSMA) were integrated to estimate ISA fraction using images from the Chinese HJ-1B satellite for 2009 to 2011. The results revealed that the integrated object-based SVM-LSMA algorithm outperformed the traditional pixel-wise LSMA algorithm in classifying ISA fraction. More specifically, the object-based ISA spatial patterns extracted were more suitable than pixel-wise patterns for urban heat island (UHI) studies, in which the UHI areas (landscape surface temperature >37 °C) generally feature high ISA fraction values (ISA fraction >50%). In addition, the object-based spatial patterns enable us to quantify the relationship of ISA with population density (correlation coefficient >0.2 in general), with global human settlement density (correlation coefficient >0.2), and with night-time light map (correlation coefficient >0.4), and, whereas pixel-wise ISA did not yield significant correlations. These results indicate that object-based spatial patterns have a high potential for UHI detection and urbanization monitoring. Planning measures that aim to reduce the urbanization impacts and UHI intensities can be better supported.
1. Introduction
Impervious surface coverage is increasingly being acknowledged to go hand in hand with urban sprawl while influencing ground runoff, jeopardizing water quality, destroying ecosystem functions and causing the urban heat island (UHI) effect [1,2,3]. Various methodologies have been developed to estimate and map the percentage of impervious surface using different spatial resolution imagery [4,5]. Although the high resolution satellite images, such as IKONOS, Worldview data have been applied in impervious surface mapping [4,6], they are still not readily available and are very expensive in large scale studies. Therefore, the medium (10–100 m) spatial resolution satellite images are the most popular data that have been successfully applied in many previous impervious surface analyses [7,8,9].
Review of impervious surface mapping studies based on medium resolution images has revealed that the linear spectral mixture analysis (LSMA) is one of the effective approaches for estimating ISA [10,11]. With the advantages of extracting sub-pixel information and dealing with the spectral mixture problem effectively, different optimized algorithms based on LSMA model have been developed to improve the pixel-wise ISA estimation [12,13]. Nevertheless, these LSMA models have one problem in common, that the similarity in spectral properties among vegetation, soil, and other impervious surface materials results in a large number of mixed pixels in classification 0. Therefore, the impervious surface tend to be overestimated in regions with small ISA and underestimated in regions with large ISA [14,15].
The Object-Based Image Analysis (OBIA), which focuses on objects and allows combining characteristics of shape, texture, context and relationships with neighbors in the image analyses [16], can provide an alternative to estimate the impervious surface. OBIA aims to improve the image interpretation by identifying structural features of land cover and thereby reducing pixel-wise spectral heterogeneity [17,18]. Thus, it is an important issue in ISA to consider multi-scale texture information jointly to prevent the loss of information and to reduce the misclassifications in ISA analyses.
ISA depicts the differences between urban and non-urban activities, which are closely related to land cover, population distribution, and urban thermal environment. Many previous researches have investigated the relationships between impervious surface and surface features (e.g., land surface temperature, vegetation abundance) [19,20,21]. Most of them, however, only stay at the pixel level. At the same time, land surface temperature (LST) estimates obtained from airborne or satellite thermal infrared remote sensing, have been recognized as a typical characterized feature of measuring urban heat island [22,23,24] and a series of global climate-induced changes [25,26,27]. In particular, examining the quantitatively relationship between LST and urban spatial structure features has been also suggested as the one of the major applications in urban environment study. Nevertheless, many researchers have examined the relationships between ISA and LST only on a certain zoning scale [28,29], leaving whether these zoning areas are appropriate for understanding landscape dynamics rarely discussed. Few studies have explored the quantitative relationships between ISA and landscape cover features at the object level in an automatic or semiautomatic way [30,31]. Subjective delineation of spatial units also makes it difficult to consider multiple dimensions of landscape arrangement [32,33]. Therefore, object-based image segmentation were proposed to scale the landscape information in proper way, in order to exploit the flexibility of object-based spatial units in measuring the relationships between impervious surface change and land cover features [8,34,35].
Our objective is to enhance the understanding of ISA estimation with medium spatial resolution data using object-based classification, and to assess the impact of ISA on the urban thermal environment. Therefore, this study began with applying an object-based algorithm in ISA estimation, with a particular interest in comparing the impact of medium resolution data characteristics (including spectral, textural information) on ISA estimation. Then, in order to test the feasibility and effectiveness of object-based impervious surface mapping, this study compared further the pixel-wise and object-based ISA estimation in analyzing the relationship with population density, human settlement density, LST and night-time light density maps. HJ-1B satellite data in the summer season in three consecutive years (2009–2011) under real and varying atmospheric conditions in southern China were used in this study.
2. Study Area and Data Collection
Guangzhou, with a total area of 7434.4 km2, is located in southern China (shown in Figure 1). As one of the fastest growing cities in China, Guangzhou has become a typical industrial city, with a high intensity of economic activities causing serious urban environmental problems, including suburban underlying surface anomalies [36,37].
One Chinese disaster mitigation satellite constellation-Huanjing (environment in Chinese, including HJ-1A/1B/1C) which was launched in 2008, is capable of monitoring the environment with wide coverage and high revisit interval at medium resolution. This paper used the HJ-1B to investigate further the correlation between the ISA and LST. HJ-1B satellite contains 2 CCD optical cameras, both with 4 bands (30 m resolution) and a broad swath infrared camera (300 m resolution).
3. Methodology
Figure 2 summarizes the hybrid multi-process ISA mapping procedure, which is a progressive process consists of four main stages. Initially, all the pre-processed remote sensing data were used to provide the spectral and spatial information for subsequent steps. Then, the object-based support vector machine (SVM) model was adopted to identify impervious characteristics and distinguish the impervious/pervious area, and later combined with the LSMA method to estimate further ISA fraction in the study area. The estimation results based on this object-based SVM-LSMA were used to compare with the results based solely on LSMA method. Lastly, the two approaches were compared by assessing their potential benefits and tradeoffs in urban spatial pattern.
3.1. Image Pre-Processing
Based on local weather data, HJ-1B data, which were under clear-sky conditions, were acquired between July to September from 2009 to 2011. Four CCD bands of the HJ-1B satellite were used to estimate the ISA. The thermal channel (IRS4) in the infrared scanner (IRS) of the HJ-1B satellite was used for the LST retrieval. Radiometric calibration and atmospheric correction were carried out based on the HJ-1A/1B tools V3.0 and FLAASH Atmospheric Correction Model. Subsequently, the brightness temperature of each pixel was calculated from the Plank radiation function using the wavelength of IRS4. In addition, water was masked out in all images to improve the ISA classification.
3.2. Impervious Surface Analysis
In order to improve the extraction of ISA for a wide range of surface materials and the heterogeneity of the land use classes based on medium resolution images, this study adopted object-based SVM algorithm to extract the pervious/impervious area first. Then, the LSMA algorithm was used in the impervious area to further estimate the ISA percentage.
ESP2 tool [38] was applied to generate an optimized segmentation scale = 50 for the HJ-1B images. Then the multi-resolution segmentation algorithm divided the original images into more than 10,000 objects with the optimized scale of 50. For supervised classification, SVM uses specific training and reference data to generate the model, and then estimates the target value based on the properties of the training data set [39]. Hence, as a compromise between statistical strictness and practical limitations, 120 samples which are 1% percentage of all the objects were selected by stratified random sampling in the SVM model. The samples were divided into two major types: 60 samples of impervious layers (mainly roads, parking lots, residential area, central business districts, rooftop, etc.) and the other 60 samples of pervious layers (including grassland, forest and farmland). These samples were used to identify training areas and train the prior classifier for SVM classification.
The kernel function Radial Basis Function (RBF) of svm.train in LIBSVM [40] was used to train the samples in a high dimensional training space. Then we used the easy.py, grid.py and gnuplot functions of LIBSVM to calculate the optimized parameters C (error tolerance) and gamma (data in high dimension distribution). Finally, the parameters-C = 3 and gamma = 0.33 were imported into the eCognition software (version 9.1, Definiens, Munich, Germany)-SVM classifiers to classify further the pervious and impervious features.
The object-based SVM adjustment algorithm incorporated spectral and textural properties to enhance further classification performance. One of the most prevalent techniques, the Grey-Level Co-occurrence Matrix (GLCM) [10,41], was used to derive textural characteristics. For coarse resolution satellite images, the anisotropy of each urban landscape represents a general isotropy [41]. Therefore, we did not combine the multiple directional influences with the textural features analyses. The calculated texture measures (including contrast, correlation, dissimilarity, mean and variance angular) were chosen to train the SVM classifier through integrating spectral information.
3.3. The Percentage of Impervious Surface Areas Estimation
Wu and Murray [10] found that impervious surfaces are likely on or near the line connecting the low albedo and high albedo endmembers in the feature spaces, and most impervious surfaces can be represented by the linear spectral mixture analysis (LSMA) model as follows in Equation (1).
Equation (1) is used to determine the reflection for each band b in the HJ-1B image, where N is the number of end-members i, is the fraction of end-member, is the reflectance of end-member i in band b, and is the un-modeled residual. and ≥ 0 are required.
Initially, the LSMA was adopted to extract ISA fraction. The Maximum Noise Fraction (MNF) was applied to build a statistical model for the images and to transform the noise covariance matrix of the dataset to an identity matrix. The MNF components suggested that the spectral reflectance of the HJ-1B image might best be represented by a three end-member linear mixing model. These end-members are high albedo (e.g., concrete, clouds, and sand), low albedo (e.g., asphalt road, built-up area), and vegetation (e.g., farmland, grass and trees). Based on the end-member extraction function PPI, three types of end-members were identified according to their feature spaces and associated interpretation. The residual term RMS of all image bands was calculated and used to assess the performance of the model fitness [10].
where is the residual term, M is the image bands.
3.4. Land Surface Temperature Estimation
We initially chose the JM&S (Jiménez-Munoz and Sobrino’s) algorithm to retrieve the LST [42], and then used the LST results to validate the results of ISA. On the basis of Planck’s law, JM&S discovered linear relationship between radiance and temperature, and set up a first order Taylor’s approximation formula around a certain temperature value. A Gaussian trigonometric filter was used as a response function for the thermal infrared band channel.
According to Planck’s law, the radiance emitted by a blackbody at temperature Ts, which can be expressed as
where
From Equations (3) and (4), Lsensor, as the at-sensor radiance, is given in W m−2 sr−1μm−1, and this data can be obtained from the calibration of satellite data. Tsensor represents the at-sensor brightness temperature, and can be obtained from the lookup table based on Equation (4), given in K. is the effective central wavelength for the thermal infrared channel, the of HJ-1B is 11.576 μm. Three atmospheric parameters ψ1, ψ2, ψ3 in the atmospheric functions, are given by:
where is the up-welling atmospheric radiance, is the down-welling radiance.
Overall, depending on the LST retrieval function from Equations (3)–(5), the land surface emissivity (ε) and the water vapor content (w) are the two major variables that need to be calculated to get Ts. Land surface emissivity, which can effectively transmit thermal energy across the surface into the atmosphere, was obtained through the NDVI thresholds method using the following Equation [43]:
where 0 < ε < = 1, is vegetation coverage, given by
where NDVI can be obtained from satellite data, NDVI_Min represents the minimum data of NDVI, and NDVI_Max represents the maximum data of NDVI. and can be obtained from the atmospheric parameters and with the following equation:
represents the correction of thermal radiation, given by:
Atmospheric water vapor content was obtained from the website of global atmospheric monitoring by the University of Wyoming. The JM&S algorithm was validated by comparing the results with MODIS LST products (MOD11_L2), which was resampled with the nearest neighbor algorithm.
3.5. Accuracy Assessment
Accuracy assessment is an important part in ISA estimation. The impervious/pervious surface areas that were classified by object-based SVM model were evaluated by the parameters of overall accuracy and kappa coefficient calculated from an error matrix. In this study, a total of 500 samples at 30 m resolution were randomly selected for accuracy assessment. At the same time, the results of ISA fraction estimated by object-based SVM-LSMA model and LSMA-only model were estimated by the same group of random samples. The values of samples were assigned by the synthetic impervious surfaces based on the integration of population density maps WorldPop (100 m), night-time light images (1 km) and Global Human Settlement Layers (GHSL: 250 m) [44,45,46,47]. The Pearson correlation coefficient (R2) was calculated and used to compare the differences between pixel-wise and object-based ISA fraction related to WorldPop maps, night-time light images and GHSL maps. The root-mean-square error (RMSE) was then used to measure the differences between the estimated ISA fraction and the reference ISA fraction provided by GHSL maps.
4. Results
4.1. Impervious Surface Area Fraction
High resolution imagery data obtained online from Google Earth were used as reference datasets for evaluating the ISA estimation accuracy over the study area. The image classification accuracy achieved at the segmentation scale of 50 ranged from 87.9% to 88.2%, and the corresponding kappa coefficient ranged from 78.6% to 81.2%.
ISA fraction was derived using two methods (LSMA-only method and object-based SVM-LSMA method). The results for 2009 based on the two methods are shown in Figure 3. In the LSMA algorithm, with the end-members’ (high albedo, low albedo, vegetation) spectral information, a fully constrained linear mixture analysis was performed in order to generate a fraction image. The overall estimates of RMS of the LSMA algorithm for the three years were 0.036, 0.054, 0.027 respectively, while the RMS of SVM-LSMA for three years were 0.024, 0.048, 0.025, respectively. Although all of them coincided with the model test standard of 0.2, SVM-LSMA obviously outperformed LSMA.
4.2. The Relationship between Population Density and Impervious Surface Area Fraction
The accuracy assessment was conducted using the reference data and estimation results based on LSMA and object-based SVM algorithm. 100 random points of impervious surface were used as reference, and the reference data of ISA percentage value in the result validation were defined by the percentage imperviousness map based on the regression model of WorldPop (100 m resolution in 2010), Global Human Settlement Layer (GHSL: 250 m resolution in 2014) and Night-time light images (1 km resolution in 2009, 2010, 2011). Table 1 demonstrates that the R2 between pixel-wise LSMA ISA values and GHSL values were 0.062, 0.312, and 0.194 respectively, lower than the correlations between object-based ISA values and GHSL values (0.319, 0.313, and 0.229 respectively). The R2 between pixel-wise LSMA ISA fraction values and WorldPop values (0.168, 0.269, and 0.133 respectively) are also lower than the correlations between object-based ISA fraction values and WorldPop values (0.272, 0.234, and 0.202 respectively). The R2 between pixel-wise LSMA ISA fraction values and Night-time light image values were 0.103, 0.268, and 0.302 respectively, while the correlations between object-based ISA values and Night-time light image values were 0.473, 0.489, and 0.156 respectively. The object-based ISA fraction demonstrated higher degree of correlation with the products of population density, night-time light images and global human settlement layers.
At the same time, the overall estimates of RMSE of the LSMA algorithm for the three years were 0.506, 0.343, 0.357 respectively, with bias of −0.031, −0,070, −0.087. While the RMSE of SVM-LSMA for three years were 0.386, 0.392, 0.468, respectively, with the bias of 0.066, 0.042, 0.326. It is difficult to compare the differences of LSMA algorithm and SVM-LSMA analysis only based on statistical analyses.
4.3. Land Surface Temperature Statistic and Its Relationship with Impervious Surface Areas
The results of LST retrieval (shown in Figure 4) correspond with the average temperature of each of the cities which was provided by the local statistics office. From 2009 to 2011, due to the influence of the construction of a new airport and the relocation and development of new industrial sites in the cities of HuaDu and CongHua, the urban heat center gradually expanded to a larger area. In addition, due to its geographic advantages, the ports in PanYu gradually fueled the economic development of the inland districts of Guangzhou and contributed to opening up its international trade. Along with such developments, the city of PanYu gradually became a new urban heat island. In the northern and northeastern parts of Guangzhou, surrounded by vegetated rolling hills, the UHI phenomenon was not quite as obvious. There was a positive correlation between the LST product of MODIS and that of HJ-1B (0.178, 0.253 and 0.215 in the year of 2009, 2010, and 2011 separately).
In addition, this paper depicts the scatter diagram between the ISA and LST distribution. Figure 5 depicts a correlation between LST and ISA based on LSMA from 2009 and 2011; the correlation parameters were 0.107, 0.137 and 0.258, respectively. Although the distribution of LST and ISA based on LSMA show a positive correlation, a large percentage of high temperature areas are mainly located in areas with a low percentage of ISA in Guangzhou.
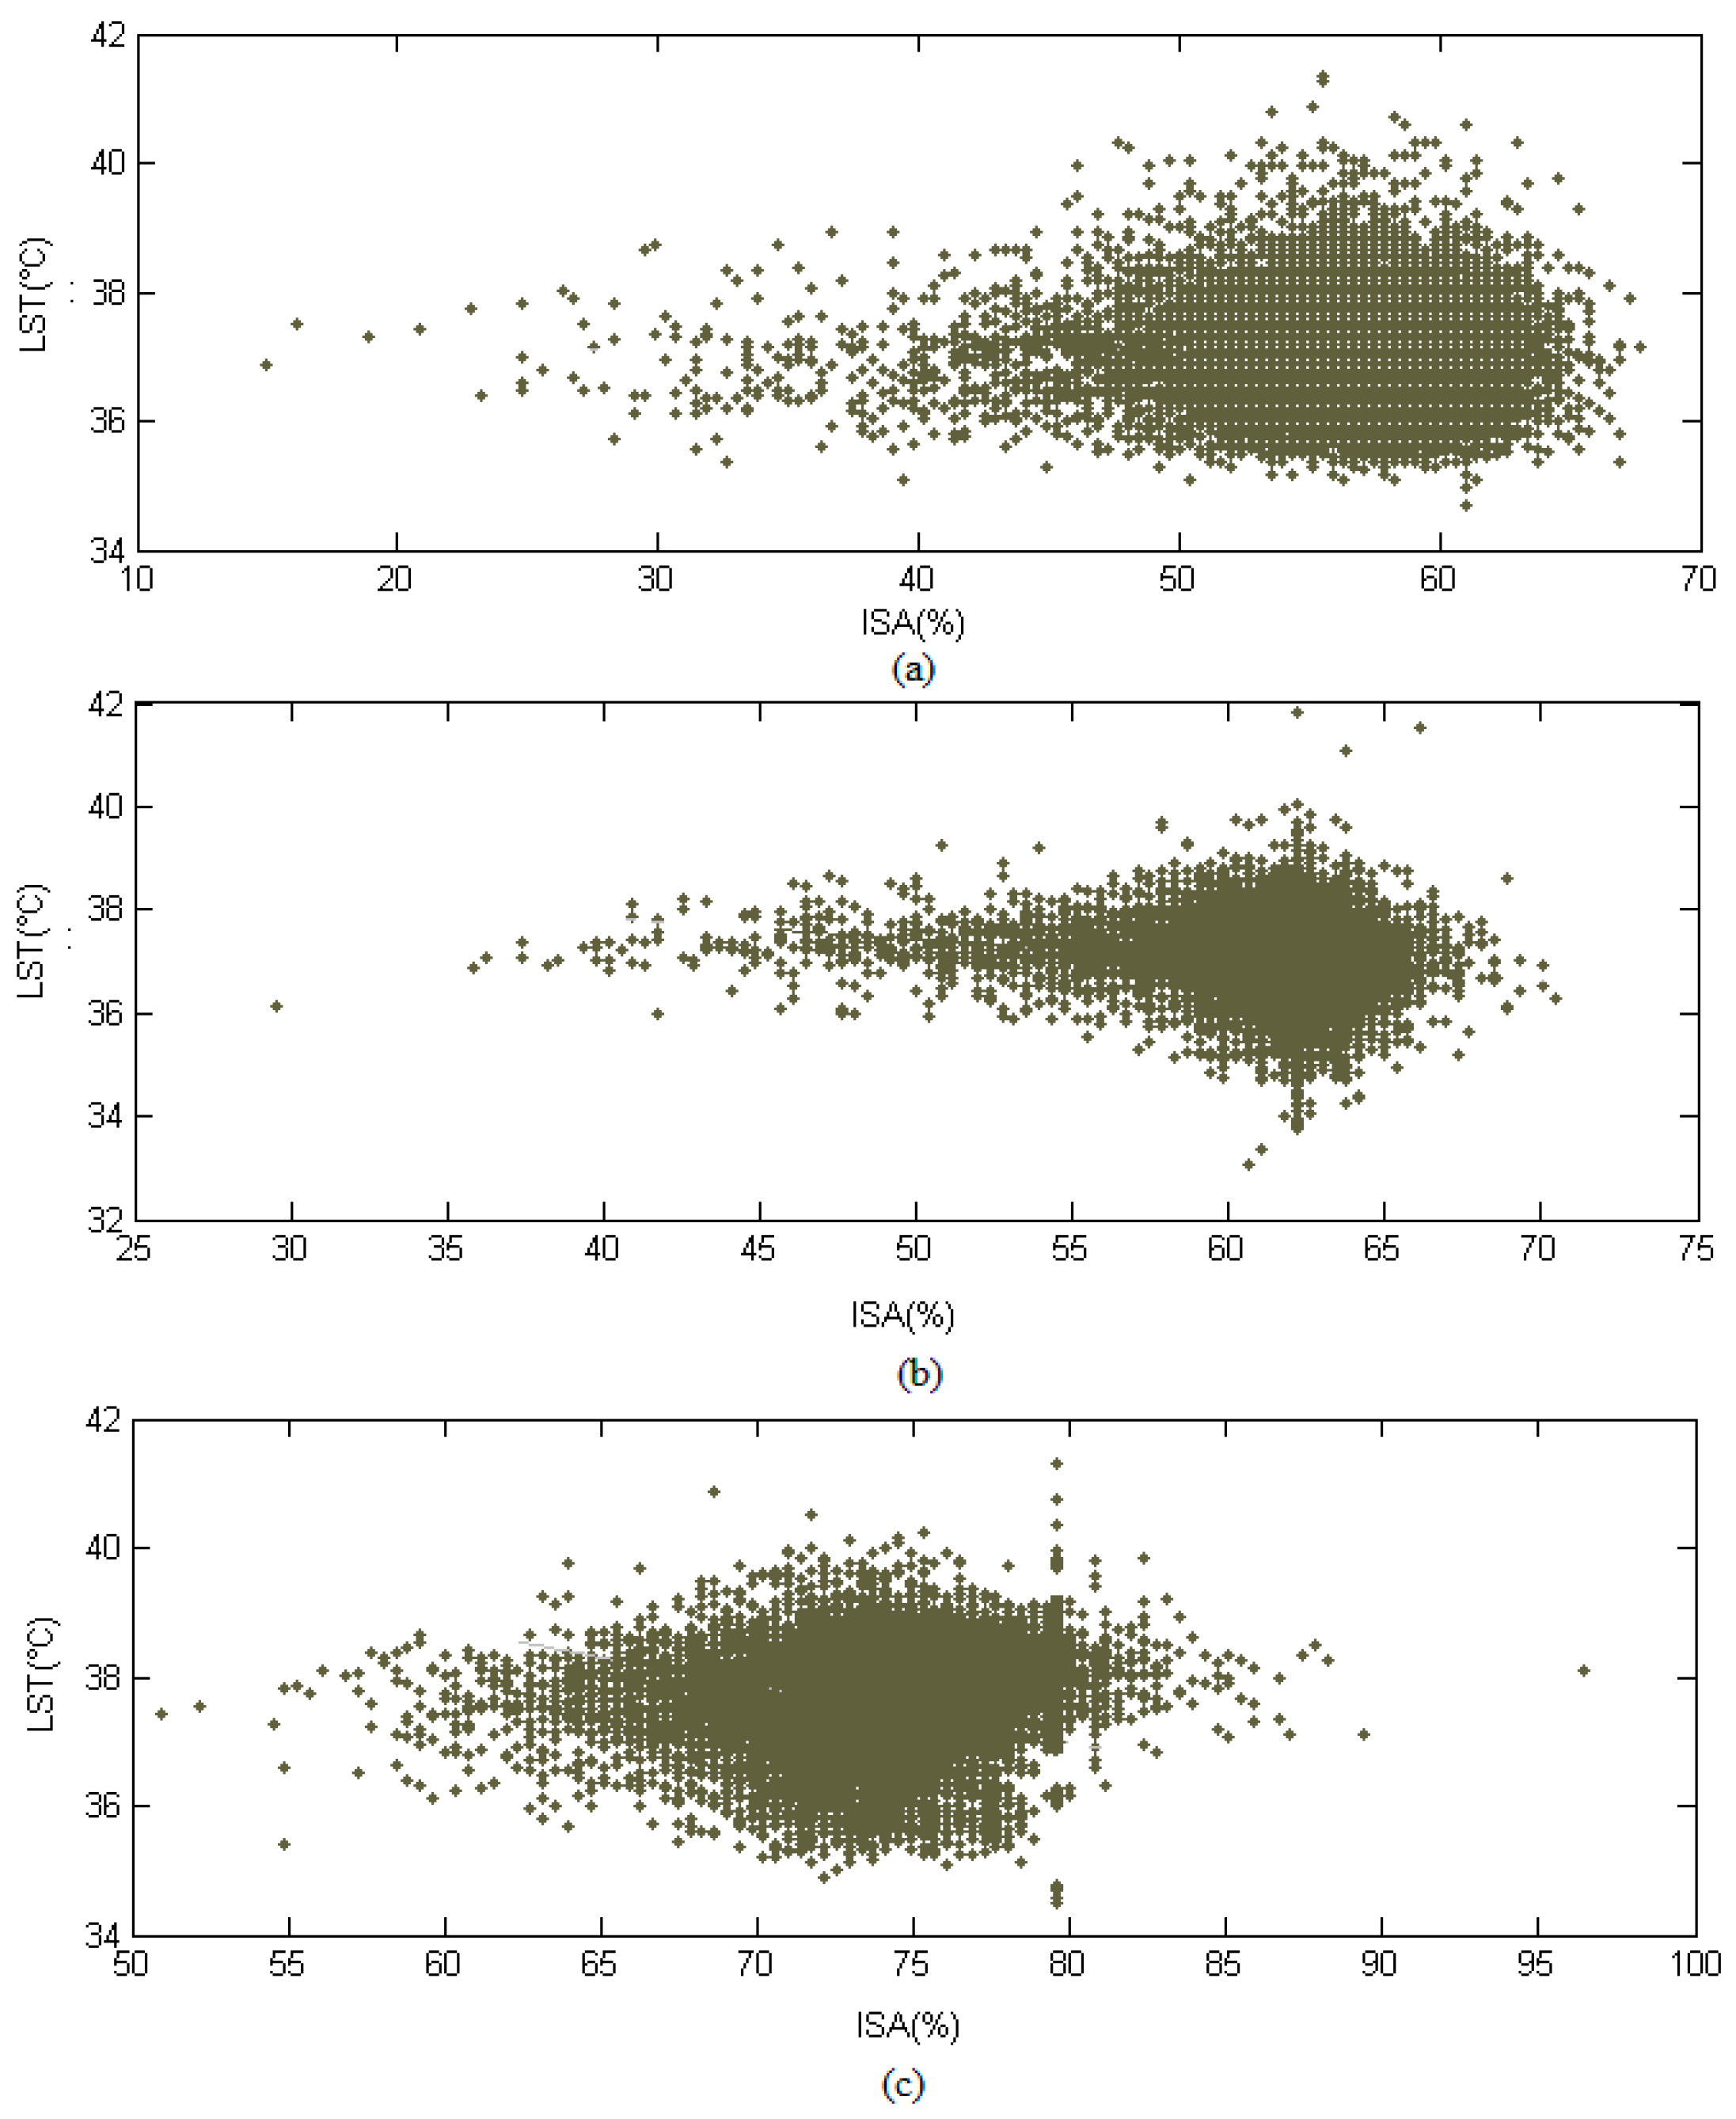
As shown in the Figure 5, the high temperature areas (higher than 37 °C) of three years occupied the high percentage of ISA (more than 50%) less than 1%, of which were 0.0122% in 2009, 0.4317% in 2010, 0% in 2011. By contrast, even though there was a slightly negative correlation between the LST and ISA based on SVM-LSMA from 2009 and 2011 the correlation parameter of which were −0.1043; −0.1395; −0.3935 respectively (shown in Figure 6). All the high temperature areas (higher than 37 °C) were located in areas with a high percentage, the amount of which were 43.15% in 2009, 51.73% in 2010, 65.71% in 2011. Therefore, the ISA results based on the object-based SVM-LSMA algorithm were more coincided with the urban heat phenomenon in Guangzhou.
In order to study further the relationship between ISA and LST, we statistically analyzed the characteristics of LST distribution in the impervious surface areas. Before that, because the data was not recorded on the same date each year, a normalization method was used to reclassify the LST results into three types: High, Normal, and Low. The normalization equations are shown in Table 2. In Table 1, represents the average LST and represents the square deviation of LST.
In Table 3, it shows that there were less than ±0.3 °C fluctuations in the corresponding LST in impervious surface areas from 2009 to 2011. Within these three years, the percentage of the high temperature category in the impervious areas decreased slightly, from 16.24% to 15.02%. There were also some fluctuations in the percentage of normal- and low LST, these two types decreased to 66.48% and 18.47% in 2011. Nevertheless, it was obvious that the percentage of ISA increased steadily within these three years, with the annual growth rate of 2.03%. Its corresponding LST had reached an average LST of 37.24 °C, which was the highest within these three years. In summary, as a result of the rapid urbanization, the total percentage of impervious surface areas is still increasing. The expansion of ISA still plays a significant role in the urban heat island in Guangzhou.
5. Discussion
5.1. Effects of an Object-Based Methodology on Estimating Impervious Surface Area
This research used object-based SVM classification and therefore including textural information to train the SVM classifier. The combination of spectral information, textural characteristics, and neighborhood relationships allowed for a better classification of pervious/impervious surfaces as compared to per-pixel analysis. In particular, the object-based textural information was found to be more efficient for ISA feature extraction than pixel-wise textural information, which was constrained by the window width in the classification procedure.
Some previous studies [6,18] suggested that the pixel-wise LSMA model tends to overestimate ISA and underestimate roads and rural areas in high-density impervious surface areas. While the object-based SVM model in this research dealt with the mixed-pixel problems that exist in traditional pixel-wise LSMA methods to some extent, especially to distinguish roads, building, and parking lots from the vegetation areas and small green spaces from high density residential areas. Therefore, the proposed object-based SVM classification resulted in higher amounts of pure high albedo and low albedo impervious surface areas compared to pixel-wise LSMA methods. At the same time, it is worth noting that the object-based SVM-LSMA model tends to slightly underestimate the ISA fraction in the central business district and to overestimate ISA fraction in less developed areas. This phenomenon may be caused by the constrained linear mixture model that requires that end member fractions are positive and sum to 1 [10].
5.2. Improving the Correlation between Impervious Surface Area and Land Surface Temperature Measures
The differences of pixel-wise and object-based ISA relationship with LST illustrate that the detailed urban morphology information addressed through objects is likely to have improved accuracy and stability for urban thermal environment studies. Although the resulting ISA fractions based on pixel-wise LSMA method are weakly and positively correlated with the LST distribution in Guangzhou, it is suggested that the UHI is inconsistent with the distribution of impervious areas with high fraction values. By contract, the UHI areas (LST higher than 37 °C) were mainly (>43%) located in areas with high ISA fraction values. The distribution of ISA based on the object-based SVM-LSMA method is consistent with the statement that impervious surface is a dominant influencing factor in the urban thermal environment. Our results also confirmed that the impact of urbanization on UHI may be mitigated by optimizing landscape arrangement at object level.
The LST and ISA data derived from remote sensing imagery yielded different UHI spatial patterns. Since the ISA value also contains information of the land surface albedo, it is difficult to explore fully the relationship between LST and surface albedo derived from medium resolution imagery in this research. The robustness of ISA and LST measurements in this study was mainly influenced by the availability of remote sensing data. Using more optical or thermal data of higher resolution would improve further the results. In the future, seasonal LST results should be included to explore further the potential quantitative relationship with ISA. In addition, it will also be worth examining whether there is global warming effect on the LST of Guangzhou.
5.3. Improving the Correlation between Impervious Surface Area, Population Density, Global Human Settlement and Night-Time Light Images
In this research, we assumed that the identification of imperviousness fraction can be correlated with the disaggregated population density maps, night-time light images and global human settlement products based on linear regression model. The correlation between the estimated ISA and the percentage imperviousness seems to be crucial to understanding the capability of widely existing 100 m population density maps, 250 global human settlement density maps and 1 km night-time light maps in quantifying both spatial extent and density variations of ISA. Nevertheless, it is also worth paying attention to the sensitivity of the disaggregation procedure in the future. In our study, although the correlations between the object-based ISA results and the population and human settlement density related maps were weak, it still sheds lights on understanding the underlying types and patterns of urban land cover, and subsequently, social studies on cause-effect relationships. The insignificant correlations between pixel-wise ISA results and the reference data imply that the selection of appropriate spatial units of ISA is very important for delineating the impervious surface pattern and for understanding urbanization processes.
Nevertheless, the robustness of the reference imperviousness maps is still unclear. This should be investigated in future research. In particular, further analyses are required to validate the estimated ISA results in a transferable interpretable way. In addition, although the object-based algorithm in this study selected the spatial pattern in a semiautomatic way, the spatial units were affected by the scale of segmentation. Determination of the segmentation scale most suitable for exploring the ‘cognitive maps of urban’ is the well-known as the modifiable areal unit problem (MAUP) [48]. It will be very interesting to examine how the segmentation scale may affect the observed relationships between ISA and other landscape variables in the future.
5.4. Consequences for City Planning and Smart Cities
Remote sensing can always just play a minor, yet indispensable role for designing and managing smart cities. In smart city research there seem to be an emphasis on energy efficiency, digital services for citizens and mobility. These aspects are without any doubt highly valuable. In fact, smart cities need energy-efficient systems that reduce energy use and reliance on fossil fuels. They need intelligent transport systems that enable citizens to travel more efficiently in private vehicles or using public transport, and they need sophisticated communication technologies that improve public safety and emergency response services.
In addition, smart cities put the citizen in the center of consideration while empowering citizens to improve their lives through better access to data and public services. Nevertheless, smart cities need precise and updated planning documents including maps. This is where remote sensing comes into play. While the degree of changes per year in land use and urban pattern may be relatively small e.g., for European cities, research demonstrates that the rate of changes in countries like China can be impressive. The authors have recently studied urbanization velocity in regard to mapping and monitoring exercises for fast growing cities in the Pearl River Delta in China [49,50]. This study on ISA may only be a very small piece in the puzzle of how remote sensing may contribute to smart city research. However, in combination with these recent findings, we may conclude that for fast growing areas in many parts of the world, remote sensing imagery, both high resolution and medium (e.g., Landsat-like 30 m resolution) build an essential base for smart city planning measures.
6. Conclusions
It is demonstrated that data from the Chinese HJ-1B satellite allow the mapping of impervious surface areas and analyses at a reasonable spatial resolution. The object-based textural characteristics are crucial to separate impervious and pervious areas for such medium resolution images. This research expands our scientific understanding of the effects of landscapes patterns in quantifying the relationships between ISA and other landscape features. The object-based spatial analysis method seem to have a high potential for urban heat island detection and population monitoring. Planners may then counteract impacts of urbanization in a sense that UHI can be mitigated or reduced by optimizing the urban landscape. However, we also confirm that the extraction of impervious surfaces is still challenging because of the complexity of urban and suburban landscapes, particularly at medium spatial resolution. Future impervious surface analyses should incorporate more detailed urban morphology information to improve the accuracy and stability of urban pattern studies.
Acknowledgments
The authors would like to thank Prof. Qingyan Meng from the Institute of Remote Sensing and Digital Earth (RADI) of the Chinese Academy of Sciences for providing the HJ-1B data. This research was partly funded by the Austrian Science Fund (FWF) through the GIScience Doctoral College (DK W 1237-N23), and partly funded by Beijing Key Laboratory of Urban Spatial Information Engineering (NO. 2017202).
Author Contributions
Chunzhu Wei conceived, designed and carried out the experiments and wrote the majority of the paper. She finished the manuscript at the Department of Geoinformatics-Z-GIS, University of Salzburg, Austria; Thomas Blaschke supported Chunzhu Wei when planning and structuring the paper and contributed to the paper, particularly to the introduction, discussion and conclusion sections.
Conflicts of Interest
The authors declare no conflict of interest.
References
- Weng, Q. Remote sensing of impervious surfaces in the urban areas: Requirements, methods, and trends. Remote Sens. Environ. 2012, 117, 34–49. [Google Scholar] [CrossRef]
- Arnold, C.L., Jr.; Gibbons, C.J. Impervious Surface Coverage: The Emergence of a Key Environmental Indicator. J. Am. Plan. Assoc. 1996, 62, 243–258. [Google Scholar] [CrossRef]
- Morse, C.C.; Huryn, A.D.; Cronan, C. Impervious Surface Area as a Predictor of the Effects of Urbanization on Stream Insect Communities in Maine, U.S.A. Environ. Monit. Assess. 2003, 89, 95–127. [Google Scholar] [CrossRef] [PubMed]
- Lu, D.; Weng, Q. Extraction of urban impervious surfaces from an IKONOS image. Int. J. Remote Sens. 2009, 30, 1297–1311. [Google Scholar] [CrossRef]
- Parece, T.E.; Campbell, J.B. Comparing Urban Impervious Surface Identification Using Landsat and High Resolution Aerial Photography. Remote Sens. 2013, 5, 4942–4960. [Google Scholar] [CrossRef]
- Weng, Q.; Hu, X.; Liu, H. Estimating impervious surfaces using linear spectral mixture analysis with multitemporal ASTER images. Int. J. Remote Sens. 2009, 30, 4807–4830. [Google Scholar] [CrossRef]
- Roberts, D.A.; Quattrochi, D.A.; Hulley, G.C.; Hook, S.J.; Green, R.O. Synergies between VSWIR and TIR data for the urban environment: An evaluation of the potential for the Hyperspectral Infrared Imager (HyspIRI) Decadal Survey mission. Remote Sens. Environ. 2012, 117, 83–101. [Google Scholar] [CrossRef]
- Powell, R.L.; Roberts, D.A.; Dennison, P.E.; Hess, L.L. Sub-pixel mapping of urban land cover using multiple endmember spectral mixture analysis: Manaus, Brazil. Remote Sens. Environ. 2007, 106, 253–267. [Google Scholar] [CrossRef]
- Franke, J.; Roberts, D.A.; Halligan, K.; Menz, G. Hierarchical Multiple Endmember Spectral Mixture Analysis (MESMA) of hyperspectral imagery for urban environments. Remote Sens. Environ. 2009, 113, 1712–1723. [Google Scholar] [CrossRef]
- Wu, C.; Murray, A.T. Estimating impervious surface distribution by spectral mixture analysis. Remote Sens. Environ. 2003, 84, 493–505. [Google Scholar] [CrossRef]
- Weng, Q.; Hu, X. Medium Spatial Resolution Satellite Imagery for Estimating and Mapping Urban Impervious Surfaces Using LSMA and ANN. IEEE Trans. Geosci. Remote Sens. 2008, 46, 2397–2406. [Google Scholar] [CrossRef]
- Ward, D.; Phinn, S.R.; Murray, A.T. Monitoring Growth in Rapidly Urbanizing Areas Using Remotely Sensed Data. Prof. Geogr. 2000, 52, 371–386. [Google Scholar] [CrossRef]
- Yang, L.; Huang, C.; Homer, C.G.; Wylie, B.K.; Coan, M.J. An approach for mapping large-area impervious surfaces: synergistic use of Landsat-7 ETM+ and high spatial resolution imagery. Can. J. Remote Sens. 2003, 29, 230–240. [Google Scholar] [CrossRef]
- Lu, D.; Weng, Q.; Li, G. Residential population estimation using a remote sensing derived impervious surface approach. Int. J. Remote Sens. 2006, 27, 3553–3570. [Google Scholar] [CrossRef]
- Sun, Z.; Guo, H.; Li, X.; Lu, L.; Du, X. Estimating urban impervious surfaces from Landsat-5 TM imagery using multilayer perceptron neural network and support vector machine. J. Appl. Remote Sens. 2011, 5. [Google Scholar] [CrossRef]
- Blaschke, T. Object based image analysis for remote sensing. ISPRS J. Photogramm. Remote Sens. 2010, 65, 2–16. [Google Scholar] [CrossRef]
- Luo, L.; Mountrakis, G. Converting local spectral and spatial information from a priori classifiers into contextual knowledge for impervious surface classification. ISPRS J. Photogramm. Remote Sens. 2011, 66, 579–587. [Google Scholar] [CrossRef]
- Youjing, Z.; Liang, C.; Chuan, H. Estimating urban impervious surfaces using LS-SVM with multi-scale texture. 2009. Available online: http://ieeexplore.ieee.org/abstract/document/5137646/ (accessed on 2 January 2018).
- Lu, D.; Weng, Q. Use of impervious surface in urban land-use classification. Remote Sens. Environ. 2006, 102, 146–160. [Google Scholar] [CrossRef]
- Yuan, F.; Bauer, M.E. Comparison of impervious surface area and normalized difference vegetation index as indicators of surface urban heat island effects in Landsat imagery. Remote Sens. Environ. 2007, 106, 375–386. [Google Scholar] [CrossRef]
- Foody, G.M. Status of land cover classification accuracy assessment. Remote Sens. Environ. 2002, 80, 185–201. [Google Scholar] [CrossRef]
- Weng, Q.; Lu, D.; Schubring, J. Estimation of land surface temperature–vegetation abundance relationship for urban heat island studies. Remote Sens. Environ. 2004, 89, 467–483. [Google Scholar] [CrossRef]
- Grimm, N.B.; Faeth, S.H.; Golubiewski, N.E.; Redman, C.L.; Wu, J.; Bai, X.; Briggs, J.M. Global Change and the Ecology of Cities. Science 2008, 319, 756–760. [Google Scholar] [CrossRef] [PubMed]
- Zhou, W.; Huang, G.; Cadenasso, M.L. Does spatial configuration matter? Understanding the effects of land cover pattern on land surface temperature in urban landscapes. Landsc. Urban Plan. 2011, 102, 54–63. [Google Scholar] [CrossRef]
- Woolway, R.I.; Merchant, C.J. Amplified surface temperature response of cold, deep lakes to inter-annual air temperature variability. Sci. Rep. 2017, 7, 4130. [Google Scholar] [CrossRef] [PubMed]
- Schneider, P.; Hook, S.J. Space observations of inland water bodies show rapid surface warming since 1985. Geophys. Res. Lett. 2010, 37, L22405. [Google Scholar] [CrossRef]
- Weng, Q.; Lu, D. A sub-pixel analysis of urbanization effect on land surface temperature and its interplay with impervious surface and vegetation coverage in Indianapolis, United States. Int. J. Appl. Earth Obs. Geoinf. 2008, 10, 68–83. [Google Scholar] [CrossRef]
- Essa, W.; van der Kwast, J.; Verbeiren, B.; Batelaan, O. Downscaling of thermal images over urban areas using the land surface temperature–impervious percentage relationship. Int. J. Appl. Earth Obs. Geoinf. 2013, 23, 95–108. [Google Scholar] [CrossRef]
- Buyantuyev, A.; Wu, J. Urban heat islands and landscape heterogeneity: linking spatiotemporal variations in surface temperatures to land-cover and socioeconomic patterns. Landsc. Ecol. 2010, 25, 17–33. [Google Scholar] [CrossRef]
- Xiao, R.; Ouyang, Z.; Zheng, H.; Li, W.; Schienke, E.W.; Wang, X. Spatial pattern of impervious surfaces and their impacts on land surface temperature in Beijing, China. J. Environ. Sci. 2007, 19, 250–256. [Google Scholar] [CrossRef]
- Zhang, Y.; Odeh, I.O.A.; Han, C. Bi-temporal characterization of land surface temperature in relation to impervious surface area, NDVI and NDBI, using a sub-pixel image analysis. Int. J. Appl. Earth Obs. Geoinf. 2009, 11, 256–264. [Google Scholar] [CrossRef]
- Parenteau, M.-P.; Sawada, M.C. The modifiable areal unit problem (MAUP) in the relationship between exposure to NO2 and respiratory health. Int. J. Health Geogr. 2011, 10, 58. [Google Scholar] [CrossRef] [PubMed]
- Frate, L.; Saura, S.; Minotti, M.; Di Martino, P.; Giancola, C.; Carranza, M.L. Quantifying Forest Spatial Pattern Trends at Multiple Extents: An Approach to Detect Significant Changes at Different Scales. Remote Sens. 2014, 6, 9298–9315. [Google Scholar] [CrossRef]
- Blaschke, T.; Hay, G.J.; Kelly, M.; Lang, S.; Hofmann, P.; Addink, E.; Queiroz Feitosa, R.; van der Meer, F.; van der Werff, H.; van Coillie, F.; et al. Geographic Object-Based Image Analysis—Towards a new paradigm. ISPRS J. Photogramm. Remote Sens. 2014, 87, 180–191. [Google Scholar] [CrossRef] [PubMed]
- Hsieh, P.-F.; Lee, L.C.; Chen, N.-Y. Effect of spatial resolution on classification errors of pure and mixed pixels in remote sensing. IEEE Trans. Geosci. Remote Sens. 2001, 39, 2657–2663. [Google Scholar] [CrossRef]
- Yang, J.; Liu, H.-Z.; Ou, C.-Q.; Lin, G.-Z.; Zhou, Q.; Shen, G.-C.; Chen, P.-Y.; Guo, Y. Global climate change: Impact of diurnal temperature range on mortality in Guangzhou, China. Environ. Pollut. 2013, 175, 131–136. [Google Scholar] [CrossRef] [PubMed]
- Xu, H.; Ding, F.; Wen, X. Urban Expansion and Heat Island Dynamics in the Quanzhou Region, China. IEEE J. Sel. Top. Appl. Earth Obs. Remote Sens. 2009, 2, 74–79. [Google Scholar] [CrossRef]
- Drăguţ, L.; Csillik, O.; Eisank, C.; Tiede, D. Automated parameterisation for multi-scale image segmentation on multiple layers. ISPRS J. Photogramm. Remote Sens. 2014, 88, 119–127. [Google Scholar] [CrossRef] [PubMed]
- Tzotsos, A.; Argialas, D. Support vector machine classification for object-based image analysis. In Object-Based Image Analysis; Lecture Notes in Geoinformation and Cartography; Springer: Berlin/Heidelberg, Germany, 2008; pp. 663–677. ISBN 978-3-540-77057-2. [Google Scholar]
- Chang, C.-C.; Lin, C.-J. LIBSVM: A Library for Support Vector Machines. ACM Trans. Intell. Syst. Technol. 2011, 2, 1–27. [Google Scholar] [CrossRef]
- Clausi, D.A. An analysis of co-occurrence texture statistics as a function of grey level quantization. Can. J. Remote Sens. 2002, 28, 45–62. [Google Scholar] [CrossRef]
- Jiménez-Muñoz, J.C.; Sobrino, J.A. A generalized single-channel method for retrieving land surface temperature from remote sensing data. J. Geophys. Res. Atmos. 2003, 108, 4688. [Google Scholar] [CrossRef]
- Li, H.; Liu, Q.; Zhong, B.; Du, Y.; Wang, H.; Wang, Q. A Single-Channel Algorithm for Land Surface Temperature Retrieval from HJ-1B/IRS Data Based on a Parametric Model. 2010. Available online: http://ieeexplore.ieee.org/abstract/document/5649801/ (accessed on 2 January 2018).
- Wickham, J.D.; Stehman, S.V.; Gass, L.; Dewitz, J.; Fry, J.A.; Wade, T.G. Accuracy assessment of NLCD 2006 land cover and impervious surface. Remote Sens. Environ. 2013, 130, 294–304. [Google Scholar] [CrossRef]
- Xian, G.Z.; Homer, C.G.; Dewitz, J.; Fry, J.; Hossain, N.; Wickham, J. Change of impervious surface area between 2001 and 2006 in the conterminous United States. Photogramm. Eng. Remote Sens. 2011, 77, 5. [Google Scholar]
- Tatem, A.J. WorldPop, Open Data for Spatial Demography. Available online: https://www.nature.com/articles/sdata20174 (accessed on 31 December 2017).
- Pesaresi, M.; Ehrilch, D.; Florczyk, A.J.; Freire, S.; Julea, A.; Kemper, T.; Soille, P.; Syrris, V. GHS Built-Up Grid, Derived From Landsat, Multitemporal (1975, 1990, 2000, 2014). European Commission, Joint Research Centre (JRC) [Dataset] PID. Available online: http://data.europa.eu/89h/jrc-ghsl-ghs_built_ldsmt_globe_r2015b (accessed on 2 January 2018).
- Openshaw, S. An optimal zoning approach to the study of spatially aggregated data. In Spatial Representation and Spatial Interaction; Studies in Applied Regional Science; Springer: Boston, MA, USA, 1978; pp. 95–113. ISBN 978-90-207-0717-5. [Google Scholar]
- Wei, C.; Taubenböck, H.; Blaschke, T. Measuring urban agglomeration using a city-scale dasymetric population map: A study in the Pearl River Delta, China. Habitat Int. 2017, 59, 32–43. [Google Scholar] [CrossRef]
- Wei, C.; Blaschke, T.; Kazakopoulos, P.; Taubenböck, H.; Tiede, D. Is Spatial Resolution Critical in Urbanization Velocity Analysis? Investigations in the Pearl River Delta. Remote Sens. 2017, 9, 80. [Google Scholar] [CrossRef]
Figure 1.
The study area of Guangzhou, China.
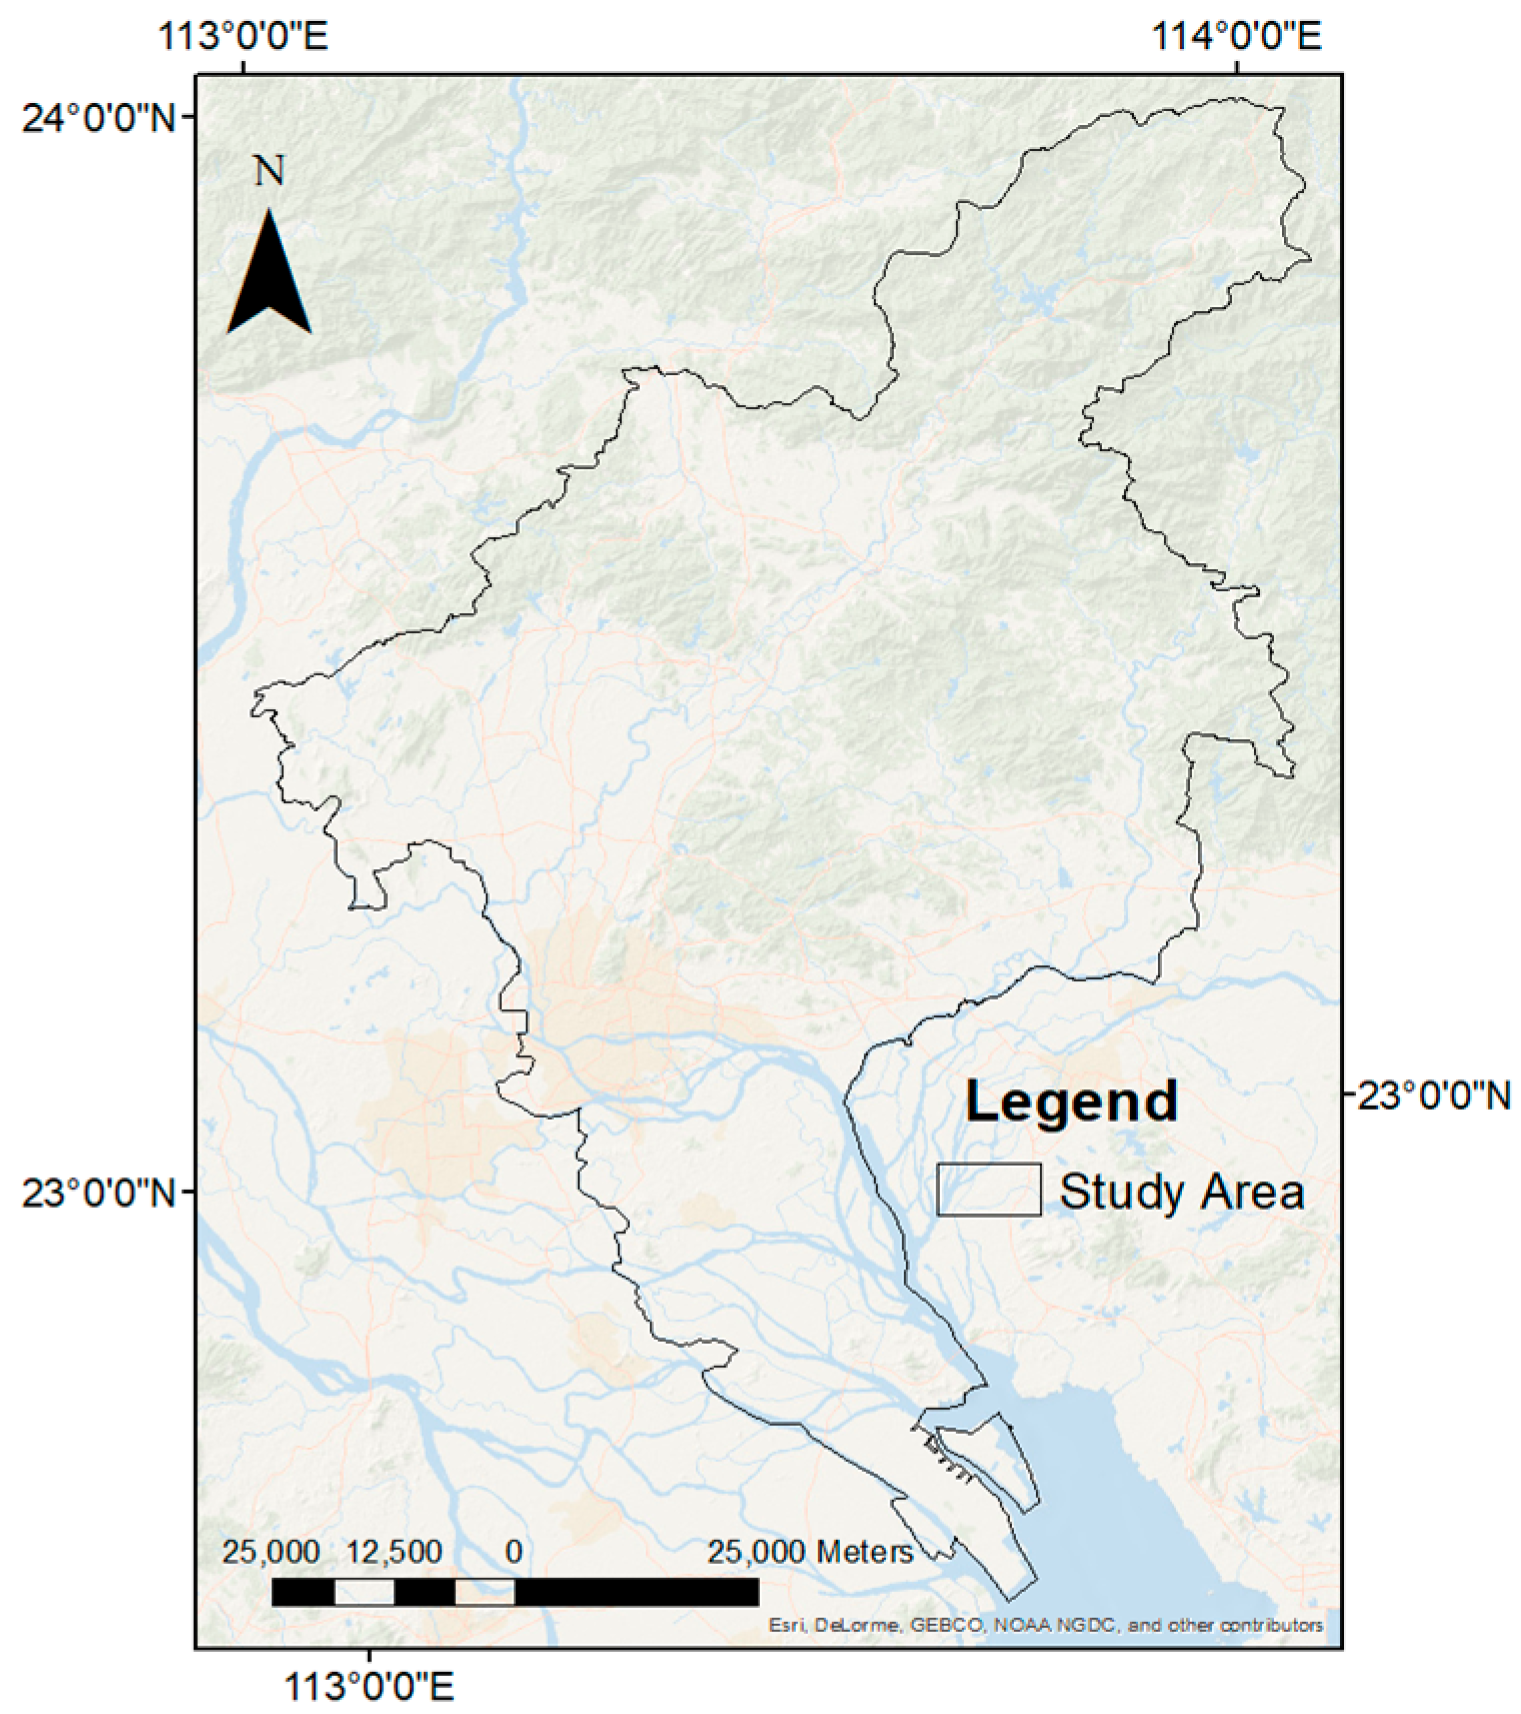
Figure 2.
Flowchart of impervious surface analysis: Gray boxes represent inputs and general processes, white boxes represent specific methods and white boxes with dashed borders represent results.
Figure 2.
Flowchart of impervious surface analysis: Gray boxes represent inputs and general processes, white boxes represent specific methods and white boxes with dashed borders represent results.
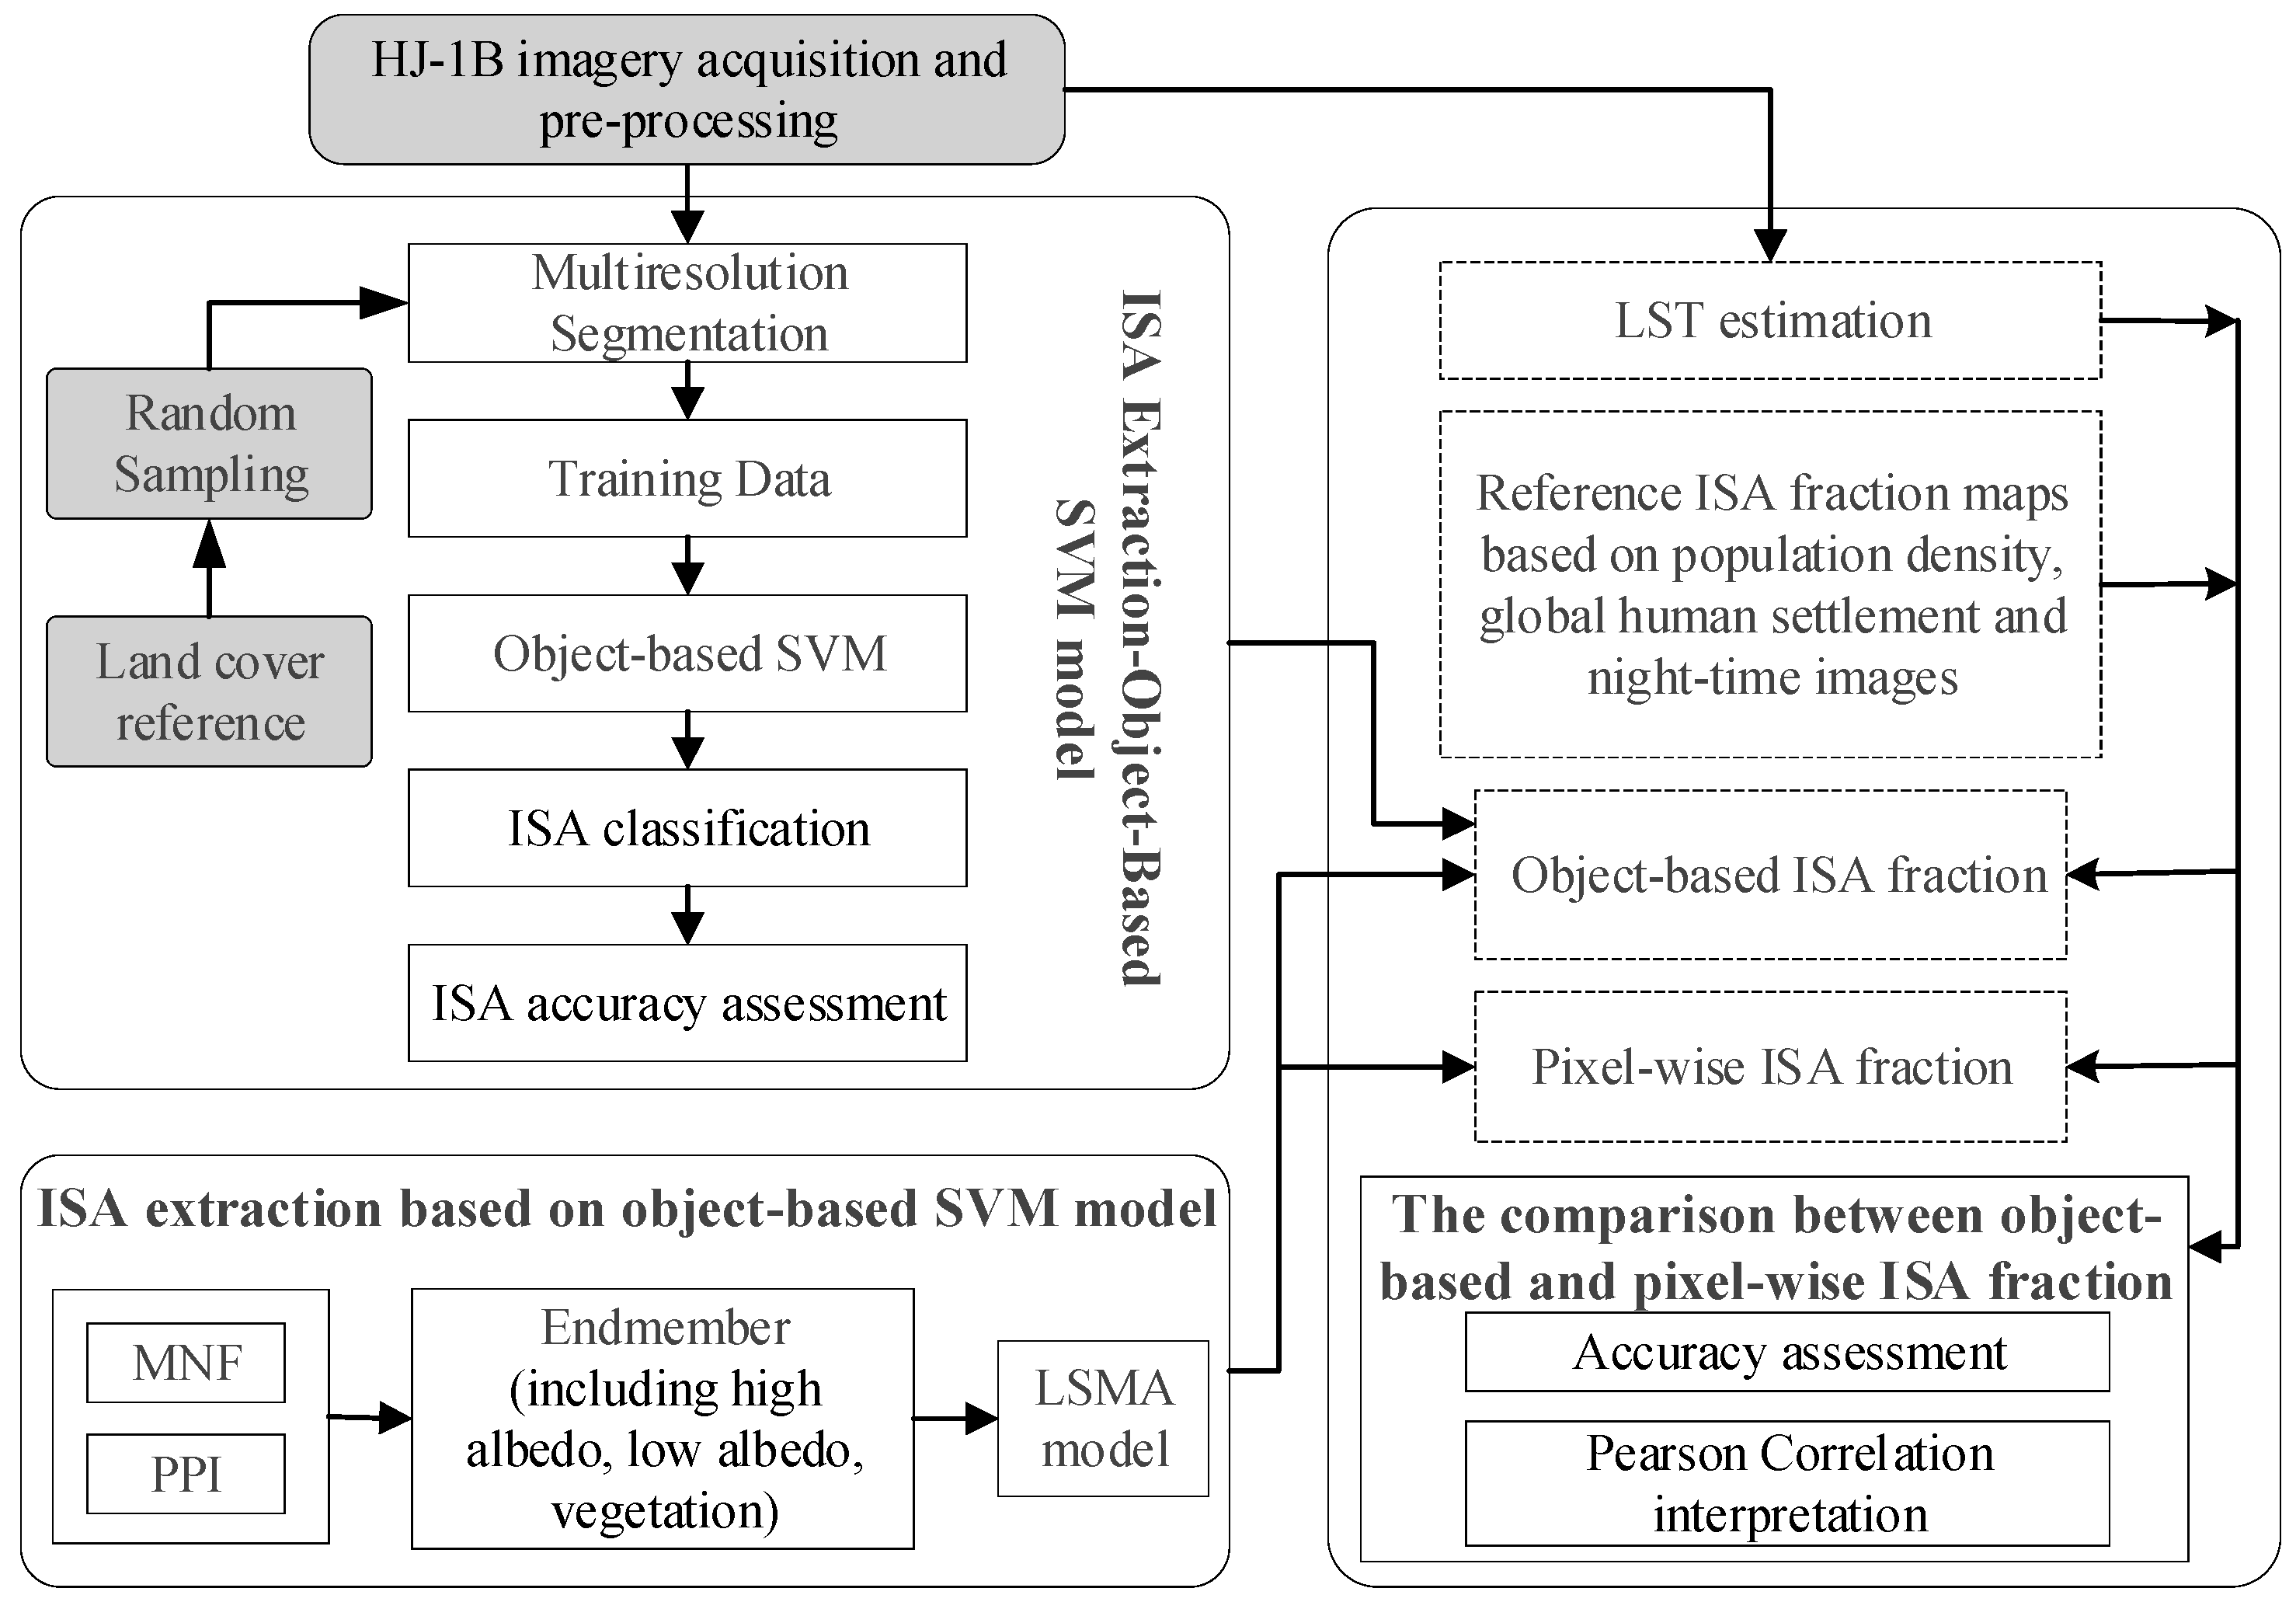
Figure 3.
The estimation of impervious surface fraction based on two methods. (a) Pixel-wise linear spectral mixture analysis (b) Object-based support vector machine-linear spectral mixture analysis.
Figure 3.
The estimation of impervious surface fraction based on two methods. (a) Pixel-wise linear spectral mixture analysis (b) Object-based support vector machine-linear spectral mixture analysis.
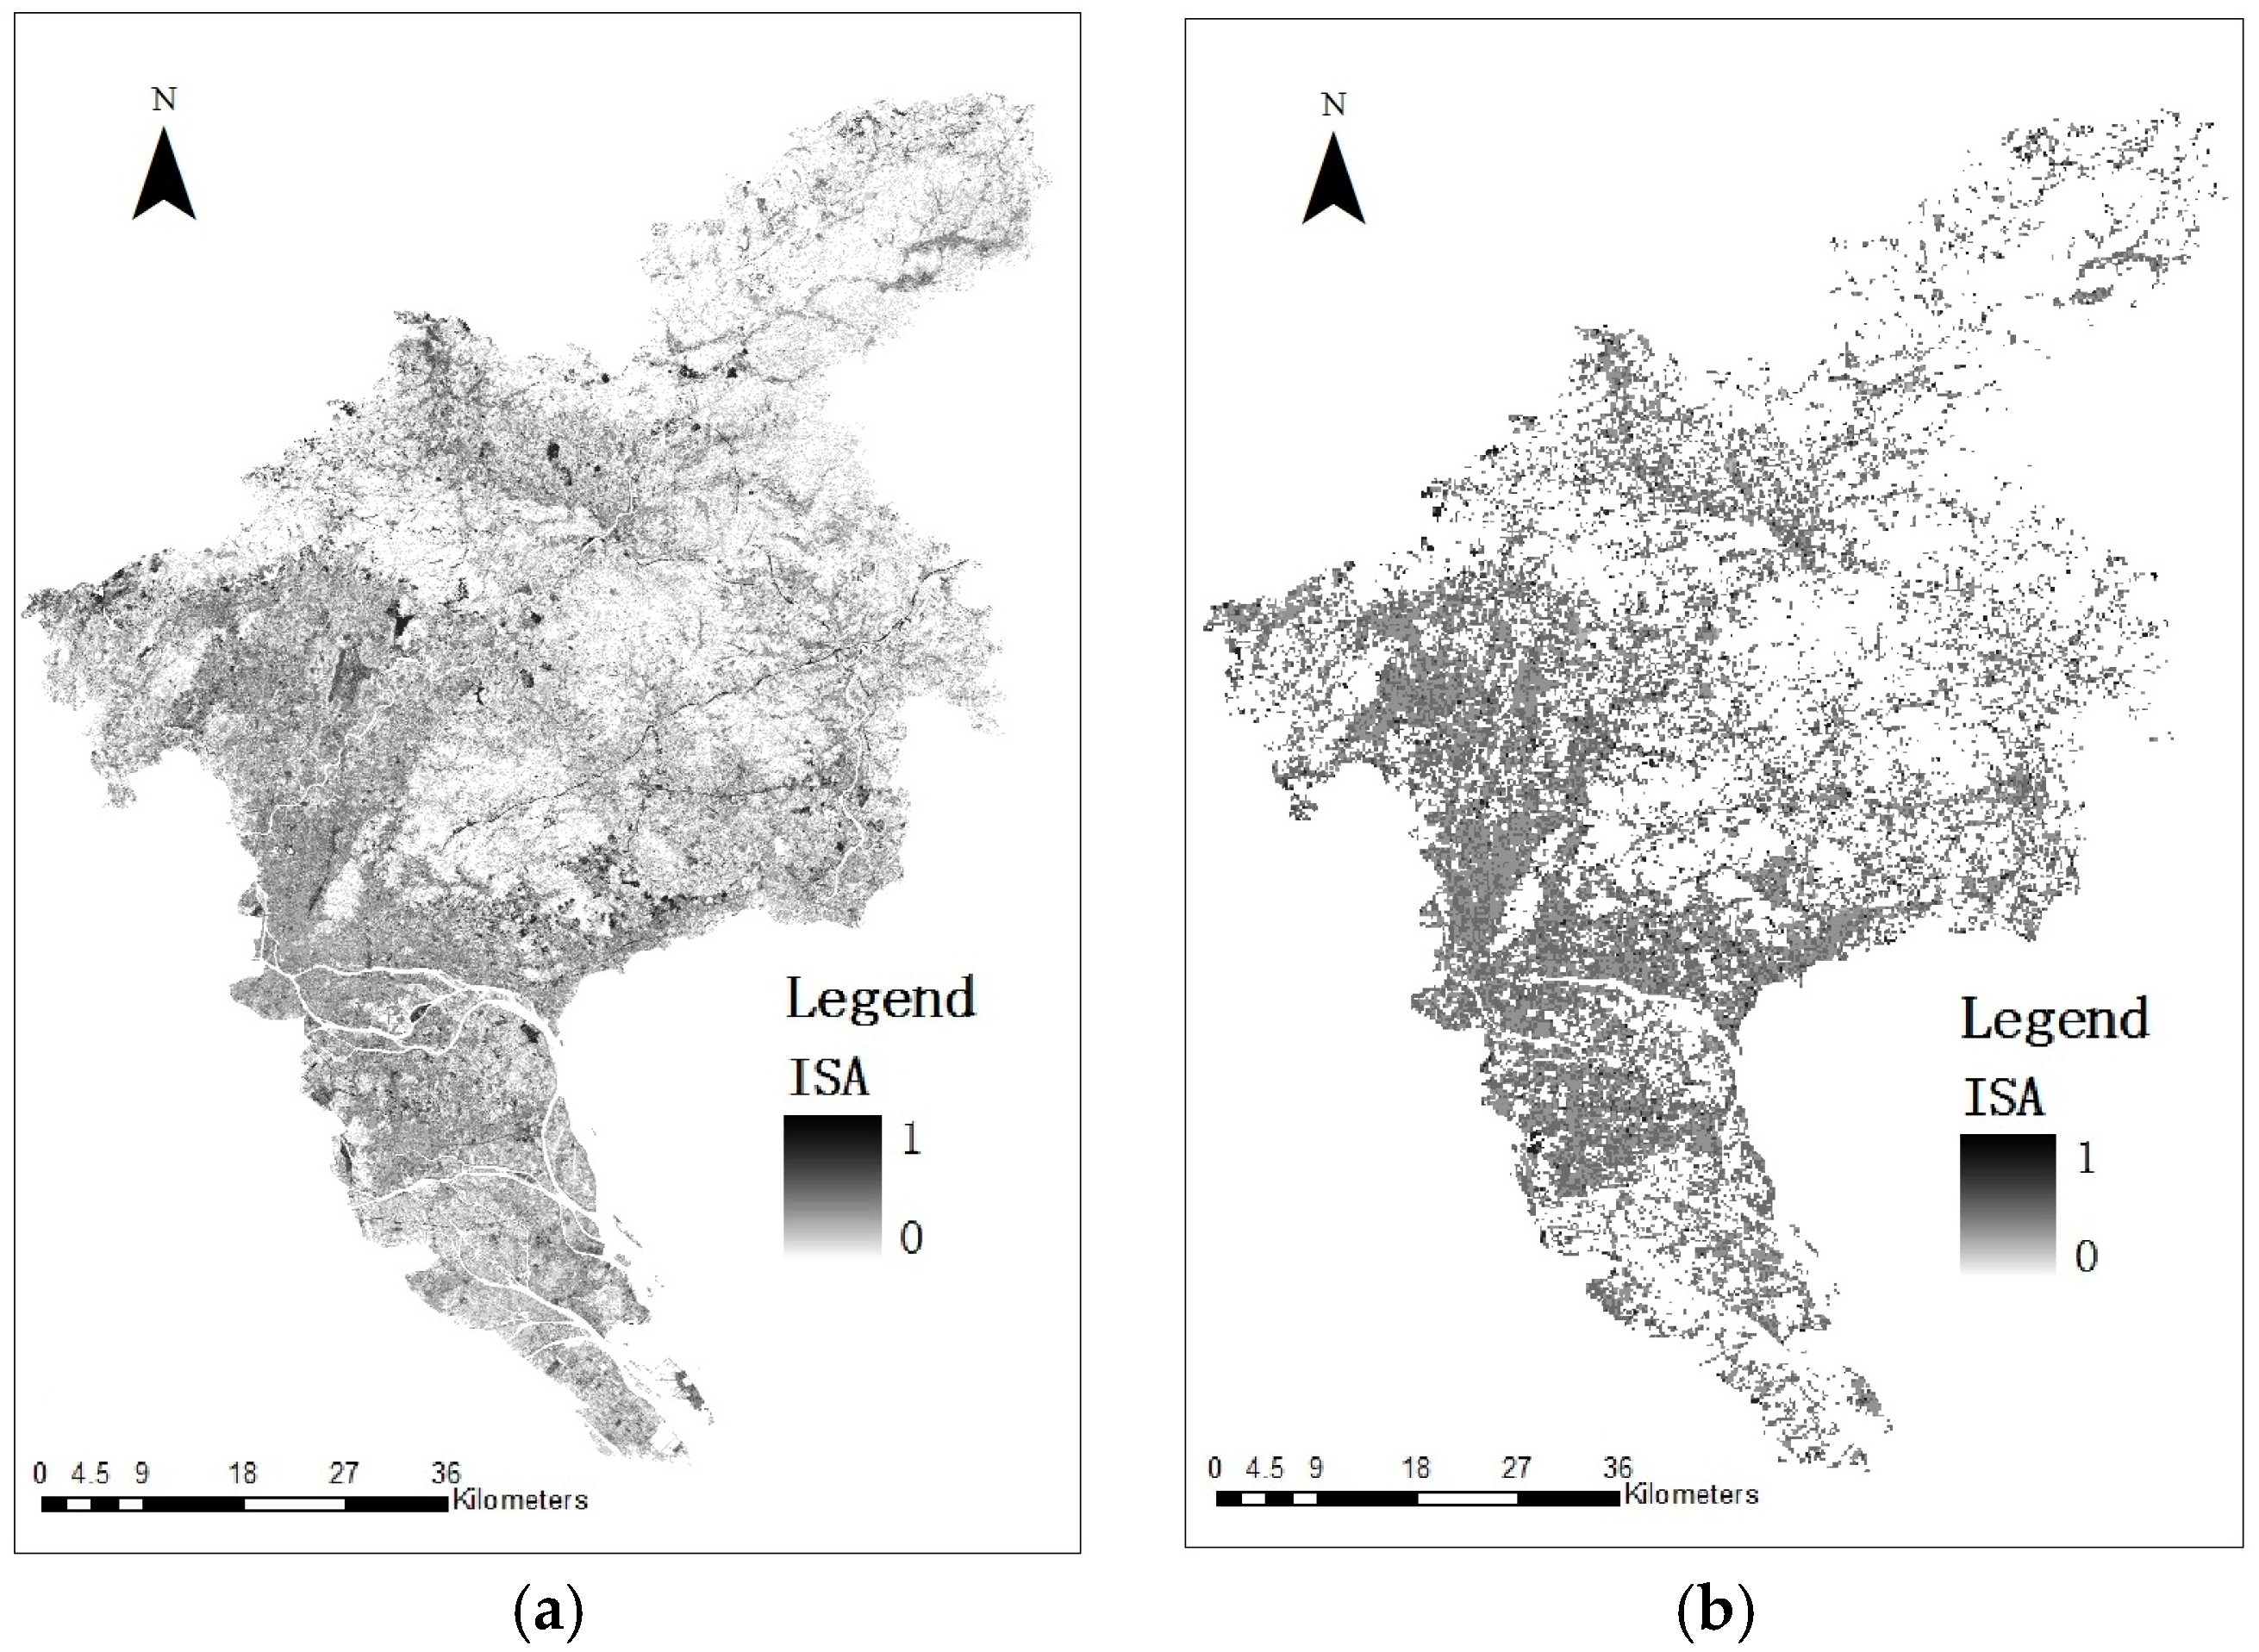
Figure 4.
Land surface temperature distribution of Guangzhou from 2009 to 2010.
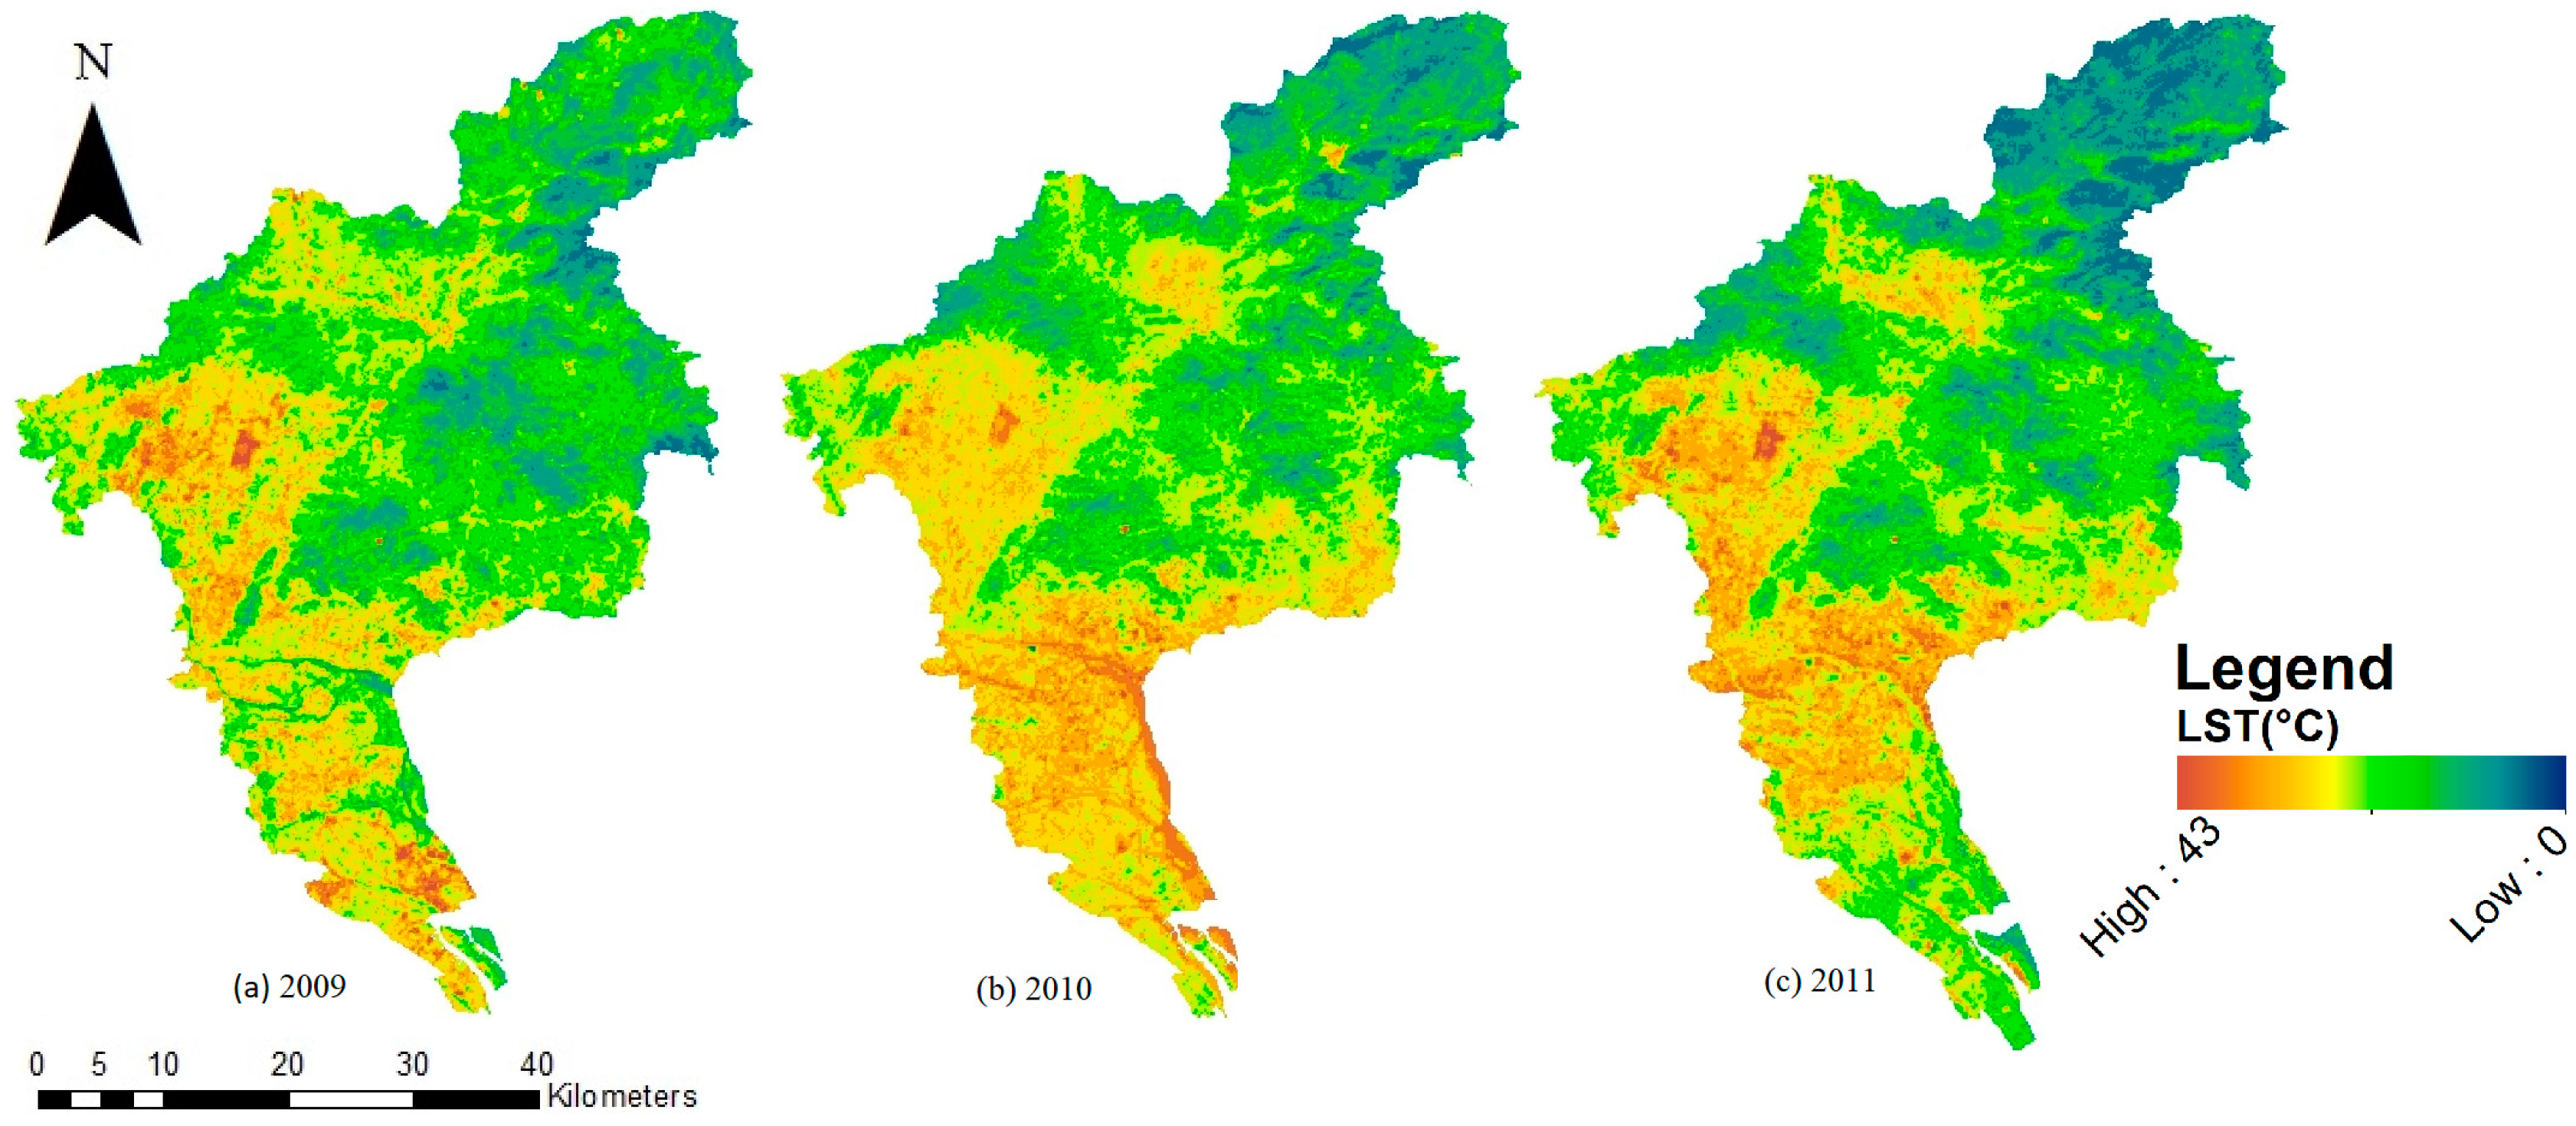
Figure 5.
Correlation analysis between pixel-wise impervious surface fraction results and land surface temperature: (a) 2009; (b) 2010; (c) 2011.
Figure 5.
Correlation analysis between pixel-wise impervious surface fraction results and land surface temperature: (a) 2009; (b) 2010; (c) 2011.
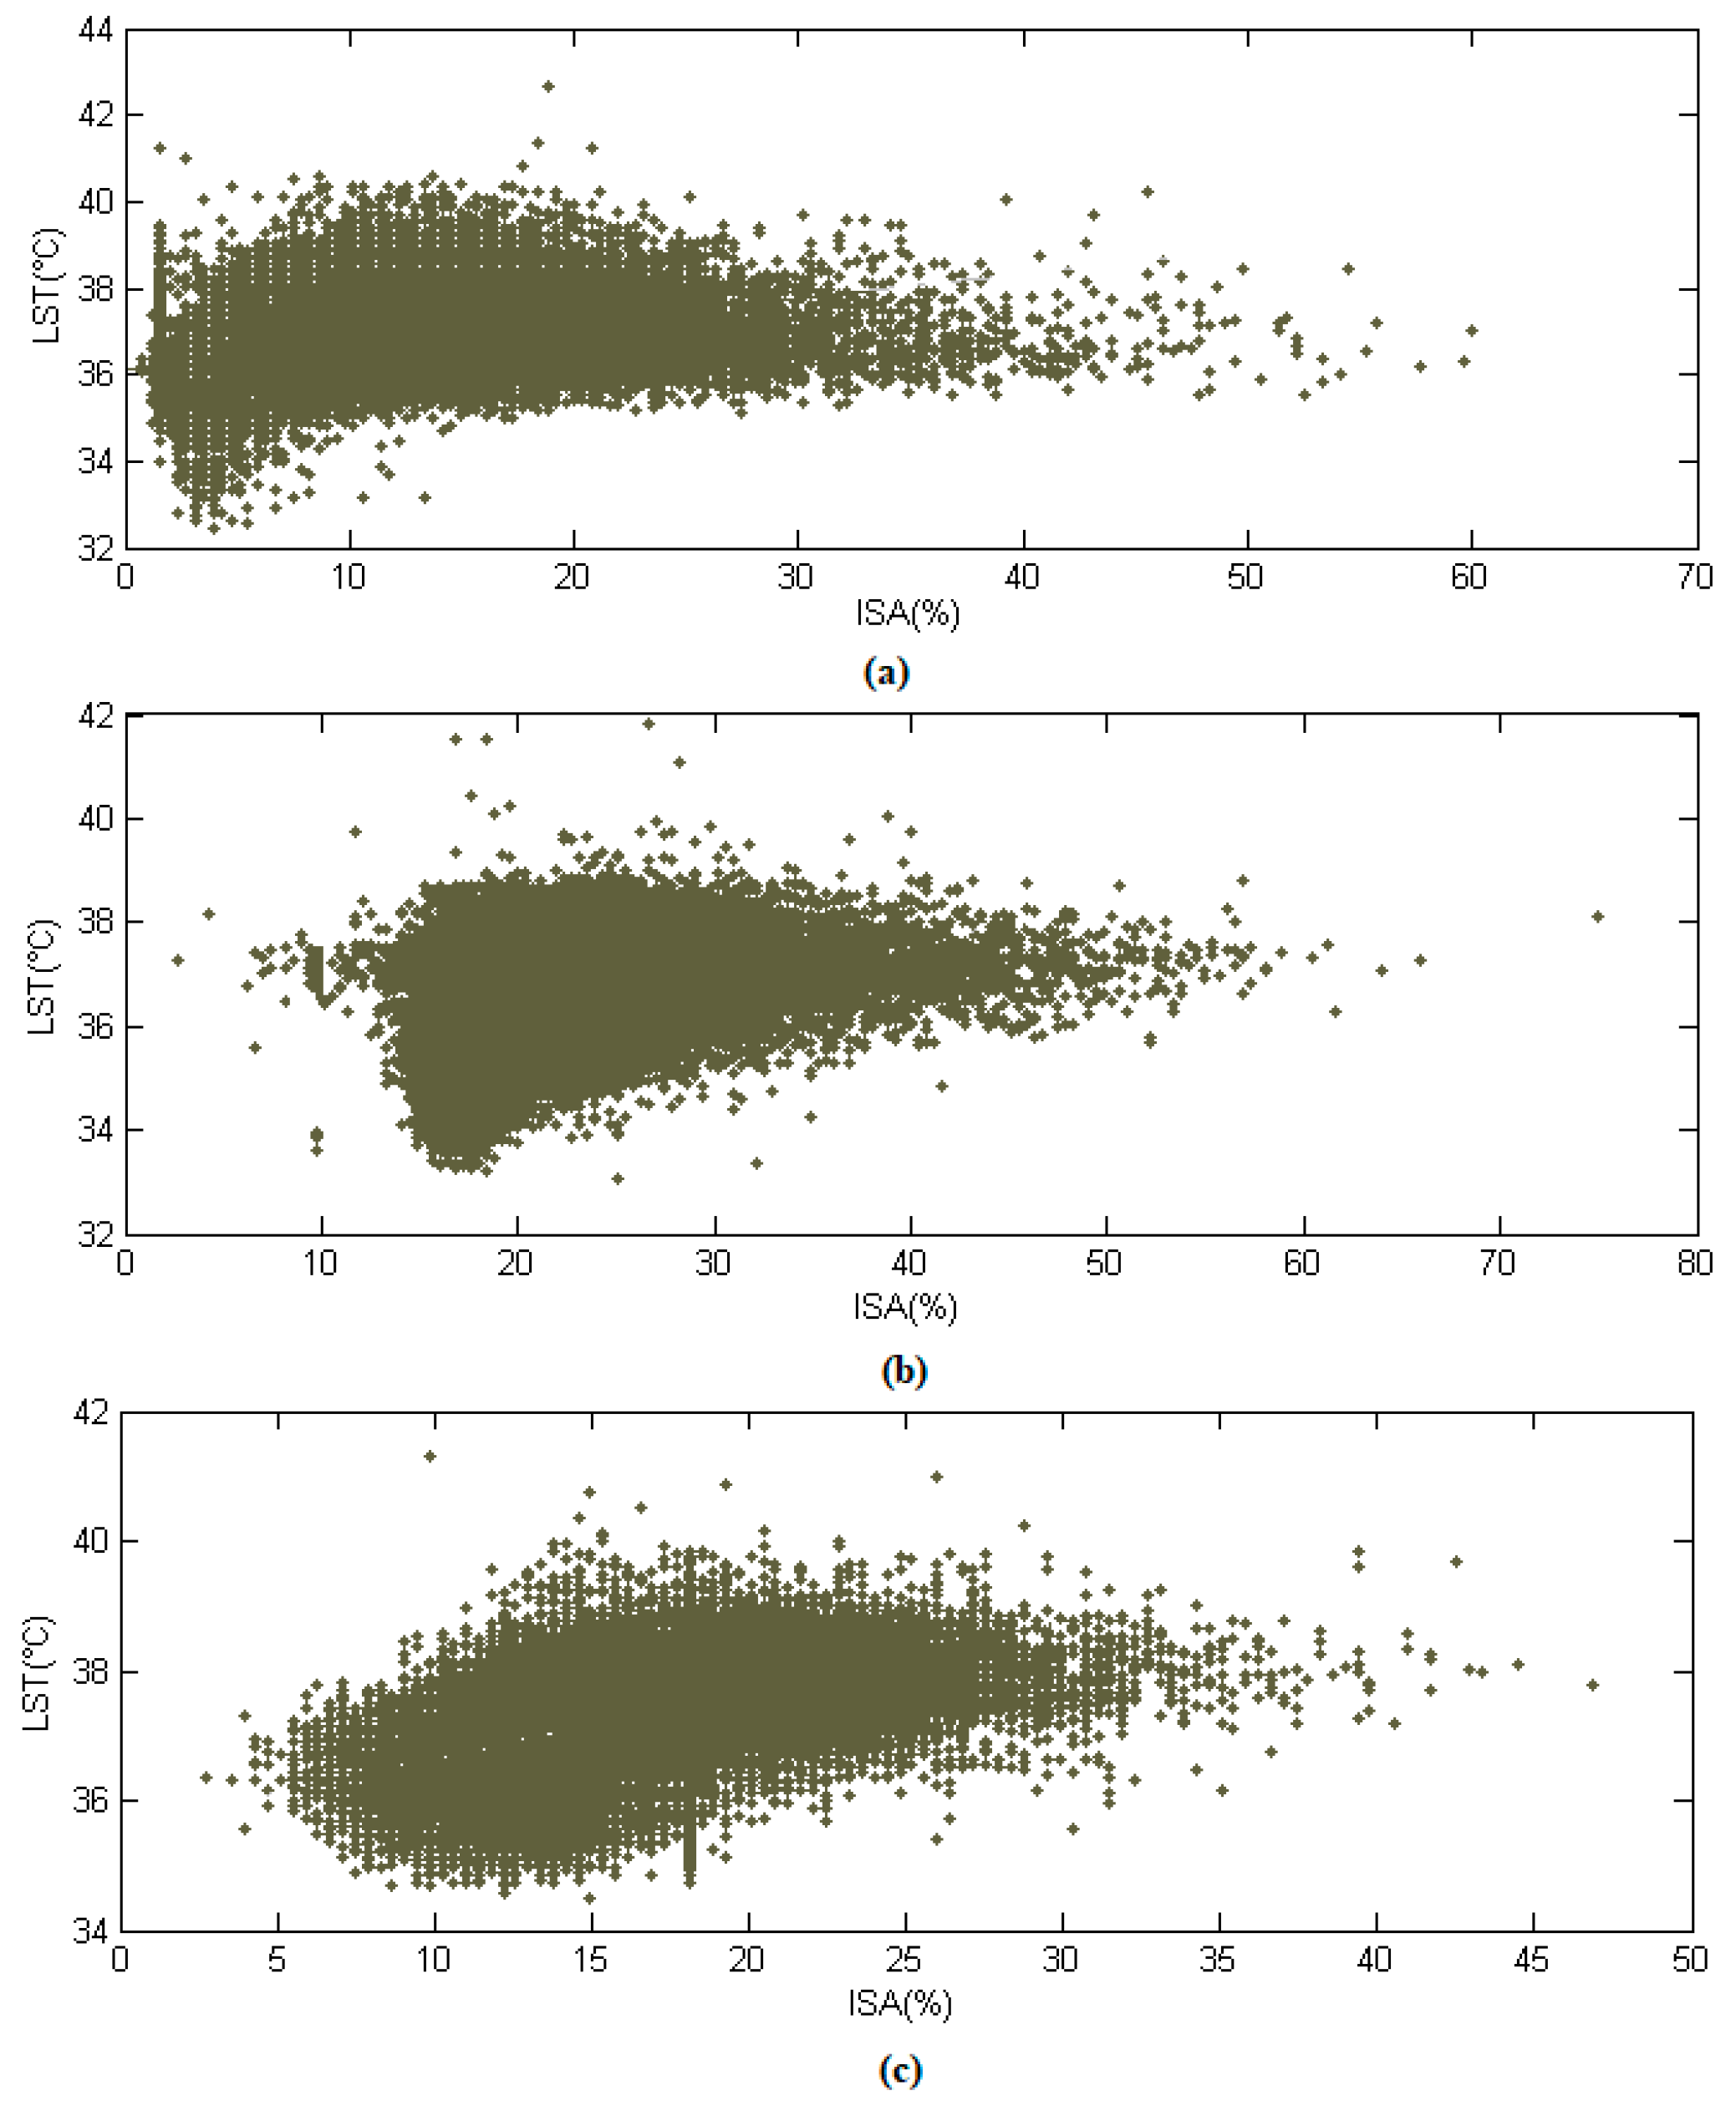
Figure 6.
Correlation analysis between object-based impervious surface fraction results and land surface temperature: (a) 2009; (b) 2010; (c) 2011.
Figure 6.
Correlation analysis between object-based impervious surface fraction results and land surface temperature: (a) 2009; (b) 2010; (c) 2011.


Table 1.
The differences between pixel-wise impervious surface fraction and object-based support vector machine-impervious surface fraction results related to GHSL, WorldPop, and Night-time light images.
Table 1.
The differences between pixel-wise impervious surface fraction and object-based support vector machine-impervious surface fraction results related to GHSL, WorldPop, and Night-time light images.
| GHSL | WorldPop | Night-Time | |
|---|---|---|---|
| Object-based ISA fraction in 2009 | 0.319 ** | 0.272 ** | 0.473 ** |
| Object-based ISA fraction in 2010 | 0.313 ** | 0.234 * | 0.489 ** |
| Object-based ISA fraction in 2011 | 0.229 * | 0.188 | 0.445 ** |
| Pixel-wise ISA fraction in 2009 | 0.062 | 0.168 | 0.103 |
| Pixel-wise ISA fraction in 2010 | 0.312 ** | 0.269 * | 0.268 * |
| Pixel-wise ISA fraction in 2011 | 0.194 | 0.133 | 0.302 ** |
* Correlation is significant at the 0.05 level (2-tailed); ** Correlation is significant at the 0.01 level (2 tailed).
Table 2.
LST classification analysis of Guangzhou from 2009 to 2011.
| Type | Categories |
|---|---|
| High Temperature | |
| Normal Temperature | |
| Low Temperature |
Table 3.
Analysis of relative ISA and LST from 2009 to 2011.
| Years | % ISA | % H-LST | % N-LST | % L-LST | LST |
|---|---|---|---|---|---|
| 2009 | 49.6% | 16.24% | 67% | 6.76% | 37.12 |
| 2010 | 51.3% | 12.88% | 72.72% | 14.5% | 36.97 |
| 2011 | 55.7% | 15.04% | 66.48% | 18.47% | 37.24 |
© 2018 by the authors. Licensee MDPI, Basel, Switzerland. This article is an open access article distributed under the terms and conditions of the Creative Commons Attribution (CC BY) license (http://creativecommons.org/licenses/by/4.0/).
Share and Cite
MDPI and ACS Style
Wei, C.; Blaschke, T. Pixel-Wise vs. Object-Based Impervious Surface Analysis from Remote Sensing: Correlations with Land Surface Temperature and Population Density. Urban Sci. 2018, 2, 2. https://doi.org/10.3390/urbansci2010002
AMA Style
Wei C, Blaschke T. Pixel-Wise vs. Object-Based Impervious Surface Analysis from Remote Sensing: Correlations with Land Surface Temperature and Population Density. Urban Science. 2018; 2(1):2. https://doi.org/10.3390/urbansci2010002
Chicago/Turabian StyleWei, Chunzhu, and Thomas Blaschke. 2018. "Pixel-Wise vs. Object-Based Impervious Surface Analysis from Remote Sensing: Correlations with Land Surface Temperature and Population Density" Urban Science 2, no. 1: 2. https://doi.org/10.3390/urbansci2010002