Article

Application of Multi-Criteria Decision-Making Model and Expert Choice Software for Coastal City Vulnerability Evaluation

by
Milad Bagheri
1,*,
Zelina Zaiton Ibrahim
2,
Shattri Mansor
3,
Latifah Abd Manaf
2,
Mohd Fadzil Akhir
1,
Wan Izatul Asma Wan Talaat
1 and
Amin Beiranvand Pour
1
1
Institute of Oceanography and Environment, Universiti Malaysia Terengganu, Kuala Nerus 21030, Malaysia
2
Department of Environment, Faculty of Environmental and Forestry, Universiti Putra Malaysia, Seri Kembangan 43400, Malaysia
3
Department of Civil Engineering, Faculty of Engineering, Universiti Putra Malaysia, Seri Kembangan 43400, Malaysia
*
Author to whom correspondence should be addressed.
Urban Sci. 2021, 5(4), 84; https://doi.org/10.3390/urbansci5040084
Submission received: 1 September 2021 / Revised: 1 October 2021 / Accepted: 14 October 2021 / Published: 1 November 2021

Abstract

:
Climate change is regarded as a serious threat to both environment and humanity, and as a result, it has piqued worldwide attention in the twenty-first century. Natural hazards are expected to have major effects in the coastal cities of the globe. At the same time, about two-thirds of the world’s human population lives in the coastal margins. One of the fundamental issues for coastal city planners is the coastal cities’ environmental change. This paper presents the application of a model framework for the management and sustainable development of coastal cities under a changing climate in Kuala Terengganu Malaysia. The analytic hierarchy process (AHP) is performed in the Expert Choice software for coastal city hazard management. This approach enables decision-makers to evaluate and identify the relative priorities of vulnerability and hazard criteria and sub-criteria based on a set of preferences, criteria, and alternatives. This paper also presents a hierarchy erosion design applied in Kuala Terengganu to choose the important sustainable weights of criteria and sub-criteria as well as the zone as an alternative model.

1. Introduction

Climate change is often regarded as the world’s most persistent environmental concern in the twenty-first century. At the same time, almost two-thirds of the world’s population lives along the shore [1]. Any long-term significant change in the average weather experienced by a specific location is referred to as climate change. The term “average weather” refers to average precipitation, temperature, and wind patterns. It includes changes in atmospheric variability or average across timescales spanning from decades to millions of years [2]. Coastal city regions are always undergoing broad changes in shape and morphologic characteristics due to natural processes such as heavy rainfall, waves, wind, sea level rise, erosion, flood, and human activity [3]. Furthermore, expansion along cities’ coastlines has resulted in issues such as increasing erosion, siltation, flooding, loss of coastal resources, and harm to the sensitive marine ecosystem [4]. Because of coastal zone management (CZM) and the creation of climate change impact assessments, coastal zone susceptibility to hazard is an important topic for study, according to [5].
Uncertainty in projecting climate remains one of the barriers to managing changes in the coastal environment caused by global warming, according to many coastal planners [6]. Similarly, uncertainties arising from human aspects of global change have a substantial influence on the evaluation and response to climate change consequences such as sea-level rise, flooding, and erosion [7]. Nonetheless, in order to create suitable adaptation measures that would limit the possible consequences of sea level rise on coastal cities, a comprehensive evaluation of the effect of sea level rise on the coastal city is necessary [8,9]. The knowledge of coastal city vulnerability raises scientists’ and policymakers’ capability to forecast the effect which might arise because of a rise in sea level as well as other climate change effects. Thus, it might assist in prioritizing the efforts of management which should be taken in order to decrease risks or its possible effects [10].
Because of climate change, the increase in global sea levels that happened in the twentieth century might likely accelerate in the twenty-first century and beyond; however, the degree of acceleration is unknown [11]. According to research on long-term sea level rise, the rate of global sea level increase caused by climate change is +3.32 mm/year [12]. Despite the expected significant scale of the consequences of sea-level rise [13], it is emphasized that the application and effectiveness of adaptation remain enormous uncertainties that demand further attention and evaluation. Variations in sea level, wave conditions, and river flow caused by climate change are expected to have an impact on the stability of the world’s hundreds of tiny tidal inlets [14].
Littoral transport, sediment supply, and secular sea-level fluctuations are all variables that impact long-term coastal city changes [15]. Furthermore, due to river mouth processes, near-shore hydrodynamics, the structure of coastal landforms, and storm surges, the coastline undergoes recurring alterations [16]. Human activity in the coastal area inside watersheds, river catchments, and offshore is another element that promotes coastal city erosion [17]. The current beach sediment transport through littoral drift in Peninsular Malaysia’s east coast is caused by the oblique technique of south-westward-directed sea swell and waves emanating from the South China Sea during the period of the northeast segments, and the existence of near shore islands and coastline protrusions, according to the conclusion of [18] regarding sediment transport in Kuala Terengganu. This sort of inlet is prevalent in developing countries, where data availability is typically sub-optimal and community resilience to coastal changes is low, due to its presence in tropical and sub-tropical zones [14]. Coastal erosion is generally exacerbated by a mix of human activity and natural factors, notably development in coastal regions [19]. One of these risks is coastal erosion, which is defined as an undesirable landward shift of the coastline [20]. Coastal erosion caused by rising sea levels is a major problem in Malaysia, according to some research [21], because the country has a long coastline and numerous cities located along the ocean. The major sources of erosion along the coastline are natural processes and human activities, both of which can have significant consequences for the natural environment and socioeconomic situations in coastal areas [22].
The coastline of Peninsular Malaysia spans for over 4800 km and is rich in natural coastal resources [23]. From November 1984 to January 1986, the Malaysian government conducted a study on national coastal erosion, which found that erosion had impacted about 29 percent of the country’s coastline, or 1380 km [24]. Along the eastern coast of Peninsular Malaysia, particularly the location of the South China Sea, flooding and coastal erosion constitute severe problems [25]. Nonetheless, in order to create suitable adaptation measures that would limit the possible consequences of sea level rise on the coastal zone, a holistic evaluation of the effect of sea level rise on the coastal zone is necessary. Flooding, coastal erosion, and shoreline alteration are major issues along Peninsular Malaysia’s eastern coast, particularly in the South China Sea [26]. Flooding has always happened in Terengganu, which is located on Peninsular Malaysia’s east coast, according to [27,28]. Floods, for example, occur often every year in Terengganu’s Dungan region, especially when the river level reaches a few meters beyond the danger threshold. highlighted that flooding has always occurred in Terengganu, which is located on Peninsular Malaysia’s east coast. For example, floods occur often every year in the Dungan district of Terengganu state, especially when the river level rises a few meters beyond the danger threshold. Dungun was badly flooded by a monsoon flood in 2012, caused by significant rains, and the region was inundated by flood water as high as 1.5 m [29]. The floods were caused by either direct river flow or tidal surges from the ocean [30,31]. According to [32], about 70% of Terengganu is categorized as a low-lying coastal territory with a height of less than 200 m, and around 30% of the area is prone to flash floods.
Due to the northeast monsoon’s stronger effect in comparison to the southwest monsoon, Peninsular Malaysia’s east coast is more sensitive to environmental changes [25]. Coastline erosion has long been a problem in Kuala Terengganu’s Marang Kechil to Kuala Merang coastal area [33]. The Kuala Terengganu coast in the South China Sea (SCS) has grown dramatically as a result of the development of breakwaters, jetties, trading hubs, residences, hotels, and coastal resorts [34]. The majority of the development in this area had a negative impact on the shoreline and the coastal environment. For example, jetties along the Kuala Terengganu coastline held sediments, producing erosion at lower littoral drift and acceleration at greater littoral drift [35]. The majority of development along Kuala Terengganu’s coasts occurred without regard for the need to gather quantitative and qualitative data on coastal city regions [36]. There are no sound coastal city setbacks or other mitigating measures in Kuala Terengganu because of a lack of coastal change data [37].
Furthermore, in this location, inadequate sediment delivery to beaches and coastal flooding are two variables that contribute to coastal city erosion. The necessity of coastal assessment and analysis of environmental change and coastline position projection for coastal development in Kuala Terengganu [38] are justified by this dangerous scenario. In addition, to improve and expand management strategies in this sensitive sector, proper tools and scientific databases are required. Coastal city vulnerability assessment is critical for coastal change research because it helps to avoid choices based on inadequate data and inaccurate assessments, which might lead to the loss of coastal resources and infrastructure [39]. As a result of the fast growth of coastal regions in recent years, coastal city change studies are becoming increasingly relevant in Malaysia. Prior research and experiences have projected that the repercussions of coastal change, particularly on the East Coast, will be severe and costly [40]. However, there is a lack of a precise and reliable assessment of the annual rate of change that might be used to enact preventative measures and describe the probable future coastline layout.
The study’s ultimate objective is to look into the vulnerability and erosion control of Peninsular Malaysia’s east coast. The project aims to do the following: (1) Estimate experimental data using subjective information and expert views in order to treat the topic as an MCDA problem. (2) On a local scale, identify the essential and sensitive criteria as well as an alternative for coastal city erosion.
As a result, using multi-criteria spatial decision analysis (MCSDA) models, this research can forecast the future of coastal city vulnerability erosion for decision-makers and planners, which is equivalent to information gathered by various Malaysian ministries and agencies [41]. MCDA provides better-supported methodologies for comparing project options using decision matrices, resulting in a significant improvement in the environmental decision-making process. It also provides formal methods for incorporating project stakeholders’ perspectives into the ordering or ranking of options [42]. The MCDA method has been widely used in environmental management and planning, as well as stakeholder participation [43]. One of MCDA’s most important features is its capacity to bring out the similarities and potential conflict areas among stakeholders in collective decision-making, allowing for a better understanding of others’ views [44]. The analytical hierarchy process (AHP) is the most widely used and widest procedures in the MCDA approach [45,46]. Reference [47] agreed, claiming that AHP is the most widely used as well as the fastest evolving decision analytic technique in a variety of disciplines, including environmental and resource planning, environmental management, and so on.
The AHP process is a reasonable method to conduct vulnerability, hazard, and risk criteria weight of erosion because it displays a choice problem and then advances precedence for the criteria, sub-criteria, and alternatives. The ANP technique, which is distinct from AHP, is a generalized variant of AHP that allows for outer-dependencies, inter-dependencies, and feedback among decision components in hierarchical or other structures. In other words, the more complicated the situation is, the more work it takes to prepare the decision structure [48]. The AHP is a particular instance of the ANP since there are no feedback loops between the components. As a result of paired comparisons of elements under identical conditions, both the ANP and the AHP obtain ratio scale priority for every component or element and cluster of components or elements [49].
AHP techniques have a number of advantages, including being relatively simple to use, the ability to integrate qualitative and subjective factors, the ability to withstand rapid preplanning, the ability to estimate the greatest judgmental decisions from a large number of credit analysts, and the ability to assess the consistency of these judgments [50]. AHP has been used in a variety of complex decisions, including challenges in natural resource management [51], integrated coastal zone management (ICZM) [52], environmental issues [53], social science and technology [54], economic studies [55], risk management process [56], land use planning [57], urban planning [58], and the business and tourism industries [59].

2. Methodology

2.1. Study Area

Terengganu is a Malaysian constituent state on Peninsular Malaysia’s east coast. Kelantan is to the northwest of the state, Pahang is to the southwest, and the South China Sea (SCS) is to the east. The largest city in the state is Kuala Terengganu, which is located at the mouth of the Terengganu River. It is located between 5°27′58.31″ N and 5°11′42.36″ N, and 102°57′06.10″ E and 103°13′18.69″ E in latitude and longitude, respectively. Figure 1 presents the sandy coastal beaches that cover the whole of the city’s eastern coast, which confronts the South China Sea. The research region is the Kuala Terengganu coastline, which stretches over around 69 km from Merang to Rusila.
The majority of the activities in this region are focused along the shore; monitoring is critical in order to identify locations inside the coastal city that are particularly vulnerable to erosion and accretion. Due to its constant exposure to significant coastal erosion as well as its unique location as an active tourism gateway to the East Coast Economic Region, Kuala Terengganu was chosen as a research region (ECER). Sustainable island tourism, ecotourism, urban tourism, and traditional culture and historical tourism are also popular tourist activities, particularly along the mainland’s coasts [60]. The ECER covers the states of Terengganu, Kelantan, and Pahang, as well as the Johor and Mersing districts [61]. It was developed as an economic corridor to help the east coast of Peninsular Malaysia undergo socioeconomic changes.

2.2. Understanding the AHP Framework

This research applies the AHP method to assess the vulnerability and hazard index criteria and sub-criteria coastal city region’s erosion that necessitates qualitative and semi-quantitative analysis of the coastal region’s information. In AHP, is important to create a hierarchy by shaping the problem into its basic elements. This model ascribes weights to the variables with the use of pairwise comparison at every hierarchy level. AHP consists of two main parts, qualitative design (QD) and semi-quantitative design (SQD). These designs in the AHP model improve the consistency of the system as well as ease weight computation for criteria and sub-criteria. The four phases of qualitative AHP are: (1) problem modeling, (2) weights valuation, (3) weights aggregation, and (4) sensitivity analysis, which will be explained briefly in the next section.
The QD utilizes two criteria for the measurement of erosion area, namely vulnerability index (VI) and hazard index (HI). VI can involve qualitative factors, namely, soil types, plantation and cultivation, regions without slope, sediment rate, average height, distance to coast, geology era, and density in rural and urban regions as well as road location to coast. Hazard index (HI) ratios can also involve qualitative risk factors, namely, amount of rainfall, coastline historical changes, wind speed, and flash flood area as well as environmental natural hazards such as sea-level rise.
On the other hand, SQD erosion risk is assessed with two criteria, namely vulnerability and hazard GIS layers. The vulnerability GIS layers include classes of land use, geology, soil, etc. Similarly, hazard GIS layers consist of classes of rainfall, flood, sea-level rise, etc. In SQD AHP design some steps are like QD without sensitive analysis. Figure 2 shows the levels and constituents of AHP for the coastal city erosion management (CCEM) model. The AHP method is organized hierarchically at diverse levels with each level containing a finite amount of decision components. The general goal of the CCEM model is represented by the upper level of the hierarchy whereas one or more intermediate levels symbolize the decision criteria and sub-criteria. Hence, the lower level comprises all potential options (zones) [62].
The first stage in any decision-making process is to organize the problem, which may be broken down into three parts: goal, criteria, and sub-criteria. The breakdown of the choice issue into components based on their common properties and the construction of a hierarchical model with several levels make up the structuring of the decision hierarchy [63].

2.2.1. Data Collection by Using Experts

We gathered two sorts of data for this post based on issues and options. The AHP technique requires both primary and secondary data. The expert choice matrix is included in the source data (ECM). ECM was provided to 12 Malaysian specialists from various agencies (DID, SMART, NAHRIM). ECM was on the scene for six months (for three rounds). The first round took place from 14 February to 17 April 2018, the second round from 22 August to 20 September 2018, and the third round from 3 October to 7 November 2018. Secondary data from relevant departments were obtained for semi-quantitative data. Topographic map (2002), land use map (2008), and MUKIM map (2010) from JUPEM, geology map from the Geology department, flood map (2008) from DID, population map (2010) from the Department of Statistics, and soil map (2008) from the Department of Agriculture were the most common secondary spatial data for GIS layers (DOA). We developed two types of hierarchy designs, QD and SQD, based on the issue description, alternative, and expert knowledge for coastal erosion in Kuala Terengganu. We gathered primary data for the AHP approach based on issues and options. ECM is included in the primary data as numerical data.

2.2.2. Pairwise Comparisons

The second step is associated with the collection of input data by pairwise comparisons of decision components as well as obtaining the judgment scales. Having arranged the problem in a hierarchical technique, the next step is to appraise the relative significance of the criteria and sub-criteria with the general goal. The study applies two designs, namely the five-level Likert with the expert choice questionnaire (ECQ) which enables the selection of the best and essential criteria from the expert’s point of view, and the Saaty’s 9-point scales with ECM which is utilized for the qualitative and semi-quantitative data criteria and sub-criteria. For the quantification process in AHP, the pairwise comparisons of criteria use a scale of unconditional judgments generally known as the Saaty’s l-9 scale that specifies the degree at which one item prevails over the other regarding certain features. By utilizing pairwise relative comparison, the preference between criteria and sub-criteria would be asked for deriving weights by the AHP model. The relative significance of every variable is evaluated through the application of Saaty’s 9-point scales, as indicated in Table 1.
A matrix collects the pairwise comparisons of the decision-maker at each node of the hierarchy. AHP applies a ratio scale that does not need any units in the comparison. The judgment indeed is a quotient a   /   b of two quantities a and b which have the same units.
The transitivity criterion (1) holds for all a i j comparisons if the matrix is consistent:
a i , j = a i , k . a k , j  
a i , j = 1 a i , j  

2.2.3. Priorities Derivation

After filling the comparison matrices, priorities could be computed. The traditional AHP utilizes the eigenvalue technique. A consistent matrix is known as priorities w i . The comparison of the alternatives i and j is denoted as w i / w j , which is multiplied by the priority vector w gives:
A = [ a 11 a 1 n a n 1 a n n ] = [ w 1 / w 1 w 1 / w n w n / w 1 w n / w n ]
For a consistent matrix, we can demonstrate that:
= [ w 1 / w 1 w 1 / w n w n / w 1 w n / w n ] × [ w 1 w n ] = n [ w 1 w n ]
or in a matrix form:
A   ·   w   = n w
where w : The eigenvector; n : The dimension of the matrix; A : The comparison matrix.
The formulation of an eigenvector issue is seen in Equation (5). The estimated priorities are exact for a consistent matrix, but based on perturbation theory, when small inconsistencies or discrepancies are inserted, the priorities should only vary minimally [65].

2.2.4. Consistency

This part is concerned with the evaluation of the weight consistency of comparisons. It offers an index for the measurement of inconsistency for every matrix of comparisons as well as for the whole hierarchy in every set of judgments. It is necessary to apply a consistency check since priorities are meaningful only if obtained from consistent or proximate consistent matrices.
This step conducted the calculations to determine the maximum eigenvalue, Consistency Index (CI), Consistency Ratio (CR), and normalized values for every alternative and criteria [66]. The AHP determines the general consistency of judgments through a CR. As noted by some studies [67], the judgmental matrix’s consistency can be accomplished through the examination of total CR, the ratio of CI denoted as follows:
C I = λ m a x n n 1  
where λ m a x = maximal eigenvalue; or the scores that attained a certain level of consistency were accepted as demonstrated by a CI calculated by [68]. A CI was proposed that is denoted as follows:
C I = j = 1 λ W j × C I j  
The CR allows determining the number of errors that were generated when offering expert judgments.
The CR, the ratio of C I and Random Indices (RI), is given by:
C R = C I / R I  
where RI signifies the random consistency index of a reciprocal matrix that was randomly created from the 9-point scale, with reciprocals forced (the average CI of 500 randomly filled matrices). The calculated CI can be compared with the created paired comparison matrix’s RI to examine CR. The CR indicated whether the judgment weights of the decision-maker were accepted. A CR below 10% reveals that the matrix could be considered as possessing an acceptable consistency and the errors are relatively small and considered acceptable. Thus, [69,70] computed the random indices as indicated in Table 2.
Some judgment matrices require stimulation from decision-makers; one for the estimation of the local weights of criteria regarding the objective and another one for the calculation of the local weights of alternatives with each of the criteria and sub-criteria. The extra judgments are required for the estimation of an index for ascertaining the consistency of judgments. One of the considered strong points of AHP is its ability to ascertain consistent judgments via the computation of consistency ratio.

2.2.5. Aggregation

This step calculates the local weights of the components by utilizing Expert Choice software and deals with the additive aggregation of weights through several levels to obtain the ultimate weights of alternatives. After obtaining the local weights of components, they are combined or aggregated to obtain the ultimate weights of the decision options. Thus, the criteria’s weights and the alternatives’ scores known as local priorities are decision components in the decision process in Step Two. The decision-maker must offer his preferences or priorities by pair-wise comparisons with the weights and scores. The weights   ( w j ) and scores ( S i j ) values are stimulated from these comparisons and denoted in a decision table. The final step of the AHP combines or aggregates all preferences from the decision table with a weighted summation of the kind in reference [71] and establishes local priorities based on all factors to determine global preference or priority. The ultimate criteria and alternative (zones) weights in qualitative and semi-quantitative data will be calculated using a formula as follows:
Z i = j w j × S i j  
where Z i : Represents global priority of the alternative   i ; S i j : Denotes weight of the criterion j; w j : Signifies local priority.
Thus, the global priorities ( Z i )   attained in this research are ultimately utilized for normalization through the division of the score of every alternative solely by the alternative score and the choice of the optimum alternative in each criterion [72].

2.2.6. Sensitivity Analysis

The sensitivity analysis of the AHP model is the final stage. The sensitivity analysis is the final phase in the decision-making process, and it involves making minor changes to the input data to see how they affect the outcomes. Hence, the results are considered robust if there is no change in the ranking [73]. The major goal of sensitivity analysis is to determine the sensitivity of the choices about the criteria weights’ changes [74].

3. Results and Discussion

3.1. AHP Approach and Structure for CCEM Model

Two AHP hierarchy designs including QD and SQD are presented in Figure 3. QD is used for appraisal of erosion assessment in experts’ knowledge setting, whereas qualitative design is used for management of erosion in expert and GIS settings. The study chose the optimum criteria based on experts’ knowledge, visits to the study area, fieldwork, and literature review.
The evaluation criteria in multi-criteria spatial decision-making (MCSDM) are linked with geographical entities as well as the association between them. Therefore, maps or GIS layers could be used to represent the evaluation criteria. The study gathered and analyzed the GIS maps which encompass geographical characteristics. We applied four criteria, based on the expert survey and review of literature, namely climatic criteria, human activities criteria, environmental criteria, and coastal hazard criteria. One of the key goals is to choose one specific alternative from a variety of known alternatives. Highlighting the criteria, sub-criteria, and options in the spatial decision problems is indeed very challenging due to the vast number of alternatives.
The main goal of this structure is to assess the coastal city risk. We have designed 6 environmental, 3 human activities, 3 climatic, and 2 coastal hazard criteria as well as 29 environmental, 13 human activities, 11 climatic, and 8 coastal hazard sub-criteria.
Based on the sensitivity of areas, the study area was classified into six regions, namely, Zone (1): Merang; Zone (2): Batu Rakit; Zone (3): Kuala Nerus; Zone (4): Manir; Zone (5): Pengadang Buluh; and Zone (6): Rusila, with every region presented as an alternative layer and every region type signified as (VI) and (HI) zones.

3.2. AHP Expert Choice Team and Weights

The study team designed all the criteria, sub-criteria, and alternatives by applying the AHP model and ECM. Weights were assigned to a range of criteria based on experts’ opinions. They were calculated for all criteria and sub-criteria in Expert Choice software for qualitative and semi-quantitative design. The ranking results of the first and second rounds were used in the third round to calculate the weight for the GIS layers class for semi-quantitative design. Areas that were ranked with the “highest” vulnerability should be the focus of future management efforts (Table 3).
The analytical results of the AHP-Expert Choice matrix from experts’ opinions are shown as numerical values in Table 3 and Table 4 which signify the weights of relative erosion vulnerability and hazard qualitative index. They are represented by numbers from 0 to 1. AHP weights are not the probabilities of erosion but comparative criteria, sub-criteria, and alternatives of erosion vulnerability and hazard qualitative index.
Within environmental criteria (EC), six criteria were selected based on erosion in the coastal area by using ECM from experts’ (some government agency of Malaysia) opinion and AHP model. The estimated final weights for each criterion, sub-criteria, and alternatives are as follows: Zone 5 is more sensitive to river criterion, because of the presence of a big river in the middle of this region, with a weight of 0.232, CR of 0.09, and high alternative weight of 0.439, while Zone 1 is less vulnerable to river criterion, because of the absence of river in this zone, with a low alternative weight of 0.053.
In the human activity criteria (HAC), the study has three criteria selected by the Expert Choice matrix. Among all the criteria in HAC, the built-up criterion has the highest weight of 0.071 with a CR of 0.09. Zone 5 has the highest alternative weight of 0.434 which shows that this area is more vulnerable to construction compared to other areas, while Zone 1 has the lowest alternative weight of 0.055. This zone is in the town area of Kuala Terengganu where there is a higher density of building and coastal construction.
Table 4 shows the different criteria weights arising from the same AHP model, but with different values for the hazard index. To calculate the hazard index, the criteria are categorized into climate change hazard criteria (CCHC) which include rainfall, wind, and sea-level rise, and coastal hazard criteria (CHC) which consist of flood and coastal change.
In CCHC, the rainfall criterion has the highest weight of 0.223 with a CR of 0.09. Among all zones, Zone 5 is more vulnerable to rainfall with an alternative weight of 0.386, while Zone 4 is less sensitive to this criterion with an alternative weight of 0.061. In CHC, the environmental change criterion has a slightly higher weight than the flood criterion. Again, Zone 5 has the highest alternative weight of 0.440 while Zone 4 has the lowest weight of 0.038.
In summary, Zone 5 has a higher vulnerability value to erosion compared to other zones. This area is more sensitive to the river, built-up, rainfall, and environmental change criteria. In addition, the vulnerability of Zone 5 was mostly influenced by the presence of a big river as well as being a town center with many ongoing environmental development projects and various man-made structures. It is revealed that this region is more affected by environmental factors followed by climate change hazards. High rates of erosion could affect the land use in the coastal area as well as increase sedimentation, which in turn could be a hazard to fishermen’s boats because they could get stuck in sand bars. It could also pose a threat to fishing villages and local aquaculture activities.
The protection of the region using breakwaters and revetments could be one of the most effective approaches to protect this area. There are more breakwaters and revetments in Zones 1 and 2 relatives to these regions experiencing a lower rate of erosion. Furthermore, data indicated that beaches protected by breakwaters and revetments were not affected by erosion during bad weather; nevertheless, a part of the beach just a few meters away from the erosion control structures was severely eroded [75].

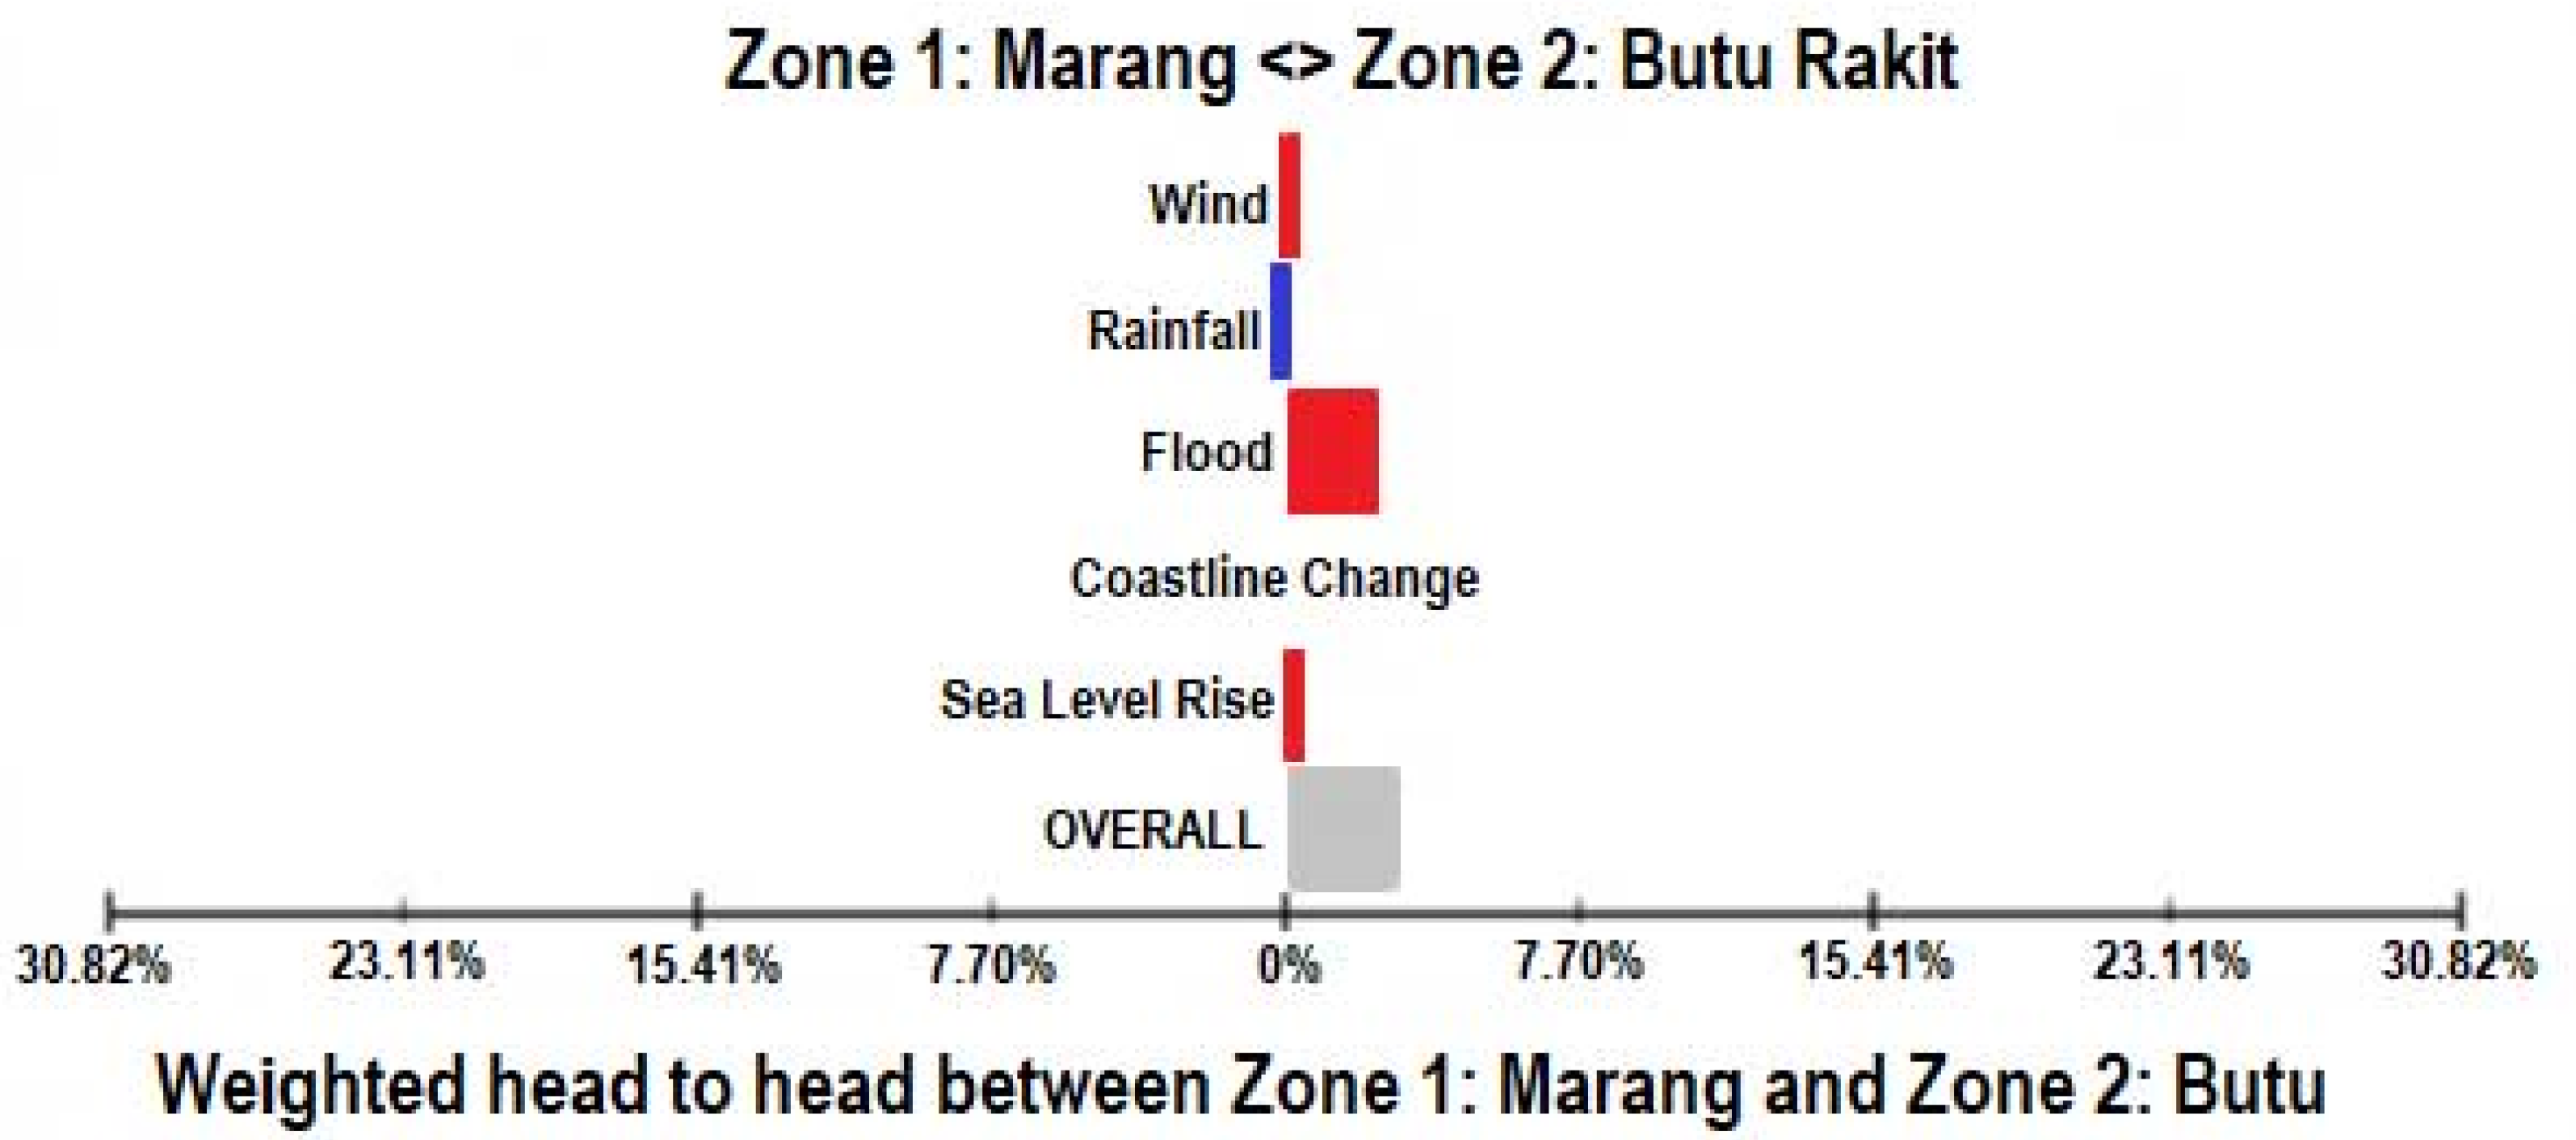
3.3. Sensitivity Analysis

A sensitivity analysis in this study shows the sensitivity of the alternatives for all the different criteria of the model on the choice of the important erosion criteria and sub-criteria in the Kuala Terengganu coastal area. The sensitivity analysis was only applied for qualitative data because experts ranked and weighted the qualitative data, and their results could be used to decide for semi-quantitative data. One of the popular sensitivity graphs in Expert Choice software is known as a dynamic graph. The sensitivity analysis results for environmental and human activity criteria obtained by using a dynamic graph through the application of AHP are presented in Figure 4.
The study presented the dynamic graph and the sensitivity analysis results in Expert Choice software in two parts; part one is the criteria and part two is the alternative. Each part has its unique menu commands and the sensitivity analysis between criteria and alternative can be compared with each other. If the priority sensitivity of each criterion or alternative is changed, the number of changes that would be necessary for other criteria or alternatives as the output of sensitive analysis could be seen. Thus, the priorities of the alternatives (zones) will change in the right column by dragging the nine criteria priorities in the left column. If a decision-maker thinks an objective might be more or less important than originally indicated, the decision-maker can drag that objective’s bar to the right or left to increase or decrease the objective’s priority and see the impact on the alternatives (Table 5).
The study considered the river criterion from environmental criteria because the AHP results revealed that the river criterion has a higher weight among other environmental and human activity criteria.
In the environmental criteria, it was found that an increase in the sensitivity of river criterion has a high weight of 0.232 with a corresponding inconsistency (CI) of 0.09 to 10%, 50%, and 90% of the main goal in the dynamic chart. This result indicates that the AHP model is still in favor of the land use criterion with scores of 23.5% of the main goal (leaving 76.5% for the others while keeping the proportionality between each), 11.1%, and 2.3%, respectively. In human activity criteria, built-up with scores of 8.3%, 3.9%, and 0.9% are more sensitive than population and road criteria. The result is relatively reasonable since more sensitivity of land use criteria in the vulnerability index is significantly greater than the other criteria. With an increase in the sensitivity of rivers in Kuala Terengganu, land use criteria will be more vulnerable than other criteria in Kuala Terengganu coastal city.
Based on the sensitivity table, the study found that Zone 5 is more vulnerable to erosion based on the criteria. The results are comparable to the other zones, but Zone 5 remains the most vulnerable and sensitive area with scores of 26.40%, 34.4%, and 42.20%. On the other hand, Zone 1 with scores of 10.20%, 8.70%, and 7.30% remains the least vulnerable and sensitive zone for erosion in Kuala Terengganu. The result shows that Zone 5 is always in the lead with a persistent score beyond 26.4%, followed by Zones 6, 2, 3, 1, and 4, respectively.
Similarly, sensitivity analysis of the coastal change criteria still demonstrates that Zone 5 has the highest score of 36.9%. Results show that Zone 5 is always in the lead with a score higher than 30%, followed by Zone 3 (27.1%), Zone 2 (11%), Zone 6 (9.1%), and Zone 4 (8%). The result is relatively reasonable since the coastal hazard erosion in Zones 5 and 3 is significantly higher than the other criteria.
In coastal hazard criteria, an increase in the sensitivity of environmental change has the best weight of 0.274 with a corresponding inconsistency (CI) of 0.01 to 10%, 50%, and 90%. It was found that the AHP model is still in favor of the flood criteria with scores of 32.7%, 18.2%, and 3.8% as indicated in Table 6.
The situation is similar for the zones, as Zone 5 has the highest vulnerability and sensitivity area with scores of 36.9%, 44.1%, and 51.3%. On the contrary, Zone 4 with scores of 8%, 6.9%, and 5.8% has the lowest sensitive zone for erosion. With an increase in sensitivity of the coastal change in the area, a flood criterion is more vulnerable compared to other criteria in Kuala Terengganu.
The sensitivity analysis results as presented in Figure 5 indicate the degree of stability of the decision. The choice of Zone 5 remains the same even with significant changes on the criteria weights which can be justified by the consistent judgments and the pairwise comparisons. AHP analysis demonstrates an efficient knowledge-based approach to help quantify experts’ knowledge to qualitative analysis. The best alternative in this study was Zone 5 for Kuala Terengganu coastal area. Qualitative vulnerability and hazard weights are final calculations in Expert Choice software for this part of the research (Figure 6 and Figure 7). By using qualitative results and some analysis on the semi-quantitative data, the result for environmental erosion of Kuala Terengganu shows that Kuala Terengganu, Kuala Ibai, Chendering, and Kuala Marang River criteria have the highest weights, 0.282, for vulnerability layer and coastline change criteria with the highest weight, 0.275, for hazard layer as the important criteria for Kuala Terengganu coastal area (Figure 6 and Figure 7).
The study found that Kg. Seberang Takir is a significant source of river sand in the Kuala Terengganu coastal area. Erosion beaches are the other major source and probably provide a larger volume of sand to the longshore transport system than do the rivers. Sand is probably lost offshore of a region between Kg. Seberang Takir and S. K. Chendring (Left Bank Bt. Chendring). In addition, some sand is probably lost in the mouth of Jalan Tok Adis (Left Bank. K. Ibai) and possibly in some closed river entrances north of Kg. Seberang Takir. Sand carried north to Right Bank Bt. Merang Kecil may be carried offshore, possibly as a result of the complex effects of offshore islands or waves which approach from the northeast. Sand is presently lost in the basin at Kampung Aur (Right Bank Bt. Chendring). This volume is carried to the north from the new nodal reaches south of the harbor from the north around S. K. Chendring (Left Bank Bt. Chendring). The volume carried north to the harbor will decrease with time as a new hook-shaped bay evolves.
Environmental change and behavior have seen some of the most extensive recent coastal retreats along the east coast of Malaysia. The coastal retreat is notably severe south of Right Bank Bt. Merang Kecil. It is also very severe from the south side of Kg. Seberang Takir to Jalan Tok Adis (Left Bank. K. Ibai), a developed region containing new hotels and some residences. Changes in coastal orientation, the related divergent nodal region, and the presence of sheltering offshore islands near Right Bank Bt. Merang Kecil appear to be responsible for the coastal city erosion from Right Bank Kg. Merang to Left Bank Bt. Chendring. Losses are in both directions between Kg. Seberang Takir and S. K. Chendring (Left Bank Bt. Chendring). Because this region projects breakwater and seaward of adjacent shore beaches, once moved to more westerly beaches, they are probably not returned when the wave direction changes. Landward inset of the beach north of S. K. Chendring (Left Bank Bt. Chendring) and the straightness of the shore there is indicative of a low sand volume that bypasses the headland to the south. Most of the sand leaving the eroding Terengganu coasts in an along-shore direction passes to the north. Since the mean wave approach direction for this coast is about normal to this shore, losses are caused more by no return of sand across the river. Half the sand from this region may be lost offshore. Sand losses south of Right Bank Bt. Merang Kecil are the result of changes in shore orientation and sheltering of the shore by offshore islands to the north and northeast. The latter reduces the magnitude of wave energy on the coast from the north and, therefore, increases the effect of waves that arrive from south of shore as normal. The coastline from S. K. Chendring (Left Bank Bt. Chendring) to Kampung Kijing (Left Bank of Kuala Marang Terengganu) has reacted quickly to the construction of the breakwater at S. K. Chendring, beginning about 1985 (Left Bank Bt. Chendring).
The north headland has basically been relocated to the south by this breakwater. The indentation of the equilibrium embayment subsequently shifted and this shift has resulted in serious erosion. The evolution of the bay after construction can be predicted quantitatively.
The pace of coastal retreat and advance, as well as the volume of sand transported north to the harbor, may all be anticipated. This data may then be utilized to best site and design a building to avoid sedimentation in the harbor and offer a dumping location so that sand dumped south of the port does not return to the harbor but instead moves south.
The volume of sand that moves south around S. K. Chendring (Left Bank Bt. Chendring) should be bypassed to the south to prevent down-drift beach erosion. It could also be back-passed to the north to mitigate erosion problems there.

4. Conclusions

For coastal vulnerability management in Kuala Terengganu, Malaysia, this study combines an MCDA model with Expert Choice decision-making software. It creates vulnerability weights and sensitivity zones for coastal region damages that might be caused by human activities, climate change, and environmental causes. A reliable erosion model and precise weights of erosion-prone regions are required to assess erosion susceptibility.
The final weights for each zone of the research area are calculated using the AHP and Expert Choice software. One of the most significant aspects of this study was the selection of the best and most relevant criterion and sub-criteria utilizing AHP model for coastal erosion in order to achieve an accurate result. Many variables may be significant for the occurrence of erosion in a particular coastal location, but they may not be important in other areas. The input data are crucial, and the technique framework used to collect them, as well as how and where they were gathered, might have an impact on the outcomes. Other significant variables include selecting the finest local agencies in the country or international agencies in other nations, as well as the quantity and quality of experts needed to construct the Expert Choice matrix and the best MCDA model.
In quality design, the flood criterion in coastal hazard criteria has the greatest weight of 0.264 with a CR of 0.07, and in semi-quantitative design, it has the highest weight of 0.251 with a CR of 0.08. Zones 5 and 4 have the greatest alternative weights of 0.375 and 0.376, respectively, indicating that they are more prone to erosion than other zones, whereas Zone 1 has the lowest alternative weight of 0.036. The rainfall criteria in climate change hazard criteria have the highest weight of 0.223 with a CR of 0.09 in quality design, and the highest weight of 0.211 with a CR of 0.08 in semi-quantitative design. Zone 5 has the highest alternative weight of 0.386, suggesting that it is more prone to erosion than the other zones, whereas Zone 4 has the lowest alternative weight of 0.061, showing that it is less prone to erosion than the other zones. In quality design, the river criterion in environmental criteria has the greatest weight of 0.232 with a CR of 0.09, while in semi-quantitative design, it has the highest weight of 0.282 with a CR of 0.09. Zone 5 has the greatest alternative weight of 0.434, indicating that it is more prone to erosion than other zones, whereas Zone 1 has the lowest alternative weight of 0.053. In quality design, the built-up criterion in human activity criteria has the greatest weight of 0.071 with a CR of 0.09, and in semi-quantitative design, it has the highest weight of 0.073 with a CR of 0.08. Zone 5 has the greatest alternative weight of 0.434, indicating that it is more prone to erosion than other zones, whereas Zone 2 has the lowest alternative weight of 0.055. The most vulnerable site, according to the research, is Zone 5, Bukit Besar. Both the hazard and vulnerable criteria are very vulnerable to it. The northern and southern districts of Kuala Terengganu have less erodible coastline regions. Environmental impact assessment (EIA) is critical in many fields, including environmental management and engineering. The results of this study reveal that the international airport in Kuala Terengganu is at moderate risk due to its location in a low-lying and flood-prone area. The findings of this study may assist managers in making better judgments and implementing new management, as well as enable the Terengganu state government to devise a strategy for addressing the erosion problem in this area. It should be mentioned that the erosion criterion used in this study should be altered in a different study area since the criteria used in Kuala Terengganu may not be relevant in other areas.
The government will need to define appropriate and unsuitable regions in order to determine whether areas are at high danger or low risk for coastal building. The findings of this study will help planners, policymakers, and decision-makers better understand the effects of climate change on coastal city regions when developing short- and long-term projections of land use appropriateness in Kuala Terengganu’s coastal districts. These study findings and outputs are critical because they might be used by the government, policymakers, and planners in the future to allocate funding and plan correctly in this field. The study identified and assessed a variety of adaptation solutions for dealing with possible climate change vulnerabilities in a number of major industries in the region. The findings provide a prioritized ranking that indicates the overall preference for each of the adaptation alternatives in the research area’s coastal zones. According to the findings, the government may implement new laws to safeguard this region from coastal erosion by building jetties and seawalls to protect the inland area from wave action and prevent coastal erosion.

4.1. Coastal City Erosion Control

Coastal erosion has severe consequences because it changes landforms, land use, and property ownership. Social, economic, and physical values are all affected by such changes, both directly and indirectly. Controlling coastal land erosion can help to reduce the impacts of coastal city erosion. Structural methods alter the physical features of the coastline, provide a physical barrier to the sea, and clearly identify the protected region. They always necessitate building expenditure, which is frequently substantial, and have immediate and sometimes long-term environmental consequences. For many, if not all, coastal erosion concerns, structural solutions are competing for alternatives. Seawalls, breakwaters, and jetties are structural methods that are especially suited in Kuala Terengganu for protecting the east coast of Peninsular Malaysia from geographically Kuala Terengganu coastal erosion.
Land and water are separated by seawalls. Their main goal is to keep the upland they have taken over from being damaged by waves. Seawalls are huge, free-standing constructions that are built to withstand the full power of waves. Undermining and flanking of sea barriers must be avoided. Furthermore, the usage of seawalls frequently necessitates acceptance of increased beach erosion in front of the seawall.
Jetties are more for navigational purposes than for erosion management, although they do control erosion in a small region of the river mouth and reduce one of the consequences of erosion. Jetties are structures that extend seaward from the river mouth to limit and guide river and tidal flows, as well as to prevent the navigation channel’s shoreline from being obstructed. Because accretion reduces the amount of sand delivered to the river mouth, the shoreline on the other side will erode. This accretion erosion will continue until the updraft shore has been built out to the end of the accreting jetty. When sand movement along the coast is evenly balanced in both directions, accretion may occur at both jetties for a period of time, and erosion may occur on both sides of the river mouth for a comparable period of time.
Breakwaters are structures that intercept waves before they reach a coastal region, harbor anchoring, or basin, providing protection from the elements. The traditional role of breakwaters in navigation improvement has been supplemented by the protection of coastal regions to limit erosion. Breakwaters prevent erosion by decreasing or preventing wave energy from reaching the shore. Breakwaters are free-standing, enormous structures that directly fight the power of waves. When circumstances are good, the cumulative impact is accretion, which can link breakwater and coastline. For most areas of Malaysia’s east coast, particularly Kuala Terengganu, a breakwater is a functionally acceptable erosion control structure. However, in many cases, they are more expensive than other options.

4.2. Control Works and Protection

Throughout the Kuala Terengganu coastline, structural control measures have been implemented. Expert selection and fieldwork observation took appropriateness and efficacy into account independently. Works were deemed appropriate if the conceptual approach was sound, implying that the structure employed was appropriate. When surveyed, the structure was judged to be effective if it had no structural or functional flaws.
At their bases, seawalls have a tendency to increase erosion and scour. Foundation collapse is probable for most seawalls unless toe protection is provided. Seawalls also have a tendency to speed up erosion at their ends. The wall will be flanked and eventually demolished from the landward side unless it returns to allow for this erosion. These natural symbioses have been seen in numerous coastal regions on the east coast, including the Kuala Terengganu coastal districts.
The predicted socio-economic effects of critical erosion risk regions imply that the social and economic costs of erosion may soon be intolerable. For the Kuala Terengganu area, feasibility studies are needed to more clearly identify and quantify such costs, as well as the costs of control, so that protective investment choices may be taken by impacted institutions. Kuala Terengganu’s leisure resorts of Kuala Nerus and Pengadang Buluh are located near Gong Merbau and Left Bank. Ibai, K.
The recreational facility is a sandy beach that is well known and has a strong brand. Erosion has already taken a toll on the beach, which is now just 30 or 40 m wide. There are other beach sites in the region where leisure use may be relocated without too much difficulty. Kuala Nerus and Pengadang Buluh in Kuala Terengganu, on the other hand, are well-known beaches that people are accustomed to visiting. They have developed support facilities and are well known.
When all of these factors are taken into account, a moderate demographic impact is predicted. It receives a modest economic effect rating based on a similar rationale. This gives the feasibility study a lot of weight and makes it a top priority. To establish the most appropriate protection strategy, the feasibility study will examine breakwaters, jetty, and beach restoration alone and in combination.

4.3. Limitations of the Study

As a result, it is determined that AHP and Expert Choice software can help with decision-making in coastal city areas like Kuala Terengganu; however, there are various challenges and constraints for integrated decision-making models. The insufficiency of sources of environmental criteria and sub-criteria for erosion in the coastal city region is one of the primary constraints of utilizing the AHP model. The insufficiency of sources of environmental criteria and sub-criteria for erosion in coastal regions, for example, was the primary restriction in utilizing MCDA models in this study. Furthermore, there was a lack of a core database for the research area’s environmental and coastal cities. Finding recognizable and consistently characterized coastal land-use indicators at individual coastal city sites proved challenging, if not impossible in some circumstances. Because this study was based on limited coastal city data, it can only provide a broad picture of environmental risks in the Kuala Terengganu coastal area. However, as a study of general coastal management and planning in the Kuala Terengganu coastal area, it may point to future research directions.

4.4. Recommendations and Future Work

The findings of this study indicate that mathematical MCDA models and computer software may be used to identify and estimate weights for criterion, sub-criteria, and alternatives for coastal conservation management and planning in Kuala Terengganu. Although the model can show the potential of using these integration methods and provide useful results in the study area, more research and application of this methodology are needed to test the model’s transferability in a variety of criteria and alternatives with similar and different coastal hazard assessments. Coastal vulnerability, such as erosion and flooding, can impact conservation and sustainability in coastal city regions; future research on coastal environmental conservation might combine environmental sustainability and vulnerability. The geospatial model used in this study can help coastal managers, planners, and developers identify vulnerable regions and enhance the coastal land-use plan and coastal city management plan. The future sustainability of coastal city systems may then be forecasted using time series data, maps, and satellite pictures for the selected indicators, resulting in a more accurate projection of future sustainability. As a result, decision-making data may be effectively obtained, assisting government policymakers in establishing stronger, more sustainable coastal development. It should be mentioned that the erosion criterion used in this study should be altered in another study area since the criteria used in Kuala Terengganu may not be applicable in other areas. The future sustainability of coastal city systems may then be forecast utilizing a time series data map and satellite pictures for the selected criteria, resulting in a more accurate projected sustainability. As a result, decision-making data may be effectively generated to aid government policy-making in establishing stronger, more sustainable coastal development.

Author Contributions

Conceptualization, M.B.; Z.Z.I.; S.M.; L.A.M.; Methodology, M.B.; L.A.M.; S.M.; Z.Z.I.; Validation, M.B.; Z.Z.I.; Formal Analysis, M.B.; Z.Z.I.; L.A.M.; Investigation, M.B.; Z.Z.I.; S.M.; L.A.M.; Resources, M.B.; Z.Z.I.; Data Curation, M.B.; Z.Z.I.; Writing—Original Draft Preparation, M.B.; Z.Z.I.; Writing—Review and Editing, M.F.A.; W.I.A.W.T.; A.B.P.; Visualization, M.B.; Z.Z.I.; Supervision, M.B.; Z.Z.I.; S.M.; L.A.M.; Project Administration, M.B.; Z.Z.I.; S.M.; L.A.M.; Funding Acquisition, M.B.; Z.Z.I.; M.F.A.; W.I.A.W.T.; supervision A.B.P. All authors have read and agreed to the published version of the manuscript.

Funding

The Universiti Putra Malaysia (UPM) RUGS 4 with Project Number (03-04-11-1477RU) and RUGS 6 with Project Number (03-01-12-1664RU) programs provided funding for this project.

Institutional Review Board Statement

Not applicable.

Informed Consent Statement

Not applicable.

Data Availability Statement

Not applicable.

Acknowledgments

Many thanks to all of Peninsular Malaysia’s government entities who assisted with this initiative, as well as the several pilots that made it possible. Thanks also to NAHRIM, JUPEM, DID, and SMART for allowing me to use their facilities. The INOS Higher Institution of Centre of Excellence (Vot 66928), Universiti Malaysia Terengganu (UMT), is also thanked for helping to fund the study’s expansion.

Conflicts of Interest

The authors declare that they have no conflict of interest.

References

  1. Bagheri, M.; Ibrahim, Z.Z.; Mansor, S.B.; Abd Manaf, L.; Badarulzaman, N.; Vaghefi, N. Shoreline change analysis and erosion prediction using historical data of Kuala Terengganu, Malaysia. Environ. Earth Sci. 2019, 78, 1–21. [Google Scholar] [CrossRef]
  2. Rahman, H.A. Global climate change and its effects on human habitat and environment in Malaysia. Malays. J. Environ. Manag. 2009, 10, 17–32. [Google Scholar]
  3. Mentaschi, L.; Vousdoukas, M.I.; Pekel, J.F.; Voukouvalas, E.; Feyen, L. Global long-term observations of coastal erosion and accretion. Sci. Rep. 2018, 8, 1–11. [Google Scholar] [CrossRef] [Green Version]
  4. Burcharth, H.F.; Zanuttigh, B.; Andersen, T.L.; Lara, J.L.; Steendam, G.J.; Roul, P.; Chen, Z. Coastal Risk Management in a Changing Climate; Butterworth-Heinemann: Oxford, UK, 2014; pp. 55–170. [Google Scholar]
  5. Balica, S.F.; Wright, N.G.; Van der Meulen, F. A flood vulnerability index for coastal cities and its use in assessing climate change impacts. Nat. Hazards 2012, 64, 73–105. [Google Scholar] [CrossRef] [Green Version]
  6. Cowell, P.J.; Thom, B.G.; Jones, R.A.; Everts, C.H.; Simanovic, D. Management of uncertainty in predicting climate-change impacts on beaches. J. Coast. Res. 2006, 22, 232–245. [Google Scholar] [CrossRef]
  7. Neumann, B.; Vafeidis, A.T.; Zimmermann, J.; Nicholls, R.J. Future coastal population growth and exposure to sea-level rise and coastal flooding-a global assessment. PLoS ONE 2015, 10, e0118571. [Google Scholar] [CrossRef] [Green Version]
  8. Ehsan, S.; Begum, R.A.; Nor, N.G.M.; Maulud, K.N.A. Current and potential impacts of sea level rise in the coastal areas of Malaysia. In IOP Conference Series: Earth and Environmental Science; IOP Publishing: Bristol, UK, 2019; Volume 228, p. 012023. [Google Scholar]
  9. Hunt, J.D.; Byers, E. Reducing sea level rise with submerged barriers and dams in Greenland. Mitig. Adapt. Strateg. Glob. Chang. 2019, 24, 779–794. [Google Scholar] [CrossRef] [Green Version]
  10. Mimura, N. Sea-level rise caused by climate change and its implications for society. Proc. Jpn. Acad. Ser. B 2013, 89, 281–301. [Google Scholar] [CrossRef] [Green Version]
  11. Nicholls, R.J. Case Study on Sea-Level Rise Impacts. Available online: https://citeseerx.ist.psu.edu/viewdoc/download?doi=10.1.1.552.4668&rep=rep1&type=pdf (accessed on 27 September 2018).
  12. Wu, Q.; Liu, Y.; Liu, D.; Zhou, W. Prediction of floor water inrush: The application of GIS-based AHP vulnerable index method to Donghuantuo coal mine, China. Rock Mech. Rock Eng. 2011, 44, 591–600. [Google Scholar] [CrossRef]
  13. Nicholls, R.J.; Cazenave, A. Sea-Level Rise and Its Impact on Coastal Zones. J. Sci. 2010, 328, 1517–1520. [Google Scholar] [CrossRef]
  14. Duong, T.M.; Ranasinghe, R.; Walstra, D.; Roelvink, D. Assessing climate change impacts on the stability of small tidal inlet systems: Why and how? Earth-Sci. Rev. 2016, 154, 369–380. [Google Scholar] [CrossRef]
  15. Kremer, H.; Crossland, C. Coastal change and the” Anthropocene”: Past and future perspectives of the IGBP-LOICZ project. In Proceedings of the Low-Lying Coastal Areas-Hydrology and Integrated Coastal Zone Management: International Symposium, Bremerhaven, Germany, 9–12 September 2002; Bundesanstalt für Gewässerkunde: Koblenz, Germany, 2002; pp. 3–19. [Google Scholar]
  16. Kumar, A.; Jayappa, K.S. Long and short-term shoreline changes along Mangalore coast, India. Int. J. Environ. Res. 2009, 3, 177–188. [Google Scholar] [CrossRef] [Green Version]
  17. Moore, L.J. Shoreline mapping techniques. J. Coast. Res. 2000, 16, 111–124. [Google Scholar]
  18. Raj, J.K. Net directions and rates of present-day beach sediment transport by littoral drift along the east coast of Peninsular Malaysia. Geol. Soc. Malays. Bull. 1982, 15, 57–70. [Google Scholar] [CrossRef]
  19. Łabuz, T.A. Environmental impacts—Coastal erosion and coastline changes. In Second Assessment of Climate Change for the Baltic Sea Basin; Springer: Cham, Switzerland, 2015; pp. 381–396. [Google Scholar]
  20. Cooper, J.A.G.; McLaughlin, S. Contemporary multidisciplinary approaches to coastal classification and environmental risk analysis. J. Coast. Res. 1998, 14, 512–524. [Google Scholar]
  21. DayangSiti, M.; Weliyadi, A.; Than, A. Method to Estimate the Land Loss from Sea Level Rise due to Gradual Warming in Kota Kinabalu. Borneo Sci. 2011, 28, 18–28. [Google Scholar]
  22. Senevirathna, E.M.T.K.; Edirisooriya, K.V.D.; Uluwaduge, S.P.; Wijerathna, K.B.C.A. Analysis of Causes and Effects of Coastal Erosion and Environmental Degradation in Southern Coastal Belt of Sri Lanka Special Reference to Unawatuna Coastal Area. Procedia Eng. 2018, 212, 1010–1017. [Google Scholar] [CrossRef]
  23. Salim, J.M.; Radzi, M.A.; Razali, S.M.; Cooke, F.M. Coastal Landscapes of Peninsular Malaysia: The Changes and Implications for Their Resilience and Ecosystem Services. In Landscape Reclamation-Rising from What’s Left; IntechOpen: London, UK, 2018. [Google Scholar]
  24. Ahmad, H.; Maulud, K.N.A.; Karim, O.A.; Mohd, F.A. Assessment of erosion and hazard in the coastal areas of Selangor. Geogr. Malays. J. Soc. Space 2021, 17. [Google Scholar] [CrossRef]
  25. Bagheri, M.; Zaiton Ibrahim, Z.; Mansor, S.; Manaf, L.A.; Akhir, M.F.; Talaat, W.I.A.W.; Beiranvand Pour, A. Land-Use Suitability Assessment Using Delphi and Analytical Hierarchy Process (D-AHP) Hybrid Model for Coastal City Management: Kuala Terengganu, Peninsular Malaysia. ISPRS Int. J. Geo-Inf. 2021, 10, 621. [Google Scholar] [CrossRef]
  26. Boateng, I. An assessment of the physical impacts of sea-level rise and coastal adaptation: A case study of the eastern coast of Ghana. Clim. Chang. 2012, 114, 273–293. [Google Scholar] [CrossRef]
  27. Ibrahim, N.; Wibowo, A. Predictions of water level in Dungun River Terengganu using partial least squares regression. Int. Basic Appl. Sci. 2013, 12, 1–7. [Google Scholar]
  28. Gasim, M.B.; Adam, J.H.; Toriman, M.E.H.; Rahim, S.A.; Juahir, H.H. Coastal Flood Phenomenon in Terengganu, Malaysia: Special Reference to Dungun. Res. J. Environ. Sci. 2007, 1, 102–109. [Google Scholar]
  29. Ishak, H.; Sidek, L.M.; Basri, H.; Fukami, K.; Hanapi, M.N.; Lahat, L.; Jaafar, A.S. Hydrological Extreme Flood Event in Dungun River Basin Region. In Proceedings of the 13th International Conference on Urban Drainage, Sarawak, Malaysia, 7–12 September 2014. [Google Scholar]
  30. Khanal, S.; Ridder, N.; de Vries, H.; Terink, W.; van den Hurk, B. Storm surge and extreme river discharge: A compound event analysis using ensemble impact modeling. Front. Earth Sci. 2019, 7, 224. [Google Scholar] [CrossRef]
  31. Talbot, C.J.; Bennett, E.M.; Cassell, K.; Hanes, D.M.; Minor, E.C.; Paerl, H.; Xenopoulos, M.A. The impact of flooding on aquatic ecosystem services. Biogeochemistry 2018, 141, 439–461. [Google Scholar] [CrossRef] [PubMed] [Green Version]
  32. Ariffin, E.H.; Sedrati, M.; Akhir, M.F.; Yaacob, R.; Husain, M.L. Open sandy beach morphology and morphodynamic as response to seasonal monsoon in Kuala Terengganu, Malaysia. J. Coast. Res. 2016, 75, 1032–1036. [Google Scholar] [CrossRef]
  33. Shaari, F.; Mustapha, M.A. Factors influencing the distribution of Chl-a along coastal waters of east Peninsular Malaysia. Sains Malays. 2017, 46, 1191–1200. [Google Scholar] [CrossRef]
  34. Selamat, S.N.; Maulud, K.N.A.; Mohd, F.A.; Rahman, A.A.A.; Zainal, M.K.; Wahid, M.A.A.; Awang, N.A. Multi method analysis for identifying the shoreline erosion during northeast monsoon season. J. Sustain. Sci. Manag. 2019, 14, 43–54. [Google Scholar]
  35. Mohd Akhir, M.F.; Zakaria, N.Z.; Tangang, F. Intermonsoon variation of physical characteristics and current circulation along the east coast of Peninsular Malaysia. Int. J. Oceanogr. 2014, 2014, 527587. [Google Scholar] [CrossRef] [Green Version]
  36. Marghany, M.; Mansor, S. Coastal Hazard Modeling from Radar Data. Pertanika J. Sci. Technol. 2000, 9, 81–86. [Google Scholar]
  37. Zainal Abidin, N.A. Assessing the Landscape Character of Malaysia’s Heritage Urban River Corridors. Doctoral Dissertation, Queensland University of Technology, Brisbane, Australia, 2017. [Google Scholar]
  38. Zulfakar, M.S.Z.; Akhir, M.F.; Ariffin, E.H.; Awang, N.A.; Yaacob, M.A.M.; Chong, W.S.; Muslim, A.M. The effect of coastal protections on the shoreline evolution at Kuala Nerus, Terengganu (Malaysia). J. Sustain. Sci. Manag. 2020, 15, 71–85. [Google Scholar]
  39. Mohamad, M.F.; Lee, L.H.; Samion, M.K.H. Coastal vulnerability assessment towards sustainable management of Peninsular Malaysia coastline. Int. J. Environ. Sci. Dev. 2014, 5, 533. [Google Scholar] [CrossRef] [Green Version]
  40. Capozzo, M.; Rizzi, A.; Cimellaro, G.P.; Domaneschi, M.; Barbosa, A.; Cox, D. Multi-hazard resilience assessment of a coastal community due to offshore earthquakes. J. Earthq. Tsunami 2019, 13, 1950008. [Google Scholar] [CrossRef]
  41. Morales, F.F., Jr.; De Vries, W.T. Establishment of Natural Hazards Mapping Criteria Using Analytic Hierarchy Process (AHP). Front. Sustain. 2021, 2, 667105. [Google Scholar] [CrossRef]
  42. Beaudrie, C.; Corbett, C.J.; Lewandowski, T.A.; Malloy, T.; Zhou, X. Evaluating the Application of Decision Analysis Methods in Simulated Alternatives Assessment Case Studies: Potential Benefits and Challenges of Using MCDA. Integr. Environ. Assess. Manag. 2021, 17, 27–41. [Google Scholar] [CrossRef]
  43. Gebre, S.L.; Cattrysse, D.; Alemayehu, E.; Van Orshoven, J. Multi-criteria decision-making methods to address rural land allocation problems: A systematic review. Int. Soil Water Conserv. Res. 2021, 9, 490–501. [Google Scholar] [CrossRef]
  44. van der Meer, J.; Hartmann, A.; van der Horst, A.; Dewulf, G. Multi-criteria decision analysis and quality of design decisions in infrastructure tenders: A contractor’s perspective. Constr. Manag. Econ. 2020, 38, 172–188. [Google Scholar] [CrossRef] [Green Version]
  45. Bagheri, M.; Sulaiman, W.N.A.; Vaghefi, N. Application of geographic information system technique and analytical hierarchy process model for land-use suitability analysis on coastal area. J. Coast. Conserv. 2013, 17, 1–10. [Google Scholar] [CrossRef] [Green Version]
  46. Yannis, G.; Kopsacheili, A.; Dragomanovits, A.; Petraki, V. State-of-the-art review on multi-criteria decision-making in the transport sector. J. Traffic Transp. Eng. 2020, 7, 413–431. [Google Scholar] [CrossRef]
  47. Bello-Dambatta, A.; Farmani, R.; Javadi, A.A.; Evans, B.M. The Analytical Hierarchy Process for contaminated land management. Adv. Eng. Inform. 2009, 23, 433–441. [Google Scholar] [CrossRef]
  48. Khademi, N.; Mohaymany, A.S.; Shahi, J.; Zerguini, S. An algorithm for the analytic network process (ANP) structure design. J. Multi-Criteria Decis. Anal. 2012, 19, 33–55. [Google Scholar] [CrossRef]
  49. Tuzkaya, G.; Önüt, S.; Tuzkaya, U.R.; Gülsün, B. An analytic network process approach for locating undesirable facilities: An example from Istanbul, Turkey. J. Environ. Manag. 2008, 88, 970–983. [Google Scholar] [CrossRef]
  50. Ishizaka, A.; Labib, A. Analytic hierarchy process and expert choice: Benefits and limitations. OR Insight 2009, 22, 201–220. [Google Scholar] [CrossRef] [Green Version]
  51. Zoppi, C. A multicriteria-contingent valuation analysis concerning a coastal area of Sardinia, Italy. Land Use Policy 2007, 24, 322–337. [Google Scholar] [CrossRef]
  52. Schmoldt, D.L.; Kangas, J.; Mendoza, G.A. Basic principles of decision making in natural resources and the environment. In The Analytic Hierarchy Process in Natural Resource and Environmental Decision Making; Springer: Dordrecht, The Netherlands, 2001; pp. 1–13. [Google Scholar]
  53. Orencio, P.M.; Fujii, M. A localized disaster-resilience index to assess coastal communities based on an analytic hierarchy process (AHP). Int. J. Disaster Risk Reduct. 2013, 3, 62–75. [Google Scholar] [CrossRef]
  54. Hill, M.J.; Braaten, R.; Veitch, S.M.; Lees, B.G.; Sharma, S. Multi-criteria decision analysis in spatial decision support: The ASSESS analytic hierarchy process and the role of quantitative methods and spatially explicit analysis. Environ. Modeling Softw. 2005, 20, 955–976. [Google Scholar] [CrossRef]
  55. Altuzarra, A.; Moreno-Jiménez, J.M.; Salvador, M. A Bayesian priorization procedure for AHP-group decision making. Eur. J. Oper. Res. 2007, 182, 367–382. [Google Scholar] [CrossRef]
  56. Bhutta, K.S.; Huq, F. Supplier selection problem: A comparison of the total cost of ownership and analytic hierarchy process approaches. Supply Chain. Manag. Int. J. 2002, 7, 126–135. [Google Scholar] [CrossRef]
  57. Dey, P.; Tabucanon, M.T.; Ogunlana, S.O. Planning for project control through risk analysis: A petroleum pipeline-laying project. Int. J. Proj. Manag. 1994, 12, 23–33. [Google Scholar] [CrossRef]
  58. Feltynowski, M.; Szajt, M. The Analytic Hierarchy Process (AHP) in Rural Land-use Planning in Poland: A Case Study of Zawidz Commune. Plan. Pract. Res. 2021, 36, 108–119. [Google Scholar] [CrossRef]
  59. Benzerra, A.; Cherrared, M.; Chocat, B.; Cherqui, F.; Zekiouk, T. Decision support for sustainable urban drainage system management: A case study of Jijel, Algeria. J. Environ. Manag. 2012, 101, 46–53. [Google Scholar] [CrossRef]
  60. Chen, S.; Jiang, Y.; Liu, Y.; Diao, C. Cost constrained mediation model for analytic hierarchy process negotiated decision making. J. Multi-Criteria Decis. Anal. 2012, 19, 3–13. [Google Scholar] [CrossRef]
  61. Bhuiyan, M.A.H.; Siwar, C. Tourism for Economic Development in East Coast Economic Region (ECER), Malaysia. In Proceedings of the Persidangan Kebangsaan Ekonomi Malaysia ke VI (PERKEM VI), Malacca, Malaysia, 5–7 June 2011; pp. 624–629. Available online: https://www.ukm.my/fep/perkem/pdf/perkemVI/PERKEM2011-1-3D6.pdf (accessed on 5 June 2011).
  62. Hisyam Hassan, M.K.; Rashid, Z.A.; Hamid, K.A. East Coast Economic Region from the Perspective of Shift-Share Analysis. Int. J. Bus. Soc. 2011, 12, 79. [Google Scholar]
  63. Sevkli, M.; Koh, S.C.L.; Zaim, S.; Demirbag, M.; Tatoglu, E. An application of data envelopment analytic hierarchy process for supplier selection: A case study of BEKO in Turkey. Int. J. Prod. Res. 2003, 45, 1973–2003. [Google Scholar] [CrossRef] [Green Version]
  64. Vaidya, O.S.; Kumar, S. Analytic hierarchy process: An overview of applications. Eur. J. Oper. Res. 2006, 169, 1–29. [Google Scholar] [CrossRef]
  65. Leal, J.E. AHP-express: A simplified version of the analytical hierarchy process method. MethodsX 2020, 7, 100748. [Google Scholar] [CrossRef] [PubMed]
  66. Dalalah, D.; Al-Oqla, F.; Hayajneh, M. Application of the Analytic Hierarchy Process (AHP) in Multi-Criteria Analysis of the Selection of Cranes. Jordan J. Mech. Ind. Eng. 2010, 4, 567–578. [Google Scholar]
  67. Saaty, T.L. A scaling method for priorities in hierarchical structures. J. Math. Psychol. 1977, 15, 234–281. [Google Scholar] [CrossRef]
  68. Franek, J.; Kresta, A. Judgment scales and consistency measure in AHP. Procedia Econ. Financ. 2014, 12, 164–173. [Google Scholar] [CrossRef] [Green Version]
  69. Waris, M.; Panigrahi, S.; Mengal, A.; Soomro, M.I.; Mirjat, N.H.; Ullah, M.; Khan, A. An application of analytic hierarchy process (AHP) for sustainable procurement of construction equipment: Multicriteria-based decision framework for Malaysia. Math. Probl. Eng. 2019, 2019, 6391431. [Google Scholar] [CrossRef]
  70. Yap, J.Y.; Ho, C.C.; Ting, C.Y. Analytic Hierarchy Process (AHP) for Business Site Selection. Available online: https://aip.scitation.org/doi/pdf/10.1063/1.5055553 (accessed on 27 September 2018).
  71. Ossadnik, W.; Schinke, S.; Kaspar, R.H. Group aggregation techniques for analytic hierarchy process and analytic network process: A comparative analysis. Group Decis. Negot. 2016, 25, 421–457. [Google Scholar] [CrossRef] [Green Version]
  72. Balubaid, M.; Alamoudi, R. Application of the analytical hierarchy process (AHP) to multi-criteria analysis for contractor selection. Am. J. Ind. Bus. Manag. 2015, 5, 581. [Google Scholar] [CrossRef] [Green Version]
  73. Tripathi, A.K.; Agrawal, S.; Gupta, R.D. Comparison of GIS-based AHP and fuzzy AHP methods for hospital site selection: A case study for Prayagraj City, India. GeoJournal 2021. [Google Scholar] [CrossRef] [PubMed]
  74. Bureš, V.; Cabal, J.; Čech, P.; Mls, K.; Ponce, D. The Influence of Criteria Selection Method on Consistency of Pairwise Comparison. Mathematics 2020, 8, 2200. [Google Scholar] [CrossRef]
  75. Williams, A.T.; Rangel-Buitrago, N.; Pranzini, E.; Anfuso, G. The management of coastal erosion. Ocean. Coast. Manag. 2018, 156, 4–20. [Google Scholar] [CrossRef]
Figure 1. Kuala Terengganu study area.
Urbansci 05 00084 g001
Figure 2. AHP framework, showing the four computational parts for qualitative data analysis and three computational parts for semi-quantitative data analysis.
Urbansci 05 00084 g002
Figure 3. Analytical hierarchy process design.
Urbansci 05 00084 g003
Figure 4. In Expert Choice software, an example of four different graphical coastal city vulnerability assessment sensitivity evaluations is shown.
Urbansci 05 00084 g004aUrbansci 05 00084 g004b
Figure 5. In Expert Choice software, an example of four possible graphical coastal city hazard assessment sensitivity evaluations is shown.
Urbansci 05 00084 g005aUrbansci 05 00084 g005b
Figure 6. Final weights for semi-quantitative vulnerability layers.
Urbansci 05 00084 g006aUrbansci 05 00084 g006bUrbansci 05 00084 g006c
Figure 7. Final weights for semi-quantitative hazard layers.
Urbansci 05 00084 g007aUrbansci 05 00084 g007b
Table 1. The fundamental AHP important scale.
For Any Pair of Objectives i, j
Verbal Judgment of PreferenceThe Intensity of Importance Numerical Rate
The equal importance of both components1
Judgment slightly favors one component
over another (moderate difference of importance)
3
Judgment strongly favors one component over another (strong difference of importance).5
Very strong favoring of one component concerning another.7
Evidence of extreme difference of importance of one component concerning another.9
Note: 2, 4, 6, 8 are intermediate values between the two adjacent judgments (Source: [64]).
Table 2. Random consistency indices.
n345678910
RI0.580.91.121.241.321.411.451.49
Table 3. AHP weights for qualitative vulnerability criteria.
GoalIndexCriteriaCRWeightSub-CriteriaCRWeightAlternativeWeight
Coastal City Erosion Vulnerability Assessment (CCEVA)Vulnerability Index (VI)Environmental Criteria (EC)River0.090.232Seasonal change0.060.084Zone 10.053
Water discharge0.060.207Zone 20.129
Flood intensity0.030.27Zone 30.199
Sedimentology (Sediment rate)0.060.123Zone 40.105
Runoff water0.070.06Zone 50.439
Rainfall & runoff correlation0.060.256Zone 60.075
Land Use0.040.201Plantation & cultivation0.070.125Zone 10.101
Forestry0.070.239Zone 20.186
Rangeland0.070.046Zone 30.218
Urban, rural, industrial, and military development0.090.361Zone 40.075
Watershed0.060.105Zone 50.237
Cultural areas0.050.05Zone 60.183
Geology0.080.036Geomorphologic scale0.080.566Zone 10.101
Zone 20.066
Waterways geo-profile0.080.26Zone 30.121
Tectonic process0.080.086Zone 40.211
Zone 50.435
Geology era0.080.08Zone 60.067
Slope0.090.118Slope Class0.080.582Zone 10.052
Zone 20.204
The average slope of waterway/floodway0.070.161Zone 30.118
The average slope of land use0.090.197Zone 40.103
Zone 50.132
Regions without slope0.040.06Zone 60.392
Soil0.090.088Soil type0.080.373Zone 10.075
Soil erosion0.070.337Zone 20.1
Soil influence0.060.099Zone 30.267
Zone 40.038
Organic material0.090.045Zone 50.472
Land proportion for agriculture use0.070.145Zone 60.048
Topography0.090.177Vertical classification0.090.223Zone 10.104
Zone 20.163
Vertical classification in coastal area0.090.239Zone 30.096
Area and location of classification0.080.425Zone 40.138
Zone 50.267
Average height0.080.113Zone 60.232
Human Activity Criteria (HAC)Road0.080.030Grid type0.090.2Zone 10.082
Water resource proximity to the road0.090.148Zone 20.039
Zone 30.093
Road location to coast0.090.607Zone 40.035
Type of materials0.090.045Zone 50.528
Zone 60.223
Population0.090.047Density/ha0.090.112Zone 10.063
Density in land shapes0.070.129Zone 20.267
Zone 30.207
Density in coastline0.060.501Zone 40.069
Density in rural and urban zone0.060.045Zone 50.299
Density in hazardous areas0.080.213Zone 60.095
Built up (BC)0.070.071Land shape0.080.338Zone 10.055
River grid location0.040.184Zone 20.17
Zone 30.172
Distance to coast0.070.426Zone 40.072
Local/non-local materials supply0.070.052Zone 50.434
Zone 60.097
Table 4. D-AHP weights for qualitative hazard criteria.
GoalIndexCriteriaCriteria CRCriteria WeightSub-CriteriaSub-Criteria CRSub-Criteria WeightAlternativeAlternative Weight
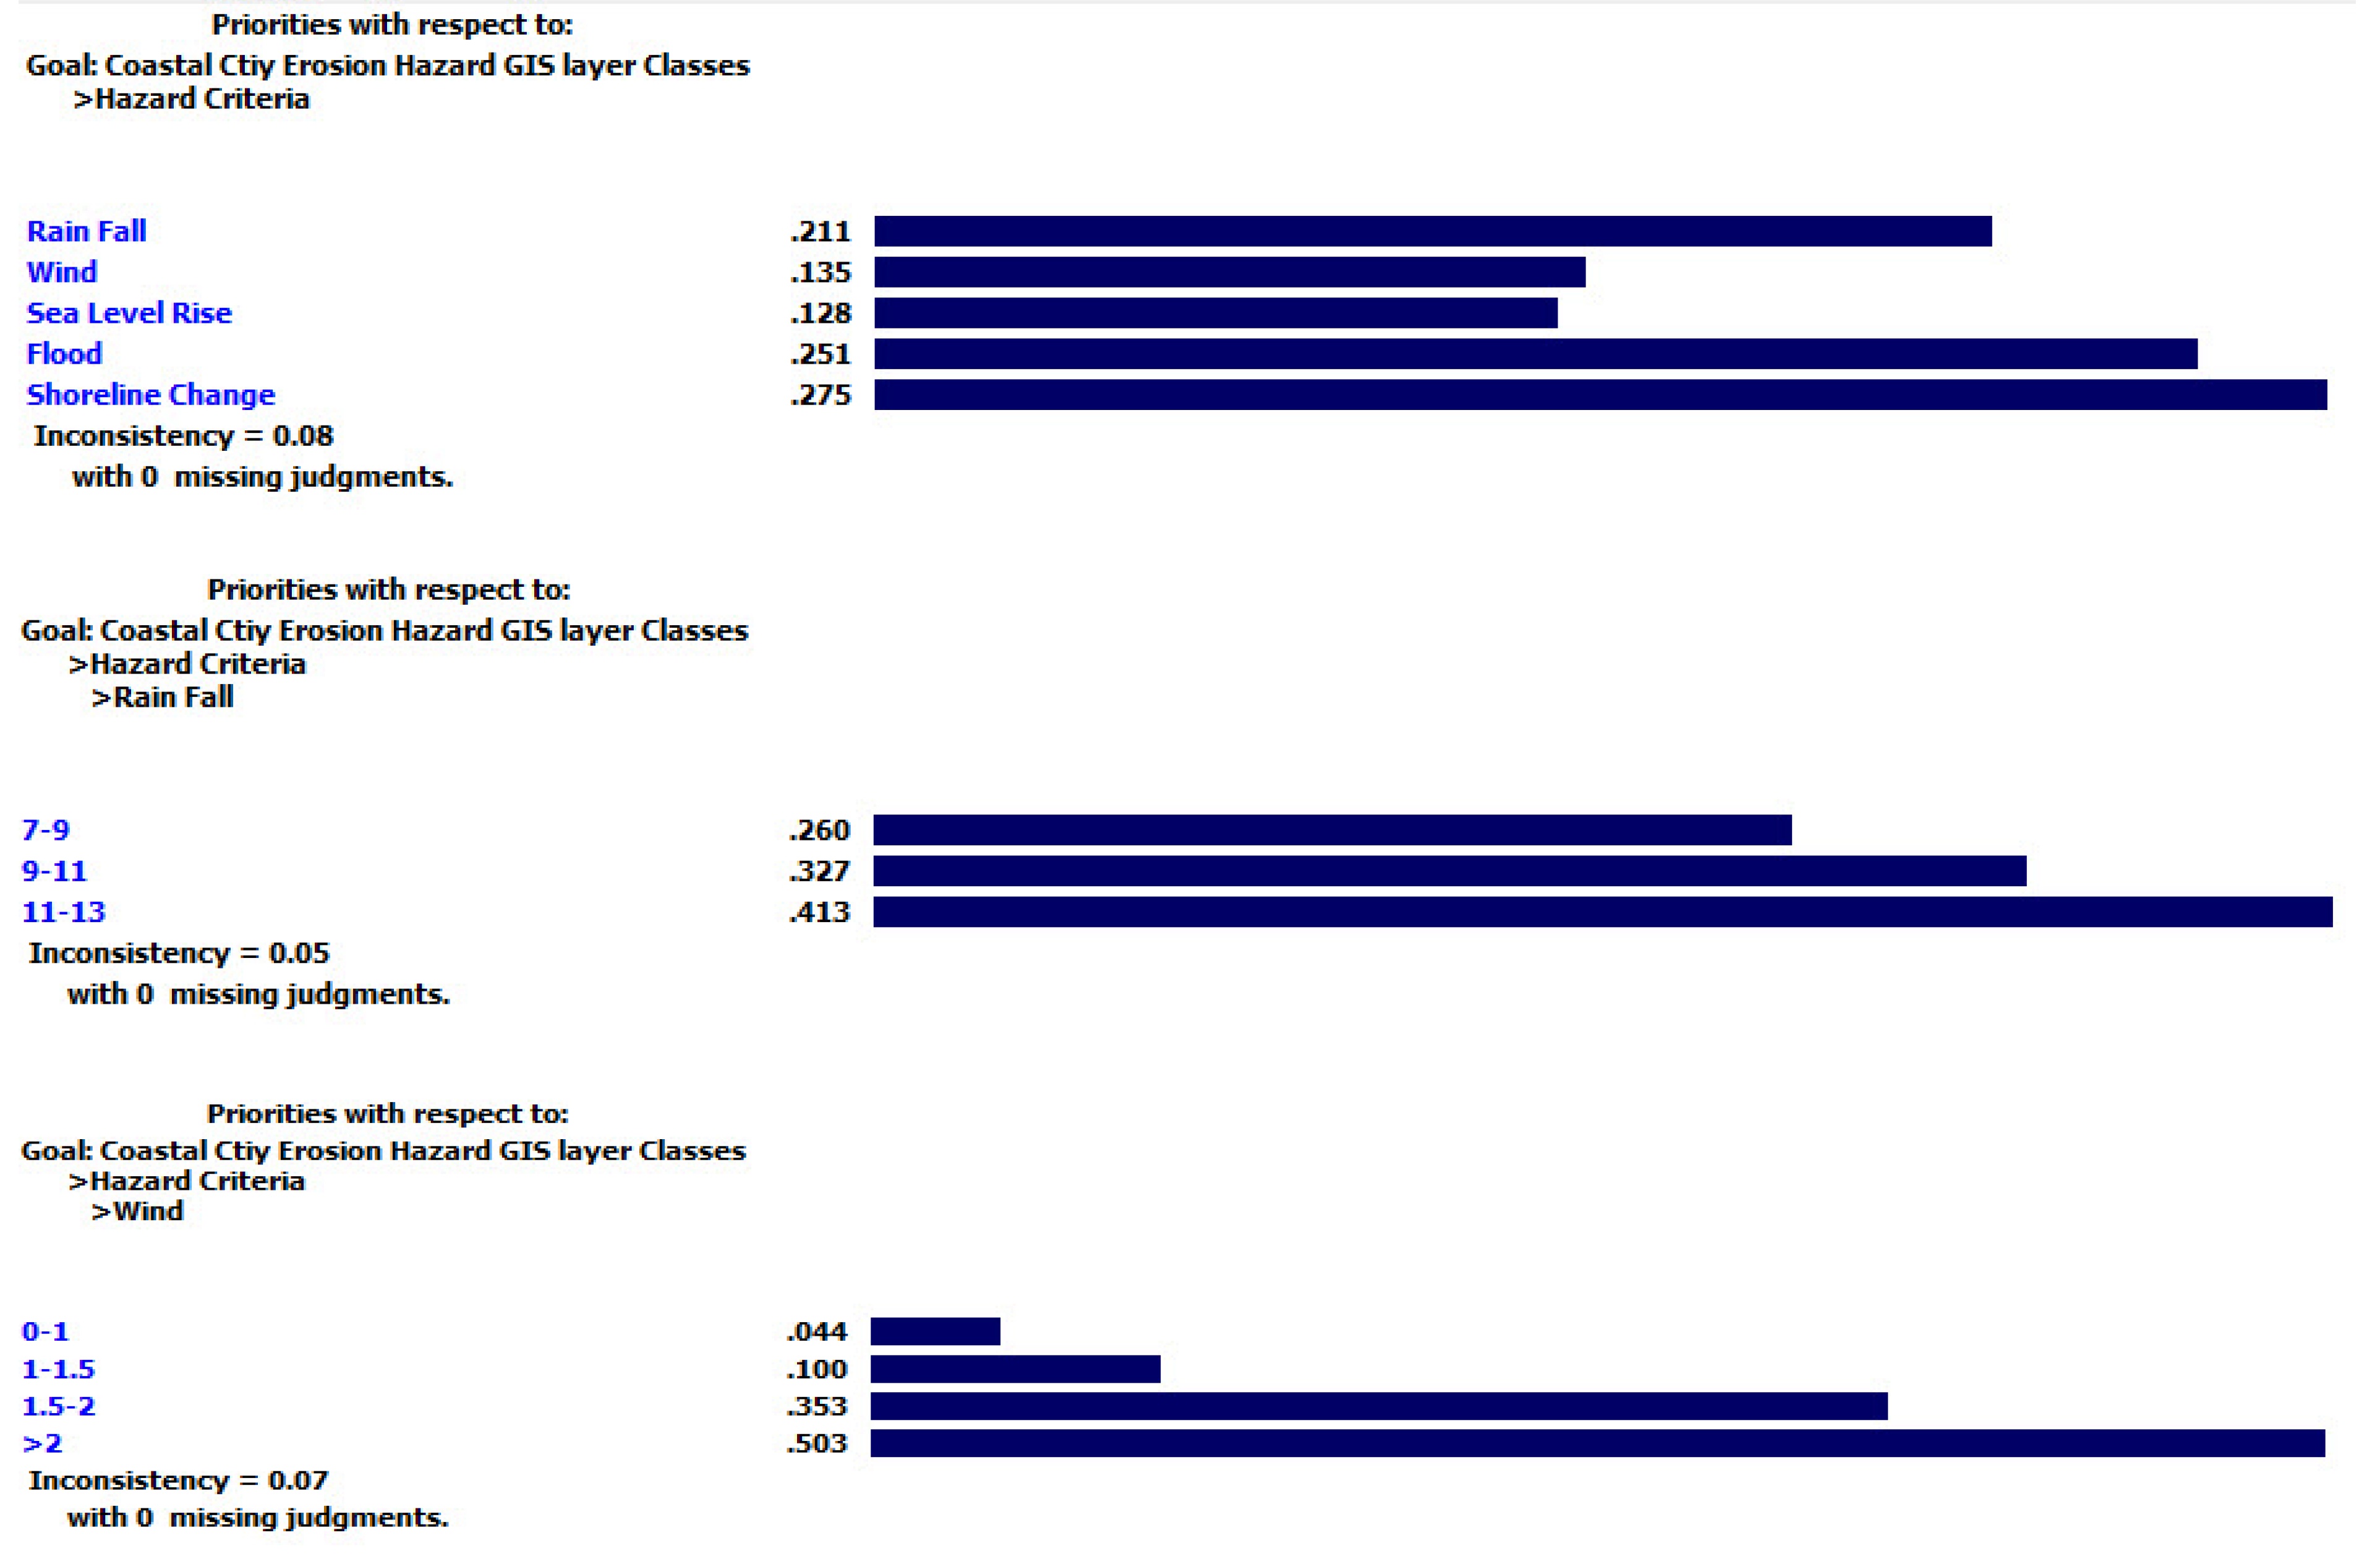
Coastal City Erosion Hazard Assessment (CCEHA)Hazard Index (HI)Climate Change Hazard Criteria (CCHC)Rainfall0.090.223Rainfall amount0.070.423Zone 10.111
Rainfall node0.070.216Zone 20.094
Zone 30.239
Monsoon rainfall0.090.199Zone 40.061
Max rainfall0.080.162Zone 50.386
Zone 60.109
Wind0.090.126Wind speed0.060.413Zone 10.097
Major wind direction0.090.26Zone 20.12
Zone 30.179
Zone 40.196
Wind & wave correlation0.080.327Zone 50.279
Zone 60.13
Sea level rise0.050.114Land and sea upward coastline0.080.591Zone 10.076
Historical changes0.090.135Zone 20.123
Historical coastal erosion due to high changes0.050.2Zone 30.224
Zone 40.044
Reform of beach platform / base on changes in height0.080.075Zone 50.41
Zone 60.123
Coastal Hazards Criteria (CHC)Flood0.070.264Flash flood Area0.080.069Zone 10.036
Flood volume0.070.377Zone 20.117
Flood intensity0.080.219Zone 30.376
Correlation between flood and river grid0.090.085Zone 40.048
Zone 50.375
Coastal zone flash flood area0.070.25Zone 60.050
Coastline Change0.010.274coastline lithology0.070.169Zone 10.092
Coastline natural hazard0.090.338Zone 20.099
Zone 30.267
Coastal land use0.090.299Zone 40.051
Permissible change to minimize coastline vulnerability0.090.194Zone 50.440
Zone 60.051
Table 5. Coastal vulnerability sensitivity weights.
NoCriteriaRiver %
10%50%90%
1Land Use23.511.12.3
2Topography20.717.33.6
3Geology4.220.5
4Slope13.86.51.4
5Soil10.44.91.1
6Built-Up8.33.90.9
7Population5.52.60.6
8Road3.51.70.4
1Zone 1 (Merang)10.28.77.3
2Zone 2 (Butu Rakit)17.614.211.2
3Zone 3 (Kuala Nerus)16.517.619.7
4Zone 4 (Manir)9.510.410.8
5Zone 5 (Bukit Besar)26.434.442.2
6Zone 6 (Rusila)19.914.79.4
Table 6. Coastal hazard sensitivity weights.
NoCriteriaCoastline Change %
10%50%90%
1Wind15.68.71.8
2Rainfall27.615.33.2
3Flood32.718.23.8
4Sea Level Rise14.17.81.7
1Zone 1 (Merang)7.96.85.8
2Zone 2 (Butu Rakit)11109.1
3Zone 3 (Kuala Nerus)27.128.830.6
4Zone 4 (Manir)86.95.8
5Zone 5 (Bukit Besar)36.944.151.3
6Zone 6 (Rusila)9.17.95.4
Publisher’s Note: MDPI stays neutral with regard to jurisdictional claims in published maps and institutional affiliations.

