


Emissions of Greenhouse Gases from Municipal Solid Waste Management System in Ho Chi Minh City of Viet Nam

Regional Resource Centre for Asia and the Pacific, Asian Institute of Technology, Pathum Thani 12120, Thailand
*
Author to whom correspondence should be addressed.
Urban Sci. 2022, 6(4), 78; https://doi.org/10.3390/urbansci6040078
Submission received: 2 October 2022
/
Revised: 28 October 2022
/
Accepted: 2 November 2022
/
Published: 7 November 2022
(This article belongs to the Special Issue Urban Climate Change Management and Society)
Abstract
:Accurate estimation of emissions of greenhouse gases (GHGs) is required for making effective climate change mitigation policies at the national level. Among major sources, municipal solid waste (MSW) is an important source of GHGs, such as methane (CH4), generated during the anaerobic decomposition of organic matter. In Viet Nam, the emissions of GHGs are not well quantified, in particular from the MSW management system. In this study, we estimated emissions of GHGs from the MSW management system of Ho Chi Minh City (HCMC), considering the current waste management practices. In HCMC, landfilling has been a common practice of solid waste management. About 85 percent of the total MSW generated in the city has been landfilled at two landfill sites. Our estimates show that landfilling was the significant source of GHGs in HCMC, with a net contribution of 781.05 kg CO2-equivalent (CO2-eq.) per tonne of MSW landfilled. From the whole MSW management system, the direct GHG emission was 768.61 (kg CO2-eq. per tonne of MSW) with avoided emissions of 72.47 (kg CO2-eq. per tonne of MSW) through composting and recycling of MSW. The net GHG emission from the MSW management system was 696.14 kg CO2-eq. per tonne of MSW (≈1.665 million tonnes of CO2-eq. per year). The GHG emission data of this study may be useful to policymakers for making effective climate change mitigation policies.
1. Introduction
Atmospheric gases, namely, carbon dioxide (CO2), methane (CH4), nitrous oxide (N2O), hydrofluorocarbons (HFCs), perfluorocarbons (PFCs), and sulfur hexafluoride (SF6) are collectively termed as the greenhouse gases (GHGs). Their emissions are expressed in terms of CO2-equivalent (CO2-eq.). GHGs absorb incoming solar radiation and outgoing terrestrial radiation in the atmosphere and alter the radiative budget of the Earth. The accumulation of excess energy in the Earth-atmosphere system results in several adverse effects on the climate, including a rise in global average temperature, sea-level rise, glaciers melting, agriculture production loss, ecosystem damage, and biodiversity loss [1]. CH4, an important GHG, possesses 0.97 Wm−2 radiative forcings and an 84 global warming potential (GWP, in 20 years of time horizon) [1]. Anaerobic decomposition of organic matter is a major source of CH4 in the environment.
Municipal solid waste (MSW) contains a large fraction of organic matter, such as food waste, kitchen waste, garden waste, etc. The percentage composition of organic waste in MSW varies with the lifestyles of people in Asian cities. For example, the percentage of organic waste in the MSW of Jabalpur city was 39%, 47%, and 44% in the waste generated by the higher-income group, middle-income group, and lower-income group, respectively [2]. The percentage of organic waste in the MSW of Thailand was about 64% [3]. The percentage of organic waste in the MSW of Manila, Kuala Lumpur, Bangkok, Singapore, and Jakarta varied from 35–70% [4].
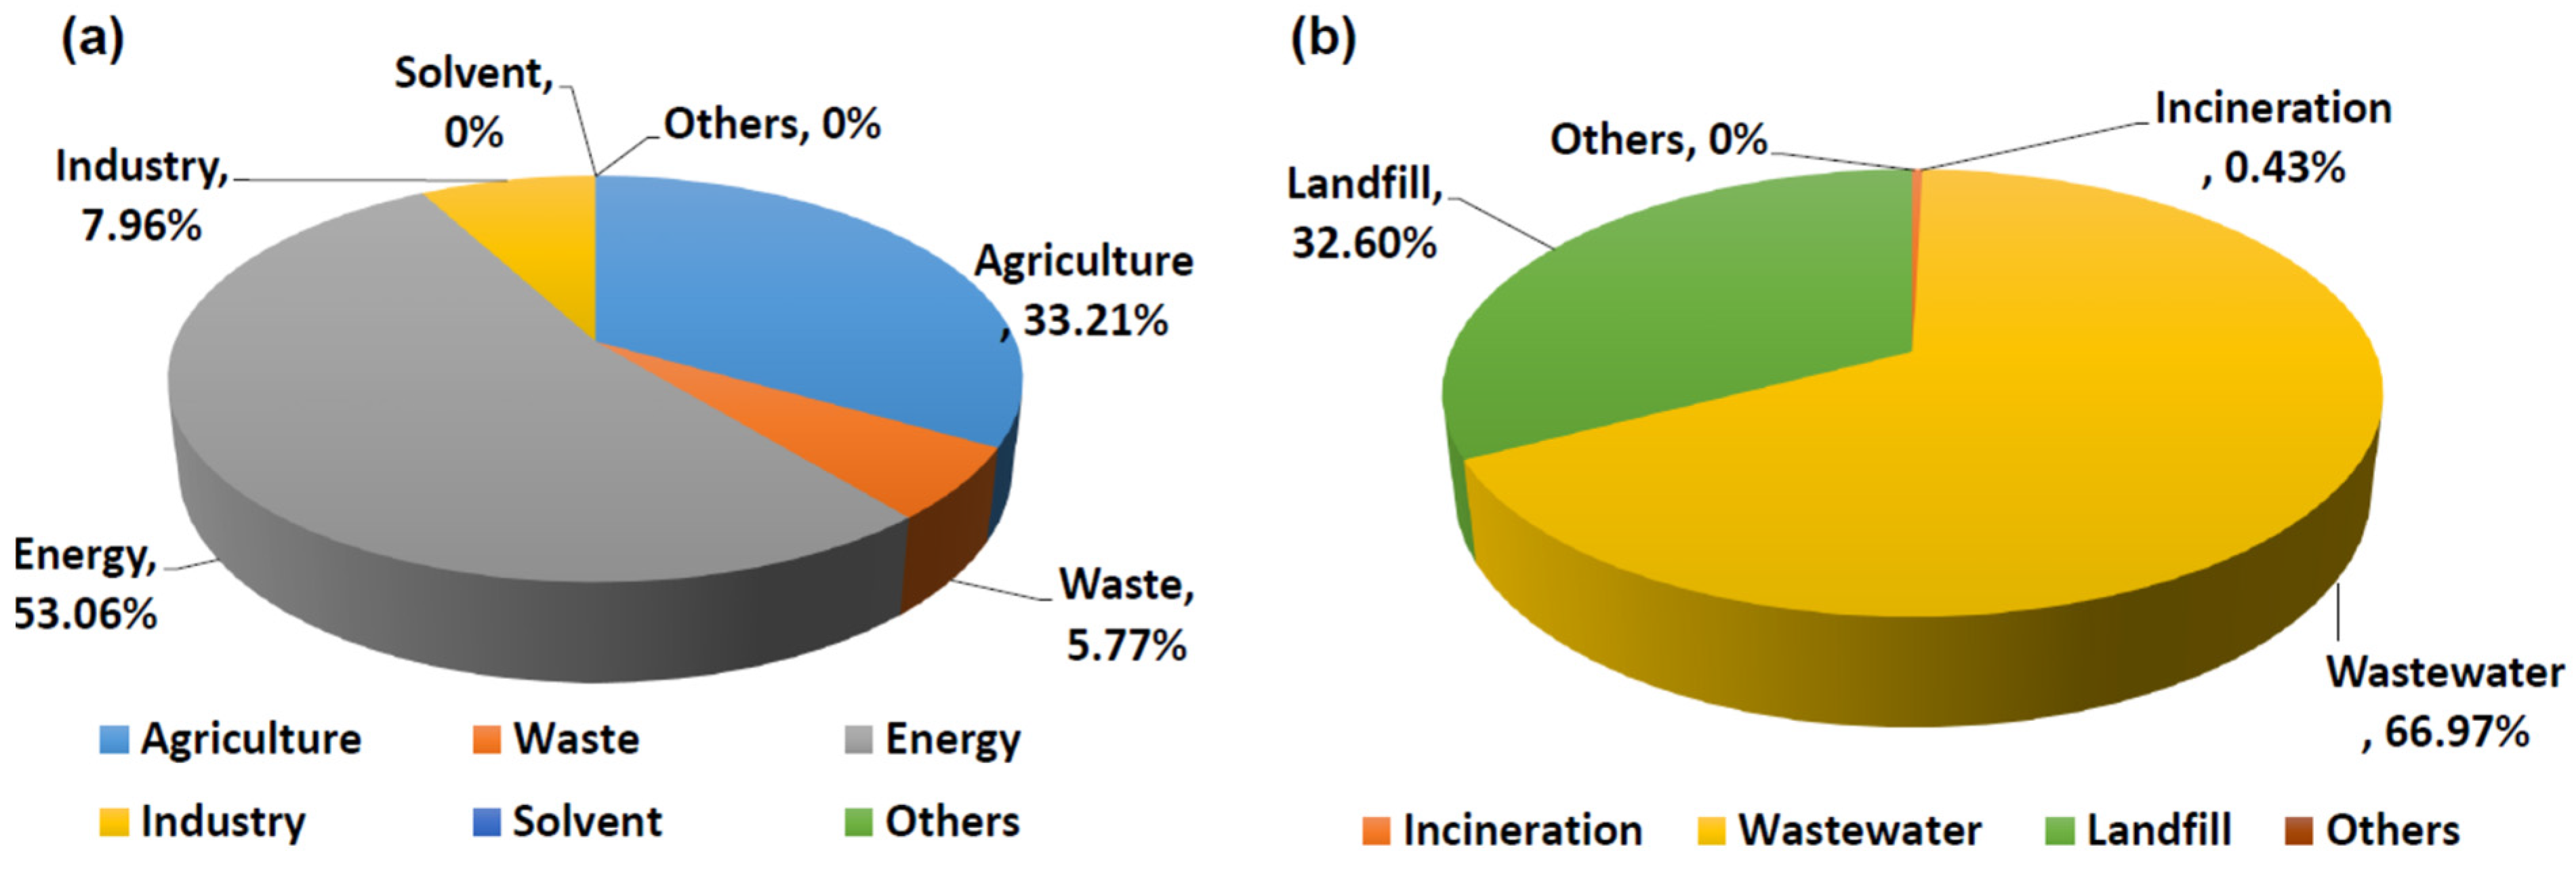
In Viet Nam, total GHG emissions at the national level, without taking into account the land-use change and forestry (LUCF), is 266,049.23 Gg/year in 2010, contributing 53.06% from the energy sector, 33.21% from the agricultural sector, 7.96% from the industrial sector, and 5.77% from the waste sector (Figure 1) [5]. In the waste sector, wastewater contributes 66.97%, followed by landfill 32.60%. GHG contribution from incineration is only 0.43% (Figure 1). Thus, the landfilling of waste in Viet Nam is an important source of GHG emissions, which requires attention in GHG emission reduction policies.
In our previous study [6], we quantified the solid waste generation in Ho Chi Minh City (HCMC) and analyzed the composition and gaps with regard to current waste management regulation, economic policies, institutional arrangements, technologies in use, infrastructure, capacity building, stakeholders’ participation, and financing mechanism, and conducted SWOT (strengths, weaknesses, opportunities, and threats) analysis for the MSW management system and proposed several recommendations.
In this study, we estimated emissions of GHGs from the MSW system of HCMC using the GHG calculator for solid waste ver. II-2013, developed by the IGES (Institute for Global Environmental Strategies, Hayama, Kanagawa, Japan) [7]. The GHG emission data of this study may be useful to the policymakers of Viet Nam in making climate change mitigation policies.
2. Ho Chi Minh City
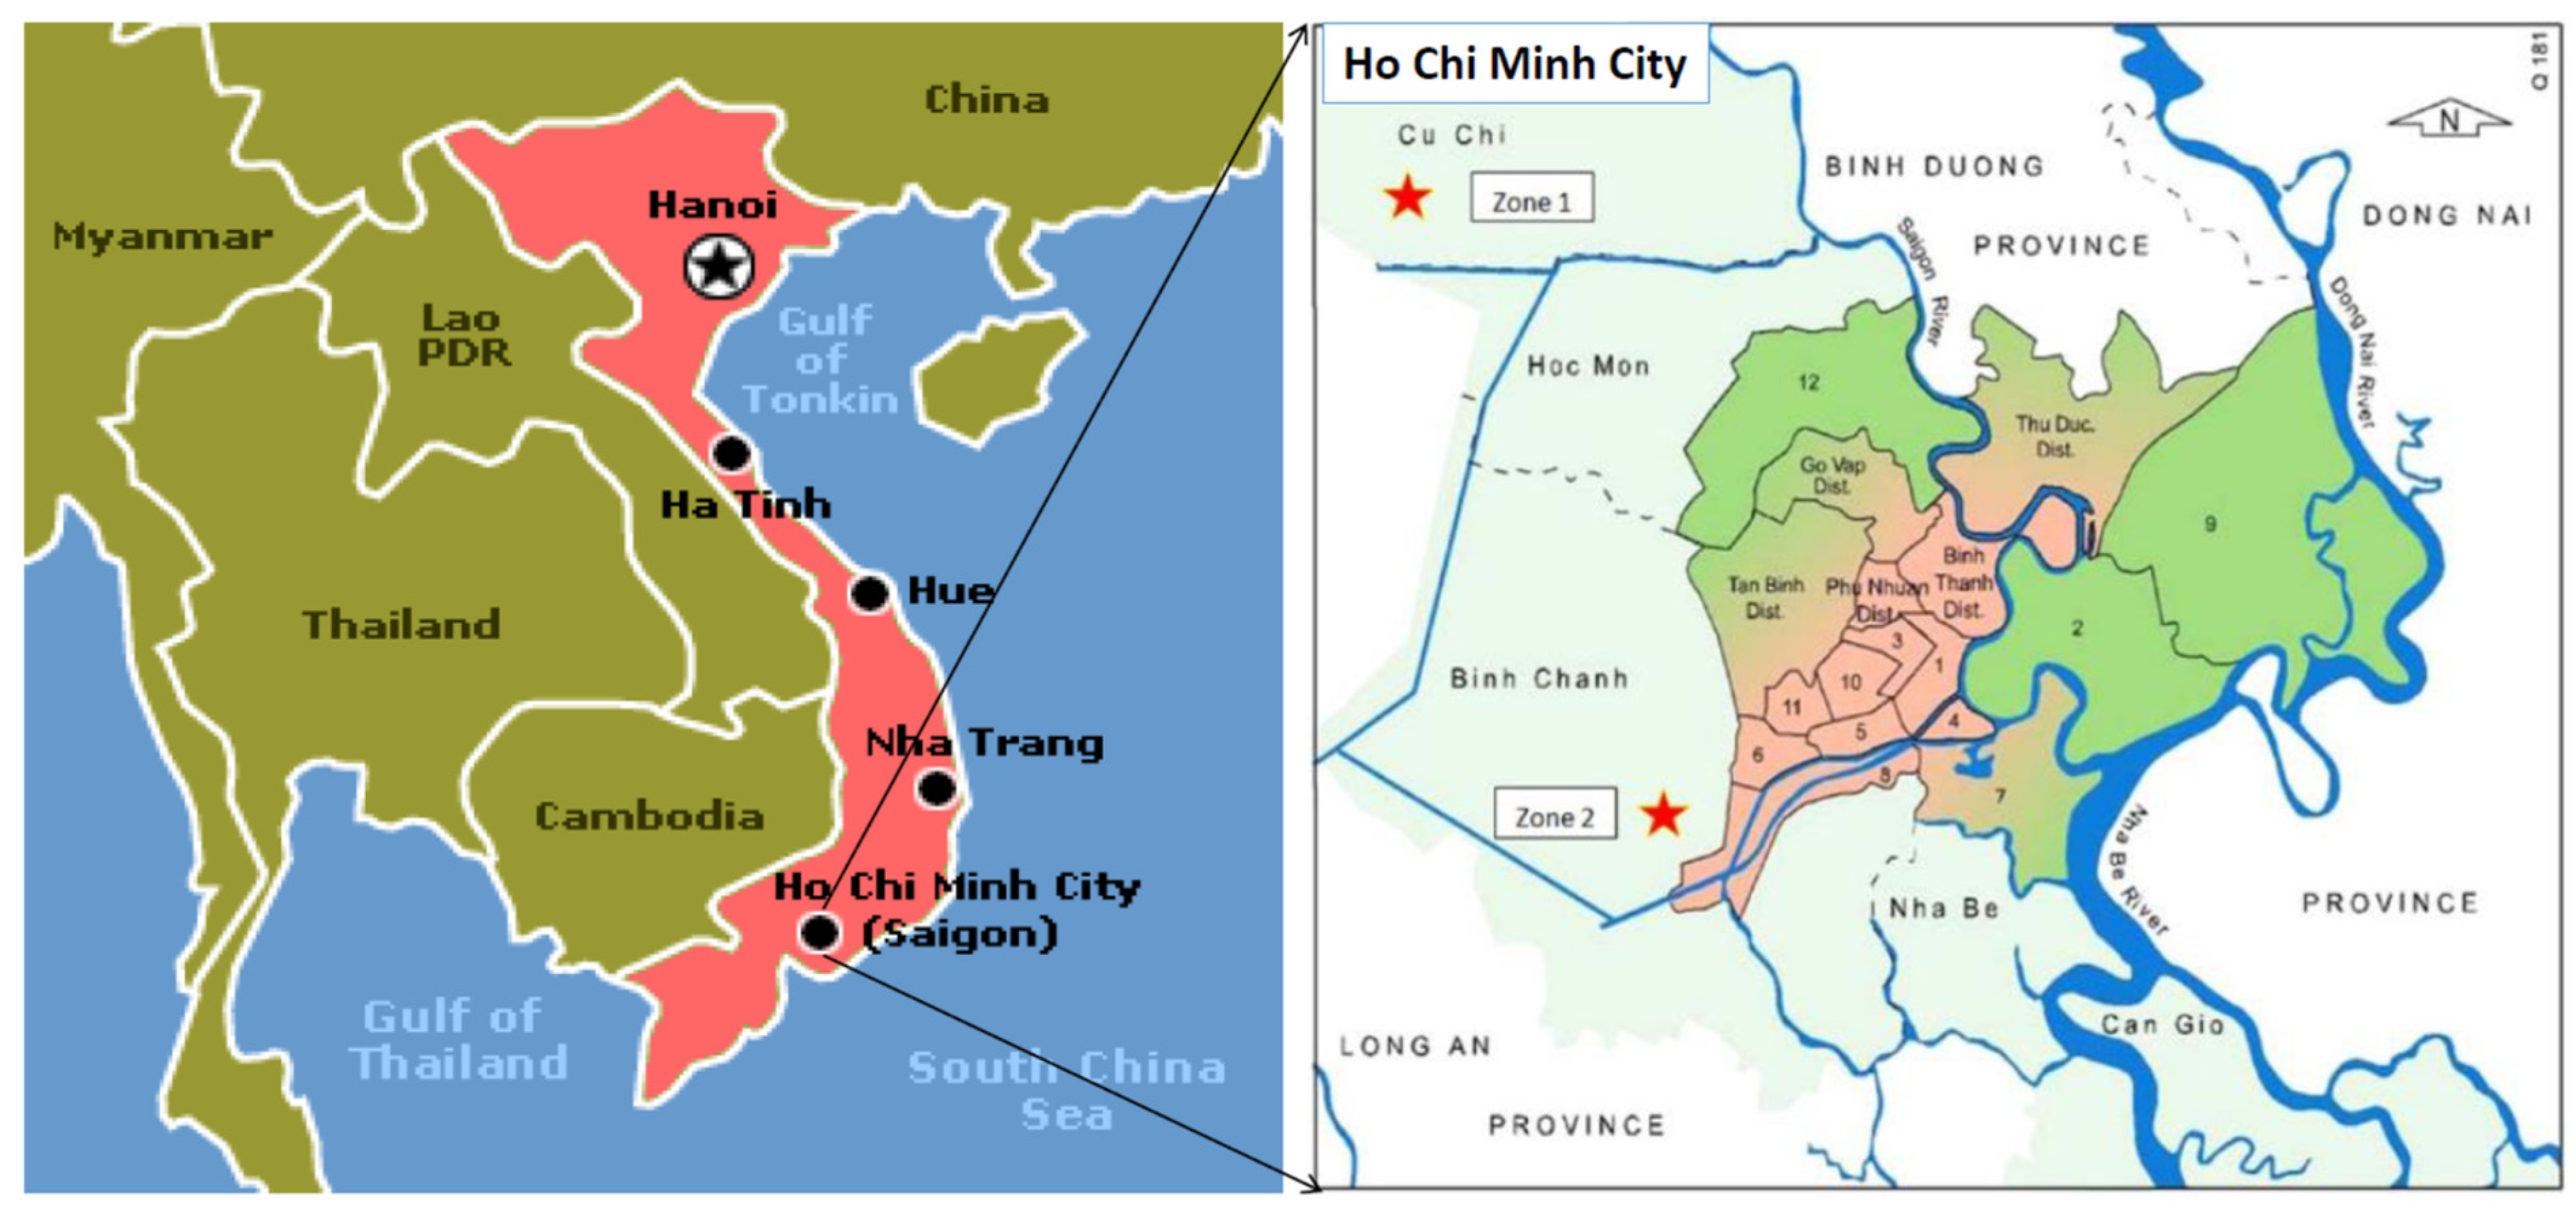
Ho Chi Minh City (HCMC) is located in the transition zone between the southeast and southwest of Viet Nam. The city is divided into 24 districts with a total area of 209,506 km2 (Figure 2). The metropolitan area of HCMC is greater than Hanoi, the capital city of Viet Nam. It is the most populous city of Viet Nam with a population of 8,993,082 (2019 census) comprising more than 10% of the total population of the country. With rapid economic development in the Southeast Asian region, HCMC is also experiencing rapid economic growth. In 2019, the gross regional product (GRP) of HCMC was estimated at $61.7 billion with a per capita income of $6862. The economic sectors in HCMC consist of mining, seafood processing, agriculture, construction, tourism, finance, industry, and trade. The city plays an important role in the economy of Viet Nam, accounting for about 21.3% of the total GDP and 29.38% of the total revenue of the country.
3. Methodology
3.1. Data Collection
Data for this study were collected from the Division of Solid Waste Management (DOSWM) of the Department of Natural Resource and Management (DONRE), HCMC. The data included organic waste (e.g., food waste) and recyclable waste (e.g., paper, plastic, nylon, metals, glass, rag, scrab, cans, rubber, etc.), fabric, ebonite, wood, foam, hide, demolition and soils, porcelain, carton, battery, cotton balls, etc. Detailed quantities of each type of waste were given in our previous study [6] and the characterization of waste is given in Section 4.2. As shown in Figure 2, there are two landfill sites in HCMC, namely, Phuoc Hiep (Zone 1) and Da Phuoc (Zone 2). These landfill sites are equipped with heavy-duty truck weighing machines. The weight of the waste generated in the city was determined by subtracting the weight of the truck without waste from the weight of the truck with waste. The segregation of waste into its different components, such as decomposable or organic (e.g., food waste) and recyclable (e.g., metals, plastics, cans, etc.) was done manually at the source of origin (e.g., houses), at the selected collection sites, as well as at the landfill sites. Households are encouraged to segregate their wastes before disposal. The recyclable waste was further processed, for example, by crushing it into fine pieces and sending it to the recycling company, while the organic waste was either sent to landfilling or composting facilities.
3.2. GHG Emission Estimation
The IPCC, in 2006, published the guidelines to quantify emissions of GHGs from various waste management technologies and practices [9]. These guidelines are a well-established methodology for the estimation of emissions of GHGs from waste management practices and have been used extensively by many studies [10,11,12,13,14]: In the present study, the GHG calculator for solid waste ver. II-2013 was used [7]. This model was developed using the IPCC 2006 guidelines. The description of equations and schemes used in the model and those applied in the present study are illustrated in Section 4.3.
4. Result and Discussion
4.1. Waste Generation and Management Practices
Verma et al. (2016) have discussed in detail the waste generation and current management practices in HCMC [6]. In brief, the main sources of solid waste generation in HCMC were domestic activities, contributing about 6800–7000 tonnes of waste per day; followed by construction and demolition activities, contributing about 500–800 tonnes per day; healthcare waste (20–25 tonnes per day), and hazardous waste (250–350 tonnes per day) (Table 1). Adding the maximum value of the solid waste from each source category, the total maximum solid waste generated in HCMC was about 8175 tonnes per day (Table 1). About 85% of MSW generated in HCMC was mostly sanitary landfilled at two active landfill sites, namely, Phuoc Hiep (Zone 1) and Da Phuoc (Zone 2), shown in Figure 2. The remaining 15% of MSW (by volume) was used for composting. The sorting of MSW was mostly done at the household level and at selected collection sites as well as at landfill sites. The sorted organic waste was used for making compost. From one tonne of mixed MSW, about 600 kg of compost was produced. In 2012, about 500 tonnes of organic waste was processed for making compost per day [15].
4.2. Waste Characterization
The percentage composition of solid waste generated in HCMC is shown in Figure 3 and Table 1. The MSW occupies a large portion of the total solid waste generated in the city, accounting for about 85.6%. Whereas the percentage of other waste sources is comparatively less; for example, construction and demolition activities contribute about 9.8%, followed by hazardous waste 4.3%, and hospital and healthcare waste 0.3%.
The fraction of organic matter is crucial in solid waste for the production of GHG, i.e., CH4 through decomposition and degradation of organic matter. Figure 4 shows the physical composition of MSW of HCMC, both dry weight and wet weight basis, expressed in percentage. The components of MSW in HCMC were mostly contributed by households, schools, restaurants, and hotels. Food waste is the largest component in the MSW, both on a dry and wet basis, contributing 51.6% and 69%, respectively (Figure 4).
Other major components in MSW of HCMC include plastic (16% and 25%), textile (5% and 7%), and papers (3% and 4%) on a wet basis and dry basis, respectively. The other minor components, which accounted for less than 0.5% in MSW of HCMC, were considered negligible. Overall, the MSW of HCMC consists of 65–90% biodegradable waste or organic waste and 10–25% recyclable waste, such as plastics, papers, metals; and remaining non-biodegradable waste, etc. [6].
4.3. GHG Emission Estimation
The GHG calculator for solid waste ver. II-2013 model included all possible processes, namely, transportation, landfilling, composting, anaerobic digestion, mechanical biological treatment, recycling, incineration, and open burning where possibilities of GHG emissions exist. Table 2 illustrates the factors and default values suggested by the IPCC 2006 waste guidelines. The same factors and values are used in the present study.
4.3.1. GHG Emissions from MSW Transportation
The transportation of waste from the point of generation to the treatment or disposal site is a significant source of GHG emissions. The combustion of fossil fuels (diesel and gasoline) in waste-transportation trucks, emits GHGs. To estimate the contribution of GHG emissions from the combustion of fossil fuels during the transportation of waste, the following equation was used.
where, EmissionsT is the emissions of GHG in kg CO2/tonne of waste transported; Fuel (units) is the total amount of fossil fuel (diesel in liters and natural gas in kg) consumed; Waste (tonnes) is the total amount of waste transported; Energy (MJ/unit) is the energy content in the fossil fuel (e.g., diesel 36.42 MJ/L, natural gas 37.92 MJ/kg); and EF is the emission factor of fuel for CO2 (e.g., diesel: 0.074 kg CO2/MJ, natural gas: 0.056 kg CO2/MJ).
EmissionsT = Fuel (unit)/Waste (tonnes) × Energy (MJ/unit) × EF (kgCO2/MJ)
As per the DONRE Report of 2009 [17], 235 trucks had been deployed for the transportation of waste every day from the point of waste generation to the treatment or disposal sites. These trucks mostly run-on diesel fuel and normally consume about 148,000 L of diesel per day and transport 6481 tonnes of MSW per day in HCMC. Using Equation (1), the estimated GHG emissions from the transportation of MSW was 6.15 kg CO2-eq. per tonne of waste.
4.3.2. GHG Emissions from Anaerobic Decomposition of Organic Waste in Landfills
Landfilling is the most common disposal method of MSW in most cities of the world [18]. It involves burying the waste in low-lying land where the decomposition of waste takes place in an uncontrolled environment, which results in emissions of GHG (mostly CH4). The IPCC (2006) guideline encourages the use of first-order decay (FOD) as it estimates more accurate emissions since it reflects the actual degradation of waste in the landfill site. First-order decay is as follows:
where, DDOCm(0) is the mass of decomposable degradable organic carbon (DDOC) at the start of reaction (t = 0 and e−kt = 1); k is the reaction constant; t is the time in years; and DDOCm is the mass of DDOC at any time. Using Equation (2), the mass of DDOC left (not decomposed) at the end of the year in landfill sites was calculated as follows:
DDOCm = DDOCm(0) × e−kt
DDOCm(1) = DDOCm(0) × e−k
The calculation of the mass of DDOC decomposed into CH4 and CO2 was made as follows:
DDOCmdecomp(1) = DDOCm(0) × (1 − e−k)
However, in actual situations, there was a possibility that decaying reactions might have started in previous years of waste deposition in the landfill site. Thus, a separate calculation for the deposition years was needed. To calculate the mass of decomposable DOC (DDOC m) from the amount of waste material, the following equation was used:
DDOCmd(T) = W(T) × DOC × DOCf × MCF
The amount of deposited DDOCmrem remaining (not decomposed) at the end of the deposition year T was calculated as follows:
and the amount of deposited DDOCm decomposed during deposition year T was calculated as:
DDOCmrem(T) = DDOCmd(T) × e(−k • ((13 − M)/12)
DDOCmdec(T) = DDOCmd(T) × (1 − e (−k • ((13 − M)/12)))
The amount of DDOCm accumulated in the disposal site at the end of year T was calculated as:
DDOCma(T) = DDOC mrem(T) + (DDOCma(T − 1) × e−k)
The total amount of DDOCm decomposed in year T was calculated as:
DDOCmdecomp(T) = DDOCmdec(T) + (DDOCma(T − 1) × (1 − e−k))
The amount of CH4 generated from DOC decomposed was:
CH4 generated(T) = DDOCmdecomp(T) × F × 16/12
The amount of CH4 emitted from the disposal sites was calculated as follows:
where, T is the year of inventory; W(T) is the amount of waste deposited in year T; MCF is the CH4 correction factor; DOC is the degradable organic carbon (under aerobic conditions); DOCf is the fraction of DOC decomposing under anaerobic conditions (0.0–1.0); DDOC is the decomposable degradable organic carbon (under anaerobic conditions); DDOCmd(T) is the mass of DDOC deposited year T; DDOCmrem(T) is the mass of DDOC deposited in inventory year T, remaining not decomposed at the end of year; DDOCmdec(T) is the mass of DDOC deposited in inventory year T decomposed during the year; DDOCma(T) is the total mass of DDOC left at the end of year T; DDOCma(T−1) is the total mass of DDOC left decomposed at the end of year T − 1; DDOCmdecomp(T) is the total mass of DDOC decomposed in year T; CH4 generated(T) is the CH4 generated in year T; F is the fraction of CH4 by volume in generated landfill gas (0.0–1.0); 16/12 is the molecular weight ratio of CH4/C; R(T) recovered CH4 in year T; and OX(T) is the oxidation factor in year T (fraction).
CH4 emitted in year T = (ΣCH4 generated(T) − R(T)) × (1 − OX(T))
Table 3 illustrates the estimated emissions of GHG from the sanitary landfills, including both decomposition and operational activities. In HCMC, the total mixed MSW landfilled was about 255,000 tonnes per month with a total landfill capacity of about 3,060,000 tonnes per year. The decomposition of disposed MSW produced 113.62 Gg CH4 per year or 37.13 kg CH4 per tonne of waste landfilled. Converting the estimated CH4 emissions into GHG (CO2-eq.), the estimated emissions of GHG from the decomposition of landfilled MSW was about 779.78 kg CO2-eq. per tonne MSW and adding the GHG emissions of 1.27 kg of CO2-eq. per tonne of MSW, estimated from the operational activities (fossil fuel, such as diesel, consumed for operating the machines). Thus, the estimated total GHG emissions from the whole landfill system were 781.05 kg GHG per tonne of waste landfilled (Table 3).
4.3.3. GHG Emissions from Composting
There are two major ways through which GHG emissions in composting take place, namely, the use of energy (electricity and diesel consumed during the operation of the composting facility) and the degradation and decomposition of organic waste. For the calculation of GHG emissions from energy consumed in the operation of the composting facility, Equation (1) was used. While for the calculation of GHG emissions from the degradation of organic waste, the following equation was used:
where, EmissionsDegradation is the emissions from organic waste degradation (in kg CO2 per tonne of organic waste); ECH4 is the emissions of CH4 generated during organic waste degradation (in kg of CH4 per tonne of waste); GWPCH4 is the global warming potential of CH4 (in 21 kg CO2 per kg of CH4)2; EN2O is the emissions of N2O during waste degradation (kg of N2O/tonne of waste) default value 0.3; and GWPN2O is the global warming potential of N2O (310 kg CO2/kg of N2O)2.
EmissionDegradation = ECH4 × GWPCH4 + E N2O × GWPN2O
Total GHG emissions from the composting activities were calculated by adding GHG emissions from the composting facility operation and waste degradation processes, as follows:
Total GHGcomposting = EmissionOperation + EmissionDegradation
Table 4 illustrates GHG emissions estimated from the composting activities in HCMC. The total amount of food waste used for the compositing was 11,000 tonnes per month and the amount of fossil fuel (i.e., diesel) used for the operation of the composting facility was 64,000 L per month. The amount of compost produced was 4800 tonnes per month. Using Equation (1), the GHG emissions from the operational activities were calculated and the estimated value was 15.68 kg CO2-eq. per tonne of waste composed. Whereas GHG emitted during the degradation of organic waste was estimated using Equation (12), the estimated emissions of GHG was 177.00 kg CO2-eq. per tonne. Adding the estimated emissions of GHG from the operational activities and the degradation process, the total estimated GHG emissions from the composting system was 192.68 kg CO2-eq. per tonne of waste (Table 4).
If the 11,000 tonnes of organic waste were sanitary-filled, instead of composting each month, there would have been a significant amount of GHG emissions due to the degradation of organic waste in the landfill sites. We estimated GHG emissions using Equations (2)–(11), mentioned in Section 4.3.2. The estimated GHG emission was 892.30 kg CO2-eq. per tonne of waste. Therefore, the composting of 11,000 tonnes of food waste monthly avoided the emissions of GHGs of 892.30 kg CO2-eq. per tonne of waste. Considering the life cycle perspective of the organic waste (if the waste was not utilized as compost and landfilled), the composting facility avoided the net GHG emissions by 699.12 kg of CO2-eq./tonne of waste (Table 4)
4.3.4. Estimation of GHG from Waste Recycling
The recycling of waste is the best available and sustainable option for waste management. By doing so, not only the recovery of valuable materials can be done but it can also avoid a significant amount of GHG emissions and harmful pollutants as well. The recycling of waste provides immense socio-economic benefits to society, including a clean environment and various kinds of employment for people. Therefore, incorporation of the recycling process into integrated waste management can be the most valuable action to drive the entire system towards sustainability.
In the case of HCMC, GHG emissions from the recycling activities were estimated using the following equation:
GHGRecycling =(FC × NCVFF × EFCO2) + (EC × FEel)
EmissionsRecycling is the emissions of GHG from recycling (kg CO2/tonne of recyclables waste); FC is the fuel consumption apportioned to the activity type (mass or volume/tonne of recyclables waste); NCVFF is the net calorific value of the fossil fuel consumed (MJ/unit mass or volume); EFCO2 is the emission factor of CO2 by combustion of fossil fuel (kg of CO2/MJ); EC is the electricity consumption for operation activities (MWh/tonne of recyclables); and EFel is the emission factor of country grid electricity production (kg CO2-eq./MWh).
Table 5 shows the amount and percentage composition of recycled waste in HCMC. The waste is normally bought by over 300 junk shops. On average, about 8813.7 tonnes of solid waste was recycled monthly in HCMC. The maximum quantity of waste recycled was from papers and plastics, contributing about 3363.8 and 3794.2 tonnes per month, respectively. Metals, which included aluminum, iron, zinc, and lead, were the next highest quantity of waste recycled in HCMC, accounting for about 1124.3 tonnes per month, followed by glass with a contribution of about 384.3 tonnes per month. Other solid wastes recycled in HCMC were rags (36.7 tonnes/month), scraps (36.6 tonnes/month), nylon (39.2 tonnes/month), and rubber (34.6 tonnes/month).
For the estimation of GHG emissions from the recycling of waste, the composition of waste is needed. As shown in Table 5, there are two sets of data (Group A and B) on recycled waste. The data in Group A were collected from 202 junk shops and properly segregated into various components including paper, plastic, aluminum, steel, and glass. On the other hand, in Group B data, only the metal waste was summed up. Therefore, to avoid uncertainties, Group A data were used for the estimation of GHG emissions.
The estimated direct GHG emission from recycling activities was 1263.95 kg of CO2-eq. per tonne of recycled waste (Table 6). Recycling is a very complex process that requires energy for sorting, transportation of recyclable waste from point of origin to sorting sites and to the recycling facility, and recycling of waste. All these activities emitted a considerable amount of GHGs. On the other hand, materials recovered from recycling processes can be used to replace an equivalent amount of new materials and thereby avoid a significant amount of GHG emissions. In the case of HCMC, recycling of 8813.7 tonnes of solid waste monthly, avoided GHG emissions of 3181.13 kg of CO2-eq. per tonne of waste recycled. By subtracting direct GHG emissions from indirect saving (or avoided) of GHG emissions, the net GHG emission was (–) 1917.18 kg of CO2-eq. per tonne of waste (Table 6). The negative signs show that GHG emission was saved because of the recycling of solid waste.
4.3.5. Net GHG Emissions from the Whole Waste Management System
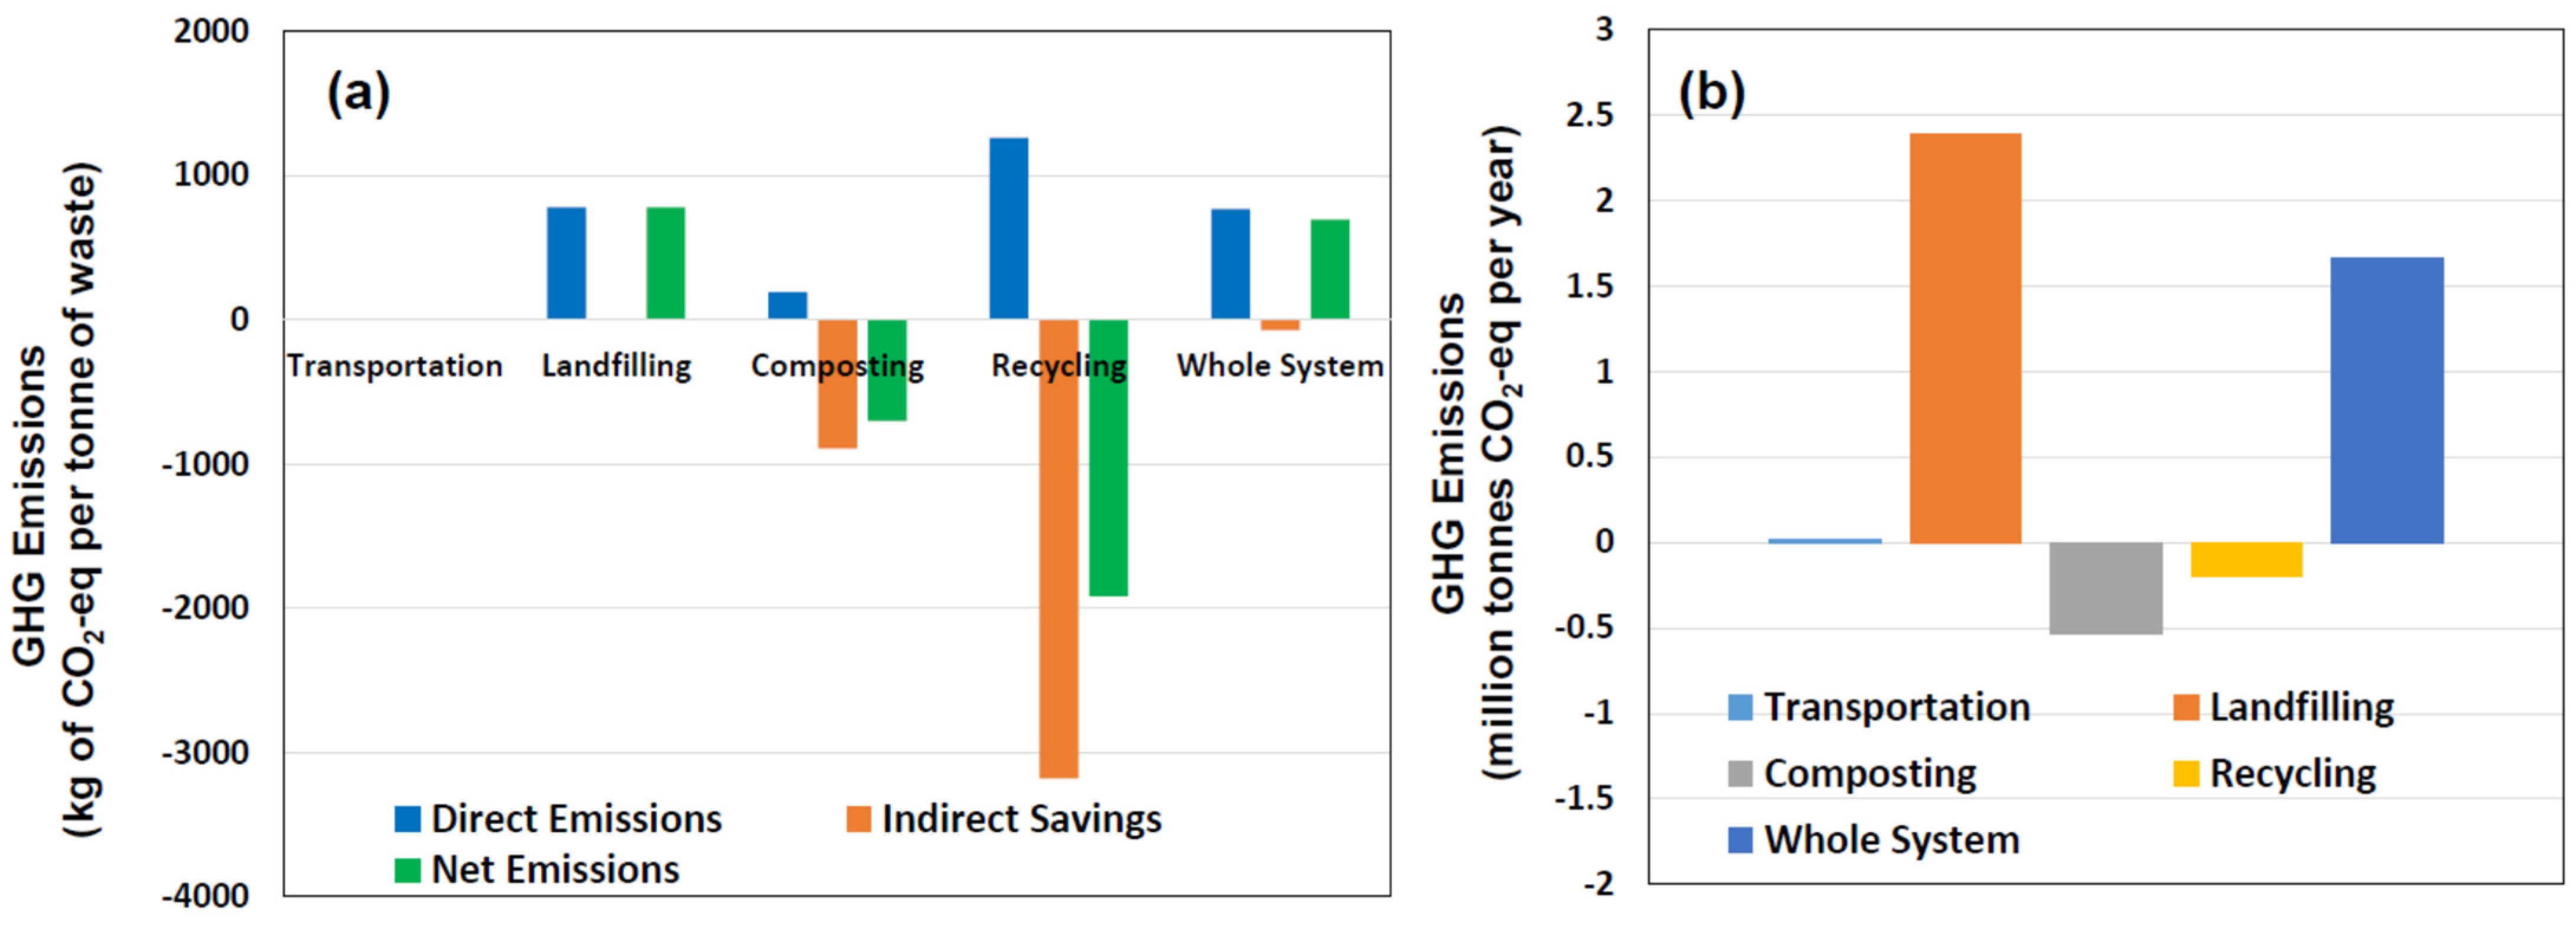
The summary of estimates of GHG emissions from the whole MSW management system of HCMC is illustrated in Table 6 and Figure 5a,b. The data included direct GHG emissions from various MSW management practices, indirect emissions, i.e., saving or avoiding emissions of GHG through applications of management technologies, and net GHG emissions. The net GHG emissions were estimated by subtracting the indirect emissions (or savings) from the direct emissions.
Table 6 and Figure 5a,b also include emissions of GHGs from the whole waste management system. As mentioned in Section 4.1, about 85% of MSW was landfilled in HCMC. Thus, landfilling was the most prominent source of GHG emissions in MSW of the city with a net contribution of about 781.05 kg CO2-eq. per tonne of MSW landfilled. Multiplying GHG emissions of 781.05 (CO2-eq./tonne of waste) with total tonnes of NSW (i.e., 3,060,000) landfilled in one year, the estimated yearly emissions of GHG from the landfill in HCMC was 2,390,013 tonnes of CO2-eq. per year, which is equal to 2.39 million tonnes of CO2-eq. per year (Table 6). The waste management practices, such as composting and recycling in HCMC also have shown direct emissions of GHGs. However, these waste management practices have avoided a large amount of GHG emissions. Thus, the net GHG emissions from these two processes were negative. The estimated direct and indirect savings (avoided) of GHG emissions from the whole MSW management system were 768.61 and −72.47 in kg CO2-eq. per tonne of waste, respectively. Whereas the net GHG emissions from the whole MSW management system was 696.14 kg CO2-eq. per tonne of waste. By summation of each MSW management process, i.e., transportation, landfilling, composting, and recycling, the net GHG emission from the MSW management system in HCMC was 1,664,867.61 tonnes of CO2-eq. per year, which is equal to 1.665 million tonnes of CO2-eq. per year (Table 6). To cross-check the GHG emission calculation, we also estimated the yearly GHG emissions by multiplying the net GHG emissions (696.14 kg CO2-eq./tonne) by the total MSW transported (2,365,565 tonnes/year) (Table 6). The estimated GHG emission was 1,646,764.42 tonnes of CO2-eq. per year, which is equal to 1.647 million tonnes of CO2-eq. per year. The ratio of both calculated values of yearly GHG emissions was 1.01, which shows that our GHG emission estimation for MSW of HCMC is to a large extent correct.
However, our estimates of GHG emissions for HCMC may have some uncertainties due to the errors in solid waste amount estimation. First, it may be noted in Table 6 that the total amount of MSW transported from HCMC to the management sites was lower than the total MSW handled at the landfill sites. This was because the landfill sites also received a significant amount of MSW from other urban and sub-urban areas, in addition to HCMC waste. Second, the data for waste management practices, such as anaerobic digestion, mechanical biological treatment, incineration, and data for open burning were not available for this study. Thus, if data from these activities had been included in this study, the net GHG emissions could be slightly different.
5. Conclusions
This study estimated GHG emissions from the MSW management system of HCMC considering the current waste management practices. In HCMC, about 8175 tonnes of solid waste was generated per day in 2014, consisting of about 85.6% MSW. Landfilling of MSW is a common practice of solid waste management in HCMC, with about 85% of the total MSW landfilled at the two landfill sites and the rest 15% of MSW being recycled. The MSW of HCMC contains 65–90% organic matter. The estimated results showed that landfilling of MSW is a significant source of GHG in HCMC with a net contribution of about 781.05 kg CO2-eq. per tonne of MSW landfilled, equivalent to 2.39 million tonnes of CO2-eq. per year. The waste management practices, such as, composting and recycling of MSW in the city also show direct GHG emissions but these practices have avoided a large amount of GHG emissions. The emissions of GHGs from the whole MSW management system including direct and indirect savings were 768.61 and −72.47 (kg CO2-eq./tonne of MSW), respectively, while the net GHG emissions were 696.14 kg CO2-eq. per tonne of MSW, which is equal to 1.665 million tonnes of CO2-eq. per year. The GHG emission data of this study may be useful to the policymakers of Viet Nam for climate change mitigation policies.
Author Contributions
Conceptualization, R.L.V.; methodology, R.L.V. and G.B.; software, G.B.; validation, R.L.V. and G.B.; formal analysis, G.B.; investigation, G.B.; resources, G.B.; data curation, G.B.; writing—original draft preparation, R.L.V.; writing—review and editing, R.L.V. and G.B.; visualization, R.L.V.; supervision, R.L.V. and G.B.; project administration, G.B.; funding acquisition, G.B. All authors have read and agreed to the published version of the manuscript.
Funding
Funding for this study was provided by the Climate and Clean Air Coalition (CCAC) under the framework of the Municipal Solid Waste Management Initiative (CCAC-MSWI) and the City Assessment Project.
Institutional Review Board Statement
Not applicable.
Informed Consent Statement
Not applicable.
Acknowledgments
The authors are thankful to the officials of the International Environmental Technology Centre—United Nations Environment Programme (UNEP-IETC) for providing coordination with the Department of Natural Resource and Management (DONRE) and Division of Solid Waste Management (DOSWM) of Viet Nam. The authors also thank the officials of the DONRE and DOSWM for assisting in data collection from various sources in Ho Chi Minh City, Viet Nam. Lastly, the authors are also grateful to the colleagues of the Regional Resource Center for Asia and the Pacific for providing necessary assistance whenever needed.
Conflicts of Interest
The authors declare no conflict of interest.
References
- Stocker, T.F.; Qin, D.; Plattner, G.-K.; Tignor, M.; Allen, S.K.; Boschung, J.; Nauels, A.; Xia, Y.; Bex, P.M.V. IPCC, Climate Change 2013: The Physical Science Basis. Contribution of Working Group I to the Fifth Assessment Report of the Intergovernmental Panel on Climate Change; Midgley Cambridge University Press: Cambridge, UK; New York, NY, USA, 2013. [Google Scholar]
- Gautam, S.P.; Bundela, P.S.; Pandey, A.K.; Awasthi, M.K.; Sarsaiya, S. Composting of municipal solid waste of Jabalpur city. Glob. J. Environ. Res. 2010, 4, 43–46. [Google Scholar]
- Thanomnim, B.; Papong, S.; Onbhuddha, R. The methodology to evaluate food Waste generation with existing data in Thailand. Thai Environ. Eng. J. 2022, 36, 1–9. Available online: https://so05.tci-thaijo.org/index.php/teej/article/view/255003/174182 (accessed on 27 April 2022).
- UNEP (United Nations Environmental Programme). Waste Management in ASEAN Countries: Summary Report. 2017. Available online: https://www.unep.org/resources/report/waste-management-asean-countries-summary-report (accessed on 20 December 2017).
- UNFCCC. GHG Emission Summary of Viet Nam. 2010. Available online: https://unfccc.int/files/ghg_data/ghg_data_unfccc/ghg_profiles/application/pdf/vnm_ghg_profile.pdf (accessed on 20 March 2011).
- Verma, R.; Borongan, G.; Memon, M. Municipal Solid Waste Management in Ho Chi Minh City, Viet Nam, Current Practices and Future Recommendation. Procedia Environ. Sci. 2016, 35, 127–139. [Google Scholar] [CrossRef]
- Menikpura, N.; Sang-Arun. User Manual Estimation Tool for Greenhouse Gas (GHG) Emissions from Municipal Solid Waste (MSW) Management in a Life Cycle Perspective. September 2013. Available online: http://enviroscope.iges.or.jp/modules/envirolib/view.php?docid=4273 (accessed on 30 September 2013).
- Buuren, J.V.; Potting, J. Project Report, Deliverable 3.1: Relevant Potential Impacts and Methodologies for Environmental Impacts Assessment Related to Solid Waste Management in Asian Developing Countries; ISSOWAMA (Integrated Sustainable Solid Waste Management) in Asia Project: Bremerhaven, Germany, 2011. [Google Scholar]
- IPCC. Guidelines for National Greenhouse Gas Inventories, Prepared by the National Greenhouse Gas Inventories Programme; Eggleston, H.S., Buendia, L., Miwa, K., Ngara, T., Tanabe, K., Eds.; IGES: Kanagawa, Japan, 2006. [Google Scholar]
- Kristanto, G.A.; Pratama, M.A.; Rahmawati, D.F. Estimation of greenhouse gas emissions from solid waste management and wastewater treatment in the Nizam Zachman Fishery Port, Jakarta, Indonesia. IOP Conf. Ser. Earth Environ. Sci. 2020, 423, 012039. [Google Scholar] [CrossRef]
- Kristanto, G.A.; Koven, W. Estimating greenhouse gas emissions from municipal solid waste management in Depok, Indonesia. City Environ. Interact. 2019, 4, 100027. [Google Scholar] [CrossRef]
- Tun, M.M.; Juchelková, D. Estimation of greenhouse gas emissions: An alternative approach to waste management for reducing the environmental impacts in Myanmar. Environ. Eng. Res. 2019, 24, 618–629. [Google Scholar] [CrossRef] [Green Version]
- Beltran-Siñani, M.; Gil, A. Accounting Greenhouse Gas Emissions from Municipal Solid Waste Treatment by Composting: A Case of Study Bolivia. Eng 2021, 2, 267–277. [Google Scholar] [CrossRef]
- Moghadam, M.A.; Feizi, R.; Fard, M.P.; Fard, N.J.H.; Omidinasab, M.; Faraji, M.; Shenavar, B. Estimating greenhouse emissions from sanitary landfills using Land-GEM and IPCC model based on realistic scenarios of different urban areas: A case study of Iran. J. Environ. Health Sci. Eng. 2021, 19, 819–830. [Google Scholar] [CrossRef] [PubMed]
- DONRE. DONRE (Department of Natural Resource and Management)-Ho Chi Minh City (2012), The Report on Overview of the SWM System of HCMC 2012. 2012. Available online: http://www.donre.hochiminhcity.gov.vn/default.aspx (accessed on 17 May 2012).
- DORNE. DONRE (Department of Natural Resource and Management)-Ho Chi Minh City (2014), The Report on Overview of the SWM System of HCMC 2014. 2014. Available online: http://www.donre.hochiminhcity.gov.vn/default.aspx (accessed on 10 March 2014).
- DONRE. DONRE (Department of Natural Resource and Management)-Ho Chi Minh City (2009), The Report on Overview of the SWM System of HCMC 2009. 2009. Available online: http://www.donre.hochiminhcity.gov.vn/default.aspx (accessed on 20 September 2009).
- Hoornweg, D.; Bhada-Tata, P. What a Waste, A Global Review of Solid Waste Management, Urban Development & Local Government Unit World Bank, 1818 H Street, NW, Washington, DC 20433, USA. 2012. Available online: https://openknowledge.worldbank.org/handle/10986/17388 (accessed on 31 March 2012).
Figure 1.
National level GHG emissions in Viet Nam: (a) contribution from various emission sectors (in %) and (b) contribution of various activities in the waste sector [5].
Figure 1.
National level GHG emissions in Viet Nam: (a) contribution from various emission sectors (in %) and (b) contribution of various activities in the waste sector [5].

Figure 2.
Location of Ho Chi Minh City (10.75° N, 106.67° E) in Viet Nam. The map (right side) is adopted from ISSOWAMA (Integrated Sustainable Solid Waste Management) in the Asia project report [8]. Zone 1 and Zone 2 (indicated with stars) are two major sanitary landfill sites in Ho Chi Min City.
Figure 2.
Location of Ho Chi Minh City (10.75° N, 106.67° E) in Viet Nam. The map (right side) is adopted from ISSOWAMA (Integrated Sustainable Solid Waste Management) in the Asia project report [8]. Zone 1 and Zone 2 (indicated with stars) are two major sanitary landfill sites in Ho Chi Min City.

Figure 3.
Composition of solid waste generated in Ho Chi Minh City [16].
Figure 3.
Composition of solid waste generated in Ho Chi Minh City [16].

Figure 4.
Physical composition of MSW in Ho Chi Minh City (a) dry weight-basis and (b) wet weight-basis (in percentage) (Data source: DONRE 2009 [17]).
Figure 4.
Physical composition of MSW in Ho Chi Minh City (a) dry weight-basis and (b) wet weight-basis (in percentage) (Data source: DONRE 2009 [17]).

Figure 5.
Estimates of GHG emissions from the MSW management of Ho Chi Minh City (a) GHG estimates include direct emissions, indirect emission saving (or avoiding), and net emissions from various solid waste mismanagement practices including the whole solid waste management system (expressed in kg CO2-eq. per tonne of waste managed); (b) net yearly emissions of GHG from the whole MSW management system (expressed in million tonnes/year).


Table 1.
Main sources of solid waste in Ho Chi Min City.
| S.No. | Sources | Quantity of Waste (Tonnes/Day) | Percentage (%) Composition |
|---|---|---|---|
| 1. | Municipal solid waste (MSW) | 6800–7000 | 85.6 |
| 2. | Construction and demolition waste | 500–800 | 9.8 |
| 3. | Healthcare waste | 20–25 | 0.3 |
| 4. | Hazardous waste | 250–350 | 4.3 |
| Total solid waste generation | 8175 | ||
Data source: DONRE, 2014 [16].
Table 2.
Factors and default values used in the IPCC 2006 waste model [7]. The same values were used in the current study.
Table 2.
Factors and default values used in the IPCC 2006 waste model [7]. The same values were used in the current study.
| Factor | Unit | Method of Deriving |
|---|---|---|
| Amount of mix waste disposal | Tonne/month | Amount/description |
| Amount deposited | Gg/Year | MSW disposal (tonnes/month) × 12/1000 |
| Degradable Organic Carbon (DOC) | DOC | DOCMSW = % of food waste × 0.15 + % of garden waste × 0.43 + % of paper waste × 0.4 + % of textile waste × 0.24 |
| Fraction of DOC decomposing under Anaerobic condition (DOCf) | DOCf | Recommended value is 0.5 |
| Methane generation rate constant | k | k value is dependent on waste composition of location kMSW = % of food waste × 0.4 + % of garden waste × 0.17 + % of paper waste × 0.07 + % of textile waste × 0.07 + % of disposal nappies × 0.17 + % of wood and straw × 0.035 |
| Half- life time(t1/2, years) | h = In(2)/k | Can be calculated based on derived k value |
| exp1 | exp(-k) | Can be calculated based on derived k value |
| Process start in decomposition year, month M | M | After 12 months |
| Exp2 | exp(-k((13-M)/12 | Can be calculated based on derived k and M values |
| Fraction to CH4 | F | The recommended value 0.5 |
| Methane oxidation on landfill cover | OX | The recommended value for the sanitary landfill with landfill cover is 0.1. for open dumpsites the OX value would be zero |
| MCF for the landfill/open dumpsite | MCF | According to management practices, this value can change, MCF values for managed (has landfill cover and liner), unmanaged-deep (>5 m waste), unmanaged-shallow (<5 m waste), uncategorized are 1, 0.8, 0.4, and 0.6 respectively. |
Table 3.
Estimates of GHG emissions from landfill activities in Ho Chi Minh City.
| At the Sanitary Landfill (Decomposition) | ||
|---|---|---|
| Activities | Quantity | Unit |
| Total mix waste disposal at the landfill sites | 255,000 | tonnes/months |
| Total disposal capacity per year | 3,060,000 | tonnes/year |
| Methane emission from disposed waste | 113.62 | Gg/year |
| kg of CH4/tonne | 37.13 | kg of CH4/tonne |
| Conversion of CH4 to CO2-eq | 21.00 | kg of CO2-eq/kg of CH4 |
| GHG emission from landfilling/open dumping | 779.78 | kg of CO2-eq/tonne of waste |
| At the Sanitary Landfill (Operational Activities) | ||
| Diesel consumption for operating machineries at the landfill | 120,000 | L/month |
| Total waste handled at the landfill sites | 255,000 | tonnes/month |
| A diesel requirement | 0.47 | L/tonne of waste |
| The total energy in consumed diesel | 17.14 | MJ/tonne of waste |
| Default CO2 emission factor for combustion | 74,100 | kg CO2/TJ |
| GHG emissions due to fossil fuel consumption | 1.27 | kg of CO2 eq/tonne of waste |
| Total GHG emissions from sanitary landfill sites | 781.05 | kg of CO2 eq/tonne of waste |
Table 4.
GHG emission estimates from composting activities in Ho Chi Minh City (data source: DONRE, 2012 [15]).
Table 4.
GHG emission estimates from composting activities in Ho Chi Minh City (data source: DONRE, 2012 [15]).
| Activities | Quantity | Unit |
|---|---|---|
| Total amount of food waste use for composting | 11,000 | tonnes/month |
| Total amount of fossil-fuel use for operational activities | 64,000 | L/month |
| Total amount of compost production | 4800 | tonnes/month |
| GHG emissions from operational activities | 15.68 | kg of CO2-eq/tonne of waste |
| GHG emissions from waste degradation | 177.00 | kg of CO2-eq/tonne of waste |
| Direct GHG emissions from composting | 192.68 | kg of CO2-eq/tonne of waste |
| Avoided GHG emissions from organic waste landfilling | 892.30 | kg of CO2-eq/tonne of waste |
| Net GHG emissions from composting (life cycle perspective) | −699.12 | kg of CO2-eq/tonne of organic waste |
Table 5.
Quantity of solid waste recycles in Ho Chi Minh City (data source: DONRE, 2007).
| No. | Type of Waste | Quantity of Recycling of Waste (Tonnes/Month) | ||||
|---|---|---|---|---|---|---|
| 202 Junkshops (Group A) | Composition (in %) | 100 Junkshops (Group B) | Composition (in %) | Total Waste Recycled (A+B) | ||
| 1. | Paper | 1696.8 | 55.7 | 1667 | 28.89 | 3363.8 |
| 2. | Plastic | 140.2 | 4.6 | 3654 | 63.33 | 3794.2 |
| 3. | Nilon | 39.2 | 1.3 | - | 0.00 | 39.2 |
| 4. | Aluminum | 40.9 | 1.3 | 78.5 * | 1.36 * | 1124.3 * |
| 5. | Iron | 1004.8 | 33.0 | |||
| 6. | Zinc | 0.1 | 0.0 | |||
| 7. | Lead | 0.01 | 0.0 | - | 0.1 | |
| 8. | Glass | 48.3 | 1.6 | 336 | 5.82 | 384.3 |
| 9. | Rag | 36.7 | 1.2 | - | 0.00 | 36.7 |
| 10. | Scrap | 36.6 | 1.2 | - | 0.00 | 36.6 |
| 11. | Rubber | - | - | 34.6 | 0.60 | 34.6 |
| Total | 3043.6 | 5770.1 | 8913.7 | |||
* Total of Aluminum, Iron, and Zinc.
Table 6.
Summary of estimates of GHG emissions from various solid waste mismanagement activities in Ho Chi Minh City including the whole solid waste management system.
Table 6.
Summary of estimates of GHG emissions from various solid waste mismanagement activities in Ho Chi Minh City including the whole solid waste management system.
| Activity | GHG Emissions (kg of CO2-eq/Tonne of Waste) | Total MSW (Tonnes/Year) | GHG Emissions (Tonnes of CO2-eq./Year) | ||
|---|---|---|---|---|---|
| Direct Emission | Indirect Emission Saving | Net Emission | |||
| Transportation | 6.15 | 0.00 | 6.15 | 2,365,565 | 14,548 |
| Landfilling of mix MSW | 781.05 | 0.00 | 781.05 | 3,060,000 | 2,390,013 |
| Composting | 192.68 | −892.30 | −699.12 | 768,000 | −536,924 |
| Anaerobic Digestion | NA | NA | NA | NA | NA |
| Mechanical Biological Treatment | NA | NA | NA | NA | NA |
| Recycling | 1263.95 | −3181.13 | −1917.18 | 105,764.4 | −202,769.39 |
| Incineration | NA | NA | NA | NA | NA |
| Open burning | NA | NA | NA | NA | NA |
| Whole System | 768.61 | −72.47 | 696.14 | 1,664,867.61 | |
Publisher’s Note: MDPI stays neutral with regard to jurisdictional claims in published maps and institutional affiliations. |
© 2022 by the authors. Licensee MDPI, Basel, Switzerland. This article is an open access article distributed under the terms and conditions of the Creative Commons Attribution (CC BY) license (https://creativecommons.org/licenses/by/4.0/).
Share and Cite
MDPI and ACS Style
Verma, R.L.; Borongan, G. Emissions of Greenhouse Gases from Municipal Solid Waste Management System in Ho Chi Minh City of Viet Nam. Urban Sci. 2022, 6, 78. https://doi.org/10.3390/urbansci6040078
AMA Style
Verma RL, Borongan G. Emissions of Greenhouse Gases from Municipal Solid Waste Management System in Ho Chi Minh City of Viet Nam. Urban Science. 2022; 6(4):78. https://doi.org/10.3390/urbansci6040078
Chicago/Turabian StyleVerma, Ram Lal, and Guilberto Borongan. 2022. "Emissions of Greenhouse Gases from Municipal Solid Waste Management System in Ho Chi Minh City of Viet Nam" Urban Science 6, no. 4: 78. https://doi.org/10.3390/urbansci6040078