
Use of Spatial Data in the Simulation of Domestic Water Demand in a Semiarid City: The Case of Campina Grande, Brazil
 ,
,  ,
,
Abstract
:1. Introduction
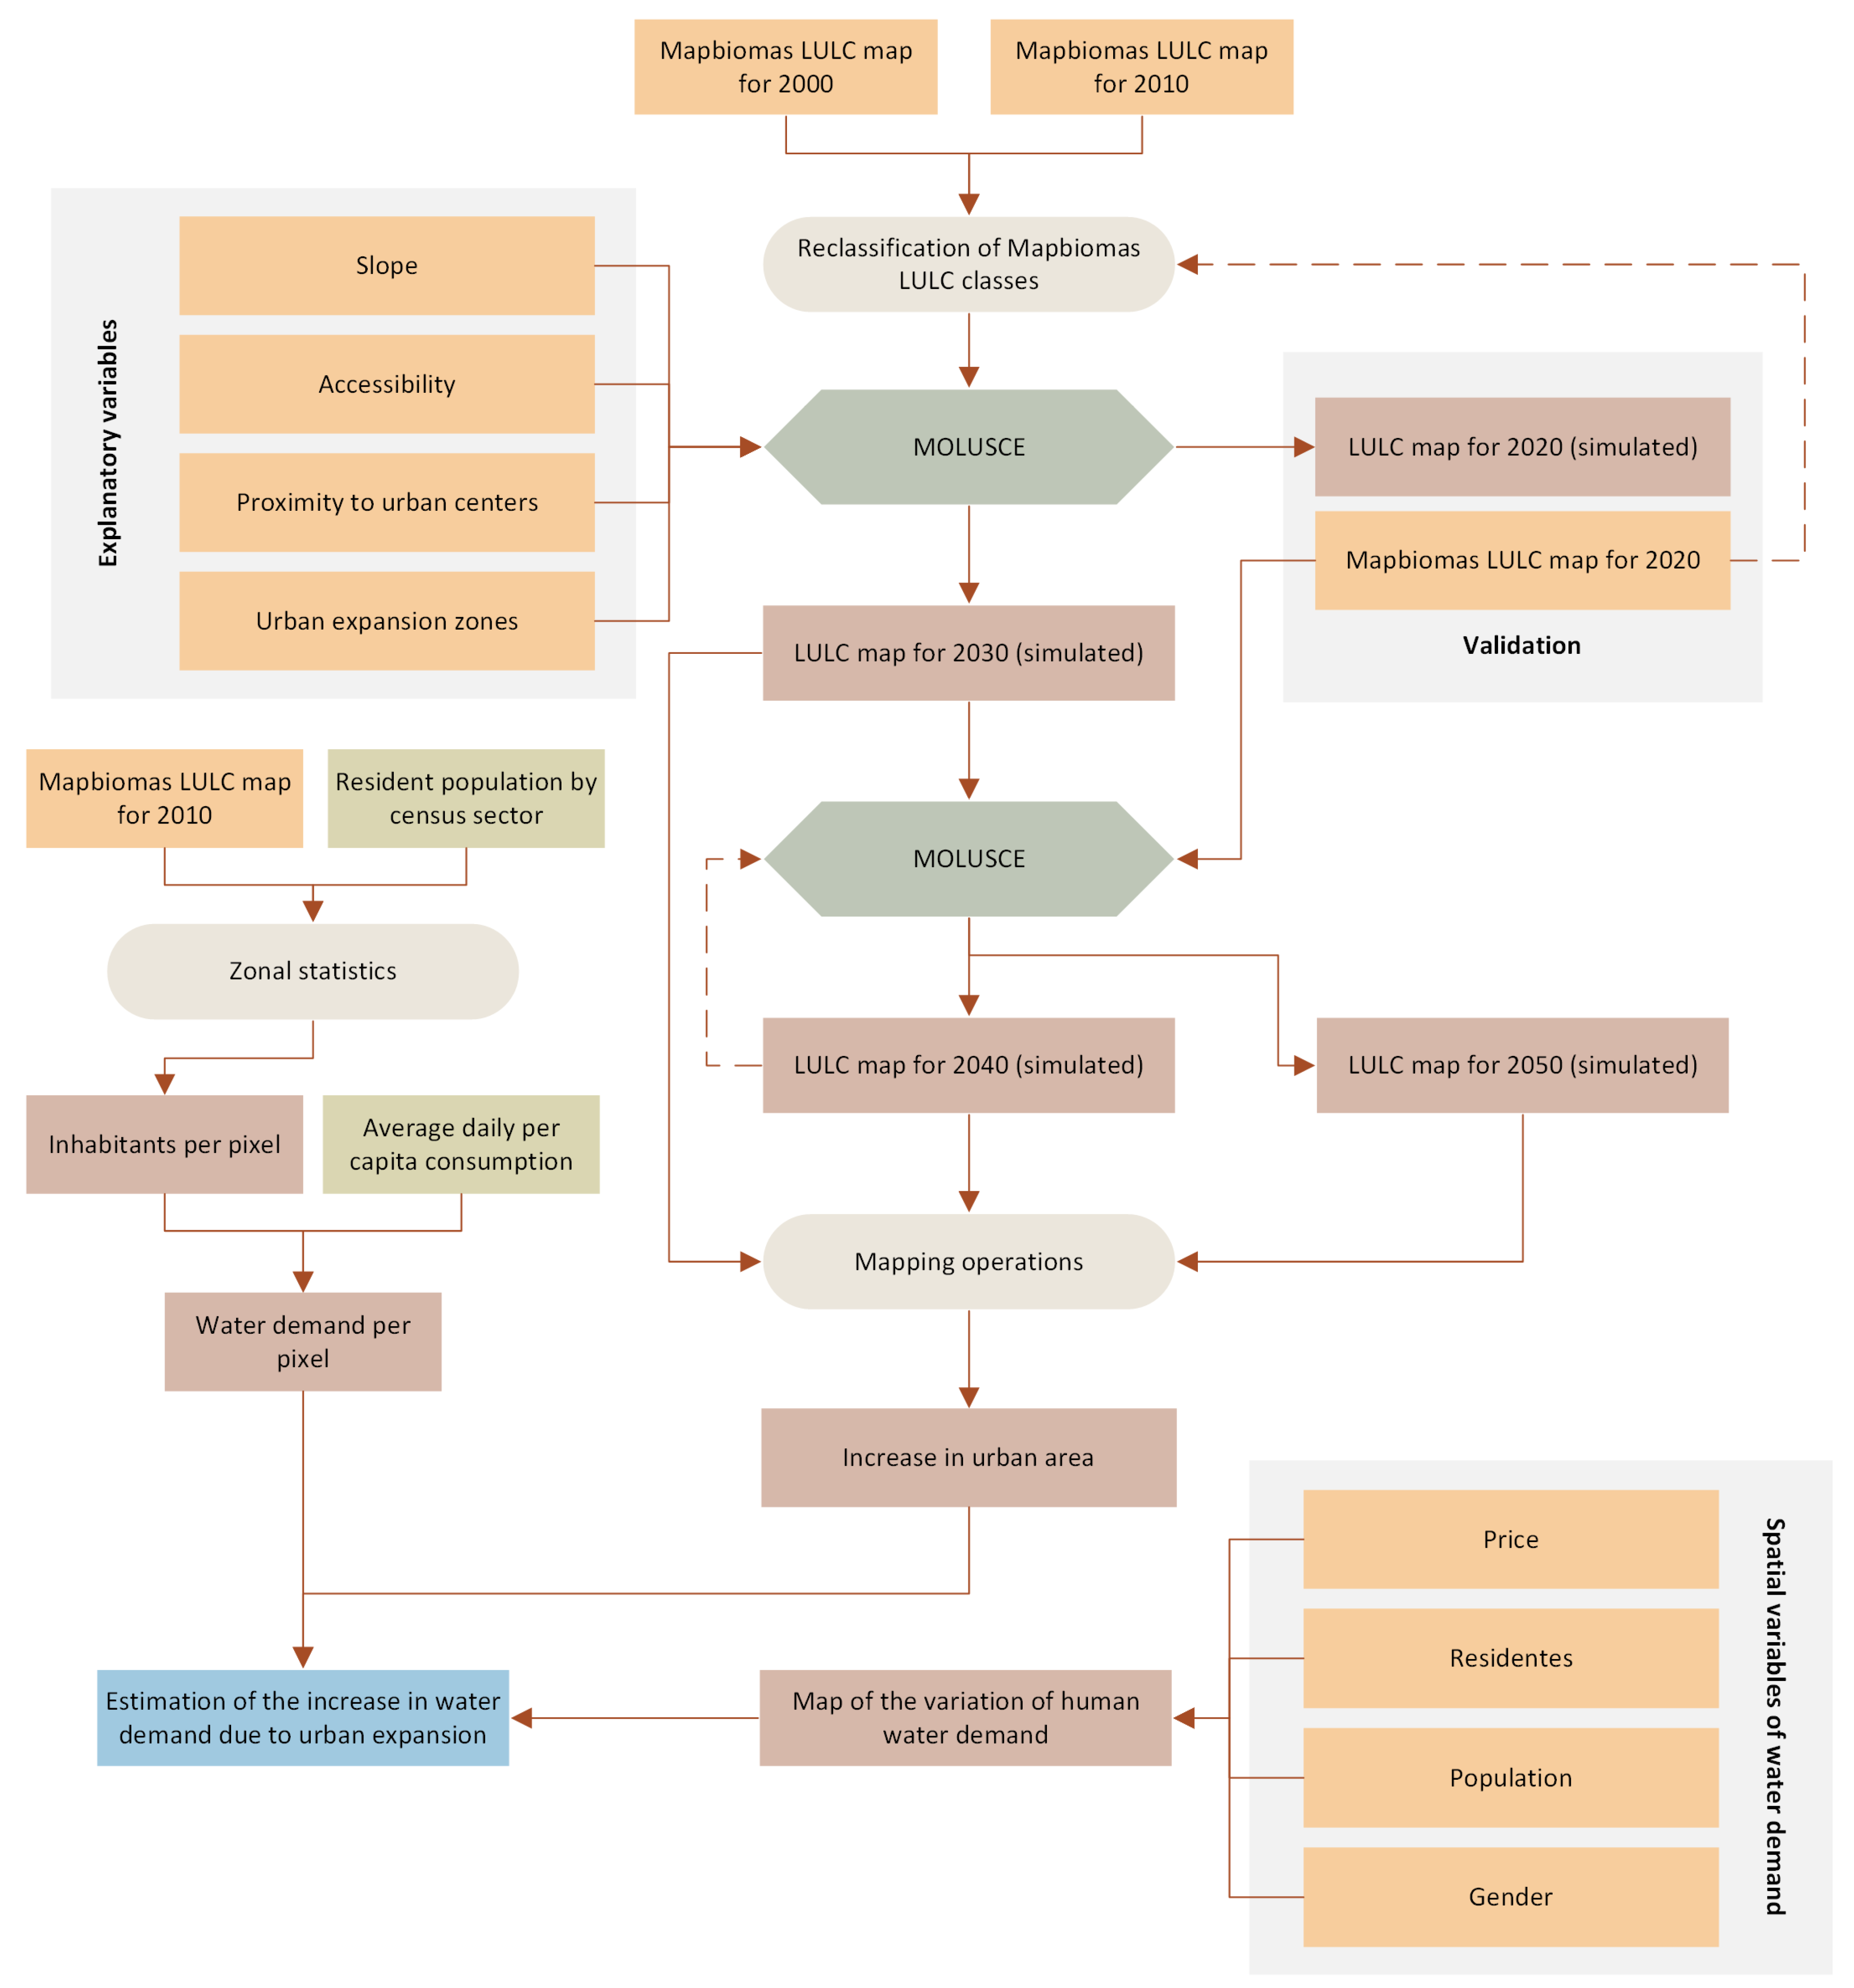
2. Methods and Data
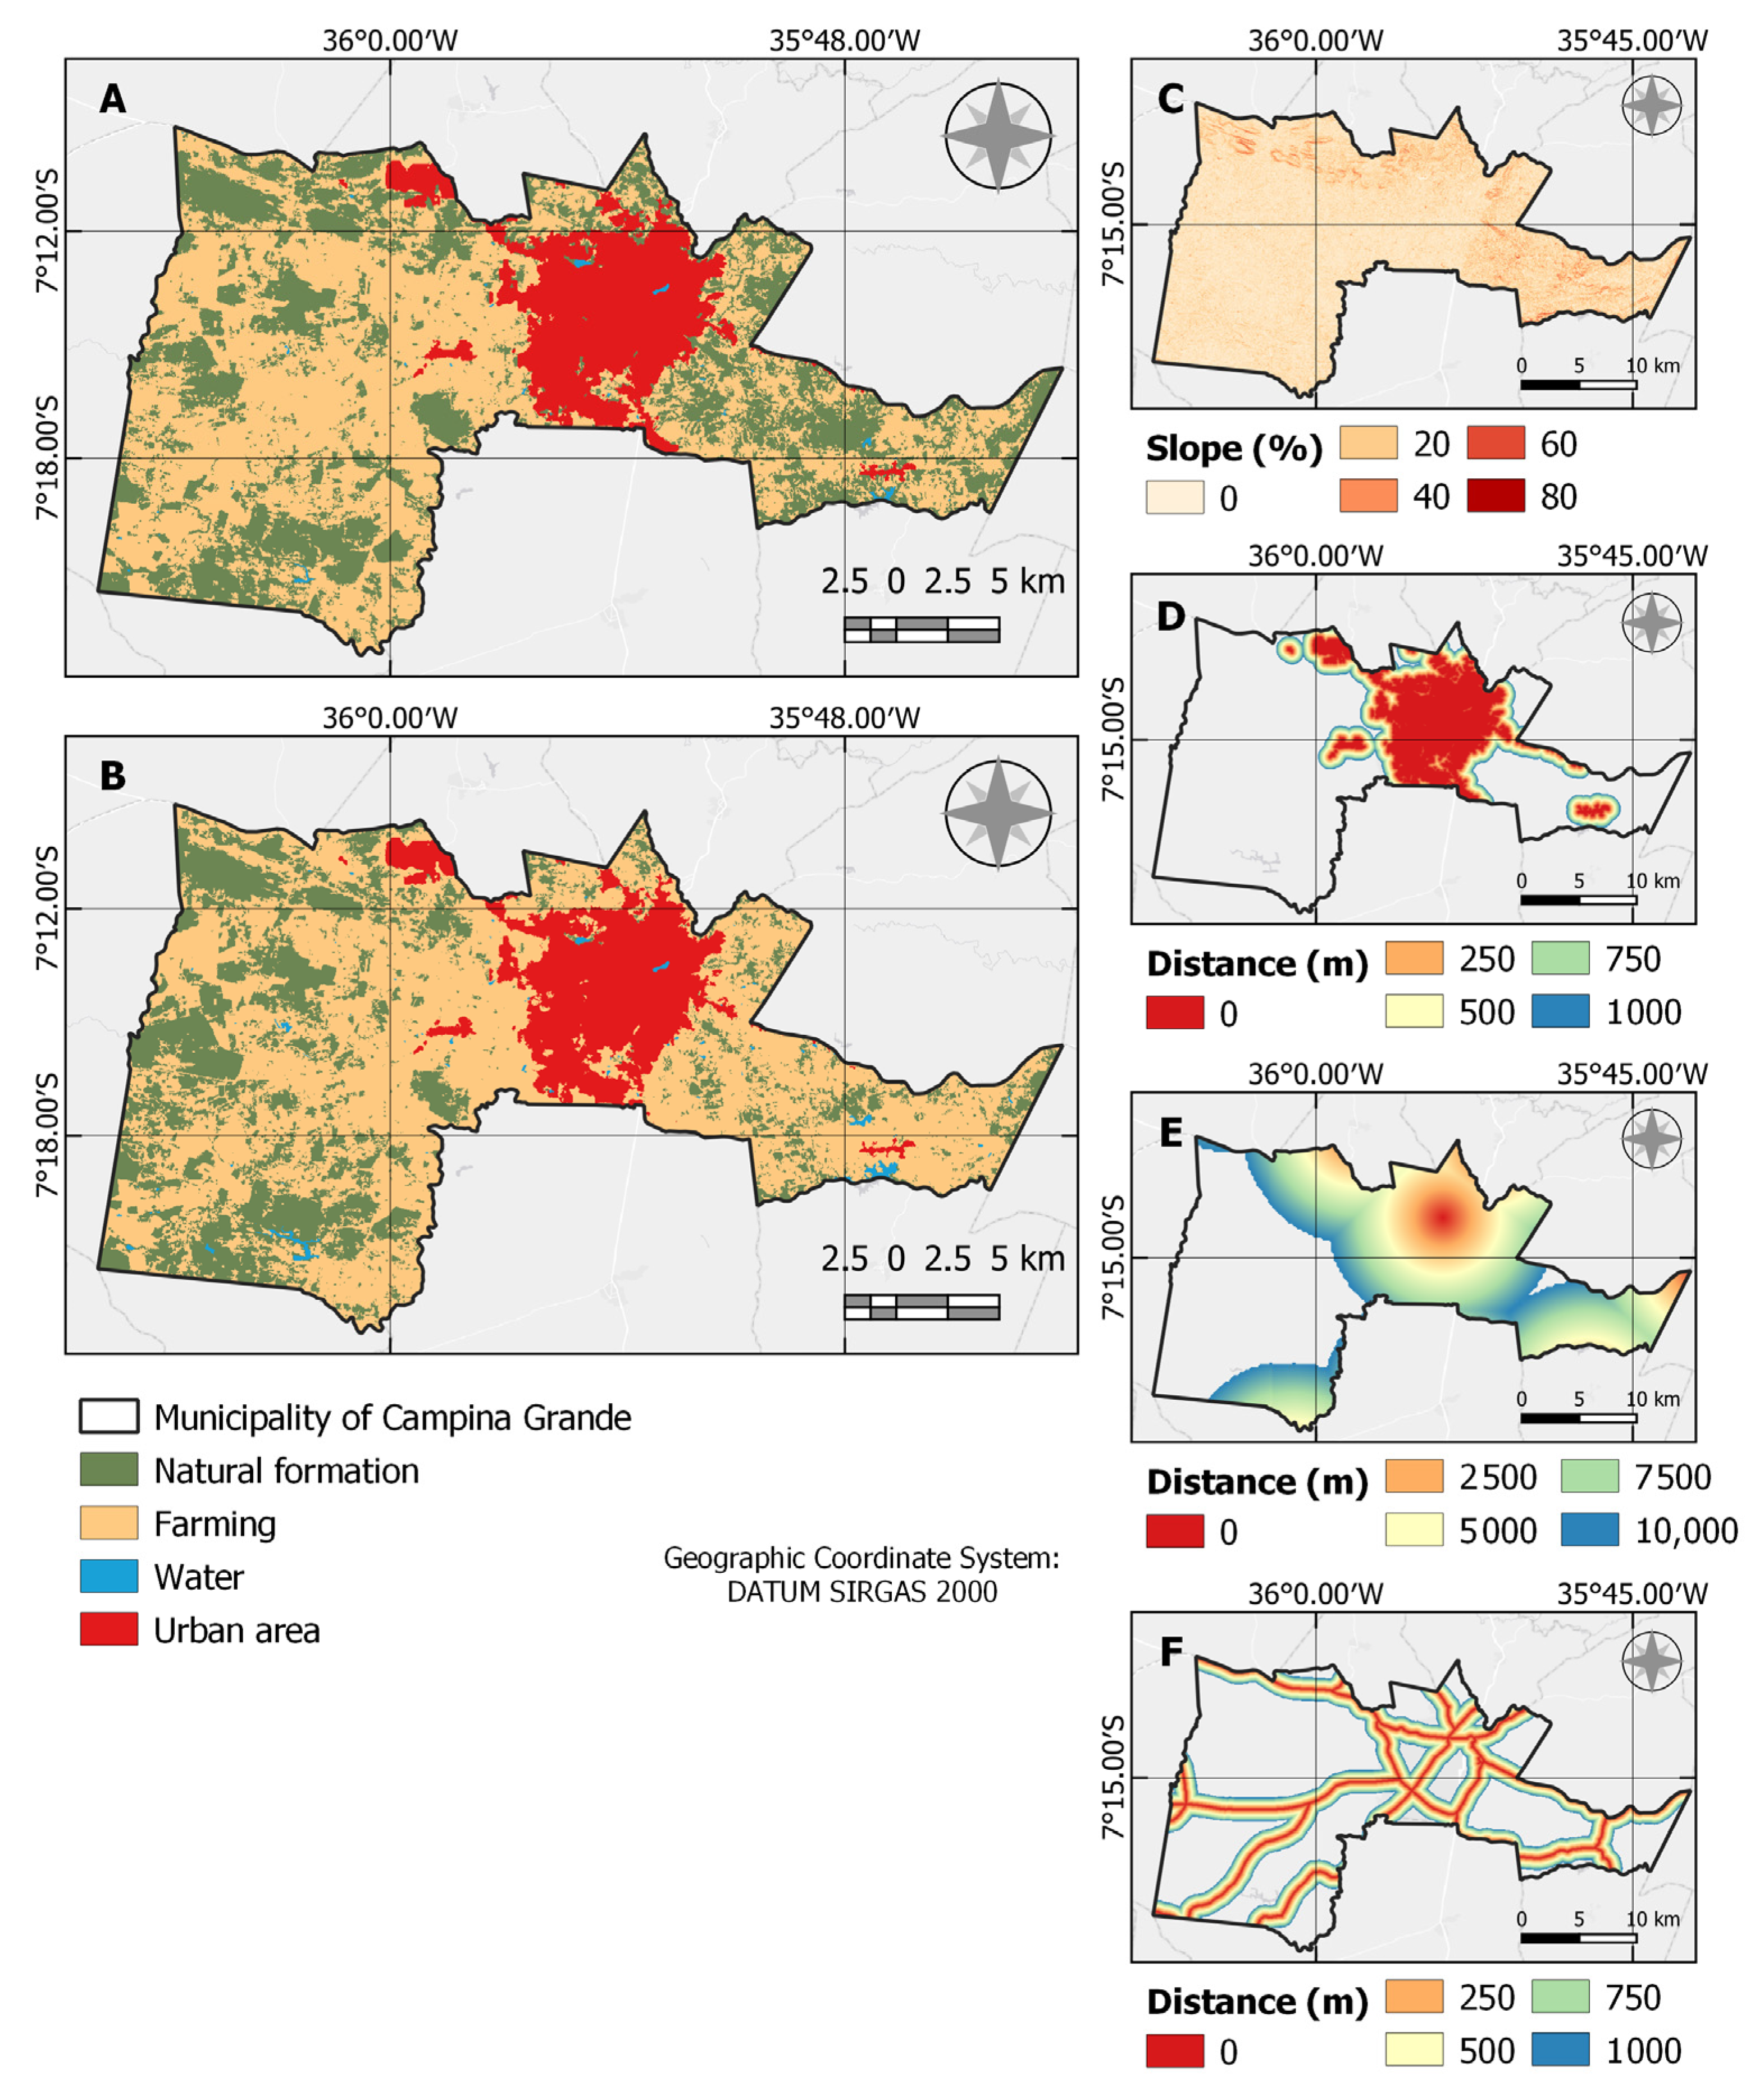
2.1. Study Area
2.2. Data Collection
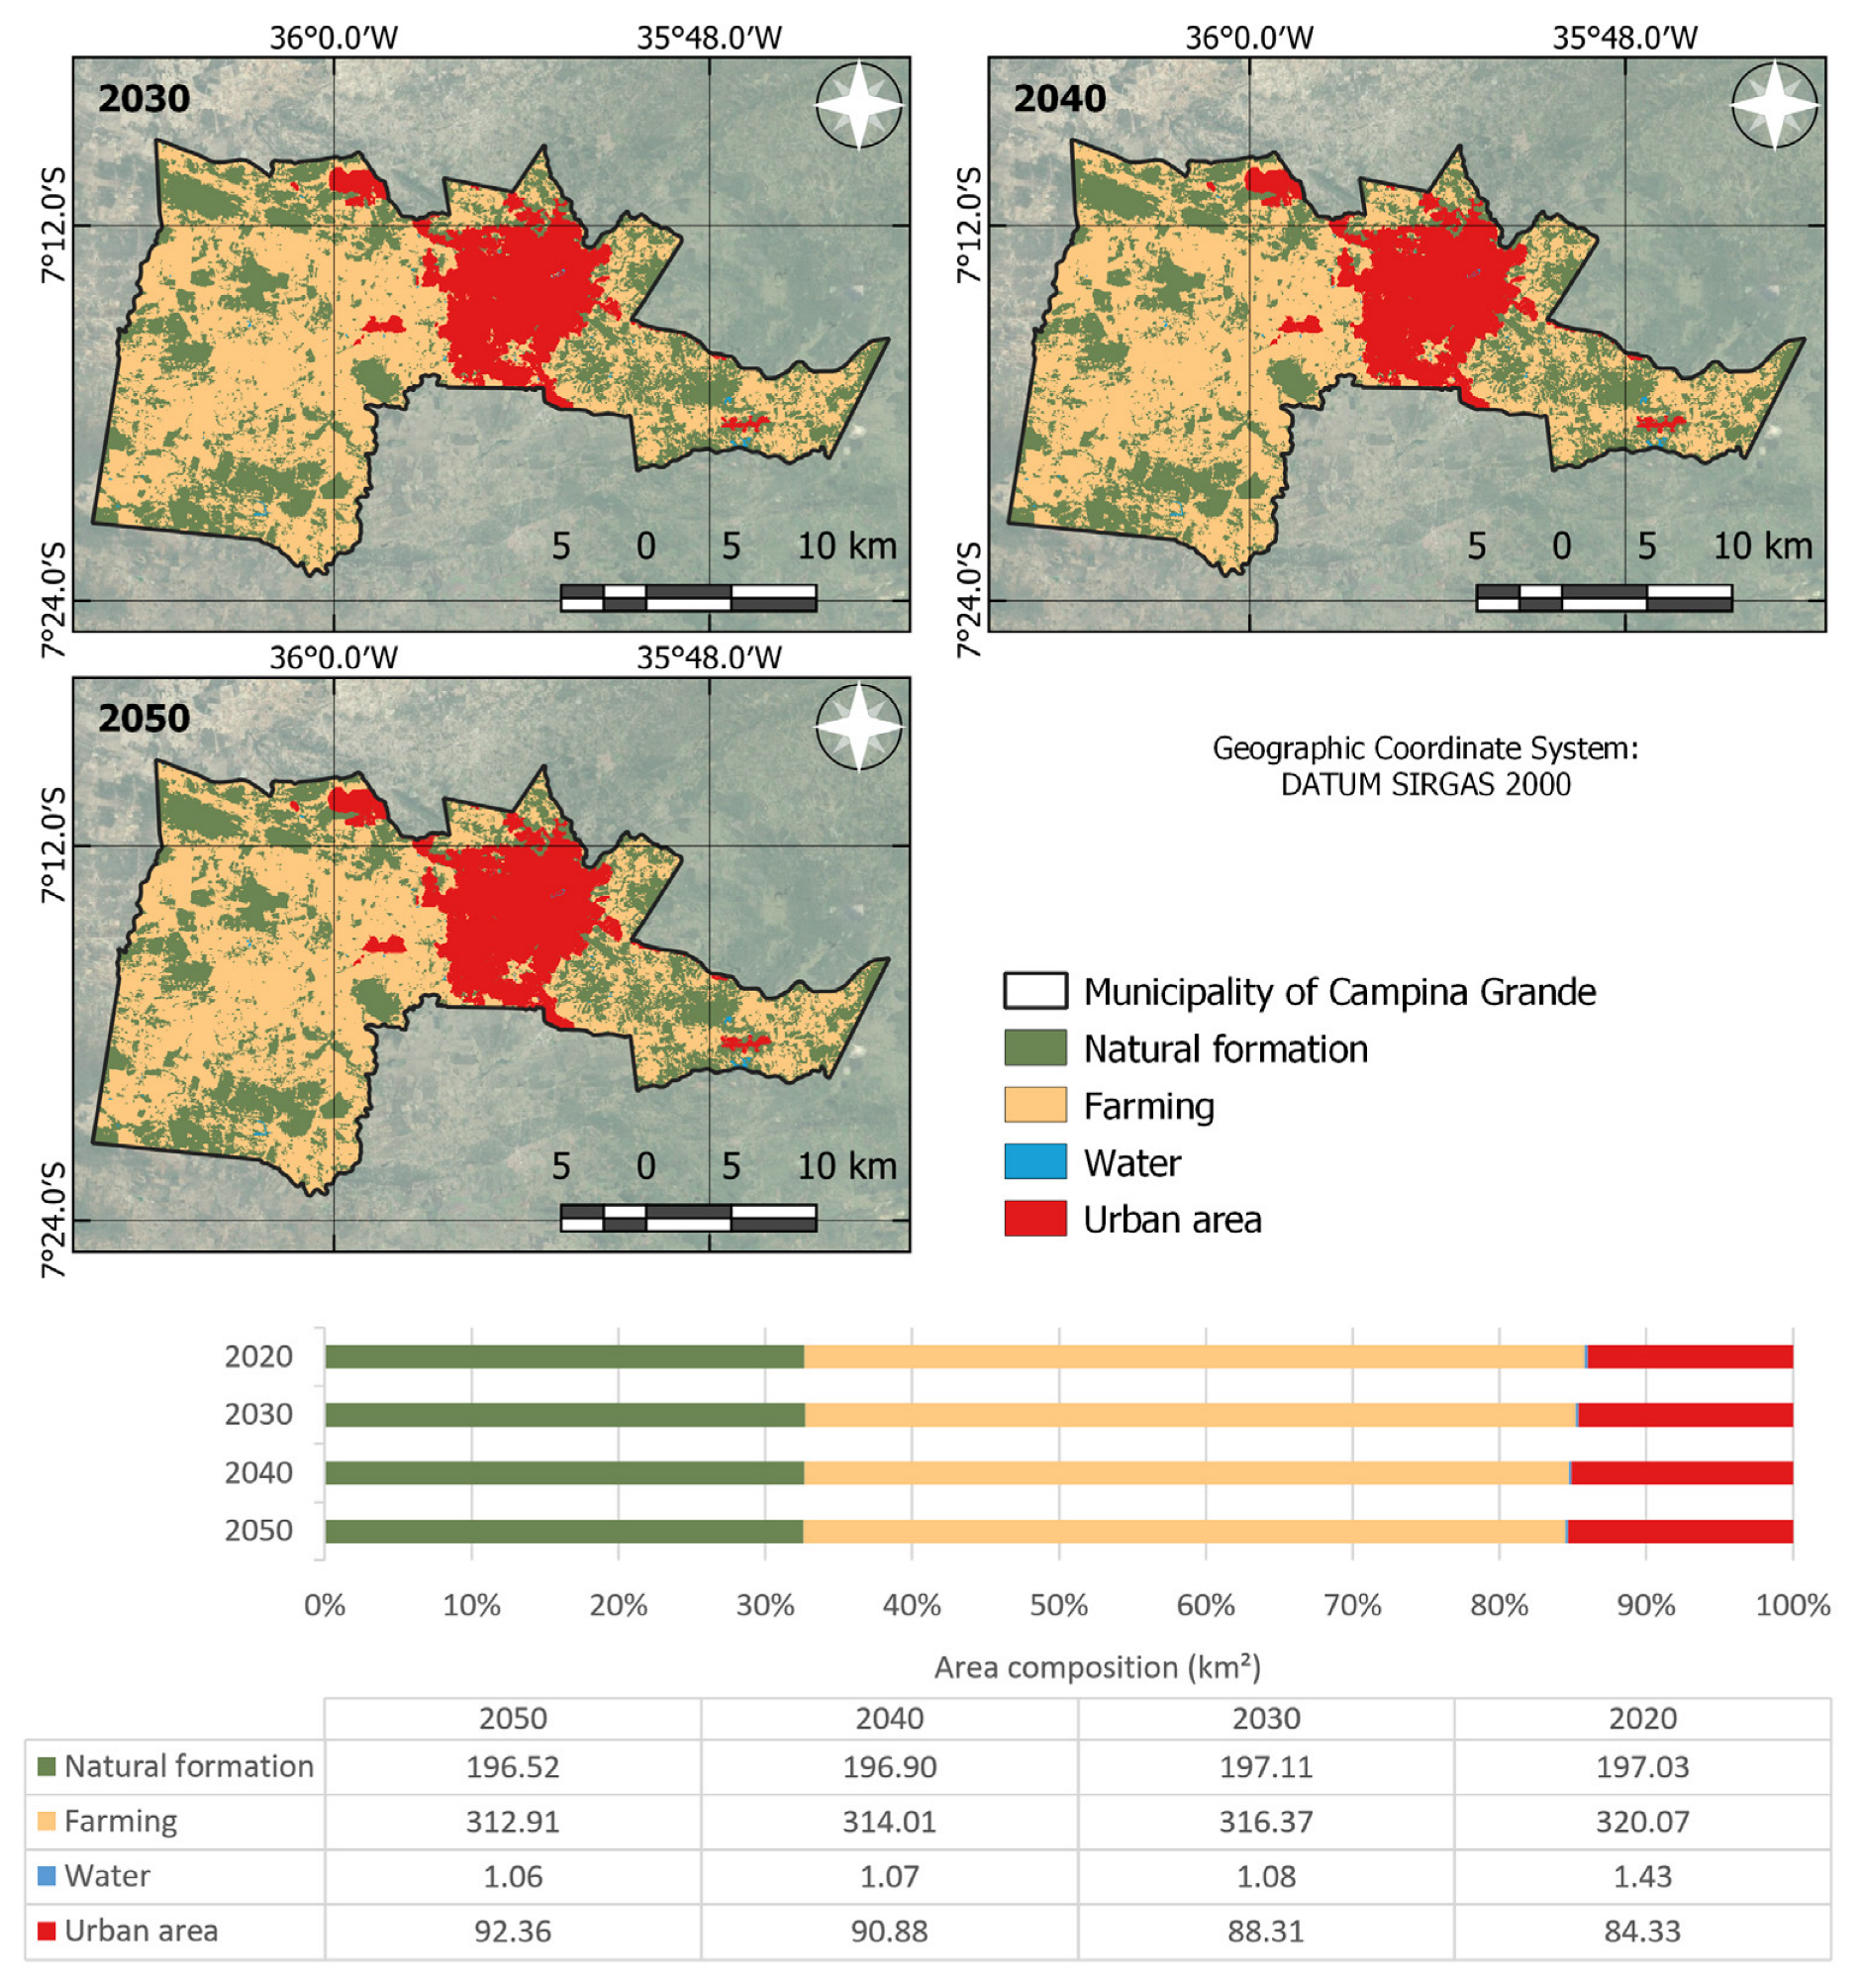
2.3. Model Analysis, Prediction, and Validation
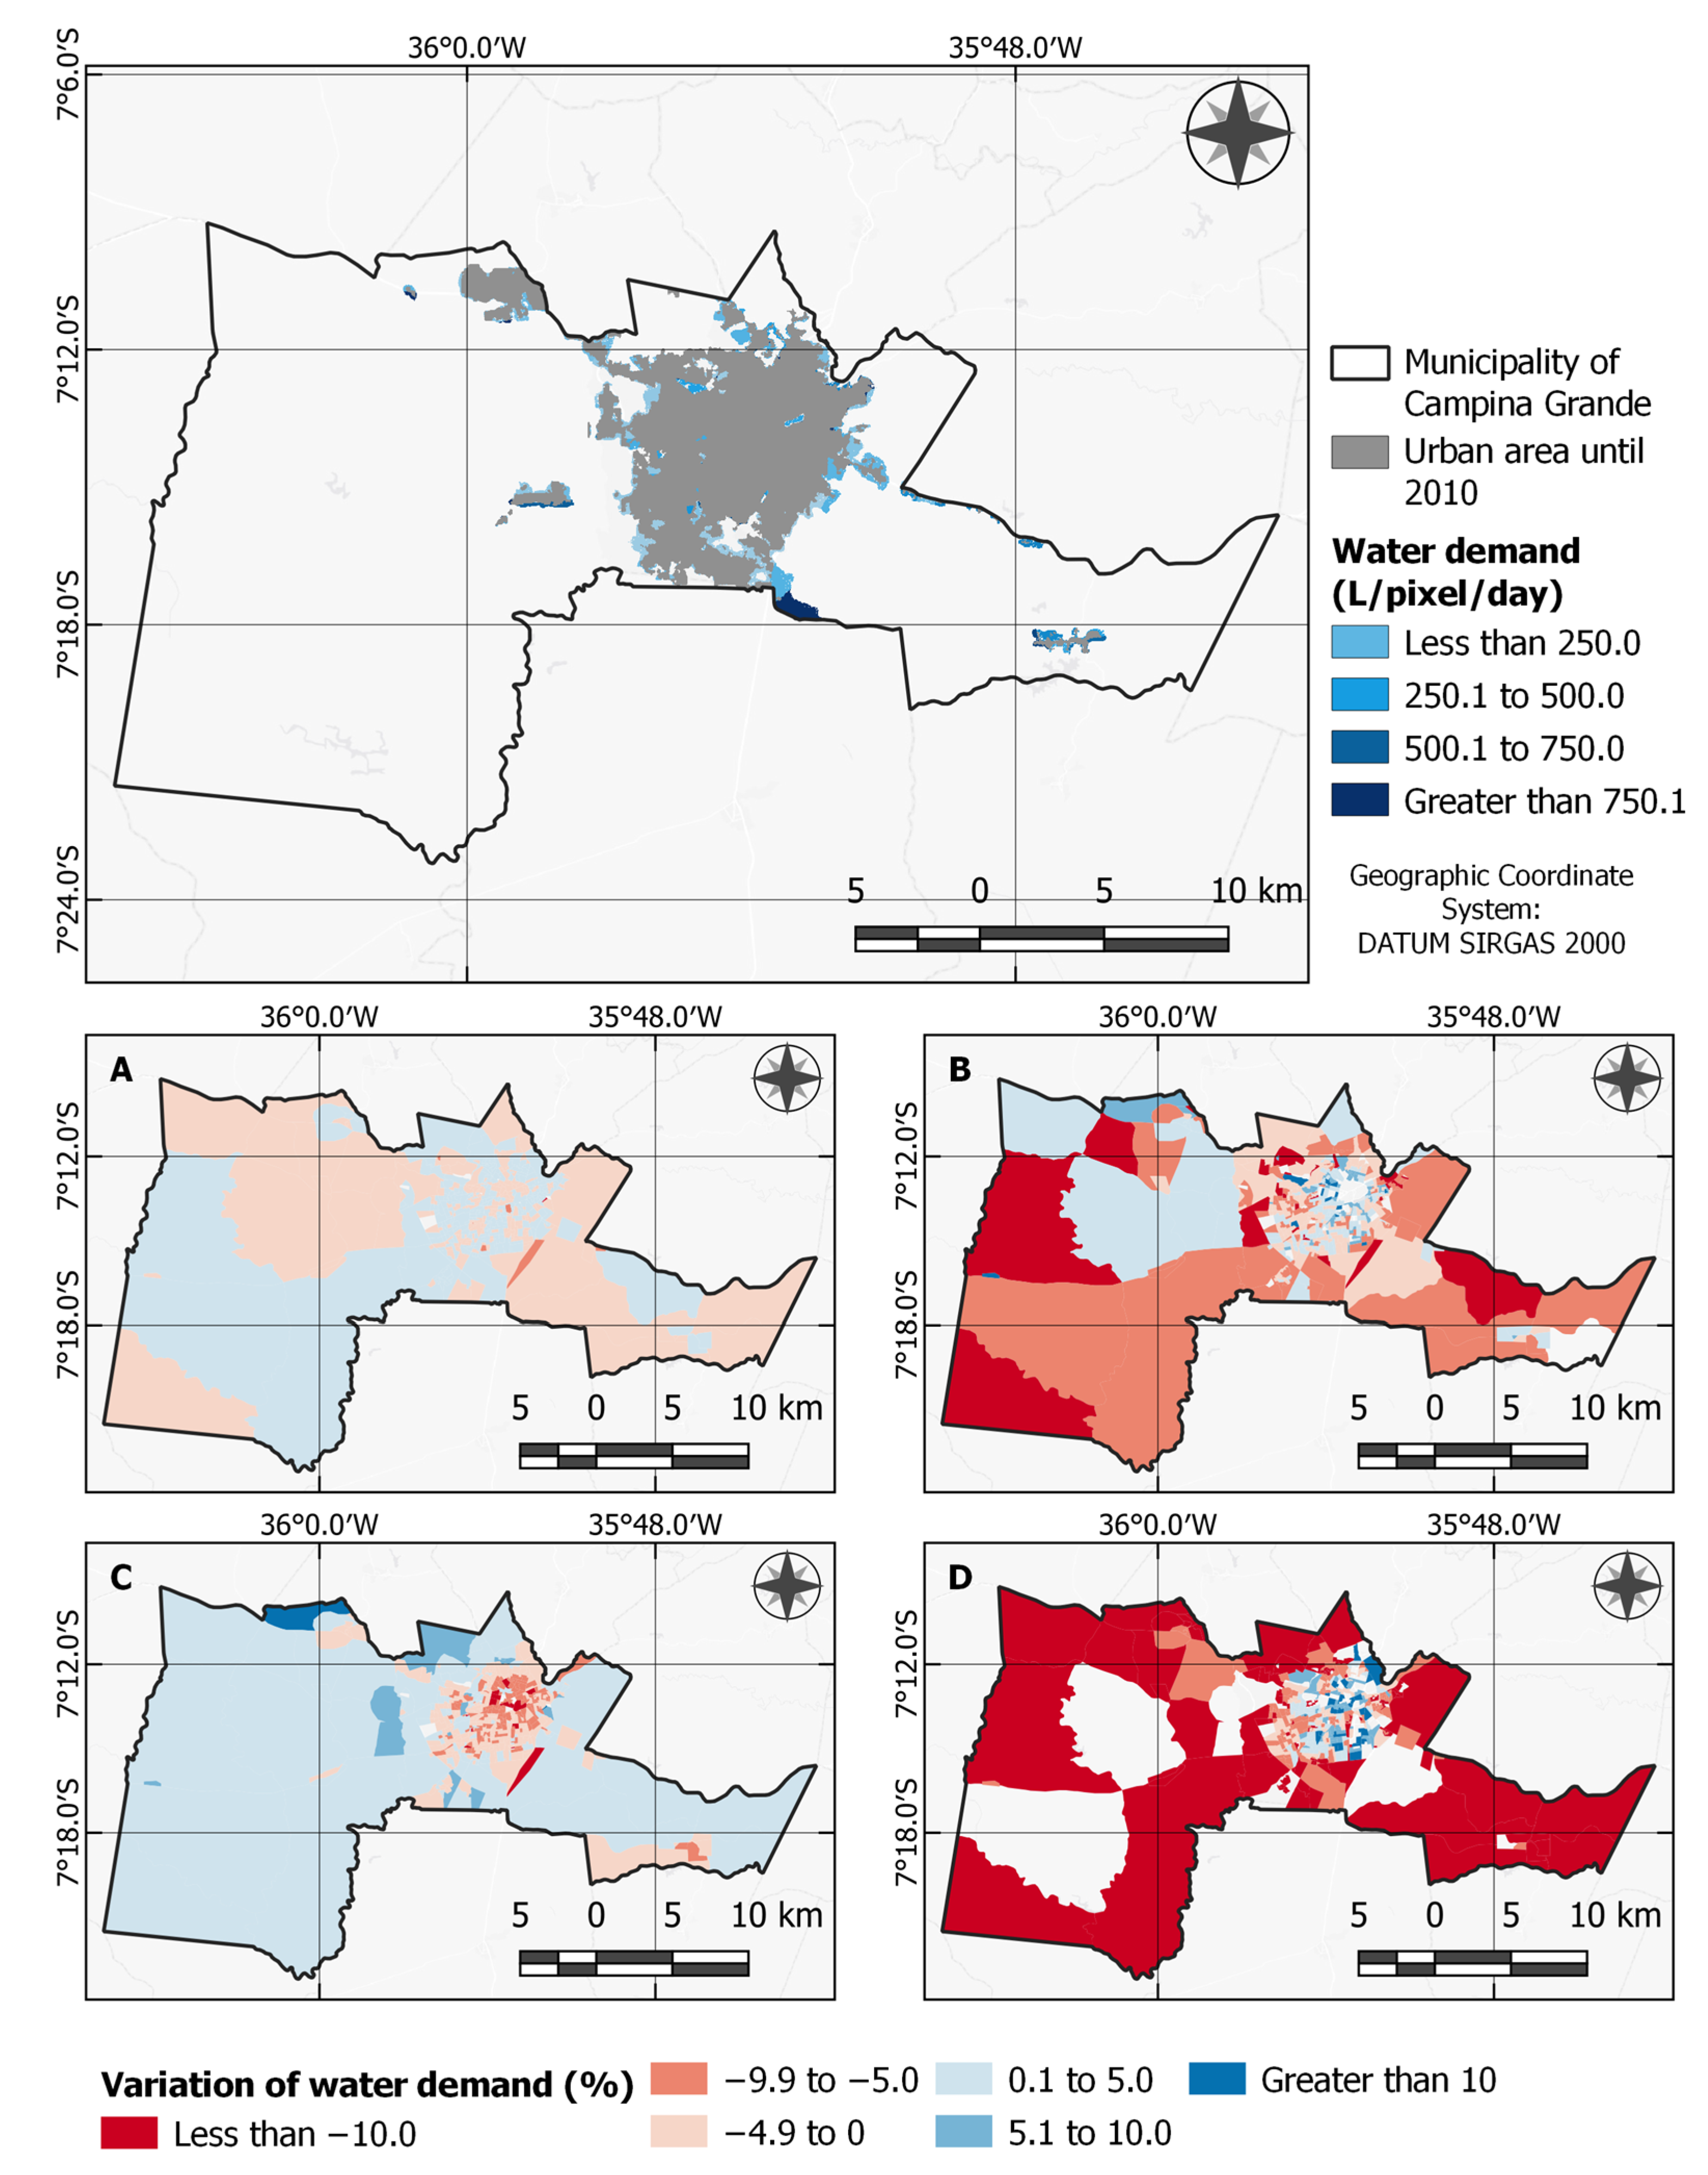
2.4. Estimating Domestic Water Demand
- is the variation in water consumption resulting from the analyzed variable;
- is an arbitrary constant value, used as a reference value;
- is the percentage that represents the increase (or decrease) in relation to the municipal average, in a whole number;
- is the regression coefficient of the analyzed variable;
3. Results and Discussion
4. Conclusions
Author Contributions
Funding
Data Availability Statement
Acknowledgments
Conflicts of Interest
References
- Patra, S.; Sahoo, S.; Mishra, P.; Mahapatra, S.C. Impacts of urbanization on land use /cover changes and its probable implications on local climate and groundwater level. J. Urban Manag. 2018, 7, 70–84. [Google Scholar] [CrossRef]
- Liu, Y.; Yang, Y.; Li, Y.; Li, J. Conversion from rural settlements and arable land under rapid urbanization in Beijing during 1985–2010. J. Rural Stud. 2017, 51, 141–150. [Google Scholar] [CrossRef]
- Ahmed, Z.; Zafar, M.W.; Ali, S. Danish Linking urbanization, human capital, and the ecological footprint in G7 countries: An empirical analysis. Sustain. Cities Soc. 2020, 55, 102064. [Google Scholar] [CrossRef]
- Xu, F.; Wang, Z.; Chi, G.; Zhang, Z. The impacts of population and agglomeration development on land use intensity: New evidence behind urbanization in China. Land Use Policy 2020, 95, 104639. [Google Scholar] [CrossRef]
- Caprotti, F.; Cowley, R.; Datta, A.; Broto, V.C.; Gao, E.; Georgeson, L.; Herrick, C.; Odendaal, N.; Joss, S. The New Urban Agenda: Key opportunities and challenges for policy and practice. Urban Res. Pract. 2017, 10, 367–378. [Google Scholar] [CrossRef]
- Carneiro, E.; Lopes, W.; Espindola, G. Urban Land Mapping Based on Remote Sensing Time Series in the Google Earth Engine Platform: A Case Study of the Teresina-Timon Conurbation Area in Brazil. Remote Sens. 2021, 13, 1338. [Google Scholar] [CrossRef]
- Yadav, G.; Mangla, S.K.; Luthra, S.; Rai, D.P. Developing a sustainable smart city framework for developing economies: An Indian context. Sustain. Cities Soc. 2019, 47, 101462. [Google Scholar] [CrossRef]
- Gaur, S.; Bandyopadhyay, A.; Singh, R. Projecting land use growth and associated impacts on hydrological balance through scenario-based modelling in the Subarnarekha basin, India. Hydrol. Sci. J. 2021, 66, 1997–2010. [Google Scholar] [CrossRef]
- Okwuashi, O.; Ndehedehe, C.E. Integrating machine learning with Markov chain and cellular automata models for modelling urban land use change. Remote Sens. Appl. Soc. Environ. 2021, 21, 100461. [Google Scholar] [CrossRef]
- Rodrigues, H.; Soares-Filho, B. A Short Presentation of Dinamica EGO. In Geomatic Approaches for Modeling Land Change Scenarios; Springer: Cham, Switzerland, 2018; pp. 493–498. [Google Scholar]
- Liu, X.; Liang, X.; Li, X.; Xu, X.; Ou, J.; Chen, Y.; Li, S.; Wang, S.; Pei, F. A future land use simulation model (FLUS) for simulating multiple land use scenarios by coupling human and natural effects. Landsc. Urban Plan. 2017, 168, 94–116. [Google Scholar] [CrossRef]
- Saxena, A.; Jat, M.K. Capturing heterogeneous urban growth using SLEUTH model. Remote Sens. Appl. Soc. Environ. 2019, 13, 426–434. [Google Scholar] [CrossRef]
- Pahlavani, P.; Askarian Omran, H.; Bigdeli, B. A multiple land use change model based on artificial neural network, Markov chain, and multi objective land allocation. Earth Obs. Geomat. Eng. 2017, 1, 82–99. [Google Scholar] [CrossRef]
- Hewitt, R.; Díaz Pacheco, J.; Moya Gómez, B. A Cellular Automata Land Use Model for the R Software Environment (Weblog). Available online: https://simlander.wordpress.com (accessed on 29 November 2019).
- Abbas, Z.; Yang, G.; Zhong, Y.; Zhao, Y. Spatiotemporal Change Analysis and Future Scenario of LULC Using the CA-ANN Approach: A Case Study of the Greater Bay Area, China. Land 2021, 10, 584. [Google Scholar] [CrossRef]
- Gharaibeh, A.; Shaamala, A.; Obeidat, R.; Al-Kofahi, S. Improving land-use change modeling by integrating ANN with Cellular Automata-Markov Chain model. Heliyon 2020, 6, e05092. [Google Scholar] [CrossRef] [PubMed]
- Gantumur, B.; Wu, F.; Vandansambuu, B.; Tsegmid, B.; Dalaibaatar, E.; Zhao, Y. Spatiotemporal dynamics of urban expansion and its simulation using CA-ANN model in Ulaanbaatar, Mongolia. Geocarto Int. 2022, 37, 494–509. [Google Scholar] [CrossRef]
- Liu, S.; Wang, N.; Xie, J.; Jiang, R.; Zhao, M. Optimal Scale of Urbanization with Scarce Water Resources: A Case Study in an Arid and Semi-Arid Area of China. Water 2018, 10, 1602. [Google Scholar] [CrossRef]
- INSA––Instituto Nacional do Semiárido Portal INSA. Available online: https://portal.insa.gov.br/noticias/1070-nova-delimitacao-expande-o-semiarido-ate-omaranhao-73-novos-municipios-foram-.incluidos#:~:text=Comoacréscimodasnovas,demográficade25hab%2Fkm2 (accessed on 29 December 2020).
- Dias de Jesus, A. From fighting against droughts to coexisting with the semiarid. Int. J. Semiarid 2021, 4, 188–197. [Google Scholar] [CrossRef]
- Delazeri, L.M.M.; da Cunha, D.A.; Couto-Santos, F.R. Climate change and urbanization: Evidence from the Semi-arid Region of Brazil. Rev. Bras. Estud. Reg. Urbanos 2018, 12, 129–154. [Google Scholar]
- de Brito, Y.M.A.; Rufino, I.A.A.; Braga, C.F.C.; Mulligan, K. The Brazilian drought monitoring in a multi-annual perspective. Environ. Monit. Assess. 2021, 193, 31. [Google Scholar] [CrossRef]
- de Espindola, G.M.; Costa Carneiro, E.L.N.; Façanha, A.C. Four decades of urban sprawl and population growth in Teresina, Brazil. Appl. Geogr. 2017, 79, 73–83. [Google Scholar] [CrossRef]
- Marengo, J.A.; Cunha, A.P.M.A.; Nobre, C.A.; Ribeiro Neto, G.G.; Magalhaes, A.R.; Torres, R.R.; Sampaio, G.; Alexandre, F.; Alves, L.M.; Cuartas, L.A.; et al. Assessing drought in the drylands of northeast Brazil under regional warming exceeding 4 °C. Nat. Hazards 2020, 103, 2589–2611. [Google Scholar] [CrossRef]
- IBGE––Instituto Brasileiro de Geografia e Estatística Estimativas da População. Available online: https://www.ibge.gov.br/estatisticas/sociais/populacao/9103-estimativas-de-populacao.html?=&t=downloads (accessed on 10 March 2021).
- IBGE––Instituto Brasileiro de Geografia e Estatística Malha Municipal. Available online: https://www.ibge.gov.br/geociencias/organizacao-do-territorio/malhas-territoriais/15774-malhas.html?=&t=acesso-ao-produto (accessed on 5 January 2022).
- SUDENE––Superintendência do Desenvolvimento do Nordeste Mapas e Shapefile. Available online: http://antigo.sudene.gov.br/delimitacao-do-semiarido (accessed on 1 May 2022).
- Cordão, M.J.d.S.; Rufino, I.A.A.; Barros Ramalho Alves, P.; Barros Filho, M.N.M. Water shortage risk mapping: A GIS-MCDA approach for a medium-sized city in the Brazilian semi-arid region. Urban Water J. 2020, 17, 642–655. [Google Scholar] [CrossRef]
- MapBiomas Project Collection [6.0] of the Annual Land Use Land Cover Maps of Brazil. Available online: mapbiomas.org (accessed on 12 December 2021).
- SNIS––Sistema Nacional de Informações Sobre Saneamento Painel de Saneamento. Available online: http://appsnis.mdr.gov.br/indicadores/web/agua_esgoto/mapa-agua (accessed on 1 May 2022).
- Miranda, L.I.B. de A Crise Hidrica e a Gestão das Águas Urbanas na Bacia Hidrográfica do Rio Paraíba. In Proceedings of the XVII ENANPUR, São Paulo, Brazil, 22–26 May 2017. [Google Scholar]
- Gorelick, N.; Hancher, M.; Dixon, M.; Ilyushchenko, S.; Thau, D.; Moore, R. Google Earth Engine: Planetary-scale geospatial analysis for everyone. Remote Sens. Environ. 2017, 202, 18–27. [Google Scholar] [CrossRef]
- Souza Junior, C.; Azevedo, T. MapBiomas General Handbook; Mapbiomas: São Paulo, Brazil, 2017; pp. 1–23. [Google Scholar]
- de Brito, H.C.; Rufino, I.A.A.; Djordjević, S. Cellular automata predictive model for man-made environment growth in a Brazilian semi-arid watershed. Environ. Monit. Assess. 2021, 193, 323. [Google Scholar] [CrossRef]
- DNIT (Departamento Nacional de Infraestrutura de Transportes) DNIT Portal. Available online: http://www.dnit.gov.br/mapas-multimodais (accessed on 4 December 2019).
- IBGE––Instituto Brasileiro de Geografia e Estatística IBGE Cidades. Available online: https://cidades.ibge.gov.br/ (accessed on 11 March 2021).
- Asia Air Survey. Next GIS MOLUSCE-Quick and Convenient Analysis of Land Cover Changes. Available online: https://nextgis.com/blog/molusce (accessed on 15 February 2022).
- El-Tantawi, A.M.; Bao, A.; Chang, C.; Liu, Y. Monitoring and predicting land use/cover changes in the Aksu-Tarim River Basin, Xinjiang-China (1990–2030). Environ. Monit. Assess. 2019, 191, 480. [Google Scholar] [CrossRef]
- Camacho Olmedo, M.T.; García-Álvarez, D. Basic and Multiple-Resolution Cross-Tabulation to Validate Land Use Cover Maps. In Land Use Cover Datasets and Validation Tools; Springer International Publishing: Cham, Switzerland, 2022; pp. 99–125. [Google Scholar]
- IBGE––Instituto Brasileiro de Geografia e Estatística Projeções da População. Available online: https://www.ibge.gov.br/estatisticas/sociais/populacao/9109-projecao-da-populacao.html (accessed on 14 March 2022).
- da Veiga, F.; Kalbusch, A.; Henning, E. Drivers of urban water consumption in Brazil: A countrywide, cross-sectional study. Urban Water J. 2022, 1–9. [Google Scholar] [CrossRef]
- IBGE––Instituto Brasileiro de Geografia e Estatística Censo Demográfico. 2010. Available online: https://censo2010.ibge.gov.br/resultados.html (accessed on 21 December 2021).
- R Core Team. R: A Language and Environment for Statistical Computing; R Foundation for Statistical Computing: Vienna, Austria, 2013. [Google Scholar]
- ANA––Agência Nacional de Águas. Manual de Usos Consuntivos da Água no Brasil, 1st ed.; Ministério do Desenvolvimento Regional: Brasília, Brazil, 2019; ISBN 978-85-8210-057-8. [Google Scholar]
- Medeiros, R.; Andrade, J.; Ramos, D.; Moura, M.; Pérez-Marin, A.M.; dos Santos, C.A.C.; da Silva, B.B.; Cunha, J. Remote Sensing Phenology of the Brazilian Caatinga and Its Environmental Drivers. Remote Sens. 2022, 14, 2637. [Google Scholar] [CrossRef]
- Cunha, J.; Nóbrega, R.L.B.; Rufino, I.; Erasmi, S.; Galvão, C.; Valente, F. Surface albedo as a proxy for land-cover clearing in seasonally dry forests: Evidence from the Brazilian Caatinga. Remote Sens. Environ. 2019, 2019, 111250. [Google Scholar] [CrossRef]
- Wang, Y. Urban land and sustainable resource use: Unpacking the countervailing effects of urbanization on water use in China, 1990–2014. Land Use Policy 2020, 90, 104307. [Google Scholar] [CrossRef]
- Teller, J. Regulating urban densification: What factors should be used? Build. Cities 2021, 2, 302–317. [Google Scholar] [CrossRef]
- Fan, J.; Zhou, L. Three-dimensional intergovernmental competition and urban sprawl: Evidence from Chinese prefectural-level cities. Land Use Policy 2019, 87, 104035. [Google Scholar] [CrossRef]
- Casaril, C.C.; Fresca, T.M. Verticalização urbana brasileira: Histórico, pesquisadores e abordagens. Rev. Faz Ciência 2000, 9, 169. Available online: https://e-revista.unioeste.br/index.php/fazciencia/article/view/7535/5570 (accessed on 29 December 2020).
- Souza, F.C. de Verticalização Urbana: Um novo formato de cidade moderna nos séculos XX e XXI–Um estudo de caso sobre Campina Grande/PB (1960–2012). Geoconexões Online 2021, 1, 14–28. [Google Scholar] [CrossRef]


| LULC Type | Mapbiomas Classes |
|---|---|
| Natural Formation | Forest, non-forest natural formation, beach, dune, other non-vegetated areas |
| Agriculture and Livestock * | Grazing, agriculture, forestry, mosaic of agriculture and grazing, mining |
| Water Body | River, lake, ocean, aquaculture |
| Urbanized Area | Urbanized area |
| Explanatory Variable | Hypothesis |
|---|---|
| Slope | Low-slope surfaces are more attractive for human activities (crops, livestock, or settlements). Usually, flat surfaces allow for most activities without the need for high earth movement (cuts and embankments), which makes it more accessible for settlements or agricultural and livestock activities. |
| Accessibility | The more accessible an area is (for example, near roads and highways), the greater the chance that sites will become occupied. |
| Proximity to urban centers | Historically, settlements begin or spread near water bodies through water availability. The ease of access to the resource also makes agricultural and cattle-raising practices feasible in nearby regions. |
| Urban Expansion Zones | Throughout the urbanization process of cities, urban areas commonly redefine their boundaries. Thus, places where urbanization processes are identified more pronouncedly attract real estate investments that contribute to the urbanization in the vicinity. |
| Natural Formation | Farming | Water | Urban Area | |
|---|---|---|---|---|
| Producer’s accuracy (%) | 75.85 | 77.82 | 37.51 | 98.91 |
| User’s accuracy (%) | 61.78 | 87.58 | 91.53 | 92.25 |
| Year | Domestic Water Consumption (m3/Year) | Consumption Growth Compared to 2010 (%) |
|---|---|---|
| 2020 | 17,773,950.83 | 7.52 |
| 2030 | 18,339,904.78 | 10.94 |
| 2040 | 18,681,267.76 | 13.01 |
| 2050 | 18,879,156.14 | 14.21 |
Disclaimer/Publisher’s Note: The statements, opinions and data contained in all publications are solely those of the individual author(s) and contributor(s) and not of MDPI and/or the editor(s). MDPI and/or the editor(s) disclaim responsibility for any injury to people or property resulting from any ideas, methods, instructions or products referred to in the content. |
© 2023 by the authors. Licensee MDPI, Basel, Switzerland. This article is an open access article distributed under the terms and conditions of the Creative Commons Attribution (CC BY) license (https://creativecommons.org/licenses/by/4.0/).
Share and Cite
Brito, H.C.d.; Rufino, I.A.A.; Barros Filho, M.N.M.; Meneses, R.A. Use of Spatial Data in the Simulation of Domestic Water Demand in a Semiarid City: The Case of Campina Grande, Brazil. Urban Sci. 2023, 7, 120. https://doi.org/10.3390/urbansci7040120
Brito HCd, Rufino IAA, Barros Filho MNM, Meneses RA. Use of Spatial Data in the Simulation of Domestic Water Demand in a Semiarid City: The Case of Campina Grande, Brazil. Urban Science. 2023; 7(4):120. https://doi.org/10.3390/urbansci7040120
Chicago/Turabian StyleBrito, Higor Costa de, Iana Alexandra Alves Rufino, Mauro Normando Macedo Barros Filho, and Ronaldo Amâncio Meneses. 2023. "Use of Spatial Data in the Simulation of Domestic Water Demand in a Semiarid City: The Case of Campina Grande, Brazil" Urban Science 7, no. 4: 120. https://doi.org/10.3390/urbansci7040120