
A Blockchain Based Framework for Efficient Water Management and Leakage Detection in Urban Areas
 , ,
, ,
Abstract
:1. Introduction
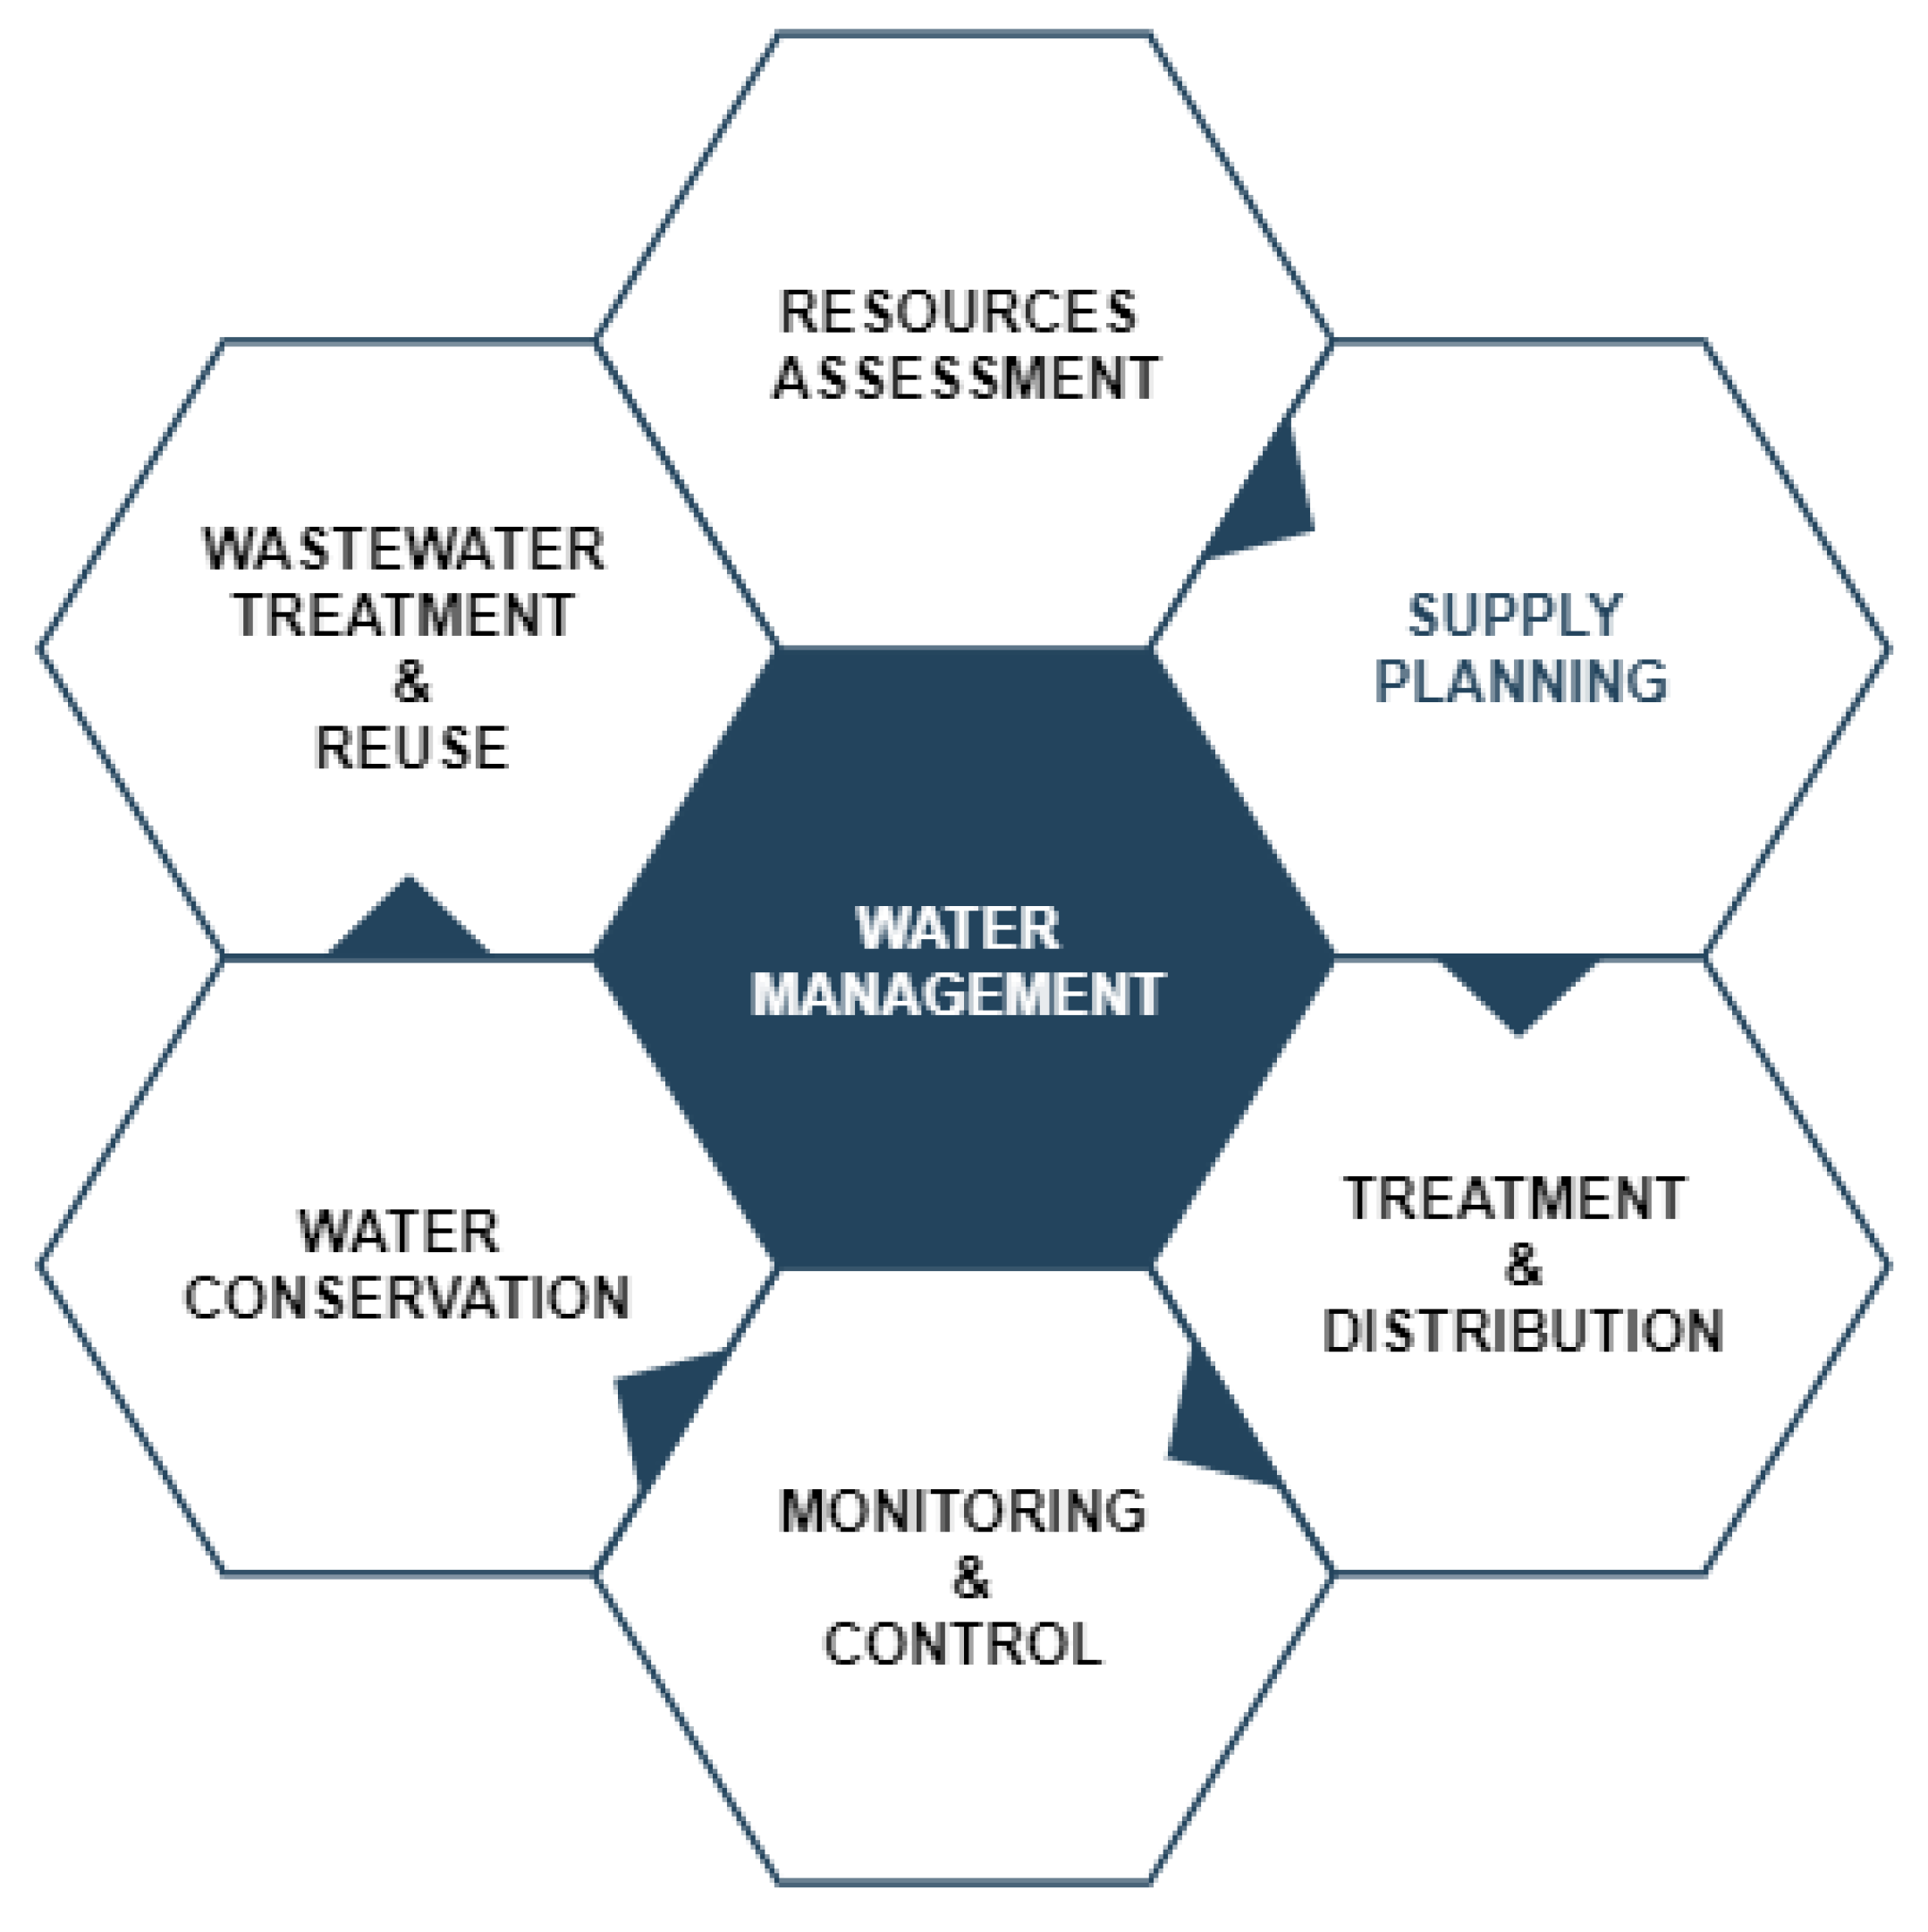
2. Water Management
3. Water Distribution Systems
4. Monitoring and Control of Water Distribution Systems
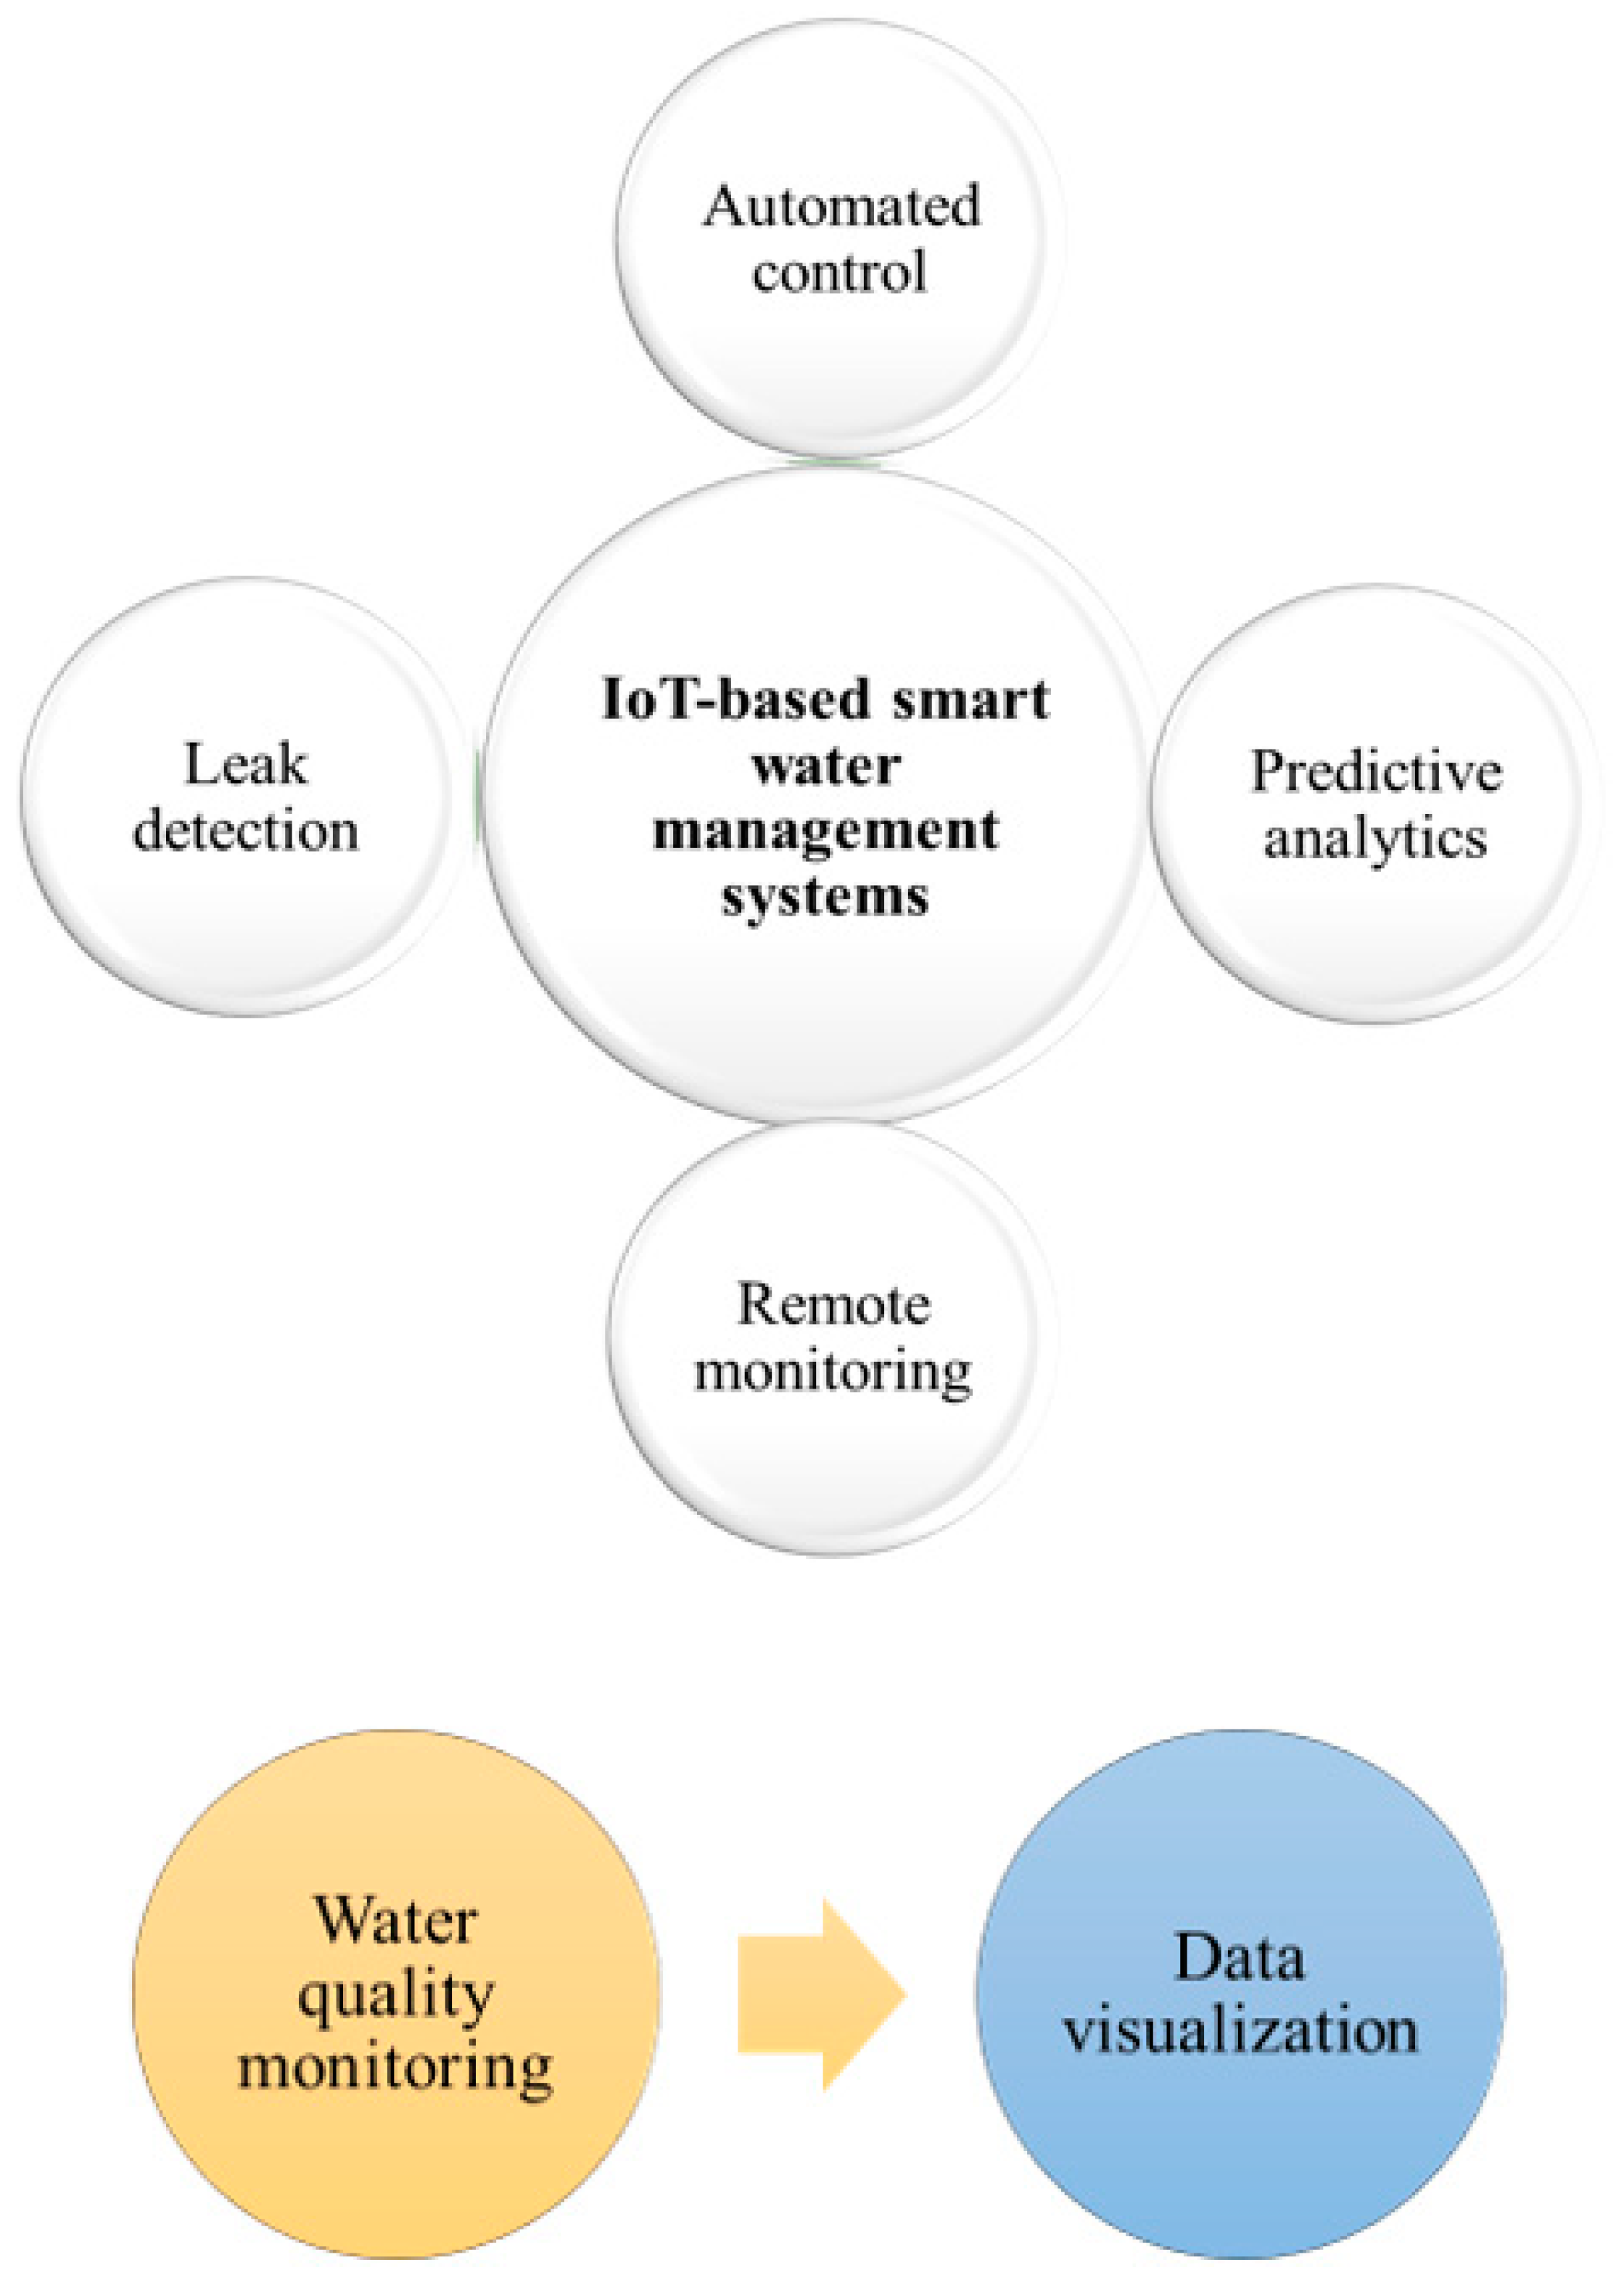
5. Smart Systems for Water Distribution
6. Water Conservation and per Capita Demand
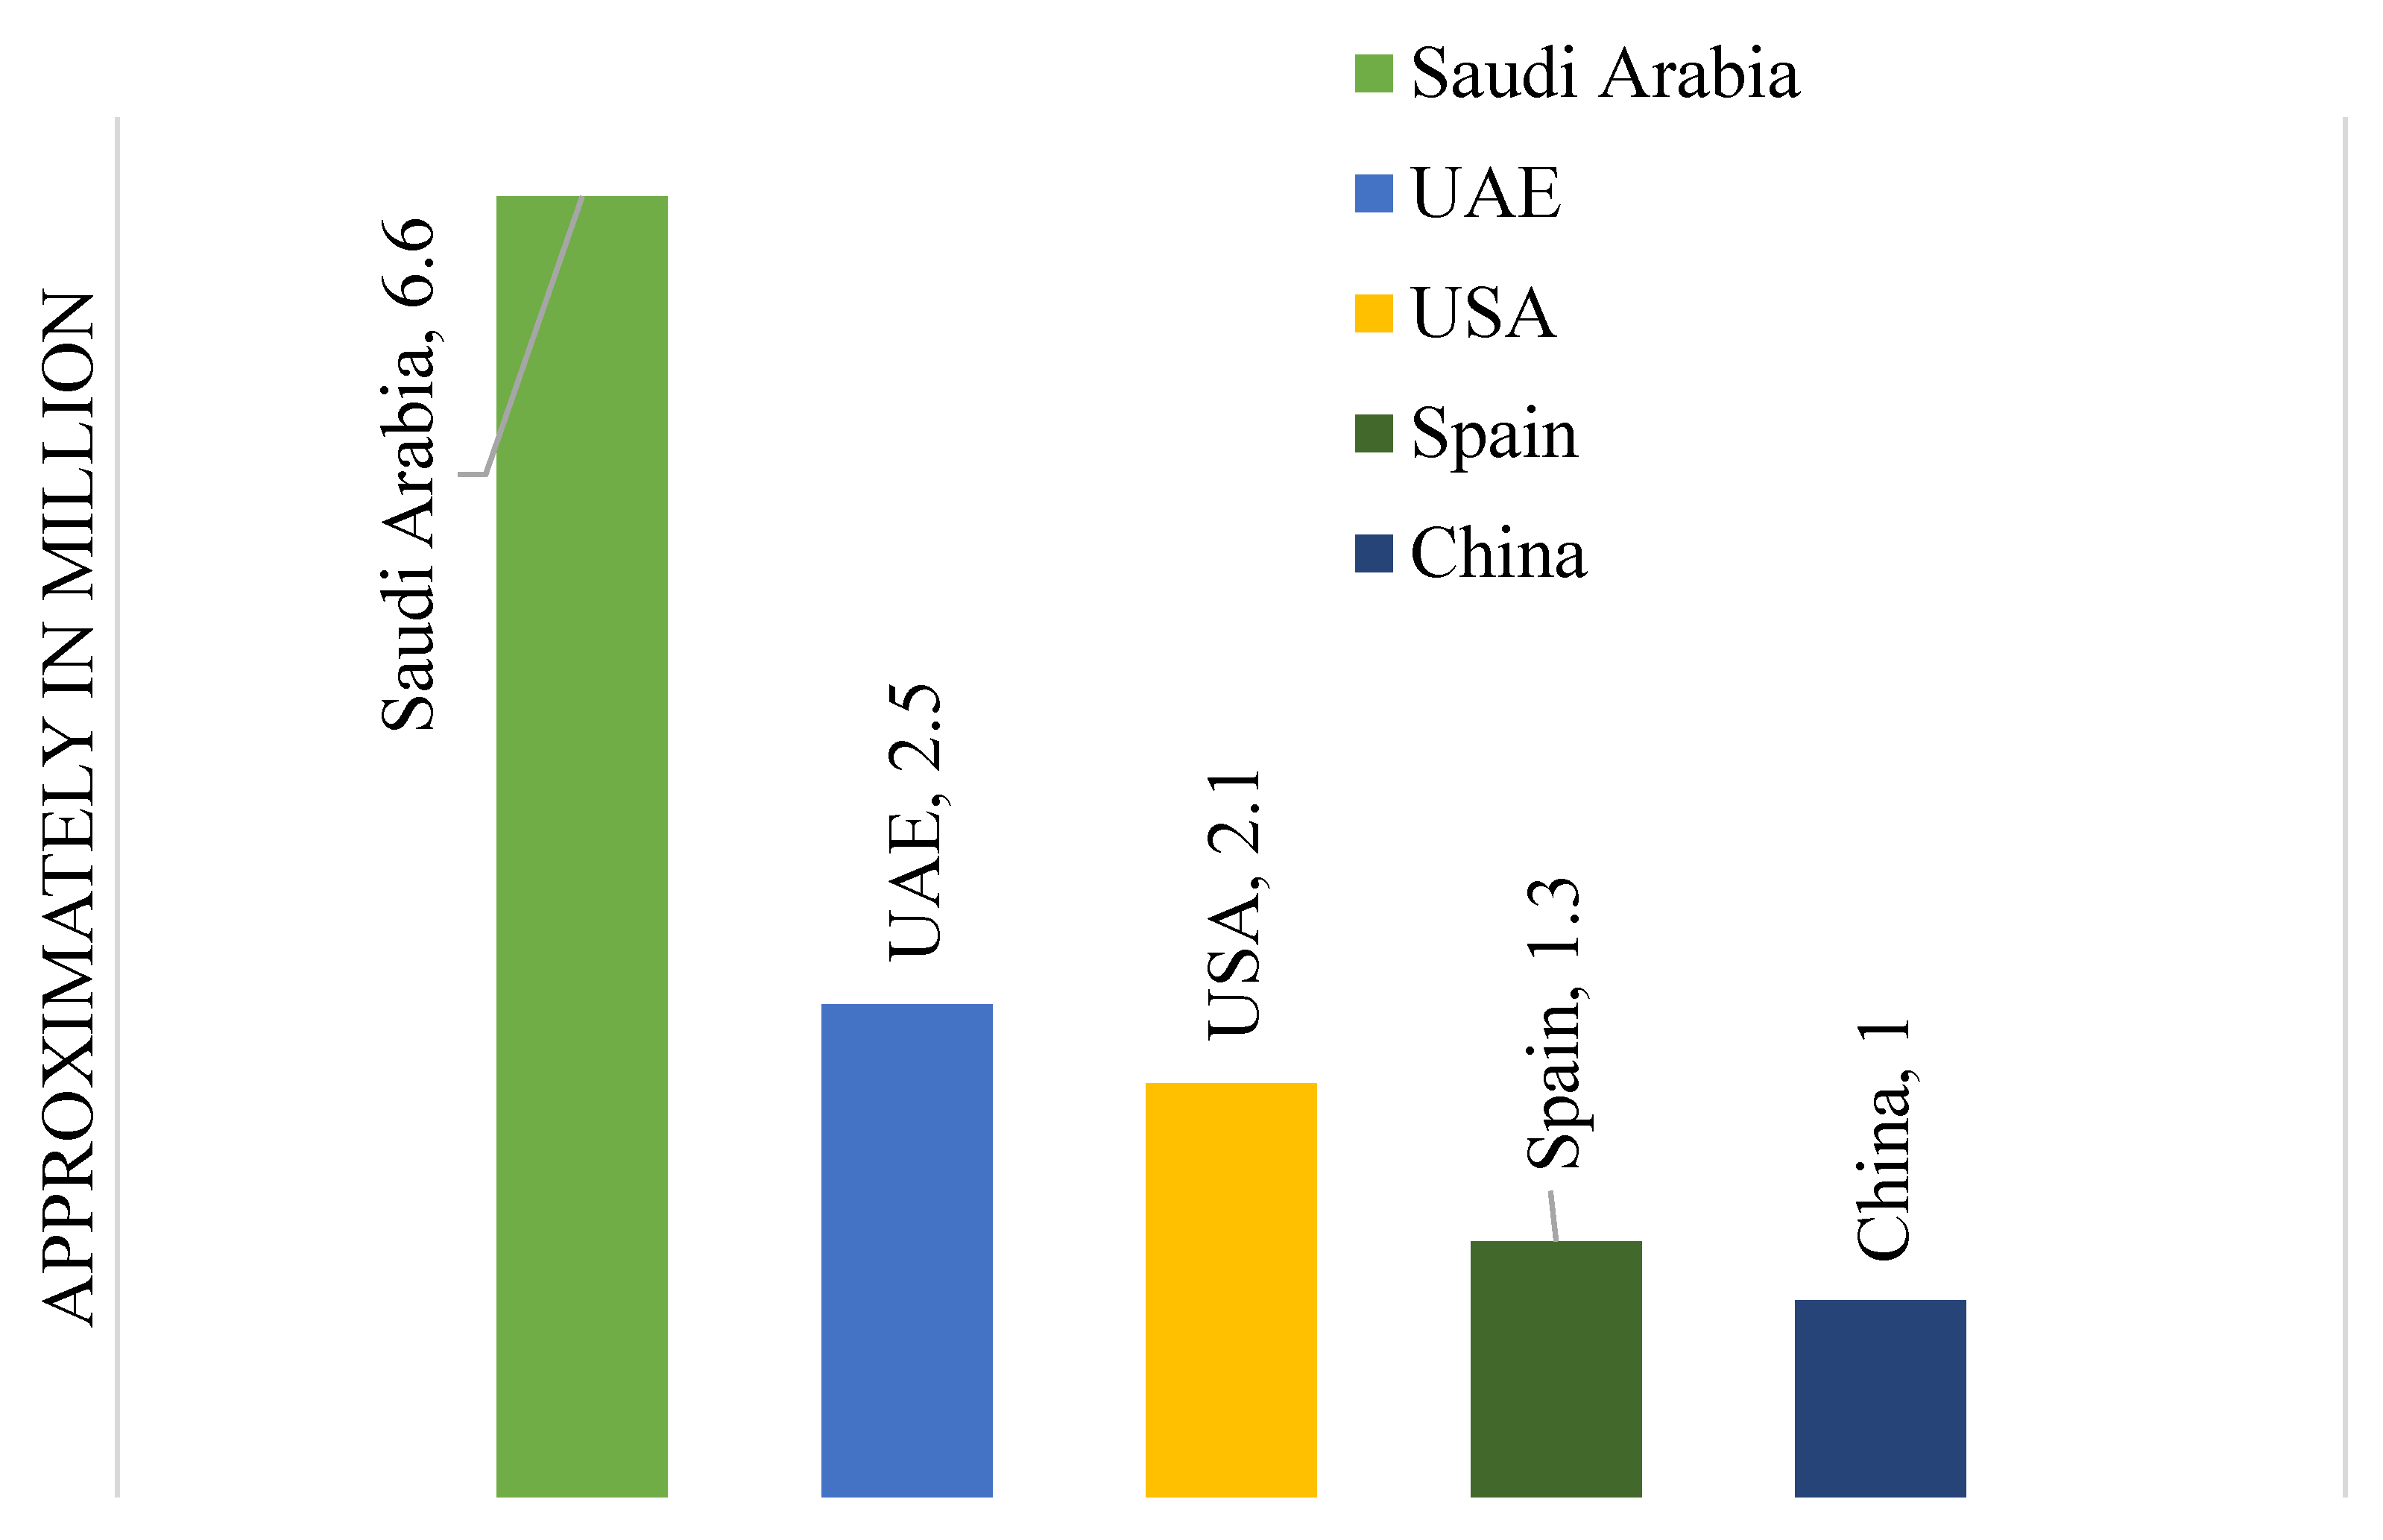
7. Desalination Plants in Saudi Arabia
8. Potential Improvements in Losses and Treatment
9. Transmission Overview of Saudi Arabia
10. Automated Frameworks
11. Proposed Trusted and Secure Networking
11.1. Water Distribution Network
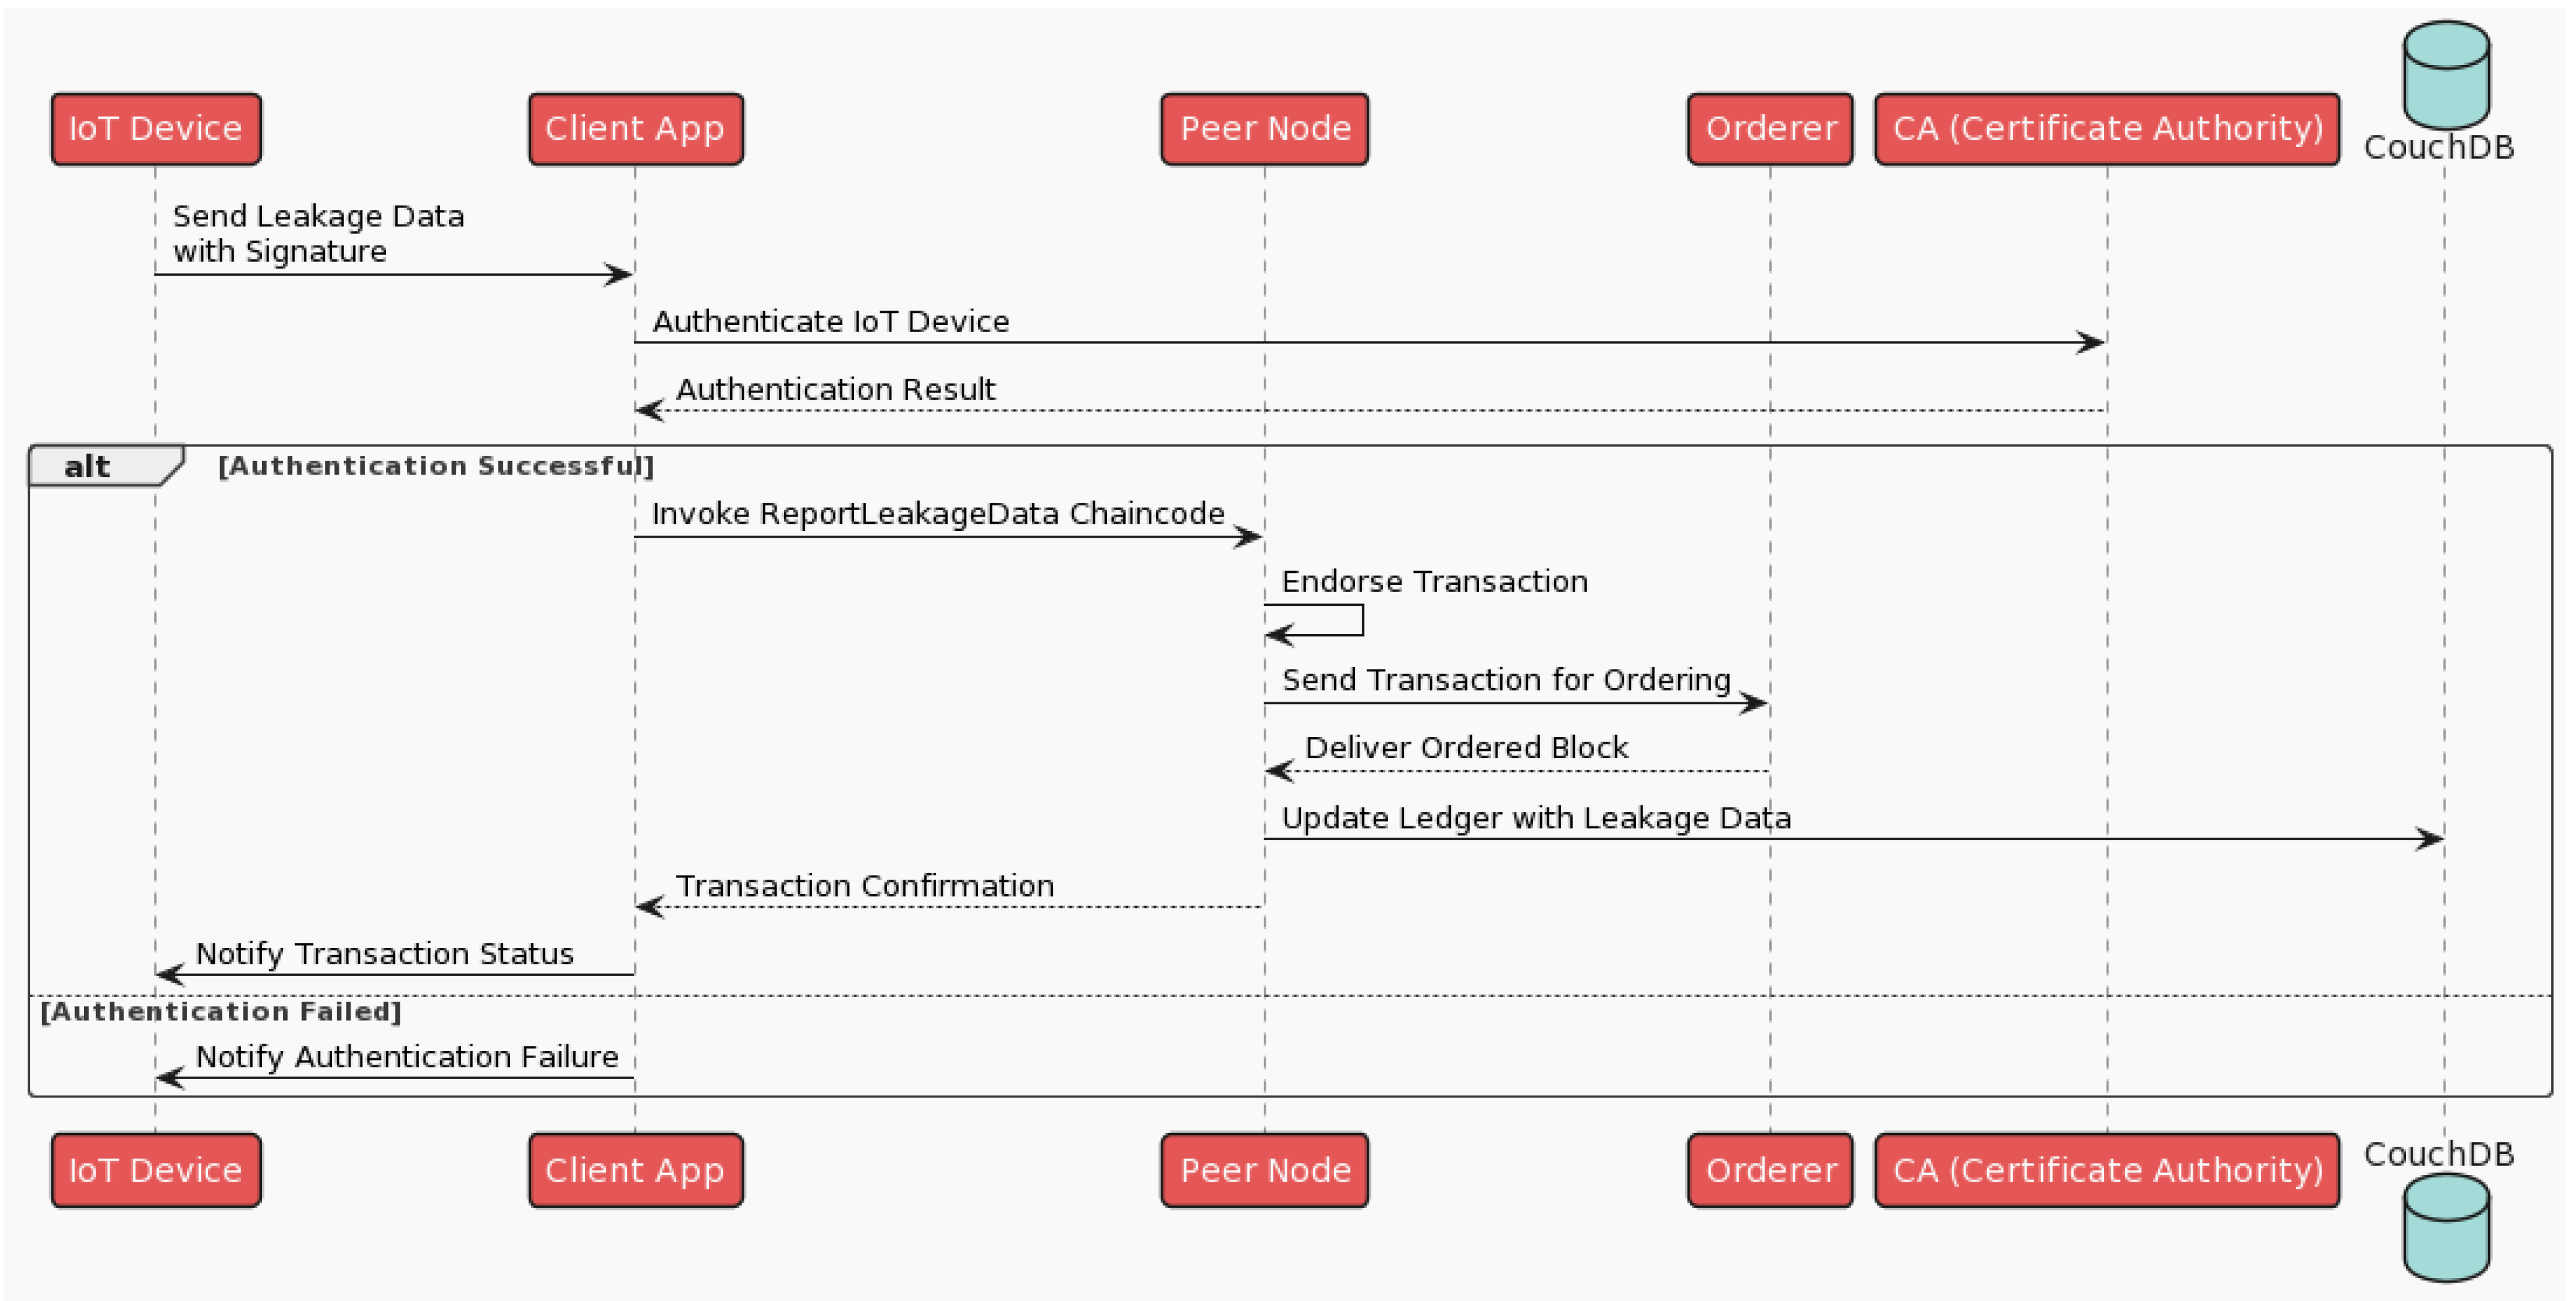
11.2. Technical Overview of the Proposed System
- D: Set of all IoT devices.
- T: Timestamp when data are generated.
- L: Water leakage data.
- S: Signature generated using the IoT device’s private key.
- K: Public key corresponding to the IoT device.
- A: Set of all authorities to be notified.
- B: Blockchain state.
- ‘authenticateDevice(d, s, k, t)’: Validates the authenticity of device (d) using signature ( s ), public key ( k ), and timestamp (t). Returns true if authenticated, false otherwise.
- ‘reportLeakageData(l, t)’: Stores leakage data (l) at timestamp (t) into the blockchain.
- ‘notifyAuthorities(a, l, t)’: Sends a notification to authority (a) regarding leakage data (l) at timestamp (t).
- The device generates leakage data l at timestamp t.
- The device generates a signature s = Sign (d, l, t) using its private key.
- The device sends (l, s, t) to the smart contract on the blockchain.
- For each received (l, s, t) from a device d:
- Call the authentication function:
- ‘authenticateDevice (d, s, K_d, t)’
- −
- If true (authenticated), proceed.
- −
- Else, discard l and exit.
- Store l in the blockchain:
- ‘reportLeakageData (l, t)’
- Notify the concerned authorities:
- For each authority a in A:
- ‘notifyAuthorities (a, l, t)’
- −
- D represents an IoT device.
- −
- A signifies the act of device authentication, where each device is verified for its integrity and trustworthiness before being allowed to report leakage data.
- −
- R stands for the reporting mechanism through which a device, once authenticated, submits water leakage information to the network.
- −
- T symbolizes a timestamp, ensuring that each report is uniquely identifiable based on the time of submission.
- −
- S is the cryptographic signature the IoT device generates, further strengthening the device’s credibility and the data authenticity.
- −
- M encompasses the complete process of the device first authenticating itself and then reporting the leakage data, all while maintaining a temporal record.
12. Implementation
Testbed Environment
| package main import ( “bytes” “crypto/sha256” “encoding/json” “fmt” “github.com/hyperledger/fabric-contract-api-go/contractapi” ) type LeakageContract struct { contractapi.Contract } type LeakageData struct { DeviceID string ‘json:“deviceID”’ Data string ‘json:”data”’ Timestamp string ‘json:“timestamp”’ Signature string ‘json:“signature”’ } type AuthResult struct { Authenticated bool ‘json:“authenticated”’ } func (s *LeakageContract) InitLedger(ctx contractapi.TransactionContextInterface) error { setups. return nil } func (s *LeakageContract) AuthenticateDevice(ctx contractapi.TransactionContextInterface, deviceID string, data string, timestamp string, signature string) (*AuthResult, error) { // A cryptographic method for authentication. hashed := sha256.Sum256([]byte(deviceID + data + timestamp)) if bytes.Compare(hashed[:], []byte(signature)) == 0 { return &AuthResult{Authenticated: true}, nil } return &AuthResult{Authenticated: false}, nil } // ReportLeakageData reports and stores the leakage data to the ledger func (s *LeakageContract) ReportLeakageData(ctx contractapi.TransactionContextInterface, deviceID string, data string, timestamp string) error { leakage:= LeakageData{ DeviceID: deviceID, Data: data, Timestamp: timestamp, } leakageJSON, err:= json.Marshal(leakage) if err!= nil { return err } return ctx.GetStub().PutState(deviceID+“-”+timestamp, leakageJSON) } // NotifyAuthorities is a function to represent notifying the concerned authorities func (s *LeakageContract) NotifyAuthorities(ctx contractapi.TransactionContextInterface, authorityID string, deviceID string, data string, timestamp string) error { // This function will be integrated with external systems to notify relevant authorities. fmt.Printf(“Notified authority %s about leakage from device %s at %s with data %s\n”, authorityID, deviceID, timestamp, data) return nil } func main() { chaincode, err:= contractapi.NewChaincode(new(LeakageContract)) if err!= nil { fmt.Printf(“Error creating leakage chaincode: %s”, err.Error()) return } if err:= chaincode.Start(); err!= nil { fmt.Printf(“Error starting leakage chaincode: %s”, err.Error()) } } |
13. Conclusions
Author Contributions
Funding
Data Availability Statement
Conflicts of Interest
Abbreviations
| Abbreviation | Meaning |
| A | The cross-sectional area of the pipe |
| D | Water demand |
| ET | Evapotranspiration |
| Kc | Crop coefficient |
| P | Precipitation |
| Q | Flow rate |
| S | The measured value of a water quality parameter |
| V | Velocity of water |
| WQI | Water quality index |
| Wi | Weight factor for a water quality parameter |
| ΔS | Change in storage |
References
- El Maghraby, M.; Bamousa, A.O. Evaluation of groundwater quality for drinking and irrigation purposes using physicochemical parameters at Salilah area, Madinah Munawarah District, Saudi Arabia. J. Taibah Univ. Sci. 2021, 15, 695–709. [Google Scholar] [CrossRef]
- Ali, T.; Naqash, T. AR for Engineers: A Collaborative and Secure Augmented Reality Platform for Construction Site Monitoring, Overlaying Complex Drawings, and Disaster Recovery. Int. J. Energy Environ. Econ. 2022, 29, 379–395. [Google Scholar]
- Overview of the Water Supply Chain in KSA. Available online: http://wif.exicon.website/en/overview-of-the-water-supply-chain-in-ksa (accessed on 17 June 2023).
- Chowdhury, S.; Al-Zahrani, M. Implications of Climate Change on Water Resources in Saudi Arabia. Arab. J. Sci. Eng. 2013, 38, 1959–1971. [Google Scholar] [CrossRef]
- Bob, M.; Rahman, N.; Elamin, A.; Taher, S. Rising Groundwater Levels Problem in Urban Areas: A Case Study from the Central Area of Madinah City, Saudi Arabia. Arab. J. Sci. Eng. 2016, 41, 1461–1472. [Google Scholar] [CrossRef]
- Energy & Sustainability—Vision 2030. Available online: https://www.vision2030.gov.sa/thekingdom/explore/energy/ (accessed on 12 June 2023).
- Naqash, M.T.; Aburamadan, M.H.; Harireche, O.; AlKassem, A.; Farooq, Q.U. The Potential of Wind Energy and Design Implications on Wind Farms in Saudi Arabia. Int. J. Renew. Energy Dev. 2021, 10, 839–856. [Google Scholar] [CrossRef]
- Nawaz, K.S.; Nawaz, K.A.; Amjad, K.M.; Ali, S.S.A.; Tayyab, N. Assessment of drought, its causes and consequences in connection with local wisdom: A case study of Kohat basin drought-2017, Khyber Pakhtunkhwa, Pakistan. Disaster Adv. 2022, 15, 29–38. [Google Scholar]
- Riskiawan, H.Y.; Gupta, N.; Setyohadi, D.P.S.; Anwar, S.; Kurniasari, A.A.; Hariono, B.; Firmansyah, M.H.; Yogiswara, Y.; Mansur, A.B.F.; Basori, A.H. Artificial Intelligence Enabled Smart Monitoring and Controlling of IoT-Green House. Arab. J. Sci. Eng. 2023, 2023, 9–10. [Google Scholar] [CrossRef]
- Ministry of Environment, Water and Agriculture, Saudi Arabia. Available online: https://www.mewa.gov.sa/ar/Pages/default.aspx (accessed on 10 September 2023).
- UNDP. Water Governance in the Arab Region. Managing Scarcity and Securing the Future; United Nations Development Programme, Regional Bureau for Arab States (RBAS): New York, NY, USA, 2013; p. 10017. [Google Scholar]
- Hindiyeh, M.; Albatayneh, A.; AlAmawi, R. Water Energy Food Nexus to Tackle Future Arab Countries Water Scarcity. Air Soil Water Res. 2023, 16, 11786221231160906. [Google Scholar] [CrossRef]
- NWC. National Water Company Website. 2023. Available online: https://www.nwc.com.sa/EN/Pages/default.aspx (accessed on 17 June 2023).
- Metwaly, M.; Abdalla, F.; Taha, A.I. Hydrogeophysical study of sub-basaltic alluvial aquifer in the southern part of Al-Madinah Al-Munawarah, Saudi Arabia. Sustainability 2021, 13, 9841. [Google Scholar] [CrossRef]
- Alkhudhiri, A.; Bin Darwish, N.; Hilal, N. Analytical and forecasting study for wastewater treatment and water resources in Saudi Arabia. J. Water Process. Eng. 2019, 32, 100915. [Google Scholar] [CrossRef]
- SWCC. Sustainability Report 2021; Saline Water Conversion Corporation, SWCC: Riyadh, Saudi Arabia, 2021. [Google Scholar]
- Al-Zahrani, M.A. Modeling and simulation ofwater distribution system: A case study. Arab. J. Sci. Eng. 2012, 39, 1621–1636. [Google Scholar] [CrossRef]
- Weerasinghe, I. Water resource management. In TORUS 3—Toward an Open Resource Using Services: Cloud Computing for Environmental Data; John Wiley & Sons: Hoboken, NJ, USA, 2020; ISBN 9781119720522. [Google Scholar]
- He, C.; Harden, C.P.; Liu, Y. Comparison of water resources management between China and the United States. Geogr. Sustain. 2020, 1, 98–108. [Google Scholar] [CrossRef]
- De Souza Groppo, G.; Costa, M.A.; Libânio, M. Predicting water demand: A review of the methods employed and future possibilities. Water Sci. Technol. Water Supply 2019, 19, 2179–2198. [Google Scholar] [CrossRef]
- Akkem, Y.; Biswas, S.K.; Varanasi, A. Smart farming using artificial intelligence: A review. Eng. Appl. Artif. Intell. 2023, 120, 105899. [Google Scholar] [CrossRef]
- Shams, A.K.; Muhammad, N.S. Toward sustainable water resources management: Critical assessment on the implementation of integrated water resources management and water-energy-food nexus in Afghanistan. Water Policy 2022, 24, 1–18. [Google Scholar] [CrossRef]
- Geissen, V.; Mol, H.; Klumpp, E.; Umlauf, G.; Nadal, M.; van der Ploeg, M.; van de Zee, S.E.A.T.M.; Ritsema, C.J. Emerging pollutants in the environment: A challenge for water resource management. Int. Soil Water Conserv. Res. 2015, 3, 57–65. [Google Scholar] [CrossRef]
- Addeen, H.H.; Xiao, Y.; Li, J.; Guizani, M. A survey of cyber-physical attacks and detection methods in smart water distribution systems. IEEE Access 2021, 9, 99905–99921. [Google Scholar] [CrossRef]
- Khand, Q.U.; Barket, A.R. Smart Water Distribution for Irrigation System Smart Water Distribution for Irrigation System (SWDIS). Int. J. Innov. Technol. Explor. Eng. 2015, 5, 1–7. [Google Scholar]
- Frikha, T.; Ktari, J.; Ben Amor, N.; Chaabane, F.; Hamdi, M.; Denguir, F.; Hamam, H. Low Power Blockchain in Industry 4.0 Case Study: Water Management in Tunisia. J. Signal Process. Syst. 2023. [Google Scholar] [CrossRef]
- Blankson, H.; Chattamvelli, R. A Hybrid Hashing Algorithm for Secure Data Logging in a Water Distribution Network System using the Blockchain Technology. J. Xidian Univ. 2023, 17, 279–293. [Google Scholar]
- Devi, B.N.; Kowsalya, G.; Senbagam, R. Design and Implementation of IOT Based Smart Water Distribution System. Int. J. Sci. Res. Sci. Eng. Technol. 2020, 7, 537–541. [Google Scholar] [CrossRef]
- Zaman, M.; Al Islam, M.; Tantawy, A.; Fung, C.J.; Abdelwahed, S. Adaptive Control for Smart Water Distribution Systems. In Proceedings of the 2021 IEEE International Smart Cities Conference (ISC2), Manchester, UK, 7–10 September 2021. [Google Scholar]
- Naqash, M.T.; Formisano, A.; Noroozinejad Farsangi, E. Using a Full-Scale Mock-Up of Skylight to Evaluate Its Performance Following Standards Criteria. Arab. J. Sci. Eng. 2022, 47, 13407–13420. [Google Scholar] [CrossRef]
- Albannay, S.; Kazama, S.; Oguma, K.; Hashimoto, T.; Takizawa, S. Water demand management based on water consumption data analysis in the emirate of Abu Dhabi. Water 2021, 13, 2827. [Google Scholar] [CrossRef]
- [Brochure]: 5 Ways Digital Solutions Are Helping Water Utilities Do More with Less. Available online: https://discover.aveva.com/paid-search-ari-water (accessed on 17 June 2023).
- Water—At the Center of the Climate Crisis|United Nations. Available online: https://www.un.org/en/climatechange (accessed on 17 June 2023).
- WHO. The Human Right to Water and Sanitation Media Brief. UN-Water Decade Programme on Advocacy and Communication and Water Supply and Sanitation Collaborative Counci, No. April 2011, pp. 1–8. Available online: http://www.un.org/waterforlifedecade/pdf/human_right_to_water_and_sanitation_media_brief.pdf (accessed on 12 August 2023).
- General Authority for Statistics. Per Capita Water Consumption In Saudi Regions During The Period 2009–2017. Available online: https://www.stats.gov.sa/sites/default/files/per_capita_water_consumption_in_saudi_regions_en_0.pdf (accessed on 12 August 2023).
- OECD. Water—Water. Available online: https://www.oecd.org/water/water-quantity-and-quality.htm (accessed on 17 June 2023).
- U.S. Environmental Protection Agency|US EPA. Available online: https://www.epa.gov/ (accessed on 17 June 2023).
- Pitt, R. Stormwater Non-Potable Beneficial Uses and Effects on Urban Infrastructure; Water Intell. Online; IWA Publishing: London, UK, 2012. [Google Scholar] [CrossRef]
- Zotalis, K.; Dialynas, E.G.; Mamassis, N.; Angelakis, A.N. Desalination technologies: Hellenic experience. Water 2014, 6, 1134–1150. [Google Scholar] [CrossRef]
- Chowdhury, S.; Rahaman, M.S.; Mazumder, M.A.J. Global mapping of seawater desalination research: A bibliometric analysis of research trends from 1980–2022. Qual. Quant. 2023. [Google Scholar] [CrossRef]
- Home—SWCC. Available online: https://www.swcc.gov.sa/en (accessed on 17 June 2023).
- Aquatech|Desalination Plants: Ten of the World’s Largest. Available online: https://www.aquatechtrade.com/news/desalination/worlds-largest-desalination-plants (accessed on 10 September 2023).
- Hurd, T.G.; Beyhaghi, S.; Nosonovsky, M. Ecological Aspects of Water Desalination Improving Surface Properties of Reverse Osmosis Membranes. Green Energy Technol. 2012, 49, 531–564. [Google Scholar] [CrossRef]
- Chowdhury, S.; Al-Zahrani, M. Characterizing water resources and trends of sector wise water consumptions in Saudi Arabia. J. King Saud Univ. Eng. Sci. 2015, 27, 68–82. [Google Scholar] [CrossRef]
- Water Infrastructure in KSA—Fanack Water. Available online: https://water.fanack.com/saudi-arabia/water-infrastructure-in-ksa/ (accessed on 10 September 2023).
- Leading Countries Using Desalination—Energy Conservation. Available online: https://www.drdarrinlew.us/energy-conservation/introduction-irq.html (accessed on 10 September 2023).
- Grievson, O.; Holloway, T.; Johnson, B. A Strategic Digital Transformation for the Water Industry; IWA Publishing: London, UK, 2022. [Google Scholar] [CrossRef]
- Dinar, A.; Subramanian, A. Water Pricing Experiences: An International Perspective; World Bank Technical Papers; World Bank: Washington, DC, USA, 1997. [Google Scholar]
- Antzoulatos, G.; Mourtzios, C.; Stournara, P.; Kouloglou, I.O.; Papadimitriou, N.; Spyrou, D.; Mentes, A.; Nikolaidis, E.; Karakostas, A.; Kourtesis, D.; et al. Making urban water smart: The SMART-WATER solution. Water Sci. Technol. 2020, 82, 2691–2710. [Google Scholar] [CrossRef]
- March, H.; Grau-Satorras, M.; Saurí, D.; Swyngedouw, E. The deadlock of metropolitan remunicipalisation of water services management in Barcelona. Water Altern. 2019, 12, 360–379. [Google Scholar]
- Grifoll, M.; Jordà, G.; Espino, M.; Romo, J.; García-Sotillo, M. A management system for accidental water pollution risk in a harbour: The Barcelona case study. J. Mar. Syst. 2011, 88, 60–73. [Google Scholar] [CrossRef]
- Echevarría, C.; Pastur, M.; Valderrama, C.; Cortina, J.L.; Vega, A.; Mesa, C.; Aceves, M. Techno-economic assessment of decentralized polishing schemes for municipal water reclamation and reuse in the industrial sector in costal semiarid regions: The case of Barcelona (Spain). Sci. Total Environ. 2022, 815, 152842. [Google Scholar] [CrossRef] [PubMed]
- Saurí, D. Lights and shadows of urban water demand management: The case of metropolitan region of Barcelona. Eur. Plan. Stud. 2003, 11, 229–243. [Google Scholar] [CrossRef]
- Furlong, C.; Gan, K.; De Silva, S. Governance of Integrated Urban Water Management in Melbourne, Australia. Util. Policy 2016, 43, 48–58. [Google Scholar] [CrossRef]
- Brodnik, C.; Brown, R. Strategies for developing transformative capacity in urban water management sectors: The case of Melbourne, Australia. Technol. Forecast. Soc. Chang. 2018, 137, 147–159. [Google Scholar] [CrossRef]
- Ferguson, B.C.; Brown, R.R.; Frantzeskaki, N.; de Haan, F.J.; Deletic, A. The enabling institutional context for integrated water management: Lessons from Melbourne. Water Res. 2013, 47, 7300–7314. [Google Scholar] [CrossRef] [PubMed]
- Furlong, C.; Brotchie, R.; Considine, R.; Finlayson, G.; Guthrie, L. Key concepts for Integrated Urban Water Management infrastructure planning: Lessons from Melbourne. Util. Policy 2017, 45, 84–96. [Google Scholar] [CrossRef]
- Thakali, R.; Kalra, A.; Ahmad, S. Understanding the Effects of climate change on urban stormwater infrastructures in the Las Vegas Valley. Hydrology 2016, 3, 34. [Google Scholar] [CrossRef]
- Stave, A.K. A system dynamics model to facilitate public understanding of water management options in Las Vegas, Nevada. J. Environ. Manag. 2003, 67, 303–313. [Google Scholar] [CrossRef]
- Ranatunga, T.; Tong, S.T.Y.; Sun, Y.; Yang, Y.J. A total water management analysis of the Las Vegas Wash watershed, Nevada. Phys. Geogr. 2014, 35, 220–244. [Google Scholar] [CrossRef]
- Tortajada, C. Water management in Singapore. Int. J. Water Resour. Dev. 2006, 22, 227–240. [Google Scholar] [CrossRef]
- Luan, I.O.B. Singapore water management policies and practices. Int. J. Water Resour. Dev. 2010, 26, 65–80. [Google Scholar] [CrossRef]
- Koh, Y.T.R. Attitude, behaviour and choice: The role of psychosocial drivers in water demand management in Singapore. Int. J. Water Resour. Dev. 2019, 36, 69–87. [Google Scholar] [CrossRef]
- El Serafy, G.Y.; Schaeffer, B.A.; Neely, M.-B.; Spinosa, A.; Odermatt, D.; Weathers, K.C.; Baracchini, T.; Bouffard, D.; Carvalho, L.; Conmy, R.N.; et al. Integrating inland and coastal water quality data for actionable knowledge. Remote. Sens. 2021, 13, 2899. [Google Scholar] [CrossRef]
- Bhardwaj, A.; Kumar, M.; Alshehri, M.; Keshta, I.; Abugabah, A.; Sharma, S.K. Smart water management framework for irrigation in agriculture. Environ. Technol. 2022. [Google Scholar] [CrossRef]
- Kingdom of Saudi Arabia and Saudi Vision 2030. National Transformation Program 2020. Saudi Vis. 2030. Available online: https://www.vision2030.gov.sa/en/vision-2030/vrp/national-transformation-program/ (accessed on 12 August 2023).
- Dragulinescu, A.M.; Constantin, F.; Orza, O.; Bosoc, S.; Streche, R.; Negoita, A.; Osiac, F.; Balaceanu, C.; Suciu, G. Smart Watering System Security Technologies using Blockchain. In Proceedings of the 13th International Conference on Electronics, Computers and Artificial Intelligence, ECAI 2021, Pitesti, Romania, 1–3 July 2021. [Google Scholar]
- Islam, M.R.; Azam, S.; Shanmugam, B.; Mathur, D. A Review on Current Technologies and Future Direction of Water Leakage Detection in Water Distribution Network. IEEE Access 2022, 10, 107177–107201. [Google Scholar] [CrossRef]


| Category | Information |
|---|---|
| Water sources | Saudi Arabia’s primary water sources are groundwater, desalinated water, and wastewater treatment. Groundwater is mainly retrieved from deep aquifers in the country’s center and east, where desalination facilities usually are found. |
| Water treatment plants | Three hundred thirty treatment facilities have been established in Saudi Arabia owing to significant infrastructure investments in water treatment. These facilities utilize high-quality technology to treat wastewater, brackish water, and seawater, including reverse osmosis, ultrafiltration, and multi-stage flash distillation. |
| Water demand | Due to population growth, urbanization, and increased industrial and agricultural activity, Saudi Arabia has a high-water demand. The nation’s annual water use is thought to be over 20 billion cubic meters, with the agricultural sector accounting for much of this need. |
| Water loss and wastage | According to some estimates, up to 30% of Saudi Arabia’s water supply is wasted owing to leaks and other waste sources, which is a severe problem. The government has implemented several initiatives to prevent water loss, such as intelligent water management systems and financial incentives for businesses to use less water. |
| Distribution networks | The Saudi Arabian water distribution system is intricate, with several networks catering to various areas and industries. The government has spent money constructing new pipes and installing smart meters to keep track of water use to improve the distribution system. |
| Category | Statistics |
|---|---|
| Water demand | Average daily water demand: 231,000 m3/day |
| Projected water demand by 2040: 356,000 m3/day | |
| Chlorination | Percentage of water treatment plants using chlorination: 100% |
| Filtration | Percentage of water treatment plants using sand filtration: 70% |
| Requirements | Capital investment required for water infrastructure development: $1.5 billion |
| Estimated operational expenses for water infrastructure: $100 million/year | |
| Availability | Percentage of the population in the region with access to potable water: 100% |
| Cost | The average cost of water supply: $0.5/m3 |
| The average cost of wastewater treatment: $0.3/m3 | |
| The estimated cost of implementing a smart system for water distribution management is $10 to $14 million |
| Type of Water Use | Per Capita Demand for Water Use |
|---|---|
| Basic human needs (Drinking, cooking, sanitation) | Minimum of 50 L per capita per day |
| Household water use (Saudi Arabia) | 200–300 L per capita per day |
| Household water use (Typical EU counties for example) | 100–150 L per capita per day |
| Commercial water use | Varies widely depending on the type of activity and level of water efficiency |
| Industrial water use | |
| Agricultural water use |
| Country | Number of Plants | Total Capacity (m3/day) | % of Water Supply | Avg. Cost per m3 | * Desalination Technology | Energy Consumption per m3 (kWh/m3) | CO2 Emissions per m3 (kg CO2/m3) |
|---|---|---|---|---|---|---|---|
| Saudi Arabia | Over 50 | 6.6 million | Around 70% | $0.53 | MSF and RO | 2.5–3 | 1.5–2.5 |
| UAE | Over 40 | 2.5 million | Around 90% | $0.58–1.00 | RO | 3–5 | 2–3 |
| USA | Over 300 | 2.1 million | Less than 1% | $0.80–1.50 | RO | 2–3 | 0.5–1.5 |
| Spain | Over 900 | 1.3 million | Less than 1% | $0.70–1.20 | RO | 2–5 | 1–3 |
| China | Over 40 | 1 million | Less than 1% | $0.70–1.00 | MSF and RO | 3–5 | 2–3 |
| Indicator | Value |
|---|---|
| Number of Desalination Plants | Over 50 |
| Total Capacity of Desalination Plants (m3/day) | Approximately 6.6 million |
| Percentage of Water Supply from Desalination | Around 25% |
| Largest Desalination Plant | Ras Al Khair (1,036,000 m3/day) |
| Cost of Ras Al Khair Desalination Plant | $7.2 billion |
| Average Cost per m3 of Desalinated Water | $0.53 |
| Largest Desalination Company | Saline Water Conversion Corporation (SWCC) |
| SWCC’s Share of Total Desalination Capacity | Over 70% |
| Energy Consumption per m3 of Desalinated Water | 2.7 kWh/m3 (large systems) 2.27 kWh/m3 (small stations) |
| CO2 Emissions per m3 of Desalinated Water | 13 million metric tons/year (Carbon emission reduction) |
| Desalination Plant | Location | Capacity (m3/day) | Capacity (MGD) | Year Built | Cost (USD) | Cost per m3 | Areas/Zones Supplied |
|---|---|---|---|---|---|---|---|
| Shuaibah | Jeddah | 880,000 | 232.5 | 2005 | $1.2 billion | $0.53 | Jeddah, Mecca, Taif, and Al Baha regions |
| Ras Al Khair | Jubail | 1,036,000 | 273.5 | 2014 | $7.2 billion | $0.53 | Eastern and Central regions |
| Jubail-2 | Jubail | 1,170,000 | 309 | 2015 | $3 billion | $0.53 | Eastern and Central regions |
| Yanbu-3 | Yanbu | 550,000 | 145.3 | 2016 | $1.7 billion | $0.55 | Yanbu Industrial City |
| Al Khobar | Al Khobar | 210,000 | 55.5 | 2016 | $530 million | $0.59 | Al Khobar and neighboring areas |
| Jeddah-3 | Jeddah | 240,000 | 63.4 | 2018 | $530 million | $0.63 | Jeddah and neighboring areas |
| Rabigh-3 | Rabigh | 600,000 | 158.5 | 2020 | $1.5 billion | $0.53 | Rabigh and neighboring areas |
| Category | Potential Improvement in Statistics |
|---|---|
| Water wastage | Reduction in water loss due to leaks and other sources of waste: up to 30% |
| Reduction in unaccounted-for water (UFW) in the distribution network: up to 20% | |
| Wastewater treatment | Increase in the efficiency of wastewater treatment processes: up to 15% |
| Reduction in the discharge of untreated wastewater into the environment: up to 90% | |
| Water quality | Improvement in water quality through real-time monitoring and control of water distribution processes |
| Energy consumption | Reduction in energy consumption through the optimization of water distribution processes: up to 10% |
| Category | Barcelona | Madrid | Cape Town | Singapore | Madinah Munawara |
|---|---|---|---|---|---|
| Government policies | Water pricing policies, promotion of water-efficient technologies and practices | Water restrictions, promotion of water-efficient technologies and practices | Investment in water infrastructure, promotion of water-efficient technologies and practices | Investment in water infrastructure, promotion of water-efficient technologies and practices | |
| Industry involvement | Collaboration with industries to reduce water usage, use of advanced technologies such as smart water management systems | Collaboration with water distribution companies, use of advanced technologies such as smart water management systems | |||
| Category | Barcelona | Madrid | Cape Town | Singapore | Madinah Munawara |
|---|---|---|---|---|---|
| Population (millions) | 1.6 | 3.3 | 4.0 | 5.7 | 1.2 |
| Water demand (m3/day) | 400,000 | 870,000 | 605,000 | 430,000 | 231,000 |
| Percentage of the population with access to potable water | 100% | 100% | 100% | 100% | 100% |
| Water loss due to leaks and other sources of waste | 25% reduction achieved | 20% reduction targeted | 15% reduction achieved | 5% reduction achieved | Up to 30% reduction targeted |
| Wastewater treatment efficiency | Up to 99% | Up to 95% | Up to 95% | Up to 95% | Up to 85% |
| Cost of water supply ($/m3) | 0.6 | 0.5 | 1.1 | 0.4 | 0.5 |
| Cost of wastewater treatment ($/m3) | 0.3 | 0.3 | 0.6 | 0.3 | 0.3 |
| Region | Length of Pipes (km) | Diameter of Pipes (Inches) | Cities/Towns Served | Purpose |
|---|---|---|---|---|
| Central | 2800 | 8–60 | Riyadh, Buraydah, Al-Kharj, and others | Drinking, domestic, and agricultural |
| Eastern | 1800 | 8–80 | Dammam, Al-Khobar, Jubail, and others | |
| Western | 2000 | 8–72 | Jeddah, Mecca, Taif, and others | |
| Southern | 1575 | 8–60 | Abha, Khamis Mushait, Najran, and others |
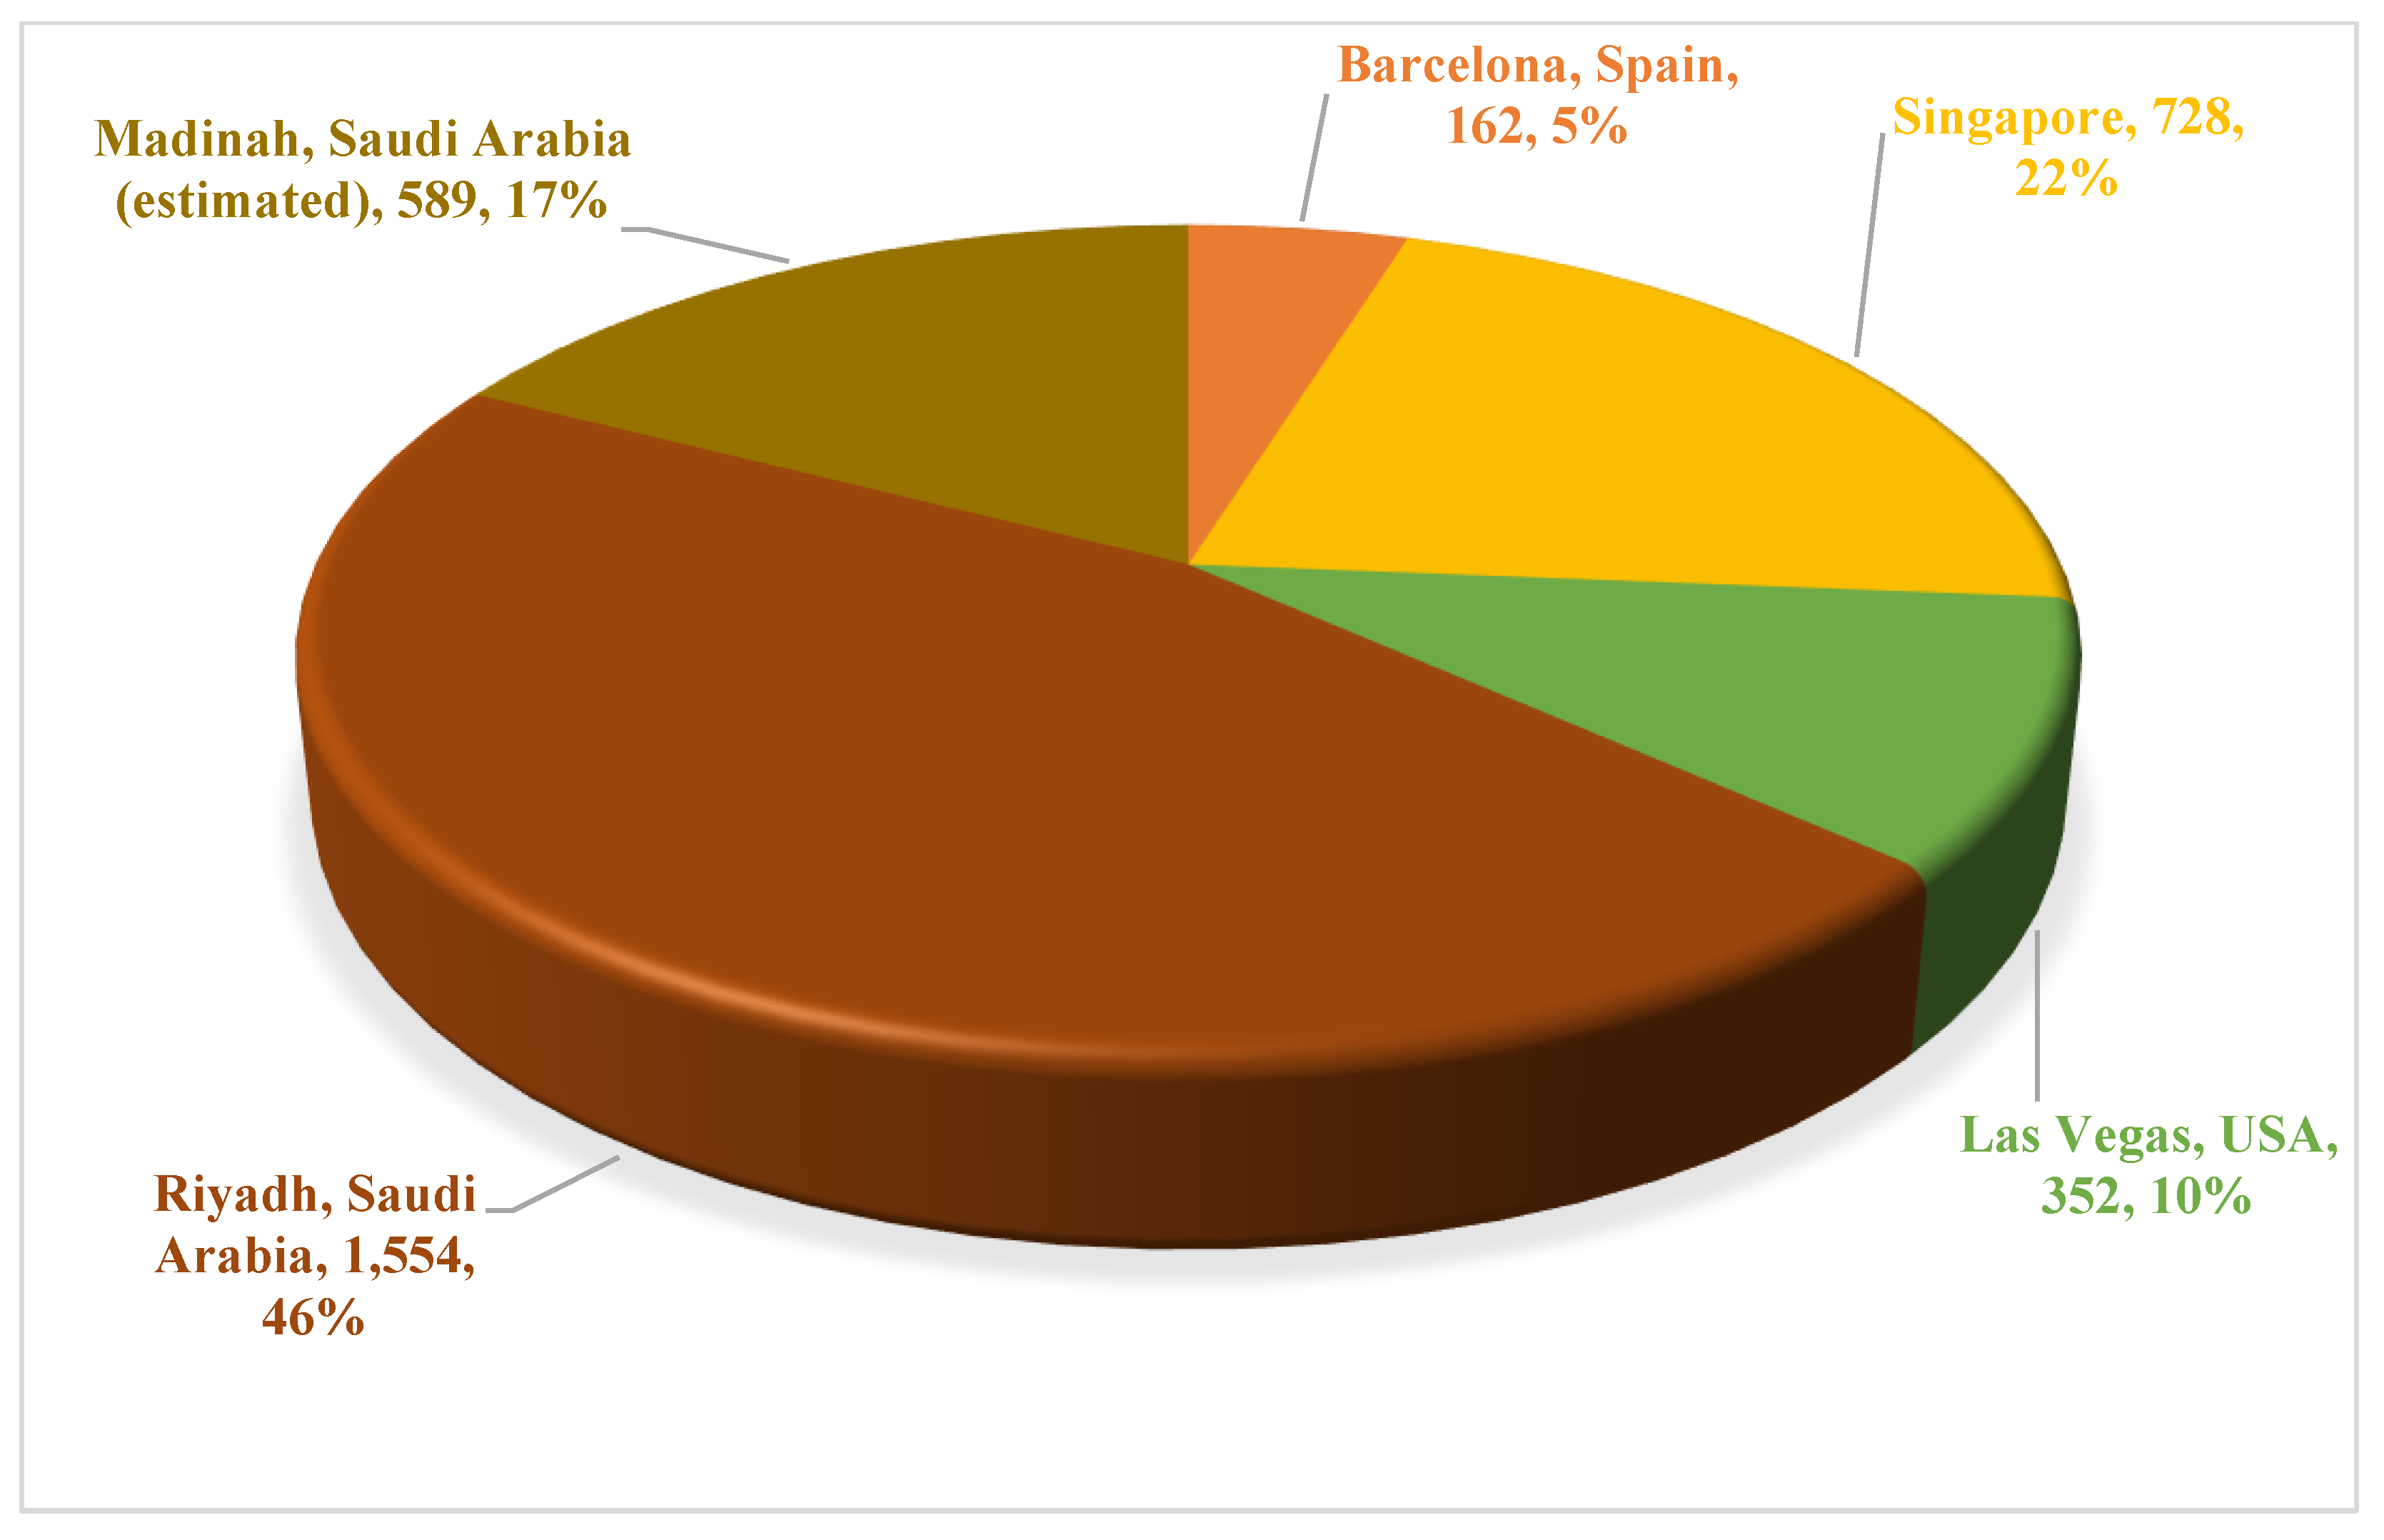
| City | Cost (USD) | Size (km²) | Beneficiaries |
|---|---|---|---|
| Barcelona, Spain [50,51,52,53] | 24 million | 162 | 5 million |
| Singapore | 12 million | 728 | 5.7 million |
| Las Vegas, USA | 12 million | 352 | 2.2 million |
| Riyadh, Saudi Arabia | 20 million | 1554 | 7.6 million |
| Melbourne, Australia [54,55,56,57] | 16 million | 9990 | 5 million |
| Madinah, Saudi Arabia (estimated) | 10–20 million | Approx 589 | Approx 1.3 million |
| Pros |
| 1. Improved data accuracy and real-time monitoring |
| 2. Better decision-making through predictive analytics |
| 3. Increased efficiency and productivity |
| Cons |
| 1. High initial cost of implementation |
| 2. Potential for system failure or malfunction |
| 3. Risk of a data breach or cyber attack |
| Impact | Short-Term | Long-Term |
|---|---|---|
| Improved tracking of water usage and loss | Short-term reduced water wastage and increased efficiency | Improved water resource management and conservation for sustainability |
| Reduced water wastage and increased efficiency | Improved customer satisfaction and trust | |
| Enhanced ability to identify and rectify system inefficiencies | Improved water quality and safety | |
Disclaimer/Publisher’s Note: The statements, opinions and data contained in all publications are solely those of the individual author(s) and contributor(s) and not of MDPI and/or the editor(s). MDPI and/or the editor(s) disclaim responsibility for any injury to people or property resulting from any ideas, methods, instructions or products referred to in the content. |
© 2023 by the authors. Licensee MDPI, Basel, Switzerland. This article is an open access article distributed under the terms and conditions of the Creative Commons Attribution (CC BY) license (https://creativecommons.org/licenses/by/4.0/).
Share and Cite
Naqash, M.T.; Syed, T.A.; Alqahtani, S.S.; Siddiqui, M.S.; Alzahrani, A.; Nauman, M. A Blockchain Based Framework for Efficient Water Management and Leakage Detection in Urban Areas. Urban Sci. 2023, 7, 99. https://doi.org/10.3390/urbansci7040099
Naqash MT, Syed TA, Alqahtani SS, Siddiqui MS, Alzahrani A, Nauman M. A Blockchain Based Framework for Efficient Water Management and Leakage Detection in Urban Areas. Urban Science. 2023; 7(4):99. https://doi.org/10.3390/urbansci7040099
Chicago/Turabian StyleNaqash, Muhammad Tayyab, Toqeer Ali Syed, Saad Said Alqahtani, Muhammad Shoaib Siddiqui, Ali Alzahrani, and Muhammad Nauman. 2023. "A Blockchain Based Framework for Efficient Water Management and Leakage Detection in Urban Areas" Urban Science 7, no. 4: 99. https://doi.org/10.3390/urbansci7040099