

Prediction of the Subgrade Soil California Bearing Ratio Using Machine Learning and Neuro-Fuzzy Inference System Techniques: A Sustainable Approach in Urban Infrastructure Development

 , , , and
Abstract
:1. Introduction
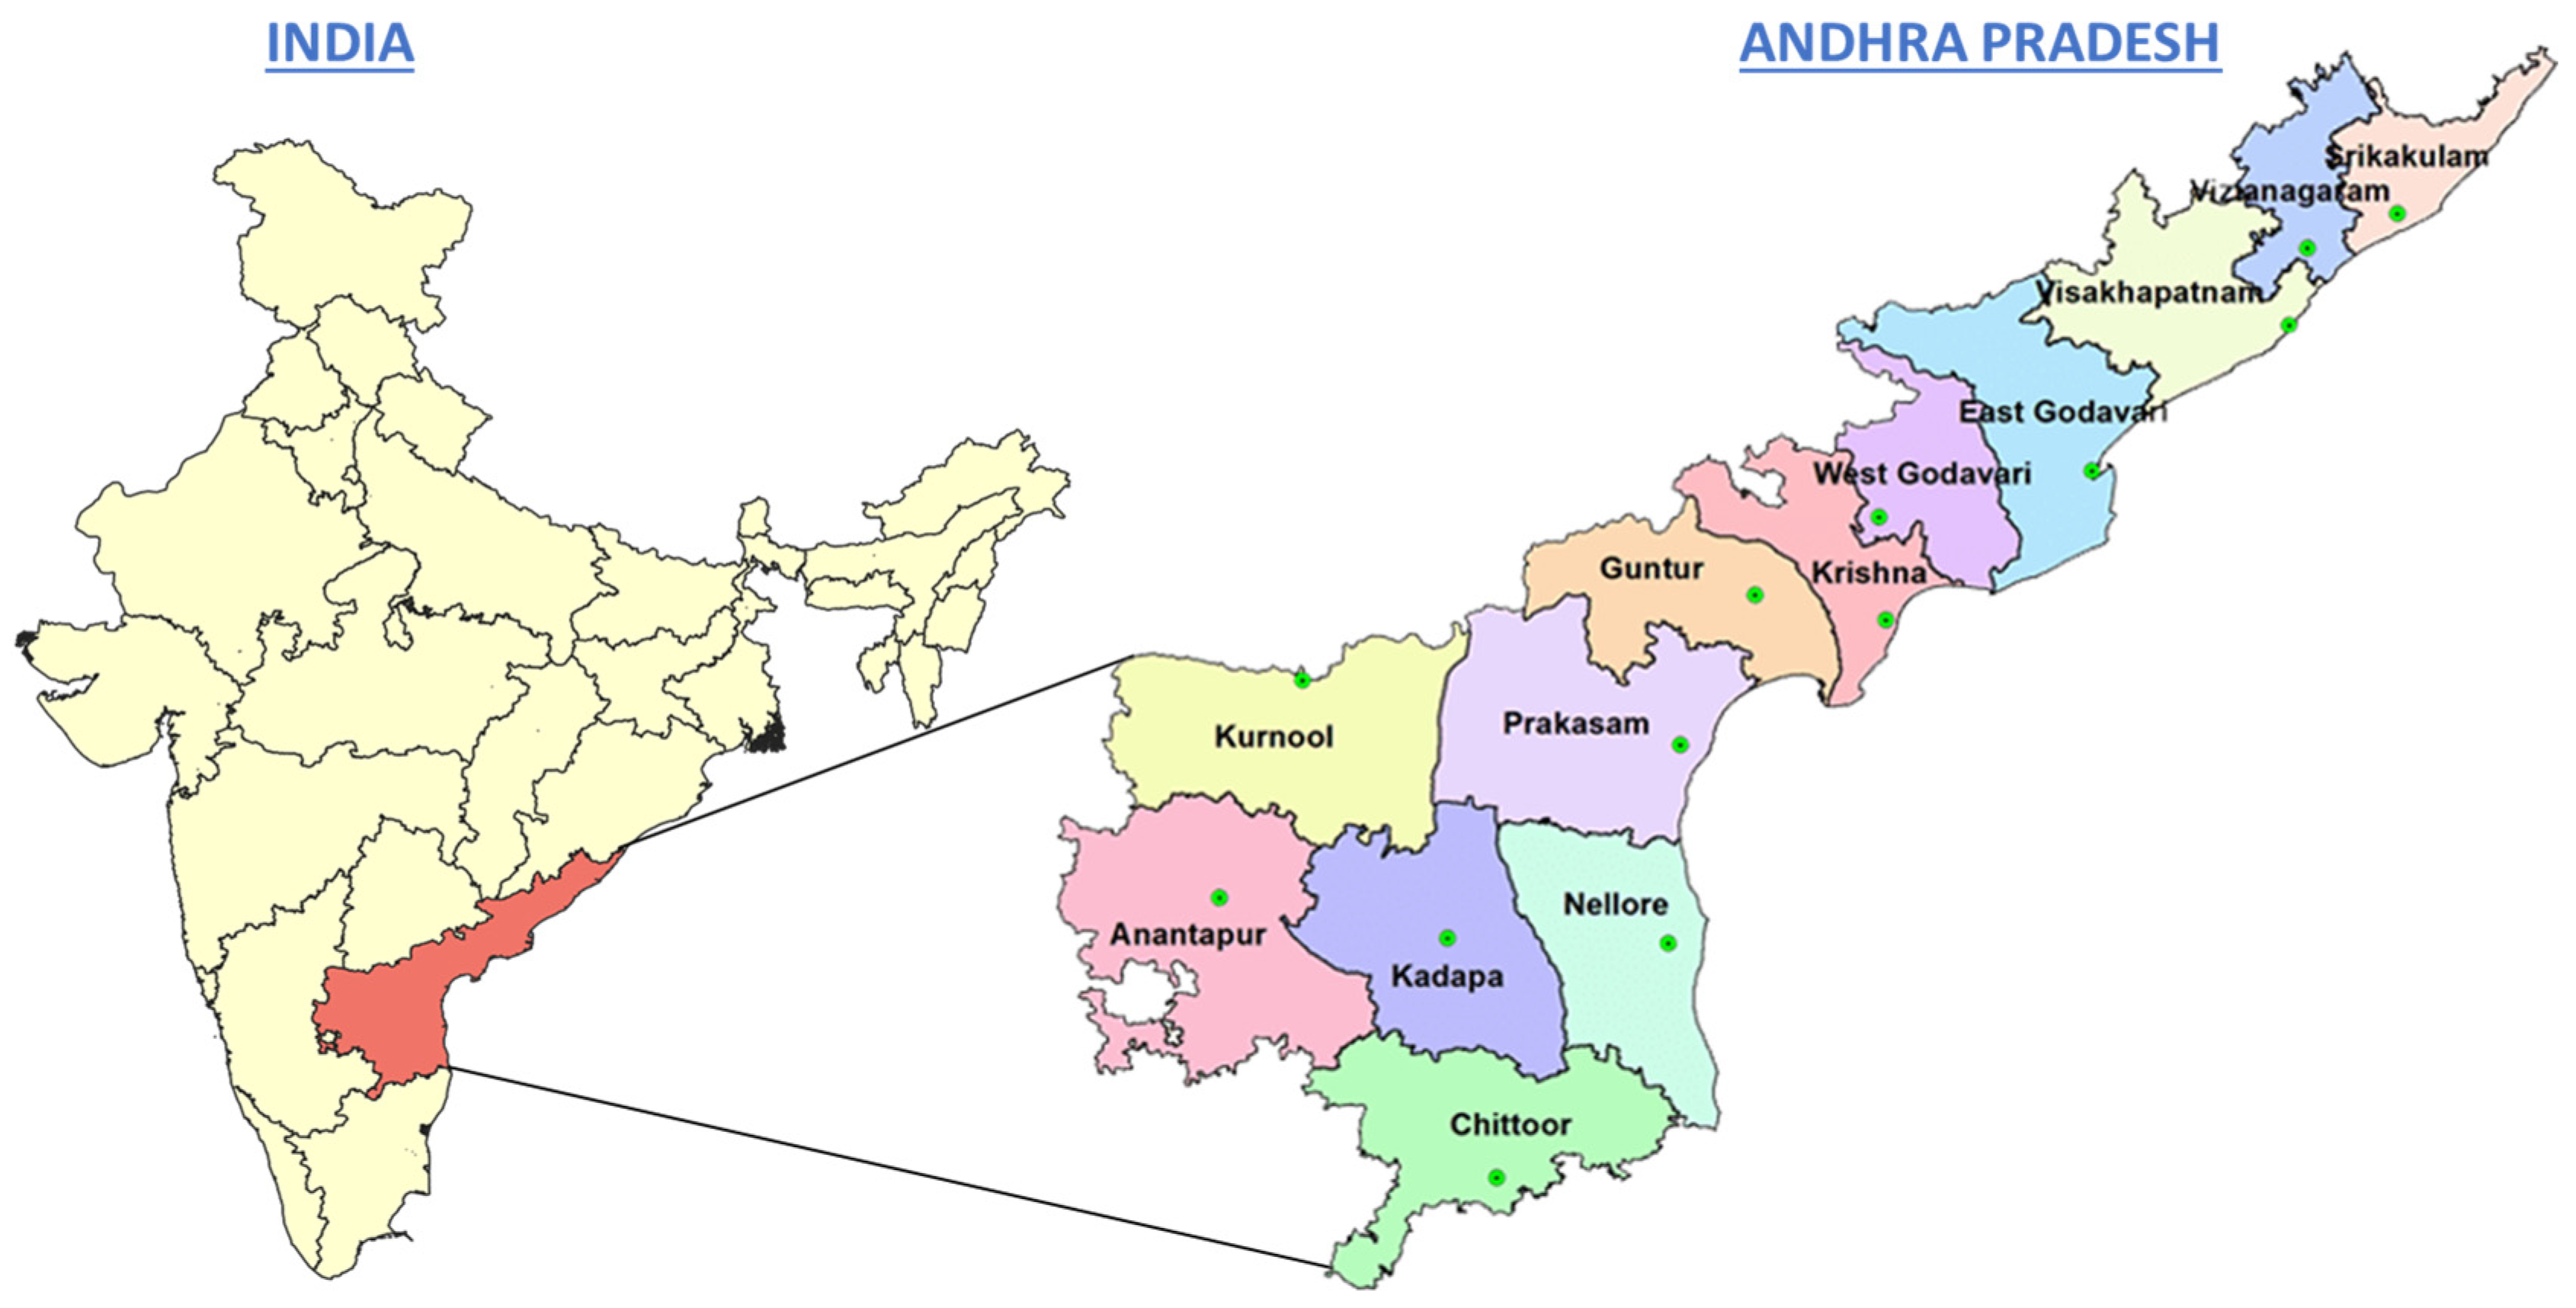
2. Soil Database and Laboratory Testing
3. Data Analysis
3.1. MLR Analysis
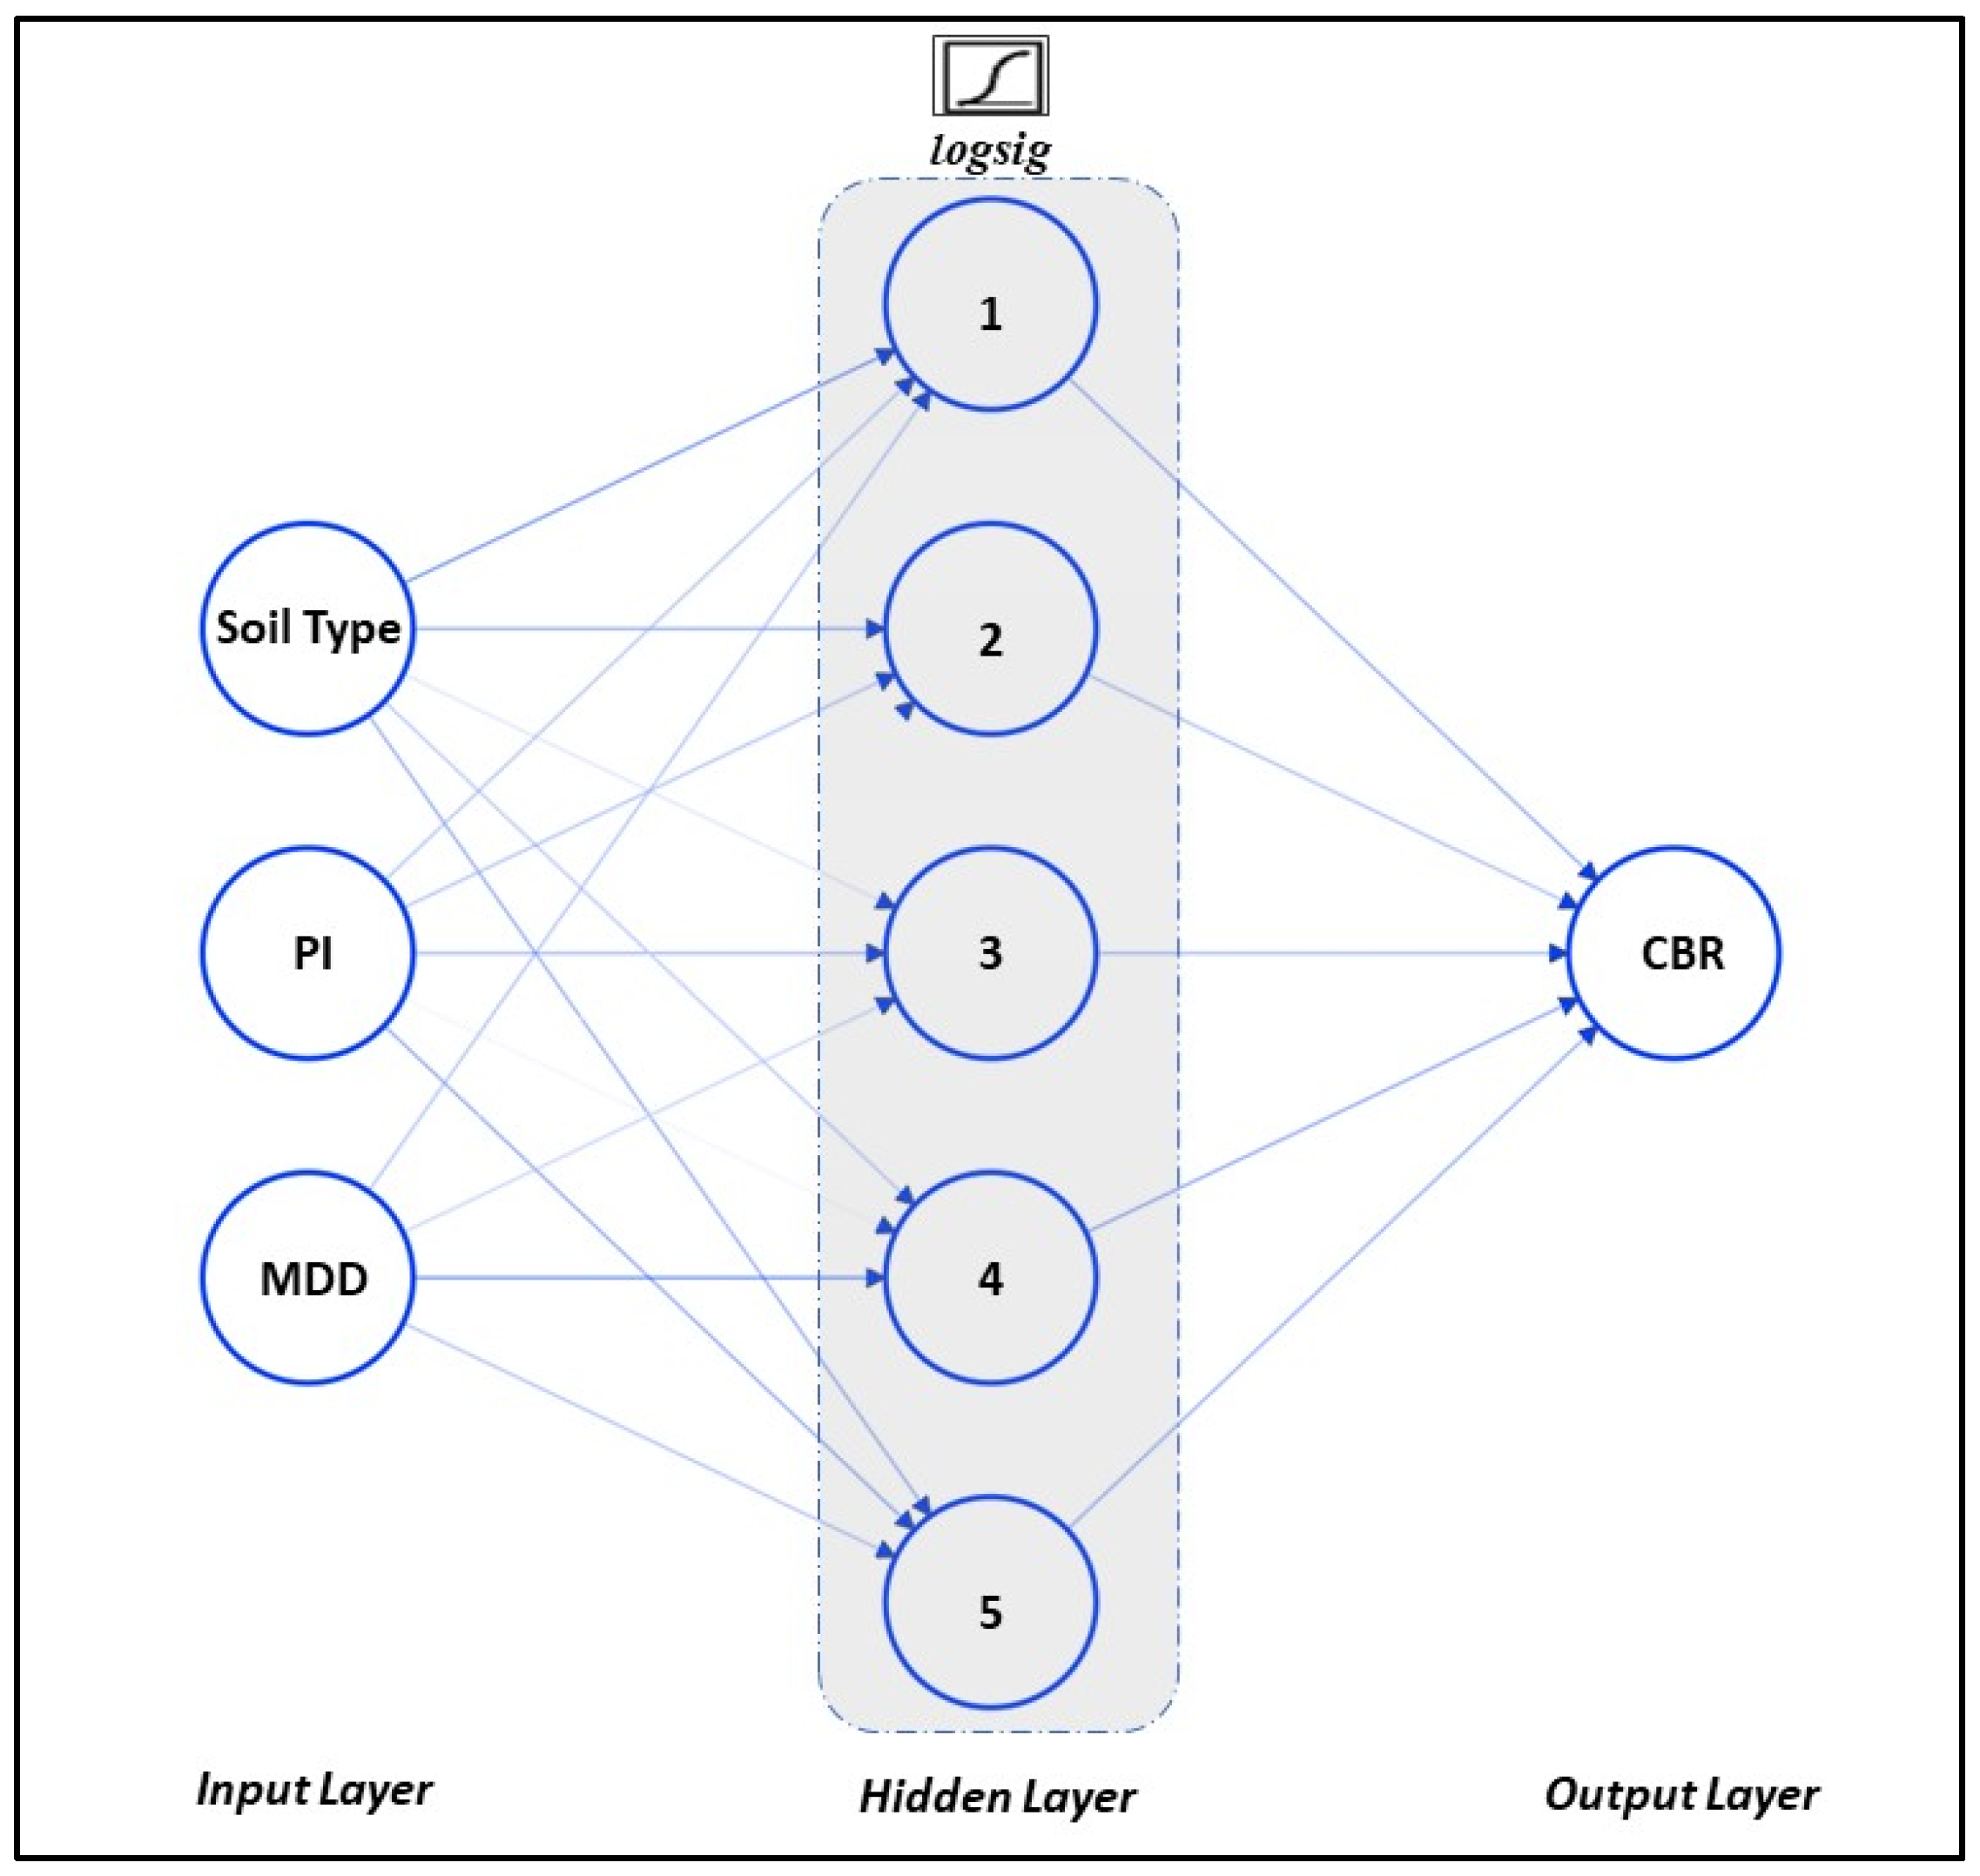
3.2. Artificial Neural Network
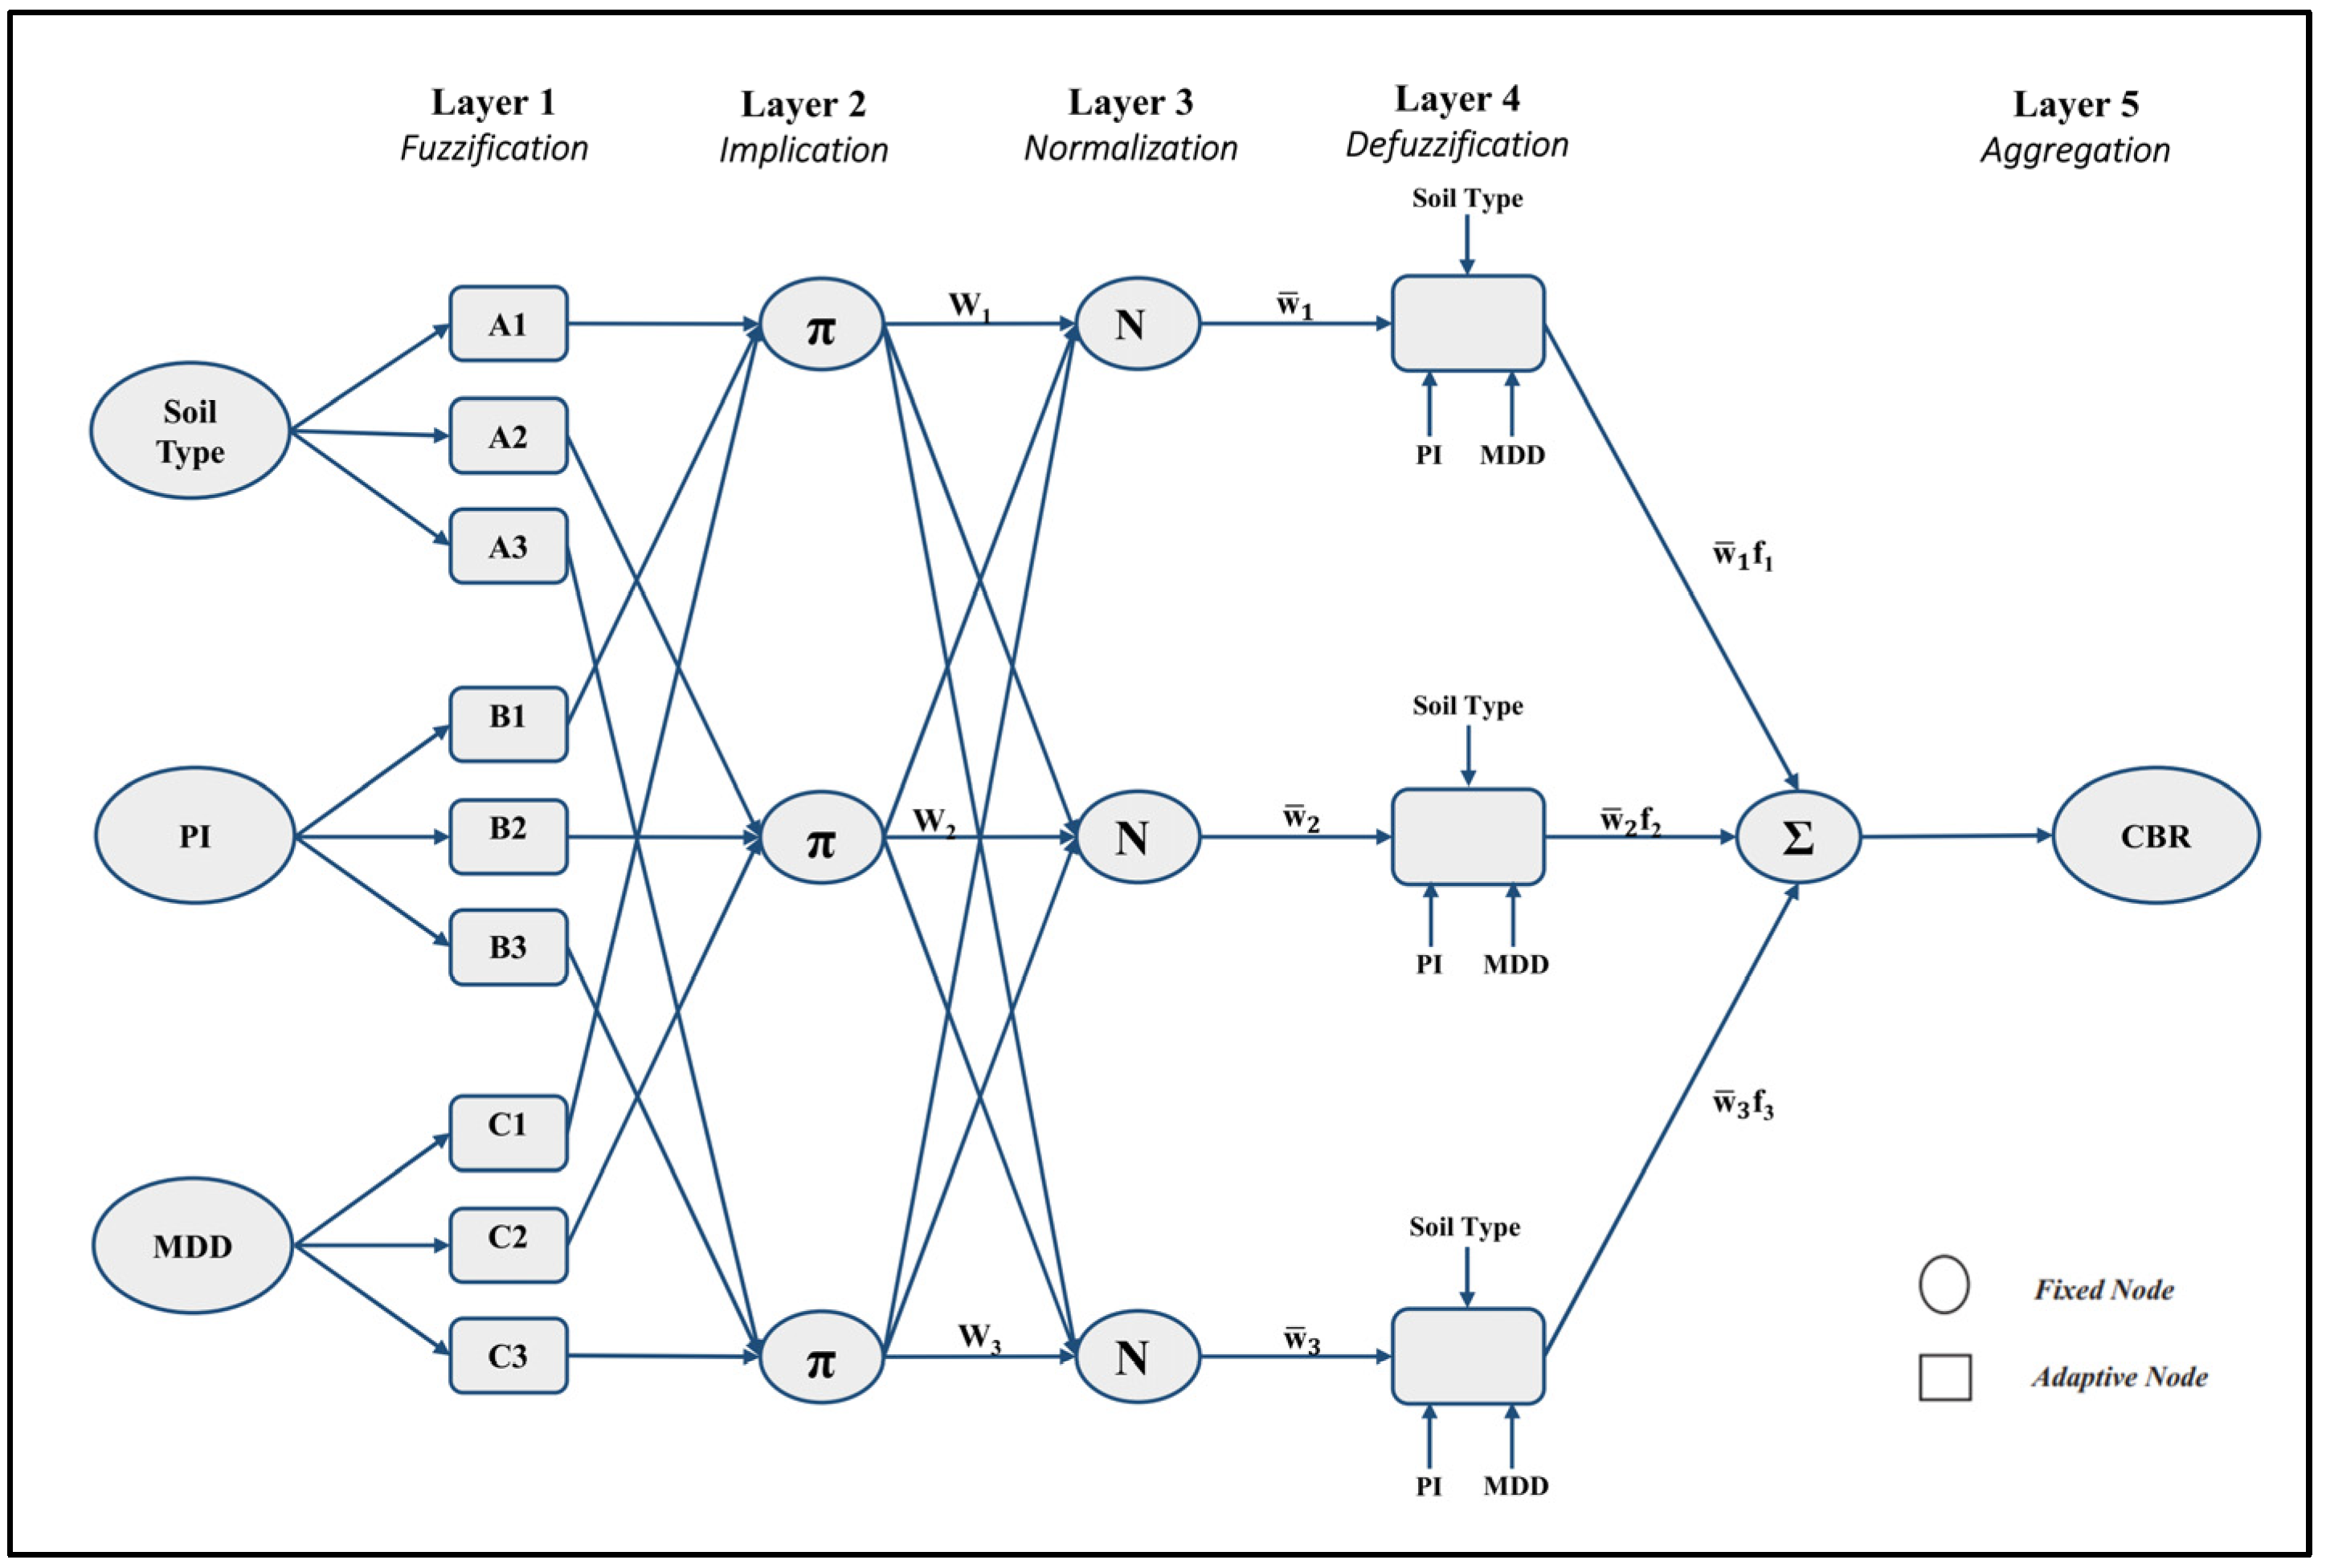
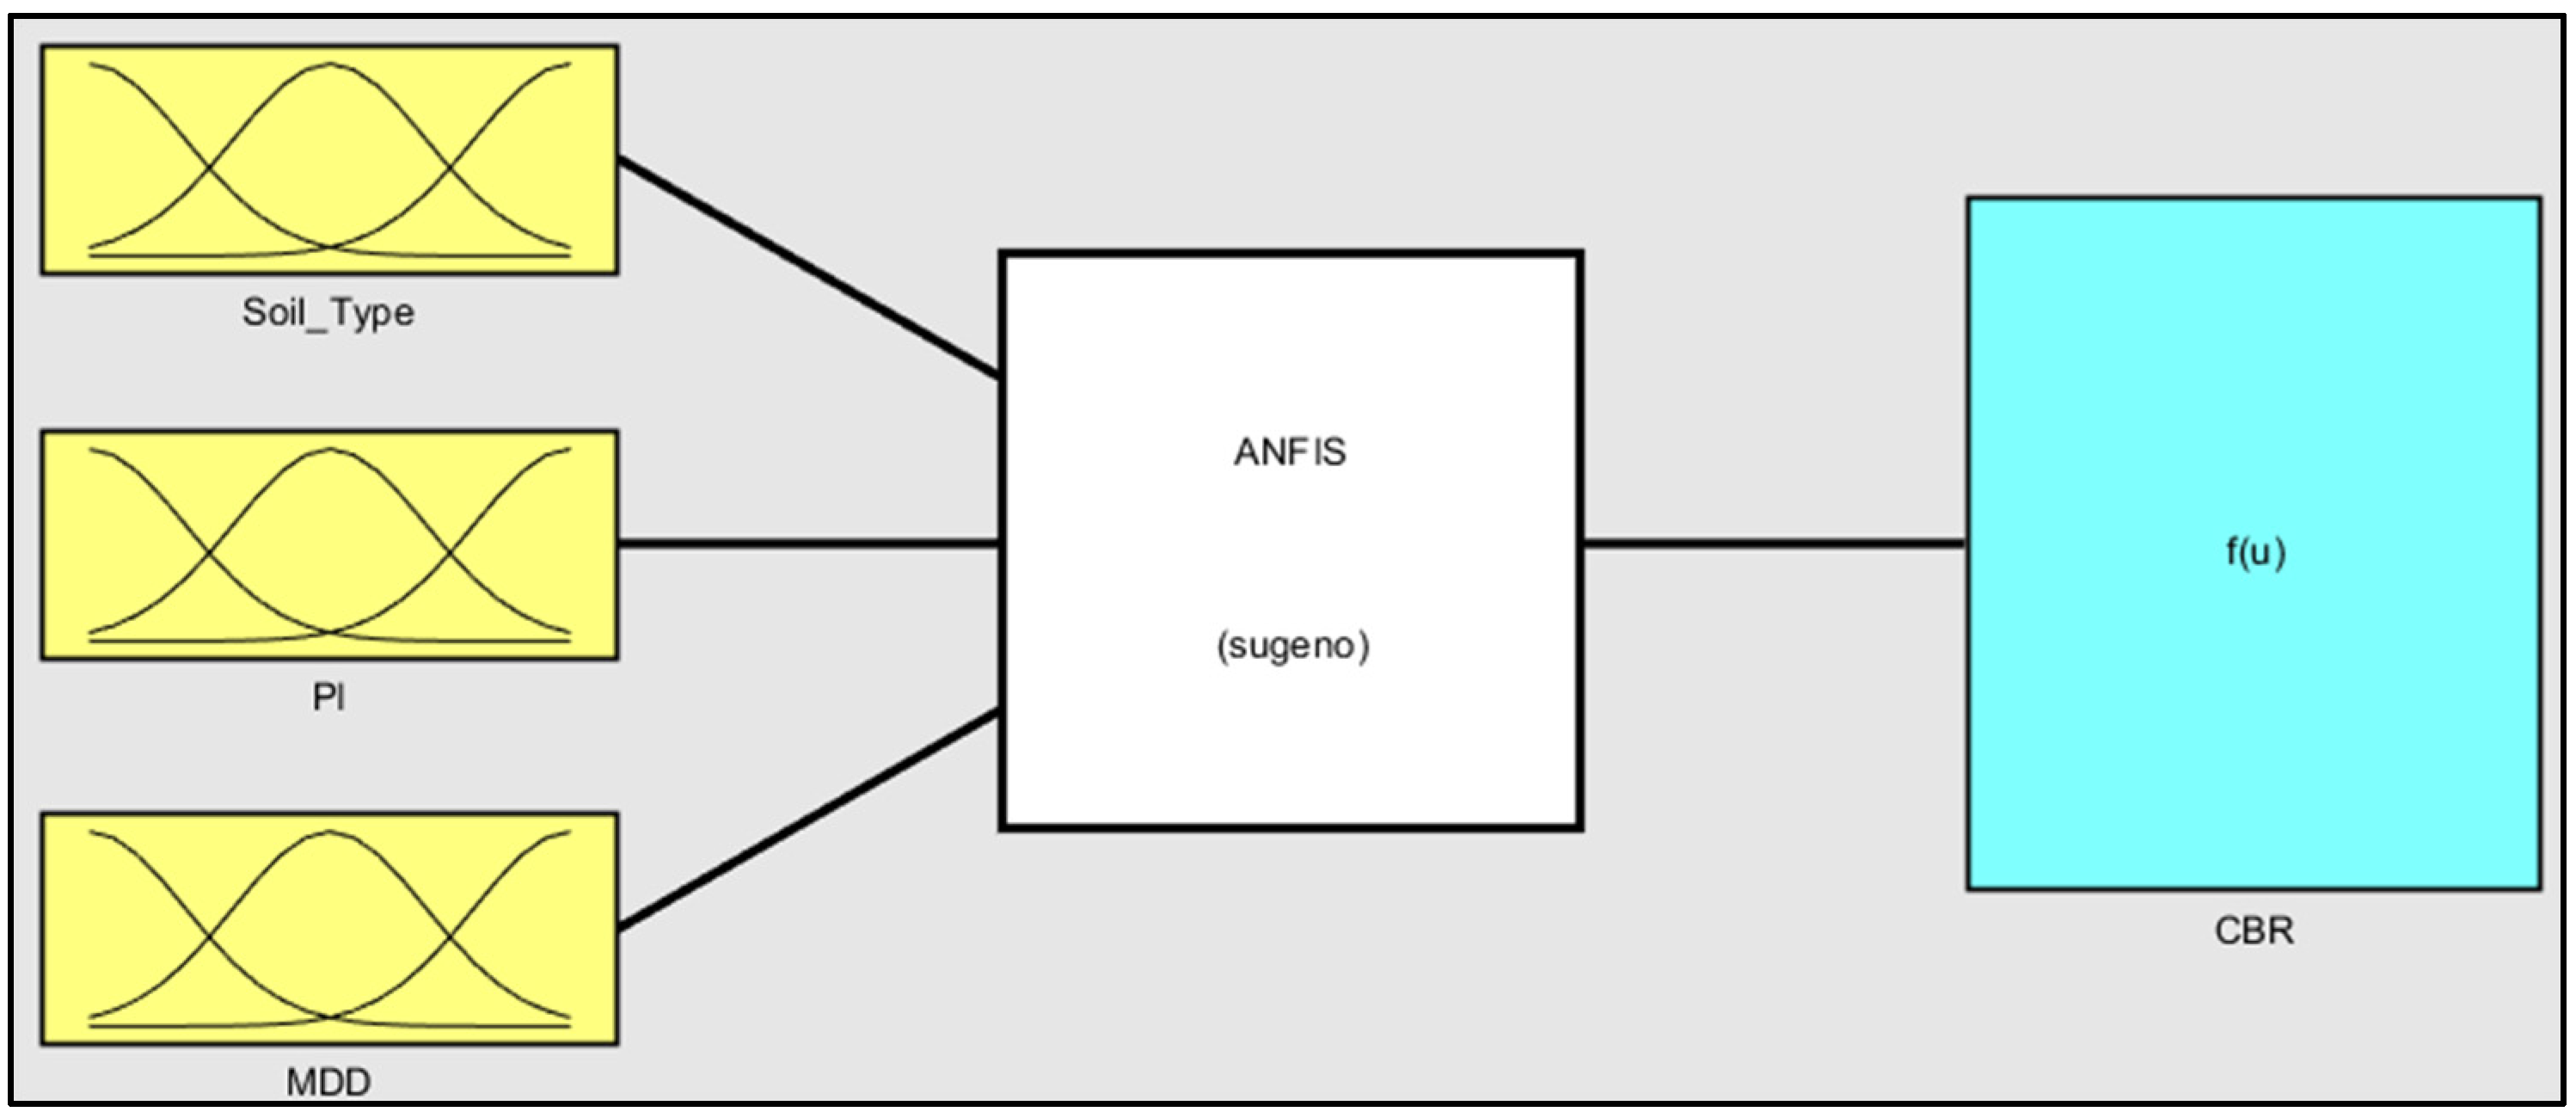
3.3. Adaptive Neuro-Fuzzy Inference System (ANFIS)
3.4. Performance Criteria
4. Results and Discussion
4.1. MLRA Results
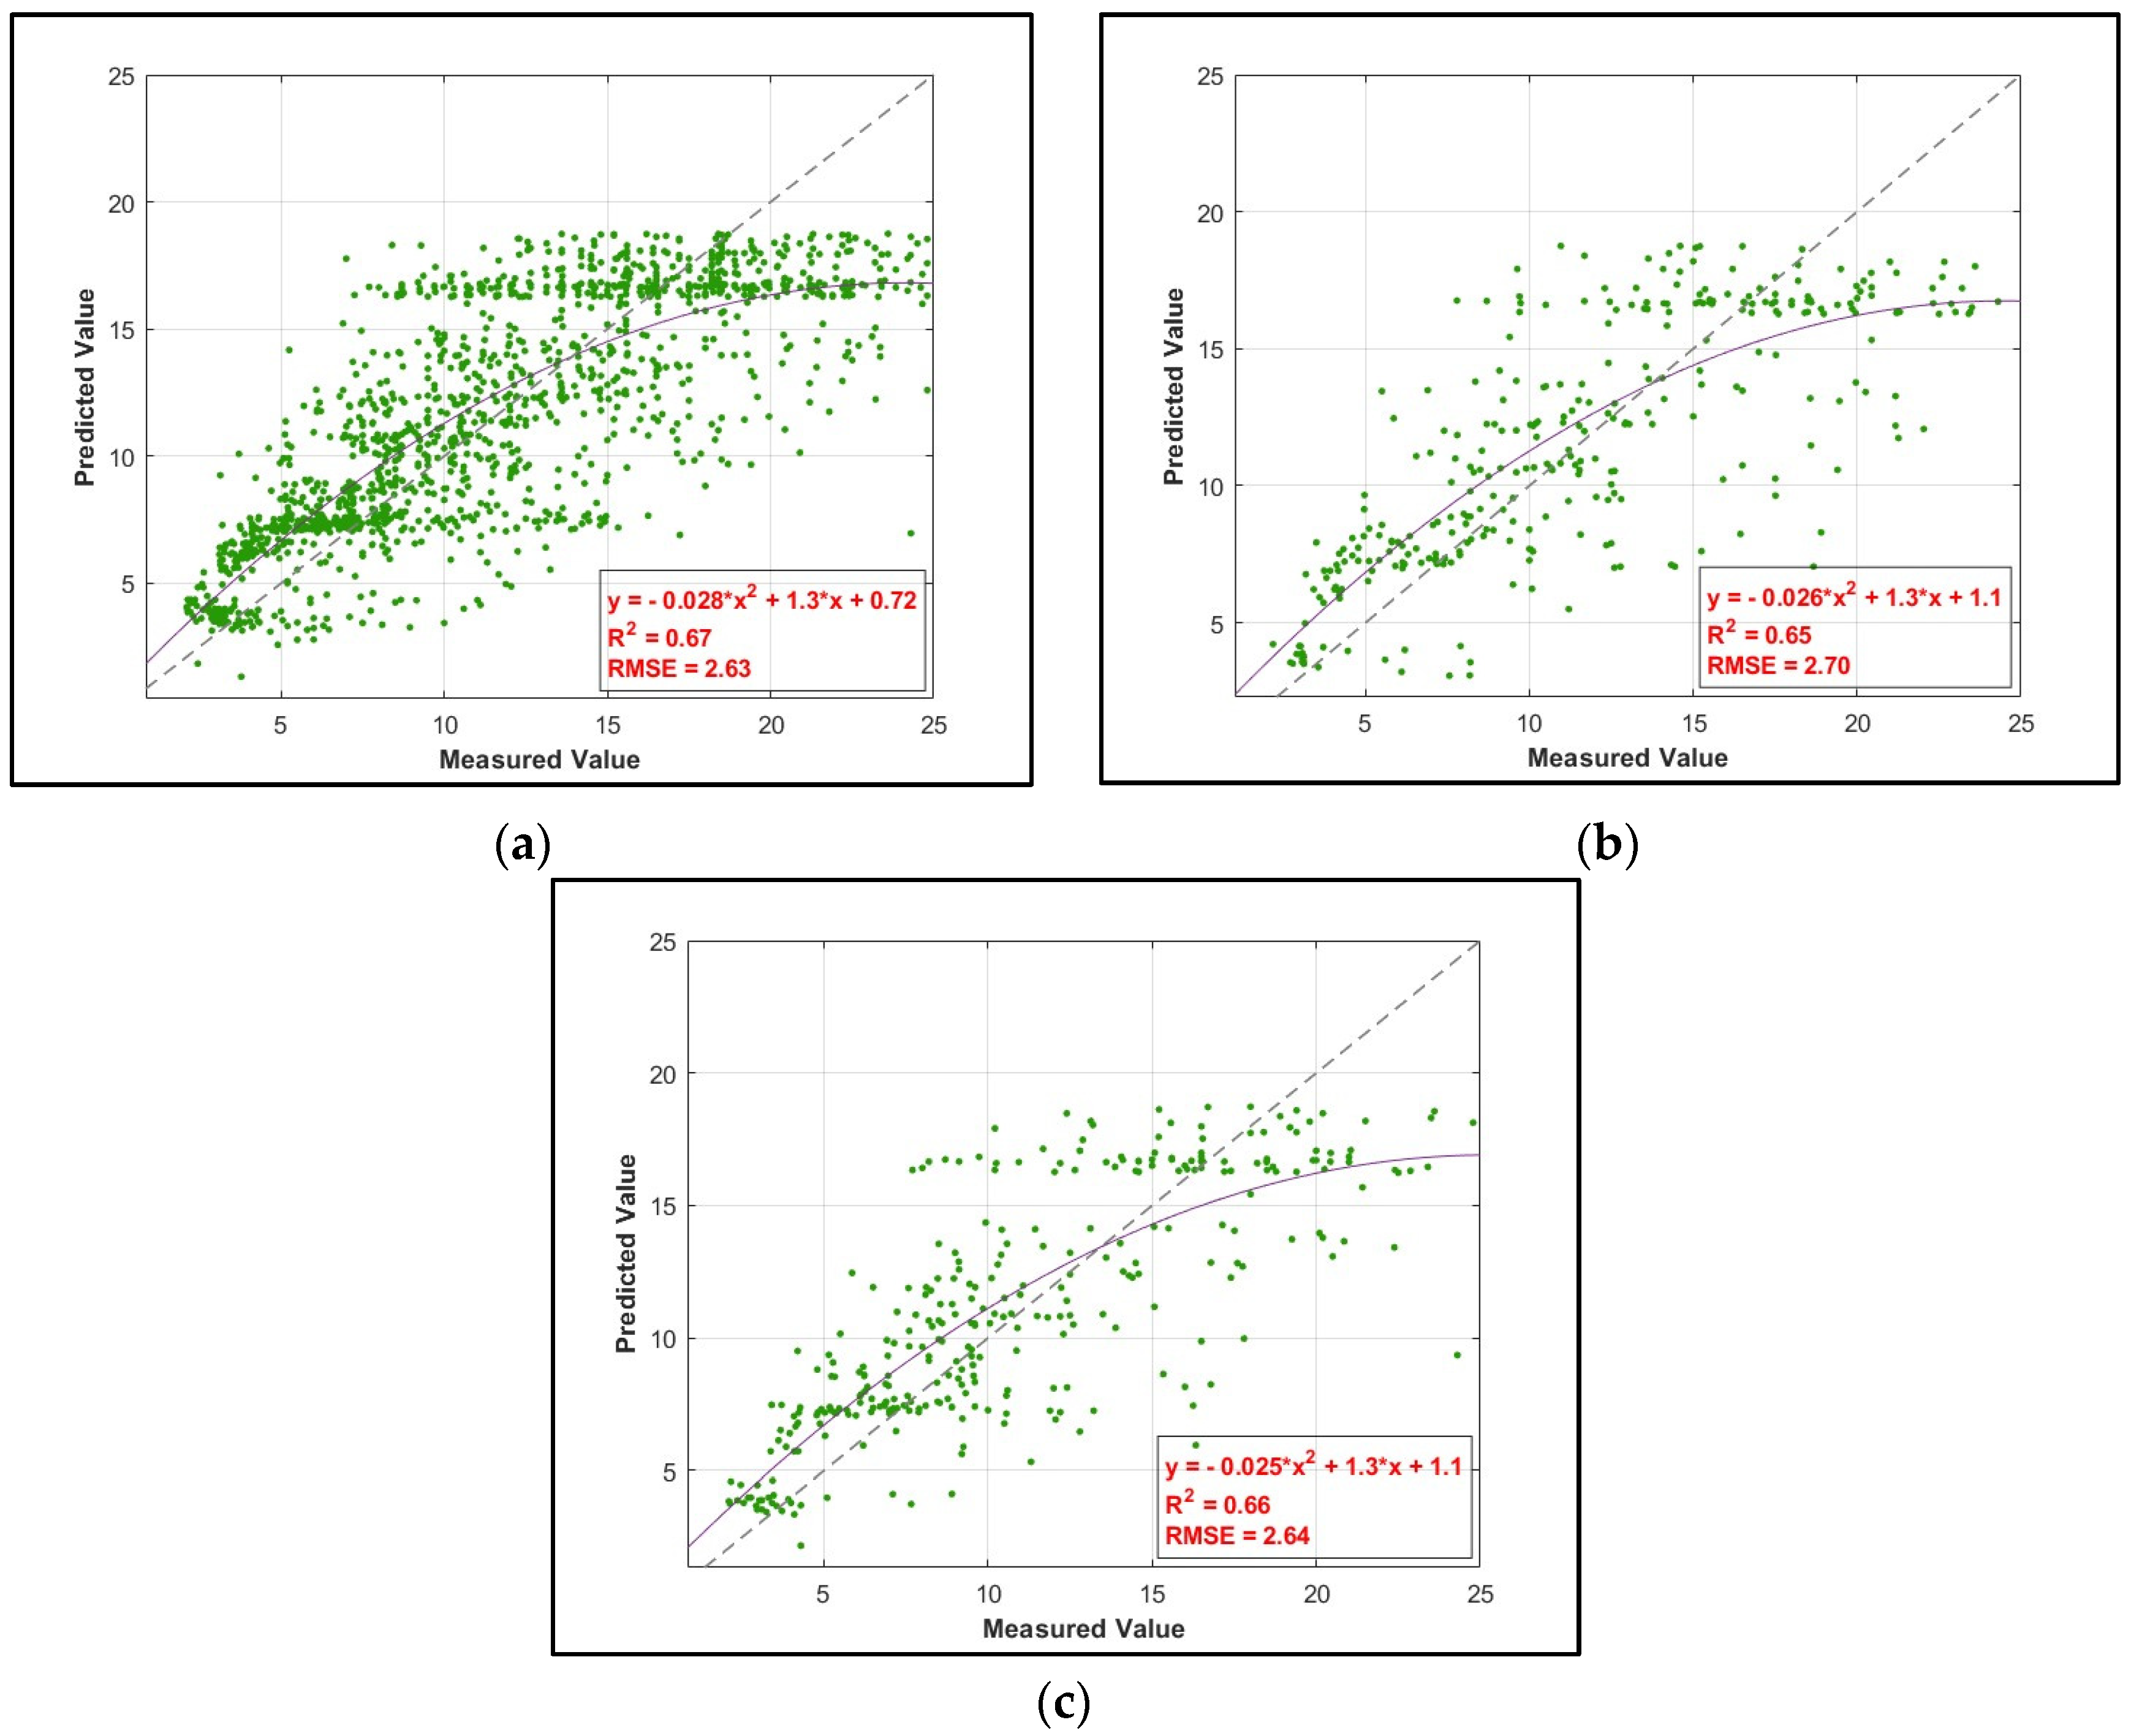
4.2. ANN Results
4.3. ANFIS Results
4.4. Sensitivity Analysis
5. Conclusions
Author Contributions
Funding
Data Availability Statement
Conflicts of Interest
References
- United Nations. The World’s Cities in 2018; United Nations, Department of Economic and Social Affairs, Population Division: San Franciso, CA, USA, 2018. [Google Scholar]
- Bulkeley, H.; Betsill, M. Rethinking sustainable cities: Multilevel governance and the ‘urban’ politics of climate change. Environ. Politics 2005, 14, 42–63. [Google Scholar] [CrossRef]
- Beatley, T. Green Urbanism: Learning from European Cities; Island Press: Washington, DC, USA, 2000. [Google Scholar]
- Kennedy, C.; Cuddihy, J.; Engel-Yan, J. The changing metabolism of cities. J. Ind. Ecol. 2007, 11, 43–59. [Google Scholar] [CrossRef]
- California Department of Transportation. California Bearing Ratio (CBR) Test Procedure; California Department of Transportation: Sacramento, CA, USA, 2019.
- Irwin, L.H. The Pressuremeter and Foundation Engineering; Elsevier Science & Technology: Amsterdam, The Netherlands, 2007. [Google Scholar]
- Farrar, M.J.; Al-Taher, A.H.; Wood, R.M. Comparison of Clegg Impact Test and California Bearing Ratio for Subgrade Strength. Geotech. Geol. Eng. 2013, 31, 1191–1201. [Google Scholar]
- Bharti, G.; Hurukadli, P.; Shukla, B.K.; Sihag, P.; Jagudi, S.; Tripathi, A. Environmental impact analysis and utilization of copper slag for stabilising black cotton soil. Mater. Today Proc. 2023, in press. [Google Scholar] [CrossRef]
- Arya, P.; Patel, S.B.; Bharti, G.; Shukla, B.K.; Hurukadli, P. Impact of using a blend of bagasse ash and polyester fiber in black cotton soil for improvement of mechanical and geotechnical properties of soil. Mater. Today Proc. 2023, 78, 738–743. [Google Scholar] [CrossRef]
- Vichare, P.; Deo, M. Soft computing approach for soil classification and its impact on the bearing capacity of soil. In Soft Computing for Problem Solving; Springer: Singapore, 2016; pp. 611–620. [Google Scholar]
- Mair, P.; Wilcox, R.; Degeneffe, D. Predicting California Bearing Ratio (CBR) of Fine-Grained Soils for Airfields Using the DCP. Geotech. Geol. Eng. 2016, 34, 835–848. [Google Scholar]
- Jordan, M.I.; Mitchell, T.M. Machine learning: Trends, perspectives, and prospects. Science 2015, 349, 255–260. [Google Scholar] [CrossRef] [PubMed]
- Taillard, E.; Waelti, P.; Zufferey, N. An efficient simulated annealing procedure for the fleet size and mix vehicle routing problem with time windows. Transp. Sci. 2007, 41, 206–218. [Google Scholar]
- Pickett, S.T.; Cadenasso, M.L.; McGrath, B.P. (Eds.) Resilience in Ecology and Urban Design: Linking Theory and Practice for Sustainable Cities; Springer Science & Business Media: Berlin/Heidelberg, Germany, 2013. [Google Scholar]
- Erzin, Y.; Turkoz, D. Use of neural networks for the prediction of the CBR value of some Aegean sands. Neural Comput. Appl. 2016, 27, 1415–1426. [Google Scholar] [CrossRef]
- Chao, Z.; Ma, G.; Zhang, Y.; Zhu, Y.; Hu, H. The application of artificial neural network in geotechnical engineering. In IOP Conference Series: Earth and Environmental Science; IOP Publishing: Bristol, UK, 2018; Volume 189, p. 022054. [Google Scholar]
- Ghorbani, A.; Hasanzadehshooiili, H. Prediction of UCS and CBR of microsilica-lime stabilized sulfate silty sand using ANN and EPR models; application to the deep soil mixing. Soils Found. 2018, 58, 34–49. [Google Scholar] [CrossRef]
- Ikeagwuani, C.C. Estimation of modified expansive soil CBR with multivariate adaptive regression splines, random forest and gradient boosting machine. Innov. Infrastruct. Solut. 2021, 6, 199. [Google Scholar] [CrossRef]
- Bakri, M.; Aldhari, I.; Alfawzan, M.S. Prediction of California Bearing Ratio of Granular Soil by Multivariate Regression and Gene Expression Programming. Adv. Civ. Eng. 2022, 2022, 7426962. [Google Scholar] [CrossRef]
- Kelleher, J.D.; Mac Namee, B.; D’Arcy, A. Fundamentals of Machine Learning for Predictive Data Analytics: Algorithms, Worked Examples, and Case Studies; MIT Press: Cambridge, MA, USA, 2015. [Google Scholar]
- Vapnik, V. The Nature of Statistical Learning Theory; Springer Science & Business Media: Berlin/Heidelberg, Germany, 2013. [Google Scholar]
- Coduto, D.P.; Yeung, M.R.; Kitch, W.A. Geotechnical Engineering: Principles & Practices; Pearson: London, UK, 2020. [Google Scholar]
- Burton, E. The use of urban resources for adaptation to climate change. Local Environ. 2010, 15, 591–603. [Google Scholar]
- Taskiran, T. Prediction of California bearing ratio (CBR) of fine grained soils by AI methods. Adv. Eng. Softw. 2010, 41, 886–892. [Google Scholar] [CrossRef]
- Yildirim, B.; Gunaydin, O. Estimation of California bearing ratio by using soft computing systems. Expert Syst. Appl. 2011, 38, 6381–6391. [Google Scholar] [CrossRef]
- Suthar, M.; Aggarwal, P. Predicting CBR value of stabilized pond ash with lime and lime sludge using ANN and MR models. Int. J. Geosynth. Ground Eng. 2018, 4, 6. [Google Scholar] [CrossRef]
- Kurnaz, T.F.; Kaya, Y. Prediction of the California bearing ratio (CBR) of compacted soils by using GMDH-type neural network. Eur. Phys. J. Plus 2019, 134, 326. [Google Scholar] [CrossRef]
- Taha, S.; Gabr, A.; El-Badawy, S. Regression and neural network models for California bearing ratio prediction of typical granular materials in Egypt. Arab. J. Sci. Eng. 2019, 44, 8691–8705. [Google Scholar] [CrossRef]
- Al-Busultan, S.; Aswed, G.K.; Almuhanna, R.R.; Rasheed, S.E. Application of artificial neural networks in predicting subbase CBR values using soil indices data. In IOP Conference Series: Materials Science and Engineering; IOP Publishing: Bristol, UK, 2020; Volume 671, p. 012106. [Google Scholar]
- Iqbal, M.; Onyelowe, K.C.; Jalal, F.E. Smart computing models of California bearing ratio, unconfined compressive strength, and resistance value of activated ash-modified soft clay soil with adaptive neuro-fuzzy inference system and ensemble random forest regression techniques. Multiscale Multidiscip. Model. Exp. Des. 2021, 4, 207–225. [Google Scholar] [CrossRef]
- Varol, T.; Ozel, H.B.; Ertugrul, M.; Emir, T.; Tunay, M.; Cetin, M.; Sevik, H. Prediction of soil-bearing capacity on forest roads by statistical approaches. Environ. Monit. Assess. 2021, 193, 1–13. [Google Scholar] [CrossRef]
- Nagaraju, T.V.; Bahrami, A.; Prasad, C.D.; Mantena, S.; Biswal, M.; Islam, R. Predicting California Bearing Ratio of Lateritic Soils Using Hybrid Machine Learning Technique. Buildings 2023, 13, 255. [Google Scholar] [CrossRef]
- Duan, H.; Li, W. Research on urban resource circulation and urban sustainable development. Procedia Environ. Sci. 2011, 5, 193–200. [Google Scholar]
- ASTM D1883-15; Standard Test Method for California Bearing Ratio (CBR) of Laboratory-Compacted Soils. ASTM International: West Conshohocken, PA, USA, 2016.
- ASTM D4318-10; Standard Test Methods for Liquid Limit, Plastic Limit, and Plasticity Index of Soils. ASTM International: West Conshohocken, PA, USA, 2015.
- ASTM D4253-14; Standard Test Method for Maximum Index Density and Unit Weight of Soils Using a Vibratory Table. ASTM International: West Conshohocken, PA, USA, 2015.
- Gunaydin, O.; Gokoglu, A.; Fener, M. Prediction of artificial soil’s unconfined compression strength test using statistical analyses and artificial neural networks. Adv. Eng. Softw. 2010, 41, 1115–1123. [Google Scholar] [CrossRef]
- Jang, J.-S.R. ANFIS: Adaptive-network-based fuzzy inference system. IEEE Trans. Syst. Man Cybern. 1993, 23, 665–685. [Google Scholar] [CrossRef]
- Xiao, S.; Lu, Z.; Xu, L. Multivariate sensitivity analysis based on the direction of eigenspace through principal component analysis. Reliab. Eng. Syst. Saf. 2017, 165, 1–10. [Google Scholar] [CrossRef]
- National Cooperative Highway Research Program (NCHRP). Guide for Mechanistic and Empirical-Design for New and Rehabilitated Pavement Structures, Final Document; Appendix CC-1: Correlation of CBR Values with Soil Index Properties; Ara, Inc.: Champaign, IL, USA, 2021. [Google Scholar]
- Bassey, O.B.; Attah, I.C.; Ambrose, E.E.; Etim, R.K. Correlation between CBR Values and Index Properties of Soils: A Case Study of Ibiono, Oron, and Onna in Akwa Ibom State. Resour. Environ. 2017, 7, 94–102. [Google Scholar]


| Methodology Used | Input Parameters Considered | No. of Samples | R2 | Ref. |
|---|---|---|---|---|
| GP | OMC, MDD, S, G, LL, and PI | 151 | 0.92 | [24] |
| MLRA ANN | Sieve analysis, Atterberg limits, MDD, and OMC. | 124 | 0.88 0.95 | [25] |
| ANN | OMC, MDD, L, and LS | 51 | 0.84 | [26] |
| GMDH | Gravel content (GC), Sand content (SC), Fine content (FC), LL, PI, OMC, and MDD | 158 | 0.96 | [27] |
| MLRA ANN | D60 and MDD | 207 | 0.93 0.97 | [28] |
| ANN | Gradation, OMC, MDD, LL, PI, and percentages of SO3, Soluble salt, Gypsum, and Organic materials. | 358 | 0.78 | [29] |
| ERF ANFIS | Hydrated lime-activated rice husk ash, LL, PL, PI, OMC, MDD, and Clay activity. | 121 | 1.00 0.99 | [30] |
| MLRA ANN ANFIS | LL, PL, PI, S, G, C/Si, MDD, and OMC | 264 | 0.80 0.90 0.98 | [31] |
| ELM-CSO | Gravel %, Sand %, Fines %, LL, PL, OMC, and MDD. | 149 | 0.90 | [32] |
| Particulars | Test Codes | Mean | Standard Deviation | Sample Variance | Kurtosis | Skewness | Minimum | Maximum |
|---|---|---|---|---|---|---|---|---|
| PI | ASTM D4318-00 | 10.80 | 9.37 | 87.82 | −0.68 | 0.44 | 0 | 39 |
| MDD | ASTM D698 | 1.91 | 0.16 | 0.02 | −0.16 | −0.30 | 1.5 | 2.31 |
| CBR | ASTM D1883-16 | 11.48 | 5.77 | 33.33 | −0.68 | 0.44 | 2.11 | 27.4 |
| Sample No | Soil Type | Soil Description | Encoded to | PI (%) | MDD (g/cc) | CBR (%) |
|---|---|---|---|---|---|---|
| 1 | CI | Intermediate-Plasticity Clay | 1 | 19.00 | 1.83 | 6.40 |
| 2 | CL | Low-Plasticity Clay | 2 | 10.60 | 1.68 | 6.50 |
| 3 | GM | Silty Gravel | 3 | 9.00 | 1.88 | 10.89 |
| 4 | GP | Poorly Graded Gravel | 4 | 10.00 | 1.95 | 7.11 |
| 5 | SC | Clayey Sand | 5 | 14.00 | 1.77 | 4.05 |
| 6 | SM | Silty Sand | 6 | 26.00 | 1.98 | 11.60 |
| 7 | SP | Poorly Graded Sand | 7 | 0 | 2.11 | 17.60 |
| 8 | SW | Well-Graded Sand | 8 | 0 | 1.94 | 10.58 |
| Regression Statistics | |
|---|---|
| Multiple R | 0.67 |
| R Square | 0.45 |
| Adjusted R Square | 0.45 |
| RMSE | 4.270 |
| Observations | 2191 |
| Coefficients | Standard Error | T Stat | p-Value | |
|---|---|---|---|---|
| Intercept | 2.13 | 1.14 | 1.86 | <0.05 |
| Soil Type | 1.24 | 0.05 | 26.16 | <0.05 |
| PI | −0.25 | 0.01 | −25.39 | <0.05 |
| MDD | 2.67 | 0.63 | 4.24 | <0.05 |
| Analysis Performed | R2 Value | Root Mean Square Error (RMSE) | ||||
|---|---|---|---|---|---|---|
| Training | Testing | Validation | Training | Testing | Validation | |
| MLRA | 0.45 | 4.6 | ||||
| ANN | 0.67 | 0.65 | 0.66 | 2.63 | 2.70 | 2.64 |
| ANFIS | 0.81 | 0.82 | 0.82 | 2.26 | 2.29 | 2.23 |
| Soil Type | Encoded To | PI, % | MDD, g/cc | Actual CBR, % | Predicted CBR, % | ||
|---|---|---|---|---|---|---|---|
| MLRA Output | ANN Output | ANFIS Output | |||||
| SP | 7.00 | 0.00 | 2.11 | 17.60 | 15.96 | 16.52 | 16.45 |
| SC | 5.00 | 11.70 | 1.47 | 10.43 | 11.40 | 8.59 | 9.75 |
| SM | 6.00 | 30.00 | 1.99 | 9.04 | 7.84 | 10.75 | 8.97 |
| CL | 2.00 | 10.60 | 1.68 | 6.50 | 7.15 | 6.04 | 5.67 |
| GP | 4.00 | 0.00 | 2.09 | 14.80 | 11.79 | 17.48 | 16.95 |
| GM | 3.00 | 28.00 | 2.11 | 7.09 | 3.92 | 7.93 | 6.51 |
| SW | 8.00 | 23.00 | 1.77 | 10.51 | 12.56 | 11.39 | 11.30 |
| CI | 1.00 | 19.00 | 1.83 | 6.40 | 3.60 | 2.47 | 5.99 |
| SC | 5.00 | 15.00 | 1.88 | 7.11 | 10.05 | 8.22 | 6.91 |
| CI | 1.00 | 16.00 | 1.75 | 4.13 | 4.41 | 3.56 | 5.17 |
| SW | 8.00 | 22.60 | 2.00 | 9.50 | 12.32 | 11.31 | 10.64 |
| SW | 8.00 | 12.15 | 1.93 | 11.40 | 14.83 | 11.31 | 12.85 |
| CL | 2.00 | 17.00 | 1.65 | 2.71 | 5.72 | 2.62 | 3.93 |
| GP | 4.00 | 0.00 | 1.96 | 15.50 | 11.98 | 17.77 | 16.95 |
| SM | 6.00 | 15.67 | 2.14 | 12.50 | 10.91 | 9.60 | 11.25 |
| SM | 6.00 | 19.22 | 2.02 | 10.48 | 10.27 | 9.89 | 10.50 |
| GP | 4.00 | 0.00 | 1.84 | 18.40 | 12.15 | 18.02 | 18.10 |
Disclaimer/Publisher’s Note: The statements, opinions and data contained in all publications are solely those of the individual author(s) and contributor(s) and not of MDPI and/or the editor(s). MDPI and/or the editor(s) disclaim responsibility for any injury to people or property resulting from any ideas, methods, instructions or products referred to in the content. |
© 2024 by the authors. Licensee MDPI, Basel, Switzerland. This article is an open access article distributed under the terms and conditions of the Creative Commons Attribution (CC BY) license (https://creativecommons.org/licenses/by/4.0/).
Share and Cite
Gowda, S.; Kunjar, V.; Gupta, A.; Kavitha, G.; Shukla, B.K.; Sihag, P. Prediction of the Subgrade Soil California Bearing Ratio Using Machine Learning and Neuro-Fuzzy Inference System Techniques: A Sustainable Approach in Urban Infrastructure Development. Urban Sci. 2024, 8, 4. https://doi.org/10.3390/urbansci8010004
Gowda S, Kunjar V, Gupta A, Kavitha G, Shukla BK, Sihag P. Prediction of the Subgrade Soil California Bearing Ratio Using Machine Learning and Neuro-Fuzzy Inference System Techniques: A Sustainable Approach in Urban Infrastructure Development. Urban Science. 2024; 8(1):4. https://doi.org/10.3390/urbansci8010004
Chicago/Turabian StyleGowda, Sachin, Vaishakh Kunjar, Aakash Gupta, Govindaswamy Kavitha, Bishnu Kant Shukla, and Parveen Sihag. 2024. "Prediction of the Subgrade Soil California Bearing Ratio Using Machine Learning and Neuro-Fuzzy Inference System Techniques: A Sustainable Approach in Urban Infrastructure Development" Urban Science 8, no. 1: 4. https://doi.org/10.3390/urbansci8010004