
Rehabilitation of Urban Beaches on the Mediterranean Coast in Valencia (Spain) Observed by Remote Sensing


Cavanilles Institute of Biodiversity and Evolutionary Biology (ICBiBE), Universitat de València, 46980 Valencia, Spain
*
Author to whom correspondence should be addressed.
Urban Sci. 2024, 8(1), 3; https://doi.org/10.3390/urbansci8010003
Submission received: 16 November 2023
/
Revised: 7 December 2023
/
Accepted: 21 December 2023
/
Published: 2 January 2024
(This article belongs to the Special Issue Coastal Urban Dynamics under Climate Change)
Abstract
:Beaches, as ecosystems of high ecosocial and biodiversity importance, are threatened by human activities such as city development and port construction. This study used satellite imagery (Landsat 5, Landsat 8, and Sentinel-2) to detect a significant reduction of 70% in the beach areas of El Saler and La Garrofera (Valencia, Spain) from 170 ha in the 1990s to 43 ha in the year 2022. This process has occurred in parallel with the successive expansion of the Port of Valencia, a modifying agent of marine sedimentation in the region. In addition, encouraging results have been observed in the rehabilitation efforts in different periods. The latest work in the autumn of 2023 has improved the beach area to 112 ha. In this context, remote sensing emerges as an essential tool to monitor these ecosystems, which are important for both human welfare and biodiversity conservation, as well as to allow for monitoring during ecological restoration.
1. Introduction
Beaches play an important role in the ecosocial balance of coastal regions and have a major environmental and social impact. They are unique habitats, where a wide variety of animal and plant species coexist and make a major ecological contribution. They usually have dunes with dense vegetation adapted to adverse conditions, which provide shelter for some animal species and form a protective system against the erosion caused by waves and storms [1]. All of this develops naturally if humans do not significantly alter them for economic purposes, as they are an important tourist attraction. It should also be noted that populations living close to the sea tend to base their livelihoods on it, either through fishing or the hotel industry. Tourism is associated with significant changes in coastal areas, often resulting in the loss of beaches and their replacement by beaches with artificial sand [2].
The Spanish Mediterranean coast is home to a great biodiversity of marine species, which makes beaches essential for the reproduction and life cycles of many species. At the same time, these beaches are subject to constant processes of erosion and sedimentation. The presence of wetlands, habitats of great importance for migratory birds and of great ecological value, also stands out [3]. On the other hand, it is a densely populated area, since, as mentioned above, much of the economic activity revolves around fishing and tourism in the area. This fact generates a great environmental challenge, since this pressure significantly degrades the ecosystems.
One of the primary issues we encounter is the depletion of the shoreline, which results in extensive biodiversity loss and significant economic damages. Coastal erosion, triggered by both natural occurrences and human activities such as noncompliant coastal urbanization, is a major underlying cause of this depletion. The degradation of dune systems is linked to erosion and presents a serious ecological threat [4]. The ingress of seawater into nearby aquifers is another significant factor to consider, leading to the salinization of freshwater and hindering its availability in coastal areas [5].
One of the most obvious impacts exerted on beaches is the construction of international ports near them, as they imply a change in the hydrodynamic flow of water due to the fact that the presence of port structures can change the direction and speed of marine currents; generally, they slow them down, which can have serious consequences on the distribution of sediment and vegetation [6].
It should be noted that such structures can become artificial barriers that alter the underwater topography, affecting the interaction of currents and waves with the seabed. This may result in the overaccumulation of sediment in certain areas and more evident erosion in others. In addition, it is important to note that not only do the structures impact marine morphology, but they also contribute greatly to pollution through the generation of discharges in the ports [7].
The El Saler beach on the Spanish Mediterranean coast has undergone significant changes lately due to the impacts of climate change and human actions, including tourism, port construction, and fishing activities. Additionally, environmental phenomena, such as storms and ocean current variability, are further contributing to these changes.
Ecological restoration is a process by which degraded, damaged, or destroyed ecosystems are enhanced, with the primary objective of re-establishing ecological functions and promoting biodiversity [8] in the study area in question. The main objectives of ecological restoration are to restore the populations of native species and promote biodiversity, re-establish ecological processes such as nutrient cycling, preserve and recover habitats, and reduce the negative impact of human activities that affect the ecosystem [9].
Ecological restoration involves several phases that adhere to the principles of an environmental impact study. First, it is essential to develop a plan that defines the study area, sets objectives, and establishes a strategy. The second phase involves soil preparation and the removal of any elements not corresponding to the study site. Finally, implementing the restoration process requires the application of specific techniques based on the intended purpose [10]. The final stages entail overseeing the execution process and conducting prolonged assessments after the project’s completion.
In the context of coastal erosion mitigation, dredging and artificial sand input from other sources are common techniques used during the design and implementation phase of beach projects. Dredging involves extracting sand from nearby sources and redistributing it on the beach. Additionally, artificial sand can be sourced from quarries. The use of breakwaters can also aid in sediment accumulation and erosion control, although their effectiveness may vary [11,12].
Possibly the most important phase of beach restoration is monitoring, as it allows for the observation of proper implementation and the verification of progress. In situ measurements of physical and biological parameters controlling the changes in topography, water quality, and key species presence, along with remote sensing, are among the methods available to assess the beach restoration efficacy [13].
Remote sensing provides a wide range of possibilities for ecological monitoring due to the variety and accessibility of satellites. This enables us to evaluate diverse situations and study areas [14]. Remote sensing obtains data about the Earth’s surface from satellite sensors. The continuous electromagnetic interaction between the sensors and Earth generates significant data that are further processed to obtain useful information. On one hand, we have the Landsat missions (United States Geological Survey—National Aeronautics and Space Administration) that have been in orbit since 1984 (Landsat 5) and the Sentinel missions (ESA). The Landsat missions, specifically Landsat 5, 7, 8, and 9 (recently launched), are the ideal missions for terrestrial ecological studies. In the case of Sentinel (European Space Agency), we have Sentinel-1 that operates with radar sensors technology, Sentinel-2 which is designed with visible and infrared bands solely for terrestrial ecological studies, although noteworthy for its significant utility in continental aquatic systems, and ultimately, Sentinel-3, with a broader spatial resolution and daily revisitation, facilitating research on marine surfaces [15].
The aim of this study is to analyze the evolution of the sand dune cover on the beaches of Pinedo, El Saler, and La Garrofera (Valencia, Spain) by applying different sand spectral indices to Landsat 5, Landsat 8, and Sentinel-2 images for the period from 1984 to 2023. The goal is to study the impact of the progressive expansion of the Port of Valencia on the sand cover since 1992, and at the same time, evaluate the results of the rehabilitation interventions carried out on these beaches, especially the last one, which was carried out between September and October 2023.
2. Materials and Methods
2.1. Study Area
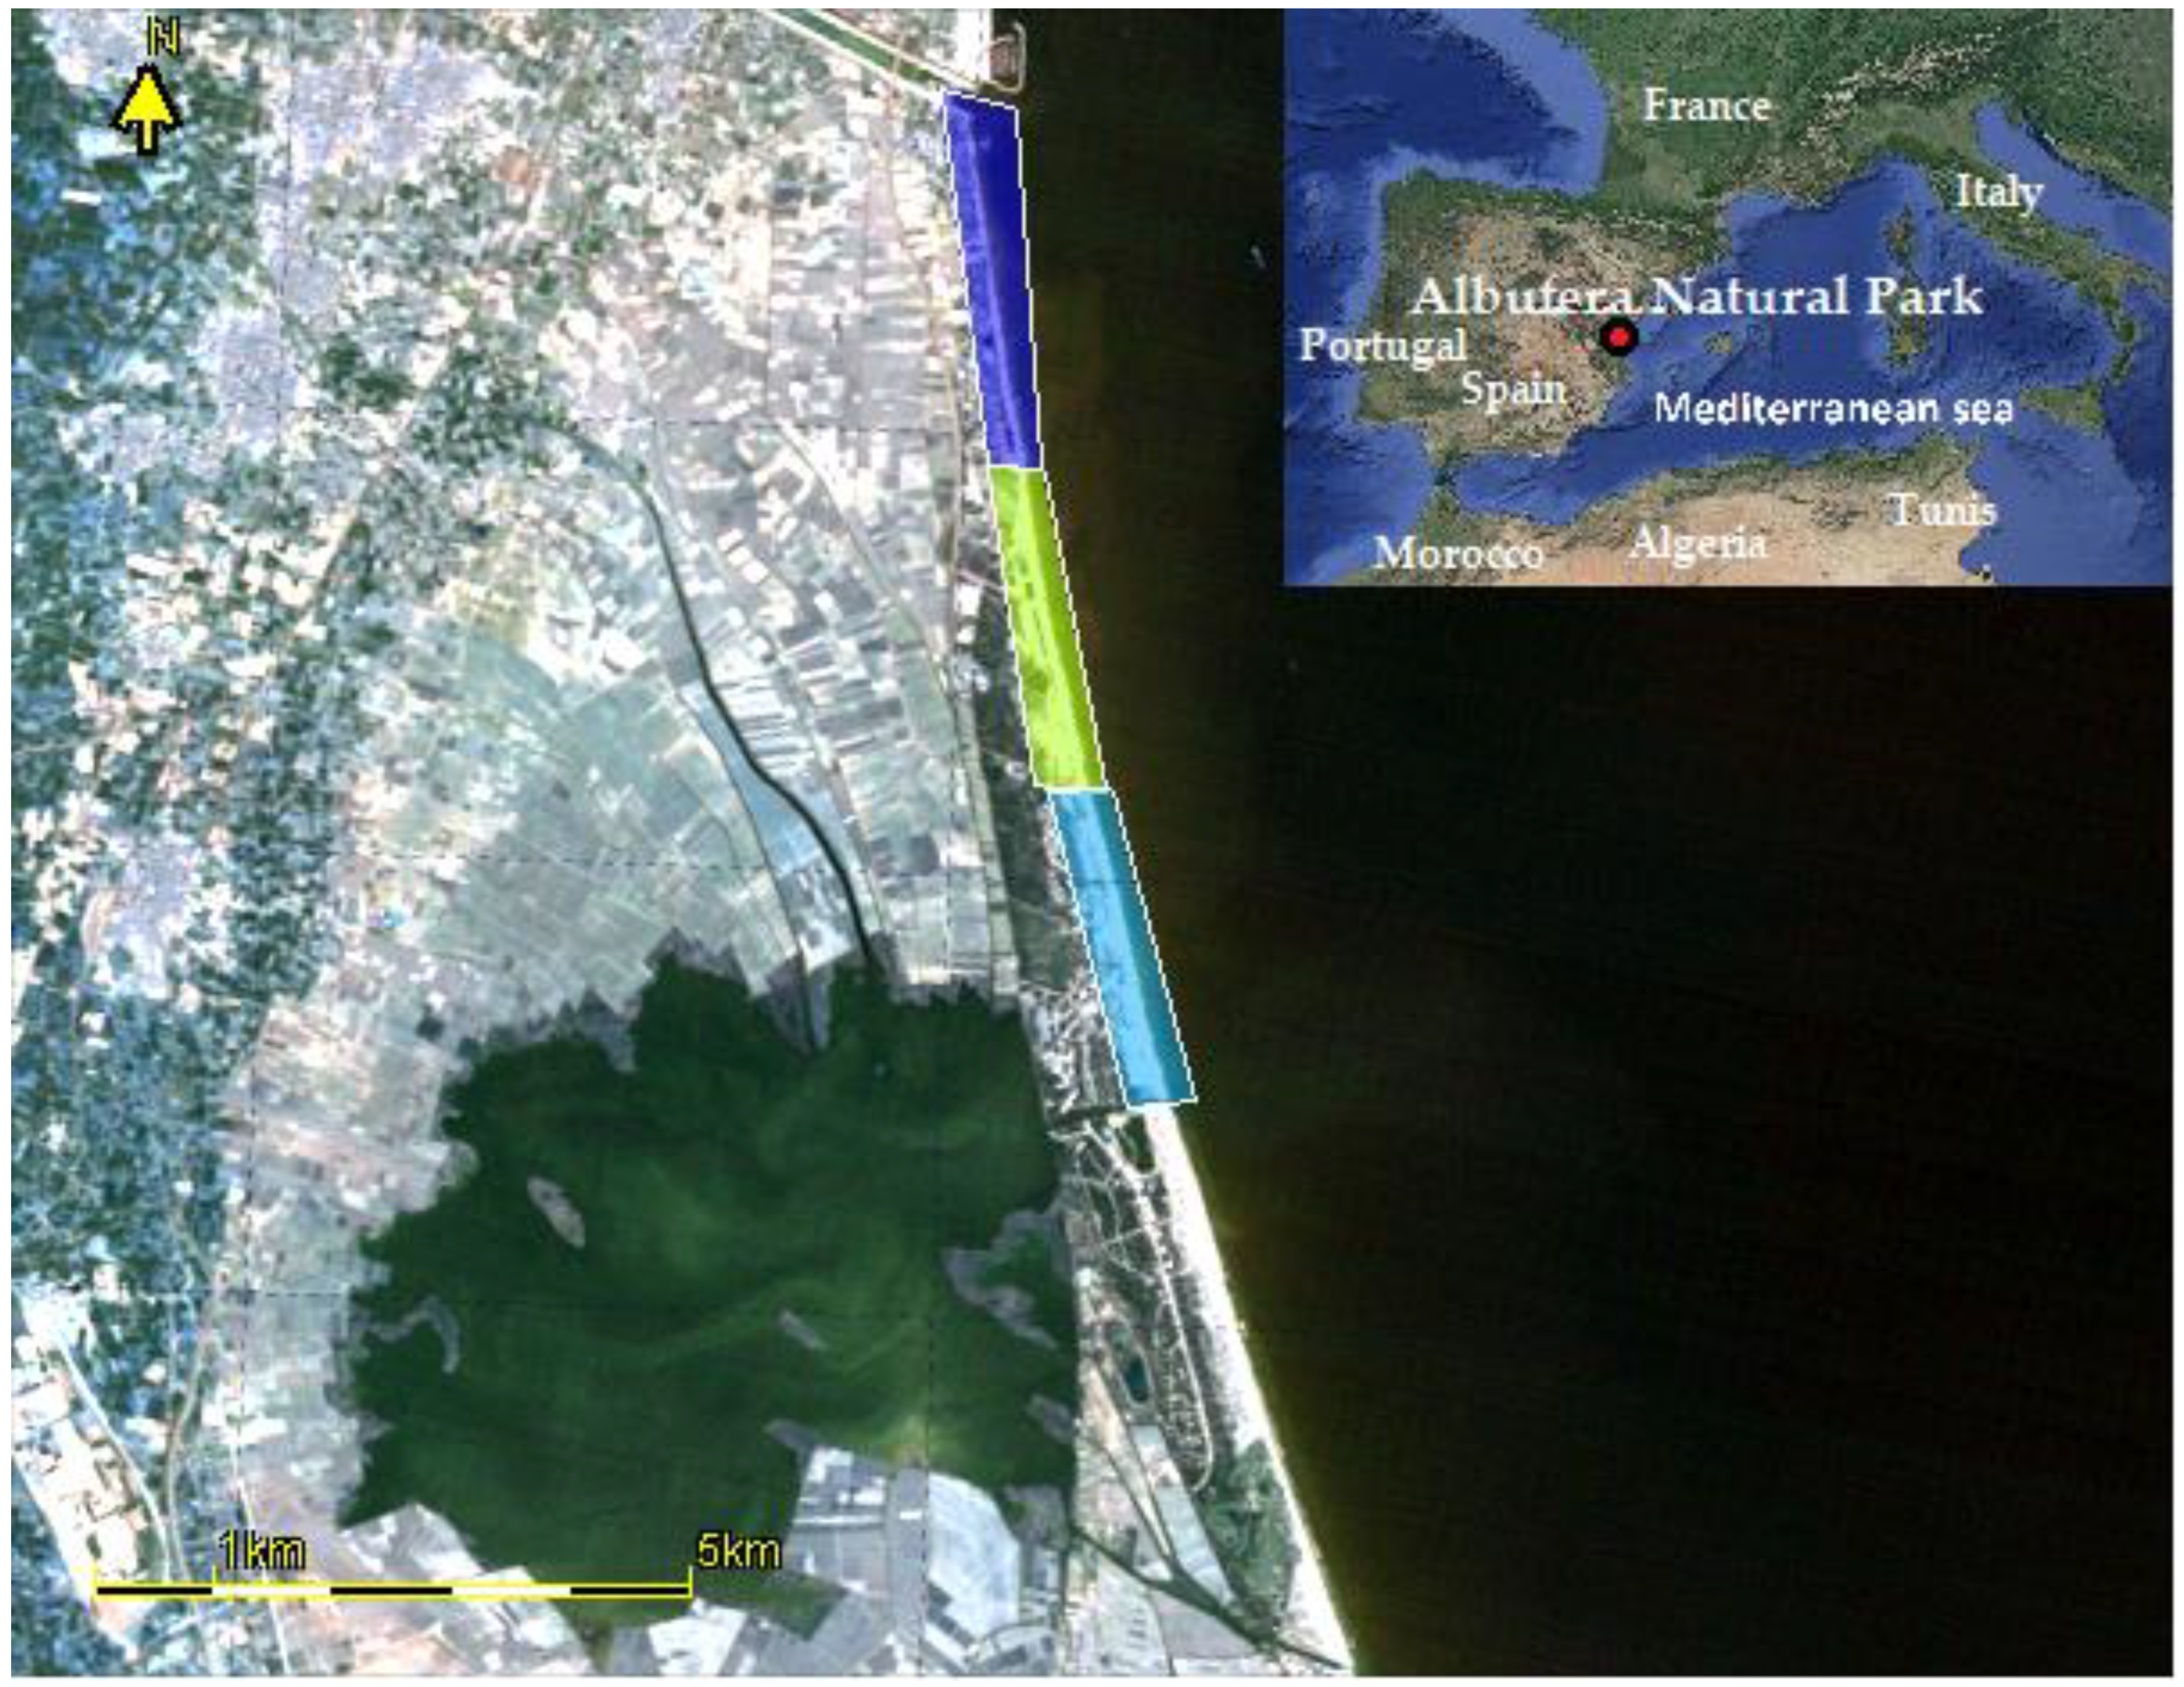
The selected study area is an approximately 8 km long segment of fine–medium grain sand beaches [16] that extends from the current mouth of the Turia River to the Gola del Pujol Nou (Figure 1). For this study, we have defined three beach subsegments that we have named in accordance with the districts of the city of Valencia to which they belong (Pinedo, El Saler, and La Garrofera).
According to Sanjaume [17], beach barriers and sand dunes are two of the dominant forms of sedimentary accumulation in this area of the Gulf of Valencia, along with alluvial fans, alluvial plains, and lagoons. The configuration of the beach barrier has resulted in the constant presence of lagoons along the coast. In the study area, most of these lagoons are characterized as marshes. Only the Albufera lagoon, south of the city of Valencia, maintains its status as a lagoon, although its size has decreased significantly in the last century due to human influence.
According to Pardo-Pascual and Sanjaume [16], from a geomorphological point of view, the Valencian coast is a low coastal area, with a wide coastal plain and a series of coastal ridges formed over time due to the accumulation of sediments. In this context, during the Pleistocene, the direction of sediment transport on the Valencian coast was from north to south. The Valencian coast is also characterized by the presence of cliffs and abrasion platforms further south, which are the result of coastal erosion.
The sedimentology of these beaches varies according to their type, which can be open or enclosed. Open beaches are wider and exposed to wave action, while enclosed beaches are smaller and protected from tidal currents. The sandy beaches of the Valencian coast are mainly composed of quartz and feldspar sediments, with a granulometry that varies from fine to coarse sand. They are the result of the accumulation of sediment transported by the rivers (mainly the Jucar and Turia) and the sea. The formation and evolution of the beaches are influenced by the hydrodynamic conditions such as tides and waves, as well as the action of the wind.
The three beach sections studied present a different transverse morphology depending on the pressures and impacts that exist in the postdune zone (Figure 2). Along the entire stretch there are one or two roads running in a north–south direction. However, the former wetland has been transformed into rice fields in the first two sections (Figure 2a,b), and there is also the construction of the town of El Saler and some buildings in the stabilized dune area (Figure 2b). In this sense, the third section further south (La Garrofera) is the section most similar to the original situation, where the sand bar separated the Mediterranean Sea from the Albufera lagoon (Figure 2c).
According to the same authors [16], the climate of the region is Mediterranean, with hot, dry summers and mild, wet winters. As also highlighted by Soria et al. [18], the prevailing winds are from the east and northeast, which can generate waves and currents that affect the morphology of the beaches. Tides influence the distribution of sediment on the beach, while waves are responsible for erosion and sediment accumulation. For example, easterly and northeasterly winds can generate waves that transport sediment offshore, which can contribute to beach formation. Waves can also affect the shape and orientation of beaches and the distribution of sediment.
However, humans have also intervened in the evolution of Valencia’s beaches. Direct human actions, such as the construction of coastal infrastructure, and artificial beach regeneration and urbanization, in addition to tourist overcrowding, have been the most important factors in the evolution of Valencia’s beaches in recent decades. Human intervention can disrupt the longitudinal transport of sediment and alter the natural balance of the beaches. Therefore, it is important to consider both natural and human factors when studying the evolution of Valencia’s beaches.
2.2. Remote Sensing Imagery
Satellite images were selected to cover the period from 1984 to 2023 and to ensure low cloud cover of less than 10%. A total of 11 Landsat 5 images were selected for the period of 1984–2013 and 2 Landsat 8 images were used for the period of 2013–2015. From 2015, the use of Sentinel-2 satellite images was prioritized due to their superior spectral range and spatial resolution, with a total of 15 images used. For the period of 2013–2023, which marks the regression phase and the beginning of regeneration processes, a total of 17 images were included in the analysis, combining Landsat 8 and Sentinel-2.
The Landsat 5 and Landsat 8 images used belong to series 33 of paths 198 and 199, downloaded under license from the USGS website. These were obtained by level 1 processing and were atmospherically corrected using the QUAC method implemented in ENVI 5.0.3 software (Exelis Visual Information Solutions, Boulder, CO, USA). Sentinel-2 images were downloaded and atmospherically corrected with Sen2Cor (level 2A) from the freely available ESA Copernicus Browser platform. All images were processed using SeNtinel Applications Platform (SNAP 9.0) software (Brockmann Consult, Hamburg, Germany).
For each image, we attempted to calculate the area of the sand dunes. For this purpose, spectral indices were applied to each image to detect sand dunes as described in the literature and presented in the subsequent sections.
For Landsat 5 images, the normalized differential sand areas index (NDSAI), which is useful for dry to wet areas [19], was applied using the following Equation (1):
NDSAI = (B5 − B3)/(B3 + B5)
For Landsat 8 and Sentinel-2 images, the normalized difference enhanced sand index (NDESI) of sand dunes [20] was applied, using Equation (2) for Landsat 8 and Equation (3) for Sentinel-2:
NDESI (Landsat 8) = (B4 − B2)/(B4 + B2) − (B7 − B6)/(B7 + B6)
NDESI (Sentinel-2) = (B4 − B2)/(B4 + B2) − (B12 − B11)/(B12 + B11)
The different spectral bands corresponding to the different satellites whose images we have used in this study, including those used directly in the calculations of the indices, are shown in Table 1.
The process of classifying pixels as “sand dunes” was performed using a consistent threshold for both indices. Regions of interest were used in all images to reduce the influence of reflectivity from buildings and paved areas on the estimation of beach sand. Frequency histograms of the index values per pixel were generated for each image, and a range between 0.05 and 0.38, which varied by satellite, index, and date, was identified as the characterizing area of sand dunes. Any value below this range was considered water or shoreline, while higher values were associated with vegetation.
2.3. Data Analysis
The number of sand pixels in each image was obtained and multiplied by the area of each pixel (m2), which depended on the spatial resolution of each satellite: 900 m2 in the cases of Landsat 5 and Landsat 8 and 100 m2 in the case of Sentinel-2. In this way, we obtained from each image the estimate of the sand surface (m2) within the previously defined region of interest, which was the same in all images for each date. To make the estimation more intuitive, these data were converted into hectares.
A graph was made to represent the evolution of the surface over the last decades, and the increase of the surface generated during the last rehabilitation was calculated.
3. Results
Table 2 lists all images used, the satellite responsible for the acquisition, the selected sand index, and the range of values considered representative of the “sand dunes” according to the image’s own histogram.
Figure 3 and Figure 4 graphically show the same results previously shown in Table 2 for the total dune areas at individual beaches.
In the 1980s, there were about 160 ha of sand dunes, which increased to 180 ha due to sediment inputs that were carried out as rehabilitation work in 1986 and 1990. After the work was completed, and during the period from 1993 to 1996 when the southern dock of the port was built, the sand dunes decreased by about 80 ha in 10 years. The result was a total of about 100 hectares. Subsequently, between 1996 and 1999, about 500,000 cubic meters of sand was added to the beaches of El Saler for the purpose of rebuilding the dunes, but no significant change in the dune area was detected during this period since no land was gained from the sea.
Subsequently, the northern area of the port was expanded for the construction of the Juan Carlos I Royal Marina and the preparation of the area for the 2007 America’s Cup, and this expansion continued in 2009–2010.
At the same time, due to the beach recession observed in previous decades, several dune rehabilitation and recreation programs were carried out, which led to a certain increase in the area of sand detected in our study between 2006 and 2013.
However, since 2013, due to the effect of the completion of the port expansion work and a decrease in the rehabilitation activities carried out in the area, during this period and until 2022, a significant reduction (p-value < 0.05) of approximately 90 ha in about 9 years has been observed in the dunes of our study beaches.
With the sand replenishment operations carried out by the Spanish government between September and October 2023, as shown in Figure 4, the sand dune area increased by approximately 70 hectares in the 45 days that the sand replenishment work lasted. However, as can be seen in Figure 3 and Figure 5, despite the large increase achieved, the values of the 1980s, before the various expansions of the Port of Valencia (Table A1 and Figure A1), have not been reached.
Through this approach, using remote sensing, it has also been possible to confirm how the mechanical contributions of sand have taken place, starting from the northernmost beach (Pinedo) towards the southernmost beaches (El Saler and La Garrofera). This can be seen graphically in Figure 4, where we can see how the increase in the surface area of the dunes occurs first at Pinedo beach, then at El Saler and finally at La Garrofera. In addition, it can be observed how, once the work is finished, Pinedo beach reduces its surface area because of marine erosion and then stabilizes. This effect is also expected to be observed later in the following two beaches, and it can be seen that there is a movement of material from the beach to the sea (Figure 5c).
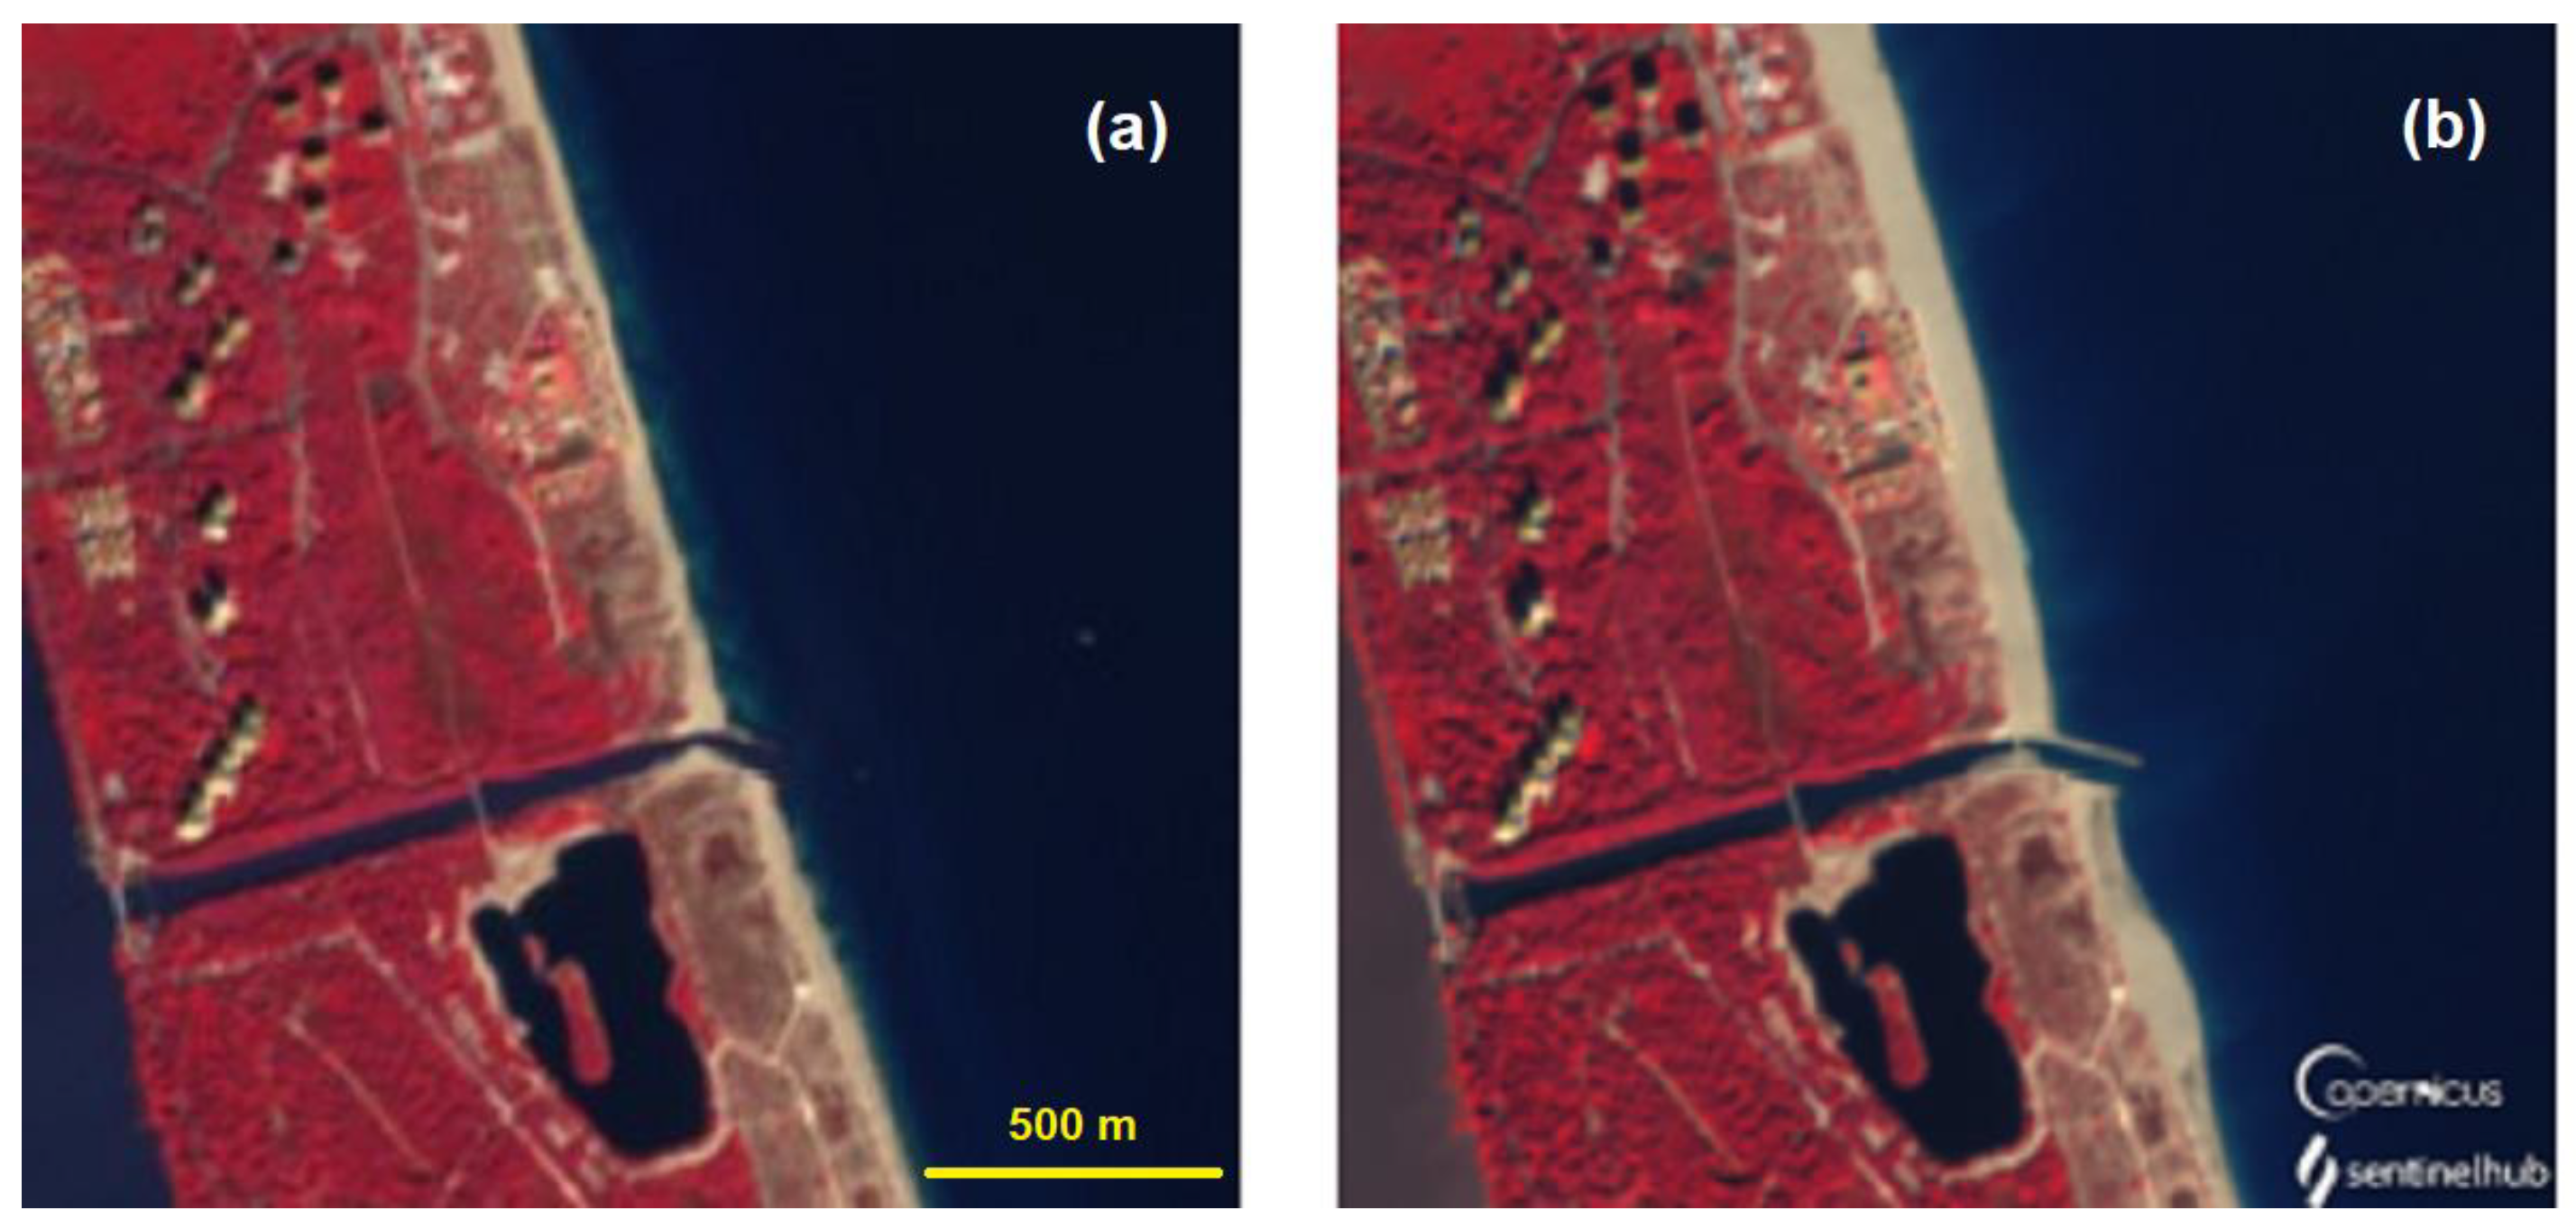
Looking in detail at the southern end of the restored area, at the outlet of the Pujol channel (Figure 6), it can be seen how the northern dike protecting the outlet has been consolidated and extended this past year to facilitate the settlement of the sand deposited at this point. The construction of this dike alone has meant that after the work, sand has already been deposited in the southern part of the canal outlet, favored by the protection of this new breakwater (Figure 6b). It is recorded that no materials have been deposited at this part during the recovery work as in the remaining section of beaches.
4. Discussion
Regarding the obtained results, it can be observed that the area of the dunes on the study beaches has varied over the years (Figure 3). Since 1984, when the Landsat 5 satellite was launched, the dune area was around 60 hectares according to satellite data. However, from 1992, a significant decline in the dune surface can be noticed, and this is mainly due to the expansion of the Valencia port. The construction of this structure dates to 1483, but it was not until the 1980s that an expansion was authorized, and the execution began in 1992 [21]. As previously mentioned, these beaches are located near the Port of Valencia, and as a result of its expansion, the regression of the coast became more evident. Over time, various ecological rehabilitation strategies have been implemented for the benefit of the beaches and the Albufera natural park. However, they have all resulted in the same consequence: loss of the dune area. Despite maintaining a relatively stable area between 1999 (the beginning of the recovery) and 2013, there has been a sharp decline due to ongoing economic-focused works in the port, such as hosting the Formula-1 Street Circuit and America’s Cup. It wasn’t until mid-2022 that a new beach regeneration plan was established, initiating the works in September 2023 using artificial sand recharge to increase their width and restore the coastline to its pre-initial port expansion state. Figure 3 shows the initial extent of the dune area as 20 hectares at the beginning of the regeneration process on the 6th of September 2023. Through the different phases, each corresponding to a specific beach, the area has increased to 40 hectares as of November 5th at Pinedo beach, nearest to the port infrastructure. The observations in Figure 3 and Figure 4 indicate that the most affected beach among the changes discussed is La Garrofera beach, which happens to be the smallest of the three studied beaches.
It should be noted that in some satellite images, the area of the sand may have been overestimated due to the presence of coastal developments, houses, and roads nearby. Similarly, roads could also be confused due to this same reason. In the case of houses, this may be because roof materials have similar optical properties to sand.
The variety of satellites used is due to the data availability, as mentioned previously. Landsat missions have been in orbit since 1984, and the data series begins with Landsat 5. Landsat 8 and Sentinel-2 have subsequently been used. In the case of Landsat, its spatial resolution is lower than that of Sentinel-2. This may affect the accuracy when counting the number of pixels to calculate the dune area, thus affecting the calculations from 1984 to 2015. This is due to the fact that Sentinel-2 entered into orbit in mid-2015, and it was not until 2016 that the data started to become more widespread.
The NDESI index was not originally designed for beaches, but rather for calculating the surface area of sand dunes in the desert. In this case, the threshold defined by the authors at the time has been changed [20]. A recent paper [22] introduced a new index, called the normalized sand index (NSI), which is designed for use in temperate regions where the textures and values of sand and soil surfaces vary greatly throughout the year. This index yielded better results than those used in the present study. It might be possible to use this index, but the Mediterranean climate possesses unique features that at times makes it more similar to deserts. Moreover, this novel index is solely based on Landsat images, which leads to inferior outcomes when using both satellite missions due to changes in spatial resolution compared to Sentinel.
The methodology developed in this work is of great importance for the monitoring and evaluation of future changes in the sand cover of beaches. This innovative methodology will allow us not only to evaluate the effectiveness of proposed regeneration programs, but also effectively monitor the evolution of these beaches over time. Furthermore, its potential to be adapted to other similar coastal areas around the world is highlighted, even with the possibility of applying similar spectral indices.
It is important to emphasize that this methodology fills a significant gap in the current research. Until now, the specific monitoring of sand cover on beaches using spectral indices designed for sand dunes has not been implemented, as this methodology has mainly been used in the assessment of arid or desert terrain [19,20,22]. Therefore, this novel application in coastal contexts opens a new perspective in the field of research, which until now has only focused on methodologies used to detect changes in coastlines. This opening towards monitoring beach dynamics with spectral sand indices provides fertile ground for future research in this field.
However, important issues remain for future research. Exploring the feasibility of discriminating between sand and paved terrain or buildings in satellite imagery using techniques such as artificial intelligence (machine learning) would be a relevant step for a more detailed classification of terrain types on the beaches analyzed.
In addition, it is crucial to develop a mathematical method to determine the threshold of the sand index. This technique would allow a more accurate classification of pixels as “sand” without relying on manual observation of the histogram. The systematic implementation of this method would improve the consistency and accuracy in the assessment of sand cover on beaches. These advances could have significant implications for monitoring changes in the sand cover and managing coastal ecosystems.
From an ecological point of view, one of the fundamental parts of beach rehabilitation or restoration is related to human actions and the way the area is managed, which in most cases is not done in the right way. On the one hand, uncontrolled urban sprawl can lead to the loss of natural coastal habitats and fragmentation of ecosystems [23]. This is mainly due to a lack of sustainable planning, i.e., it is only in recent years that principles of sustainability or habitat conservation have begun to be integrated into coastal infrastructure development. Another practice with little or no management is the discharge of urban wastewater into coastal waters, which damages marine ecosystems [24]. In addition to uncontrolled urban pressure, there is also pressure from tourism, as resources are focused on tourism and not on protection. In fact, the regeneration of beaches in this study was purely for tourist and recreational purposes, rather than as a preventive measure, as recommended in environmental management and restoration manuals. In addition to the pollution caused by the discharge of wastewater, there is also the pollution caused by humans in situ, as there is little environmental awareness of our ecosystems [25].
The beaches in this study are habitats for birds and turtles, species that are severely affected by poor management. Such management can lead to the degradation of nesting habitats for shorebirds and consequently reduce the reproductive success of these species, in addition to the fact that waste left by people using the beach can be ingested by birds, posing a risk to them [26]. For turtles, human presence and changes to the beach negatively affect them, as they use the sand as a nesting site [27]. An additional risk is light pollution from promenades, or as in the case of Pinedo beach, the lighting of the port of Valencia, which has a negative impact on turtle hatchlings as it can disorientate newborn turtles, leading them far from the sea and reducing their survival [28]. The regional environmental government conduces, during summer research on nesting turtles, the reallocation of the nests to the south of La Garrofera beach (Figure 6) and maintains continuous monitoring from the time the turtle camp is set up until hatching occurs and the hatchlings are transferred to the sea, either by their own means or with assistance (see more details at https://xalocmar.org/campamento-tortuga/ (accessed on 15 November 2023)).
Remote sensing can be useful for the study of coastal areas and their monitoring of regeneration processes, with applications to decision making in beaches and their associated ecosystems, since it facilitates the provision of continuous spatiotemporal data. Through regular observation, remote sensing enables the monitoring of beach changes and provides valuable information on coastal dynamics and the effects associated with urbanization, erosion, and climate change. The early detection of these changes facilitates the identification of critical areas, allowing effective conservation strategies to be applied.
The indices that have been developed over the years, as well as those applied in this study, allow us to obtain significant data variability. In the case of vegetation, including dune vegetation, the NDVI (normalized difference vegetation index) can be used, which is useful for monitoring dune vegetation [29]. There are other indices such as LST (land surface temperature), which is used to measure land surface temperature [30], and thermal infrared spectral reflectance can also be used to estimate sand temperature, providing important information for understanding the thermal conditions on beaches.
Despite the sand replenishment and rehabilitation efforts undertaken to date, the process is not complete. It is intended to continue revegetating the dunes by reintroducing native dune vegetation, a strategy successfully implemented in previous initiatives such as LIFE Juniper and LIFE Dune. However, it is important to keep in mind that as the tides act and storms occur, the deposited sand is likely to be progressively removed.
This scenario is exacerbated by predicted future effects of extreme events due to climate change in the region [31]. Furthermore, due to the high human population in the area, a full recovery of the ecosystem under current conditions seems unlikely. Therefore, it would be more accurate to refer to this process as rehabilitation, as the ecosystem will not be able to regenerate itself in the current environment.
For a complete and effective recovery, it would be essential to consider an integral change in the territorial planning and management of the area. The proposal of a coastal Territorial Action Plan, in accordance with article 16 of Legislative Decree 1/2021 [32], will be crucial to ensure adequate territorial planning. This plan should significantly reduce human pressure on the territory, limit the impact of tourist overcrowding and consider not only socioeconomic aspects, but also environmental considerations, such as climate change scenarios, biodiversity, and above all, the active participation of the local community in the decision-making process.
5. Conclusions
The results reflect a notorious decline in the dune area of the beaches studied, mainly because of the expansion of the Port of Valencia in 1992. Despite attempts at rehabilitation, the negative effects of urbanization, recreational activities, and inadequate management of the coastal environment are evident. These results are of concern, considering that these beaches are the habitats of important marine species, such as various birds and turtles.
Moreover, these results highlight the importance of the methodology developed to monitor future changes in beach sand cover. This innovative methodology will allow for the evaluation of the effectiveness of rehabilitation programs. It can potentially be adapted to other coastal areas. In addition, it fills a research gap by applying spectral sand indices to specific beach monitoring, a new approach in coastal contexts.
In this sense, remote sensing proves to be a very useful resource for monitoring coastal environments and their associated ecosystems. This technique provides complete spatiotemporal coverage, allowing for the early detection of coastal changes and facilitating decision making.
Despite the efforts made to rehabilitate and revegetate the dunes, the process is not yet complete. Moreover, human pressure on the area and the impacts of tides and storms suggest additional difficulties in the recovery process of these ecosystems, making it improbable.
Finally, future climate change poses additional challenges in terms of extreme events, exacerbating the difficulty of full recovery. A comprehensive change in territorial planning is considered crucial, highlighting the proposal of a coastal Territorial Action Plan for proper management. This plan should reduce human pressure in the area and consider both socioeconomic and environmental aspects, with the active participation of the local community in decision making.
Author Contributions
Conceptualization, J.M.S. and J.V.M.; methodology, J.V.M. and J.M.S.; software, J.V.M.; formal analysis, J.M.S.; investigation, J.M.S., J.V.M. and R.P.-G.; data curation, J.V.M. and J.M.S.; writing—original draft preparation, J.V.M. and R.P.-G.; writing—review and editing, J.M.S., J.V.M. and R.P.-G.; supervision, J.M.S. All authors have read and agreed to the published version of the manuscript.
Funding
This research received no external funding.
Data Availability Statement
Images are available through the ESA Copernicus Browser and the USGS website, and the data presented are available in this document for scientific purposes in accordance with the provisions of the Berne Convention.
Acknowledgments
The authors would like to thank R. Muñoz for the original Figure 2 drawing.
Conflicts of Interest
The authors declare no conflicts of interest.
Appendix A

Table A1.
Evolution of the approximated area (ha) of the Port of Valencia. Data calculated using SNAP 9.0.
Table A1.
Evolution of the approximated area (ha) of the Port of Valencia. Data calculated using SNAP 9.0.
| Year | Approximated Area (ha) |
|---|---|
| 26 June 1987 | 206.10 |
| 9 July 1992 | 394.56 |
| 7 July 1997 | 533.52 |
| 24 June 2004 | 552.22 |
| 3 July 2007 | 624.13 |
| 28 June 2011 | 698.63 |
Figure A1.
Images show the evolution of the Port of Valencia at different times. Dates of images from Landsat 5: (a) 26 June 1987, (b) 9 July 1992, (c) 7 July 1997, (d) 24 June 2004, (e) 3 July 2007, and (f) 28 June 2011.
Figure A1.
Images show the evolution of the Port of Valencia at different times. Dates of images from Landsat 5: (a) 26 June 1987, (b) 9 July 1992, (c) 7 July 1997, (d) 24 June 2004, (e) 3 July 2007, and (f) 28 June 2011.

References
- Gómez-Pina, G.; Muñoz-Pérez, J.J.; Ramírez, J.L.; Ley, C. Sand dune management problems and techniques, Spain. J. Coast. Res. 2002, 36, 325–332. [Google Scholar] [CrossRef]
- Semeoshenkova, V.; Newton, A. Overview of erosion and beach quality issues in three Southern European countries: Portugal, Spain and Italy. Ocean Coast. Manag. 2015, 118, 12–21. [Google Scholar] [CrossRef]
- Malvárez, G.; Navas, F.; Guisado-Pintado, E.; Jackson, D.W.T. Morphodynamic interactions of continental shelf, beach and dunes: The Cabopino dune system in southern Mediterranean Spain. Earth Surf. Process. Landf. 2019, 44, 1647–1658. [Google Scholar] [CrossRef]
- Dong, C.; Yan, Y.; Guo, J.; Lin, K.; Chen, X.; Okin, G.S.; Gillespie, W.T.; Dialesandro, J.; MacDonald, G.M. Drought-vulnerable vegetation increases exposure of disadvantaged populations to heatwaves under global warming: A case study from Los Angeles. Sustain. Cities Soc. 2023, 93, 104488. [Google Scholar] [CrossRef]
- Zhang, K.; Douglas, B.C.; Leatherman, S.P. Global Warming and Coastal Erosion. Clim. Chang. 2004, 64, 41–58. [Google Scholar] [CrossRef]
- Tsoukala, V.K.; Katsardi, V.; Hadjibiros, K.; Moutzouris, C.I. Beach Erosion and Consequential Impacts Due to the Presence of Harbours in Sandy Beaches in Greece and Cyprus. Environ. Process. 2015, 2, 55–71. [Google Scholar] [CrossRef]
- Kudale, M.D. Impact of port development on the coastline and the need for protection. Indian J. Geo-Mar. Sci. 2010, 39, 597–604. [Google Scholar]
- Jackson, S.T.; Hobbs, R.J. Ecological Restoration in the Light of Ecological History. Science 2009, 325, 567–569. [Google Scholar] [CrossRef]
- Harris, J.A.; Hobbs, R.J.; Higgs, E.; Aronson, J. Ecological restoration and global climate change. Restor. Ecol. 2006, 14, 170–176. [Google Scholar] [CrossRef]
- Hagger, V.; Dwyer, J.; Wilson, K. What motivates ecological restoration? Restor. Ecol. 2017, 25, 832–843. [Google Scholar] [CrossRef]
- Paoli, C.; Gastaudo, I.; Vassallo, P. The environmental cost to restore beach ecoservices. Ecol. Eng. 2013, 52, 182–190. [Google Scholar] [CrossRef]
- Pouso, S.; Ferrini, S.; Turner, R.K.; Uyarra, M.C.; Borja, Á. Financial inputs for ecosystem service outputs: Beach recreation recovery after investments in ecological restoration. Front. Mar. Sci. 2018, 5, 375. [Google Scholar] [CrossRef]
- Klemas, V. Using remote sensing to select and monitor wetland restoration sites: An overview. J. Coast. Res. 2013, 29, 958–970. [Google Scholar] [CrossRef]
- Chebud, Y.; Naja, G.M.; Rivero, R.G.; Melesse, A.M. Water quality monitoring using remote sensing and an artificial neural network. Water Air Soil Pollut. 2012, 223, 4875–4887. [Google Scholar] [CrossRef]
- European Space Agency (ESA). Sentinel-2 Spectral Response Functions. 2017. Available online: https://sentinel.esa.int/web/sentinel/user-guides/sentinel-2-msi/document-library/-/asset_publisher/Wk0TKajiISaR/content/sentinel-2a-spectral-responses (accessed on 10 November 2023).
- Pardo-Pascual, J.E.; Sanjaume, E. Beaches in Valencian Coast. In The Spanish Coastal Systems; Springer: Berlin/Heidelberg, Germany, 2018; pp. 209–236. [Google Scholar]
- Sanjaume, E. Las Costas Valencianas. In Sedimentología y Morfología; Universitat de València: Valencia, Spain, 1985; p. 505. [Google Scholar]
- Soria, J.; Jover-Cerdá, M.; Gómez, J. Influence of Wind on Suspended Matter in the Water of the Albufera of Valencia (Spain). J. Mar. Sci. Eng. 2021, 9, 343. [Google Scholar] [CrossRef]
- Sahar, A.A.; Rasheed, M.J.; Uaid, D.A.A.-H.; Jasimm, A.A. Mapping Sandy Areas and Their Changes Using Remote Sensing. A Case Study at North-East Al-Muthanna Province, South of Iraq. Rev. Teledetec. 2021, 58, 39–52. [Google Scholar] [CrossRef]
- Marzouki, A.; Dridri, A. Normalized Difference Enhanced Sand Index for desert sand dunes detection using Sentinel-2 and Landsat 8 OLI data, application to the north of Figuig, Morocco. J. Arid. Environ. 2022, 198, 104693. [Google Scholar] [CrossRef]
- García Maldonado, M. Estudio de Impacto Ambiental de la ampliación del puerto deportivo Pobla Marina (TM Puebla de Farnals, Valencia). Doctoral Dissertation, Universitat Politècnica de València, Valencia, Spain, 2020. [Google Scholar]
- Secu, C.V.; Stoleriu, C.C.; Lesenciuc, C.D.; Ursu, A. Normalized Sand Index for Identification of Bare Sand Areas in Temperate Climates Using Landsat Images, Application to the South of Romania. Remote Sens. 2022, 14, 3802. [Google Scholar] [CrossRef]
- Williams, A.T.; Micallef, A. Beach Management: Principles and Practice; Routledge: London, UK, 2011. [Google Scholar]
- Vaz, B.; Williams, A.; Silva, C.; Phillips, M. The importance of user’s perception for beach management. J. Coast. Res. 2009, 1164–1168. Available online: https://www.jstor.org/stable/25737970 (accessed on 8 November 2023).
- Ariza, E.; Sardá, R.; Jiménez, J.A.; Mora, J.; Ávila, C. Beyond Performance Assessment Measurements for Beach Management: Application to Spanish Mediterranean Beaches. Coast. Manag. 2007, 36, 47–66. [Google Scholar] [CrossRef]
- Pfister, C.; Harrington, B.A.; Lavine, M. The impact of human disturbance on shorebirds at a migration staging area. Biol. Conserv. 1992, 60, 115–126. [Google Scholar] [CrossRef]
- Schlacher, T.A.; Schoeman, D.S.; Jones, A.R.; Dugan, J.E.; Hubbard, D.M.; Defeo, O.; Peterson, C.H.; Weston, M.A.; Maslo, B.; Olds, A.D.; et al. Metrics to Assess Ecological Condition, Change, and Impacts in Sandy Beach Ecosystems. J. Environ. Manag. 2014, 144, 322–335. [Google Scholar] [CrossRef] [PubMed]
- Kamrowski, R.L.; Limpus, C.; Moloney, J.; Hamann, M. Coastal light pollution and marine turtles: Assessing the magnitude of the problem. Endanger. Species Res. 2012, 19, 85–98. [Google Scholar] [CrossRef]
- Pinto, L.H.T.; Fernandes, L.R. Multitemporal analyses of the vegetation cover of coastal sand dune ecosystems in Natal/RN, based on NDVI index. In Proceedings of the Anais XV Simpósio Brasileiro de Sensoriamento Remoto—SBSR, Curitiba, Brazil, 30 April–5 May 2011; pp. 1895–1901. [Google Scholar]
- Julien, Y.; Sobrino, J.A.; Mattar, C.; Ruescas, A.B.; JimeNez-Munoz, J.C.; SoRia, G.; Hidalgo, V.; Atitar, M.; Franch, B.; Cuenca, J. Temporal analysis of normalized difference vegetation index (NDVI) and land surface temperature (LST) parameters to detect changes in the Iberian land cover between 1981 and 2001. Int. J. Remote Sens. 2011, 32, 2057–2068. [Google Scholar] [CrossRef]
- Insua-Costa, D.; Senande-Rivera, M.; Llasat, M.C.; Miguez-Macho, G. A global perspective on western Mediterranean precipitation extremes. NPJ Clim. Atmosp. Sci. 2022, 5, 9. [Google Scholar] [CrossRef]
- Official Journal of the Generalitat Valenciana (OJGV). Legislative Decree 1/2021, of June 18, of the Council of approval of the revised text of the Law of land use planning, urbanism, and landscape. OJGV 2021, 9129, 32094–32301. (In Spanish) [Google Scholar]
Figure 1.
Beach sections analyzed in this study. Dark blue = Pinedo, green = El Saler, and turquoise = La Garrofera. Date from Landsat 5 image, 7 April 1984.
Figure 1.
Beach sections analyzed in this study. Dark blue = Pinedo, green = El Saler, and turquoise = La Garrofera. Date from Landsat 5 image, 7 April 1984.

Figure 2.
Beach transects from west to east that are analyzed in this study: (a) Pinedo, (b) Saler, and (c) La Garrofera. Image drawn by R. Muñoz for this study.
Figure 2.
Beach transects from west to east that are analyzed in this study: (a) Pinedo, (b) Saler, and (c) La Garrofera. Image drawn by R. Muñoz for this study.

Figure 3.
Graph of the evolution in the sand dune areas (ha) of the beaches during the last 40 years, monitored by Landsat 5, Landsat 8, and Sentinel-2.
Figure 3.
Graph of the evolution in the sand dune areas (ha) of the beaches during the last 40 years, monitored by Landsat 5, Landsat 8, and Sentinel-2.

Figure 4.
Evolution of the dune areas (ha) of the beaches during the regeneration operations in the autumn of 2023, monitored by Sentinel-2.
Figure 4.
Evolution of the dune areas (ha) of the beaches during the regeneration operations in the autumn of 2023, monitored by Sentinel-2.

Figure 5.
Sentinel-2 RGB images of the study beaches’ regeneration: (a) 1 November 2022 before the last rehabilitation; (b) 2 October 2023 during the rehabilitation; and (c) 6 November 2023 after the rehabilitation. The yellow arrow is the north arrow, and the yellow bar equals 1 km.
Figure 5.
Sentinel-2 RGB images of the study beaches’ regeneration: (a) 1 November 2022 before the last rehabilitation; (b) 2 October 2023 during the rehabilitation; and (c) 6 November 2023 after the rehabilitation. The yellow arrow is the north arrow, and the yellow bar equals 1 km.

Figure 6.
Sentinel-2 false-color infrared (RGB 843) images detailing the southern La Garrofera beach rehabilitation: (a) 2 October 2022 before the last rehabilitation and (b) 6 November 2023 after the rehabilitation.
Figure 6.
Sentinel-2 false-color infrared (RGB 843) images detailing the southern La Garrofera beach rehabilitation: (a) 2 October 2022 before the last rehabilitation and (b) 6 November 2023 after the rehabilitation.

Table 1.
L5, L8, and S2 bands. NIR is near infrared, SWIR is short wavelength infrared, TIR is thermal infrared, Pan is panchromatic, and λc is the center wavelength of each band.
Table 1.
L5, L8, and S2 bands. NIR is near infrared, SWIR is short wavelength infrared, TIR is thermal infrared, Pan is panchromatic, and λc is the center wavelength of each band.
| Landsat 5 | Landsat 8 | Sentinel-2 | ||||||
|---|---|---|---|---|---|---|---|---|
| Bands | Objective | λc (nm) | Bands | Objective | λc (nm) | Bands | Objective | λc (nm) |
| B1 | Blue | 482 | B1 | Coastal aerosol | 443 | B1 | Coastal aerosol | 442 |
| B2 | Green | 562 | B2 | Blue | 482 | B2 | Blue | 492 |
| B3 | Red | 655 | B3 | Green | 562 | B3 | Green | 560 |
| B4 | NIR | 840 | B4 | Red | 655 | B4 | Red | 665 |
| B5 | SWIR 1 | 1676 | B5 | NIR | 865 | B5 | Vegetation red edge | 705 |
| B6 | TIR | 10,900 | B6 | SWIR | 1610 | B6 | 740 | |
| B7 | SWIR 2 | 2200 | B7 | 2200 | B7 | 783 | ||
| B8 | Pan | 590 | B8 | NIR | 842 | |||
| B9 | Cirrus | 1375 | B8A | 865 | ||||
| B10 | TIR | 10,900 | B9 | 942 | ||||
| B11 | 12,000 | B10 | SWIR | 1380 | ||||
| B11 | 1610 | |||||||
| B12 | 2190 | |||||||
Table 2.
Results obtained for the dune surface corresponding to the total area of the study segment at individual beaches.
Table 2.
Results obtained for the dune surface corresponding to the total area of the study segment at individual beaches.
| Date | Satellite | Sand Area (ha) | Applied Index | Index Range Selected | |||
|---|---|---|---|---|---|---|---|
| Total | Pinedo | El Saler | La Garrofera | ||||
| 7 April 1984 | L5 | 157.50 | 48.51 | 59.49 | 49.50 | NDSAI | 0.10–0.295 |
| 21 April 1989 | L5 | 177.75 | 64.80 | 62.37 | 50.58 | 0.07–0.31 | |
| 26 April 1994 | L5 | 110.79 | 47.61 | 33.57 | 29.61 | 0.12–0.32 | |
| 8 April 1999 | L5 | 102.51 | 46.80 | 32.31 | 23.40 | 0.07–0.30 | |
| 19 June 2002 | L5 | 100.44 | 47.25 | 27.81 | 25.38 | 0.12–0.32 | |
| 8 July 2003 | L5 | 97.29 | 46.53 | 27.36 | 23.40 | 0.007–0.33 | |
| 26 May 2005 | L5 | 93.78 | 44.28 | 27.18 | 22.32 | 0.02–0.30 | |
| 30 June 2006 | L5 | 94.68 | 53.55 | 24.03 | 17.10 | 0.06–0.32 | |
| 3 July 2007 | L5 | 93.78 | 51.75 | 21.24 | 20.79 | 0.02–0.34 | |
| 19 June 2008 | L5 | 100.98 | 54.63 | 25.92 | 20.43 | 0.05–0.33 | |
| 11 July 2010 | L5 | 116.64 | 57.69 | 31.23 | 27.72 | 0.04–0.365 | |
| 12 July 2013 | L8 | 139.32 | 54.63 | 37.08 | 47.61 | NDESI | 0.21–0.39 |
| 15 July 2014 | L8 | 91.53 | 37.26 | 23.04 | 31.23 | 0.20–0.36 | |
| 6 July 2015 | S2A | 61.58 | 32.38 | 16.84 | 12.36 | 0.14–0.27 | |
| 10 June 2016 | S2A | 55.15 | 28.13 | 14.85 | 12.17 | 0.16–0.27 | |
| 5 July 2017 | S2A | 52.10 | 26.37 | 14.68 | 11.05 | 0.16–0.27 | |
| 5 July 2018 | S2A | 51.55 | 25.98 | 14.22 | 11.35 | 0.14–0.28 | |
| 5 June 2019 | S2A | 49.18 | 25.71 | 11.89 | 11.58 | 0.145–0.265 | |
| 30 May 2020 | S2A | 47.69 | 23.88 | 12.10 | 11.71 | 0.18–0.28 | |
| 14 June 2021 | S2A | 48.97 | 23.99 | 12.09 | 12.89 | 0.16–0.26 | |
| 1 November 2022 | S2B | 45.11 | 23.14 | 9.97 | 12.00 | 0.145–0.256 | |
| 7 September 2023 | S2B | 43.94 | 22.91 | 9.30 | 11.73 | 0.14–0.26 | |
| 17 September 2023 | S2B | 58.97 | 33.25 | 11.74 | 13.98 | 0.14–0.27 | |
| 27 September 2023 | S2B | 81.89 | 46.79 | 19.41 | 15.69 | 0.14–0.28 | |
| 2 October 2023 | S2A | 83.70 | 42.57 | 25.63 | 15.50 | 0.14–0.29 | |
| 7 October 2023 | S2B | 93.18 | 42.45 | 34.48 | 16.25 | 0.14–0.25 | |
| 12 October 2023 | S2A | 97.51 | 43.34 | 37.39 | 16.78 | 0.14–0.28 | |
| 6 November 2023 | S2B | 112.90 | 42.49 | 38.64 | 31.77 | 0.14–0.26 | |
Disclaimer/Publisher’s Note: The statements, opinions and data contained in all publications are solely those of the individual author(s) and contributor(s) and not of MDPI and/or the editor(s). MDPI and/or the editor(s) disclaim responsibility for any injury to people or property resulting from any ideas, methods, instructions or products referred to in the content. |
© 2024 by the authors. Licensee MDPI, Basel, Switzerland. This article is an open access article distributed under the terms and conditions of the Creative Commons Attribution (CC BY) license (https://creativecommons.org/licenses/by/4.0/).
Share and Cite
MDPI and ACS Style
Molner, J.V.; Pérez-González, R.; Soria, J.M. Rehabilitation of Urban Beaches on the Mediterranean Coast in Valencia (Spain) Observed by Remote Sensing. Urban Sci. 2024, 8, 3. https://doi.org/10.3390/urbansci8010003
AMA Style
Molner JV, Pérez-González R, Soria JM. Rehabilitation of Urban Beaches on the Mediterranean Coast in Valencia (Spain) Observed by Remote Sensing. Urban Science. 2024; 8(1):3. https://doi.org/10.3390/urbansci8010003
Chicago/Turabian StyleMolner, Juan Víctor, Rebeca Pérez-González, and Juan M. Soria. 2024. "Rehabilitation of Urban Beaches on the Mediterranean Coast in Valencia (Spain) Observed by Remote Sensing" Urban Science 8, no. 1: 3. https://doi.org/10.3390/urbansci8010003