Article

Total Suspended Particulate Matter (TSP)-Bound Carbonaceous Components in a Roadside Area in Eastern Indonesia

by
Muhammad Amin
1,2,*,
Andi Annisa Tenri Ramadhani
3,
Rasdiana Zakaria
4,
Zarah Arwieny Hanami
4,
Rahmi Mulia Putri
3,
Worradorn Phairuang
1,5,*,
Mitsuhiko Hata
1 and
Masami Furuuchi
1
1
Faculty of Geosciences and Civil Engineering, Institute of Science and Engineering, Kanazawa University, Kanazawa 920-1192, Ishikawa, Japan
2
Faculty of Engineering, Maritim University of Raja Ali Haji, Tanjung Pinang 29115, Kepulauan Riau, Indonesia
3
Graduate School of Natural Science and Technology, Kanazawa University, Kanazawa 920-1192, Ishikawa, Japan
4
Environmental Engineering Department, Faculty of Engineering, Universitas Hasanuddin, Gowa 92171, South Sulawesi, Indonesia
5
Department of Geography, Faculty of Social Sciences, Chiang Mai University, Muang 50200, Chiang Mai, Thailand
*
Authors to whom correspondence should be addressed.
Urban Sci. 2024, 8(2), 37; https://doi.org/10.3390/urbansci8020037
Submission received: 18 February 2024 / Revised: 12 April 2024 / Accepted: 15 April 2024 / Published: 22 April 2024

Abstract

:
To evaluate carbonaceous components in the ambient air in the eastern region of Indonesia, 35 Total Suspended Particulate Matter (TSP) samples were collected on four characteristic roadsides on Sultan Alauddin Street, in Makassar City, using a high-volume air sampler. The average TSP concentration was 279.7 μg/m3, which exceeded both the National Ambient Air Quality Standard (NAAQS) of Indonesia and the World Health Organization (WHO) standards. The highest concentration reached 838.6 μg/m3 in the GR (gravel) site, which had the highest number of vehicles and was near a U-turn. TSP concentration was higher during peak hours (morning and late afternoon) than off-peak hours (noon). The main component of the total carbon (TC) fraction was organic carbon (OC), which showed a strong correlation with elemental carbon (EC) (r values for the morning, noon, and late afternoon were 0.89, 0.87, and 0.97, respectively), indicating that the carbon components were derived from common sources. TSP had a strong correlation with carbon components, except for char-EC. OC vs. soot-EC and EC vs. soot-EC also correlated well, suggesting the dominant influence of vehicle exhaust emissions. Non-exhaust emissions had a slight influence during peak hours, particularly at the GR site.

1. Introduction

Over the past few decades, numerous studies have documented the presence of carbonaceous components in ambient particulate matter (PM), including Total Suspended Particulates (TSP) which encompass a wide range of particle sizes and compositions. These components have significant impacts on human health, such as respiratory inflammation, asthma, compromised lung functions, and even promoting cancers. Moreover, TSP and its carbonaceous constituents also affect the environment, influencing climate and visibility [1,2]. Carbonaceous aerosol (CA) refers to the presence of carbon-based particles, either in solid or liquid form, that are spread in the atmosphere. In urban areas, the levels of these components are generally higher compared to those in rural areas, especially Elemental Carbon (EC) and soot-EC, mostly because of the substantial impact of human-produced emissions [3,4]. The carbon components are categorized into two primary types, namely organic carbon (OC) and elemental carbon (EC), based on their chemical, optical, and thermal properties [5]. OC in the atmosphere can be classified into two categories based on its source: primary organic carbon (POC), which is emitted directly into the atmosphere, and secondary organic carbon (SOC), which is formed through chemical reactions in the atmosphere. POC refers to the organic carbon component of particulate matter that is directly discharged into the atmosphere from a variety of primary sources, including combustion processes, biomass burning, automobile exhaust, industrial emissions, and other direct organic compound emissions. POC is emitted directly from these human and natural sources and is frequently associated with specific emission episodes [6,7,8]. In contrast, SOC refers to the organic carbon percentage in particulate matter that arises in the atmosphere as a result of chemical processes involving volatile organic compounds (VOCs) [7,8]. When VOCs undergo complex chemical transformations in the atmosphere, they might produce secondary organic aerosols (SOA), which contribute to SOC. Sunlight, temperature, and the presence of certain atmospheric contaminants all have an impact on these chemical reactions. SOC is generated by atmospheric processes rather than being directly emitted, making it an important component in understanding the aging and transformation of organic aerosols [8,9,10].
EC is predominantly generated from primary sources and can be classified into two separate forms: char-EC and soot-EC. Both types possess distinct chemical and visual characteristics that are essential for understanding their different effects. Char-EC is produced as a result of the incomplete combustion of organic substances, such as biomass or fossil fuels [11,12]. This process commonly takes place in environments with low oxygen levels, leading to partially charred carbon particles. Primary contributors to char-EC emissions include the burning of household and agricultural waste, certain industrial processes, and emissions from older or less efficient vehicles [13,14,15]. Char-EC particles are larger, have a greater graphitic composition, and are associated with unique environmental and climatic impacts as a result of their distinctive physical characteristics. Soot-EC, on the other hand, arises from the incomplete combustion of hydrocarbons, predominantly present in fossil fuels such as diesel, gasoline, and other petroleum derivatives [11,13,14]. Nitrogen dioxide is a prominent constituent of diesel exhaust emissions and is strongly linked to emissions from diesel engines, as well as other types of fossil fuel combustion [13,14]. Soot-EC particles are often smaller, possess a larger surface area, and pose a greater risk to human health when inhaled due to their capacity to penetrate deeper into the lungs. The differentiation between char-EC and soot-EC is pivotal, not only in terms of their origin and composition, but also regarding their individual effects on human health and the environment [16,17]. Although char-EC’s larger particles with higher graphitic content have distinct effects on climate, the smaller particles of soot-EC present a more significant health hazard. This highlights the necessity for tailored strategies to tackle their emissions.
Since carbon components are the major constituents of various size fractions of PM such as PM2.5, PM10, and Total Suspended Particles (TSP), they are commonly used as an indicator of the source of emitted aerosol particles [18,19]. The OC/EC and char-EC/soot-EC ratios are frequently used to identify the major sources of PMs [20,21]. In several reports, PyOC (Pyrolysis)/OC4 and soot-EC/TC (total carbon) ratios were used to differentiate the emission sources from biomass and fossil fuels [22,23]
In Southeast Asia (SEA), Indonesia is the main contributor to carbonaceous aerosols that are emitted into the atmosphere, especially from forest fires in the peatland areas [19,23,24,25]. This is an annual occurrence in Sumatra and Kalimantan Islands. However, compared to other SEA countries such as Malaysia, Singapore, and Thailand [22,26], only limited information is available for Indonesia. Most of the studies that have been published in the peer-reviewed journal are related to biomass burning from forest fires [24,25], and only a few studies dealing with the evaluation of carbon components in urban areas have appeared. In addition, the data for all these documents were collected on the three major islands in Indonesia, namely Java, Sumatra, and Kalimantan [19,27,28] To the best of our knowledge, information concerning the carbonaceous components of PMs either PM2.5, PM10, or TSP in the eastern part of Indonesia (Sulawesi and Papua Islands) has not been previously collected and evaluated.
Makassar, the most populous city in the eastern region of Indonesia and an important urban hub on Sulawesi Island, demonstrates a greater vulnerability to particulate pollution compared to other cities in the area. The increased susceptibility can be ascribed to the substantial activity of its citizens, congested traffic conditions, and geographical fac-tors that limit the dispersion of pollutants. In addition, the increasing urbanization and development of Makassar have resulted in a rise in construction and vehicular emissions, which has contributed to the relatively higher levels of particulate matter in the city. Therefore, the objective of this study was to generate baseline information on the carbonaceous components of TSP, such as OC, EC, char-EC, and soot-EC, at different times (peak and off-peak hours) and in various roadside environments, in Makassar City, eastern region of Indonesia. Our previous publication, a conference proceeding, offered an initial overview of TSP data [29], focusing on basic concentration levels. In contrast, the current study delves deeper, analyzing not only TSP concentration but also its carbon components, emission sources, and the potential health impacts. This work represents a significant advancement from our initial findings, providing a more detailed and comprehensive understanding of TSP and its environmental implications in the eastern part of Indonesia.

2. Methodology

2.1. Study Area

Makassar City is situated on Sulawesi Island, one of the five major islands and located in the eastern part of Indonesia or between 119°24′17′38″ East Longitude and 5°08′06′19″ South Latitude. The area of Makassar City is around 175.77 square kilometers which includes 15 subdistricts. The climate in this city is generally similar to other regions in Indonesia which has two seasons, i.e., rainy, and dry season. The southwest monsoon (from May to September) and the northwest monsoon (from November to March) are the two main monsoons that affect Makassar as similar with other cities in Indonesia. The monsoon season can bring high winds and heavy rain [30].
Throughout the year, the city experiences relatively constant temperatures (ranges from around 25 °C to 32 °C) with high humidity levels (Table S1). Humidity can often exceed 80% or even higher, especially during the wet season. The wet season normally starts from November to April. During this period, the city experiences heavy rainfall, with January and February being the wettest months. On the other hand, the dry season commonly starts from May to October. At this time, the rainfall is lower than usual; however, the humidity remains high [30].
Due to its population and development, the statistical agency of Indonesia (BPS) categorizes this city as a Metropolitan city. Based on their data, the total population in Makassar City was 1,427,619 in 2022 [30]. The growth of the population has led to an increase in transportation volume. Based on the BPS data, in 2021, the total number of vehicles in Makassar City was around 858,755 units. Motorcycles accounted for more than 79% of the total vehicles [30]. The sampling location was carefully chosen on Sultan Alauddin Street, a major road in Makassar, in order to conduct a comprehensive assessment of particle pollution in an urban environment. The selection of this area was based on its diverse environmental and transportation features, which provide a comprehensive overview of urban air quality affected by many types of pollution.
The study employed four different roadside environments, namely paved (PA), gravel (GR), paved with a pedestrian walk (PP), and unpaved (UP), along Sultan Alauddin Street to cover a broad spectrum of urban pollution situations. The selection of these environments was based on their ability to represent a wide range of traffic density and urban activities, which are known to have an impact on particulate matter levels. This ensures that the dataset is diverse and representative. The sampling was carried out in three distinct periods: morning, afternoon, and late afternoon. Each period was repeated three times to enhance the reliability and validity of the data collected. This approach was aimed at capturing the dynamic character of urban pollution, which can vary significantly over time due to factors such as traffic patterns, human behavior, and weather conditions. The details of the sampling site are shown in Figure 1 and Figure S1.

2.2. Sampling Times and Procedures

TSP sampling was carried out hourly using a high-volume air sampler (HVAS) with a flowrate of 2 m3/min from Monday to Thursday of 28 March to 31 March 2022, in PA (paved), GR (gravel), PP (paved with pedestrian walkway), and UP (unpaved) sites, respectively. The sampling period was divided into three periods, i.e., morning (peak hour; 07:00–11:00 a.m.), noon (off-peak hour; 12:00–16:00 p.m.), and late afternoon (peak hour; 17:00–20:00 p.m.). The details of sampling sites and times are listed in Table 1. To identify the effect from vehicle emissions, we installed a cam-recorder and counted the number of vehicles manually based on types and sampling period, as listed in Table 2. Quartz Fiber Filters (QFFs) with a diameter of 110 mm were used and all these filters were prebaked at 350 °C to remove all the possible contaminants following the Ministry of Environment, Japan (MOEJ), procedure [31]. It has been reported that baking the filter at temperatures above 500 °C can activate the fiber surface, thereby enhancing the absorption of OC by the filters, especially after the filters have cooled down [5,32].
All filters were then stored in the weighing chamber for 48 h. The chamber temperature and humidity were maintained at 21.5 ± 1.5 °C and 35 ± 5%, respectively, before and after sampling [31]. All these filters were produced at Atmospheric Environment and Pollution Control Engineering Laboratory, Kanazawa University, Japan. There were 35 samples and 1 travel blank filter for the four sites and three different times. At each period, filters were changed three times, aiming for the repetition in each period. Initially, 36 samples were anticipated; however, 1 sample was excluded due to damage. All filters were covered with aluminum foil and stored in zip-lock plastic bags to prevent contamination during their transport to and from the sampling site in Indonesia.

2.3. Carbon Analyses

Carbonaceous components of the TSP in this study were evaluated by using a carbon analyzer and following the Interagency Monitoring of Protected Visual Environments-Thermal/Optical Reflectance (IMPROVE-TOR) method at Atmospheric Environment and Pollution Control Engineering Laboratory, Kanazawa University, Japan. The total analyzed area of the QFF was from a 1.5 cm2 or 1 cm × 1.5 cm section that was punched from the filter using stainless-steel-based materials, and a cleanup with ethanol was conducted before and after the analyses. Throughout the process, the analyzer temperatures were continuously increased to 120, 250, 450, 550, 700, and 800 °C to evaluate both OC and EC. The OC1, OC2, OC3, and OC4 were evaluated in a non-oxidizing oven at temperatures of 120, 250, 450, and 550 °C. Then, an oxidizing atmosphere of oxygen (O2, 2%) and helium (He, 98%) was supplied to the oven. During this process, the temperature was gradually increased to 550, 700, and 800 °C to produce EC1, EC2, and EC3, respectively. The pyrolysis of organic carbon (PyOC) was determined during the addition of O2 to the experimental atmosphere and was used as an indicator of the amount of OC evolved from EC1. Total OC is defined as OC1 + OC2 + OC3 + OC4 + PyOC, while EC is the sum of the overall EC fraction minus PyOC. OC in this study also separated into POC and SOC. The separation of POC and SOC in OC is critical for understanding the sources and formation processes of organic aerosols in the atmosphere. There were several approaches to calculate those components. In this study, POC and SOC was calculated using the EC tracer method [33,34].
POC = (OC/EC) min × EC
SOC = OC − POC
where the (OC/EC) min is the minimum ratio of OC/EC for all the samples in Makassar City.
As mentioned above, EC was divided into char-EC and soot-EC. The char-EC was calculated from the EC1-PyOC, while soot-EC was the total of EC2 and EC3. The total amount of OC and EC is defined as total carbon or TC. All these types of carbon were used to evaluate the characteristics of PMs in Makassar City. Regarding quality assurance and quality control (QA/QC), the calibration of the carbon analyzer was performed by analyzing a reference standard solution (sucrose; C12H22O11 (196-00015, Sucrose, Wako Pure Chemical Industries, Ltd., Osaka, Japan)). The travel blank filter was analyzed to specify the total amount of carbon contaminants. The data were subtracted from the travel blank filter to ensure that all the carbon components were from the ambient air in Makassar City.

3. Results and Discussion

3.1. Hourly Variability of TSP

The hourly concentrations of TSP in four different characteristic roadsides are listed in Table 3 and shown in Figure 2a,b. The concentrations of PMs were higher during peak hour in the morning and the late afternoon. This is attributed to the fact that the morning and nighttime is commonly busier than in the afternoon [35]. In Indonesia, the working day starts at 08:00 a.m. and ends at 16:00 p.m. (8 h/day), while for schools, this period depends on the individual school, but, on average, schools start at 07:00 a.m. Several schools, however, open between 06:30 and 07:30 a.m. The end of school also depends on each school, where some schools that use the full hours system might not end until 15:00 or 16:00 p.m. Thus, the higher PMs concentration during rush-hour morning and late afternoon seem reasonable considering the school and working hours of the citizens in Makassar. The average for all TSP levels in Sultan Alauddin (280 μg/m3), Makassar, was higher than the National Ambient Air Quality Standard (NAAQS) of Indonesia for a 24 h average (230 μg/m3), especially for the rush-hour morning and late-noon values, which approached 839 μg/m3 in GR site [36].
Conversely, vehicle numbers experience a significant decline during the lunchtime period in comparison to the morning and late afternoon. This decrease can be ascribed to diverse lunchtime behaviors: while most employees and students may choose to consume their meals within the surroundings of their workplaces and schools, some members of the workforce, especially those lacking access to company or school cafeterias, prefer to dine elsewhere. In Indonesia, it is common for workers to visit neighboring restaurants or street food vendors, particularly in urban areas where there are many choices available. The combination of lunchtime patterns is responsible for the observed variations in vehicle activity. However, as seen in Figure 2b, the TSP level in the sixth periods (n6 or 15:00–16:00 p.m.) at the PP site was higher than that for other sampling periods. This can be attributed to a traffic jam that was caused by a demonstration of college students. There were many cars stuck on the road due to a demonstration by the students and the access road was blocked by them. Compared to all sites, the concentration of TSP at the PA site was the lowest. This can be attributed not only to the characteristics of this site but also to a heavy rain event that occurred on Monday, 28 March 2022, during which TSP particles precipitated upon colliding with raindrops, resulting in their deposition on the ground [37]. Regarding the PA site, as explained in Section 2.1, because the roadside was paved, this inhibited dust from being resuspended in the air.

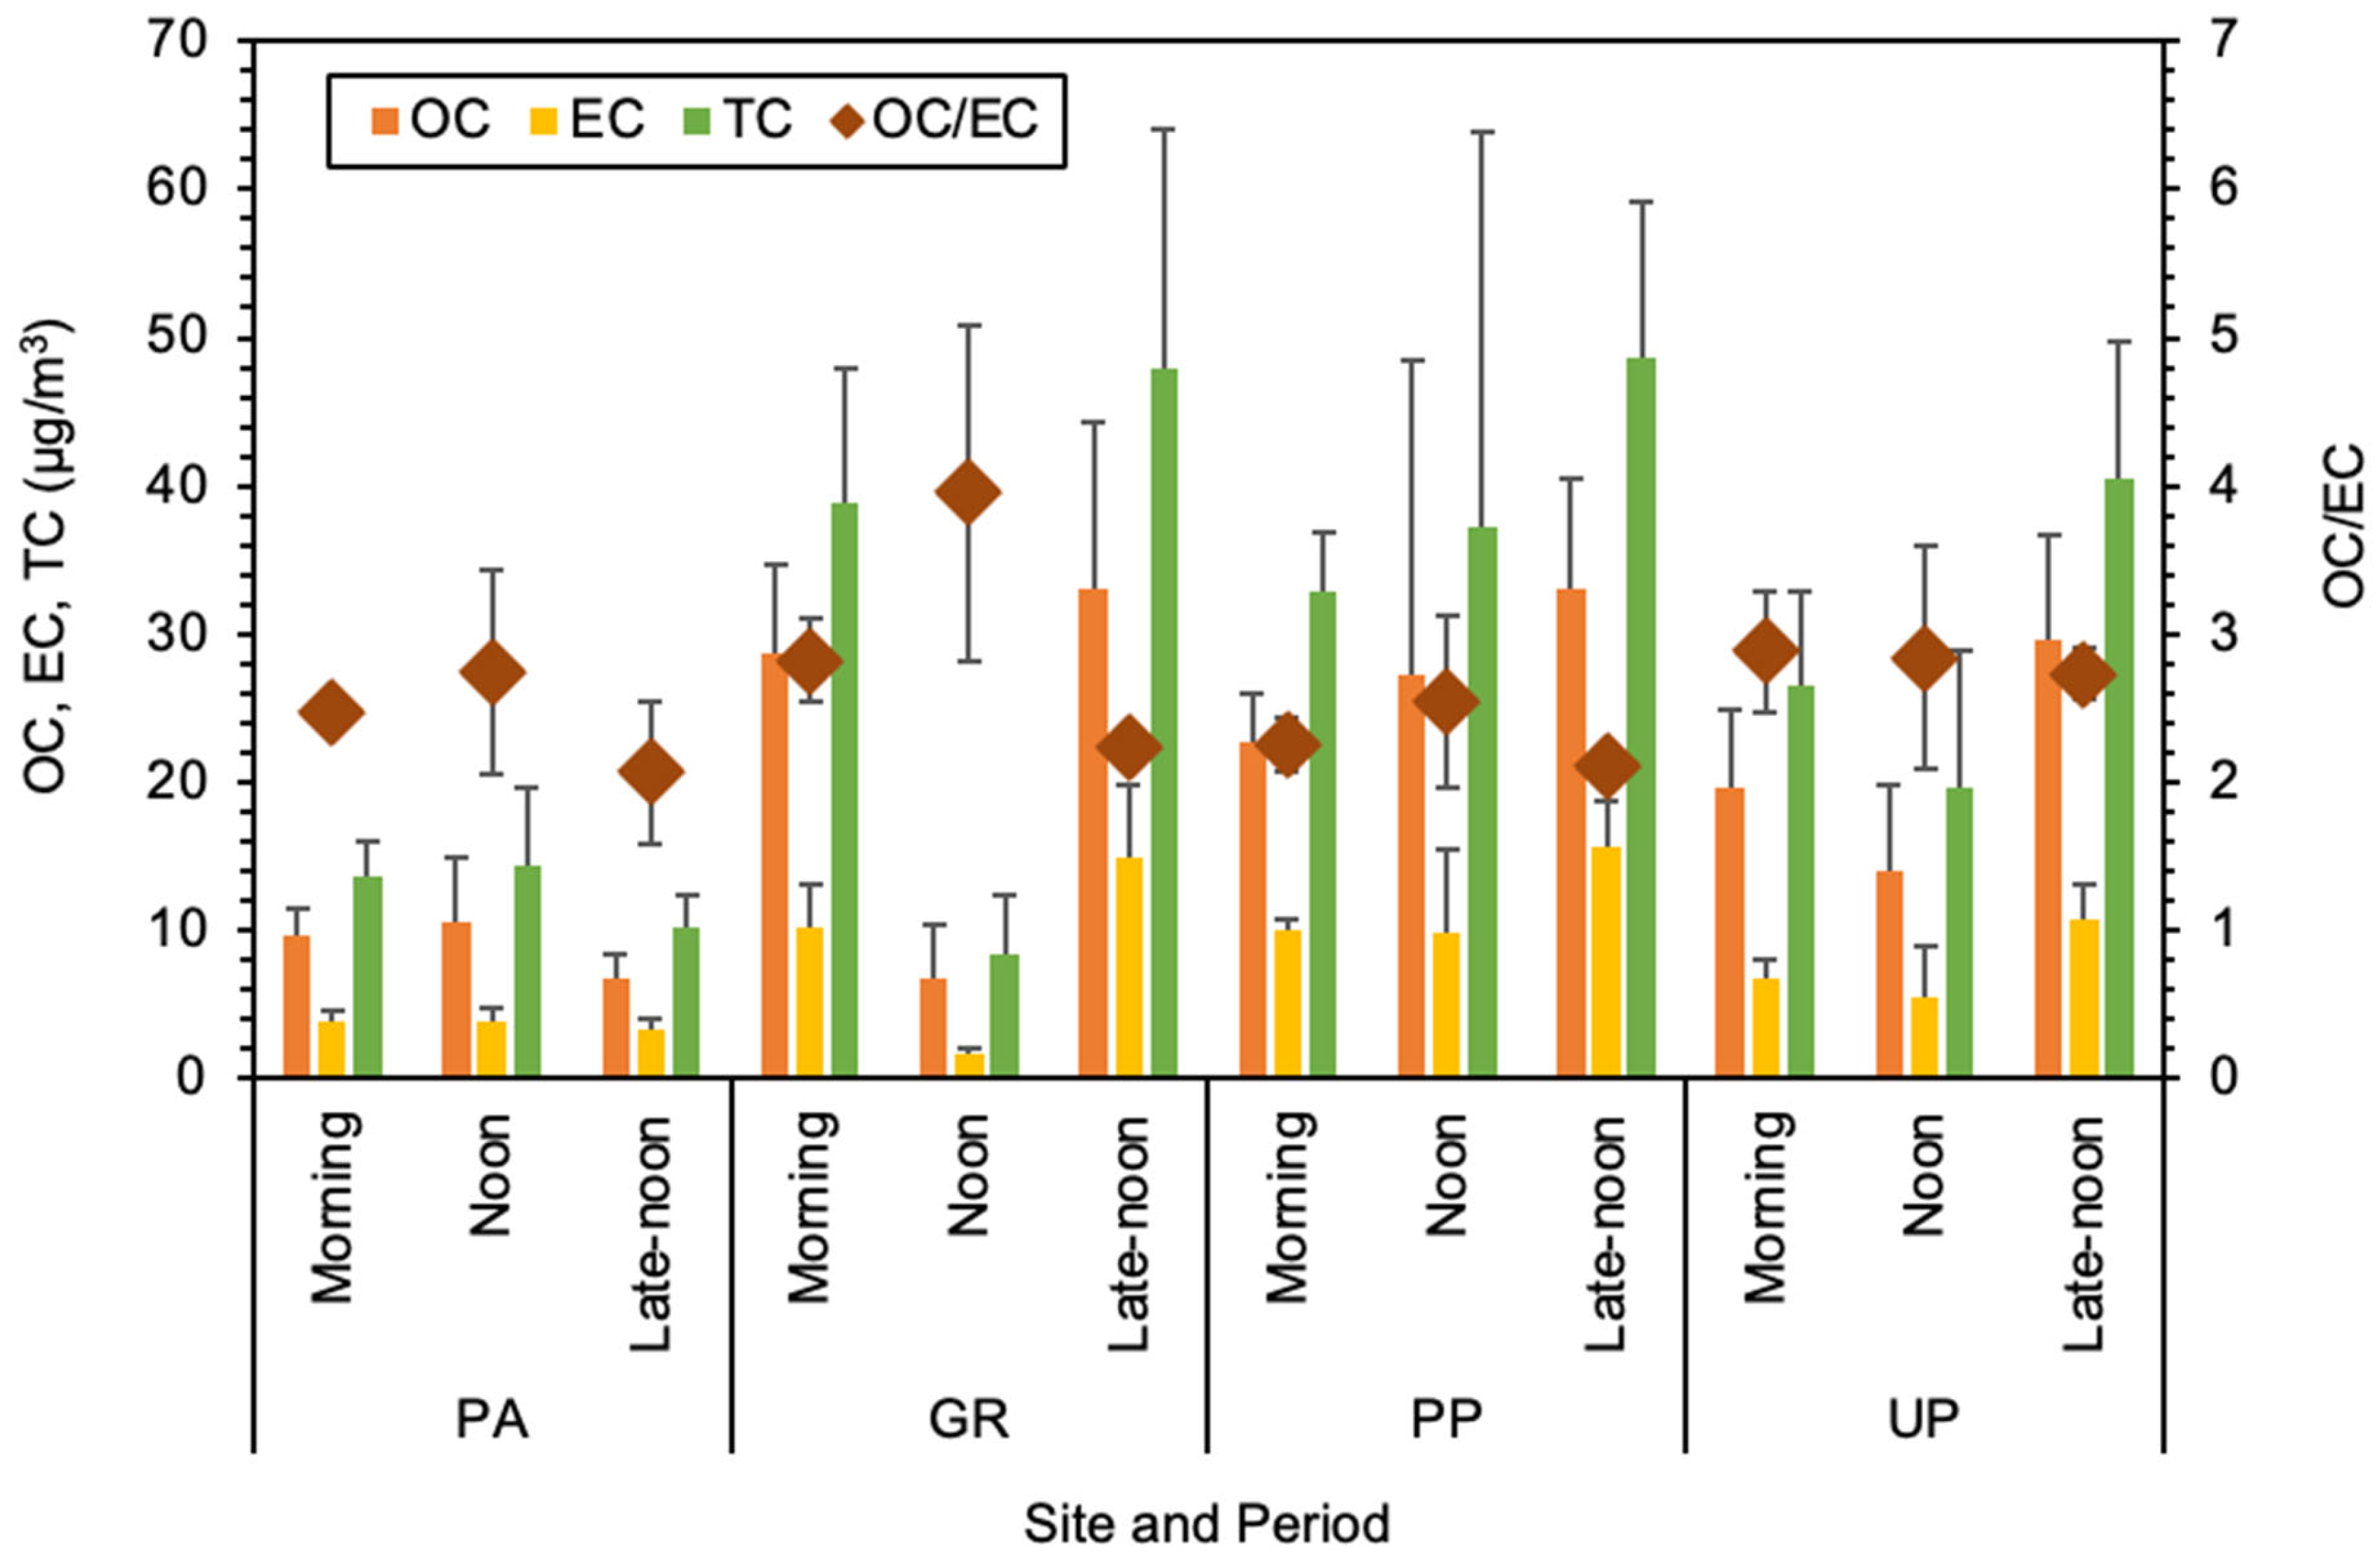
3.2. Carbonaceous Fraction in TSP and Their Relation to Emission Sources

The distribution of each carbon component at three different times (morning, noon, and late afternoon) is depicted in Figure 3. Figure 4 presents the hourly mass concentration of carbon components (OC, EC, and TC) within TSP observed in Makassar City. Notably, OC2 and OC3 levels were consistently higher across various sites and sampling periods, indicating their predominant presence in the carbon component fraction. The analysis revealed significant variations in the levels of OC and EC, which were found to correlate strongly with specific times of the day and unique roadside environments. This variation underscores the intricate dynamics of urban emissions and their dependence on time and location. OC accounted for more than 60% of the TC, suggesting a significant contribution from primary sources such as vehicles emission. This observation is in agreement with the findings of Tang et al., who reported the impact of urban activities on the fluctuation of carbonaceous chemicals [38].
Soot-EC was notably higher than char-EC, particularly during the morning and late afternoon when the number of vehicles was higher than at noon [39,40]. This is also related to the characteristics of the sites, which were significantly impacted by vehicle emissions, as indicated by the ratio (char-EC/soot-EC) being less than one. The OC/EC ratio in this study was comparable for the entire period and locations, ranging within 1.67–2.87, suggesting that OC and EC were emitted from the common sources such as vehicles emission. This is consistent with findings reported in a previous study by Demir et al. [41] who found low OC/EC ratios, pointing to diesel emissions as a major contributor. Our findings also aligned with the data reported by Shandilya and Kumar [42], who emphasized the variations in EC emissions from buses fueled by different sources, indicating a significant correlation between the type of fuel and carbon emissions. Our findings were also confirmed by the strong correlation between OC and EC as shown in Figure 5. These Pearson correlation coefficients (r) for carbon were 0.89, 0.87, and 0.97 in the morning, noon, and afternoon, respectively. The main sources of carbon in this study appear to be from emissions derived from vehicle engines from Sultan Alauddin Road. The higher level of EC detected during peak hours emphasized the substantial influence of vehicular traffic, particularly from large vehicles as reported by Demir et al. and Yan et al. [31,43]. The ratio of POC/SOC (Table 4) during the entire period was 2.58 ± 1.70, indicating that fresh emissions were the main sources of the carbon component of the TSP [44]. Nevertheless, these data indicate that the proportion of SOC compared to POC varies during the course of the day. The morning period had the highest POC/SOC ratio at all locations, indicating a prevailing impact of direct emissions from morning traffic. Throughout the day, the lowest ratio was observed during the afternoon. This drop can be attributed to less traffic and enhanced air oxidation processes which promoted the creation of SOC. During the late afternoon, there was noticeable increase in the ratio of POC/SOC compared to midday. This increase may be linked to the increased traffic in the late afternoon (Table S2).
Since, the monitoring period was conducted at the same month, there was no significant correlation between carbonaceous component of TSP and the meteorological condition (See Figures S2 and S3). Taking into account the air mass backward trajectory in each sampling site, it originated from the Southwest and West of Makassar city as shown in Figure S4.

3.3. Influence of Exhaust and Non-Exhaust Emission from Road Traffic

The interaction of exhaust and non-exhaust sources were added to the complexity of carbonaceous components of PMs in the urban environment. Road traffic has long been recognized as the main source of TSP due to the fact that it emits large numbers of particles and carbonaceous components [45]. While the dominant particle sources have traditionally been associated with combustion processes from vehicle exhaust [46], non-exhaust emissions from vehicles also represent a significant source of particulate matter and have gained increasing attention with the advent of electric vehicles. The TSP and its carbonaceous components were produced from both sources, i.e., as exhaust, and non-exhaust emission [47]. Regarding exhaust emission, the OC and EC values at both sites were highly correlated, suggesting that the carbon components arose from the same source. Emission from vehicle exhaust clearly occurred, as seen from the EC concentration, especially soot-EC which is emitted directly from vehicle combustion. The concentration of soot-EC at all sites and all periods was higher than that for char-EC and accounted for more than 75.02% of the total EC, suggesting that vehicle combustion is the main source of carbon components at all sites [45]. This is consistent with the good correlation of OC vs. soot-EC and EC vs. soot-EC, as displayed in Figure 6c,e, respectively.
Regarding the effect of non-exhaust vehicle emissions, carbonaceous components at those four sites might be influenced by tire wear abrasion and the resuspension of road dust in the air. These processes are predominantly driven by vehicle movement, although they are also significantly influenced by human activities near the sampling sites and along the roads. The interplay among these components is intricate, reflecting the diverse character of urban pollution sources. Tire wear abrasion is a significant source of non-exhaust emissions, which release OC and EC particles into the atmosphere. These particles are produced when tire material is mechanically broken down, releasing carbonaceous substances into the atmosphere. Road dust resuspension, intensified by vehicle traffic, releases a combination of OC, EC, TC, and soot-EC from many sources, such as asphalt erosion, deposition of vehicle exhaust, and previously settled airborne particles. The emissions are intensified by the increased movement of vehicles, particularly during rush hour in the morning and late afternoon, which leads to heightened activity along roads [48]. As seen in Figure 7a–d, the rise in carbon components (OC, EC, TC, and soot-EC) during peak traffic times does not exhibit a linear correlation with the increase in TSP, which is especially evident at the GR site. This discovery indicates that road surfaces have a substantial role in the presence of suspended particles due to tire wear and road dust. However, they are not the only factor responsible for the differences in carbonaceous component concentrations in TSP. This observation is essential because it suggests that there are other sources or processes that contribute to the overall carbonaceous composition of TSP. The unique environmental and infrastructural conditions at the GR site, characterized by its gravel or unpaved composition, emphasize the site’s significance as a primary sources of suspended road dust particles. The physical properties of these surfaces make it easier for higher amounts of particulate matter to be released into the atmosphere, particularly under the mechanical action of moving vehicles [49]. Interestingly, at noon across all sites, we documented a linear correlation between carbon components and TSP concentrations. This pattern aligns with a period of reduced human activity outdoors, attributable to the daytime working hours prevalent in Makassar City. The decreased movement of vehicles and pedestrians during these hours is expected to result in less tire wear abrasion and road dust resuspension, indicating a change in the sources that contribute to the detected carbonaceous components.
Furthermore, a previous study by Thorpe and Harrison [50] clarified that metallic elements like Cu and Sb originating from brake wear, as well as Zn from tire wear, were substantial contributors to non-exhaust emissions. However, it is important to note that these elements are simply a component of a larger combination of sources. The presence of these elements, as well as others that indicate crystal minerals like silicon (Si), iron (Fe), and calcium (Ca), highlight the complex composition of road dust and the difficulties in identifying the chemical fingerprints of non-exhaust emissions. The lack of a straightforward diagnostic ratio for tire wear, along with the interplay of other non-exhaust sources such as the simultaneous deposition and resuspension of brake and tire dust, increases the intricacy of determining and measuring these contributions to urban PMs.

3.4. Potential Risk Estimation from EC Exposure

Carbonaceous components, particularly elemental carbon (EC), have an adverse effect to the human health. Both short and long-term exposure to EC could potentially contribute to the development of various diseases, especially acute myocardial infarction, and in some cases, lead to fatalities [51,52]. Amin et al., found that more than 2 μg of EC in the PM0.5–1 was inhaled by the adults and children in Batam island for 8 h of activity every day [53]. By employing a similar approach, we calculated the potential health risk using EC data. EC was chosen over OC for analysis due to its persistent characteristics in the air and because its sources are exclusively primary, as detailed in the previous section. To calculate the inhalation dose (D), three parameters, i.e., concentration of EC (Cp, μg/m3), inhalation rate of human both adults and children (IR(Δt) m3/min), and exposure time (dt, min), were considered. The equation and detail calculation can be seen in the Supplementary Materials.
Based on the calculated inhalation doses for both adults and children on Sultan Alauddin Road, Makassar, the highest risk was found during peak hours, particularly in the late afternoon period. The lowest risk taking into account the EC level was found in the PP sites as explained before, which could be associated with the heavy rain during the monitoring. The highest inhalation doses for adults and children were 1.39 ± 0.28 and 1.17 ± 0.24 µg for an 8 h exposure period, respectively. Detailed information regarding the inhalation doses of EC for both adults and children can be found in Table S3.
In order to control the vehicular emissions reported in this study, effective measures such as improving traffic control to mitigate congestion during rush hour, promoting public transportation, and encouraging the usage of electric vehicles are all possibilities. Strengthening infrastructure, such as by paving gravel roads and conducting regular street maintenance, could reduce non-exhaust emissions. Furthermore, enhancing public awareness of the effects of emissions and implementing more strict regulations for vehicle maintenance could jointly contribute to improved air quality in Makassar City.

3.5. The Limitation of the Study

The approach used in this study was designed to enhance understanding of changes in TSP concentrations in urban roadside environments. It involved short-term sampling conducted three times a day at different intervals. The aim was to capture fluctuations in TSP levels related to traffic patterns by collecting samples at 2–3 h intervals. While this approach provided beneficial temporal resolution, it may not adequately represent long-term TSP concentration trends. The decision to use short-duration sampling was made to reduce the possibility of sample saturation and maintain the chemical integrity of the samples for analysis.
However, there were some limitations that potentially affected the quality of the results. The study was constrained by the availability of sampling equipment, which limited the ability to thoroughly compare TSP concentrations across different periods and sites. This highlights the need for further studies that integrate both short-term and long-term sampling to comprehensively understand TSP behavior in urban environments.
Furthermore, the purpose of comparing short-term or hourly based TSP levels with the 24 h National Ambient Air Quality Standards (NAAQS), as discussed in Section 3.1, was to specifically identify occurrences of high pollution levels rather than to evaluate compliance with regulatory standards. This comparison emphasized the importance of continuous monitoring to detect temporary increases in TSP levels that might have immediate effects on health and the environment, even if these increases do not significantly influence the average concentrations over 24 h. Moreover, these limitations direct future research efforts, such as employing a combination of integrative and hourly sampling to better understand the origins and temporal fluctuations of urban air pollution, particularly PM as TSP.

4. Conclusions

In this study, we evaluated the carbonaceous components in total suspended particulate (TSP) in the eastern region of Indonesia. The sampling sites included four characteristic roadside sites in Makassar City, South Sulawesi. Based on the results, the average for the TSP in all sites was higher than NAAQS Indonesia (230 μg/m3 daily average), except in the PA site, which was due to the heavy rain. The concentrations of TSP during rush hour (morning and late afternoon) were higher than at noon because of human activities, i.e., students and workers going and back from/to school and offices. OC is the main component of TC, accounting for more than 60% of the total, regardless of the sampling site or collection period. OC and EC were derived from common sources. Both carbons have a good correlation with soot-EC, while there was no significant correlation between either of these with char-EC, suggesting that the main sources of carbon components in this study was vehicle exhaust emission. This conclusion was also confirmed by the lower char-EC/soot-EC ratio, which was less than unity. However, non-exhaust emission sources, such as road dust and tire wear abrasion, were not negligible, especially at the GR site during rush hour. Thus, both sources, vehicles exhaust and vehicle non-exhaust emissions, play an important role and appear to be the two main sources of TSP in Alauddin Street, Makassar City, Indonesia.

Supplementary Materials

The following supporting information can be downloaded at: https://www.mdpi.com/article/10.3390/urbansci8020037/s1, Figure S1: Detail of sampling site in Sultan Alauddin Street, Makassar city, South Sulawesi, Eastern region Indonesia (a) PA (b) GR (c) PP (d) UP sites; Figure S2: Pearson correlation between TSP, carbonaceous components, and meteorological condition at each sampling site in Sultan Alauddin Street, Makassar city, South Sulawesi, Eastern region Indonesia (a) PA (b) GR (c) PP (d) UP sites; Figure S3: Pearson correlation between TSP, carbonaceous components, and meteorological condition at all sampling site in Sultan Alauddin Street, Makassar city, South Sulawesi, Eastern region Indonesia (a) Morning (b) Afternoon (c) Late-afternoon; Figure S4: Air mass backward trajectory arrived at the sampling site in Sultan Alauddin Street, Makassar city, South Sulawesi, Eastern region Indonesia; Table S1: Primary and secondary organic carbon (POC and SOC) in Sultan Alauddin Street, Makassar city, South Sulawesi, Eastern region Indonesia; Table S2: Inhalation dose based on elemental carbon in Sultan Alauddin Street, Makassar city, South Sulawesi, Eastern region Indonesia; Meteorological condition during the sampling period in each site, in Sultan Alauddin Street, Makassar city, South Sulawesi, Eastern region Indonesia.

Author Contributions

Conceptualization, M.A., A.A.T.R., Z.A.H. and R.Z.; methodology, M.A., M.F. and M.H.; investigation, A.A.T.R., Z.A.H., R.M.P. and R.Z.; resources, M.A. and R.M.P.; data curation, M.A. and M.F.; writing—original draft preparation, M.A.; writing—review and editing, M.F., M.H. and W.P.; supervision, M.F. and M.H.; project administration, A.A.T.R. and Z.A.H.; funding acquisition, M.F. and M.H. All authors have read and agreed to the published version of the manuscript.

Funding

This research was funded by Sumitomo Foundation (Kankyo Kenkyu Josei 2020–2022), Japan.

Data Availability Statement

Data are contained within the article.

Acknowledgments

The authors wish to thank Milton S. Feather for improving the English in this paper. The authors gratefully acknowledge the students and lecturers of Environmental Engineering Department of Universitas Hasanuddin, Makassar for the collaboration and sampling process.

Conflicts of Interest

The authors declare no conflicts of interest.

References

  1. Li, H.; Wang, Q.; Yang, M.; Li, F.; Wang, J.; Sun, Y.; Wang, C.; Wu, H.; Qian, X. Chemical characterization and source apportionment of PM2.5 aerosols in a megacity of Southeast China. Atmos. Res. 2016, 181, 288–299. [Google Scholar] [CrossRef]
  2. Chuang, H.; Sun, J.; Ni, H.; Tian, J.; Lui, K.H.; Han, Y.; Cao, J.; Huang, R.; Shen, Z.; Ho, K.F. Characterization of the chemical components and bioreactivity of fine particulate matter produced during crop-residue burning in China. Environ. Pollut. 2019, 245, 226–234. [Google Scholar] [CrossRef] [PubMed]
  3. Chen, B.; Du, K.; Wang, Y.; Chen, J.; Zhao, J.; Wang, K.; Zhang, F.; Xu, L. Emission and Transport of Carbonaceous Aerosols in Urbanized Coastal Areas in China. Aerosol Air Qual. Res. 2012, 12, 371–378. [Google Scholar] [CrossRef]
  4. Kouassi, A.; Doumbia, M.; Silue, S.; Yao, E.; Dajuma, A.; Adon, M.; Touré, N.; Yoboue, V. Measurement of Atmospheric Black Carbon Concentration in Rural and Urban Environments: Cases of Lamto and Abidjan. J. Environ. Prot. 2021, 12, 855–872. [Google Scholar] [CrossRef]
  5. Karanasiou, A.; Minguillon, M.C.; Viana, M.; Alastuey Putaud, J.P.; Maenhaut, W.; Panteliadis, P.; Mocnik, G.; Favez, O.; Kuhlbusch, T.A.J. Thermal-optical analysis for the measurement of elemental carbon (EC) and organic carbon (OC) in ambient air a literature review. Atmos. Meas. Tech. 2015, 8, 9649–9712. [Google Scholar]
  6. Turpin, B.J.; Huntzicker, J.J. Identification of secondary organic aerosol episodes and quantitation of primary and secondary organic aerosol concentrations during SCAQS. Atmos. Environ. Part A Gen. Top. 1991, 25, 2071–2081. [Google Scholar] [CrossRef]
  7. Lyu, R.; Zhang, J.; Wu, J.; Feng, Y. Primary Carbonaceous Particle Emission from Four Power Plants with Ultralow Emission in China. ACS Omega 2021, 6, 1309–1315. [Google Scholar] [CrossRef] [PubMed]
  8. Hallquist, M.; Wenger, J.C.; Baltensperger, U.; Rudich, Y.; Simpson, D.; Claeys, M.; Dommen, J.; Donahue, N.M.; George, C.; Goldstein, A.H.; et al. The formation, properties, and impact of secondary organic aerosol: Current and emerging issues. Atmos. Chem. Phys. 2009, 9, 5155–5236. [Google Scholar] [CrossRef]
  9. Moretti, S.; Tassone, A.; Andreoli, V.; Carbone, F.; Pirrone, N.; Sprovieri, F.; Naccarato, A. Analytical study on the primary and secondary organic carbon and elemental carbon in the particulate matter at the high-altitude Monte Curcio GAW station, Italy. Environ. Sci. Pollut. Res. 2021, 28, 60221–60234. [Google Scholar] [CrossRef]
  10. Volkamer, R.; Jimenez, J.L.; San Martini, F.; Džepina, K.; Zhang, Q.; Salcedo, D.; Molina, L.T.; Worsnop, D.R.; Molina, M.J. Secondary organic aerosol formation from anthropogenic air pollution: Rapid and higher than expected. Geophys. Res. Lett. 2006, 33, L17811. [Google Scholar] [CrossRef]
  11. Choochuay, C.; Pongpiachan, S.; Tipmanee, D.; Suttinun, O.; Deelaman, W.; Wang, Q.; Xing, L.; Li, G.; Han, Y.; Palakun, J.; et al. Impacts of PM2.5 sources on variations in particulate chemical compounds in ambient air of Bangkok, Thailand. Atmos. Pollut. Res. 2020, 11, 1657–1667. [Google Scholar] [CrossRef]
  12. Mishra, M.K.; Kulshrestha, U.C. Source Impact Analysis Using Char-EC/Soot-EC Ratios in the Central Indo-Gangetic Plain (IGP) of India. Aerosol Air Qual. Res. 2021, 21, 200628. [Google Scholar] [CrossRef]
  13. Kumar, A.; Singh, S.; Kumar, N.; Singh, N.K.; Kumar, K.; Chourasiya, S. Assessment of carbonaceous fractions in ambient aerosols at high altitude and lowland urban locations of Kumaon Province, Indian Himalaya. SN Appl. Sci. 2021, 3, 83. [Google Scholar] [CrossRef]
  14. Vilcassim, M.J.; Thurston, G.D.; Peltier, R.E.; Gordon, T. Black Carbon and Particulate Matter (PM2.5) Concentrations in New York City’s Subway Stations. Environ. Sci. Technol. 2014, 48, 14738–14745. [Google Scholar] [CrossRef] [PubMed]
  15. Healy, R.M.; Wang, J.M.; Jeong, C.; Lee, A.K.; Willis, M.D.; Jaroudi, E.; Zimmerman, N.; Hilker, N.; Murphy, M.; Eckhardt, S.; et al. Light-absorbing properties of ambient black carbon and brown carbon from fossil fuel and biomass burning sources. J. Geophys. Res. Atmos. 2015, 120, 6619–6633. [Google Scholar] [CrossRef]
  16. Han, Y.M.; Cao, J.J.; Chow, J.C.; Watson, J.G.; An, Z.S.; Jin, Z.D.; Fung, K.; Liu, S.X. Evaluation of the thermal/optical reflectance method for dis-crimination between char-and soot-EC. Chemosphere 2007, 69, 569–574. [Google Scholar] [CrossRef] [PubMed]
  17. Han, Y.M.; Cao, J.J.; Lee, S.C.; Ho, K.F.; An, Z.S. Different characteristicsof char and soot in the atmosphere and their ratio as an indicator forsource identification in Xi’an, China. Atmos. Chem. Phys. 2010, 10, 595–607. [Google Scholar] [CrossRef]
  18. Banoo, R.; Sharma, S.K.; Rani, M.; Mandal, T.K. Source and Source Region of Carbonaceous Species and Trace Elements in PM10 over Delhi, India. Environ. Sci. Proc. 2021, 8, 2. [Google Scholar] [CrossRef]
  19. Amin, M.; Putri, R.M.; Handika, R.A.; Ullah, A.; Goembira, F.; Phairuang, W.; Ikemori, F.; Hata, M.; Tekasakul, P.; Furuuchi, M. Size-Segregated Particulate Matter down to PM0.1 and Carbon Content during the Rainy and Dry Seasons in Sumatra Island, Indonesia. Atmosphere 2021, 12, 1441. [Google Scholar] [CrossRef]
  20. Pio, C.; Cerqueira, M.; Harrison, R.M.; Nunes, T.; Mirante, F.; Alves, C.A.; Oliveira, C.; Campa, A.M.; Artíñano, B.; Matos, M. OC/EC ratio observations in Europe: Re-thinking the approach for apportionment between primary and secondary organic carbon. Atmos. Environ. 2011, 45, 6121–6132. [Google Scholar] [CrossRef]
  21. Yoo, H.; Kim, K.A.; Kim, Y.P.; Jung, C.H.; Shin, H.J.; Moon, K.; Park, S.; Lee, J. Validation of SOC Estimation Using OC and EC Concentration in PM2.5 Measured at Seoul. Aerosol Air Qual. Res. 2020, 16, 19–30. [Google Scholar] [CrossRef]
  22. Amin, M.; Handika, R.A.; Putri, R.M.; Phairuang, W.; Hata, M.; Tekasakul, P.; Furuuchi, M. Size-Segregated Particulate Mass and Carbonaceous Components in Roadside and Riverside Environments. Appl. Sci. 2021, 11, 10214. [Google Scholar] [CrossRef]
  23. Fujii, Y.; Mahmud, M.; Oda, M.; Tohno, S.; Matsumoto, J.; Mizohata, A. A key indicator of transboundary particulate matter pollution derived from Indonesian peatland fires in Malaysia. Aerosol Air Qual. Res. 2017, 16, 69–78. [Google Scholar] [CrossRef]
  24. Fujii, Y.; Iriana, W.; Oda, M.; Puriwigati, A.; Tohno, S.; Lestari, P.; Mizohata, A.; Huboyo, H.S. Characteristics of carbonaceous aerosols emitted from peatland fire in Riau, Sumatra, Indonesia. Atmos. Environ. 2014, 87, 164–169. [Google Scholar] [CrossRef]
  25. Fujii, Y.; Kawamoto, H.; Tohno SOda, M.; Iriana, W.; Lestari, P. Characteristics of carbonaceous aerosols emitted from peatland fire in Riau, Sumatra, Indonesia (2): Identification of organic compounds. Atmos. Environ. 2015, 110, 1–7. [Google Scholar] [CrossRef]
  26. Putri, R.M.; Amin, M.; Suciari, T.F.; Faisal AF, M.; Auliani, R.; Ikemori, F.; Wada, M.; Hata, M.; Tesakul, P.; Furuuchi, M. Site-Specific Variation in Mass Concen-tration and Chemical Components in Ambient Nanoparticles (PM0.1) in North Suma-tra Province-Indonesia. Atmos. Pollut. Res. 2021, 12, 101062. [Google Scholar] [CrossRef]
  27. Jayarathne, T.; Stockwell, C.E.; Gilbert, A.A.; Daugherty, K.; Cochrane, M.A.; Ryan, K.C.; Putra, E.I.; Saharjo, B.H.; Nurhayati, A.; Albar, I.; et al. Chemical characterization of fine particulate matter emitted by peat fires in Central Kalimantan, Indonesia, during the 2015 El Niño. Atmos. Chem. Phys. 2017, 18, 2585–2600. [Google Scholar] [CrossRef]
  28. Santoso, M.; Dwiana Lestiani, D.; Hopke, P.K. Atmospheric black carbon in PM2.5 in Indonesian cities. J. Air Waste Manag. Assoc. 2013, 63, 1022–1025. [Google Scholar] [CrossRef] [PubMed]
  29. Amin, M.; Ramadhani, A.A.; Zakaria, R.; Hanami, Z.A.; Putri, R.M.; Torabi, S.E.; Phairuang, W.; Hata, M.; Masami, F. Carbonaceous component of Total Suspended Particulate (TSP) in Makassar City, Sulawesi Island, Indonesia. IOP Conf. Ser. Earth Environ. Sci. 2023, 1199, 012021. [Google Scholar] [CrossRef]
  30. BPS (Badan Pusat Statistik or Statistics Agency). Makkasar City in Figure; BPS: Makassar, Indonesia, 2022. [Google Scholar]
  31. MOEJ (Ministry of Environment of Japan). Chapter 4. Carbonaceous Component Analysis Method 483 (Thermal Optical Reflectance Method), 3rd ed.; Fine Particles (PM2.5) Component 484 Measurement Manual; 2019. Available online: https://www.env.go.jp/content/900400187.pdf (accessed on 14 December 2022). (In Japanese)
  32. Arp, H.P.H.; Schwarzenbach, R.P.; Goss, K.-U. Equilibrium sorption of gaseous organic chemicals to fiber filters used for aerosol studies. Atmos. Environ. 2007, 41, 8241–8252. [Google Scholar] [CrossRef]
  33. Chu, S.H. Stable estimate of primary OC/EC ratios in the EC tracer method. Atmos. Environ. 2005, 39, 1383–1392. [Google Scholar] [CrossRef]
  34. Yu, X.Y.; Cary, R.A.; Laulainen, N.S. Primary and secondary organic carbon downwind of Mexico City. Atmos. Chem. Phys. 2009, 9, 6793–6814. [Google Scholar] [CrossRef]
  35. Al-Taai, O.; Al-Ghabban, Z.M. The Influence of Relative Humidity on Concentrations (PM10, TSP) in Baghdad City. Mod. Environ. Sci. Eng. 2016, 2, 111–122. [Google Scholar] [CrossRef]
  36. PPRI (Peraturan Pemerintah Republik Indonesia) Nomor 22 Tahun 2021. Tentang Penyelenggaraan Perlindungan Dan Pengelolaan Lingkungan Hidup; Kementerian Sekretariat Negara Republik Indonesia: Jakarta, Indonesia, 2021. (In Bahasa) [Google Scholar]
  37. Czarnecka, M.; Kalbarczyk, R.; Kalbarczyk, E. Variability in particulate matter concentrations versus precipitation in Pomerania Region. Pol. J. Nat. Sci. 2007, 22, 645–659. [Google Scholar] [CrossRef]
  38. Tang, X.; Chen, X.; Tian, Y. Chemical composition and source apportionment of PM2.5—A case study from one-year continuous sampling in the Chang-Zhu-Tan urban agglomeration. Atmos. Pollut. Res. 2017, 8, 885–899. [Google Scholar] [CrossRef]
  39. Cao, J.; Lee, S.; Ho, K.F.; Fung, K.K.; Chow, J.C.; Watson, J.G. Characterization of Roadside Fine Particulate Carbon and its Eight Fractions in Hong Kong. Aerosol Air Qual. Res. 2003, 6, 106–122. [Google Scholar] [CrossRef]
  40. Kim, K.; Sekiguchi, K.; Kudo, S.; Sakamoto, K. Characteristics of Atmospheric Elemental Carbon (Char and Soot) in Ultrafine and Fine Particles in a Roadside Environment, Japan. Aerosol Air Qual. Res. 2011, 11, 1–12. [Google Scholar] [CrossRef]
  41. Demir, T.; Yenisoy-Karakaş, S.; Karakaş, D. PAHs, elemental and organic carbons in a highway tunnel atmosphere and road dust: Discrimination of diesel and gasoline emissions. Build. Environ. 2019, 160, 106166. [Google Scholar] [CrossRef]
  42. Shandilya, K.K.; Kumar, A. Carbon speciation of exhaust particulate matter of public transit buses running on alternative fuels. Fuel 2014, 115, 678–684. [Google Scholar] [CrossRef]
  43. Yan, C.; Zheng, M.; Shen, G.; Cheng, Y.; Ma, S.; Sun, J.; Cui, M.; Zhang, F.; Han, Y.; Chen, Y. Characterization of carbon fractions in carbonaceous aerosols from typical fossil fuel combustion sources. Fuel 2019, 254, 115620. [Google Scholar] [CrossRef]
  44. Pipal, A.S.; Satsangi, P.G. Study of carbonaceous species, morphology and sources of fine (PM2.5) and coarse (PM10) particles along with their climatic nature in India. Atmos. Res. 2015, 154, 103–115. [Google Scholar] [CrossRef]
  45. Etyemezian, V.; Kuhns, H.D.; Gillies, J.A.; Chow, J.C.; Hendrickson, K.; McGown, M.; Pitchford, M.L. Vehicle-based road dust emission measurement (III): Effect of speed, traffic volume, location, and season on PM10 road dust emissions in the Treasure Valley, ID. Atmos. Environ. 2003, 37, 4583–4593. [Google Scholar] [CrossRef]
  46. Yuwono, A.S.; Mulyanto, B.; Fauzan, M.; Mulyani, F.; Munthe, C.R. Generation of Total Suspended Particulate (TSP) In Ambient Air from Four Soil Types in Indonesia. Int. J. Appl. Environ. Sci. 2016, 11, 995–1006. [Google Scholar]
  47. Williams, D.S.; Shukla, M.K.; Ross, J. Particulate matter emission by a vehicle running on unpaved road. Atmos. Environ. 2008, 42, 3899–3905. [Google Scholar] [CrossRef]
  48. Kuhns, H.D.; Gillies, J.A.; Etyemezian, V.; Nikolich, G.; King, J.; Zhu, D.; Uppapalli, S.; Engelbrecht, J.P.; Kohl, S.D. Effect of Soil Type and Momentum on Unpaved Road Particulate Matter Emissions from Wheeled and Tracked Vehicles. Aerosol Sci. Technol. 2010, 44, 187–196. [Google Scholar] [CrossRef]
  49. Gillies, J.A.; Etyemezian, V.; Kuhns, H.D.; Nikolić, D.; Gillette, D.A. Effect of vehicle characteristics on unpaved road dust emissions. Atmos. Environ. 2005, 39, 2341–2347. [Google Scholar] [CrossRef]
  50. Thorpe, A.J.; Harrison, R.M. Sources and properties of non-exhaust particulate matter from road traffic: A review. Sci. Total Environ. 2008, 400, 270–282. [Google Scholar] [CrossRef] [PubMed]
  51. Zhang, J.; McCreanor, J.E.; Cullinan, P.; Chung, K.F.; Ohman-Strickland, P.; Han, I.; Järup, L.; Nieuwenhuijsen, M.J. Health effects of real-world exposure to diesel exhaust in persons with asthma. Res. Rep. 2009, 138, 5–109. [Google Scholar]
  52. Barraza-Villarreal, A.; Escamilla-Núñez, M.C.; Hernández-Cadena, L.; Texcalac-Sangrador, J.L.; Sienra-Monge, J.J.; Del Río-Navarro, B.E.; Cortez-Lugo, M.; Sly, P.D.; Romieu, I. Elemental carbon exposure and lung function in schoolchildren from Mexico City. Eur. Respir. J. 2011, 38, 548–552. [Google Scholar] [CrossRef]
  53. Amin, M.; Prajati, G.; Humairoh, G.P.; Putri, R.M.; Phairuang, W.; Hata, M.; Furuuchi, M. Characterization of size-fractionated carbonaceous particles in the small to nano-size range in Batam city, Indonesia. Heliyon 2023, 9, e15936. [Google Scholar] [CrossRef]
Figure 1. Sampling site in Sultan Alauddin Makassar City, South Sulawesi, eastern region of Indonesia.
Urbansci 08 00037 g001
Figure 2. TSP concentration in all sites (a) averaged based at morning, noon, and late-noon including the standard deviation, and (b) hourly based at morning, afternoon, and late-noon in Sultan Alauddin Street, Makassar City, South Sulawesi, Indonesia.
Urbansci 08 00037 g002
Figure 3. Average carbonaceous fraction of TSP based on the monitoring period in Sultan Alauddin Street, Makassar city, South Sulawesi, Indonesia.
Urbansci 08 00037 g003
Figure 4. Average carbonaceous concentration or OC, EC, and TC of TSP based on the monitoring period in Sultan Alauddin Street, Makassar city, South Sulawesi, Indonesia.
Urbansci 08 00037 g004
Figure 5. OC vs. EC correlation based on monitoring period in Sultan Alauddin Street, Makassar city, South Sulawesi, Indonesia.
Urbansci 08 00037 g005
Figure 6. Correlations of (a) TSP vs. soot-EC, (b) TSP vs. char-EC, (c) OC vs. soot-EC, (d) OC vs. char-EC, (e) EC vs. soot-EC, and (f) EC vs. char-EC in Sultan Alauddin Street, Makassar city, South Sulawesi, Indonesia.
Urbansci 08 00037 g006
Figure 7. TSP correlation with (a) OC, (b) EC, (c) TC, and (d) soot-EC in all sites and periods of monitoring in Sultan Alauddin Street, Makassar city, South Sulawesi, Indonesia. Description: PA, GR, PP, UP: sampling site; M: morning; N: noon; LN: late noon.
Urbansci 08 00037 g007
Table 1. Details concerning the sampling sites at four different characteristic roadside sites in Sultan Alauddin, Makassar City, South Sulawesi, Indonesia.
NoSiteCoordinateDescriptionDateTime
1PA5°10′31.0″ S 119°26′01.7″ EPaved, around ±31 m from intersection (Makassar city and Gowa district)28 March 2022Morning, noon, late noon
2GR5°11′11.9″ S 119°26′27.4″ EGravel, nearby U-turn and surrounded by open area cover by sand29 March 2022Morning, noon, late noon
3PP5°10′31.0″ S 119°26′01.7″ EPaved with pedestrian walk, in front of bus stop and UIN Alauddin hospital30 March 2022Morning, noon, late noon
4UP5°10′29.0″ S 119°25′57.9″ EUnpaved, nearby residential area (Pelindo resident)31 March 2022Morning, noon, late noon
Table 2. The number of vehicles based on type at all sampling sites, in Sultan Alauddin, Makassar City, South Sulawesi, Indonesia.
LocationVehicle TypesTime
MorningNoonLate Noon
PAMC412316672284
LV14291106806
HV597758
GRMC514236333494
LV152114991136
HV727960
PPMC273328301895
LV86610623922
HV697666
UPMC250424092842
LV93412301332
HV698074
Description: MC: motorcycles; LV: light duty vehicle; HV: high duty vehicle.
Table 3. Hourly TSP mass concentration for all sites in Sultan Alauddin Street, Makassar City, South Sulawesi, Indonesia.
SiteDatePeriodTSP (μg/m3)
PAMonday, 28 March 2022Morning100
36
110
Noon55
46
26
Late-noon22
30
46
GRTuesday, 29 March 2022Morning546
776
839
Noon149
59
93
Late-noon576
583
822
PPWednesday, 30 March 2022Morning226
223
235
Noon161
238
825
Late-noon307
324
UPThursday, 31 March 2022Morning242
220
226
Noon150
106
231
Late-noon428
495
238
Table 4. Primary and secondary organic carbon (POC and SOC) and their ratio in Sultan Alauddin Street, Makassar city, South Sulawesi, eastern region of Indonesia.
LocationPeriodPOC (μg/m3)SOC (μg/m3)POC/SOC (-)
PAMorning6.73.02.3
Noon6.64.13.0
Late-noon5.81.16.2
GRMorning17.611.01.6
Noon2.83.90.9
Late-noon25.57.73.4
PPMorning17.25.63.5
Noon17.010.23.1
Late-noon26.86.34.3
UPMorning11.78.11.6
Noon9.44.62.1
Late-noon18.511.11.7
Disclaimer/Publisher’s Note: The statements, opinions and data contained in all publications are solely those of the individual author(s) and contributor(s) and not of MDPI and/or the editor(s). MDPI and/or the editor(s) disclaim responsibility for any injury to people or property resulting from any ideas, methods, instructions or products referred to in the content.

