Article

Effects of Periodic Incoming Wakes on the Aerodynamics of a High-Speed Low-Pressure Turbine Cascade †

1
Turbomachinery and Propulsion Department, Von Kàrmàn Institute for Fluid Dynamics, Chaussée de Waterloo 72, 1640 Rhode-St-Genèse, Belgium
2
Departement of Aerospace & Mechanical Engineering, University of Liège, Allée de la Découverte 9, 4000 Liège, Belgium
*
Author to whom correspondence should be addressed.
This manuscript is an extended version of the ETC2023-293 meeting paper published in the Proceedings of the 15th European Turbomachinery Conference, Budapest, Hungary, 24–28 April 2023.
Int. J. Turbomach. Propuls. Power 2023, 8(3), 35; https://doi.org/10.3390/ijtpp8030035
Submission received: 13 June 2023 / Revised: 28 June 2023 / Accepted: 4 September 2023 / Published: 13 September 2023

Abstract

:
The influence of unsteady wakes incoming from the upstream stages is of high relevance in modern high-speed, low-pressure turbines (LPT) operating at transonic exit Mach numbers and low Reynolds numbers for their potential to trigger transition and influence the separation of the boundary layer on the blade suction side. The aim of this paper is the experimental characterization of the influence of incoming wakes on the 2D aerodynamics of a high-speed LPT cascade operating at a low Reynolds number and transonic exit Mach number. A detailed analysis of the status of the flow along the blade under investigation and its impact on the profile loss are presented for a range of Mach numbers from 0.70 to 0.95 and Reynolds numbers from 70k to 120k under steady and unsteady inflow conditions. Tests were conducted at on- and off-design engine realistic conditions in the VKI S-1/C wind tunnel on the SPLEEN C1 transonic cascade. The wakes incoming from an upstream blade row have been replicated using a set of rotating bars, which shed wakes at an engine-representative reduced frequency ( f + = 0.95 ) and flow coefficient ( Φ = 0.80 ). A set of densely instrumented traversable blades were used to sample the surface pressure distributions. The development of the boundary layers along the blade suction side is examined through quasi-wall shear stress obtained with surface-mounted hot-film sensors. Wake traverses were carried out downstream of the cascade with a miniaturized L-shaped five-hole probe to characterize the blade losses. The introduction of periodic incoming wakes promotes variations in the flow topology over the blade. The effect on the suction side separation bubble is shown to depend on the exit flow conditions. At low Mach numbers, the incoming wakes determine a reduction in the size of the bubble; in contrast, this effect is not registered as the exit Mach number increases. Consistently, a high dependence of the unsteady wake effect on the profile loss on the exit Reynolds and Mach numbers is demonstrated.

1. Introduction

Modern geared engine architecture allows for an increased low-pressure turbine (LPT) pressure ratio. This is associated with improved efficiency and a reduction in stage count and engine weight [1,2]. Consequently, the design space of modern high-speed LPTs consists of transonic exit Mach numbers ( M o u t > 0.80 ) and low Reynolds numbers [3]. This combination of operating conditions introduces new complexities, such as the effect of compressibility, on the already multifaceted scenario that is the design of modern LPT blades. The aerodynamics of LPT blades is characterized by strong adverse pressure gradients on the rear suction side that can lead to a separation of the laminar boundary layer [4], particularly under the low Reynolds number conditions typical of commercial jet engine LPTs operating at cruising altitude. A significant deterioration in engine efficiency is determined by the losses generated in the separated shear layer, particularly in open separation bubbles that fail to reattach. Therefore, the boundary layer transition plays a key role in determining the performance of LPT blade design [5].
The transition and reattachment processes are strongly affected by the unsteadiness carried by periodic wakes incoming from the upstream blade rows [6]. A large body of seminal studies is available on the effect of wakes periodically shed by an upstream row on the separation, transition, and reattachment processes in LPTs. Stieger and Hodson [7] showed the evolution of the wake fluid in the blade passage, highlighting high turbulence in the region of the impinging wakes. According to the model proposed by Schulte and Hodson [6], and Howell et al. [8], the wakes periodically trigger turbulent events in the separated shear layer, which suppress the separation during their presence. The turbulent patches are then followed by distinct becalmed regions. Observations by Coull and Hodson [9], Clinkemaillie et al. [10], and Mahallati and Sjolander [11], amongst others, showed that the wake-induced disturbances and becalmed region convect downstream more slowly than the wake itself, persisting for some time after the wake centerline has passed.
The interaction between the unsteadiness carried by the incoming wakes and the blade aerodynamics, as well as the loss generation, strongly depend on the blade design and operating conditions. The effect of the Reynolds number was studied by Schulte and Hodson [6], and Brunner et al. [12]. They documented a more beneficial effect induced by the incoming wakes at low Reynolds numbers, where the separation bubble is strong and contributes largely to the profile losses. In contrast, reduced benefits, or even detrimental effects, were observed at higher Reynolds numbers—the condition at which the separation bubble is smaller—and the anticipated reattachment increased the region wetted by the turbulent boundary layer. The effect of the exit Mach number on the blade–wake interaction in modern LPT blades was investigated by Vera et al. [13] and Vazquez et al. [14]. These studies demonstrated that, for the tested blade designs, the incoming wake’s benefit was maintained up to an exit Mach number of 0.90. However, for transonic exit Mach numbers, the profile losses showed an increasing trend. The authors ascribed the loss of performance to a compressibility effect, responsible for the shift of the velocity peak towards the trailing edge and for the subsequently increased diffusion. Detailed examination of the effects of changing the velocity distribution on the blade suction surface was the aim of a study by Coull et al. [15]. As for the measurements of Curtis et al. [16], this study showed that increasing the diffusion factor and acceleration rate generate stronger separation bubbles, which produce more losses. Simultaneously, the transition and reattachment processes move upstream, expanding the region wetted by turbulent boundary layer and, thus, raising the losses. Contrarily, designs with lower diffusion factors show low bubble-associated losses also at low Reynolds numbers. Coull et al. [15] also identified that moving the velocity peak downstream is detrimental for the performance at low Reynolds numbers, as it increases the diffusion rate and, hence, the losses produced by the separation (see also [17]). Other significant design parameters are the reduced frequency and the flow coefficient. Several studies targeted the understanding of the consequences of varying such parameters on the wake–blade interaction. Among the studies already mentioned, Schulte and Hodson [6], and Coull et al. [15], showed that the balance between the beneficial effect due to the separation reduction and the detrimental effect associated with the extended turbulent region depend both on the reduced frequency and on the Reynolds number. Moreover, data presented by Mahallati and Sjolander [11] indicated the presence of an optimal reduced frequency for the tested design. The location of this optimum varied with Reynolds number and freestream turbulence intensity, demonstrating that the effect of the incoming wakes on the blade depends on the specific pre-existing conditions of the boundary layer. Mahallati and Sjolander [2], and Canepa et al. [18], also considered the influence of the flow coefficient. Higher negative incidence of the wake on the suction surface is determined as the flow coefficient decreases, which at low Reynolds numbers was associated to earlier reattachment and, consequently, to a larger surface portion occupied by turbulent boundary layer, thus resulting in larger profile losses.
Most of the works discussed above were conducted in an effort to design high or ultra-high lift LPT blades in low-speed simplified setups, such as flat plate and cascade test rigs. Data collected at engine-representative conditions were presented by Howell et al. [8], Vera et al. [13], and Vazquez et al. [14]. Cascade tests were conducted by Wakelam et al. [19], Clinkemaillie, et al. [10], and Arts [20]. The latter studies were conducted in the same test facility used for the current investigation.
The aim of this work is to complement the previous studies by presenting the results of an extensive experimental characterization of a modern high-speed LPT blade. Tests were conducted in the VKI S1-C transonic cascade under engine-representative conditions in terms of transonic exit Mach and low Reynolds numbers, including the effects of unsteady incoming wakes on the behavior of the suction side boundary layer and on the loss generation, reproducing both realistic reduced frequencies and flow coefficients. The tests at off-design conditions covered a range of Mach numbers from 0.70 to 0.95 and Reynolds numbers from 70k to 120k. The test setup was analogous to that presented in Simonassi et al. [21], except for the addition of the wake generator upstream of the cascade. The blade profile design was characterized in a steady environment in Ref. [22], where it was shown that the suction surface aerodynamics are characterized by a thin laminar open separation bubble. The present work extends the latter study, allowing the detailed analysis of the modifications introduced by incoming wakes on the blade loading and on the status of the suction surface boundary layer, as well as their propagation on the loss generation mechanisms.
The large variety of tested conditions under unsteady engine-realistic conditions represent also a novel experimental dataset concerning the effects of unsteady wakes at high Mach numbers and low Reynolds numbers, providing references for the validation of models and CFD. The experimental data described in this paper can be obtained at the open access repository https://doi.org/10.5281/zenodo.7264761 (accessed on 12 June 2023).
This manuscript corresponds to the paper published in the proceedings of the 15th European Turbomachinery Conference [23].

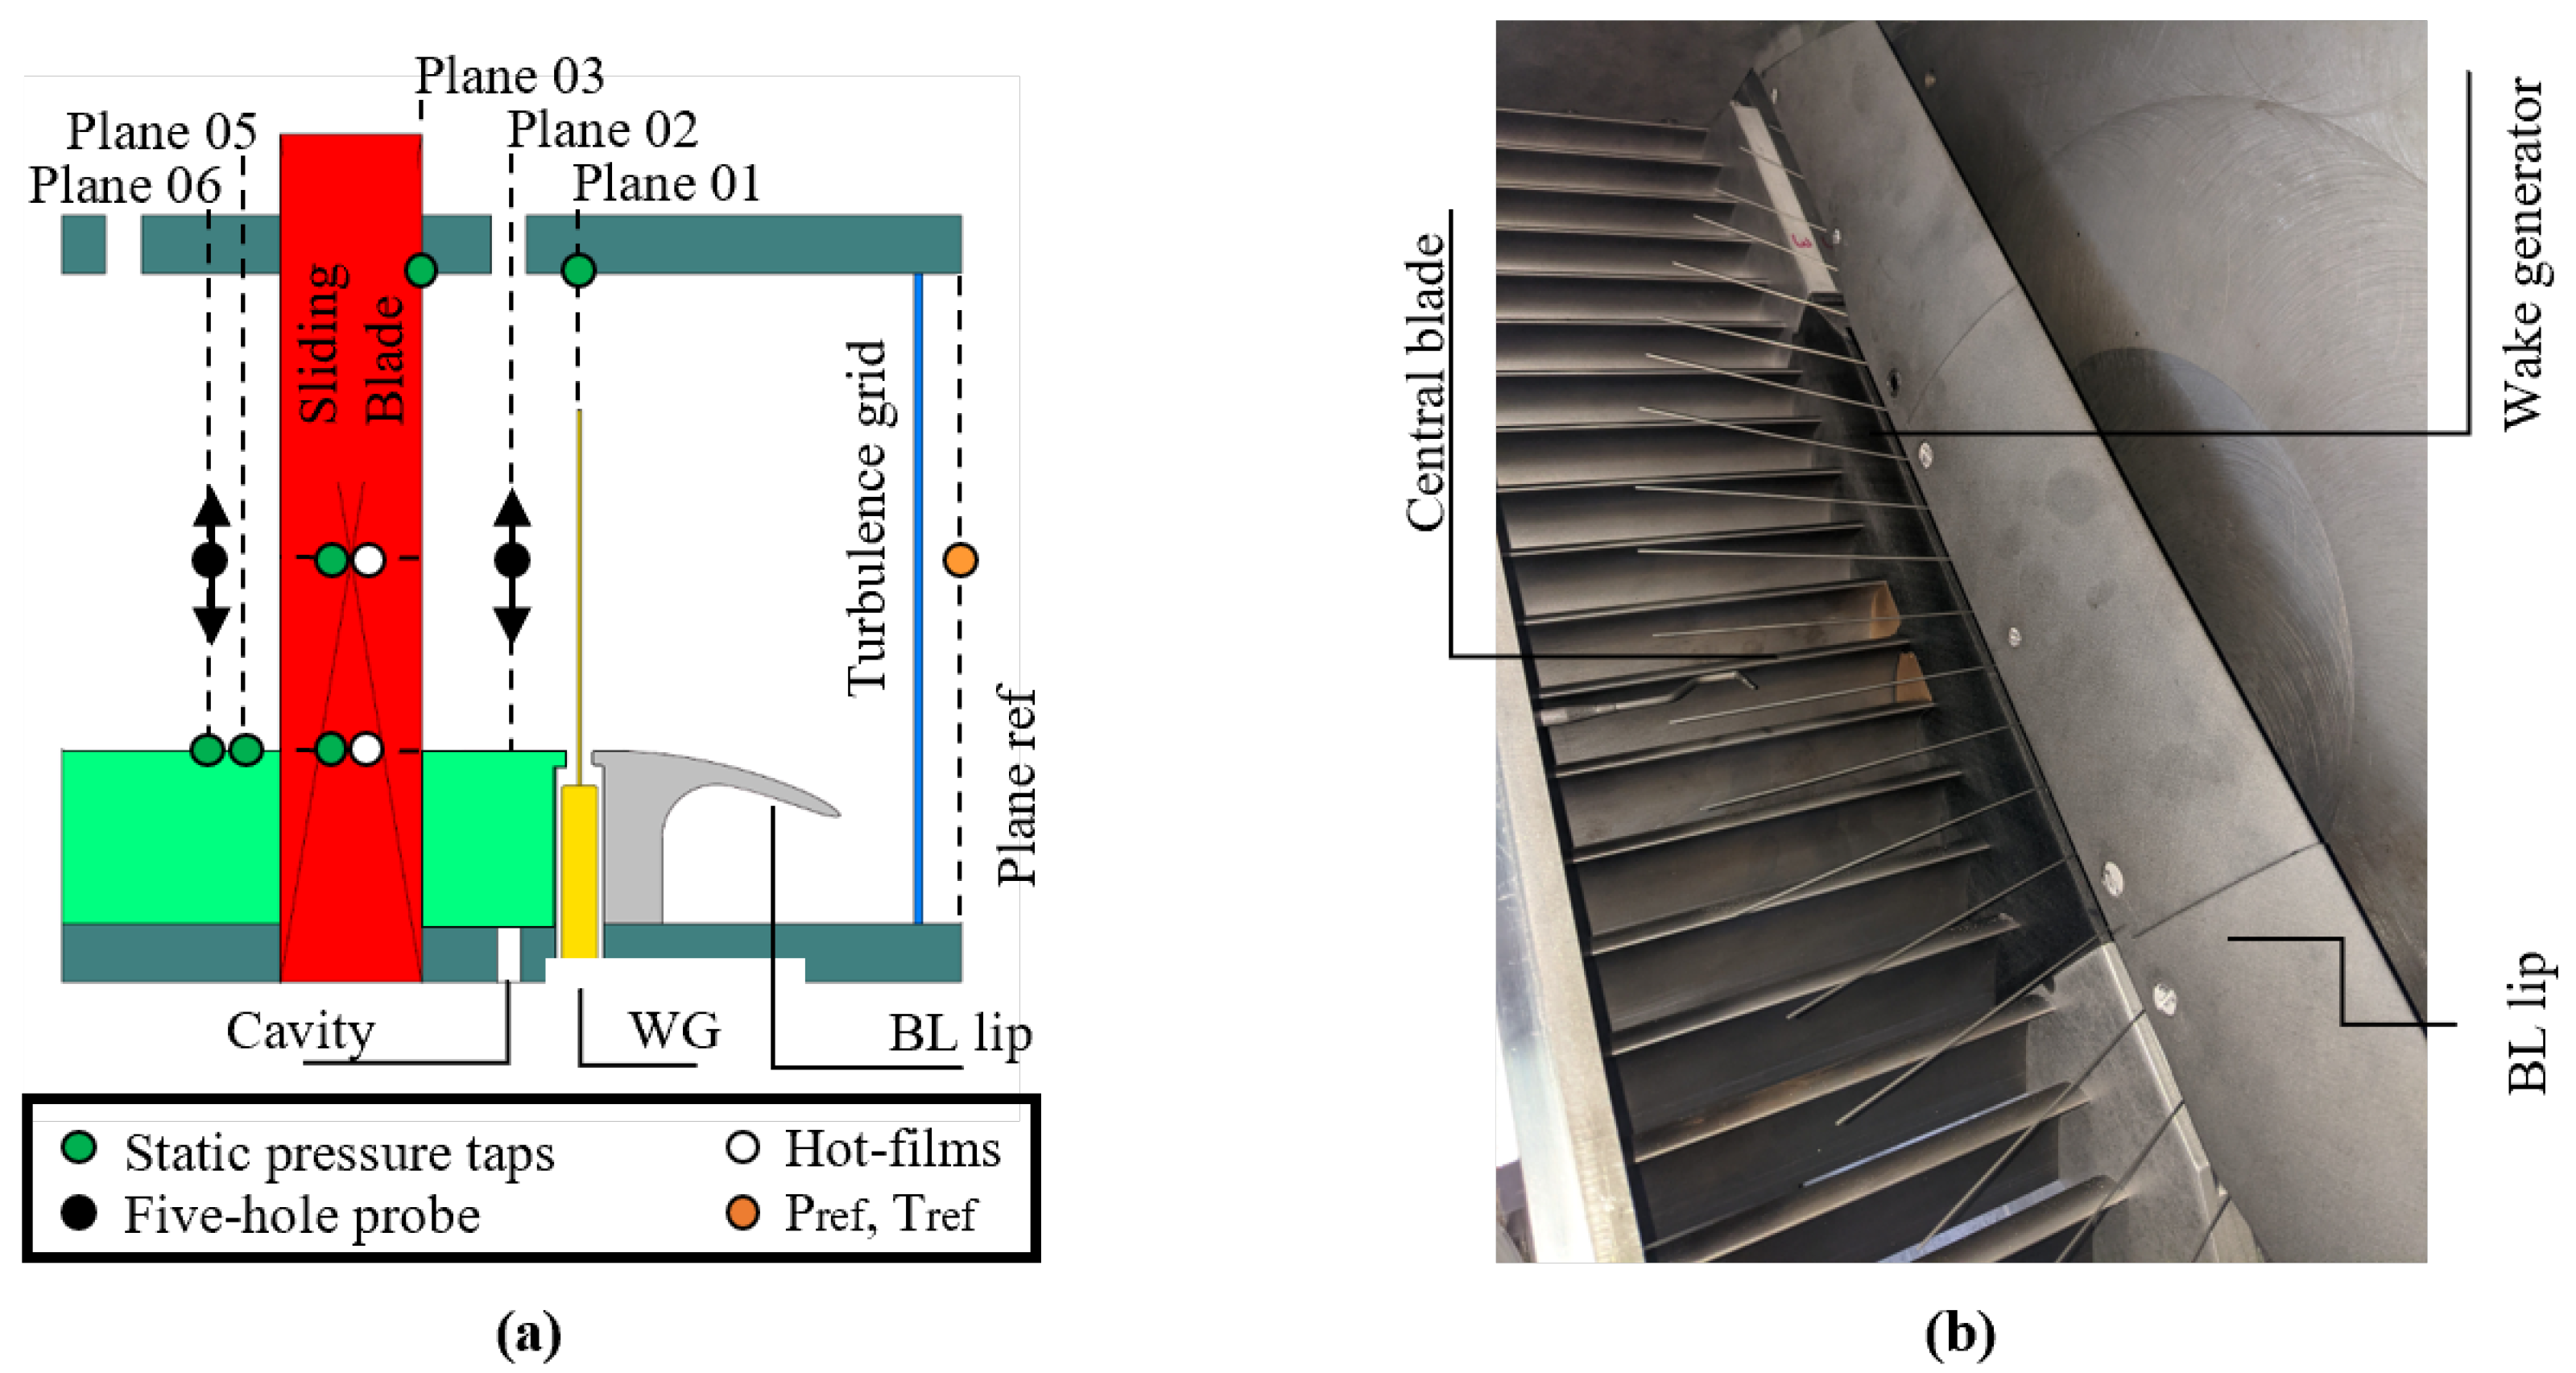
2. Experimental Setup

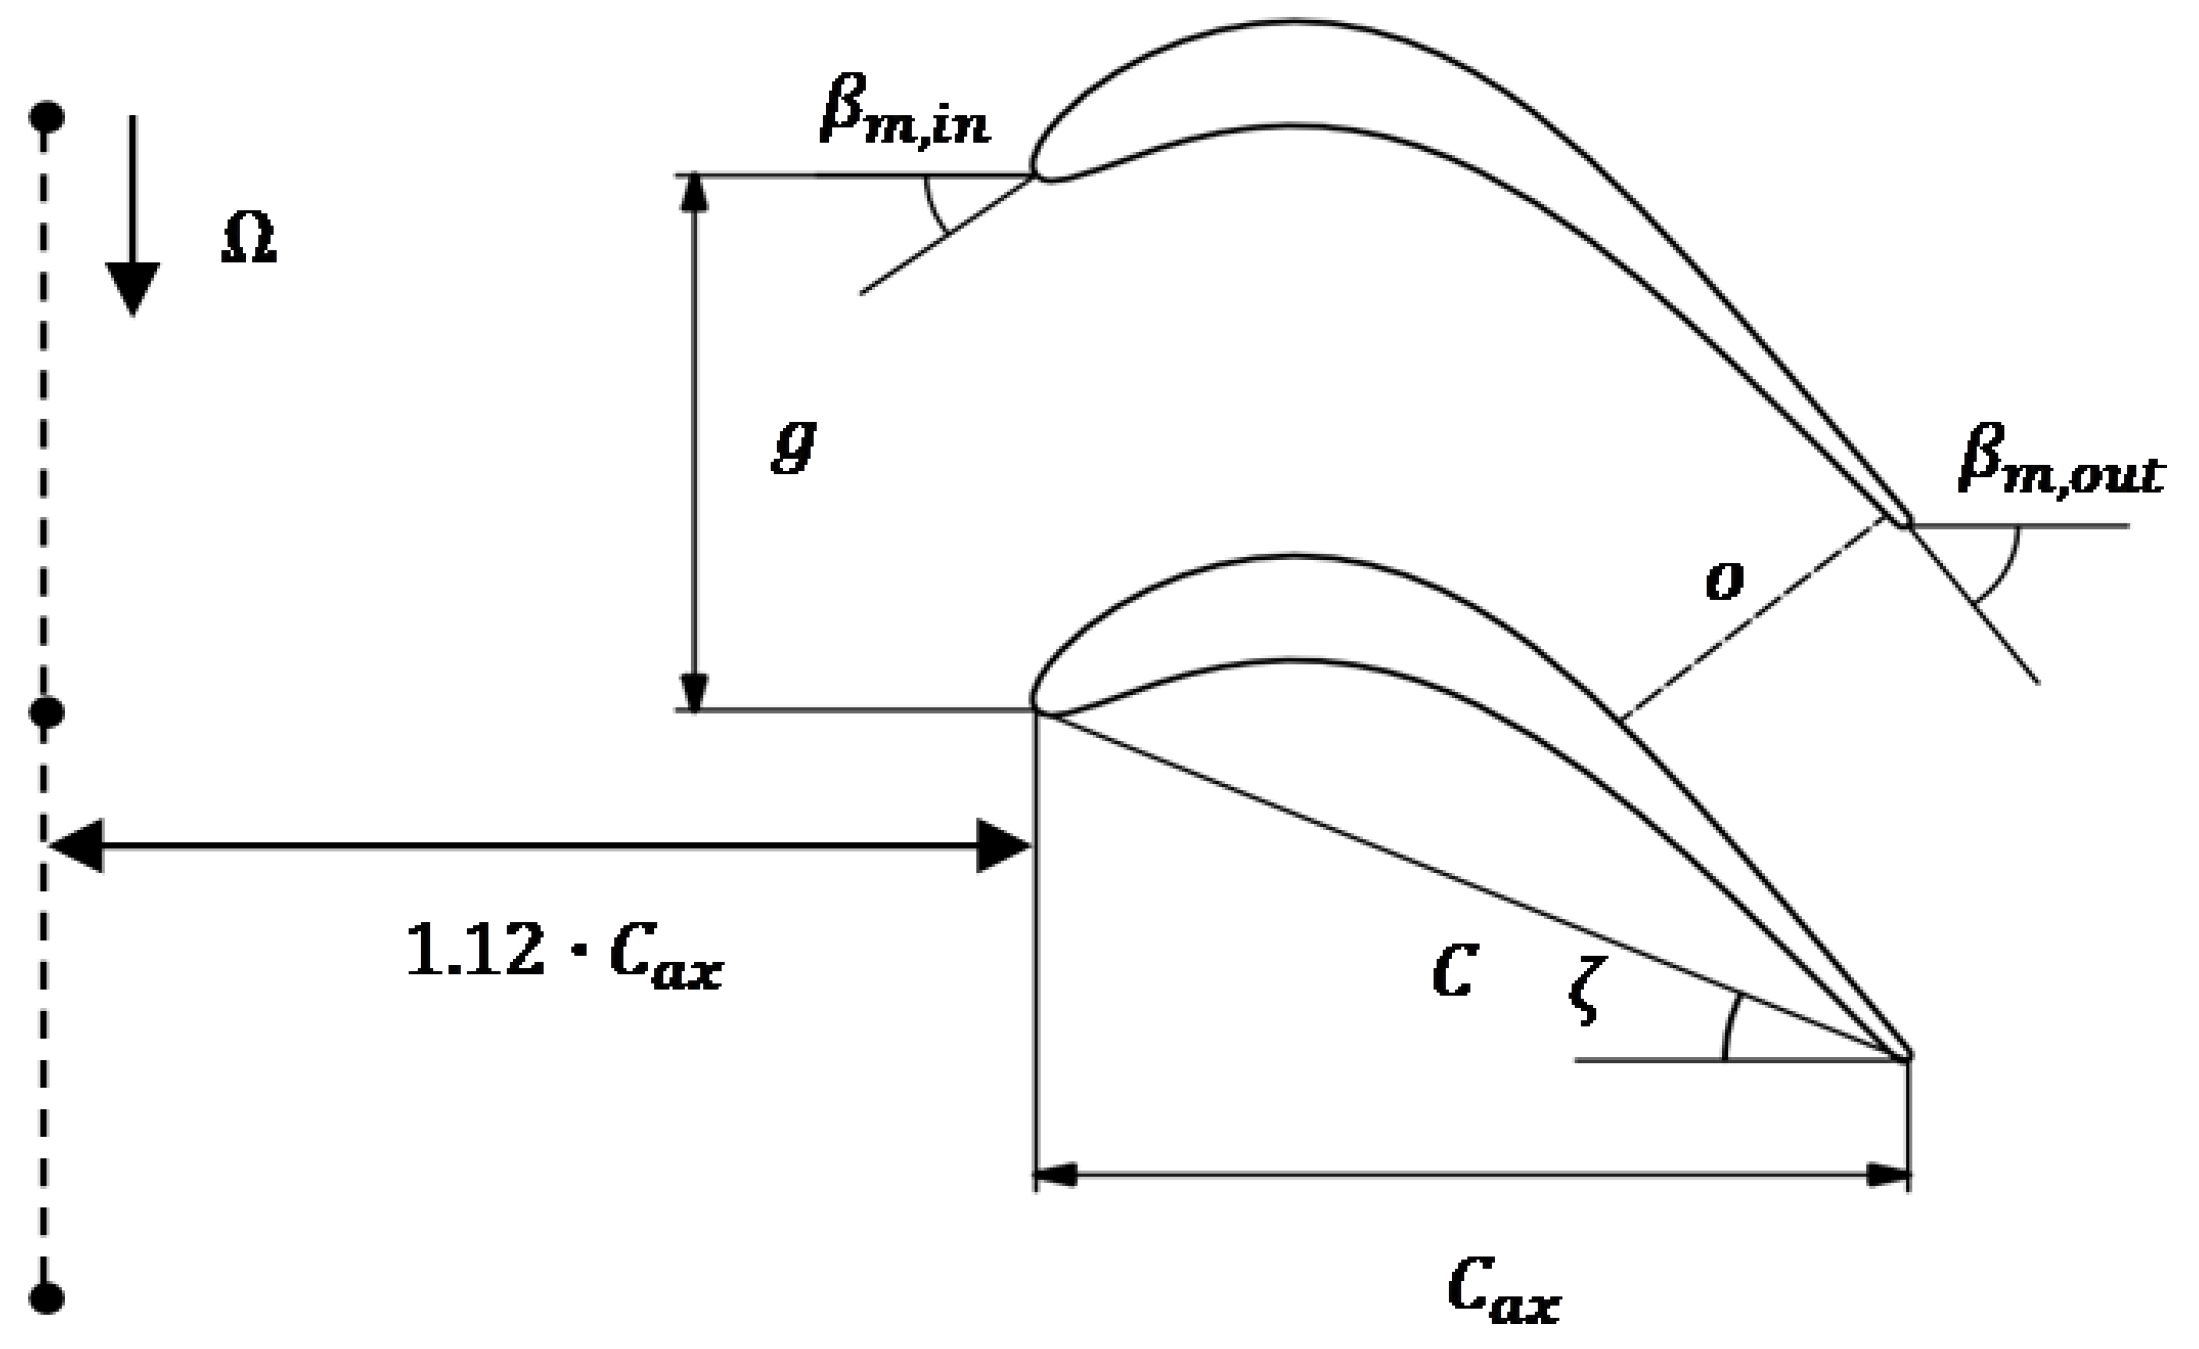
2.1. The SPLEEN C1 Cascade with Wake Generator

The linear cascade measurements were conducted in the high-speed, low-Reynolds facility S-1/C of the von Karman Institute. In-depth descriptions of the facility are reported in Refs. [10,20]. The tested cascade consisted of 23 blades with a span of 165 mm. The setup is presented in Figure 1a. The sketch represents the cascade including a central sliding blade, the wake generator (WG) bars, and the inlet turbulence grid. Figure 1a also reports the location of the measurement planes and the used instrumentation.
The wake generator consisted of a brass disk 625 mm in diameter with cylindrical bars mounted on the perimeter. The bar tips reached 73% of the blade span, guaranteeing no disturbances due to the bar tip flow at midspan. In this configuration, the rotating bars are only parallel to the blade leading edge when passing in front of the central blade. A picture of the complete setup is shown in Figure 1b.
To simulate the blade row interference effects due to wake–blade interactions, the test section was equipped with a high-speed rotating bar system located 1.12 axial chords ( C a x ) upstream of the blade leading edges.
The use of cylindrical bars to simulate the wakes shed by upstream turbomachinery blades was validated by Pfeil and Eifler [24], and Schulte and Hodson [6], who showed that the structure of the far wake of an airfoil and that of a cylindrical body of the same drag is almost identical at a distance ranging between 40 and 80 times the bar diameter. The effect of the wake generator on the inlet flow angle was computed according to the model of Berrino et al. [25]. After a series of commissioning tests, the cascade was rotated counterclockwise by 6.15° with respect to the tests without rotating bars, reaching 46.90° to the vertical axis, to compensate for the turning induced by the rotating bars.

2.2. SPLEEN C1 Blade Design

The SPLEEN C1 blade profile is representative of a blade hub–endwall section and was designed for a transonic outlet Mach number, high deflection, and low flow acceleration. The blade geometry is depicted in Figure 2.
A detailed description of the test case is presented in Ref. [21]. The scaled geometrical dimensions of the cascade and the details of the blade velocity distribution are reported in Table 1.

2.3. Test Conditions

The tests were carried out at representative conditions of high-speed LPTs for modern geared turbofan engines. Table 2 summarizes the nominal and off-design operating conditions. The Reynolds number characteristic length is the blade chord (C). Since the wake generator was operated at a fixed rotational velocity, the bar-reduced frequencies and flow coefficients are different for each flow condition.

3. Experimental Methodology

The cascade operating point is defined in terms of outlet isentropic Reynolds and Mach numbers monitored by means of the total pressure and temperature upstream and static pressure downstream of the blade row. The total temperature was measured by means of a type-K thermocouple at Plane Ref. The uncertainty on the temperature measurements is ±0.518 K (20:1). A correlation was made to estimate the total pressure losses across the TG and WG at different operating points. The correlation was used to calculate the total pressure at Plane 01 with a total uncertainty of ±31 Pa (20:1). Endwall taps connected to a Scanivalve MPS4264-2.5 PSI were used to measure the outlet static pressure with a total uncertainty of ±29 Pa (20:1).

3.1. Blade Measurements

The characterization of the blade steady aerodynamics was obtained by combining measurements performed with two instrumented blades (PS and SS). The pressure taps were displaced by traversing the instrumented blade at 66 spanwise locations starting from the midspan (z/H = 0.50) until the endwall (z/H = 0.00). The pressure was acquired by means of a Scanivalve MPS4264-1 PSI pressure scanner. The local isentropic Mach number was computed with a total uncertainty of ±0.005 (20:1).
Surface-mounted hot-films were used to characterize the blade unsteady aerodynamics. Mounted on the blade were 52 sensors equally distributed on the central blade PS (21 sensors) and SS (31 sensors). The distance between each sensor was 2 mm. The sensors were operated using a Dantec Streamline Pro chassis with six channels. The measurements were performed with a sampling frequency of 1.2 MHz for a sampling period of 3 s, corresponding to 165 rotations of the upstream wake generator. A square-wave test was performed at maximum mass-flux conditions ( M 6 , i s = 0.90 ;   R e 6 , i s = 120 k) tomaximize the bandwidth of the sensors. A minimum bandwidth of 50 kHz was achieved for all the sensors. The signals were low-pass filtered at 8 kHz in the steady case and 30 kHz in the unsteady case.
The sensors were operated at an over-temperature of ∼60 K, granting an over-heat ratio of 0.50. The qualitative description of the wall shear stress in Equation (1), introduced in Ref. [26], is used in this study.
τ w τ q = E 2 E 0 2 E 0 2 3
where E is the bridge voltage with flow and E 0 is the bridge voltage without flow at the same operating temperature. Since the sensors are operated at a constant temperature but the flow and blade temperature during the measurements vary, the voltage correction proposed in Ref. [27] and shown in Equation (2) is applied to the acquired voltages with and without flow.
E c o r r = E × T s T 0 T s T a
where T s is the sensor temperature during operation, T a is the gas temperature during the measurement, and T 0 is the reference temperature to which the over-temperature resultant from the overheat ratio is applied during the setup.

3.2. Inlet and Outlet Flow Field

The inlet flow was investigated by means of a cobra-shaped miniaturized five-hole (C5HP) pressure probe located at 0.50 C a x upstream of the central blade leading edge (Plane 02). The probe is calibrated for a range of yaw ( α ) and pitch ( γ ) angles of ±30° and Mach number between 0.20 and 0.60. The error due to the finite spatial resolution of the probe ports along the pitchwise direction was corrected using the first correction proposed by Ligrani et al. [28]. The total uncertainty on the yaw and pitch angles is ±1.00° and ±0.60°, respectively.
The inlet turbulence measurements were carried out using a single wire probe featuring a 9 μm wire parallel to the probe stem axis, i.e., parallel to the blade’s LE and rotating bar. The signals were acquired at a frequency of 1.2 MHz for 3 s after being analogue low-pass filtered by the CTA system at 30 kHz. The freestream turbulence intensity was computed according to the sensitivity coefficients method reported in the works of Cukurel et al. [29], and Boufidi and Fontaneto [30], assuming the fluctuations of temperature and density to be negligible [21].
The downstream flow field was measured with an L-shaped miniaturized five-hole probe at 0.50 C a x downstream of the central blade trailing edge (Plane 06). The probe was calibrated for a range of α and g of ±30° with Mach number varying between 0.20 and 0.95. The same spatial corrections as for the C5HP were used. Performance results are reported in this work in terms of energy loss coefficient, defined according to Lopes et al. [22]. The total uncertainty on the energy loss coefficient is ±0.0083. The error on the midspan mass-averaged energy loss coefficient computed by comparing repeated traverses is below ±0.00032, demonstrating high test-to test repeatability. A detailed description of the probes, blade instrumentation, and uncertainty estimation can be also found in Refs. [21,22].

4. Results and Discussion

4.1. Cascade Inlet Flow

The cascade inlet flow was interrogated by means of a cobra-shaped five-hole probe and single wire probe in Plane 02. The main characteristics are reported in Table 3 for both the steady and unsteady inlet cases. The table reports the midspan flow incidence angle and the maximum pitchwise variation observed within all the off-design flow conditions, alongside the midspan nominal pitch angle and pitchwise area-averaged turbulence intensity at midspan. The results show a variation of the incidence between the steady and unsteady cases. Despite the attempt to modify the cascade relative angle, it was not possible to obtain a complete compensation of the wake generator effect. This is ascribable to the large blockage induced by the cascade, which promotes additional flow turning at the cascade inlet. The incidence variation due to the change in flow conditions is maintained as minimal also in the unsteady case. Moreover, the wake generator seems to have a limited effect on the inlet pitch angle. A time-mean increase in turbulence intensity of 1.74% associated with the presence of the rotating bars was recorded.

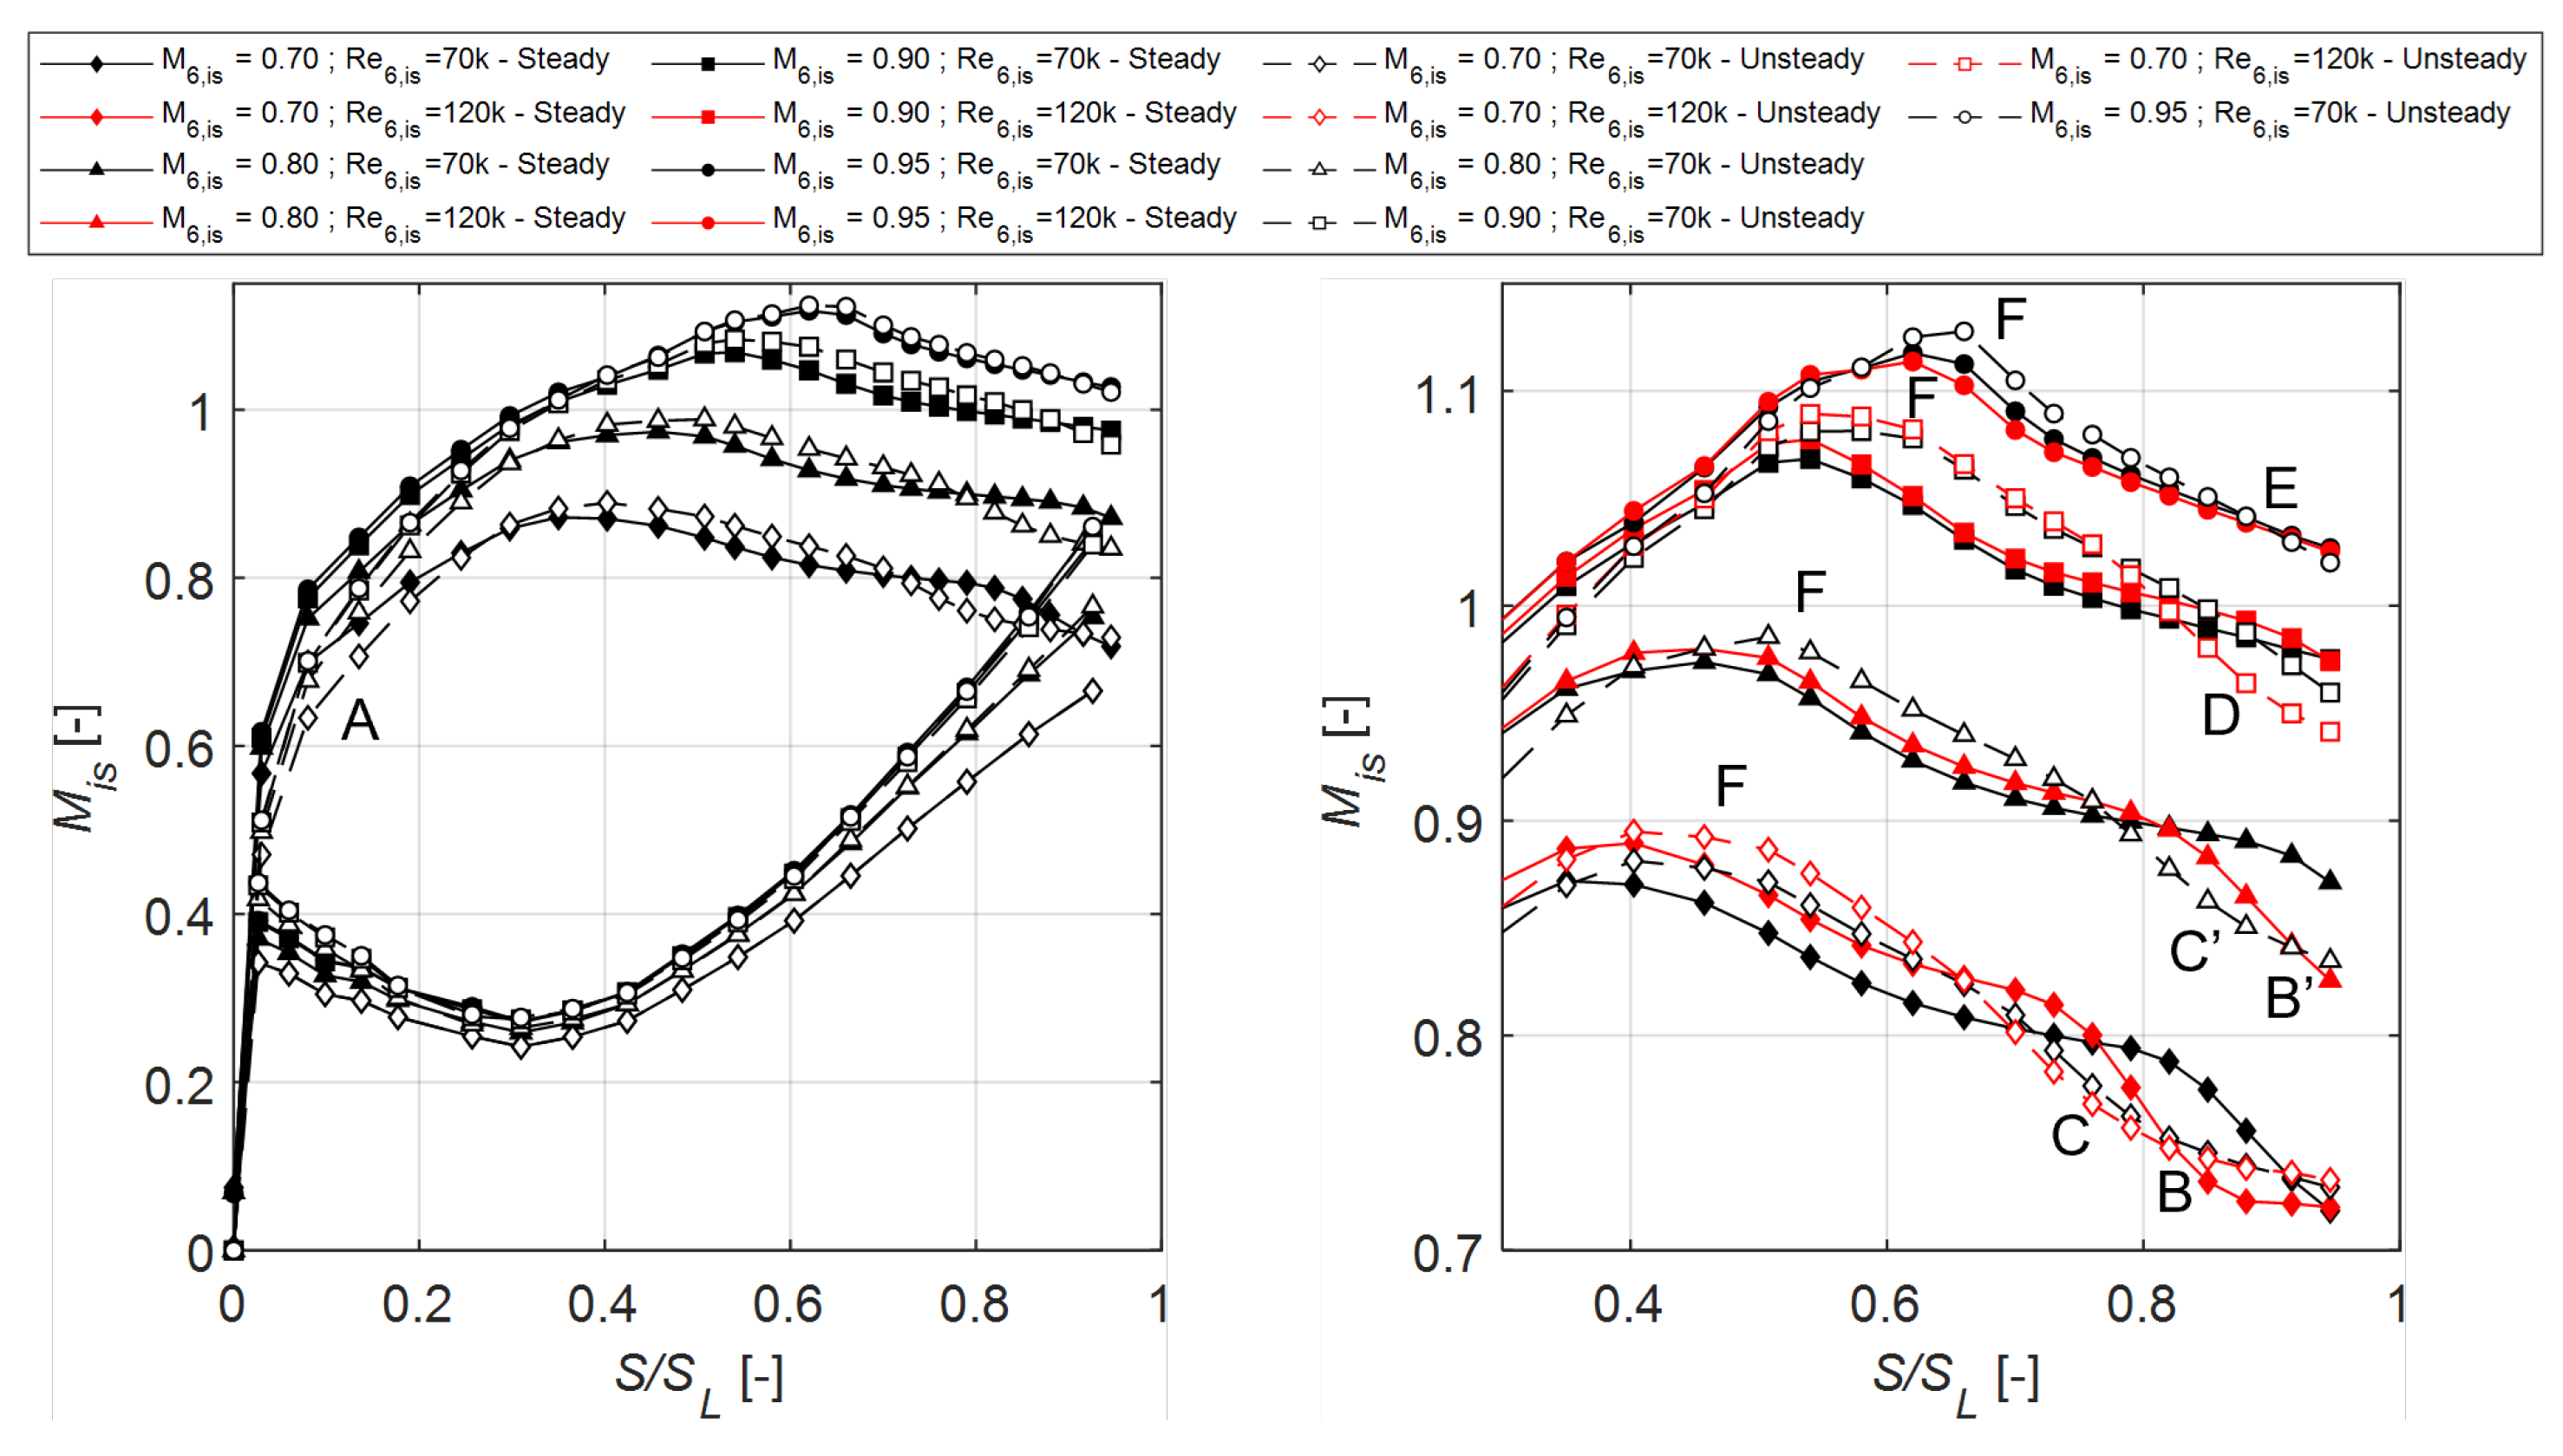
4.2. Blade Pneumatic Taps

The profile isentropic Mach number distributions with and without incoming wakes are displayed in Figure 3(left) for the investigated on- and off-design Mach numbers at the nominal exit Reynolds number ( R e 6 , i s = 70 k). Thecomparison between steady and unsteady inflow cases at midspan shows a significant effect of the incidence angle variation due to the presence of the rotating bars upstream of the cascade for all exit Mach numbers. The unsteady cases show a lower isentropic Mach number in the blade front SS (A), consistently with the increased negative incidence promoted by the rotating bars. A zoomed view of the rear SS is reported in Figure 3(right). To study the impact of the exit Reynolds number, in this plot, the comparison is extended to the R e 6 , i s = 120 k cases. All undisturbed blade loadings feature a laminar separation bubble on the rear SS, as described in Ref. [22].
The main characteristics of the flow topology over the blade rear SS obtained by applying the methodology defined in Ref. [22] are reported in Table 4. The location of the separation and reattachment are assessed analyzing the distributions of the isentropic Mach number, acceleration parameter ( K s ), and spatial derivative of the acceleration parameter ( K s / S ), computed from the surface pressure taps measurements. The influence of the outlet Reynolds number is evident in the two steady cases at M 6 , i s = 0.70 and M 6 , i s = 0.80 , as early reattachment and, consequently, closed separations are observed at R e 6 , i s = 120 k (B, B′). As the exit Mach number is increased to 0.90 and 0.95, the Reynolds number effect becomes weaker. For both Reynolds numbers, the separated boundary layer does not reattach to the last pressure tap location. Table 4 highlights that as the exit Mach number increases, the location of the suction peak is shifted towards the blade trailing edge and the diffusion factor is progressively reduced. A consequence of the peak velocity aft shift is the growth of the deceleration rate (defined as in Ref. [15]) registered for increasing exit Mach numbers.
The unsteady inflow promotes early reattachment for the M 6 , i s = 0.70 cases at both outlet Reynolds numbers and in the M 6 , i s = 0.80 ;   R e 6 , i s = 70 k case (C, C′). For increasing high exit Mach number, the effect of the incoming wakes becomes less impactful. Early reattachment is registered only for the high Reynolds case at M 6 , i s = 0.90 (D), while the pneumatic data seem to suggest that the separation bubble remains open at this exit Mach number for the lower Reynolds case. At the highest outlet Mach number ( M 6 , i s = 0.95 ), the rear portion of the SS appears to be only marginally responsive to both the effect of the Reynolds number and of the incoming wakes (E). An important effect of the unsteady inflow is the increase and further shift of the velocity peak towards the trailing edge for all studied cases (F). This is associated with higher diffusion factors and deceleration rates for the unsteady cases with respect to the steady counterparts. Furthermore, the portion of the suction surface after reattachment significantly increases in the cases presenting earlier reattachment due to the unsteady inflow conditions.

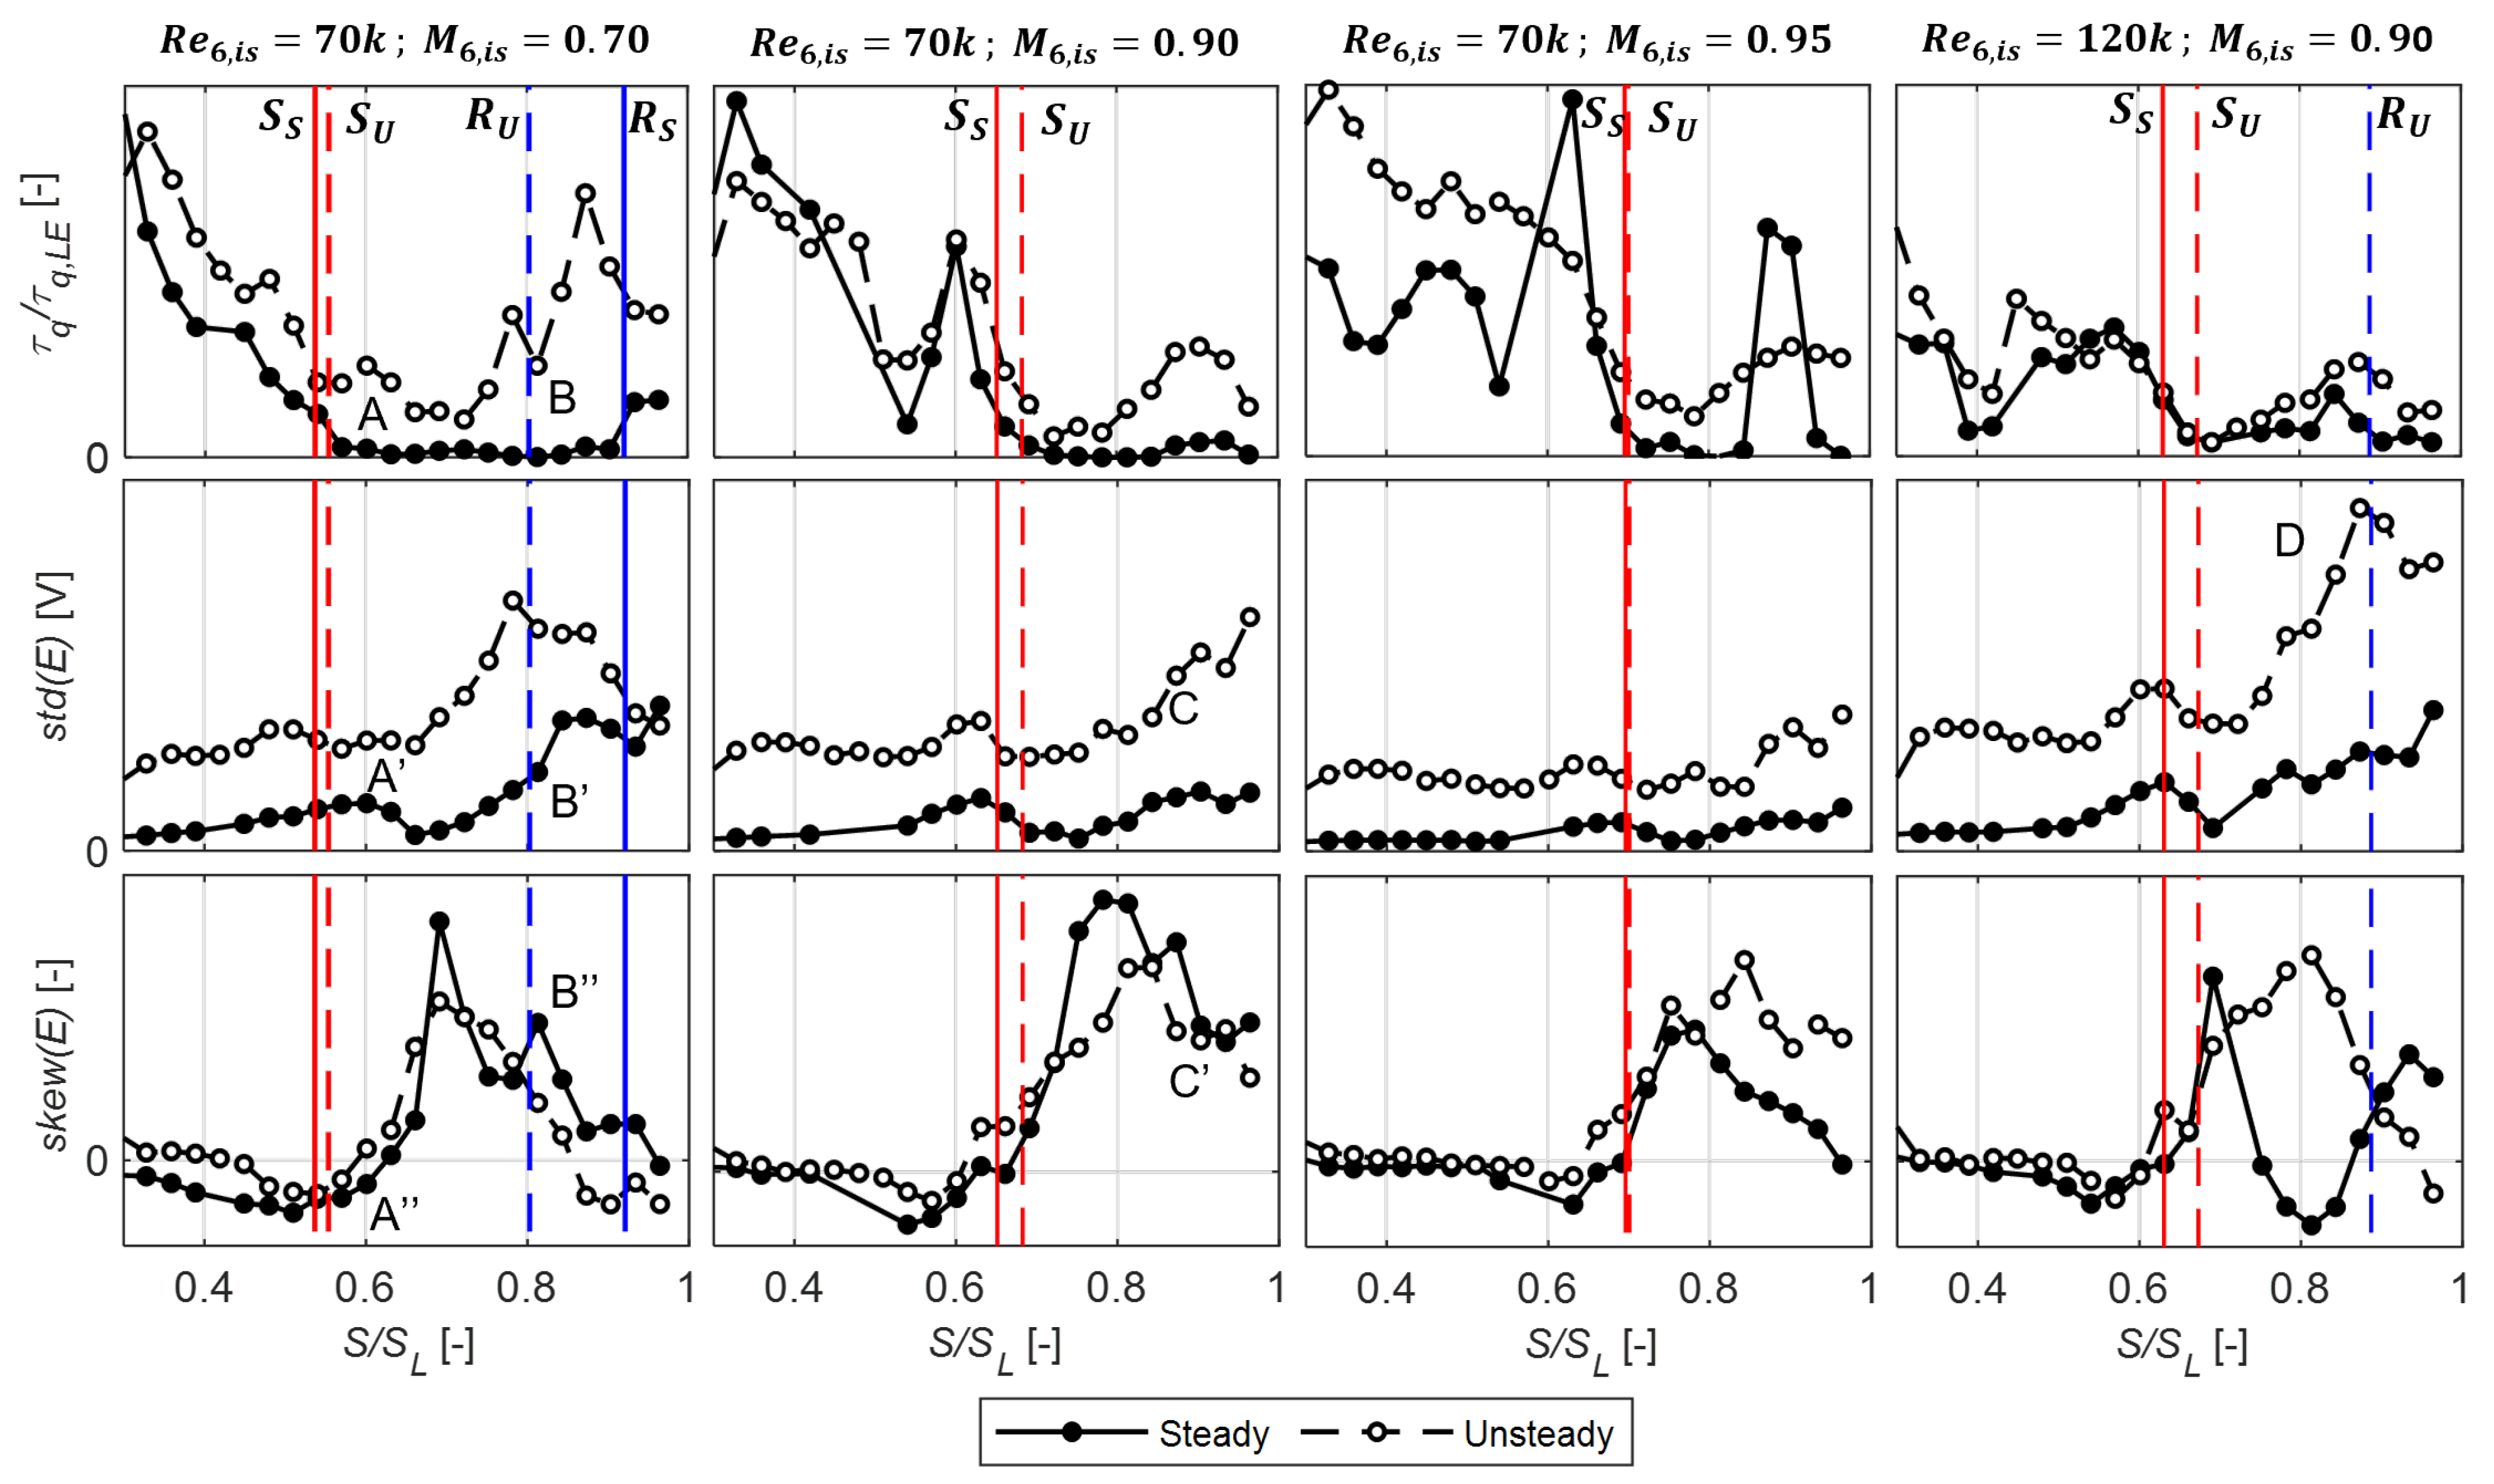
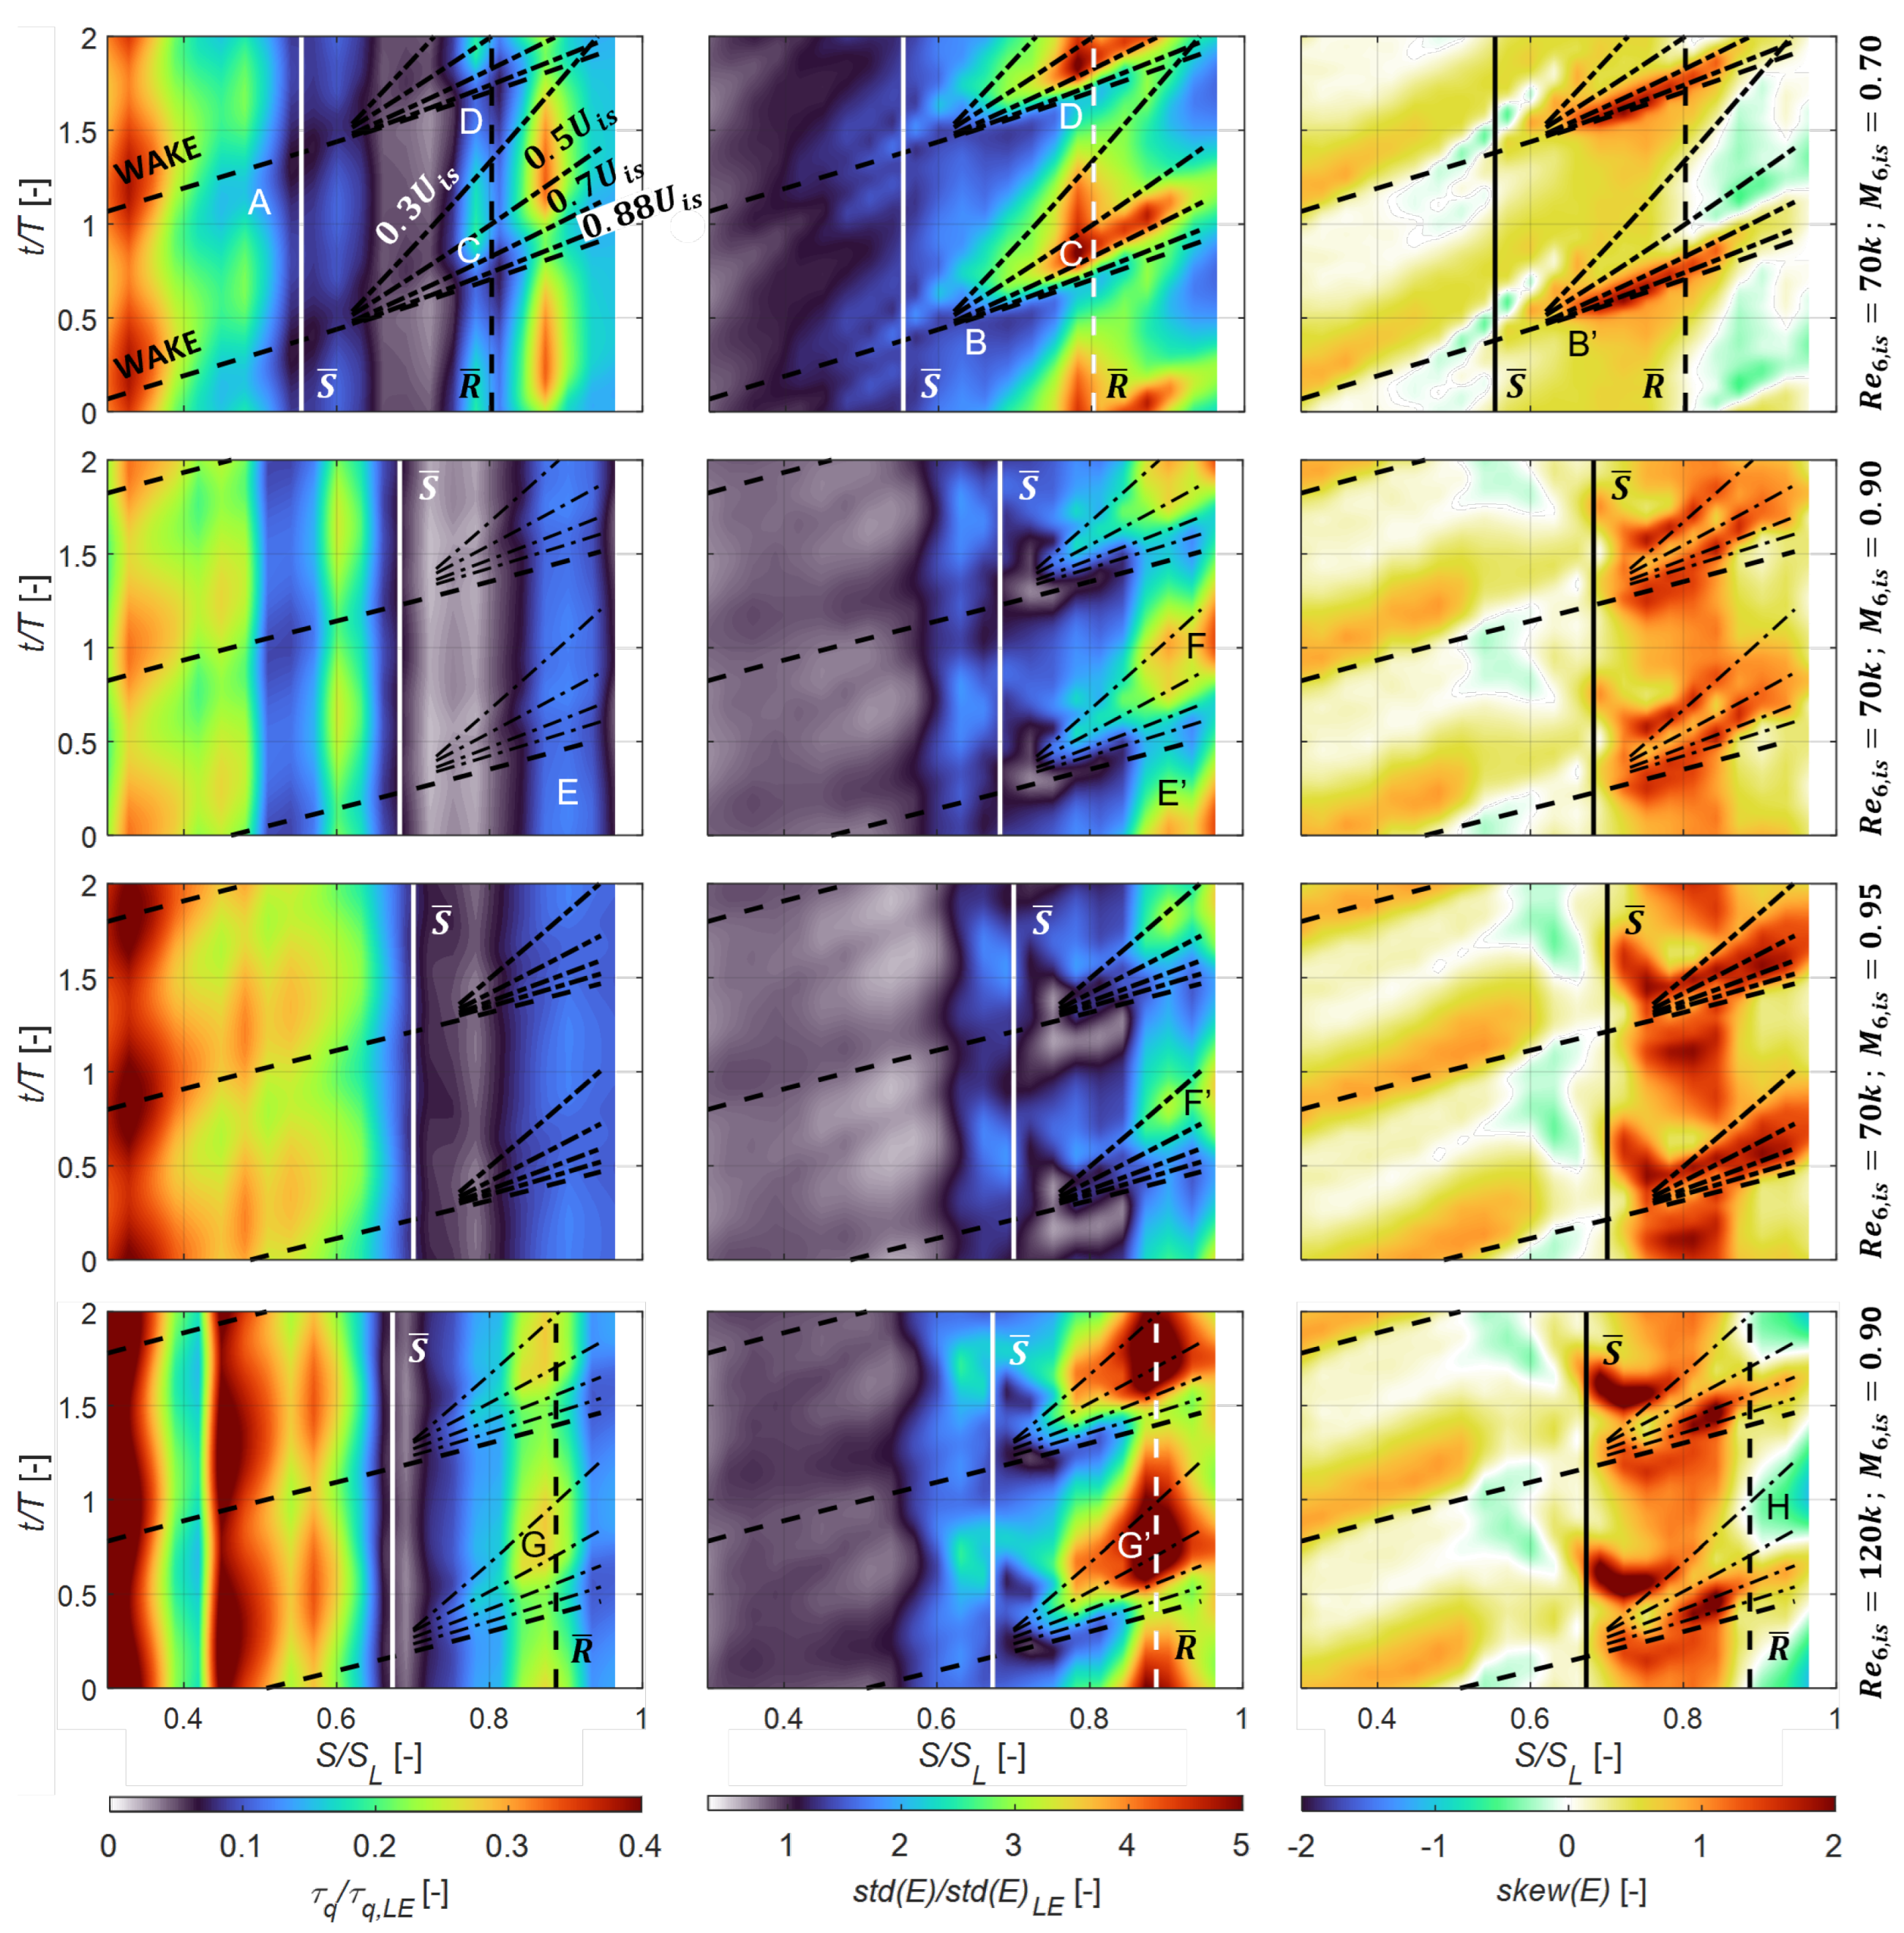
4.3. Blade Hot-Film Sensors

Hot-film sensors measurements were carried out to support the observations obtained by means of pressure measurements and to investigate the response of the blade aerodynamics to the periodic incoming wake disturbances. Figure 4 presents the time-mean averaged distribution of quasi-wall shear stress, sensor bridge voltage standard deviation, and skewness along the rear SS ( S / S L = [ 0.30 1.00 ] ) for the four flow conditions tested with steady and unsteady inflow conditions. The quasi-wall shear stress of each case was normalized with the average value of the first sensor close to the blade leading edge on the SS. The locations of separation (S) and reattachment (R) reported in Table 4 are superimposed on the plots using solid and dashed lines for the steady and unsteady cases, respectively. The hot-film data analysis reported here was conducted according to the works of Howell et al. [8], Gomes et al. [31], Borner and Niehuis [32], and Clinkemaillie et al. [10]. The low exit Mach ( M 6 , i s = 0.70 ;   R e 6 , i s = 70 k, left column in Figure 4) steady case is taken as a reference to compare with the literature and describe the evolution of the signals along the SS. The average value of τ q drops to nearly-zero values at the location of separation (S) in S / S L 0.54 (A), while the std(E) reaches a peak (A′). The separation region is characterized by low quasi-wall shear stress. According to Hodson [26], the τ q may be non-zero in the region of unsteady separation since the heat-flux process is not sensitive to the flow direction. The skewness starts to decrease after the location of the peak velocity ( S / S L 0.54 ) as the end of the acceleration allows the transition process to start. Around the separation location, the skewness tends to cross the zero becoming positive (A″), indicating an increased presence of turbulent spots. The transition process is linked to an increase in τ q and std(E) (B, B′). Following the std(E) growth, a local maximum identifies imminent reattachment, which is located at S / S L 0.92 according to the pneumatic data. At this location, the skewness of the bridge voltage approaches zero (B″).
The distributions of the unsteady case at M 6 , i s = 0.70 ;   R e 6 , i s = 70 k are useful to discern the effect of the periodic incoming wakes. The location of separation is little impacted while the reattachment seems greatly anticipated at S / S L 0.80 . At the nominal steady flow conditions ( M 6 , i s = 0.90 ;   R e 6 , i s = 70 k, center-left column in Figure 4), the hot-film data support the presence of an open separation bubble, as hinted by the analysis of the pneumatic data (Figure 3 and Table 4). In the unsteady case, τ q and std(E) register an increase after S / S L 0.80 (C) while the skew(E) approaches zero close to the trailing edge (C′). This suggests that the incoming wakes promote the onset of transition also at a higher exit Mach number. However, the growth of std(E) is not complete and the skew(E) does not reach zero by the location of the last sensor. An important difference with respect to the lower exit Mach case is the location of the velocity peak, which shifts towards the trailing edge as the exit Mach number increases (Figure 3), allowing less surface length to the transition process to occur. Increasing the exit Mach to 0.95 (Figure 4, center right column) reduced the growth of both quasi-wall shear stress and std(E) after the separation location, supporting the inference that the reattachment does not take place at high exit Mach numbers, even in the presence of incoming wakes. The further aft shift of the velocity peak, and consequently of the separation location, observed at M 6 , i s = 0.95 appears to further weaken the wake-induced transition process. At M 6 , i s = 0.90 ;   R e 6 , i s = 120 k (Figure 4, right column), the evolution of the distributions in the steady case is similar to case with the same exit Mach number but lower Reynolds (70k). The periodic wakes seem to promote a steeper growth in the std(E) (D), reaching a peak at S / S L 0.89 . The hot-film data agree with the pressure measurements, suggesting the presence of reattachment at this location.
To investigate the fundamental unsteady characteristic of the interaction between the periodically incoming wakes and the separated flow on the blade rear suction surface, time–space (T-S) diagrams of the phase-averaged hot-film data are shown in Figure 5. The x-axis shows the fraction of the suction side between S / S L = 0.30 and the trailing edge, and the y-axis represents the variation of time normalized with the bars’ passing period. The instantaneous values of quasi-wall shear stress and standard deviation of the sensors’ bridge voltage were normalized with the time mean of the first sensor close to the blade leading edge on the SS to facilitate a comparison between cases. The black dashed lines superimposed on the plots represent the trajectory of the passing wakes obtained by means of the blade pneumatic tap pressure measurements. The time-averaged locations of separation and reattachment (Table 4) are indicated with vertical solid and dashed lines, respectively. The lower Reynolds and Mach numbers ( M 6 , i s = 0.70 ;   R e 6 , i s = 70 k) case (Figure 5, top row) shows similar characteristics to the models described in the literature [6,8]. After the suction peak ( S / S L 0.37 ), the flow decelerates until the separation region is found at S / S L 0.54 . The location of the separation seems to vary around the time mean location in phase with the passage of the wakes (A). Regions of higher τ q after the wake were associated in previous works to the negative jet effect [11]. After the separation region, the disturbance of the wakes appears most evident with the typical wedge shape visible in all three plotted quantities. The origin of the wedge is identified at S / S L 0.62 as an increase in std(E) and skew(E) (B, B′). Point-dashed lines downstream of this location indicate the traveling path of wake-induced features. The turbulent patches introduced by the wake center are indicated by a strip of high standard deviation and are approximately comprised by the lines representing 88 % and 50 % of the wake propagation velocity, with a maximum right above the 0.70 U i s propagation line. Several authors [9,11] report that 0.88 U i s and 0.50 U i s are the velocities of the leading and trailing edge of a turbulent spot in zero pressure gradient, according to the experiments reported by Schubauer and Klebanoff [33]. According to Coull and Hodson [9], the 70 % velocity rate represents amplified Klebanoff streaks. This region of high std(E) is associated with high quasi-wall shear stress, which suggests a reattached turbulent boundary layer. Between t / T 0.65 and t / T 1.40 , increased values of quasi-wall shear stress upstream of the time-averaged reattachment location indicate that the wake-induced disturbance generates a periodical anticipation of reattachment (C, C′). Following the wake-induced path, regions of substantially lower voltage standard deviation are indicative of the becalmed region. The propagation velocity of the becalmed region trailing limit is indicated by the line at 0.3 U i s , as supported by several works in the literature [6,10,11]. After the trailing edge of the becalmed region, lower values of τ q and std(E) are found (D, D′). This is an indication that the separation bubble gradually returns to its undisturbed length between two wake passing events.
The two central rows in Figure 5 present the higher Mach number cases at Re 6 , i s = 70 k. The distribution of std(E) after the separation appears comparable to the lower Mach case. The wake-induced disturbances seem to respect the typical wedged shape, although they appear lower relative to the respective leading edge values. Contrarily to the M 6 , i s = 0.70 case, the effect of the turbulent patch does not correlate to a relevant increase in quasi-wall shear stress following the passage of the wake and only a region of moderately higher τ q with respect to the values at the separation onset (E). These observations correlate well with the impossibility of finding an indication of reattachment in the pneumatic pressure data for these two cases. The shift of the velocity peaks and separation locations occurring as the exit Mach number is increased was already identified in the data presented in Figure 3 and Figure 4 as a possible cause for the reduction of the wake capability to promote early reattachment. The T-S plots at exit Mach numbers 0.90 and 0.95 seem to support this hypothesis, showing regions of only moderately increased turbulent activity related to the wake passage pushed downstream on the SS (E′). The origin of the wake disturbance is located at S / S L 0.62 , while it is pushed downstream to S / S L 0.72 and S / S L 0.76 at M 6 , i s = 0.90 and 0.95, respectively. Moreover, the fraction of the wake passing period between the wake passage and the trailing edge of the becalmed region (0.30 U i s ) at the location of the last sensor close to the TE reduces as the exit Mach number is increased (F, F′). If the effect of one wake passing event seems to spill into the next incoming wake at M 6 , i s = 0.70 , occupying a period of t / T 1.00 , the wake influence is reduced to t / T 1.00 and t / T 0.59 at M 6 , i s = 0.90 and M 6 , i s = 0.95 , respectively. This is also a consequence of the increase in wake-reduced frequency associated with the decrease in exit flow velocity. The T-S diagrams of the higher Reynolds case ( M 6 , i s = 0.90 ;   R e 6 , i s = 120 k) (Figure 5, lower row) are similar to the lower Reynolds number and lower Mach number case. Comparable wedge-shaped regions can be identified and, contrarily to the lower Reynolds number cases at the same exit Mach number, the increase in std(E) corresponds to a region of high quasi-wall shear stress (G, G′). This seems to confirm the presence of reattachment around this location, as suggested by the pressure measurements of Figure 3 and Table 4. The skew(E) T-S suggests that the higher exit Reynolds number appears to promote the presence of increased turbulent activity after the reattachment location (H). Consequently, increasing the exit Reynolds number seems to facilitate the wake-induced periodic reattachment process also at an exit Mach number of 0.90.

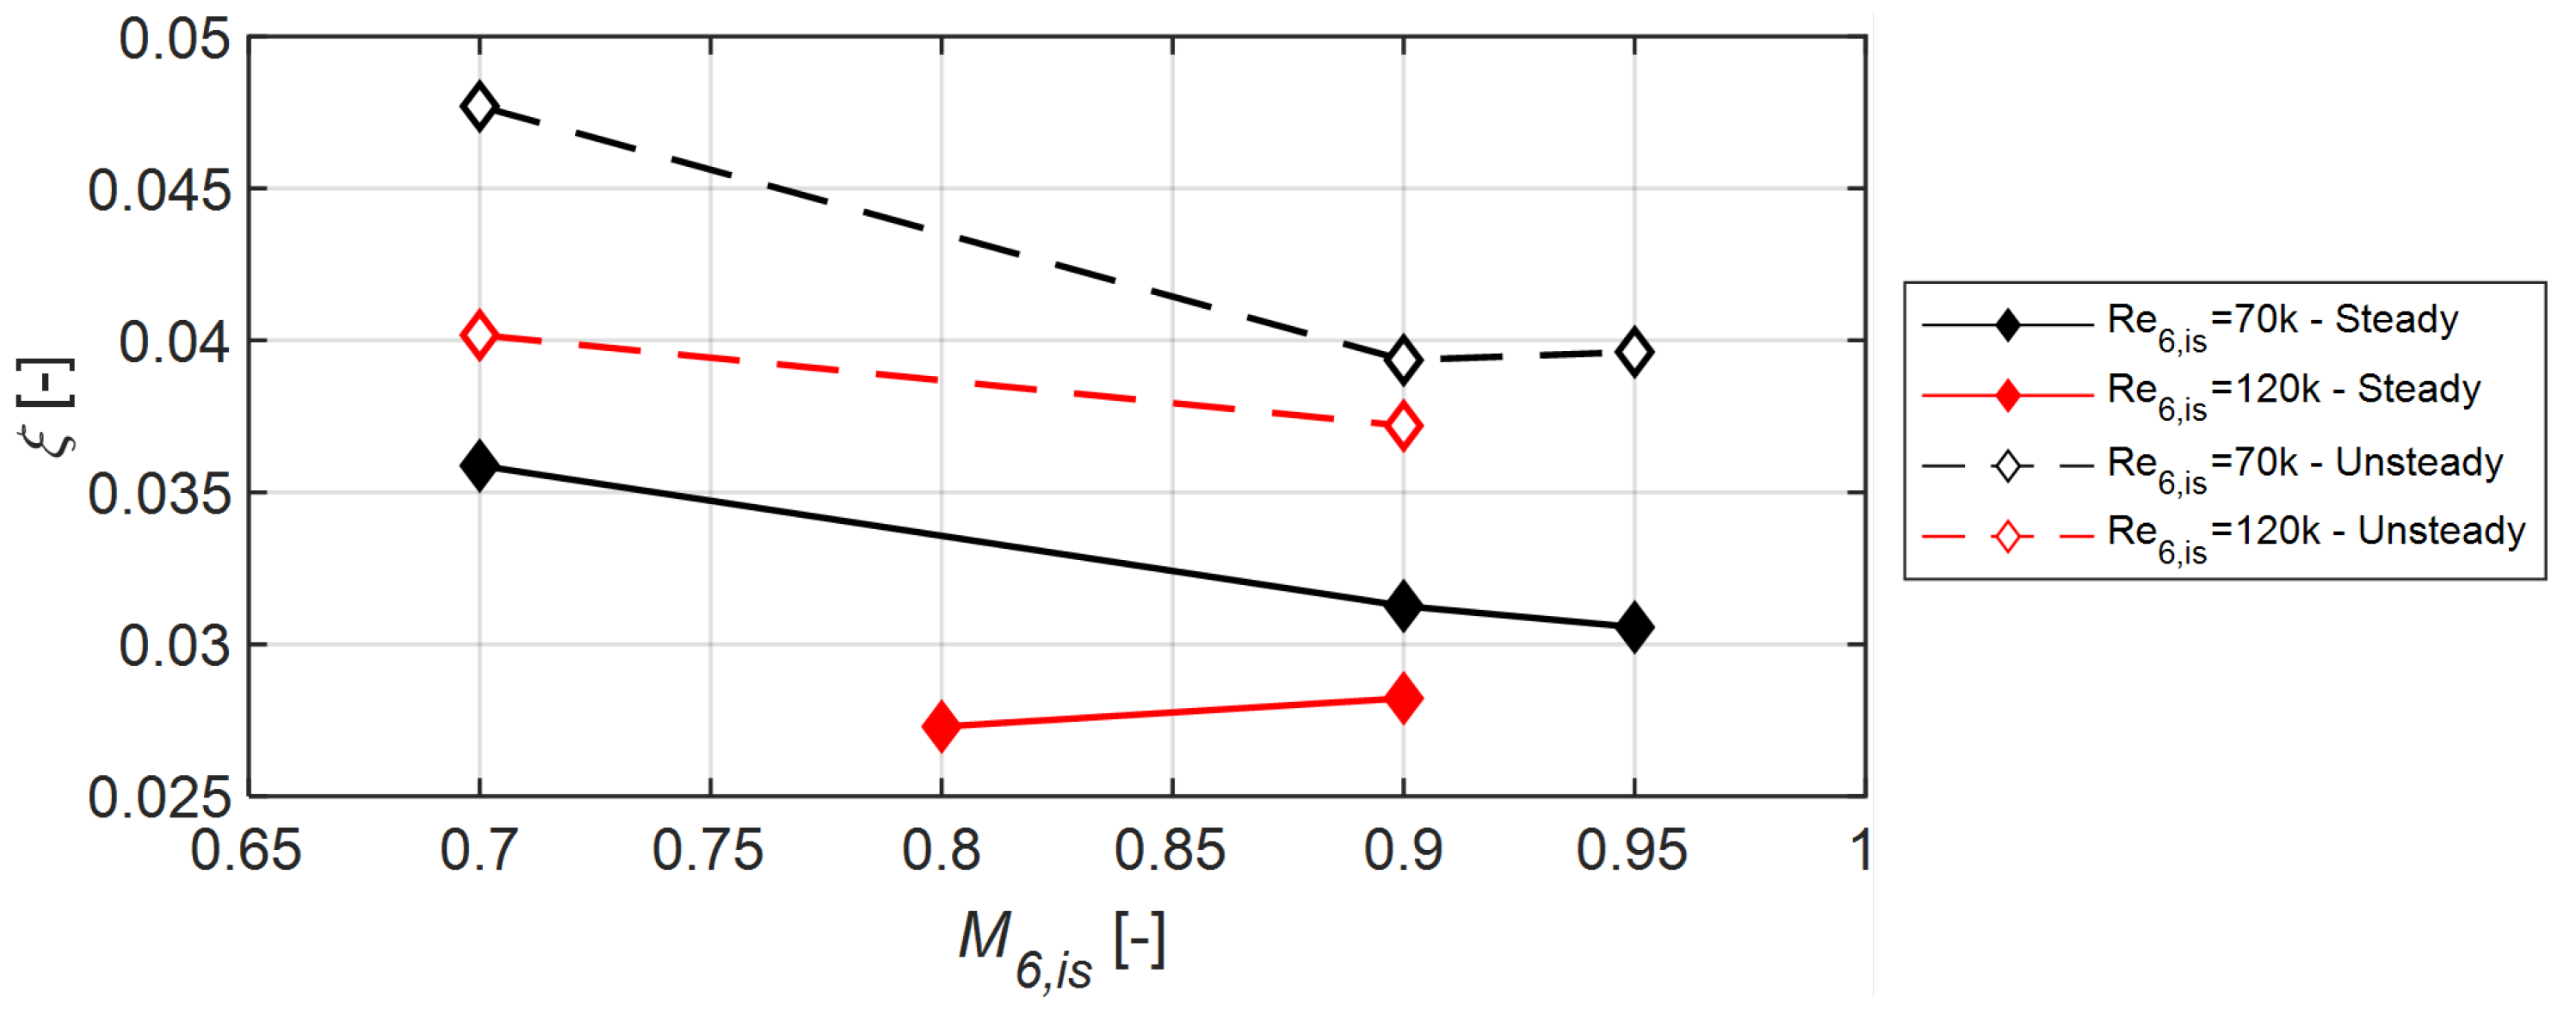
4.4. Cascade Outlet Flow

Figure 6 reports the wake profiles at midspan for all investigated cases with and without periodic incoming wakes. For all the tested conditions, the main difference in the wake profile is associated with the thickening of the wake in the SS portion (negative y g ) (A). This result has been related in the literature to the migration of the incoming wakes towards the blade SS. The interaction of the incoming wake with the boundary layer on the blade SS is associated with high levels of turbulent kinetic energy [7,18] and increased downstream turbulent mixing [11].
At R e 6 , i s = 70 k (see Figure 7), the effect of the wakes seems to be opposite between the low exit Mach number and the high Mach number ( M 6 , i s = 0.90 and 0.95 ) cases (B, B′). At M 6 , i s = 0.70 , the depth of the wake increases in the unsteady case. Even though the incoming wakes periodically reduce the extent of the laminar separation, the region of surface area wetted by more turbulent boundary layer increases with respect to the steady inflow, as shown in Figure 4 (left column) and Figure 5 (top row), determining higher skin friction losses than in the steady inflow case. On the other hand, in the cases with exit Mach numbers 0.90 and 0.95, the wake-separation bubble interaction is pushed towards the blade trailing edge, leaving less space for the wake-induced transition and reattachment phenomena to materialize. Consequently, a limited area, noteworthy due to its increased level of turbulence, is detected in Figure 5 (central rows). This difference is likely to be the origin of the opposite behavior between low and high exit Mach number cases, as also described by Coull et al. [15]. The loss distribution shown in Figure 6(right) obtained at R e 6 , i s = 120 k shows a similar behavior to the case of R e 6 , i s = 70 k, M 6 , i s = 0.70 (C). The wake profiles in the higher Reynolds case supports the conclusion that the profile losses are due to the increase in friction on the rear section of the blade SS after the early reattachment promoted by the wakes.
The pitchwise mass-averaged profile energy loss coefficient is presented in Figure 7. The losses are higher for the unsteady case at both Reynolds numbers. The loss evolution for high exit Mach numbers does not follow the increasing trend shown by Vera et al. [13], as reported in Ref. [22]. At R e 6 , i s = 70 k, the overall trend for Mach number variation is conserved with incoming wakes, as the losses decrease by increasing the exit Mach number. For the higher Reynolds number cases, the trend is inverted, as decreasing losses are measured as the exit Mach number increases with wakes.
The loss growth with unsteady inflow conditions could be explained considering that, in the steady case, the loading profiles are characterized by moderate values of diffusion factor and deceleration rate, generally associated with low loss generation in the separation bubble with respect to the turbulence-generated losses. The introduction of unsteady inflow conditions moves the velocity peak downstream, increasing the diffusion; the rate of deceleration; and, hence, the bubble-generated losses [15]. The sensitivity of the profile losses to the location of the velocity peak was also observed by Wakelam et al. [19]. Their experiments at low outlet Reynolds numbers showed deeper and thicker wakes for a blade design characterized by higher diffusion and a more aft location of the velocity peak. In the high exit Mach number cases ( M 6 , i s = 0.90 and 0.95) at a lower exit Reynolds number ( R e 6 , i s = 70 k), no wake-induced reattachment was observed; therefore, higher bubble-generated losses due to the increased diffusion could explain the loss growth associated with the unsteady cases. Furthermore, the hot-film data showed additional turbulence activity due to the passing wakes for all cases. Thus, the increase in profile losses could also be linked to a higher contribution from the turbulent losses.
Regarding the cases characterized by early attachment promoted by the wake interaction ( R e 6 , i s = 70 k, M 6 , i s = 0.70 and R e 6 , i s = 120 k, M 6 , i s = 0.90 ), the analysis of the pneumatic data showed a substantial increase in turbulent wetted length and the hot-film signals demonstrated extended regions occupied by turbulent spots on the rear SS. Therefore, the combination of higher separation losses due to increased diffusion and more turbulent wetted areas could be linked to the highest loss increase in the unsteady cases registered at these conditions. Wakelam et al. [19] reported increased profile losses under unsteady conditions for blades characterized by similar values of diffusion and ascribed this effect to increased mixing in the boundary layer, even in the event of earlier reattachment.
Furthermore, since all tests were conducted at a constant wake-generator speed, the effect of the bar-reduced frequency and of the flow coefficient must be considered. Decreasing the exit Mach number determines the increase in the reduced frequency and the decrease in the flow coefficient. Consequently, the number of wakes flowing in the blade passage at each instant of time increases and the wakes approach the blade passage at higher incidence. Since more wake-induced turbulence is present in the passage, increasing the effect of the wake-induced effects is expected. Similarly, an inverse relationship between the profile losses and flow coefficient was reported in previous studies [6,11,18]. This is suggested in the presented data by the higher difference between the losses at M 6 , i s = 0.70 (between steady and unsteady cases) than the difference at M 6 , i s = 0.90 .

5. Conclusions

The influence of unsteady wakes convecting through the passage of a high-speed LPT turbine cascade was studied experimentally. The measurements covered a wide range of flow conditions, allowing the study of the effect of unsteady inflow conditions at engine-representative exit Mach and Reynolds numbers, reduced frequencies, and flow coefficients.
The unsteady inflow generates modifications to the blade loading distribution. All the tested unsteady cases show reduced loading on the front suction side due to an incidence variation caused by the upstream rotating bars. The interaction with the wakes increases the suction peak and shifts it downstream, thereby augmenting the diffusion. Even though the boundary layer on the blade SS presents a laminar separation in all steady and unsteady cases, it was shown that the effects of the wakes on the separation bubble depend on the exit flow conditions. At the lowest Reynolds number, early reattachment is registered up to an exit Mach number of 0.80, while at the highest outlet Reynolds, indications of the wake-induced reattachment are observed also at the highest tested Mach number (0.90). The analysis of the hot-film data suggests that the aft-shift of the velocity peaks and separation locations, occurring as the exit Mach number is increased, moves the wake-separation bubble interaction towards the trailing edge. At the tested low Reynolds numbers and high transonic Mach number conditions, such a shift is linked to the absence of reattachment, even in the presence of unsteady wakes.
The study of the profile losses shows that, for the tested blade design, the effect of unsteady incoming wakes is detrimental. Considering that the tested blade exhibits a low diffusion factor under steady conditions, the shift of the peak downstream and the increase in diffusion with periodic inflow is related to the increase in separation losses. Increasing the exit Reynolds number promotes the reattachment at an exit Mach number of 0.90 with incoming wakes. These conditions are associated to a strong increase in losses due to the predominant impact of the turbulence-wetted surface. At a low Reynolds number, operating at a high exit Mach number results in lower profile losses, since no reattachment was detected under unsteady inflow and lower loss increase due to turbulent mixing was registered with respect to the higher Reynolds case. The separations of the suction side boundary layer for the tested blade design are not strong enough to generate a benefit from the wake-induced early reattachment; in contrast, they suffer the negative effect of the increased turbulent losses promoted by the wake.

Author Contributions

Conceptualization, G.L., L.S. and S.L.; Methodology, G.L., L.S. and S.L.; formal analysis, G.L., L.S. and S.L.; investigation, G.L., L.S. and S.L.; data curation, G.L., L.S. and S.L.; writing—original draft preparation, G.L., L.S. and S.L.; writing—review and editing: G.L., L.S. and S.L. All authors have read and agreed to the published version of the manuscript.

Funding

This research was funded by the Clean Sky 2 Joint Undertaking under the European Unions Horizon 2020 research and innovation program under the grant agreement 820883.

Institutional Review Board Statement

Not applicable.

Informed Consent Statement

Not applicable.

Data Availability Statement

The data presented in this study are openly available in Zenodo at https://doi.org/10.5281/zenodo.7264761, accessed on 13 June 2023.

Acknowledgments

The authors gratefully acknowledge funding of the SPLEEN project by the Clean Sky 2 Joint Undertaking under the European Unions Horizon 2020 research and innovation program under the grant agreement 820883.

Conflicts of Interest

The authors declare no conflict of interest.

Abbreviations

CTAconstant temperature anemometry
DFdiffusion factor, ( M p e a k M o u t ) / M o u t
DRdeceleration rate, ( M p e a k M o u t ) / ( M o u t [ 1 S p e a k / S L ] )
FSTIfreestream turbulence intensity
HFsurface-mounted hot-film
LEleading edge
L5HPL-shaped five-hole probe
LPTlow-pressure turbine
PSpressure side
SSsuction side
TEtrailing edge
TGturbulence grid
WGwake generator
Roman
Ctrue chord
Ebridge voltage
ffrequency
f + bar-reduced frequency, f b a r · C / V 6 , i s
gcascade pitch
Hcascade span
iincidence, β β i n
K s acceleration parameter, ν V i s 2 V i s S
MMach number
othroat
Ppressure
Q ˙ heat flux
Rreattachment, resistance
R e Reynolds number, ρ C V / μ
Sseparation line, location along surface length
s k e w skewness
S L surface length
s t d standard deviation
Ttemperature
Ubar peripheral speed
Vabsolute velocity
x , y , z location along axial chord, pitchwise and spanwise direction
Greek letters
α yaw angle
β primary flow direction, t a n 1 V a x / V t a n
γ ratio of specific heats, pitch angle
δ T E trailing edge thickness
ϵ S S wedge angle
ζ stagger angle
μ dynamic viscosity
ξ kinetic energy loss coefficient, 1 1 ( P 6 P 06 ) γ 1 γ 1 ( P 6 P 01 ) γ 1 γ
ρ density
τ q quasi-wall shear stress
Φ flow coefficient, V a x / U
Subscripts and superscripts
aambient, area-averaged
axaxial
barbar
Fflow
fsfreestream
Endendwall
ininlet
isisentropic
mmass-averaged
metmetallic
outoutlet
Profprofile
qquasi
Ssensor, substrate
secsecondary
wwall
0flow-off, cold, total
2at Plane 02
6at Plane 06
A ¯ time-averaged quantity

References

  1. Kurzke, J. Fundamental Differences Between Conventional and Geared Turbofans. In Proceedings of the ASME Turbo Expo 2009: Power for Land, Sea, and Air, Orlando, FL, USA, 8–12 June 2009; Volume 1. [Google Scholar] [CrossRef]
  2. Malzacher, F.J.; Gier, J.; Lippl, F. Aerodesign and Testing of an Aeromechanically Highly Loaded LP Turbine. J. Turbomach. 2003, 128, 643–649. [Google Scholar] [CrossRef]
  3. Vázquez, R.; Torre, D. The Effect of Mach Number on the Loss Generation of LP Turbines. In Proceedings of the ASME Turbo Expo 2012: Turbine Technical Conference and Exposition, Copenhagen, Denmark, 11–15 June 2012; Volume 8. [Google Scholar] [CrossRef]
  4. Ladwig, M.; Fottner, L. Experimental Investigations of the Influence of Incoming Wakes on the Losses of a Linear Turbine Cascade. In Proceedings of the ASME 1993 International Gas Turbine and Aeroengine Congress and Exposition, Cincinnati, OH, USA, 24–27 May 1993; Volume 3C. [Google Scholar] [CrossRef]
  5. Mayle, R.E. The 1991 IGTI Scholar Lecture: The Role of Laminar-Turbulent Transition in Gas Turbine Engines. J. Turbomach. 1991, 113, 509–536. [Google Scholar] [CrossRef]
  6. Schulte, V.; Hodson, H.P. Unsteady Wake-Induced Boundary Layer Transition in High Lift LP Turbines. J. Turbomach. 1998, 120, 28–35. [Google Scholar] [CrossRef]
  7. Stieger, R.D.; Hodson, H.P. The Unsteady Development of a Turbulent Wake Through a Downstream Low-Pressure Turbine Blade Passage. J. Turbomach. 2005, 127, 388–394. [Google Scholar] [CrossRef]
  8. Howell, R.J.; Hodson, H.P.; Schulte, V.; Stieger, R.D.; Schiffer, H.P.; Haselbach, F.; Harvey, N.W. Boundary Layer Development in the BR710 and BR715 LP Turbines—The Implementation of High-Lift and Ultra-High-Lift Concepts. J. Turbomach. 2002, 124, 385–392. [Google Scholar] [CrossRef]
  9. Coull, J.D.; Hodson, H.P. Unsteady boundary-layer transition in low-pressure turbines. J. Fluid Mech. 2011, 681, 370–410. [Google Scholar] [CrossRef]
  10. Clinckemaillie, J.; Fattorini, L.; Fontani, T.; Nuyts, C.; Wain, G.; Arts, T. Aerodynamic performance of a very-high-lift low-pressure turbine airfoil (T106C) at low Reynolds and high Mach number including the effect of incoming periodic wakes. In Proceedings of the 11th European Conference on Turbomachinery Fluid Dynamics and Thermodynamics, ETC 2015, Madrid, Spain, 23–27 March 2015. [Google Scholar]
  11. Mahallati, A.; Sjolander, S.A. Aerodynamics of a Low-Pressure Turbine Airfoil at Low Reynolds Numbers—Part II: Blade-Wake Interaction. J. Turbomach. 2012, 135, 011011. [Google Scholar] [CrossRef]
  12. Brunner, S.; Fottner, L.; Schiffer, H.-P. Comparison of Two Highly Loaded Low Pressure Turbine Cascades Under the Influence of Wake-Induced Transition. In Proceedings of the ASME Turbo Expo 2000: Power for Land, Sea, and Air, Munich, Germany, 8–11 May 2000; Volume 3. [Google Scholar] [CrossRef]
  13. Vera, M.; Hodson, H.; Vázquez, R. The Effect of Mach Number on lp Turbinewake-Blade Interaction. In Unsteady Aerodynamics, Aeroacoustics and Aeroelasticity of Turbomachines; Hall, K.C., Kielb, R.E., Thomas, J.P., Eds.; Springer: Dordrecht, The Netherlands, 2006; pp. 203–216. [Google Scholar]
  14. Vázquez, R.; Antoranz, A.; Cadrecha, D.; Armanãnzas, L. The Influence of Reynolds Number, Mach Number and Incidence Effects on Loss Production in Low Pressure Turbine Airfoils. In Proceedings of the ASME Turbo Expo 2006: Power for Land, Sea, and Air, Barcelona, Spain, 8–11 May 2006; Volume 6. [Google Scholar] [CrossRef]
  15. Coull, J.D.; Thomas, R.L.; Hodson, H.P. Velocity Distributions for Low Pressure Turbines. J. Turbomach. 2010, 132, 041006. [Google Scholar] [CrossRef]
  16. Curtis, E.M.; Hodson, H.P.; Banieghbal, M.R.; Denton, J.D.; Howell, R.J.; Harvey, N.W. Development of Blade Profiles for Low-Pressure Turbine Applications. J. Turbomach. 1997, 119, 531–538. [Google Scholar] [CrossRef]
  17. González, P.; Ulizar, I.; Vázquez, R.; Hodson, H.P. Pressure and Suction Surfaces Redesign for High-Lift Low-Pressure Turbines. J. Turbomach. 2002, 124, 161–166. [Google Scholar] [CrossRef]
  18. Canepa, E.; Lengani, D.; Nilberto, A.; Petronio, D.; Simoni, D.; Ubaldi, M.; Zunino, P. Flow Coefficient and Reduced Frequency Effects on Wake-Boundary Layer Interaction in Highly Accelerated LPT Cascade. Int. J. Turbomach. Propuls. Power 2021, 6, 32. [Google Scholar] [CrossRef]
  19. Wakelam, C.T.; Hoeger, M.; Niehuis, R. A Comparison of Three Low Pressure Turbine Designs. J. Turbomach. 2013, 135, 051026. [Google Scholar] [CrossRef]
  20. Arts, T. Aerodynamic performance of two very high lift low pressure turbine airfoils (T106C–T2) at low Reynolds and high Mach numbers. In Proceedings of the 5th European Conference for Aerospace Sciences, Munich, Germany, 1–5 July 2013. [Google Scholar]
  21. Simonassi, L.; Lopes, G.; Gendebien, S.; Torre, A.F.M.; Patinios, M.; Lavagnoli, S.; Zeller, N.; Pintat, L. An Experimental Test Case for Transonic Low-Pressure Turbines–Part I: Rig Design, Instrumentation and Experimental Methodology, In Proceedings of the ASME Turbo Expo 2022: Turbomachinery Technical Conference and Exposition, Rotterdam, The Netherlands, 13–17 June 2022; Volume 10B. [CrossRef]
  22. Lopes, G.; Simonassi, L.; Torre, A.F.M.; Patinios, M.; Lavagnoli, S. An Experimental Test Case for Transonic Low-Pressure Turbines–Part 2: Cascade Aerodynamics at On- and Off-Design Reynolds and Mach Numbers. In Proceedings of the ASME Turbo Expo 2022: Turbomachinery Technical Conference and Exposition, Rotterdam, The Netherlands, 13–17 June 2022; Volume 10B. [Google Scholar] [CrossRef]
  23. Simonassi, L.; Lopes, G.; Lavagnoli, S. Effects of Periodic Incoming Wakes on the Aerodynamics of a High-Speed Low-Pressure Turbine Cascade. In Proceedings of the 15th European Conference on Turbomachinery Fluid Dynamics and Thermodynamics, Paper n. ETC2023-293. Budapest, Hungary, 24–28 April 2023; Available online: https://www.euroturbo.eu/publications/conference-proceedings-repository/ (accessed on 12 June 2023).
  24. Pfeil, H.; Eifler, J. Turbulence characteristics behind rotating cylinder grids. Forsch. Ingenieurwesen 1976, 42, 27–32. [Google Scholar] [CrossRef]
  25. Berrino, M.; Simoni, D.; Ubaldi, M.; Zunino, P.; Bertini, F. Off-Design Performance of a Highly Loaded LP Turbine Cascade Under Steady and Unsteady Incoming Flow Conditions. In Proceedings of the ASME Turbo Expo 2014: Turbine Technical Conference and Exposition, Dusseldorf, Germany, 16–20 June 2014; Volume 2D. [Google Scholar] [CrossRef]
  26. Hodson, H. The detection of boundary-layer transition and separation in high speed turbine cascades. In Measurement Techniques for Transonic and Supersonic Flow—Proc. 7th Symposium; University of Cambridge: Cambridge, UK, 1984. [Google Scholar]
  27. Hultmark, M.; Smits, A.J. Temperature corrections for constant temperature and constant current hot-wire anemometers. Meas. Sci. Technol. 2010, 21, 105404. [Google Scholar] [CrossRef]
  28. Ligrani, P.; Baun, L.; Singer, B. Spatial resolution and downwash velocity corrections for multiple-hole pressure probes in complex flows. Exp. Fluids 1989, 7, 424–426. [Google Scholar] [CrossRef]
  29. Cukurel, B.; Acarer, S.; Arts, T. A novel perspective to high-speed cross-hot-wire calibration methodology. Exp. Fluids 2012, 53, 1073–1085. [Google Scholar] [CrossRef]
  30. Boufidi, E.; Fontaneto, F. Towards a more reliable application of hot-wire anemometry in complex compressible flows. In Proceedings of the XXIII Biannual Symposium on Measuring Techniques in Turbomachinery, Transonic and Supersonic Flow in Cascades and Turbomachines, Stuttgart, Germany, 1–2 September 2016. [Google Scholar]
  31. Gomes, R.A.; Stotz, S.; Blaim, F.; Niehuis, R. Hot-Film Measurements on a Low Pressure Turbine Linear Cascade with Bypass Transition. J. Turbomach. 2015, 137, 091007. [Google Scholar] [CrossRef]
  32. Börner, M.; Niehuis, R. Dynamics of Shock Waves Interacting with Laminar Separated Transonic Turbine Flow Investigated by High-Speed Schlieren and Surface Hot-Film Sensors. J. Turbomach. 2021, 143, 051010. [Google Scholar] [CrossRef]
  33. Schubauer, G.B.; Klebanoff, P.S. Contributions on the Mechanics of Boundary-Layer Transition; Technical Report; NASA: Washington, DC, USA, 1956. [Google Scholar]
Figure 1. Sketchof the SPLEEN C1 cascade test setup with wake generator, including measurement planes and techniques (a). Picture of the cascade in the configuration relative to the current paper (b).
Ijtpp 08 00035 g001
Figure 2. SPLEEN C1 blade geometry.
Ijtpp 08 00035 g002
Figure 3. Comparison ofPS and SS distributions of isentropic Mach number at R e 6 , i s = 70 k with and without periodic incoming wakes (left); detail of rear part of SS for all investigated exit Mach number cases at R e 6 , i s = 70 k and at R e 6 , i s = 120 k (right).
Ijtpp 08 00035 g003
Figure 4. Midspan distribution of quasi-wall shear stress (top), voltage standard deviation (center), and voltage skewness (bottom). S S —steady case separation location, S U —unsteady case separation location, R S —steady case reattachment location, and R U —unsteady case reattachment location, computed from pneumatic taps data.
Ijtpp 08 00035 g004
Figure 5. Space–time diagrams of quasi-wall shear stress (left), voltage standard deviation (center), and voltage skewness (right) at midspan. S ¯ —average location of separation and R ¯ —average location of reattachment, computed from pneumatic taps data.
Ijtpp 08 00035 g005
Figure 6. Pitchwise distributions of energy loss coefficient at midspan for R e 6 , i s = 70 k (left) and R e 6 , i s = 120 k (right).
Ijtpp 08 00035 g006
Figure 7. Mass-averaged energy loss coefficient for all investigated flow conditions at midspan.
Ijtpp 08 00035 g007
Table 1. SPLEENcascade design parameters.
True chord, C52.285mm
Axial chord, C a x 47.614mm
Cascade pitch, g32.950mm
Pitch-to-chord ratio0.630-
Cascade span, H165.000mm
Max thickness/Chord0.127-
TE thickness, d e l t a T E 0.870mm
Throat opening, o19.400mm
Stagger angle, ζ 24.400°
Wedge angle, ϵ S S 6.480°
Inlet metal angle, β m , i n 37.300°
Outlet metal angle, β m , o u t 53.800°
Table 2. Nominaland off-design flow conditions. F—flow field measurements at cascade outlet; B Pneu—blade surface pneumatic measurements; B HF—hot-film sensors on blade surface.
Nominal
Conditions
Off-Design Conditions
M 6 , i s 0.9 R e 6 , i s 65k70k100k120k
R e 6 , i s 70k M 6 , i s 0.700.900.700.800.900.950.700.900.700.90
M 1 , i s 0.46 f + 1.180.951.181.050.950.91.180.951.180.95
f + 0.95 Φ 0.720.770.720.770.800.800.720.800.720.80
Φ 0.80F X X XX
B PneuXXXXXXXXXX
B HF X XX X
Table 3. Comparison of inlet flow conditions with and without incoming wakes.
( i MS ) Nominal   [ ° ] ( Δ i MS ) Max   [ ° ] ( γ MS ) Nominal   [ ° ] FSTI   [ % ]
Steady 0.89 ±0.240.652.30
Unsteady 2.00 ±0.400.754.10
Table 4. Blade loading characteristics for all tested outlet Mach number conditions at R e 6 , i s = 70 k and R e 6 , i s = 120 k. Locations of separation and reattachment obtained by applying the method of Lopes et al. [22].
Re 6 is M 6 is S peak
[ S / S L ]
M is , max
[-]
DF
[-]
DR
[-]
Separation
[ S / S L ]
Reattachment
[ S / S L ]
SUSUSUSUSUSU
70k0.700.370.410.8740.8820.250.260.390.410.540.550.920.8
70k0.800.460.50.9750.9860.220.230.410.430.560.57ND0.87
70k0.900.530.561.0701.0820.190.20.40.430.650.68NDND
70k0.950.630.651.1201.1300.180.190.480.510.70.7NDND
120k0.700.390.410.8910.8960.270.280.450.460.540.570.860.75
120k0.800.44-0.981-0.26-0.4-0.56-0.92-
120k0.900.530.551.0791.0900.20.210.420.450.630.67ND0.89
120k0.950.62-1.114-0.17-0.45-0.69-ND-
Disclaimer/Publisher’s Note: The statements, opinions and data contained in all publications are solely those of the individual author(s) and contributor(s) and not of MDPI and/or the editor(s). MDPI and/or the editor(s) disclaim responsibility for any injury to people or property resulting from any ideas, methods, instructions or products referred to in the content.

