1. Introduction
Cooling systems in gas turbines have continually evolved to enable ever-increasing turbine entry temperatures (TETs) leading to improved specific work outputs and cycle efficiencies. External surfaces of components (vanes, blades, endwalls, etc.) in the high-pressure turbine region are protected from exposure to high mainstream temperatures by thin films of cool air bled from the compressor stage. The ideal cooling system provides a uniform protective layer of coolant between the external component surfaces and the mainstream gas path—this ensures adequate protection over the surfaces to prevent hotpots forming in under-cooled regions.
Traditionally, the coolant layer is introduced to external component surfaces through discrete angled holes within the components—this is known as film cooling. Film cooling is a standard approach to thermal management of components in the high-pressure turbine region. Effusion cooling refers to the introduction of coolant through many small discrete holes; this can produce a more uniform protective layer, but increases the complexity of manufacture, making it less widely adopted in practice. The distinction between film and effusion cooling is whether coolant jets from individual holes interact, which typically occurs at low hole pitch-to-diameter ratios
. Transpiration cooling denotes the introduction of a uniform film of protective coolant to external component surfaces through porous sections in the component walls. Film, effusion, and transpiration cooling mechanisms are shown schematically in
Figure 1.
Research into the thermal performance of film cooling is a mature field. Whilst this body of previous research is pertinent to transpiration cooling, a summary will not be provided explicitly here—an up-to-date review of the topic can be found in [
2]. Transpiration cooling is less widely studied, despite being identified as a potential method for highly effective thermal management of turbine components 50+ years ago (e.g., [
3,
4]). The reason for this is largely due to historical manufacturing limitations and the structural challenges associated with use of this technology in such a demanding environment. Advances in additive manufacturing (AM) have relaxed manufacturability constraints relative to subtractive processes, which in the context of gas turbines has made porous materials a viable option for use in future cooling systems. Furthermore, AM porous materials can be constructed from periodic structures, e.g., Triply Periodic Minimal Surfaces (TPMS) or Lattice Trusses. These periodic porous structures offer improved strength and stiffness performance relative to their stochastic counterparts [
5], which is a clear benefit for highly stressed turbine components. Transpiration cooling is thus becoming an increasingly realisable prospect, resulting in an increased focus from researchers in recent years, e.g., [
6,
7,
8,
9].
2. Test Coupon Topology and Manufacture
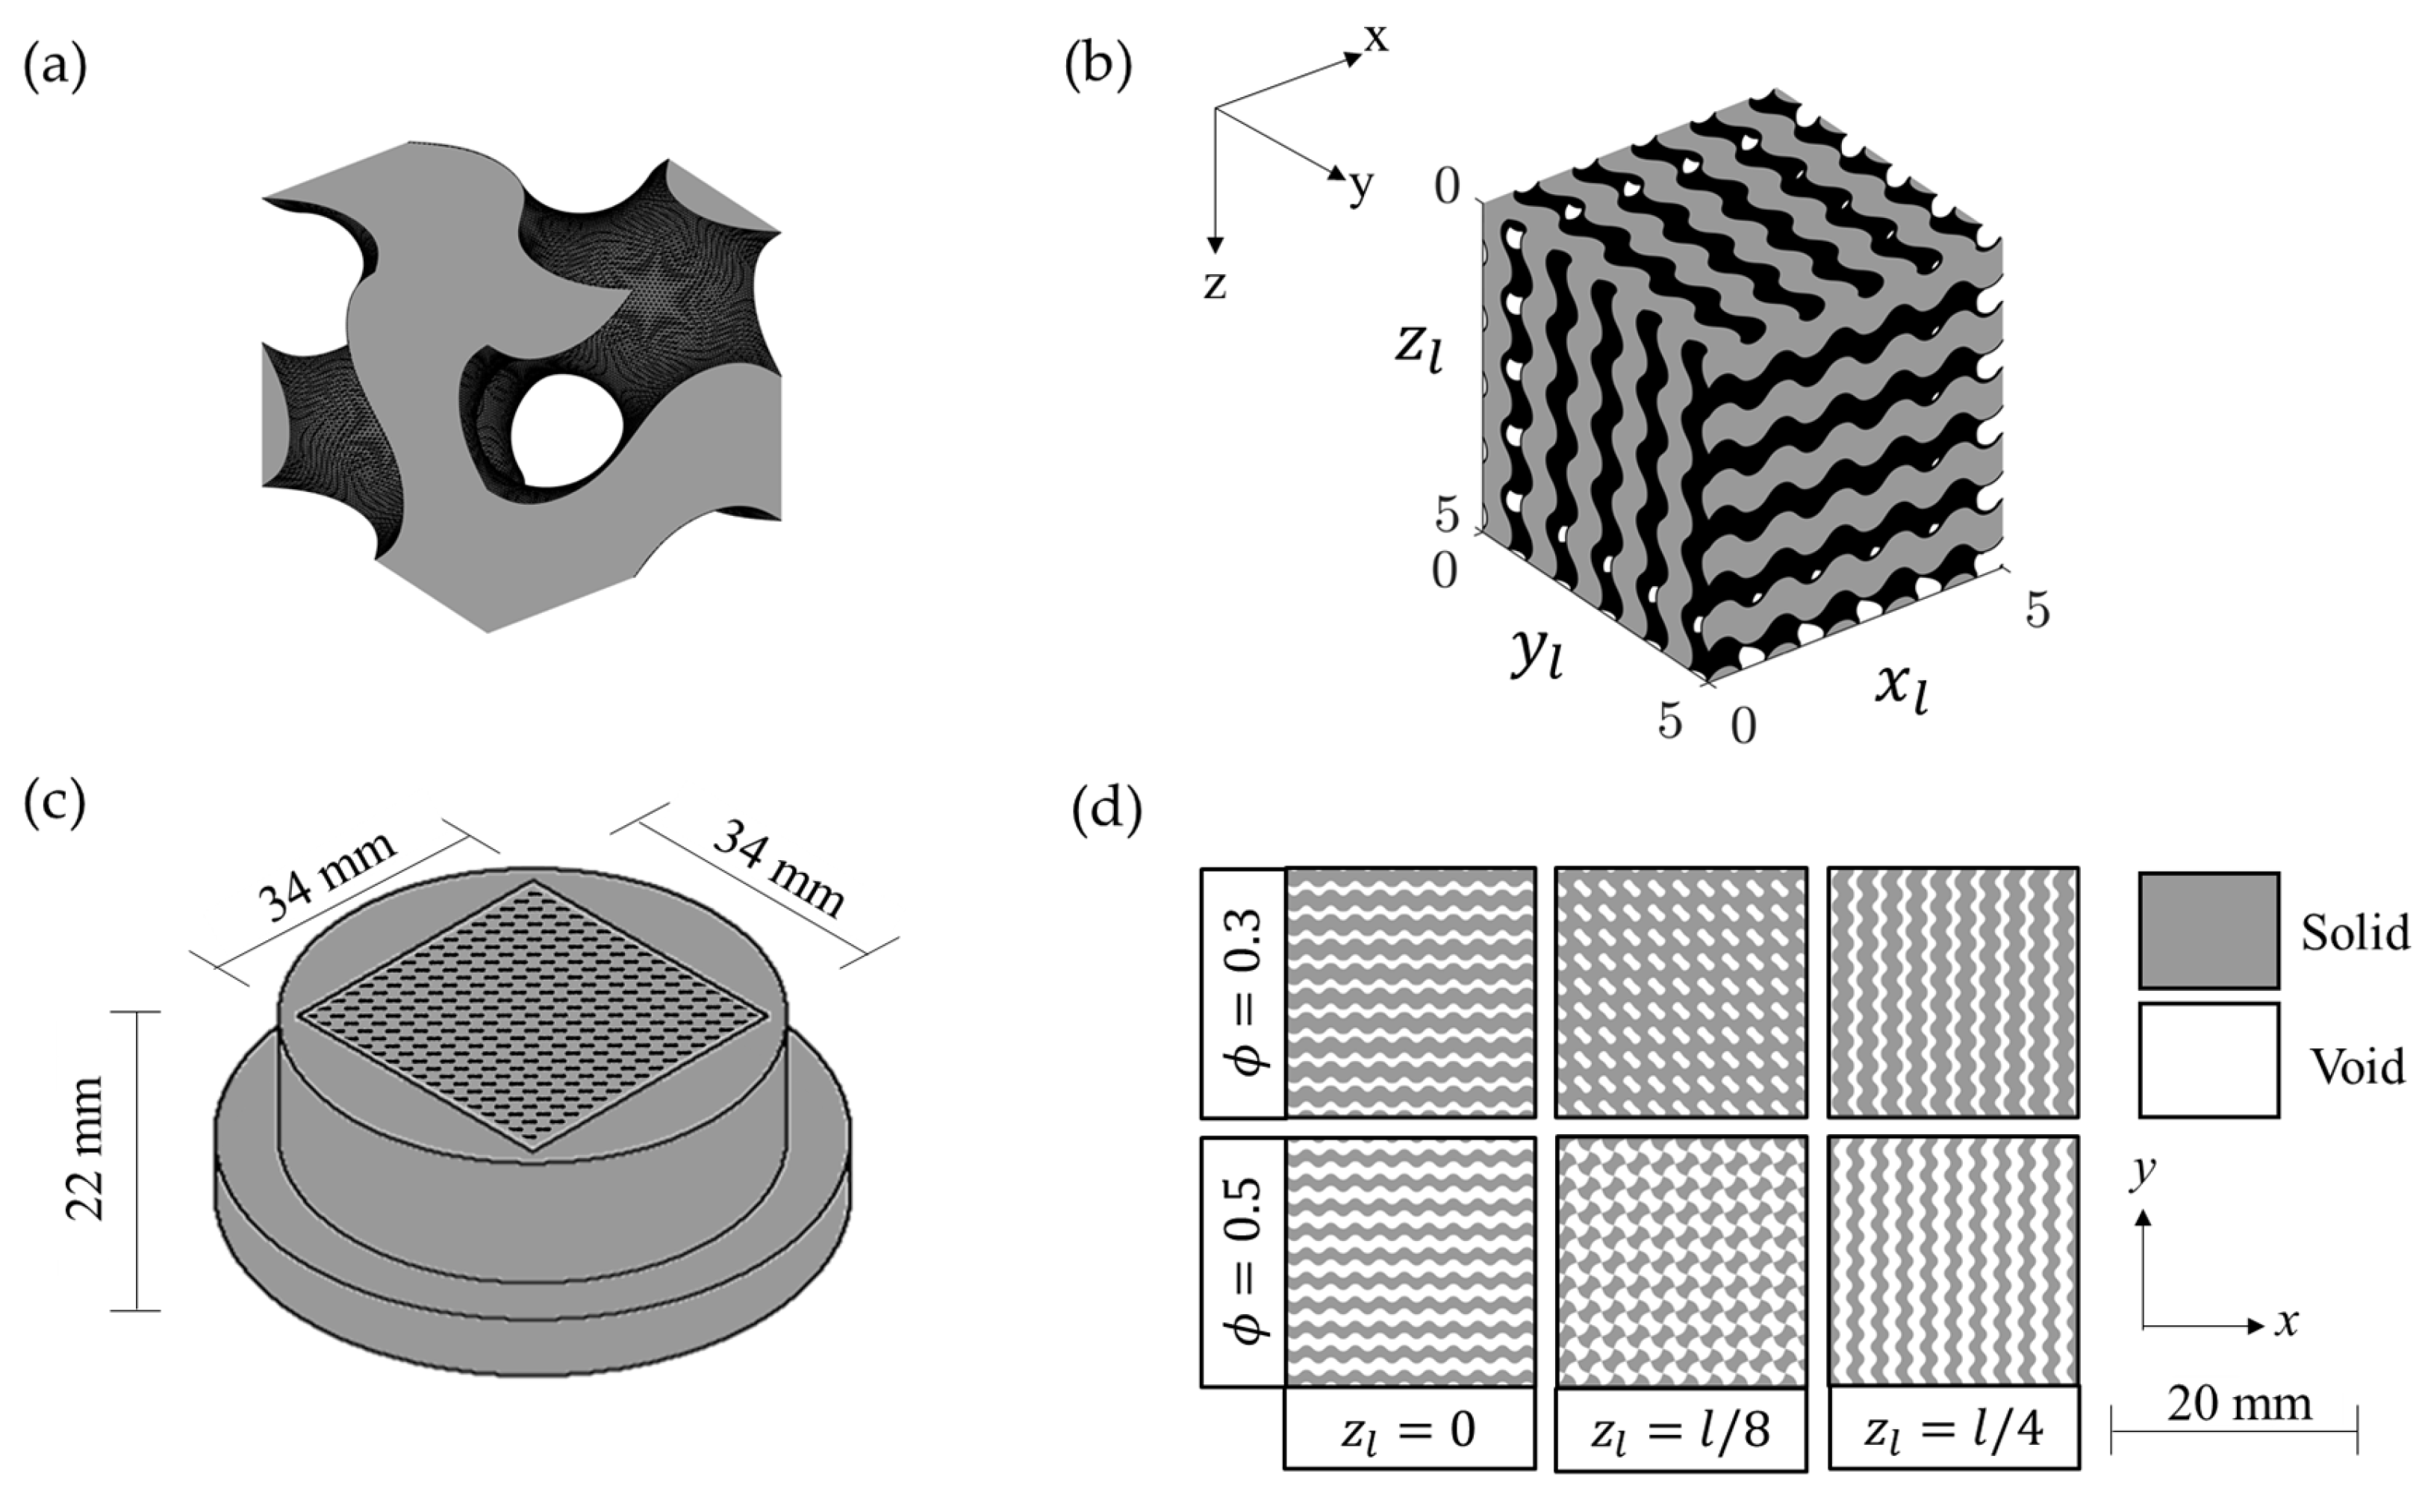
This paper presents an experimental study of transpiration cooling for periodic porous structures formed by repeating gyroid unit cells. Renders of a single gyroid unit cell (classified as a type of TPMS structure) and a periodic porous structure comprising 5 × 5 × 5 gyroid unit cells are shown in
Figure 2a,b for illustrative purposes (
,
, and
are the number of unit cells from the origin in the respective dimension). The porous test coupons were produced in polymer through Stereolithography (SLA) 3D printing.
The test coupons featured a 34 mm × 34 mm × 22 mm porous region, as shown in
Figure 2c. The porous region was constructed from repeating gyroid unit cells. Gyroids are commonly approximated in Cartesian co-ordinates by the following equation [
11]:
where
is the unit cell length and
is the iso-value, which can vary between 1.5 and −1.5. A surface of constant iso-value forms the boundary that divides the gyroid between regions of empty space (i.e., the void through which the coolant will flow) and solid material. The void is defined as the volume occupied by iso-values that are greater than the surface iso-value, and the solid as the volume occupied by iso-values that are less than the surface iso-value. Porosity is taken as the ratio of the void volume to total volume occupied by the void and solid. A surface iso-value of 0 divides the space into equal void and solid volumes, thereby resulting in a porosity of 0.5. Porosities of less than 0.5 are achieved by defining the surface at positive iso-values.
It is worth noting that the void-solid cross-sectional profile resulting from the intersection between the gyroid and the
plane changes depending on the constant. For this study, the
-terms were offset by an eighth of the unit cell length to produce a ‘checkerboard pattern’ for injection of the coolant into the mainstream at
. This is illustrated for porosities of 0.3 and 0.5 by the central column of tiles in
Figure 2d.
The test coupon topologies were generated using Gen3D Sulis (now Altair Sulis). Coupons with porosities of 0.3, 0.4, and 0.5 were tested in this study. In all cases, the unit cell length was set to 2 mm, resulting in porous regions comprising 17 × 17 × 11 unit cells. The coupons were 3D printed using a Formlabs 3+, which has a print resolution of 25 microns. Once the printing had finished, the coupons were flushed with isopropyl alcohol to remove uncured resin.
3. Performance Parameters
The adiabatic effectiveness,
, was used to determine cooling performance of the three test coupons. Adiabatic effectiveness is defined as follows:
where
and
are the temperatures of the mainstream and coolant flows, respectively, and
is the adiabatic wall temperature of the cooled surface. By definition, the adiabatic effectiveness varies between 0 and 1: a value of
indicates that
, i.e., no protection is provided by the coolant to the surface from the hot mainstream flow; a value of
is achieved when the
, which is the maximum level of cooling that can be realised. The adiabatic effectiveness varies over the surface owing to mainstream fluid entrainment into the coolant layer. A balance must be struck between adequate and excessive use of coolant, for which there is an associated penalty to specific work output.
Film cooling studies traditionally use the blowing ratio,
, to investigate the effect of coolant supply rate on thermal performance [
12]. The blowing ratio is defined as the ratio of the coolant mass flux to the mainstream flow mass flux:
where
and
are density and velocity terms and the subscripts
and
denote the coolant and mainstream gas paths. The blowing ratio is useful for comparing the performance of discrete cooling holes; however, it is less effective when assessing multi-hole arrays, which transpiration test pieces may ultimately be considered. This is exemplified by the study of Courtis et al. [
13], who investigated the thermal performance of effusion hole configurations with different porosities. The authors carried out tests where coolant and mainstream mass flow rates were kept constant between geometries of low and a high porosity—this led to a lower blowing ratio at the higher porosity owing to the larger open area. Measurements of adiabatic effectiveness indicated a reduction in individual hole performance for the high porosity specimen relative to the low porosity specimen owing to its lower blowing ratio; however, the high porosity specimen yielded a more uniform surface coverage of coolant (indicated by a higher average adiabatic effectiveness) owing to its greater open area for coolant delivery.
It follows from the above that the injection ratio (
) is a useful factor for assessing the relationship between coolant flow levels and thermal performance in effusion and transpiration cooling systems:
where
is the total mass flow rate of the coolant,
is the product of the mainstream density and freestream velocity, and
is the effective area of cooling—for this study this was taken as the area of the porous section (34 mm × 34 mm—see previous section). This is notably different from the open area at exit. Effective area aims to represent the source area of film coverage. Effectiveness values tend to increase with increased coolant use until a point where the momentum of the coolant is high enough to cause separation from the surface, leading to a sharp decrease in effectiveness. An optimal system would provide an even distribution of high adiabatic effectiveness values for a low injection ratio.
4. Experimental Facility
Figure 3a shows a schematic of the test facility; a detailed view of the test section is provided in
Figure 3b. The test coupon was installed in the wall of wind tunnel with a 54 mm wide and 30 mm high cross-section in the region of interest. Air was drawn through the wind tunnel by an inverter-controlled side-channel blower; a bell mouth inlet was used to accelerate the flow into the test section, with the boundary layer removed upstream of the test coupon. The mainstream flow velocity
was taken from pitot-static measurements. In this study,
was maintained at 87.5 m/s (
~0.27) throughout and so all presented data are for incompressible flow conditions. The boundary layer followed a 1/7th power law distribution for a turbulent profile with thickness
3.63 mm.
The coolant flow was supplied through a compressed air line to a plenum on the underside of the test coupon with the mass flow measured using a Bronkhorst thermal flow controller (F-206AI). Given the fixed mainstream flow velocity, blowing and injection ratios were varied by changing the coolant mass flow rate through control of the compressor demand setting. A mesh heater was used to heat the “coolant” flow to 80 °C, thereby providing a temperature difference relative to the mainstream flow, which is a pre-requisite for making adiabatic effectiveness measurements. This temperature difference led to a density ratio of 0.83. The temperatures of the mainstream and coolant flows were measured with thermocouple probes installed upstream of the test section and downstream of the mesh heater respectively.
Internal surfaces of the wind tunnel were lined with Rohacell (a specialist insulating material) and the test coupons were mounted within a polycarbonate plate—these low-conductivity materials were selected to minimise heat loss from the system between the mesh heater and the measurement region, thereby limiting the uncertainty associated with heat loss in the effectiveness measurements. The structural components of the wind tunnel were manufactured out of stainless steel rather than aluminium owing to its lower thermal conductivity, again to minimise heat loss.
A calcium fluoride window provided IR optical access to an In-Sb infrared camera (IRC-Mid800) downstream of the test coupon for non-intrusive measurement of the adiabatic wall temperatures (and thus the adiabatic effectiveness) on the Rohacell tunnel wall. The adiabatic wall temperatures for a given test case were obtained from the average of ~500 IR images captured at a rate of 5 Hz and integration time of 0.52 ms. The window afforded a 46 mm streamwise and 20 mm pitchwise view of the wall (referred to as the ‘measurement region’ from hereon). The upstream edge of the measurement region was located 47 mm downstream of the trailing edge of the porous test region. The range of injection ratios tested in this study (1.4% to 3.1%) are presented in
Table 1 alongside those from pertinent transpiration work in literature for context. Garg and Gaugler [
14] used injection ratios in the range 2% to 7% to investigate discrete hole film cooling in an engine-representative environment. The values of injection ratio used in the present study (and those referenced in
Table 1) are of comparable magnitude.
The measurement region was selected downstream of the test coupon to represent a hybrid transpiration cooling, as in Fier and Bogard [
8]. Given current manufacturing capabilities, full transpiration cooling is impractical in gas turbines and so hybrid systems, whereby porous regions cool solid sections, present the most realistic development pathway. Understanding of cooling downstream of porous regions is therefore of high importance while also providing data analogous to film cooling.
Calibration of the IR camera was conducted following the two-stage process from Ochs et al. [
16], which involves pre-calibration (stage 1) and in situ correction (stage 2). The pre-calibration was conducted in the test rig using a copper block sprayed with black paint on its surface. A thin film heater was used to set the temperature of the block. This temperature was measured by an embedded thermocouple for correlation against the IR camera intensity readings. An average of 600 IR images was taken at each temperature setpoint to produce intensity-temperature data for fitting of the pre-calibration curve at 16 evenly spaced points between 20 °C and 60 °C. This fitting followed ‘case two’ from Ochs et al. [
16], which assumes that window transmissivity is dependent on window temperature but independent of the wavelength of irradiation. Independence of wavelength was assumed due to the broad transmissivity of the calcium fluoride window in the spectral range of blackbody irradiation for the experimental temperatures. Whilst the window demonstrated no signs of heating during testing, fitting with a dependence of temperature allowed pre-calibration data to be used day-to-day by accounting for changes in room temperature through an in situ correction. The in situ correction was conducted using a reference temperature provided by a thermocouple mounted in a copper disk within the measurement region [
17]. Finally, it should be noted that gains and offsets were applied to each pixel in the camera focal planar array before data collection, a process typically referred to as a Non-Uniformity Correction (NUC). For this study, a two-point NUC was collected at 22 °C and 55 °C.
5. Uncertainties
Uncertainties in the measurement of
(
= 1.1 × 10
−5 kg/s) and
(
= 1.2 × 10
−6 kg/s) affected the measurement of the injection ratio, giving
0.12% (calculated using
)) [
18]. The same result would be given for
due to the same dependence on the coolant and mainstream mass flow rates. Temperature measurements made using thermocouples calibrated against a Pt100 reference probe had an uncertainty of ±0.1 °C. These thermocouple beads were used to calibrate the IR camera, discussed in the previous section, giving an uncertainty in the IR measurement of ±0.5 °C. Assuming
the uncertainty for adiabatic effectiveness is given below [
19]:
where the partial derivatives of the adiabatic effectiveness with respect to injection ratio and temperature measurements were used to find an uncertainty in
of
.
included the IR surface temperature measurement as well as the coolant and mainstream thermocouple measurements. Representative values for
were calculated from the fits of area averaged effectiveness from data presented in the results section. The combination of uncertainties in the three temperatures used to calculate
gave a dependence on
. The main contribution to
came from these temperature measurements.
6. Results
6.1. Adiabatic Effectiveness Measurements at Constant Blowing Ratio
Figure 4 provides contour plots of adiabatic effectiveness for test coupon porosities of 0.3, 0.4, and 0.5, at blowing ratios of 0.024, 0.048, and 0.062. These blowing ratios were selected to replicate those used in the transpiration cooling study of Fier and Bogard. Note that the columns and rows of the 3 × 3 plots in
Figure 4 are organised into constant values of porosity and blowing ratio, respectively. The streamwise length of the porous region (34 mm) was taken as the length
to normalise the streamwise,
, and pitchwise,
, locations in the plots. Taking
at the trailing edge of the porous region and
at the centre of the coolant jet gave a dimensionless measurement region of
and
.
It is apparent from the contour plots in
Figure 4 that effectiveness levels increase as the blowing ratio increases, most prominently along the centreline; they also increase as porosity increases. These observations can be readily explained: increasing the blowing ratio and/or porosity (which is proportional to the coolant exit area) increases the mass of coolant introduced through the porous region, with the effect of increasing the area-averaged effectiveness. Stronger lateral variation in effectiveness was observed at higher blowing ratios, as illustrated by more aggressive tapering of the isolines. This is the result of edge effects present in the data due to the porous region not spanning the full width of the tunnel (34 mm of the 54 mm full width). Edge effects were more apparent at high blowing ratios due to the higher gradients between the centreline effectiveness
and the edge of the test plate
, where the effectiveness approaches the freestream value of
. Also of note is the apparent movement of the lateral maximum towards the positive
direction. This may be due to the gyroid channels imparting swirl on the coolant, although further investigation would be required to draw any conclusions.
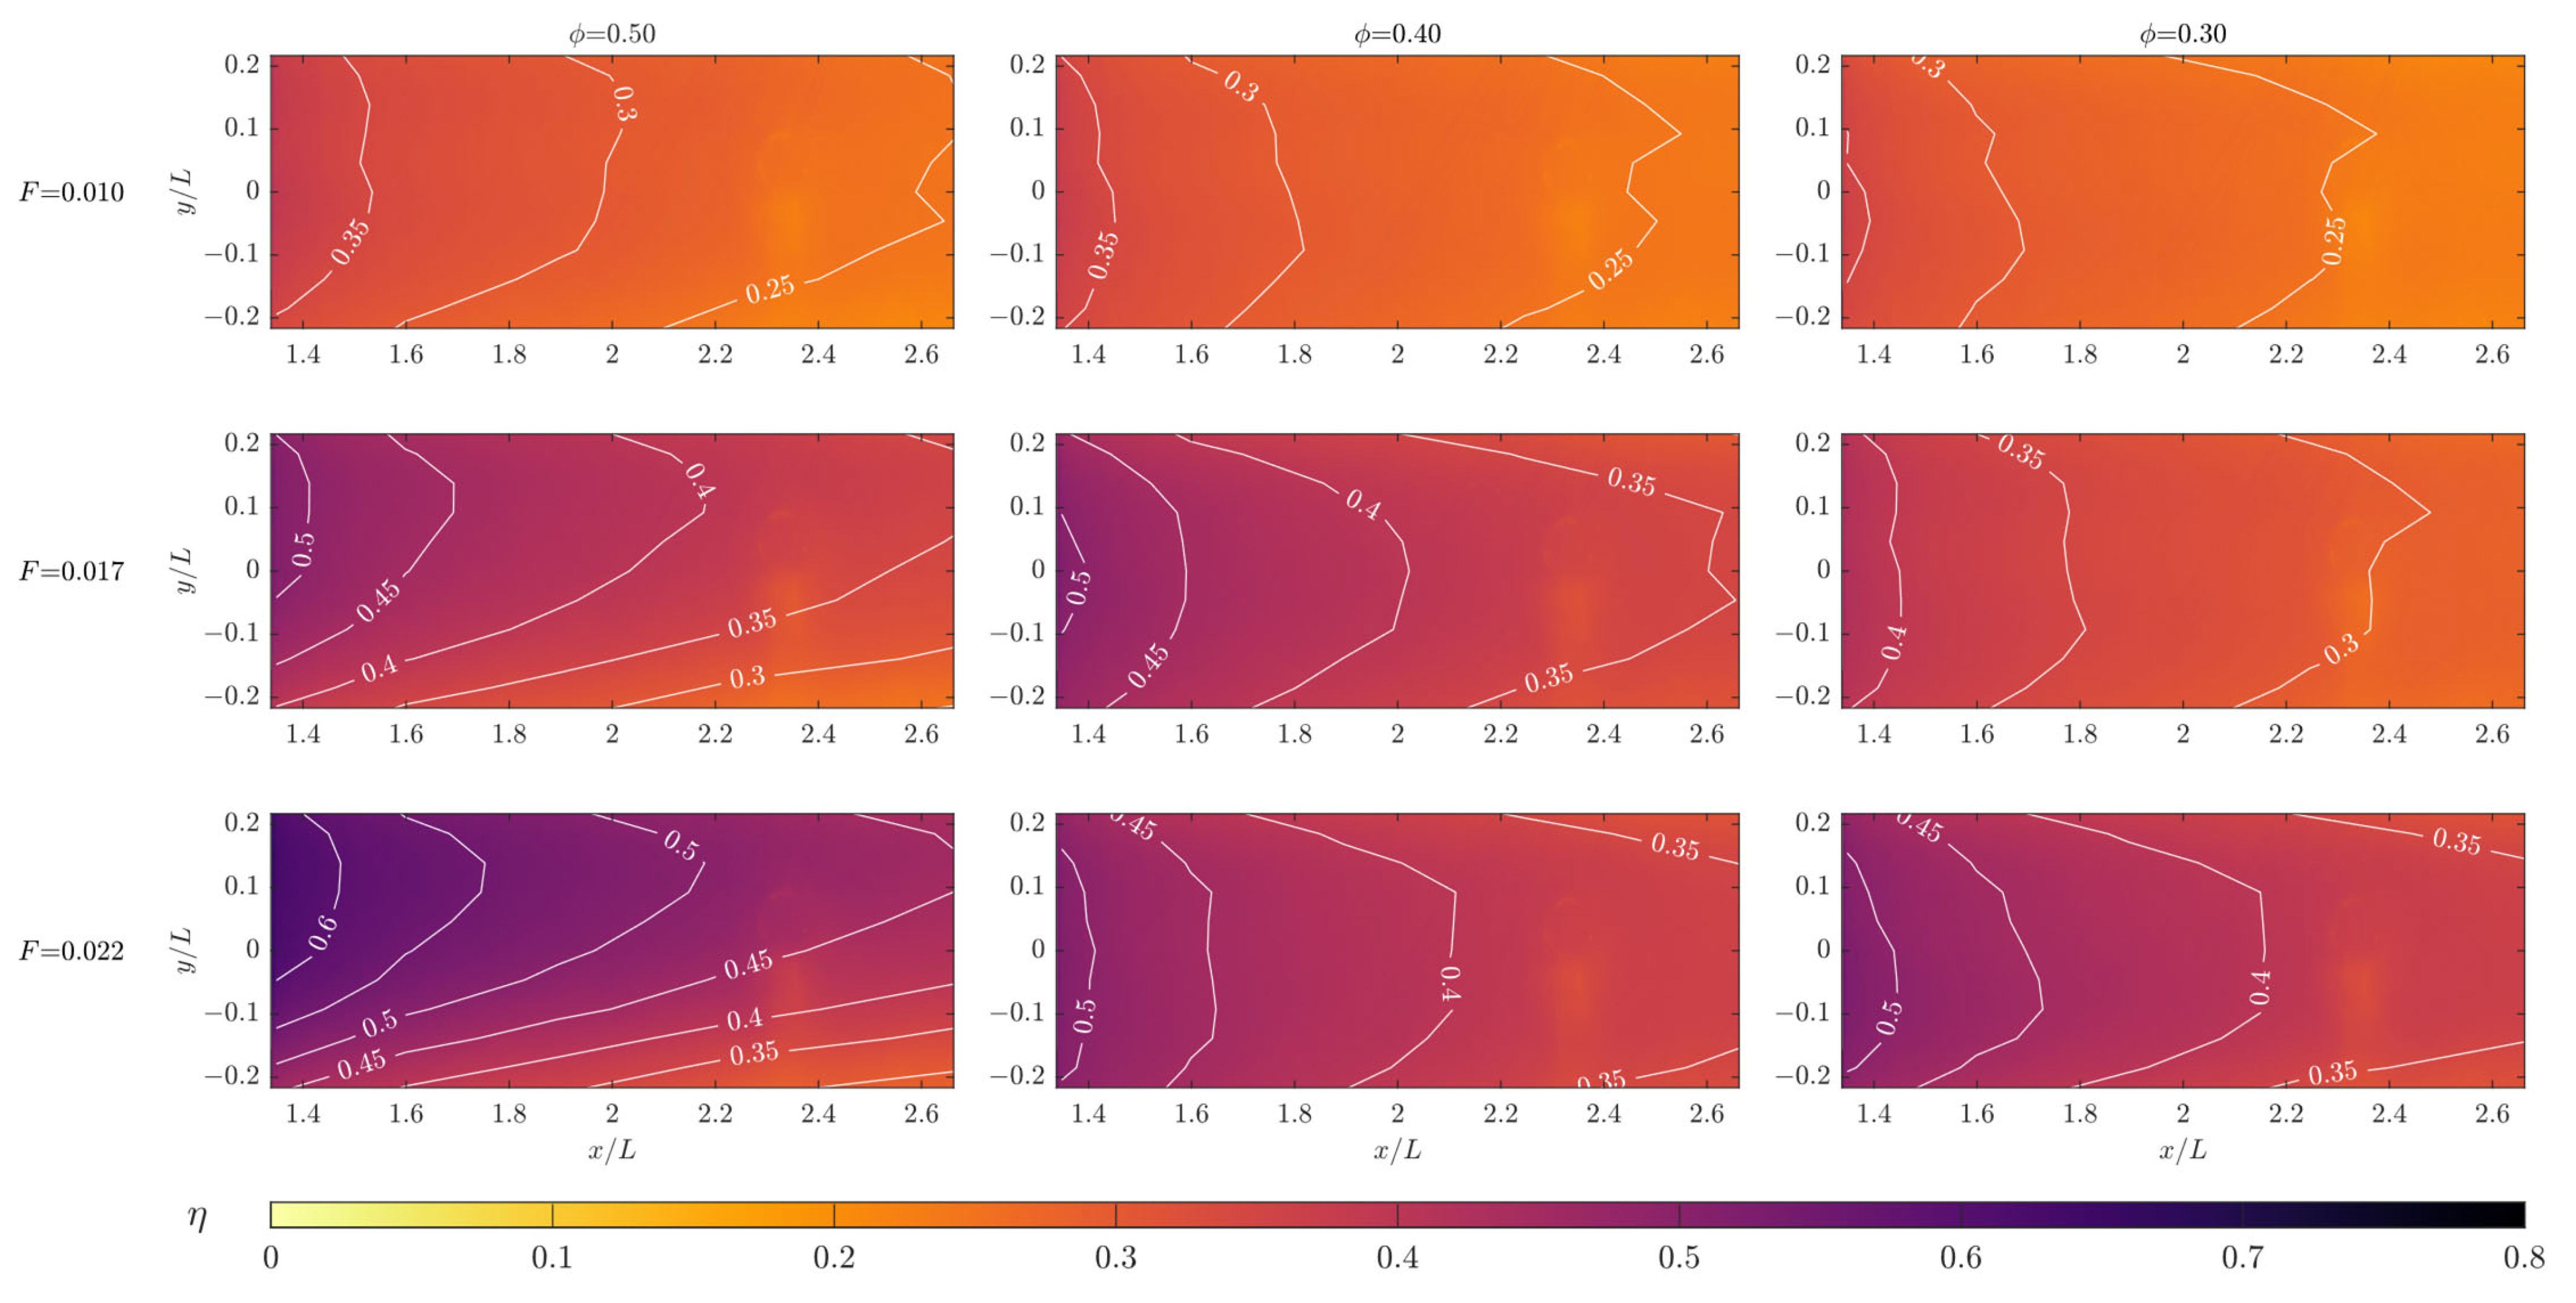
6.2. Adiabatic Effectiveness Measurements at Constant Injection Ratio
Figure 5 provides contour plots of adiabatic effectiveness for the three test coupons at injection ratios of 0.010, 0.017, and 0.022. It is apparent that the sensitivity of cooling effectiveness to porosity is much less pronounced at a given injection ratio than at a given blowing ratio (moving left to right in
Figure 5 shows much less variation in effectiveness than left to right in
Figure 4). This is clearer when evaluating the impact of blowing ratio and injection ratio on area averaged cooling performance,
, as provided in
Figure 6a and
Figure 6b, respectively. In
Figure 6a there are distinct curves for the three porosity values, whereas in
Figure 6b the curves collapse, i.e., there is little sensitivity of the effectiveness to porosity (any observed difference is within experimental uncertainty). Note that the fits provided in
Figure 6a,b follow the equation
, where
is the independent variable (
or
), and
is the fitting constant. This fitting equation was chosen to give a single parameter fit that respected the limits of effectiveness measurements for an attached jet (through the origin and asymptote at
)—as such, the associated fits are for data visualisation purposes rather than representing robust physical correlations.
7. Discussion
Blowing ratio is the established parameter for comparing film cooling thermal performance; however, it does not adequately account for the performance of multi-hole arrays [
13] or porous sections used in transpiration cooling (illustrated in
Figure 6 of this study). The results in
Figure 6a indicate that at a given blowing ratio cooling performance increases with porosity; however, to realise such an improvement requires the delivery of a greater mass flow rate of coolant through the porous region owing to the increased open area at the surface—this brings about a penalty to the specific work output.
The results in
Figure 6b are arguably more meaningful in that they show the relative thermal performance characteristics of the porous gyroid structures at equivalent coolant mass flow rates. For the gyroid structures tested here, there was little discernible difference in cooling performance with
between porosities of 0.3 and 0.5 for the measurement region of this study. As such, selecting the porosity (within the range tested) of a gyroid structure for use in a transpiration cooling system would be based less on thermal performance and more on other factors, such as coolant pressure drop and structural integrity.
Advances in AM will facilitate new effusion and transpiration cooling designs. Assessing the relative thermal performance between these new designs (and with existing designs) needs to be conducted in a meaningful way if cooling system designers are to make informed decisions. As the results of this study have shown, injection ratio is a more meaningful parameter for assessment of thermal performance than blowing ratio. Given this finding, injection ratio has been used as the independent variable for comparing area averaged adiabatic effectiveness results from this study with those in Fier and Bogard [
8], and Meng et al. [
20], as shown in
Figure 7. These previous studies were chosen as they enabled ready comparison of area averaged adiabatic effectiveness over the same dimensionless streamwise length range as the experiments here. Fier and Bogard tested a mesh-like transpiration setup with
; Meng et al. [
20] tested inline and staggered multi-row effusion cooling setups. Porosities for the setups in Meng et al. [
20] were calculated for staggered
and inline
arrays in accordance with the recommendations of Courtis et al. [
13], where
and
are streamwise and pitchwise hole spacings, respectively (normalised by hole diameter). Porosities were calculated independent of injection angle to enable simple calculation of injection ratio from blowing ratio using
.
Comparison of the present work with the results of Fier and Bogard shows an apparent drop off in effectiveness at high injection ratios. The drop off may in part be caused by edge effects present in this study at higher injection ratios, which acted to lower the area averaged effectiveness (this effect was not observed in Fier and Bogard as their transpiration setup spanned the full width of their wind tunnel); differences in the transpiration geometries (wire-mesh in Fier and Bogard, and gyroids here) may also have contributed to the performance difference, but to confirm this further testing would be required where the gyroid test pieces spanned the full width of the tunnel. The transpiration setups tested here and in Fier and Bogard show significant thermal performance improvement over the effusion cooling setups in Meng et al. [
20].
8. Conclusions
Transpiration cooling is a promising technological advancement within cooling of gas turbine components. Porous cooling has far fewer design constraints than the established method of film cooling, providing a wide field for research. However, this provides challenges in comparing between systems. It was found that:
Gyroids can be manufactured using SLA down to a resolution of 25 µm for a 2 mm unit cell. At this resolution and cell size, a minimum porosity of 30% was achieved before blockage of pores was noticed.
Area averaged adiabatic effectiveness was found to be insensitive to porosity for a given injection ratio over the range of 0.3–0.5.
A method of comparison for transpiration studies was presented and extended to enable comparison with wider film cooling literature.
Results collected at constant blowing ratio and constant injection ratio prompted discussion on the most effective metrics for comparison amongst transpiration studies as well as with film cooling. The observations made were as follows:
Blowing ratio is not adequate to compare cooling cases of varying open area at exit (porosity in transpiration cases). A changing open area at exit changes the amount of coolant use with higher porosities requiring more coolant for a given M.
The injection ratio is the key parameter when comparing cases with varying open area at exit. Included within injection ratio is the effective area of cooling taken as the porous region footprint for transpiration cooling but does not have a formal definition in film cooling cases.
Author Contributions
Conceptualization, C.M.S. and J.M.F.; funding acquisition, O.J.P.; investigation, B.J.B.; methodology, B.J.B., C.M.S., J.M.F., J.A.S. and O.J.P.; resources, J.M.F.; software, B.J.B.; supervision, C.M.S., J.M.F. and O.J.P.; visualization, B.J.B.; writing—original draft preparation, B.J.B. and O.J.P.; writing—review and editing, B.J.B., C.M.S., J.M.F., J.A.S. and O.J.P. All authors have read and agreed to the published version of the manuscript.
Funding
This research was funded by the Engineering and Physical Sciences Research Council (Grant No. EP/R021279/1; Funder ID: 10.13039/501100000266).
Institutional Review Board Statement
Not applicable.
Informed Consent Statement
Not applicable.
Data Availability Statement
Data are contained within the article. Additional data are available on request from the corresponding author.
Acknowledgments
The authors of this paper would like to thank: Andrew Langley and James Cansell for technical support of the test facility. Hui Tang for advising on IR data processing methods. Jack Crossfield, Tom Eagland, Adnaan Hamza and Callum Woodward for helping to source related literature and for developing methods for specimen production through a series of undergraduate projects.
Conflicts of Interest
The authors declare no conflict of interest.
Nomenclature
| Symbols | |
| area (m2) |
| injection ratio |
| gyroid unit cell length (m) |
| streamwise length of porous section (m) |
| mass flow rate (kg/s) |
| blowing ratio = |
| streamwise and pitchwise hole spacings, normalised by hole diameter |
| isovalue |
| temperature (°C) |
| velocity (m/s) |
| stream-, pitch- and span- wise co-ordinates (m) |
| Gyroid unit cell count in ,, directions |
| adiabatic effectiveness |
| area averaged adiabatic effectiveness |
| density (kg/m3) |
| porosity of transpiration geometry |
| Subscripts | |
| adiabatic wall |
| effective |
| coolant (at exit) |
| mainstream |
References
- Lakshminarayana, B. Fluid Dynamics and Heat Transfer of Turbomachinery; Wiley & Sons: New York, NY, USA, 1996. [Google Scholar]
- Dutta, S.; Kaur, I.; Singh, P. Review of Film Cooling in Gas Turbines with an Emphasis on Additive Manufacturing-Based Design Evolutions. Energies 2022, 15, 6968. [Google Scholar] [CrossRef]
- Goldstein, R.J.; Shavit, G.; Chen, T.S. Film-Cooling Effectiveness with Injection Through a Porous Section. J. Heat Transf. 1965, 87, 353–359. [Google Scholar] [CrossRef]
- Bayley, F.J.; Turner, A.B. The Transpiration-Cooled Gas Turbine. ASME J. Eng. Power 1970, 92, 351–358. [Google Scholar] [CrossRef]
- Deshpande, V.S.; Fleck, N.A.; Ashby, M.F. Effective properties of the octet-truss lattice material. J. Mech. Phys. Solids 2001, 49, 1747–1769. [Google Scholar] [CrossRef]
- Huang, G.; Min, Z.; Yang, L.; Jiang, P.; Chyu, M.K. Transpiration cooling for additive manufactured porous plates with partition walls. Int. J. Heat Mass Transf. 2018, 124, 1076–1087. [Google Scholar] [CrossRef]
- Min, Z.; Huang, G.; Parbat, S.N.; Yang, L.; Chyu, M.K. Experimental Investigation on Additively Manufactured Transpiration and Film Cooling Structures. J. Turbomach. 2019, 141, 031009. [Google Scholar] [CrossRef]
- Fier, N.D.; Bogard, D.G. Additively Manufactured Porous Geometries for Hybrid Turbine Cooling (Paper No. V05AT12A005). In Proceedings of the ASME Turbo Expo 2021, Virtual, Online, 7–11 June 2021. [Google Scholar]
- Brimacombe, B.J.; Scobie, J.A.; Flynn, J.M.; Sangan, C.M.; Pountney, O.J. Effect of Porosity and Injection Ratio on the Performance of Transpiration Cooling through Gyroids (Paper No. ETC2023-271). In Proceedings of the 15th European Turbomachinery Conference, Budapest, Hungary, 24–28 April 2023; Available online: https://www.euroturbo.eu/publications/conference-proceedings-repository/ (accessed on 26 May 2023).
- Desmos Studio PBC. Available online: https://www.desmos.com/ (accessed on 26 May 2023).
- Kaur, I.; Singh, P. Flow and thermal transport characteristics of Triply-Periodic Minimal Surface (TPMS)-based gyroid and Schwarz-P cellular materials. Numer. Heat Transf. Part A Appl. 2021, 79, 553–569. [Google Scholar] [CrossRef]
- Bogard, D.G.; Thole, K.A. Gas turbine film cooling. J. Propuls. Power 2006, 22, 248–270. [Google Scholar] [CrossRef]
- Courtis, M.; Murray, A.; Coulton, B.; Ireland, P.; Mayo, I. Influence of Spanwise and Streamwise Film Hole Spacing on Adiabatic Film Effectiveness for Effusion-Cooled Gas Turbine Blades. Int. J. Turbomach. Propuls. Power 2021, 6, 37. [Google Scholar] [CrossRef]
- Garg, V.K.; Gaugler, R.E. Effect of coolant temperature and mass flow on film cooling of turbine blades. Int. J. Heat Mass Transf. 1997, 40, 435–445. [Google Scholar] [CrossRef]
- Liu, Y.Q.; Jiang, P.X.; Xiong, Y.B.; Wang, Y.P. Experimental and numerical investigation of transpiration cooling for sintered porous flat plates. Appl. Therm. Eng. 2013, 50, 997–1007. [Google Scholar] [CrossRef]
- Ochs, M.; Horbach, T.; Schulz, A.; Koch, R.; Bauer, H.J. A novel calibration method for an infrared thermography system applied to heat transfer experiments. Meas. Sci. Technol. 2009, 20, 075103. [Google Scholar] [CrossRef]
- Michaud, M.; Ornano, F.; Chowdhury, N.; Povey, T. Methodology for high-accuracy infrared calibration in environments with through-wall heat flux. J. Glob. Power Propuls. Soc. 2020, 4, 1–13. [Google Scholar] [CrossRef]
- Kline, S.J.; McClintock, F.A. Describing Uncertainties in Single Sample Experiments. Mech. Eng. 1953, 75, 3–8. [Google Scholar]
- Moffatt, R.J. Describing the uncertainties in experimental results. Exp. Therm. Fluid Sci. 1988, 1, 3–17. [Google Scholar] [CrossRef]
- Meng, T.; Zhu, H.; Liu, C.; Yu, Q.; Wei, J. Accuracy of Superposition Predictions of Film Cooling Effectiveness on a Flat Plate with Double Rows of Holes (Paper No. V05CT19A018). In Proceedings of the ASME Turbo Expo 2016, Seoul, Republic of Korea, 13–17 June 2016. [Google Scholar]
| Disclaimer/Publisher’s Note: The statements, opinions and data contained in all publications are solely those of the individual author(s) and contributor(s) and not of MDPI and/or the editor(s). MDPI and/or the editor(s) disclaim responsibility for any injury to people or property resulting from any ideas, methods, instructions or products referred to in the content. |
© 2023 by the authors. Licensee MDPI, Basel, Switzerland. This article is an open access article distributed under the terms and conditions of the Creative Commons Attribution (CC BY) license (https://creativecommons.org/licenses/by/4.0/).


 ,
, 


