1. Introduction
For two decades, fan and compressor blade design for aircraft engines has been based on the usage of modern optimization procedures and CFD methods, as already shown by Benini [
1] and Voss et al. [
2]. Initially, the development led to the use of multi-objective optimizations with the application of Kriging and Bayesian trained Neural-Network-based metamodels, which are still used for simple aerodynamic profile design, as shown by Munoz Lopez et al. [
3]. Later on, the importance of including different disciplines became more clearly recognized. This has resulted in today’s design processes’ multiobjective–multidisciplinary optimization procedures
The resulting highly efficient designed blades are subject to various types of wear and damage as soon as they are in service. This directly affects the efficiency and fuel consumption of an engine, as described in the report by Sallee et al. [
4]. They investigated the Pratt and Whitney JT8D engine and could show that 60 to 70 percent of the increase in fuel consumption results from a deterioration in the fan and compressor system. In this context, the authors were also faced with the question of how to deal with this knowledge in terms of engine maintenance. Essentially, this means balancing the cost of replacing or repairing the fan and compressor blades against increasing fuel consumption and the associated increase in operating costs. However, in order to make a clear statement or decision about what repair efforts are necessary and economical, the mechanisms causing the deterioration must be identified, and their effect must be understood in detail.
In 1995, the first advise concerning the blade-refurbishing technique was given by Roberts [
5]. Next, Lufthansa Technik AG (LHT), one of the world’s largest aircraft engine maintenance companies, started a long-term study more than ten years ago to address questions, which are the significant effects, how the deterioration mechanisms are working, and what maintenance efforts would economically improve efficiency. In the first step, the main damage types were extracted on the basis of engine data from maintenance at LHT, as described by Giebmanns et al. [
6]. The erosion of the leading edge of transonic blading has thereby been shown to be a dominant damage type. This has been confirmed by a number of studies in recent decades. Reid and Urasek [
7] showed a significant reduction in efficiency in a single-stage compressor caused by an increase in leading edge thickness. Within a further study, Balan and Tabakoff [
8] investigated a low-speed compressor cascade and a single-stage rig and found a reduction in efficiency which was also based on the changes in leading edge shape. Besides all the investigations on leading-edge erosion effects by Roberts et al. [
5], Hamed et al. [
9], Ghenaiet [
10], and Gunn et al. [
11], the numerical simulation and prediction of this effect becomes important, as shown in the study by Tabakoff et al. [
12].
However, within the study of DLR and LHT (Giebmanns et al. [
6]), it was apparent that detailed measurements of the effects of leading-edge erosion on transonic fans and compressor blades were not available, although they are needed for the description and understanding of the loss mechanisms and for the development of an accurate numerical prediction. Hence, a detailed pre-study of the influence of a blunt leading edge was investigated by Hergt and Klinner et al. [
13,
14]. Based on this and on Hergt et al. [
15], the current paper deals with the experimental and numerical investigation of a transonic compressor cascade with an eroded leading edge, whereby this erosion is derived from real engine blades. The aim of this study is to precisely describe the influence of leading-edge erosion on the performance of the cascade in terms of total pressure loss and deflection and then to identify the mechanisms causing it. Thereby, and through the simultaneous validation of the numerical simulations, the basis for the future development of a prediction model and process will be provided.
4. Numerical Setup
The numerical simulations in the present study were carried out with the CFD flow solver Ansys CFX using a stationary approach with a fully coupled solution to Reynolds-averaged conservation equations for mass, momentum, and energy in the flow field (RANS equations). Furthermore, the SST two-equation turbulence model of Menter [
19] with automatic wall treatment was used. This was combined with the gamma–theta transition model of Langtry and Menter [
20]. The fluid was defined as dry air, treated as a single-component ideal gas.
In addition, different boundary conditions were set. All fluid walls of the geometry had a no-split condition and were assumed to be hydraulically smooth walls. The walls were assumed to be adiabatic. As only one blade of the cascade was modeled for the CFD simulation, a periodic boundary condition was applied to consider the influence of the neighboring blades. At the sides of the segment, symmetry boundary conditions were applied. The boundary conditions at the inlet of the domain were set according to the measurement values from the experiments and depending on the operating point and the cascade geometry. The following values were applied: total pressure, total temperature, inflow direction, and turbulence level. At the outlet, a static pressure was applied, according to the measurement results.
Computational Mesh
Ansys CFX uses a finite-volume method to solve the conservation equations. The conservation equations are integrated over control volumes formed around the corners of the elements, i.e., the nodes of the mesh. The flow solution is calculated at these nodes. The mesh was created using the software package Ansys ICEM. The blade region for the reference cascade type A consisted entirely of hexahedral elements (three layers and 1 mm height), whereas for cascade type B a hybrid approach was applied (21 prism layer, 4.5 mm height). This included an unstructured domain around the leading edge, consisting of tetrahedral elements, to adequately resolve the details of the erosion, as depicted in
Figure 4. In this area, the boundary layer was resolved using prismatic elements. The nodes of the hexahedral part and the unstructured part are conformal and connected; therefore, no mesh interface is needed. To avoid interactions of the shock wave with the inlet boundary condition, an increasingly coarse hexdominant mesh was used upstream of the cascade. The Y+ values along the surface are globally kept below 1, with the exception of some positions at the leading edge of the eroded blade, where locally higher values appear around the corners of the erosion structures.
5. Results and Discussion
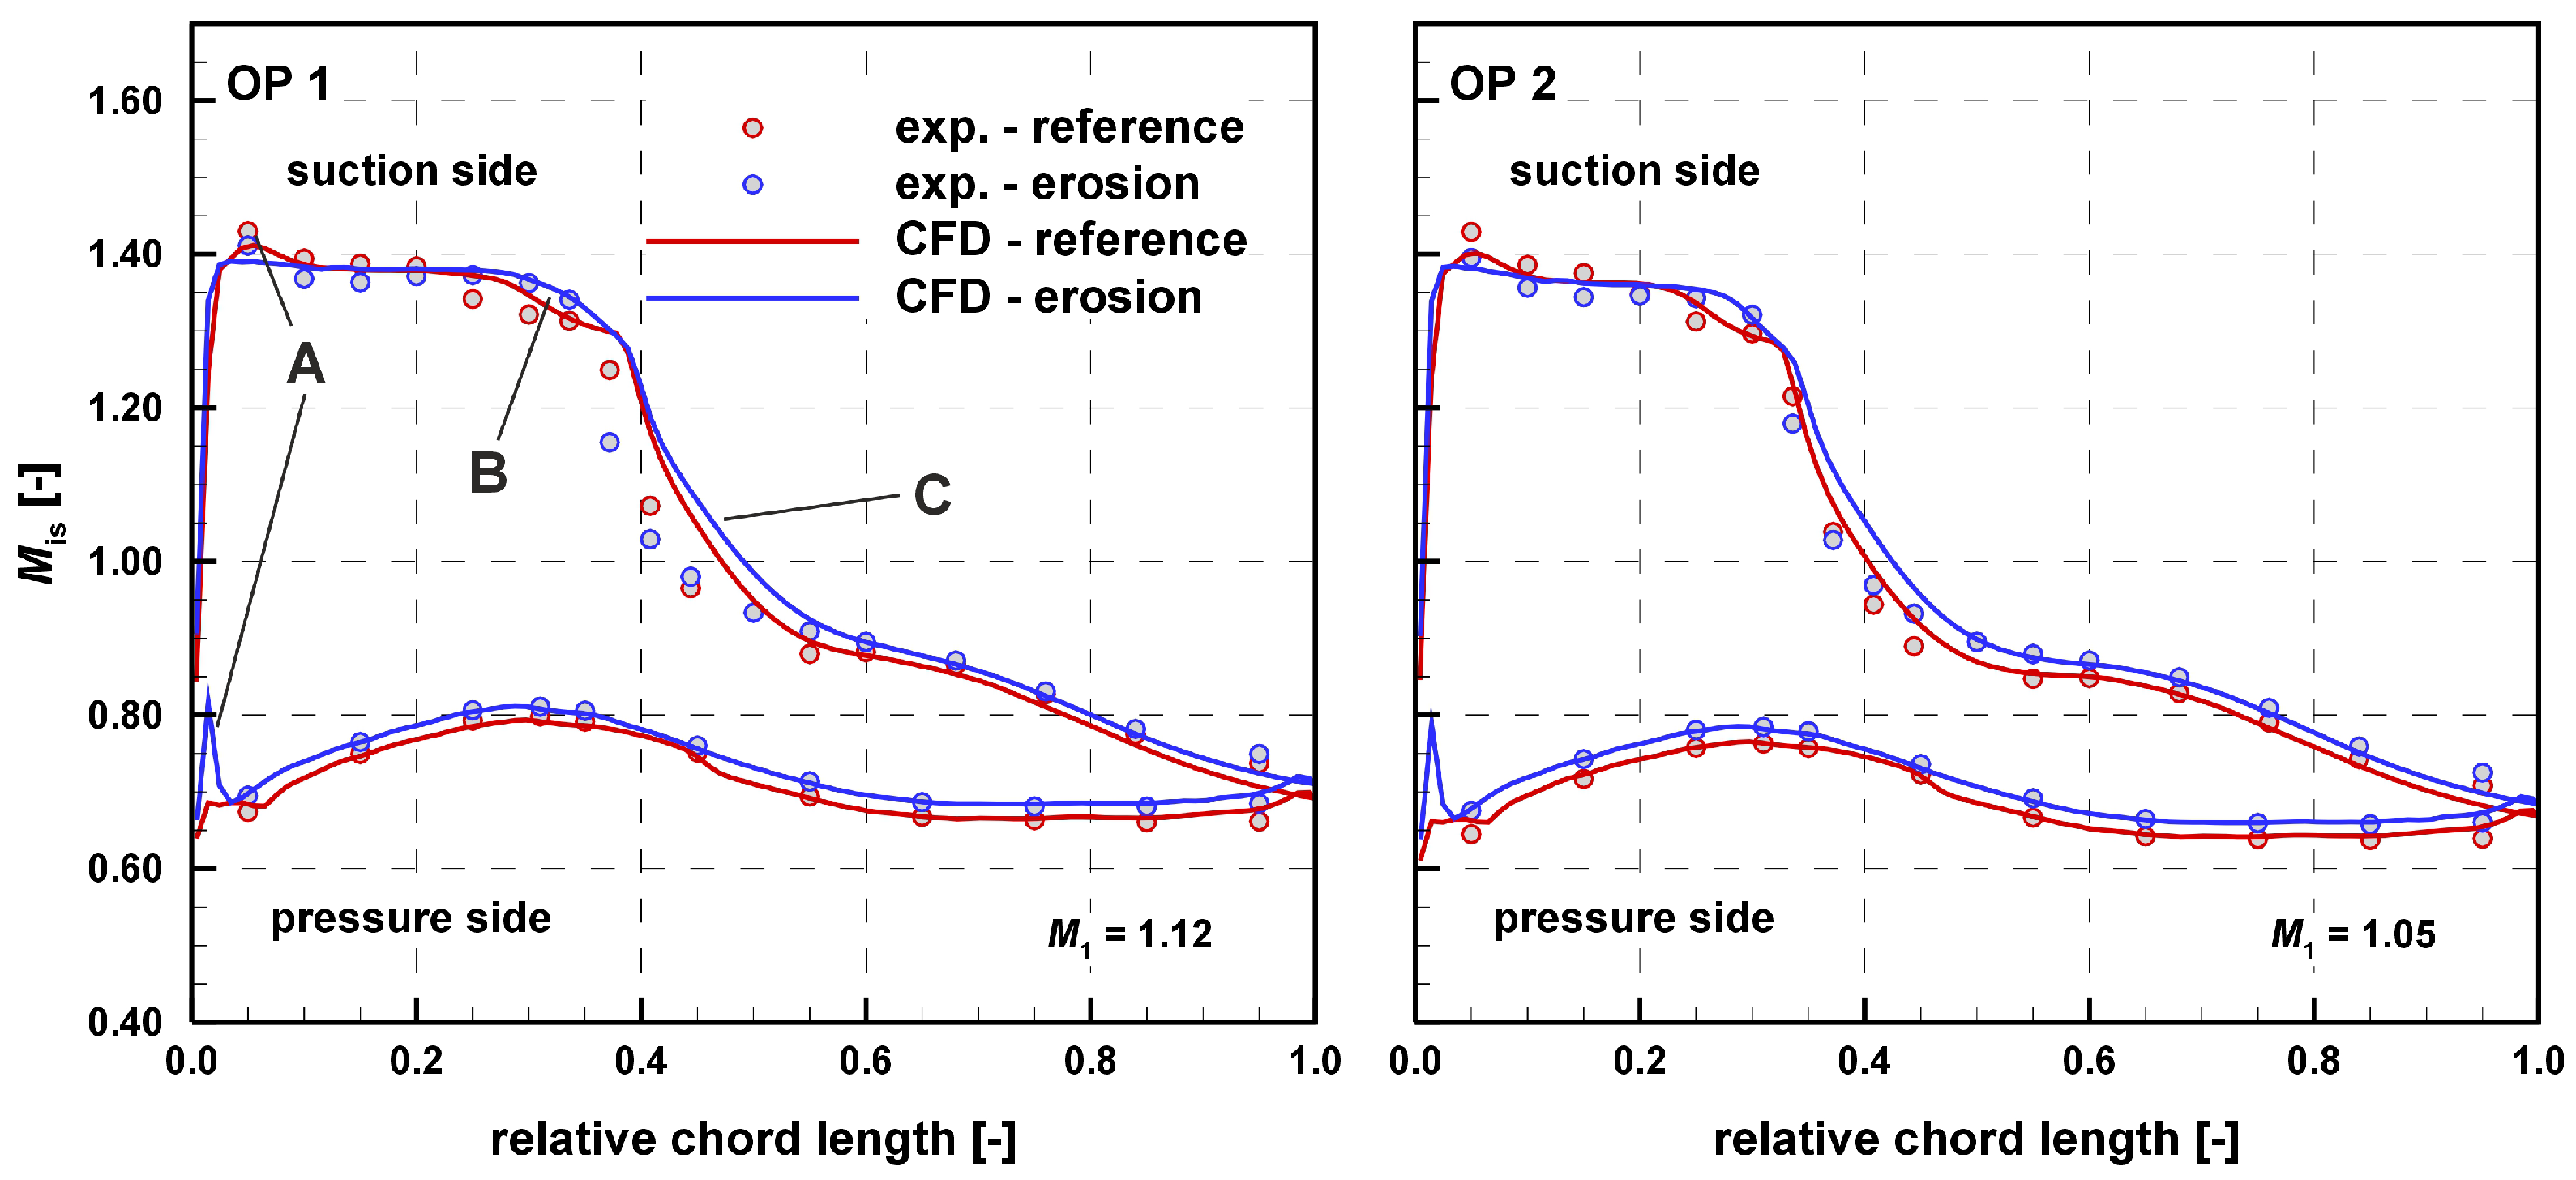
In this study, the focus is on the influence of the eroded leading edge on the performance of a compressor blade cascade. In addition, the question of how accurately the cascade flow can be reproduced and predicted using the numerical simulations and what insights into the flow behavior can be obtained from the numerical results will also be answered. The profile Mach number distribution is an essential way to evaluate the performance of a cascade, so the distributions of the two cascade types at both operating points will be reviewed and compared.
Figure 5 shows these comparisons of experimental and numerical profiles of Mach number distribution (OP1 left, OP2 right), and it immediately becomes clear that the experimental distributions are reflected well by the numerical results. Only small differences are identifiable between the cascade types, but they reflect the essential effects of the flow. In the area of the leading edge along the first 5 percent of the chord length, it can be observed in the numerical results that there is a Mach number peak on the pressure side due to erosion (marked with A). In contrast to this, on the first 5 percent of the suction side, the Mach number is slightly decreased, and thus, the small Mach number peak of the reference cascade disappears at the erosion cascade.
In general, all suction side distributions show the characteristic behavior of a transonic/supersonic compressor profile that is reflected in the high local Mach number gradient of the plots, marked with a C. This gradient results from the normal shock within the cascade passage where the flow is decelerated into the subsonic range. However, at the position marked with a C, it is noticeable that there is a discrepancy between the experimental and numerical results. In addition, it can be observed that the beginning of the pressure gradient at 38 percent chord length corresponds well for both and that the curves overlap again at 48 percent. The gradient difference can be attributed to a slight change in the structure of the lambda shock above the blade surface. Even small deviations in the numerical and experimental boundary layer can lead to a changed shock boundary layer interaction and thus to a changed shock structure, as described by Hergt et al. [
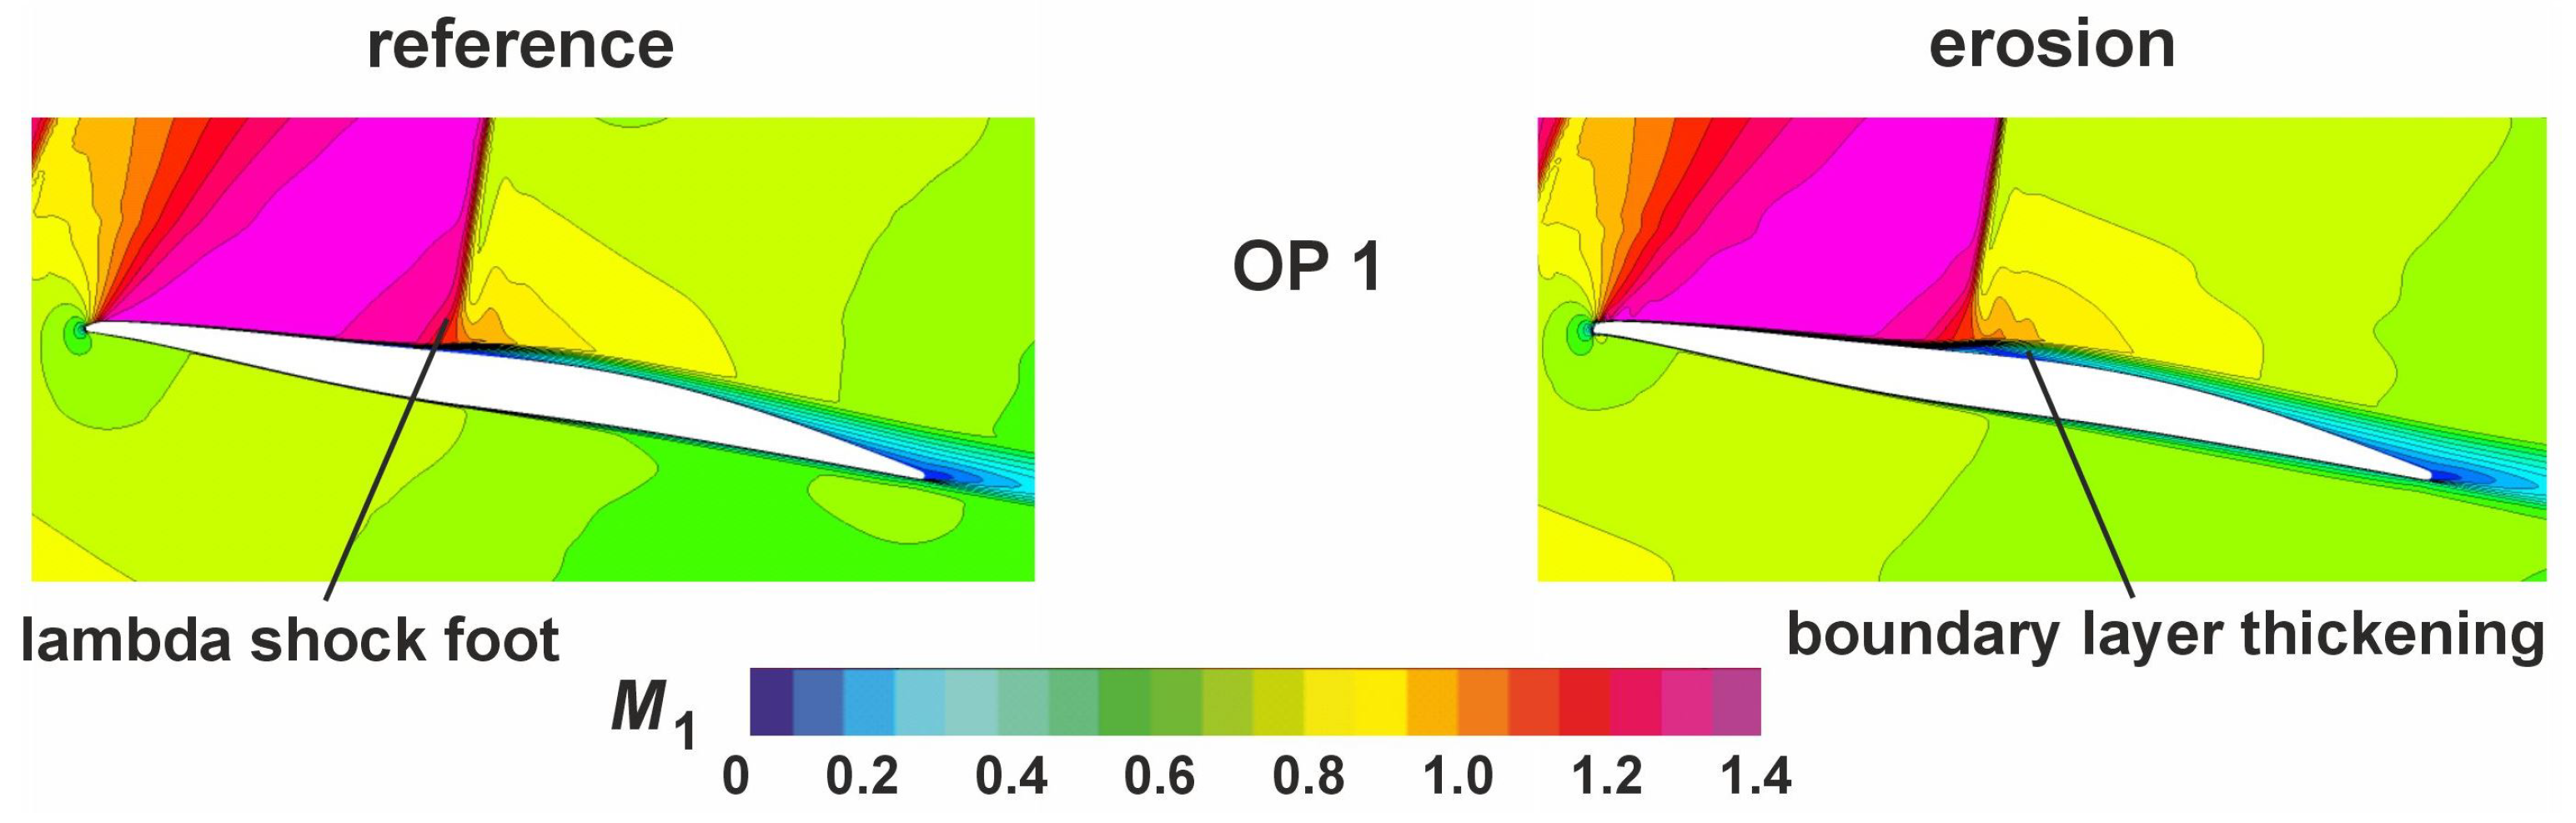
16]. Furthermore, this position of the gradient can also be used to determine the average position of the shock foot on the blade suction surface. Despite the almost abrupt reduction in the Mach number over the shock, the Mach number distribution shows that the deceleration into the subsonic range on the blade covers about 10 to 15 percent of the chord length. This behavior results from the fanning out of the shock into a lambda structure, which is caused by the thickening of the boundary layer due to the high pressure gradient, as shown in
Figure 6. Moreover, the figure shows that the boundary layer underneath the shock thickens due to the increase in static pressure over the shock. Qualitatively, it can be guessed that there is a difference between the two types of cascades, which is probably caused by the effect of the eroded leading edge on the blade boundary layer development. A first indication to clarify this assumption can be found in
Figure 5. At the point marked with a B, a significant difference in the curve of the Mach number distribution of the two cascade types can be recognized. This indicates that, at the reference cascade, the suction-side boundary layer is laminar up to the shock, and in the case with the eroded leading edge, the curve shows a turbulent interaction between shock boundary layers. Thus, the transition already takes place in front of the shock.
On this basis, it can be noted as a first result that the upstream shifting of the boundary-layer transition is a significant effect of the leading-edge erosion. But in the next step, the question arises as to how this effect can be quantified. For this purpose, we use the plot of the wall shear-stress coefficient C
on the blade surface in
Figure 7. In this figure, three main effects are depicted, which are marked with A, B, and C. First of all, it is noticeable that the value of the wall shear-stress coefficient on the suction side, beginning from the leading edge up to 30 percent of the blade chord length, is significantly lower in the reference case than in the case of the cascade with erosion (marked with A). Furthermore, also on the pressure side, the value of the wall shear-stress coefficient is much higher on the front 50 percent chord length at the erosion cascade than in the reference case (marked with a C). The higher values indicate that the boundary-layer transitions on the suction and also on the pressure side already take place in the leading-edge region and are caused by the erosion. This is further confirmed by the fact that the laminar separation bubble (marked with a B) under the shock on the suction side only appears in the reference cascade.
It should be noted that, in the case of the eroded leading edge, the curves shown in
Figure 7 represent the average results compared to the reference cascade. This results from the fact that the spanwise extent of the numerical simulation is 4.5 mm and the shape of the leading edge is anything but uniform, as already described above and depicted in
Figure 8. This figure shows the wall shear-stress coefficient distribution on the surface of the cascade blade with leading-edge erosion. Here, it becomes obvious how non-uniformly the wall shear stress is distributed over the blade height due to the realistic erosion modeling in the simulation. Not taking this effect into account could lead to a significant error in the evaluation.
Based on the higher wall shear stresses caused by the change in the boundary layer behavior, it is now to be expected that the viscous flow losses are also increased, as discussed by Hergt et al. [
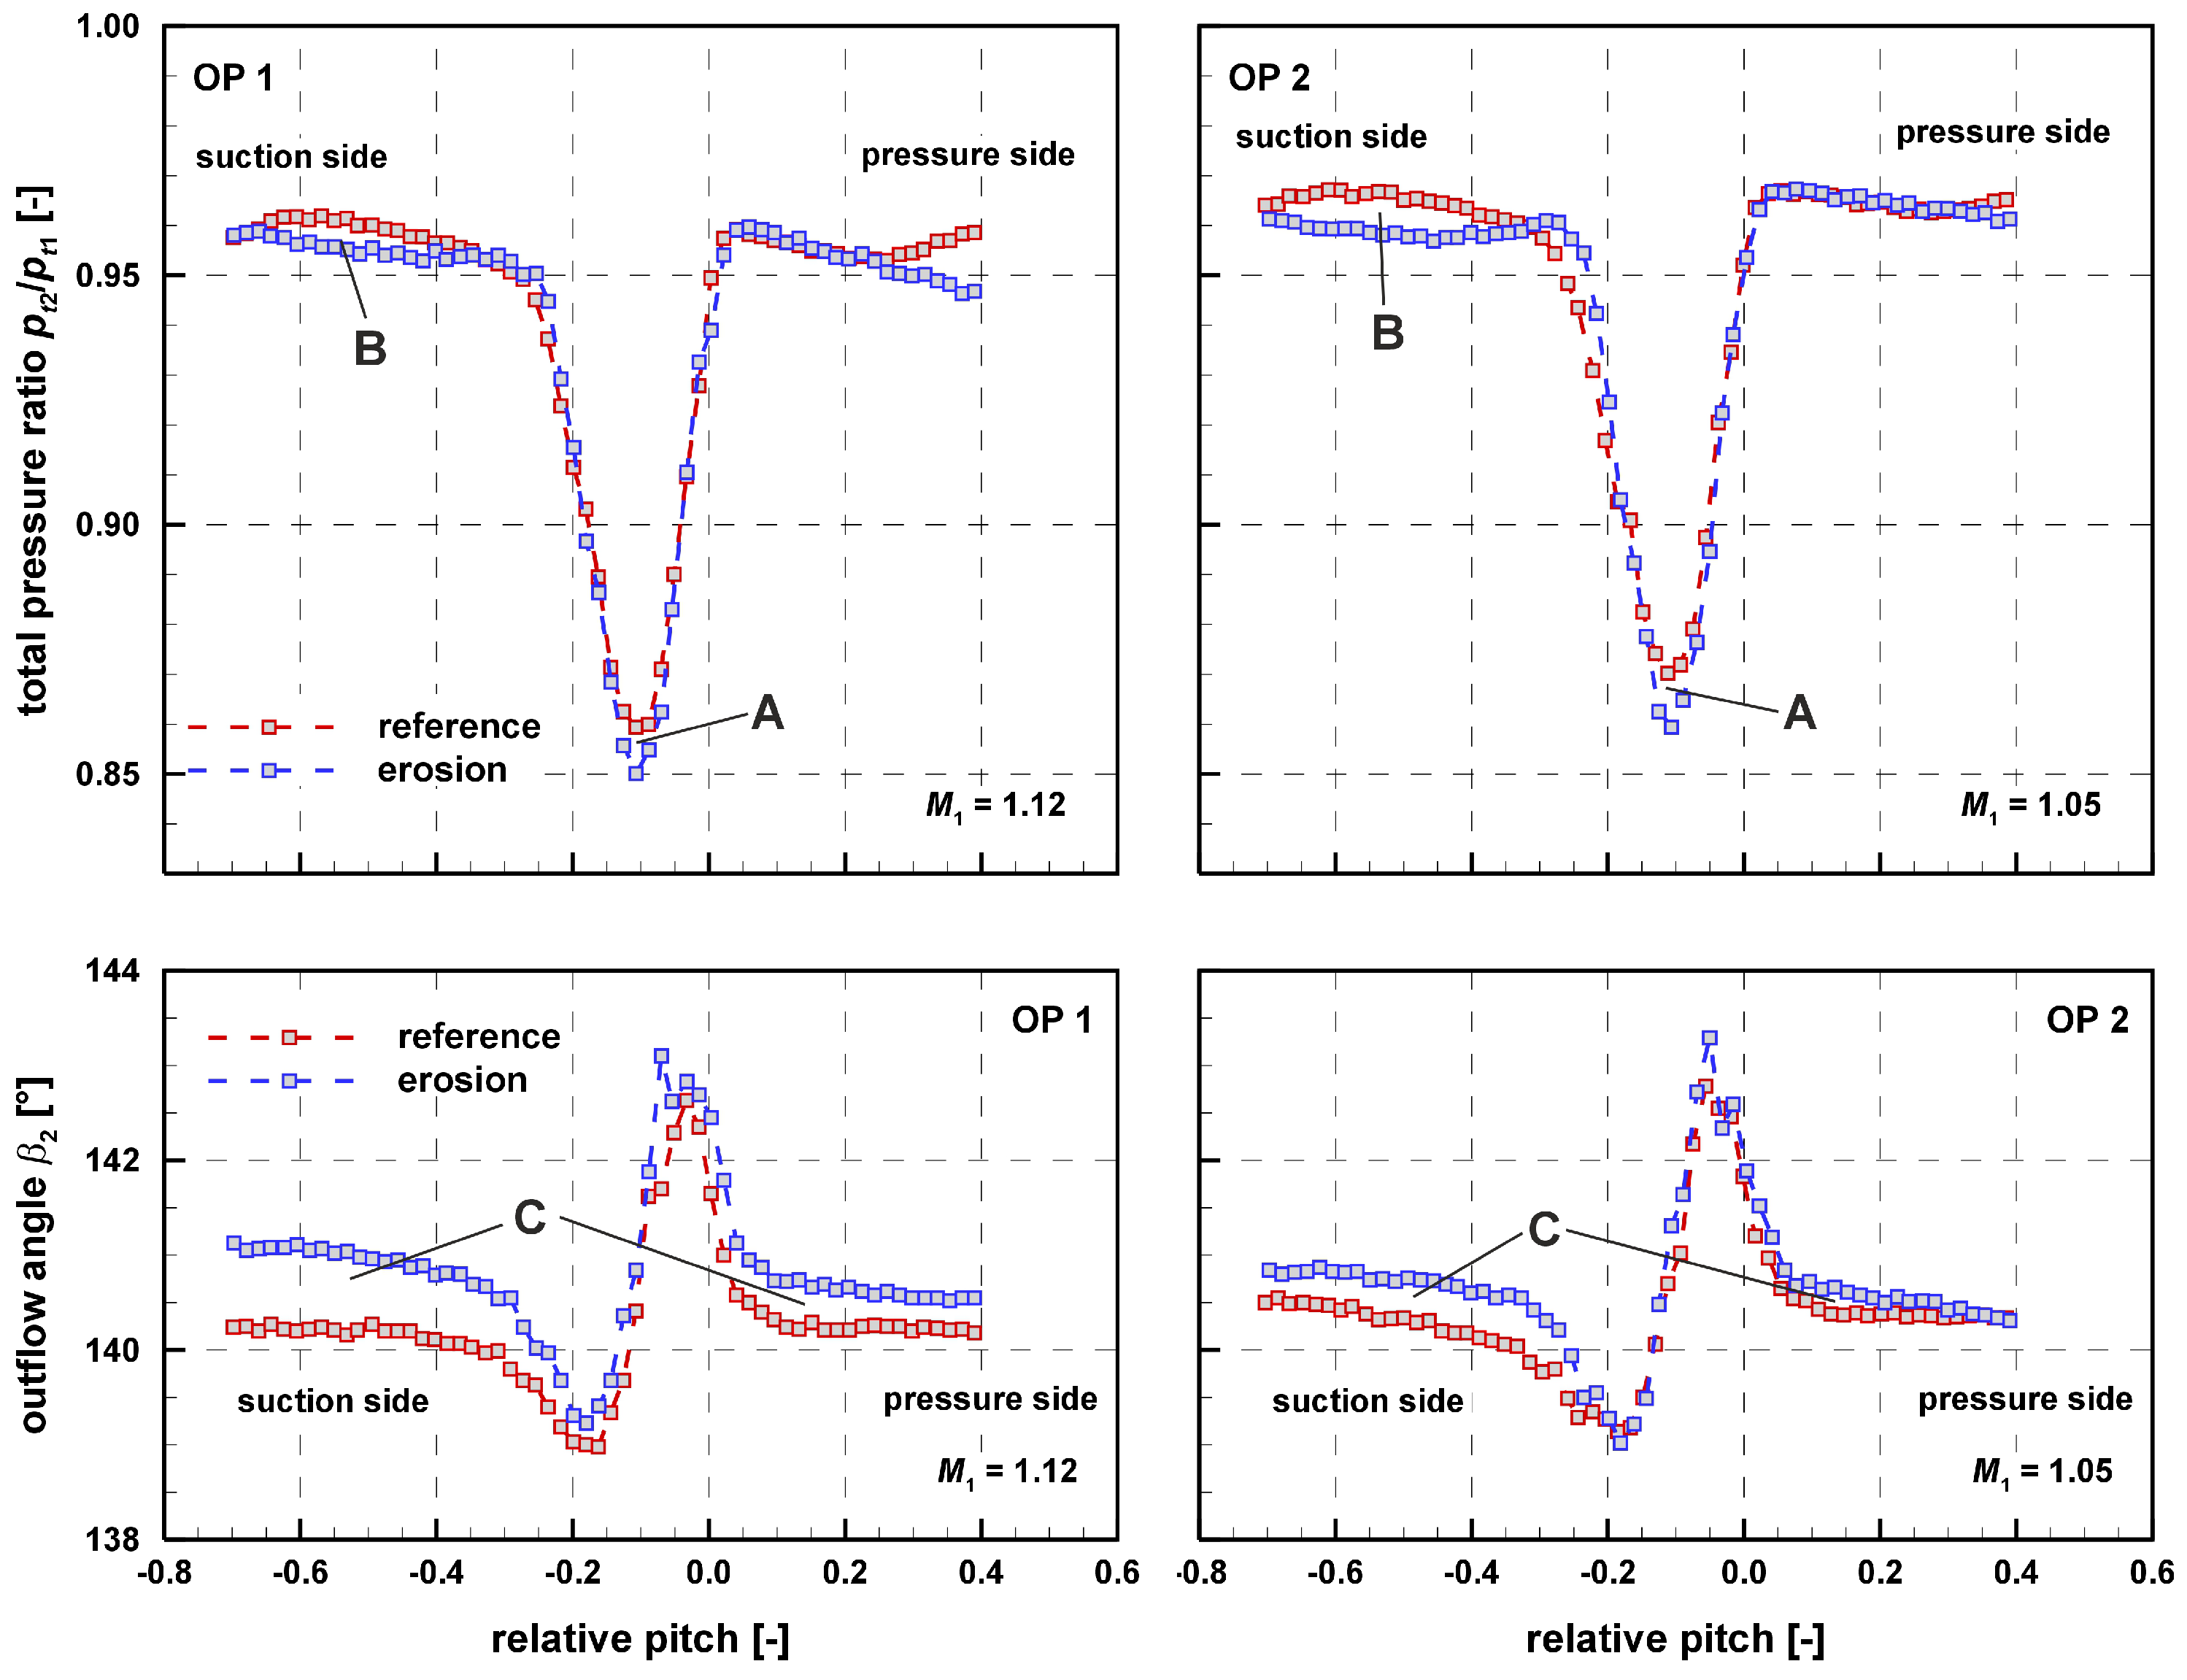
21]. In order to verify and quantify this assumption, the wakes of the total pressure ratio are shown in
Figure 9. Here, it is visible and marked with A that the wake of the erosion cascade is deeper, which represents higher viscous losses. The average loss coefficient indicates that there is a loss increase of about 4 percent at both operating points.
But this loss increase not only results from the viscous losses caused by the changed boundary layers. In
Figure 9, it is also observable that there is an increase in shock losses within the cascade passage (marked with a B). In addition, a slight shift in the outflow angle distribution is also visible at both operating points. This means a slightly reduced deflection of 0.5 deg. at OP1 and of 0.3 deg. at OP2 caused by the erosion, which also results from the change in the boundary layer conditions.
Furthermore, it is to be expected that with higher total pressure losses and a slightly reduced deflection, the static pressure ratio is also influenced. Indeed, the analysis shows that the static pressure ratio has decreased by an average of 2 percent. Thus, the second main result of the study can now be stated, which consists of a significant reduction in the cascade performance in terms of loss and static pressure rise caused by the leading-edge erosion. Besides this statement, it has to be finally clarified where the higher shock losses come from, and what is the mechanism causing this behavior. There are two main reasonsthat could be causing the higher shock losses. One is a higher pre-shock Mach number, which is not detectable in
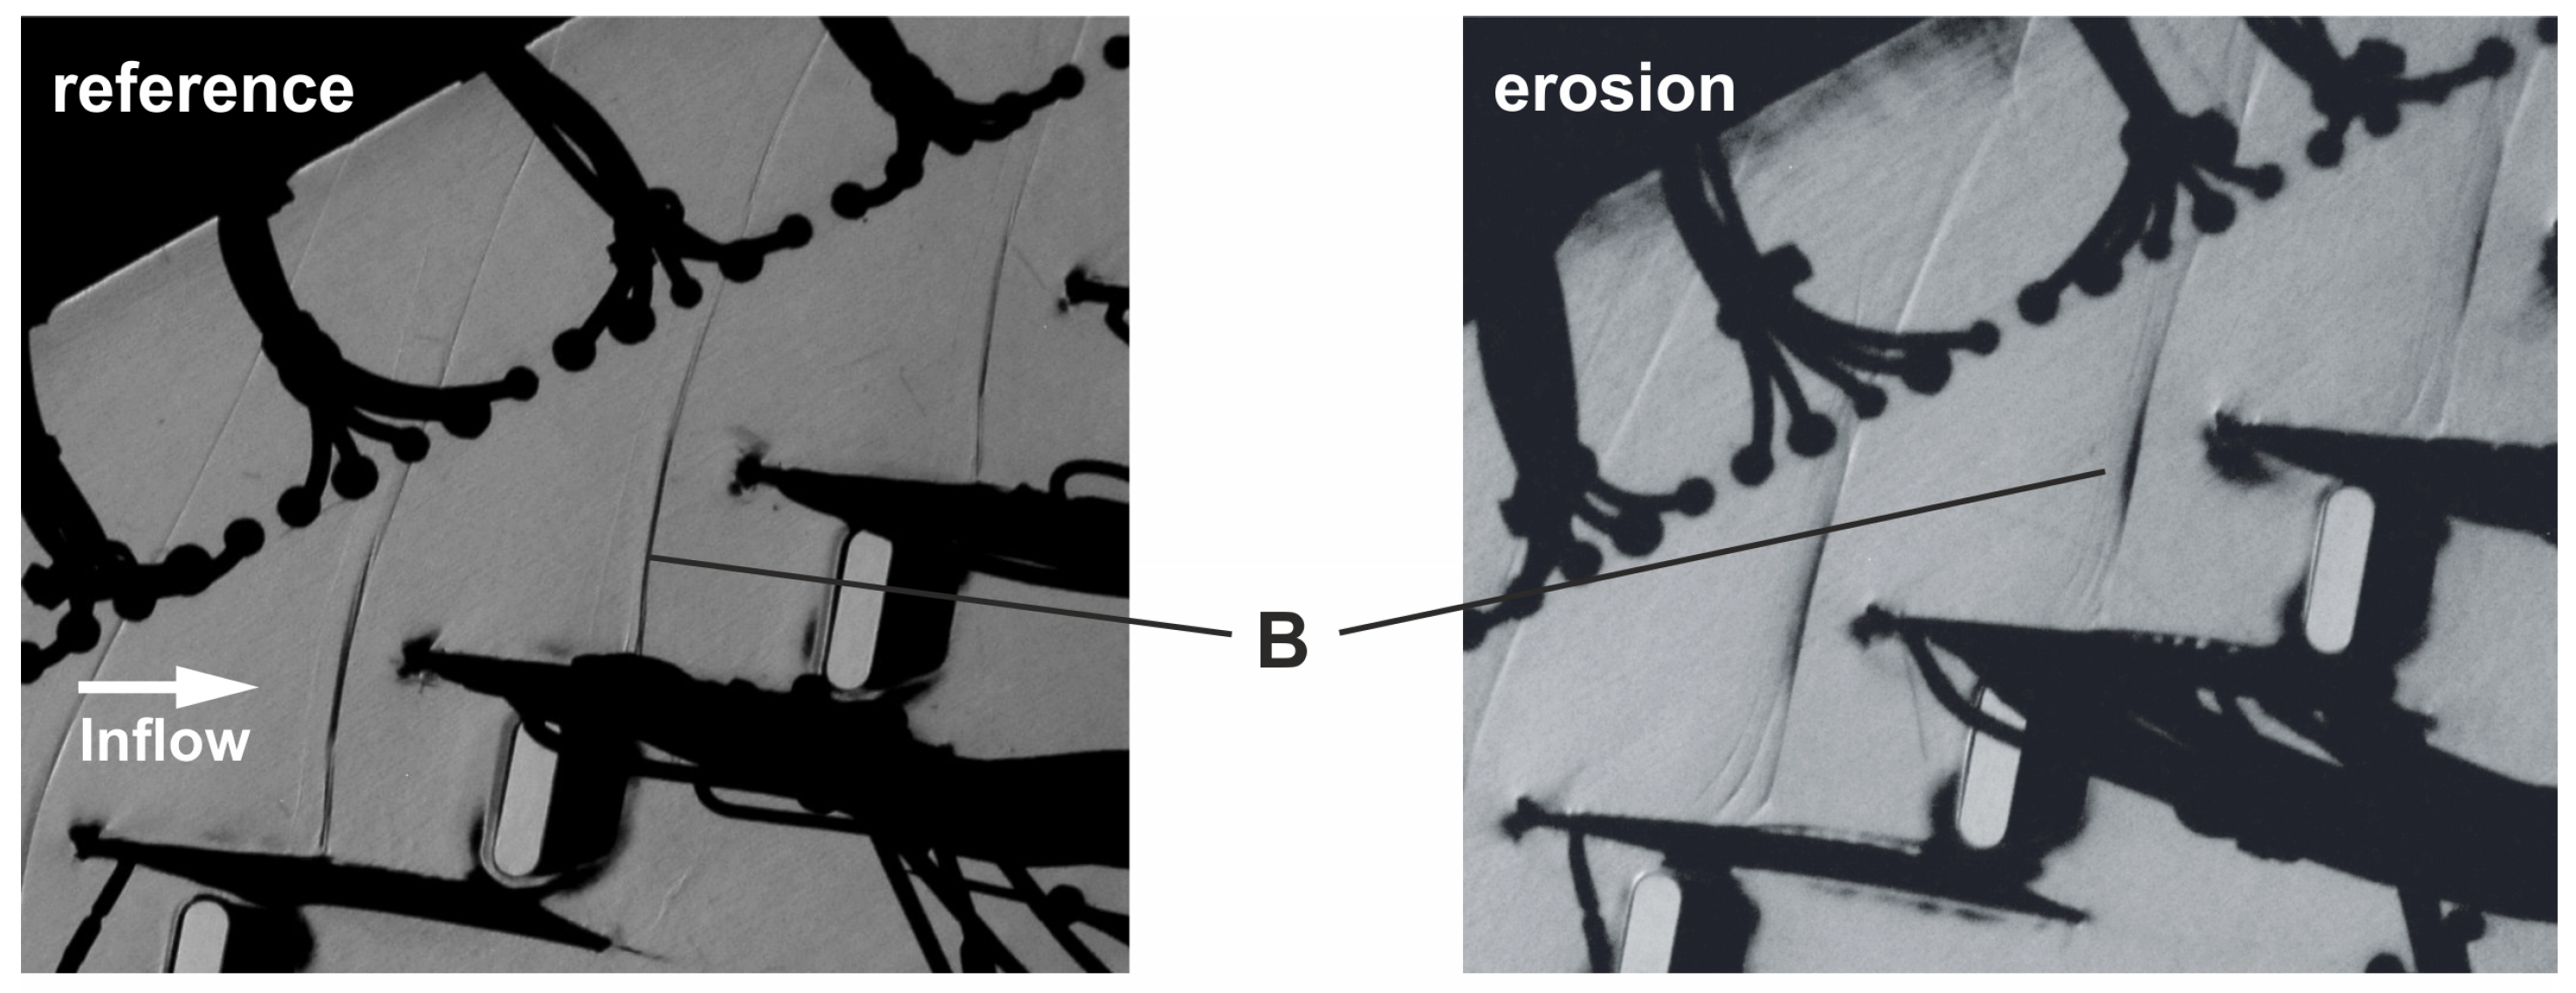
Figure 5. The second reason could be a change within the shock structure in the cascade. Therefore, the shock structure and behavior are analyzed in the case of operating point 1 in more detail.
Figure 10 shows, in the upper part, the Schlieren pictures and, in the lower part, the results of the PIV measurement in the leading edge region of both cascade types. Within this figure, it is visible that the curved shape of the bow shock is slightly straightened by erosion, as marked with a B. Furthermore, the analysis of the PIV results shows an upstream shift in the bow shock of about 10 percent, as marked with an A in the figure. This shift and the more straightened shape of the shock lead to higher shock losses in the suction side above the blade suction side, as marked with a B in
Figure 9.
6. Conclusions
An experimental and numerical investigation of the effect of an eroded leading edge on the performance of a transonic compressor cascade was performed. For the study, a real eroded leading edge from an operating engine was optically measured and applied to the experimental linear cascade, as well as in the numerical setup. The aim was to identify the main effects on the performance of the cascade and their causes.
The first result found that the boundary-layer transition is shifted upstream toward the leading edge, which means that no laminar boundary layer is formed on the blade side due to the roughness of the leading edge. On this basis, the second main result of the study is shown by the reduction in the cascade performance in terms of loss and static pressure rise caused by erosion. The losses are increased by about 4 percent, whereas the deflection is reduced by about 0.3 deg. to 0.5 deg. The operating mechanisms are described in detail as follows. The rise in losses results from an increase in viscous losses due to the changed boundary layer state and from higher shock losses due to a change in the shock structure in front of the leading edge. Furthermore, it is shown that the decrease in deflection also results from the changed boundary layer conditions. Now this knowledge can be used for future prediction of the degradation effects in engine compressor blades.
Finally, it can be stated that the sophisticated modeling of the leading-edge erosion within the CFD led to very good comparability of the numerical and experimental results, and the validation of the numerical approach was achieved.

 ,
, 


