Article

Modelling Method for Aeroelastic Low Engine Order Excitation Originating from Upstream Vanes’ Geometrical Variability

1
Structural Mechanics and Vehicle Vibrational Technology, Brandenburg University of Technology, 03046 Cottbus, Germany
2
Rolls-Royce Deutschland Ltd. & Co. KG, 15827 Blankenfelde-Mahlow, Germany
*
Author to whom correspondence should be addressed.
Int. J. Turbomach. Propuls. Power 2024, 9(2), 12; https://doi.org/10.3390/ijtpp9020012
Submission received: 13 September 2023 / Revised: 26 February 2024 / Accepted: 29 February 2024 / Published: 1 April 2024

Abstract

:
The manufacturing geometrical variability in axial compressors is a stochastic source of uncertainty, implying that the real geometry differs from the nominal design. This causes the real geometry to lose the ideal axial symmetry. Considering the aerofoils of a stator vane, the geometrical variability affects the flow traversing it. This impacts the downstream rotor, especially when considering the aeroelastic excitation forces. Optical surface scans coupled with a parametrisation method allow for acquiring the information relative to the real aerofoils geometries. The measured data are included in a multi-passage and multi-stage CFD setup to represent the mistuned flow. In particular, low excitation harmonics on the rotor vane are introduced due to the geometrical deviations of the upstream stator. The introduced low engine orders, as well as their amplitude, depend on the stator geometries and their order. A method is proposed to represent the phenomena in a reduced CFD domain, limiting the size and number of solutions required to probabilistically describe the rotor excitation forces. The resulting rotor excitation forces are reconstructed as a superposition of disturbances due to individual stator aerofoils geometries. This indicates that the problem is linear in the combination of disturbances from single passages.

1. Introduction

The increasing depth of detail required in the modelling of turbomachinery performance has caused the introduction of probabilistic approaches in different fields. Geometrical variability, in particular, has been addressed as a source of uncertainty. Although geometrical deviation from the nominal design may have different causes, the manufacturing process on its own contributes to the geometrical variability of turbomachinery components.
The impact of manufacturing geometrical variability on turbomachinery aerodynamic performance in particular was already presented in the literature. Garzon and Darmofal [1] considered the impact of aerofoils manufacturing geometrical variability on an axial compressor’s aerothermal performance. Surface scans were used to characterise the geometry from a set of measurement data. Lange et al. [2] proposed a parametrisation method to characterise aerofoils optical surface measurements to represent the variability. The method was used to characterise deviations from the nominal design and could be used to investigate the impact on the steady state aerodynamic performance [3,4]. Lange et al. [4] showed the particular importance of a multi-passage representation of the investigated compressor stage. This is required to evaluate the impact on the performance accurately, representing the geometrical differences between neighbouring passages. On the other side, for each passage included in the computations, the computational cost for the CFD solutions and the variability domain are also expanded.
Historically the study of blade vibrations has been crucial in the development of turbomachinery, being described in the past as the dominant factor having an influence on a machine’s quality and reliability [5]. Deviations from the nominal cyclic symmetry are of particular interest in the context of aeroelasticity. Within this field, we refer to these deviations in general as mistuning. The mistuning of turbomachinery components is largely studied with respect to the structural dynamics, as it potentially leads to local amplification of the vibration amplitudes [6,7,8]. To take into consideration the impact of mistuning, Whitehead [9] first proposed a conservative design limit for bladed disks. A less conservative limit was defined by Martel and Corral [10], considering the number of active modes, thus taking into account the modal coupling within blade mode families. In recent years, the possibility to identify the structural mistuning was shown, and subsequently the passage-to-passage scatter of natural frequencies, from surface measurements of real components [11,12]. Through the identification of the mistuning, it is possible to predict the structure behaviour using an aeromechanic reduced order model. An example is the Subset of Nominal system Modes (SNM) model proposed by Yang and Griffin [13,14], which represents the vibration of the mistuned system with a subset of the nominal geometry modes. Nonetheless, the geometrical mistuning of a stage affects also the flow traversing it, resulting in a mistuning of the flow interacting with the downstream stages.
The geometrical mistuning of a blade-row causes a mistuning of the flow field for the downstream row. This can be seen as the cause of non-axisymmetric flow downstream. For instance, the geometrical variability of the single aerofoils of a stage stator would cause a flow mistuning for the following stage rotor blades. The flow mistuning impacts the aeroelastic forced response, affecting the excitation harmonics amplitudes. However, the harmonics present in the flow field are, in general, unknown. These are usually identified as multiples of the shaft speed, namely Engine Orders (EO). Of particular interest are the Low Engine Orders (LEO) of excitation introduced in the system.
From an aeroelastic point of view, a large effort was exerted in representing the unsteady flow in a reduced domain. Mata et al. [15] proposed a method to represent rotor-stator interactions in a single passage setup. A method to represent a non-axisymmetric flow on a reduced number of passages was introduced by Stapelfeldt et al. [16,17]. The methodology was capable of representing a flow with a known spatial/temporal periodicity in a sparse single passage assembly, significantly reducing the computational cost. Considering the probabilistic analysis of the aeroelastic forces, Figaschewsky et al. [18] investigated the impact of the upstream nozzle guide vane (NGV) pitch angle’s variability. For the computation of the forces, a full annulus unsteady CFD setup was used, representing a unit response for a single disturbed NGV. The resulting forces, considering a fully mistuned NGV (in terms of pitch angle), could be predicted through a superposition of the individual unit responses.
In a previously published study [19], the authors investigated the impact of a stator’s geometrical variability on the excitation forces for the downstream rotor. A stochastic model for stator vanes geometrical variability was created using a set of optical surface scans. The aeroelastic forces on the downstream rotor were investigated using a single passage unsteady CFD solver. A reconstruction algorithm was proposed to predict the resulting forces over a full revolution of the shaft. In particular, the reconstruction was found to overestimate the LEOs amplitudes, but correctly identify the LEOs pattern. The limitations are considered to be due to the oversimplification of the geometry in the single passage representation. When introducing a stochastic source of uncertainty as the manufacturing geometrical variability, the investigation of the mistuned unsteady aerodynamics is not easily solved. The difficulties are associated with the large domain of the variability as well as the computational cost required to represent the axial asymmetry. This paper wants to propose a method to evaluate the impact of a stochastic source of geometrical variability on the aeroelastic excitation forces. The manufacturing geometrical variability of an axial compressor Variable Stator Vane (VSV) is considered. The objective is to evaluate how different stator geometries, arbitrarily ordered around the annulus, may affect the traversing unsteady flow field. The impact on the aeroelastic excitation forces on the downstream rotor blade integrated disk (blisk) is finally investigated.

2. Materials and Methods

In the following chapter, the method used for the representation of the mistuned aeroelastic forces is presented. The first section describes the representation of the manufacturing geometrical variability for VSVs, measured with optical surface scans. Next, the geometry of the test rig used as a case study will be described. Finally, the CFD setup will be presented, introducing the reduced domain for the computation aeroelastic forces.

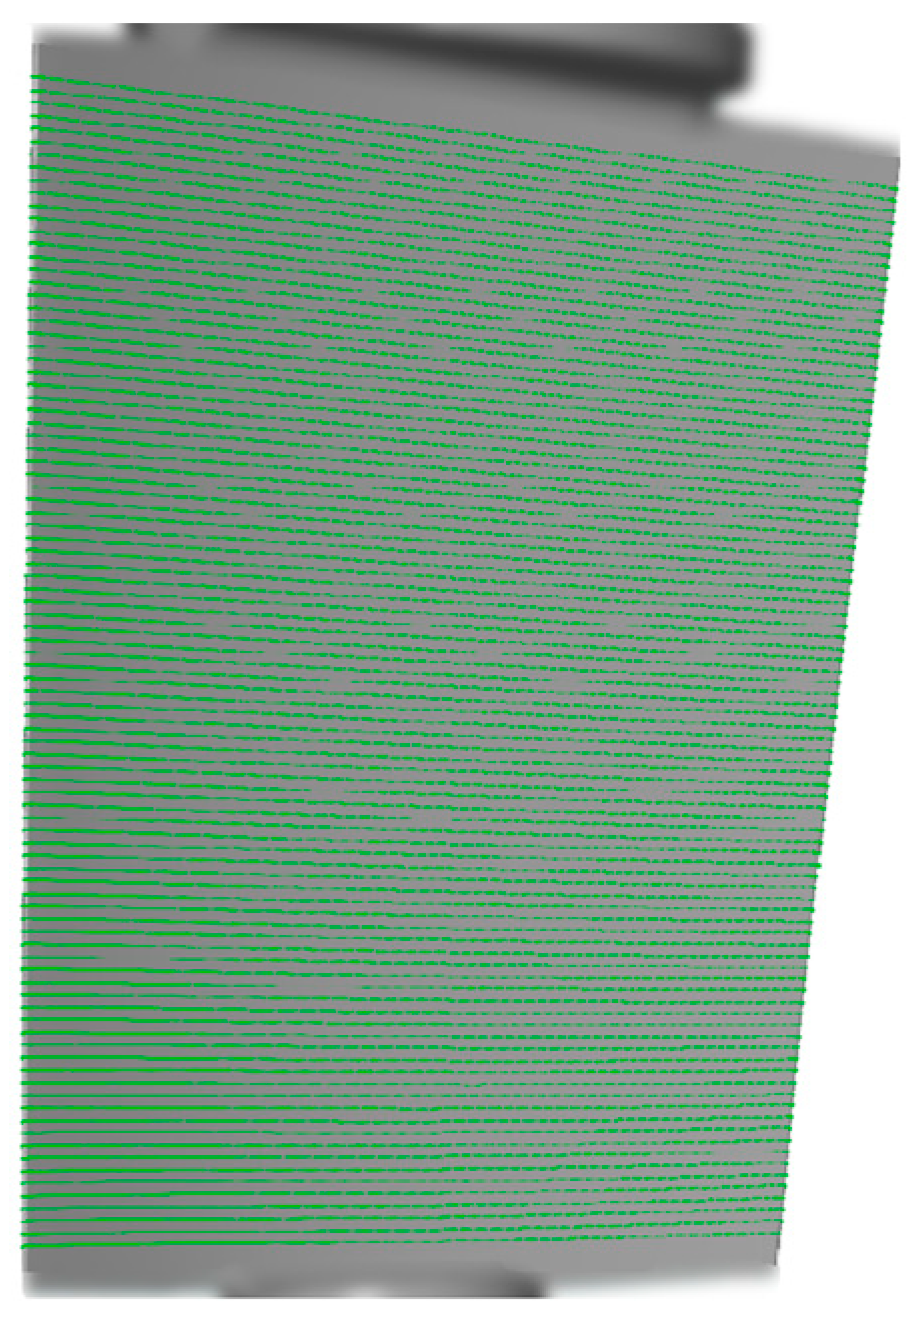
2.1. Aerofoils Geometrical Variability

The description of the geometrical variability is based on the information relative to optical surface scans. A set of 36 VSV optical scans was available to the authors to investigate the impact of the manufacturing process on the aerofoils’ geometry. The measurements are characterised using the parametrisation method proposed by Lange et al. in [2]. The aerofoils are represented as a set of radial sections, each described in a two-dimensional space with a set of numerical parameters. Figure 1 shows the radial sections distributed over a single blade geometry.
A total of 93 radial sections are used for the parametrisation, ranging from 4% to 96% of the aerofoils’ height. Fillets and gaps’ sizes are omitted from the geometrical representation. The three-dimensional surface is defined with an interpolation/extrapolation process over the modelled sections.
The parametrisation technique is applied to the surface scans as well as to the respective nominal CAD geometry. This allows the representation of the available measures as geometrical offsets from the design intent. In particular, the geometrical deviations Δ b for blade b are calculated as the difference between the parametric characterisation S ^ b of the surface scan b and the geometric parameters S ^ N of the nominal aerofoil:
Δ b = S ^ b S ^ N .
The resulting 36 geometrical deviations Δ b are considered to be deterministic in this study. No further modelling is conducted to represent the geometrical variability of the VSV. This is representative of a dataset for a group of manufactured vanes, which have to be assembled in a machine. The vanes are designed with the same geometry and manufactured individually; therefore, the assembly order may be arbitrary. However, the method can be expanded to consider a stochastic geometry, defining an appropriate geometrical model as proposed in [20].

2.2. Case Study

The geometry of the test rig Rig250 from the German Aerospace Centre (DLR) is used as a case study. The rig is a 4.5 stage axial compressor. The geometrical deviations are applied to the first stage variable stator vane (VSV1). The resulting aeroelastic excitation forces are studied for the second stage rotor blisk (R2).
The quantities of interest for this study are the aeroelastic excitation forces, with particular focus on the LEO harmonics. Considering the equation of motion for a bladed disk in the rotating frame of reference, the structure displacement vector x can be represented through the modes matrix Φ and the modal displacement vector q :
M x ¨ + G + D x ˙ + K x = f ,
x = Φ q ,
where M , G , D and K are, respectively, the mass, gyroscopic, structural damping and stiffness matrices. The forces f act as a forcing on the system.
Following the formulation of Crawley [6], the modal forces Φ T f are divided into external aerodynamic excitation forces F e and motion induced forces F d . Both terms are functions of time t , while only the latter depends on the displacement:
Φ T f = F e ( t ) + F d ( t , q ) .
The external aerodynamic excitation forces F e are investigated. These depend on the interaction with the unsteady flow field. As for the formulation in Equation (4), no blade motion is considered for their computation.
The compressor is represented at 90% of its nominal mechanical speed. This configuration is considered to be representative of resonance conditions for two R2 vibration modes. The mode shapes of interest are represented in Figure 2 as total displacement amplitudes. The modes are the first flap mode (Mode 1F) and a higher mode (Mode H). The vibration modes are computed using the commercial finite element software Abaqus, considering rotational speed and material temperature. The steady aerodynamic gas loading is neglected in this case. The mode shapes of interest are interpolated with the CFD mesh. The displacement shown in Figure 2 is representative of the resulting total displacement amplitudes on the CFD nodes.
For the fluid dynamics computations, the Rolls-Royce CFD software AU3D (version: 8.1.6), developed at Imperial College London, is used. The solver uses unsteady, compressible, Favre-averaged Navier–Stokes equations to represent the three-dimensional flow. A finite volume formulation on semi-structured grids and a second order time integration are implemented. Sayma et al. [21] describe in detail the flow model and provide two validation cases for turbomachinery.
The computations use the one equation Spalart–Allmaras turbulence model. The near walls flow field is computed utilising wall functions, with y + ~ 30 values. Fillets and varying gap sizes are included in the CFD model, with the exception of the fillets of VSV1. As the fillets of the surface scans are not included in the geometry’s characterisation, the VSV1 fillets are not included in the simulation. The single passage mesh counts approximately 2 × 10 6 cells for each blade-row, with approximately 120 radial levels.
A steady state CFD solution at the considered working point is solved considering a single passage of all the 4.5 stages. The boundary conditions are extracted from available measurement data. The instrumentation and the experimental setup of the rig are described in detail in [22]. In Figure 3a, the relative Mach number is represented at 90% height for VSV1, R2 and VSV2. The figure shows two passages for each vane, representing one of the two on the CFD mesh. The flow field in this condition is subsonic, with a relative Mach number up to 0.9. In Figure 3b, a comparison is shown between measurement data and the CFD results of the radial total pressure profiles at the inlet of the VSV1 and VSV2.
The steady state results are used as an initial solution for the unsteady computations. Boundary conditions for the latter are extracted from the steady state mixing planes.

2.3. Reduced CFD Domain

A sector representation of the different rows is proposed as a reduced model to represent the flow field. Single sectors including one or more aerofoils are represented in the CFD for each blade-row. The number of blades is limited to integer fractions of the total number of aerofoils for the blade-row. Cyclic symmetric boundary conditions are used to represent the full geometry. The full annulus flow field is reconstructed over the sliding planes connecting the different blade-rows for the unsteady computations as presented by Stapelfeldt et al. [16]. A Fourier decomposition in the frequency domain allows this, using the information relative to the individual blade-rows. A sector representation is chosen in this case over a sparse single passage assembly to capture the local deviations. The sector model will be named Multi-Passage Multi-blade Row (MPMR).
A sector model is presented in Figure 4a, where the VSV1, R2 and VSV2 are included. This Stator–Rotor–Stator (SRS) configuration is used only as validation of the method in this work. This configuration is chosen as the EO 12 would be present due to the interaction between the VSV1 wakes and the VSV2 potential field (respective blade counts: 36 and 48). The number of blades per sector is therefore chosen to be at least 1 / 12 of the circumference. In Figure 4b, the modal forcing result for the tuned nominal geometry using the MPMR are validated with a Full Annulus (FA) CFD solution. The method can therefore also be used to explore large computational domains.
In general, for the mistuned case the excitation forces depend on the geometry of the full annulus of the mistuned blade-row. This would imply that all the aerofoils in the blade-row need to be represented in the CFD solution. Considering a probabilistic study of this phenomenon, knowing that any permutation of the same vane set would also affect the result, the representation of the full geometries would make the solution unfeasible. Considering moreover the vane geometries as uncertain, the FA CFD would be even more prohibitive. Therefore, it is of interest to define a method to represent the disturbances in a reduced CFD model. This ideally would contain the lowest possible number of passages for each blade-row to reduce the computational cost. Moreover, it is of interest to represent the fewest possible mistuned geometries in each CFD computation (a single one if possible). This would reduce the variability space to explore when considering a probabilistic study. Finally, it is necessary to define a reconstruction algorithm to predict the forcing disturbances for the downstream blade-row over a full rotation of the shaft, starting from the reduced CFD data.

2.4. Mistuned Stator Configuration

The application of the geometrical deviations is based on the parametrisation method introduced in Section 2.1. The parametric offsets Δ b obtained from the optical surface scans are applied to the hot nominal geometry parametrisation S N of the Rig250 VSV1. The parametric description of the mistuned blades S b is defined as follows:
S b = S N + Δ b .
The representation of the manufactured geometries as an offset from the nominal design allows the application of the measured deviations, described in a cold setup (static, ambient pressure and temperature), to the hot aerofoil geometries in the machine. Moreover, this allows the transfer of the measured deviations on the Rig250 VSV1. Due to a lack of available data regarding the rig geometry, the measurements were conducted on a different component, with a different nominal geometry. The measurements are assumed to be representative for the rig due to the similarity of the two geometries and manufacturing methods. In addition, this assumption is preferred over a random representation of the variability.
As the parameters characterised the aerofoils on a set of radial sections, the three-dimensional geometry of these could be recreated from the S b values. Further points of the aerofoil were calculated through a quadratic interpolation over the three closest sections. For the extrapolation at the hub and shroud, an interpolation was performed over the two closest mistuned sections and the nominal geometry hub/shroud section.
The geometrical deviation of a different optical surface scan is used for each of the 36 VSV1 stator vanes in the assembly. An arbitrary ordering of the vanes is assumed to represent a single mistuned configuration of the stator vane. A comparison between the tuned nominal geometry and the mistuned geometry is shown in Figure 5a for the FA.
Two unsteady CFD simulations representing the FA of VSV1 and R2 are computed. For the time resolution of all the unsteady computations, 240 time steps are used to resolve the passage of a rotor aerofoil between two VSV1 vanes. This is found to be sufficient to capture the unsteadiness. At first, the tuned system is represented. The second simulation included the mistuned VSV1 geometry generated and the nominal R2 geometry. In both configurations, the modal excitation forces for the two mode shapes of interest show identical results for all the rotor blades (with an appropriate phase shift).
In Figure 5b, the computed forcing results are reported. The forcing is represented as normalised amplitudes of its harmonics (EO) for the tuned and mistuned FA geometries. The normalisation is conducted with respect to the maximum amplitude observed in a stator–rotor–stator configuration (maximum ”FA Tuned SRS” in Figure 4b). In the tuned case, only the harmonics relative to the VSV1 vane count (EO 36 and multiples) are present. In the mistuned case, the introduction of asymmetry causes the excitation to range over a larger spectrum of harmonics. Compared to the nominal forcing, in the mistuned case an amplification of the EO 30 and 72 amplitudes is observed. Moreover, a variety of LEOs are introduced to the system.

3. Results

The study investigates if it is possible to represent the impact of the upstream row mistuning on the aeroelastic excitation forces in this reduced domain. Of primary interest are the following topics:
  • The number of aerofoils per stage required to represent the physics;
  • The number of mistuned aerofoil geometries required in each CFD computation to represent the deviations;
  • Methods to reconstruct the forcing spectra starting from multiple MPMR solutions.
In this section, two different methods will be proposed. The first one is the extension of the work presented in [19], which used only single passages of the geometries in the CFD. The method is extended to use MPMR solutions as input, predicting the FA forcing as a mixture of these (“MPMR Forcing Mixture”). The results correctly predict the overall forcing function, but they do not capture the LEO amplitudes. The second method presented is adapted to represent unit responses in the MPMR solution, predicting the FA forcing as a superposition of these (“MPMR Forcing Superposition”). The reconstruction captures the physics of the problem from a set of MPMR solutions, representing in each a single mistuned VSV.
For simplicity, the domain is reduced to the VSV1 and R2 rows. The VSV1 geometries are limited to the 36 deviations obtained from the optical surface scans.

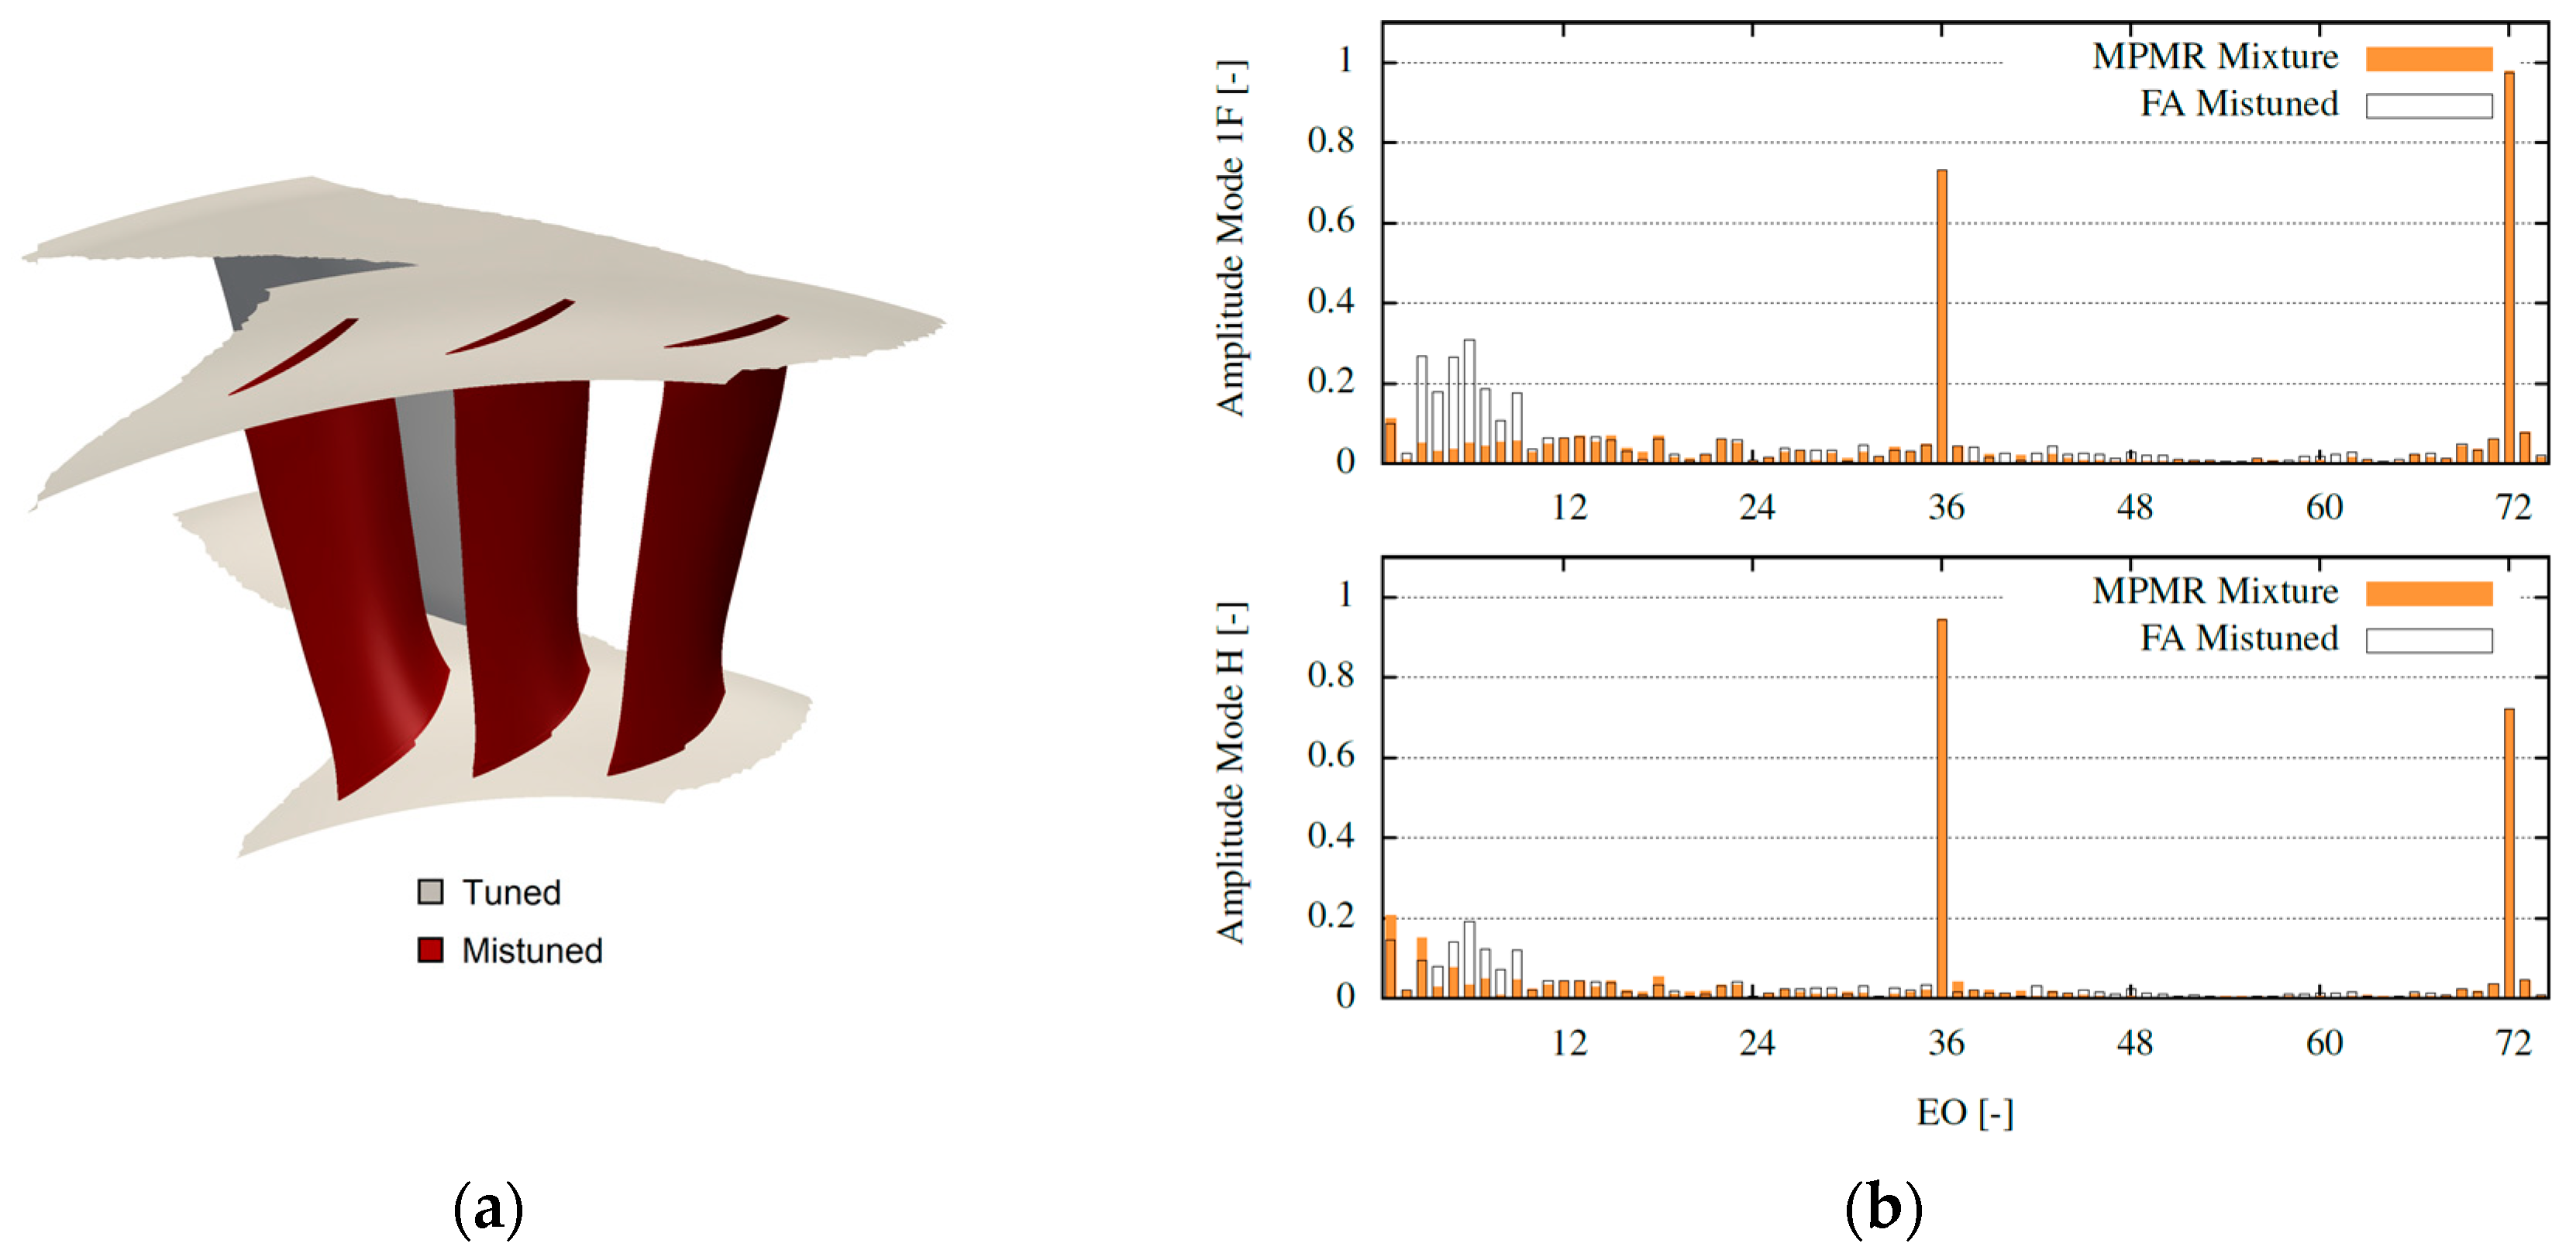
3.1. MPMR Forcing Mixture

This method aims to verify if the local flow deviations downstream of the single mistuned VSV are sufficient to represent the overall mistuned flow. The reduced CFD setup includes three passages of the stator in a single sector. A single passage of the rotor is added, as for this row, the nominal geometry is used.
All three VSV1 aerofoils in each computation include the geometrical deviations modelled. Moreover, the vanes order considered for the investigated FA setup is kept. One simulation is run for each of the 36 assembly vanes. For each run, the geometry of the vane of interest is placed in the centre of the computational domain. The directly adjacent geometries on the suction and pressure side are the respective ones in the FA assembly.
The presence of multiple mistuned vanes in each MPMR solution would be a limitation for a stochastic representation of the geometries. This implies that the geometrical variability space generated on the single-blade deviations is tripled. The inclusion of three mistuned blades per solution is chosen to assess the method’s capabilities in an example, using a small sector of the annulus, but with high fidelity in terms of geometry.
As a result of each simulation, a forcing function f b , m ( M ) ( t ) on the R2 blade is calculated. The subscripts indicate the VSV1 blade b [ 1 ;   36 ] at the centre of the sector and the R2 vibration mode m considered. The superscript ( M ) indicates that these solutions are computed using the CFD setup for the mixture method here presented. We indicate with N the number of total assembly vanes ( N = 36 for VSV1).
The FA forcing prediction f ^ m M , F A ( t ) for the mode m is computed as a mixture of MPMR solutions, using the definitions in Equations (6)–(8). Indicating with t R the time required for a revolution, t B P = t R / N represents a vane passing time interval. A phase shift is added to the MPMR solutions, such as t = 0 coincides with the wake of the central assembly vane. This is identified with the position of a minimum of EO 36 in the nominal forcing function.
To ensure the continuity of the predicted FA forcing, each f b , m M ( t ) is mixed with the results centred on the neighbouring blades. This is performed in the form of a weighted average over a selected time frame t w a = t B P / 20 .
The first blade b = 1 and the last blade b = N in the assembly are adjacent. To represent this in a short notation, we define: f b = 0 , m M = f b = N , m M and f b = N + 1 , m M = f b = 1 , m M .
f ^ b , m M ( t ) = f b , m M t + k m f b 1 , m M t + t B P f b , m M t             t [ t 0 ,   t 1 [ f b , m M t                                                                         t [ t 1 ,   t 2 [ f b , m M t + k p f b + 1 , m M t t B P f b , m M t               t [ t 2 ,   t 3 [
k m = 1 2 t t 1 t 0 t 1 ,                   k p = 1 2 t t 2 t 3 t 2
t 0 = t B P 2 ,       t 1 = t w a t B P 2 ,       t 2 = t B P 2 t w a ,       t 3 = t B P 2 .
The reconstruction of the modal forcing f ^ m M , F A ( t ) over one revolution is obtained as a concatenation of the weighted averages f ^ b , m M ( t ) for the single sectors. The periodic function over the full annulus is defined for a single period of length t R as follows:
f ^ m M , F A t = f ^ b = 1 , m M t                                     t t B P 2 , t B P 2                 f ^ b = 2 , m M t t B P                           t t B P 2 , 3 2 t B P                   f ^ b = N , m M t ( N 1 ) t B P             t t R 3 2 t B P ,   t R t B P 2 .
Figure 6 represents the forcing mixture for the modal forcing at the wake of a generic blade b. The FA forcing reconstruction f ^ m M , F A ( t ) is based on the computed value of the forcing function f b , m ( M ) ( t ) for the blade b in the respective vane passing time interval. The local results for each blade b are mixed with the local results f b 1 , m ( M ) ( t ) and f b + 1 , m ( M ) ( t ) for the neighbouring blades in the time intervals b 3 2 t B P ,   b 3 2 t B P + t w a and b 1 2 t B P t w a ,   b 1 2 t B P , respectively.
The FA modal forcing predicted from the mixture of MPMR solutions can be analysed by studying its spectrum. In Figure 7a, the represented CFD domain is shown. The resulting forcing prediction is computed for the mistuned configuration presented in Figure 5a. The computed FA CFD solution is compared with the prediction using the MPMR mixtures. The normalised spectra for the two solution methods are presented in Figure 7b for the two investigated vibration modes.
The results show a good overall prediction of the excitation harmonics, but the LEOs are not captured. The harmonic relative to the vane count of the upstream stator (EO 36) and its upper harmonics are correctly predicted. These are also amplified by the mistuning (see Figure 5b) and the mixture can correctly represent the amplification. On the other side, the introduced lower harmonics are not represented by the method. It can therefore be concluded that the mixture correctly represents the local deviations, but these are insufficient to represent the lower excitation harmonics.

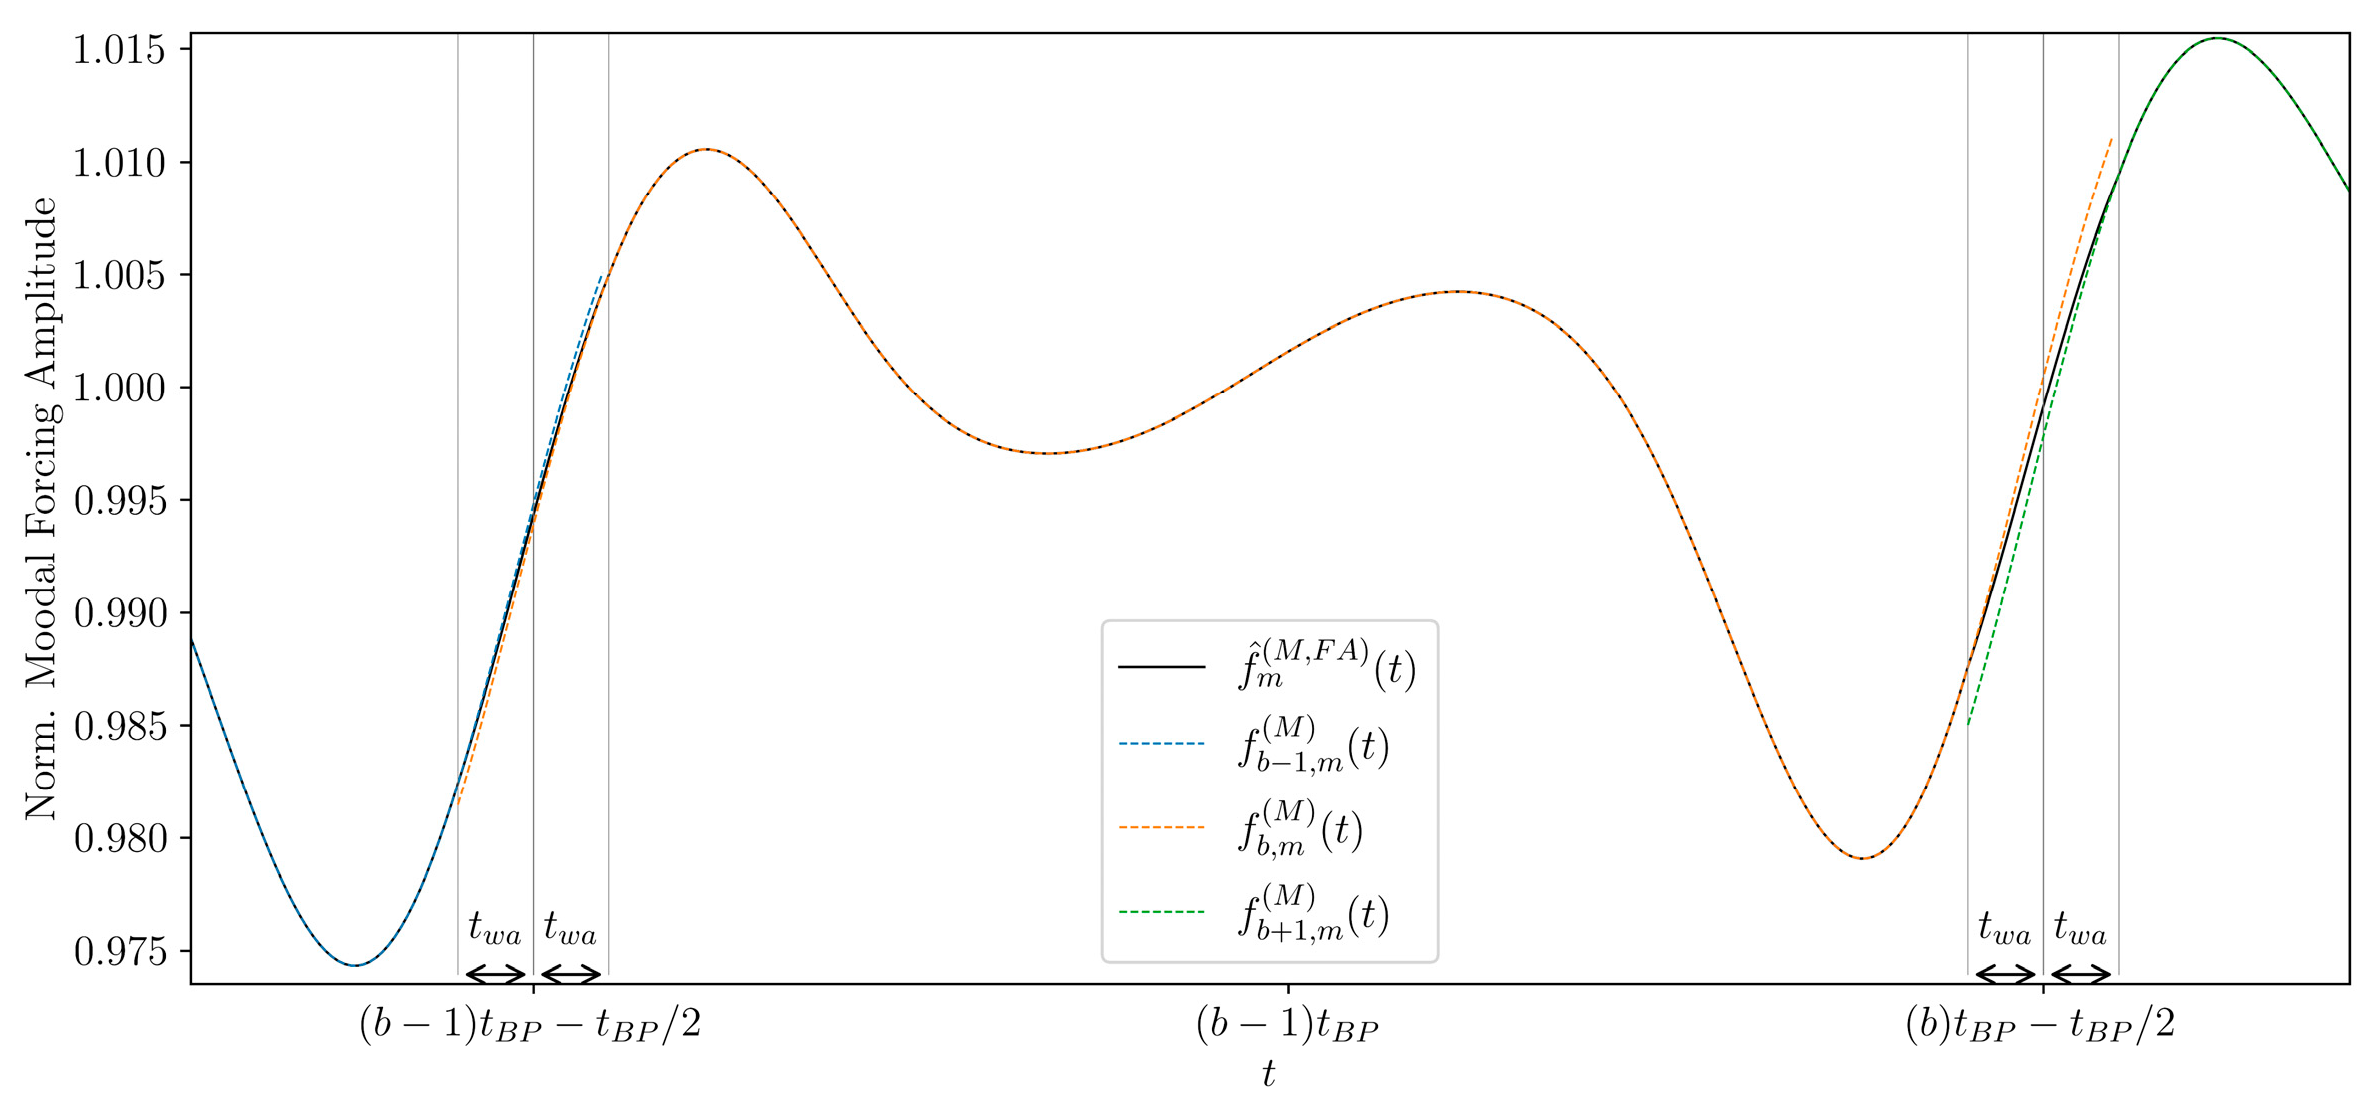
3.2. MPMR Forcing Superposition

The second proposed method aims to capture the LEO introduced by the mistuning, representing a larger domain in the CFD. The reduced CFD setup includes multiple passages of the stator in a single sector and a single passage of the rotor.
In this case, a single stator vane in the sector included the geometrical deviations. Further aerofoils are described with the nominal geometry of the vane. This allows for individual representation of the disturbances due to the single mistuned geometry, namely the unit responses. Moreover, variability space is reduced to the geometrical deviations of a single aerofoil per simulation. As presented by Figaschewsky et al. [18], for differences in pitch angle, unit responses computed in a FA setup could be superimposed to represent the total mistuned system. It is of interest here to consider the complex three-dimensional deviations of the geometry. Moreover, in order to reduce the computational time, the method is redefined to use the sector CFD setup.
As a result of each simulation, a forcing function f b , m S ( t ) on the R2 blade is calculated. The subscripts indicate the VSV1 single blade b [ 1 ,   36 ] with applied geometrical variability in the sector and the R2 vibration mode m considered. The superscript ( S ) indicates that these solutions are computed using the CFD setup for the superposition method here presented.
The FA forcing prediction f ^ m S , F A ( t ) is computed as a superposition of the MPMR unit responses, using the definitions in Equations (10)–(13). We indicate with N the number of total assembly vanes ( N = 36 for VSV1). As previously, t R represents the time required for a revolution, and t B P = t R / N represents a vane passing time interval. For the MPMR solutions, the wake of the assembly mistuned vane is identified with a minimum of EO 36 in the nominal forcing function. This is used to define the time step t = 0 .
In the MPMR stator vanes sector, M airfoils are included. This imposes an artificial periodicity to the sector geometry. In particular, the solution is representative of N / M blades over the full annulus with the same applied Δ p geometrical disturbances, evenly spaced over the circumference. Therefore, a period t S = M   t R / N is imposed to the MPMR solutions.
A mean force f ¯ m S ( t ) is defined from the MPMR solutions. As the f b , m S ( t ) are discrete and periodic, a discrete Fourier transform (DFT) can be applied. The mean force is computed by averaging, out of all of the N MPMR solutions, only the harmonics which are multiples of M are used, as these represent the vane passing frequency. The f ¯ m S ( t ) is computed with the inverse transform to the time domain. This allows to define a forcing disturbance function n b , m S ( t ) for all the MPMR solutions. A filter F is applied to the disturbances, considering a fixed filter window t f w = t B P :
n b , m S t = f b , m S t f ¯ m S ( t ) × F ,
F = 1             t [ 0 , t S 2 t f w [   t S 2 t 2 t w f         t [ t S 2 t f w , t S 2 [     2 t t S 2 t w f         t [ t S 2 , t S 2 + t w f [     1             t [ t s 2 + t f w , t S [   .
The mean force f ¯ m S ( t ) can be considered periodic. The disturbance n b , m S t for the individual vanes has to be limited in the respective sector. The periodicity of the disturbances, having period length equal t S , is artificially introduced by the cyclic symmetric boundary. Therefore, only one period per vane has to be used for the superposition. In doing this, the filter F ensures continuity to the individual noise terms. The local disturbances n b , m S t have to be expanded to a respective FA disturbance, taking into consideration the respective blade b position.
We define the FA disturbance n ^ b , m S ( t ) for each blade b over one shaft revolution as follows. The n b , m S ( t ) values are considered over one period t S . The disturbance introduced by each vane is considered null outside the period t S for the rest of the revolution. An appropriate phase shift is added to account for the blade b position in the assembly. The FA disturbances are periodic and described over one t R period:
n ^ b , m S t = 0                               t [ t S 2 + δ t b , t R t S 2 + δ t b [ n b , m S t δ t b           t [ t S 2 + δ t b , t S 2 + δ t b [       ,
δ t b = b 1 t B P .
The FA disturbances computed for a set of blades are represented in Figure 8. The disturbances n b , m S ( t ) affect a time window t S (dependent on M ). The FA disturbances n ^ b , m S ( t ) have the value of n b , m S ( t ) around the wake of the blade b and have the value of 0 elsewhere. The position of the wake for each blade depends on the respective mistuned blade position in the investigated assembly. Each FA disturbance therefore represents the local modal forcing perturbation due to the mistuning of a single stator.
The FA forcing prediction f ^ m S , F A ( t ) is formulated as follows, superimposing the MPMR unit responses. It is defined as a superposition of the average extracted forcing f ¯ m S ( t ) and the individual n ^ b , m S ( t ) disturbances for all the vanes:
f ^ m S , F A t = f ¯ m S t + b = 1 N n ^ b , m S ( t ) .
The FA modal forcing predicted from the MPMR superposition can be analysed in terms of its spectrum. A first investigation considers a number M = 6 of MPMR sectors. In Figure 9a, the represented CFD domain is shown. The resulting forcing prediction is computed for the mistuned configuration presented in Figure 5a. The computed FA CFD solution is compared with the prediction. The normalised spectra of the two solutions are presented in Figure 9b for the two investigated vibration modes. In Figure 10, the excitation forces F e are plotted for the two models in the time domain.
The results show that the method can capture the full spectra of the excitation forces for the two vibration modes. The amplification of the vane passing frequency (EO 36) and its higher harmonics are captured as well as the introduced LEO. It is possible though to see a certain prediction inaccuracy with regard to some of these harmonics amplitudes. To verify that the model is representative of the aerodynamic mistuning, in Figure 10 the computed and modelled excitation forces F e can be compared in the time domain. The forces are normalised such as the nominal excitation would oscillate between 1 and −1. It is possible here to compare the results computed with the FA CFD and the MPMR superposition. A period of length t R is represented, coinciding with one full shaft revolution. The prediction is shown here to be capable of capturing the physics of the problem correctly.
The loss in accuracy is judged to be caused by an insufficient number of vanes included in the VSV1 sector. The sector in the example represents 1 / 6 of the full annulus. Hence, the cyclic symmetry imposed to reduce the CFD domain may be the cause of the inaccuracy. The only set parameter of the method is the filter window t f w , which does not influence significantly the final result. In addition, small changes in the identification of the geometrically mistuned vane wake seem not to affect the result significantly.
To investigate the influence of the stator sector size on the superposition result, the study was repeated with a larger number M of stator blades. A total of M = 12 blades are included in the new setup, equivalent to 1 / 3 of the FA for this specific geometry. The resulting MPMR domain for the calculation of the unit responses is shown in Figure 11a. In Figure 11b, the resulting rotor forcing superposition for the investigated mistuning pattern is compared with the FA CFD. The results show an increased accuracy in the prediction of the LEO, compared to the M = 6 case in Figure 9b. However, a larger error is observed in the prediction of the EO 36 and 72. This is attributed to the inclusion in the MPMR of several stator blades with the nominal geometry. These EOs were shown to be affected by the mistuning (see Figure 5b). To address this issue in future studies, a mean geometry of the measured aerofoils can be defined to replace the nominal aerofoils in the MPMR unit responses computation. This can give a better representation of the mean flow and therefore a higher accuracy of the reconstruction. This is supported by the high accuracy in the prediction of those harmonics in the “MPMR Forcing Mixture” method.
The results indicate that the problem can be considered linear, even when considering a set of real mistuned stator geometries assembled in an arbitrary order. The disturbances introduced by the individual real stator aerofoils on the flow with respect to the nominal tuned system can be linearly superimposed to represent the assembly. This reduces the problem of modelling this type of flow mistuning to the modelling of the disturbances caused by individual stators. The variability space can therefore be limited to the characterisation of the single aerofoil. Moreover, the CFD domain can be reduced to a sector representation of the stages.
To investigate a different ordering of the stator vanes with this method, it would be sufficient to change the different vanes relative phase. Therefore, having a set of N MPMR solutions available, any permutation of those vanes in a FA setup can be solved algebraically.

4. Discussion

A method to calculate the aeroelastic excitation forces on an axial compressor rotor in the presence of an upstream geometrically mistuned stator is presented. The problem requires the description of the flow over the full annulus of the machine. The individual stator geometries and their relative position cause the non-axisymmetric flow affecting the rotor aeroelastics. This alters the amplitudes of the excitation harmonics, introducing a particular set of low engine orders, which are not present in a tuned geometry.
This paper proposes two modelling methods to describe the phenomenon. The forces are computed in a reduced CFD model, limited to a sector domain. Optical surface scans are used to represent the manufacturing geometrical variability of axial compressor stator vanes. Real engine geometries, acquired from measurement data, can therefore be included in the study.
A first proposed approach (“Forcing Mixture”) shows how local flow information is insufficient to represent the full spectrum of the forces. The amplifications of the harmonics connected with the stator vane count (here EO 36 and multiples) are accurately captured, but the introduced lower harmonics are not predicted correctly.
The second proposed modelling method (“Forcing Superposition”) considers a single sector of the stator and a single passage of the downstream rotor. The stator sector includes a single aerofoil with applied geometrical deviations. The rotor forcing over a shaft revolution for a fully mistuned stator can be predicted superimposing the disturbances originating from the single real stator geometries, namely the unit responses. This indicates that the problem can be considered linear in the combination of disturbances from single passages. This method opens up the possibility for a probabilistic study:
  • The geometrical variability space can be limited to the characterisation of the single aerofoil;
  • The CFD domain can be limited to a sector of the geometry of interest, including a single mistuned aerofoil per solution;
  • Rotor modal excitation force disturbances can be linearly superimposed to represent the system;
  • The full forcing spectrum is reconstructed from the single unit responses, for any arbitrary ordering of the mistuned vanes.
For the considered compressor stage, 1 / 3 of the full annulus allowed for computation of the unit responses and accurate prediction of the introduced LEO. For future investigations, it is recommended to define a mean mistuned geometry from the measured data. This can be used to represent the sectors with fixed geometry in the calculation of the unit responses to better describe the mean flow.
The disturbances computed for this study show patterns unique to each vane. No common trend could be observed. Nevertheless, we cannot exclude, on a larger dataset, the possibility of interpolation between different geometries. Moreover, the creation of a stochastic model for the geometrical variability [20] would allow for a probabilistic description of the problem.

Author Contributions

Conceptualization, B.B. and S.S.; methodology, M.G.; software, M.G.; validation, M.G.; formal analysis, M.G.; investigation, M.G.; resources, B.B.; data curation, S.S.; writing—original draft preparation, M.G.; writing—review and editing, M.G., B.B. and S.S.; visualization, M.G.; supervision, S.S.; project administration, B.B.; funding acquisition, B.B. All authors have read and agreed to the published version of the manuscript.

Funding

This publication is based on the work within the research project FlexVerdi (FKZ: 0324309E), which is funded by the German Federal Ministry for Economic Affairs and Climate Action.

Institutional Review Board Statement

Not applicable.

Informed Consent Statement

Not applicable.

Data Availability Statement

The datasets presented in this article are not readily available due to technical limitations and accessibility of the geometries. Requests to access the datasets should be directed to the corresponding author.

Acknowledgments

The authors gratefully acknowledge Rolls-Royce Deutschland for the collaboration in this project, the German Aerospace Centre (DLR) for the support and the data related to the Rig250 and the Technical University of Dresden (TUD-ISM) for the parametrisation tool.

Conflicts of Interest

Author Sven Schrape was employed by the company Rolls-Royce. The remaining authors declare that the research was conducted in the absence of any commercial or financial relationships that could be construed as a potential conflict of interest.

References

  1. Garzon, V.E.; Darmofal, D.L. Impact of geometric variability on axial compressor performance. J. Turbomach. 2003, 125, 692–703. [Google Scholar] [CrossRef]
  2. Lange, A.; Vogeler, K.; Gümmer, V.; Schrapp, H.; Clemen, C. Introduction of a Parameter Based Compressor Blade Model for Considering Measured Geometry Uncertainties in Numerical Simulation. In Proceedings of the ASME Turbo Expo, Orlando, FL, USA, 8–12 June 2009; GT2009-59937. pp. 1113–1123. [Google Scholar]
  3. Lange, A.; Voigt, M.; Vogeler, K.; Schrapp, H.; Johann, E.; Gümmer, V. Impact of manufacturing variability on multistage high-pressure compressor performance. ASME J. Eng. Gas Turbines Power 2012, 134, 112601. [Google Scholar] [CrossRef]
  4. Lange, A.; Voigt, M.; Vogeler, K.; Schrapp, H.; Johann, E.; Gümmer, V. Impact of Manufacturing Variability and Nonaxisymmetry on High-Pressure Compressor Stage Performance. ASME J. Eng. Gas Turbines Power 2012, 134, 032504. [Google Scholar] [CrossRef]
  5. Srinivasan, A.V. Flutter and Resonant Vibration Characteristics of Engine Blades: An IGTI Scholar Paper. In Proceedings of the ASME International Gas Turbine and Aeroengine Congress and Exhibition, Orlando, FL, USA, 2–5 June 1997. V004T17A001. [Google Scholar] [CrossRef]
  6. Crawley, E.F. Aeroelastic Formulation for Tuned and Mistuned Rotors. In AGARD Manual on Aeroelasticity in Axial-Flow Turbomachines; AGARD: Neuilly sur Seine, France, 1988; Volume 2, pp. 1–24. [Google Scholar]
  7. Castanier, M.P.; Pierre, C. Modeling and analysis of mistuned bladed disk vibration: Current status and emerging directions. J. Propuls. Power 2006, 22, 384–396. [Google Scholar] [CrossRef]
  8. Slater, J.; Minkiewicz, G.; Blair, A. Forced response of bladed disk assemblies—A survey. In Proceedings of the 34th AIAA/ASME/SAE/ASEE Joint Propulsion Conference and Exhibit, Cleveland, OH, USA, 13–15 July 1999; p. 3743. [Google Scholar]
  9. Whitehead, D.S. Effect of Mistuning on the Vibration of Turbo-Machine Blades Induced by Wakes. J. Mech. Eng. Sci. 1966, 8, 15–21. [Google Scholar] [CrossRef]
  10. Martel, C.; Corral, R. Asymptotic Description of Maximum Mistuning Amplification of Bladed Disk Forced Response. ASME J. Eng. Gas Turbines Power 2009, 131, 022506. [Google Scholar] [CrossRef]
  11. Beirow, B.; Figaschewsky, F.; Kühhorn, A.; Bornhorn, A. Modal Analyses of an Axial Turbine Blisk with Intentional Mistuning. ASME J. Eng. Gas Turbines Power 2018, 140, 012503. [Google Scholar] [CrossRef]
  12. Maywald, T.; Backhaus, T.; Schrape, S.; Kühhorn, A. Geometric Model Update of Blisks and its Experimental Validation for a Wide Frequency Range. In Proceedings of the ASME Turbo Expo, Charlotte, NC, USA, 26–30 June 2017. V07AT30A001. [Google Scholar]
  13. Yang, M.; Griffin, J.H. A Normalized Modal Eigenvalue Approach for Resolving Modal Interaction. ASME J. Eng. Gas Turbines Power 1997, 119, 647–650. [Google Scholar] [CrossRef]
  14. Yang, M.; Griffin, J.H. A Reduced-Order Model of Mistuning Using a Subset of Nominal System Modes. ASME J. Eng. Gas Turbines Power 2001, 123, 893–900. [Google Scholar] [CrossRef]
  15. Mata, S.; Di Mare, L.; Mehmet, I.; Green, J. Generalised Single-Passage Multi-Bladerow Method for Turbomachinery Forced Response. In Proceedings of the ASME Turbo Expo, Orlando, FL, USA, 8–12 June 2009; pp. 1685–1692. [Google Scholar]
  16. Stapelfeldt, S.C.; Di Mare, L. A method for modelling flow past non-axisymmetric configurations on reduced passage counts. In Proceedings of the 13th International Symposium on Unsteady Aerodynamics, Aeroacoustics and Aeroelasticity of Turbomachines, Tokyo, Japan, 11–14 September 2012. [Google Scholar]
  17. Stapelfeldt, S.C. Advanced Methods for Multi-Row Forced Response and Flutter Computations. Ph.D. Thesis, Imperial College London, London, UK, 2013. [Google Scholar]
  18. Figaschewsky, F.; Giersch, T.; Kühhorn, A. Forced Response Prediction of an Axial Turbine Rotor with Regard to Aerodynamically Mistuned Excitation. In Proceedings of the ASME Turbo Expo, Düsseldorf, Germany, 16–20 June 2014. V07BT35A013. [Google Scholar]
  19. Gambitta, M.; Kühhorn, A.; Beirow, B.; Schrape, S. Stator Blades Manufacturing Geometrical Variability in Axial Compressors and Impact on the Aeroelastic Excitation Forces. J. Turbomach. 2022, 144, 041007. [Google Scholar] [CrossRef]
  20. Gambitta, M.; Beirow, B.; Schrape, S. A Digital Twin of Compressor Blisk Manufacturing Geometrical Variability for the Aeroelastic Uncertainty Quantification of the Aerodynamic Damping. In Proceedings of the ASME Turbo Expo, Rotterdam, The Netherlands, 13–17 June 2022. V08AT21A021. [Google Scholar]
  21. Sayma, A.I.; Vahdati, M.; Sbardella, L.; Imregun, M. Modeling of three-dimensional viscous compressible turbomachinery flows using unstructured hybrid grids. AIAA J. 2000, 38, 945–954. [Google Scholar] [CrossRef]
  22. Schönweitz, D.; Voges, M.; Goinis, G.; Enders, G.; Johann, E. Experimental and Numerical Examinations of a Transonic Compressor-Stage With Casing Treatment. In Proceedings of the ASME Turbo Expo, San Antonio, TX, USA, 3–7 June 2013. [Google Scholar] [CrossRef]
Figure 1. Radial sections used for the parametric description of a VSV’s optical surface scan.
Ijtpp 09 00012 g001
Figure 2. Vibration mode shapes of interest for the second stage rotor.
Ijtpp 09 00012 g002
Figure 3. Numerical and experimental steady state results on VSV1, R2 and VSV2 at 90% nominal mechanical speed: (a) numerical relative Mach number at 90% channel height; (b) numerical and experimental total pressure’s radial distribution upstream of the variable stator vanes [20].
Ijtpp 09 00012 g003
Figure 4. Stator–Rotor–Stator (SRS) configuration forced response: (a) MPMR representation of the investigated test rig for the SRS setup; (b) excitation forces amplitude spectra of the two vibration modes, comparing the FA and the MPMR CFD results for the tuned nominal geometry SRS setup.
Ijtpp 09 00012 g004
Figure 5. Full Annulus (FA) comparison between tuned and mistuned setups: (a) geometry comparison between the FA of the tuned setup and the mistuned VSV1 setup; (b) spectra of the two vibration modes, comparing the FA tuned setup and the FA mistuned VSV1 setup CFD results.
Ijtpp 09 00012 g005
Figure 6. Mixture of the local forcing function f b , m ( M ) ( t ) with respect to blade b, with the modal forcing computed for the neighbouring blades b 1 and b + 1 .
Ijtpp 09 00012 g006
Figure 7. Modal forcing mixture method: (a) CFD domain used for the MPMR forcing mixture individual solutions; (b) comparison of the forcing spectra between a FA CFD and the MPMR mixture results.
Ijtpp 09 00012 g007
Figure 8. MPMR superposition method’s FA disturbances for a set of aerofoils with considered geometrical deviations (rotor mode m); the vertical dotted lines indicate the wake position for blade b.
Ijtpp 09 00012 g008
Figure 9. Modal forcing superposition method ( M = 6 ): (a) CFD domain used for the individual MPMR solutions computed for the forcing superposition; (b) comparison of the forcing spectra between a FA CFD and the MPMR superposition results.
Ijtpp 09 00012 g009
Figure 10. Excitation forces F e ( t ) in the time domain for the investigated vibration modes; comparison between the FA CFD and the MPMR superposition results.
Ijtpp 09 00012 g010
Figure 11. Modal forcing superposition method on extended sector ( M = 12 ): (a) CFD domain used for the individual MPMR solutions computed for the forcing superposition; (b) comparison of the forcing spectra between a FA CFD and the MPMR superposition results.
Ijtpp 09 00012 g011
Disclaimer/Publisher’s Note: The statements, opinions and data contained in all publications are solely those of the individual author(s) and contributor(s) and not of MDPI and/or the editor(s). MDPI and/or the editor(s) disclaim responsibility for any injury to people or property resulting from any ideas, methods, instructions or products referred to in the content.

