Abstract
Emotions are viewed as an important aspect of human interactions and conversations, and allow effective and logical decision making. Emotion recognition uses low-cost wearable electroencephalography (EEG) headsets to collect brainwave signals and interpret these signals to provide information on the mental state of a person, with the implementation of a virtual reality environment in different applications; the gap between human and computer interaction, as well as the understanding process, would shorten, providing an immediate response to an individual’s mental health. This study aims to use a virtual reality (VR) headset to induce four classes of emotions (happy, scared, calm, and bored), to collect brainwave samples using a low-cost wearable EEG headset, and to run popular classifiers to compare the most feasible ones that can be used for this particular setup. Firstly, we attempt to build an immersive VR database that is accessible to the public and that can potentially assist with emotion recognition studies using virtual reality stimuli. Secondly, we use a low-cost wearable EEG headset that is both compact and small, and can be attached to the scalp without any hindrance, allowing freedom of movement for participants to view their surroundings inside the immersive VR stimulus. Finally, we evaluate the emotion recognition system by using popular machine learning algorithms and compare them for both intra-subject and inter-subject classification. The results obtained here show that the prediction model for the four-class emotion classification performed well, including the more challenging inter-subject classification, with the support vector machine (SVM Class Weight kernel) obtaining 85.01% classification accuracy. This shows that using less electrode channels but with proper parameter tuning and selection features affects the performance of the classifications.
1. Introduction
Emotions are viewed as an important aspect of human interactions and conversations, and allow effective and logical decision-making [1]. To understand how these responses are made or decided, multiple neurophysiological devices collect the bio-signals that are emitted within the human body. Such devices include electrocardiograms (ECGs) [2] which measure the heartbeat; electromyograms (EMGs) [3], which measure muscle movements; electrodermal activity (EDA), which measures skin conductance; electrooculograms (EOGs), which measure eye movements; and electroencephalography (EEG) [4,5,6,7,8,9,10], which measures brainwave signals directly from the brain. The current medical devices have been developed to be non-invasive, which reduces risks and provides safe implementation for many people and researchers alike to perform experiments on human physiology.
Emotion recognition using EEG signals has attracted many researchers with the aim of understanding the evocation of the emotional responses from the human brain [9,11,12,13]. The applications of this research will disrupt developers and encourage them to integrate the use of a low-cost, portable EEG device together with the use of VR into their products. Emotion recognition systems can assist in a diverse area of applications, such as human–computer interaction (HCI), emotion understanding, brain–computer interface (BCI), and medical applications. The EEG emotion recognition system [14,15,16] does provide a unique challenge due to the vast differences in every individual’s brainwave patterns, especially when each individual’s association with emotional experiences is different. EEG data can assist with the collection of brainwave signals by placing non-invasive electrodes onto the scalp by following the placement standards of the 10–20 international system. These electrodes then collect EEG signals and are filtered using fast Fourier transform (FFT) to obtain rhythmic bands, such as the delta (<4 Hz), theta (4 < 7 Hz), alpha (8 < 13 Hz), beta (14 < 30 Hz), and gamma (>30 Hz) bands. Additionally, some of the low-cost wearable EEG headsets have an in-built inertial sensor that allows for the collection of gyroscope and accelerometer data.
This paper is segregated into the following sections: Section 2 provides literature reviews of earlier findings of emotional responses from humans and the availability of emotional datasets; Section 3 presents the research methodology of this work; Section 4 presents the findings and analysis of the classification accuracy and its highlights; and, lastly, Section 5 presents the conclusion of this research work.
2. Related Work
The database presented in this study explores the possibility of classifying emotions by stimulating the responses through the use of a virtual reality environment that simulates an immersive experience reflecting real-life situations. To the best of our knowledge, the use of a VR-based stimulus for evoking emotions is rarely explored, although VR technology has proven to provide significant immersive experiences for entertainment, virtual walkarounds, and simulated driving, which presents an opportunity for researchers to collect physiological responses for emotion evaluation and classification. This paper’s contribution explores the use of a VR-based stimulus which will be used to evoke the emotional responses of participants and to evaluate this proposed classification model using machine learning algorithms.
The selection of a particular emotion to stimulate responses is crucial in studying human emotions. Moreover, human emotions are tied to life experiences; therefore, every person’s attachment, for example, towards an object or animal differs from one another, in addition to increases in the complexity of communication among humans over time. However, every human being from the moment they are born, is implanted with instincts and basic behavioral patterns that can be found in infants, such as behavioral patterns that include laughing, crying, and being scared and relaxed, among many other emotions. These findings were presented by the eminent psychologist, Ekman, who claimed that a human being has six basic embedded human emotions [17], though some other researchers have shown that there are more complex embedded emotions beyond these six basic emotions. Such complex responses are governed by the definitions described in our emotional dictionaries and are reflective of one’s actions. Plutchik then further developed these concepts into the wheel of emotions [18]. Additionally, the valence–arousal scale was developed by Russell [19]. In this study, Russell’s valence–arousal scale was adopted as this approach has been widely used for emotion recognition where the measurement of emotions is represented using the valence and arousal axes. To describe the scale, the emotional state is placed on a two-dimensional plane where arousal is located on the vertical axis while valence is located on the horizontal axis. Additionally, there is sometimes also a third axis known as dominance, but is not usually included as the measurement of dominance is not straightforward. Arousal is measured by using two states which are active (interested/engaged) and inactive (not interested/not engaged) states, while valence is measured through the feelings of pleasantness (happy, excited) and unpleasantness (sad, depressed).
The exploitation of next-generation technology for entertainment and neurological evaluation of emotions, such as the adoption of virtual reality, has been actively conducted by various researchers. Some studies have compared the immersive capabilities between the standard delivery of video content via computer monitors or television screens versus virtual reality display headsets and have shown that emotions are triggered at a higher intensity when presented through VR [20,21]. Emotional implications, such as being seated and utilizing room-scaled VR, were also studied, and it was shown that room-scale VR enhances emotional reactivity, especially towards negative threats [22]. VR technology also provides the flexibility for designers to create realistic and controlled environments [23], where this would help designers to induce specific emotions for the users.
Presently, the closest resemblance of this research work with any other relatable public VR database is the “Public Database of 360 Videos with Corresponding Ratings of Arousal and Valence” [24], where the VR videos were taken from an open-source content and edited to accommodate the emotional responses required by the researchers. From the 200 immersive VR clips collected from Youtube, Vrideo, and Facebook, 113 were shortlisted, and this number was then further reduced to 73 after some additional criteria were applied, such as video length, engagement, and ability to induce valence and arousal. The VR clips’ lengths were between 29 s to 668 s, with an average runtime of 188 s per clip. These videos were then presented to the participants using an Oculus Rift head-mounted device (HMD), which features sensors such as a magnetometer, gyroscope, and accelerometer to track the rotational movement of the head. Later, the researchers requested their participants to complete a self-evaluation of their emotions by using the self-assessment manikin (SAM) to obtain an indication of the arousal and valence levels experienced. It was observed that the lengthier video clips used were of journalistic content (such as news of nuclear fallouts, homeless veterans, dictatorship regimes) which naturally evokes negative valence, as stated earlier. Other observations included the appropriate length of the video; if the user was exposed too long to VR, some of their participants started to feel nauseated and fatigued, requiring the participants to take a break every 15 min to recover.
Another notable VR database that was found from previous studies was the affective virtual reality system (AVRS) [25]. This paper showed that the researchers developed their database by selecting videos that evoked the four emotional quadrants, including both high and low arousal, as well as positive and negative valence, and then evaluating their VR stimuli contents by using the SAM rating reporting method.
The Nencki affective picture system (NAPS) [26] is a collection of 1356 realistic pictures that encompasses five categories (people, faces, animals, objects, and landscapes) which were confirmed by three evaluators with descriptive rules [27] to ensure the pictures were in line with the theme in question. Ten pictures were then selected to expose participants to two stimulating emotions, which were happiness and fear, where these pictures were embedded into a 3D VR environment to provide the VR experience of viewing the picture immersively. There were 10 pictures present in each VR room, and the participants were exposed to these stimuli for 15 s in each room with a 10 s rest in between. While the participants were exposed to the pictures, the participants wore the Emotiv Epoc+ headsets to collect their brainwave signals. The paper showed that the researchers were able to observe changes in the user’s brainwave signals, such as alpha, beta low, beta high, gamma, and theta bands.
In terms of machine learning algorithms, there were different classification outcomes depending on the type of stimuli that were presented, whether it was video, images, music, or a combination of them. Table 1 summarizes the types of classifiers used and their performance achieved, which ranged in accuracy from 60–83%.

Table 1.
Classification performance achieved by prior researchers.
3. Methodology
3.1. Stimuli Selection
The stimuli that were used in the experiments of this study were selected using several steps. Firstly, we manually selected 39 initial VR-capable video stimuli showing the potential to evoke the most impactful emotional response. Secondly, these initial VR-capable video stimuli were then assessed by structurally placing each of the corresponding videos in its respective quadrants using the arousal–valence space (AVS) model shown in Figure 1. Finally, 16 VR video stimuli were then selected after an assessment conducted by subject matter experts with experiences in artificial intelligence supported by a professional cognitive psychologist.
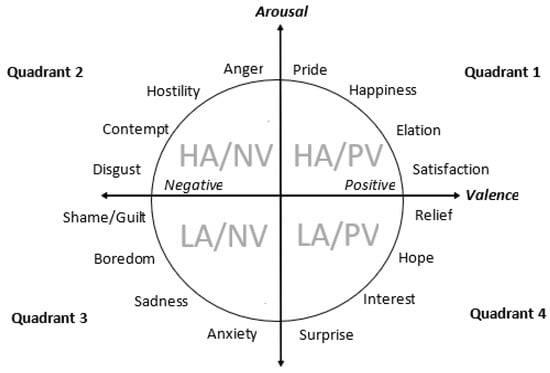
Figure 1.
Arousal–valence Space (AVS) Model.
3.2. Initial VR Video Selection
The selected VR videos must be capable of stimulating emotional responses that can produce the highest impact for the participants. Initially, it is important to decide on a specific type of emotional response required for conducting the emotion classification of the participants. The study follows the most basic types of emotions which can be represented by the arousal and valence regions, where arousal measures the level of engagement, i.e., whether the participants are active or passive about the situation, and valence measures whether the participants are experiencing positive or negative emotions. Additionally, the VR videos must be able to fully simulate a virtual reality environment and be reflective or representative of the real world as much as possible. Lastly, the quality of the VR videos must be sufficiently high. The criteria applied included the clarity of the VR video and audio, whereby the VR video presented is intuitive to the participant, and the VR video can be viewed in 360 degrees virtually. These criteria would provide an immersive experience for the participants while viewing the VR world, and the emotional representation of the real world, as presented in VR, can be sampled accurately.
A total of 39 VR videos was selected for the initial stimuli assessment, and VR videos were collected from Youtube.com and downloaded for offline usage. These VR videos were filtered using a built-in feature within Youtube to search for VR videos that can detect head movements and follow the direction of the user’s visual orientation. However, the challenge here was that emotional tags were not part of their filter system, thus making it somewhat challenging to directly locate suitable VR videos required to elicit a particular kind of emotion. In many of the VR videos viewed during pre-selection, there was a mixture of emotions that can be found in typical videos. In order to elicit a particular emotion, a short clip of approximately 20 s would be adequate to stimulate the necessary emotional responses without fatiguing or nauseating the participants.
The AVS model is divided into four quadrants, namely high arousal/positive valence (HA/PV), high arousal/negative valence (HA/NV), low arousal/positive valence (LA/PV), and low arousal/negative valence (LA/NV). To ensure that there was diversity in the VR videos, each of the quadrants would be populated with four different VR videos that were representative of that emotional quadrant, which was verified by a cognitive psychologist. The VR videos were shortlisted according to the adherence of the following criteria:
Does the VR video represent the emotions according to the AVS quadrants?
Does the VR video have a clear image and sound quality?
Does the VR video contain any background music that may disturb the user’s emotional responses?
3.3. Selection of EEG Headset
For the experiment to succeed, it is important to select the correct EEG headset that is both convenient and inexpensive. The improvements made towards medical imaging technology have allowed doctors and researchers to be able to further understand human physiology and psychology through the study of the central nervous system. Various products for brain imaging scans which do not harm the patients or participants through any surgical incisions, but instead use non-invasive electrodes to obtain the brainwave signals, have been developed. The EEG headset in this study needs to be low-cost, portable, and have electrodes that do not require constant maintenance. At the time of gathering the information on the cost of EEG headsets that were available in the market, the EEG headsets available are identified and presented in Table 2 [35,36,37,38,39], along with the descriptions of the available features and costs for each headset. It can be clearly seen that the relative cost of the EEG headset increases proportionally with the number of channels with some of the headsets providing additional features, such as wireless connection or motion sensors.
Table 2.
Breakdown of EEG headsets details and costs.
For the EEG electrodes to obtain the brainwave signals effectively, the sensors must not be blocked by any external objects, such as hair or fabric. The closest area to the region of the hypothalamus of the brain without being obstructed by hair is near the back of the earlobes. This narrows down the selection from the list of available EEG headsets in Table 2 to Interaxon Muse 2016, where it has four channels with additional features, such as the 3-axis motion sensor which provides accelerometer and gyroscope data. This device is also open-source, thereby providing researchers access to the raw data of the brainwave signals captured by the device.
3.4. EEG Headset and Smartphone Setup
The experiments were performed in a controlled environment inside a laboratory. The EEG signals were recorded using the Interaxon Muse 2016 EEG headset. The EEG headset collects the brainwave signals from four different channels (AF7, AF8, TP9, TP10) and a reference at (FpZ). The EEG signals were transmitted via Bluetooth low-energy (BLE) 4.0 to a Bluetooth-capable smartphone using an application called Mind Monitor, which records the incoming brainwave signals and applies a fast Fourier transform (FFT) to obtain the five brainwave signals (Delta, Theta, Alpha, Beta, and Gamma). Apart from these signals, it also retains the raw brainwave signal. Any artifacts resulting from muscle movements, such as jaw clenching and eye blinking, were filtered out using noise suppression methods such as driven-right-leg (DRL)-reference electrodes [40]. Additionally, the 50-Hz electrical noises were filtered out using a notch filter. The Mind Monitor application has an integrated FFT algorithm that processes the raw brainwave signal being acquired from the EEG headset and stores the transformed signals in a comma-separated-value (CSV) file. The smartphone used to collect the incoming EEG signals was a Samsung Note II (N7100) with a Quad-Core 1.6 GHz Cortex-A9 CPU, an Exynos 4412 Quad 2 GB RAM chip, and a BLE 4.0 Bluetooth chip. The EEG recordings were acquired at 0.5-s intervals by Muse Monitor based on the original 256-Hz raw sampling rate with the four-channel electrodes placed at AF7, AF8, TP9, and TP10, and reference at FpZ according to the 10–20 international system.
The stimulus was presented via a VR headset which requires the attachment of a smartphone that has an AMOLED screen display of 5.5” with a 1080 × 1920 pixel resolution. The stimulus VR video that was stitched together based on the respective quadrant representation of the emotions was stored in the smartphone for ease of access. The stimulus was presented in the order of calm, scared, happy, and bored, with each quadrant presenting four different VR videos stimulating the participants for 80 s per quadrant. When transitioning to another quadrant, there was a rest period of 10 s provided for the participants to reset their mental state before proceeding with the next emotional quadrant of VR videos. The presentation of the VR videos was continuous and takes approximately 350 s to complete.
3.5. Experiment Protocol
A total of 32 healthy participants (7 females, 25 males), aged between 23 and 45, participated in the experiment. Before the experiment began, each user was required to sign a consent letter and was notified of the experimental procedure. Participants were presented with a pair of earphones for an immersive audio experience, and adjustments were made by the participants to improve comfort while viewing the VR video. Figure 2 shows the setup of the low-cost wearable EEG headset used to collect the brainwave signals as well as the VR stimulus presented using the VR headset attached with a smartphone.
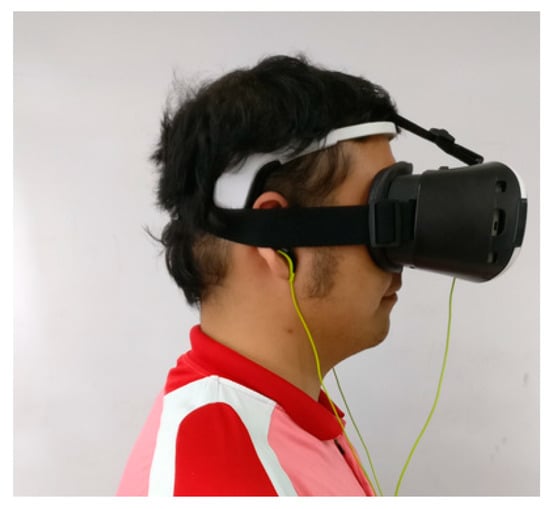
Figure 2.
Headset devices (EEG and VR) worn by a participant where the positions of sensors are placed on the frontal scalp (AF7, AF8) and earlobes (TP9, TP10).
A total of 16 VR videos were presented to the participants, and any disorientations [41,42,43,44] that may be felt by the participants were avoided as much as possible to reduce incomplete recording sessions. Table 3 shows the details of the VR videos in the sequence of presentation. The access hyperlink details for the videos are also provided as of 17 November 2020 for the VR stimuli that were used for the editing and stitching of the complete emotional stimuli presentation. As depicted in Figure 3, the sequence of presenting the emotional responses of the VR videos was as follows:
Table 3.
VR videos used for stimulating emotional responses.

Figure 3.
Video sequence of the VR stimulus.
- Each quadrant of the VR videos was presented for 80 s using four different videos per quadrant;
- A 10-s rest was provided to reset the user’s mental state before proceeding to the next emotional quadrant;
- The VR videos were presented in a continuous sequence without any breaks in between;
- Once the presentation of VR videos had ended, the participants would notify the researcher to conclude the experiment.
3.6. Machine Learning Algorithms
3.6.1. K-Nearest Neighbor (KNN)
The classification using the KNN algorithm aims to extract the majority vote, which decides whether the observation belongs to a certain K-similar distance. For this, in any dimensional space, the Euclidean distance shown in the equation was used since KNN is a non-parametric classification algorithm. It can assign labels to any previously unsampled points which generally has a lower efficiency as the size of the data increases, thus requiring the use of a feature decomposition algorithm [45]. The performance is highly reliant on the value of K which is usually determined from hand-tuning experiments. However, an exhaustive search using an expensive search technique might be required in certain cases since it is not trivial to optimally select K, where the K-similar distance (d) is described in the equation below.
where d = the distance between 2-points; x = the value of x at x-axis point; y = the value of y at y-axis point; i = the counter from 1 to n.
3.6.2. Support Vector Machine (SVM)
The SVMs are supervised linear classification models that make use of hyperplanes, where the hyperplane is the plane that exists between the separation of classes. Each sample point is plotted in space which determines the different classification features. In SVMs, a multiclass classification is implemented by breaking the problem down to multiple binary classification cases. The following equation is retrieved using the one-vs-one multiclass classification where n represents the number of classes [46].
where n = number of classes.
3.6.3. Naïve Bayes (NB)
When the dimensionality of a particular dataset is high, the use of NB is recommended since the presence of the selected feature in a class is unrelated to the presence of another feature which belongs to another class. The use of the NB model is helpful for large datasets with many attributes [47]. Due to its simplicity, the naïve Bayes algorithm might even surpass some of the more complex classification techniques. The probabilistic rule used in the NB equation is shown below.
where P(c|x) = the posterior probability of class (c, target), i.e., the given predictor (x, attributes); P(c) = the prior probability of class; P(x|c) = the likelihood/probability of the predictor given the class; P(x) = the prior probability of the predictor.
3.6.4. Neural Network (NN)
The neural network (NN) usually consists of weights, where the value designates the importance of the neuron which was attached on the input side of the weight while the bias term factors in any possibilities that may not have been initially considered and will cater to these unforeseen circumstances. The bias can be attached to any neuron that is not specifically on the input layer. Activation will cause a neuron to make a decision on an output and return itself to another decide on another iteration of the output. The equation for calculating the activation of a neuron is shown below.
where b = bias; x = the input to neuron; w = weights; n = the number of inputs from incoming layer; i = the counter from 1 to n.
3.6.5. Random Forest (RF)
The random forest (RF) algorithm can be used to solve regression or classification problems, making it a diverse model. In RF, the classification model is used based on the entropy node shown in the equation below:
where pi = the relative frequency of the class being observed; c = the number of classes.
Entropy uses the probably of a certain outcome in order to make a decision on how the node will branch out. However, due to its logarithmic function, it is mathematically intensive.
3.6.6. Gradient Boosting Machine (GBM)
Boosting is a machine learning algorithm where weak learners are converted into strong learners. Weak learners are classifiers which may perform slightly better than chance, irrespective of the distribution over the training data. In boosting, the predictions are sequential, wherein each subsequent predictor learns from the errors of the previous predictors. Hence, gradient boosting (GB) can be applied to both regression and classification problems.
3.7. Machine Learning Parameters
This research approach adopts the approach of intra-subject and inter-subject classification. Intra-subject classification is a process of classification of individual datasets whereas inter-subject classification is the process of classification by combining all individual datasets into a single large dataset. Both intra-subject and inter-subject classification have single-band features (individual bands of Delta, Theta, Alpha, Beta, and Gamma) or a combination of all five bands. This research uses all available electrode positions (TP9, TP10, AF7, AF8) for the classification process. The summaries of the classifiers and their configurations are as presented in Table 4, Table 5 and Table 6.
Table 4.
KNN parameter configuration.
Table 5.
SVM parameter configuration.
Table 6.
Feedforward artificial neural network (FANN), distributed random forest (DRF), gradient boosting machine (GBM), naïve Bayes (NB) parameter configuration.
All the classifiers were trained using 90% of the total dataset while the remaining 10% were tested and evaluated on the performance of the trained model. All the classifiers were conducted using the 10-fold cross-validation method to find the average accuracies of the various classification models’ performances.
4. Discussion and Analysis
4.1. Data Structure
The data were collected and stored in a comma-separated value (CSV) format with each participant’s data recorded on approximately 640 rows. Twenty-four EEG-related columns were extracted as features, which consisted of each electrode’s (AF7, AF8, TP9, TP10) raw and transformed brainwave data (delta, theta, alpha, beta, gamma), along with additional readings that included the accelerometer, gyroscope (X,Y,Z), HSI link, battery level, and extraneous elements (blinks and clenches). An additional column was added to the dataset to indicate the emotions that were elicited during the specific timestamps. Any cells with missing values due to movements of the head that may cause a temporary connection loss between the sensor and the skin during the data streaming process from the EEG headset were interpolated.
The intra-subject variability approach was applied to measure the individual classification accuracy over 31 participants, where each individual’s dataset would consist of approximately 640 rows. On the other hand, the inter-subject variability approach was applied to measure all of the combined individuals’ datasets to form a single large dataset that consisted of approximately 20,000 rows. Subsequently, columns such as the HSI link, battery level, and extraneous elements (blinks and clenches) were removed from the dataset, as they only consisted of either hardware or involuntary muscular movement information that was not relevant to the emotion classification task.
4.2. Overall Classification Results
The experiment commenced by using the intra-subject variability approach to perform the emotion classification, i.e., a common experimentation approach used in prior studies due to its lower complexity and higher classification accuracy results. Based on Figure 4, it is shown that the class weight kernel from SVM was able to achieve the highest accuracy of 97.57% using spline interpolation and 97.66% using linear interpolation, and followed closely by the polynomial kernel with 96.03% using spline interpolation and 96.14% using linear interpolation. As such, it was also observed that the interpolation approach used as part of the classification preprocessing does impact the accuracy of the emotion classification, although the topic of the interpolation method adopted was rarely discussed in prior studies.
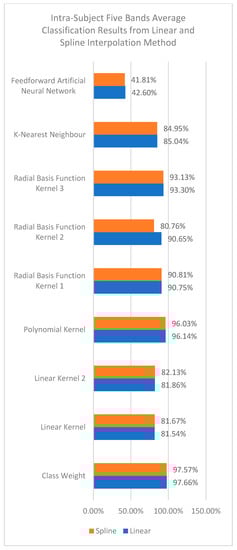
Figure 4.
Intra-Subject Classification Results using Five Bands.
Subsequently, the experiment proceeded to use the inter-subject variability approach to observe whether the added complexity of classification over the entire test cohort would drastically impact the emotion classification accuracy results. The classification results using a feedforward artificial neural network (FANN) are shown in Figure 5. By observing the changes in the classification accuracy based on the changes of the epoch configurations, it was shown that FANN does not produce very high accuracy results. The highest emotion classification accuracy obtained was 41.04% with the number of epochs set at 2000.
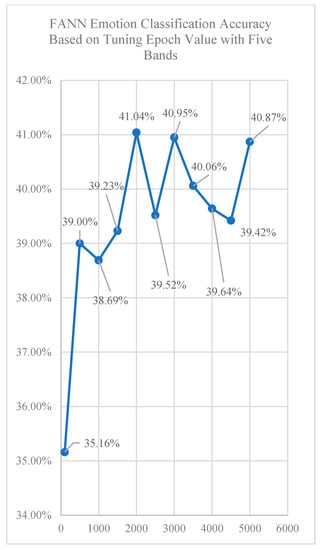
Figure 5.
Inter-Subject FANN Classification Result using Five Bands.
In Figure 6, the results for KNN, SVM, and FANN using the default parameter configurations are shown. By comparing the results shown in this figure, the class weight kernel from SVM obtained the best classification results, i.e., 75.90% using the linear interpolation method and 75.61% using the spline interpolation method. This was followed closely by KNN achieving a classification accuracy of 75.55% using linear interpolation method and 75.43% using spline interpolation. Despite the complexity of adopting the inter-subject variability approach, the classification accuracy achieved from the two classifiers was acceptable for a four-class classification problem.
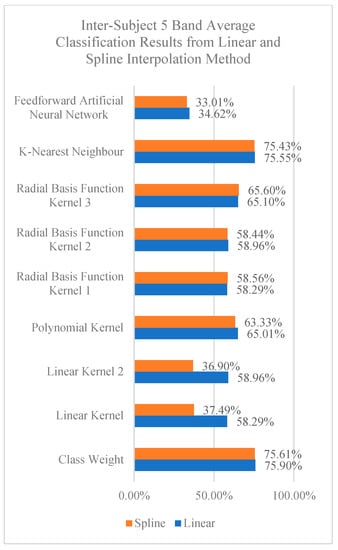
Figure 6.
Inter-subject classification results using five bands.
To further improve the classification accuracy, the default parameters of the classifiers were then tuned in the next set of experiments. The dataset used for this classification results was based on the linear interpolation method as it consistently produced better classification accuracies over the spline interpolation method when adopting the inter-subject variability approach presented earlier above. The results for the tuned classifiers are shown in Figure 7. By tuning the parameters of the classifiers, it was observed that the majority of the classifiers showed improvements throughout. Noticeably, the most improvements were gained by the radial basis function kernel 1 and radial basis function kernel 3, followed by class weight kernel, all of which were from the SVM classifier. Through ranking, it can be seen that radial basis function kernel 1 achieved the highest accuracy at 85.01%, followed closely by class weight kernel at 84.80%, the radial basis function kernel 3 at 84.44%, and finally KNN at 82.61%.
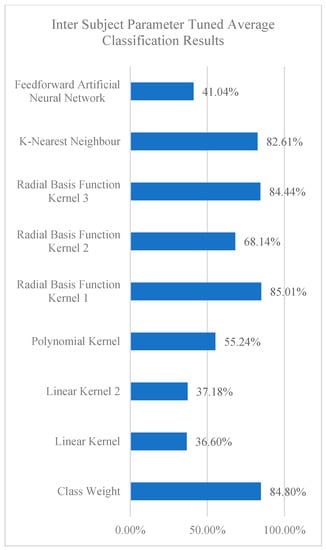
Figure 7.
Parameter-tuned SVM and FANN classification results.
The following experiment compares results between brainwave signals for classification only and the combination of brainwave signals plus inertial sensing data (accelerometer and gyroscope). The dataset used for this experiment was conducted using the inter-subject variability approach. The classifiers used for this experiment were distributed random forest (DRF), gradient boosting machine (GBM), and naïve Bayes (NB), as shown in Figure 8. It can be observed that that the addition of the inertial sensing data affects the outcome of the classification accuracy for GBM and NB with slight improvements in their accuracies when brainwave signals were combined with the inertial sensing data. However, the DRF classification accuracy remained relatively the same. As for classification performances, DRF still achieved the highest classification accuracy at 82.49%.
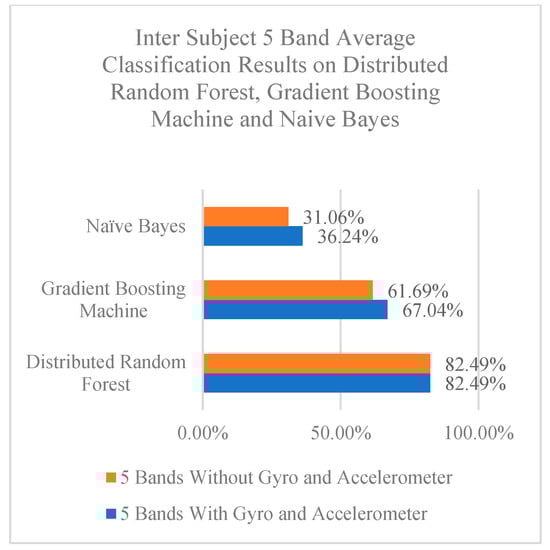
Figure 8.
Brainwave and inertial sensing emotion classification result from DRF, GBM, and NB.
Using the training model achieved from earlier results, the next step was to develop a live emotion prediction system using the four-class classification approach together with the trained machine model as shown in Figure 9. The model used for this live emotion prediction system was based on DRF obtained from the previous classification experiment. Figure 10 shows the results from five participants. It can be observed that the highest emotion classification accuracy obtained was from the scared emotion at 76.25% and the bored emotion at 72.50%. Both the scared and bored emotions are located in the low arousal space of the AVS model.
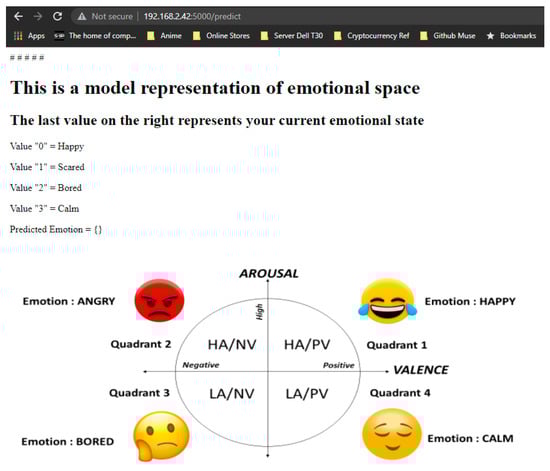
Figure 9.
Live web page of the emotion prediction system.
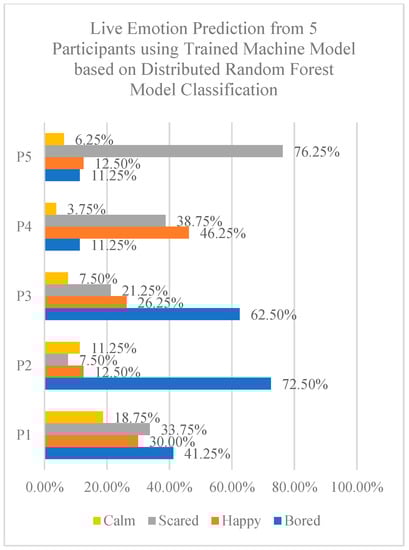
Figure 10.
Results from live emotion prediction system using a four-channel EEG headset from a four-class predictor model.
4.3. Comparing Classification Results from Previous Studies
Based on the observations of the results presented in Table 7, the highest classification accuracy using the intra-subject variability approach was 97.68%, while it was 85.01% for the inter-subject variability approach. In this study, the classification results showed that using the features of the five bands exhibited a higher classification accuracy over the single bands. Since inter-subject classification would be more representative of general application usage, this study then combined the five bands with the inertial data and classified them using distributed random forest (DRF) which is a neural network classifier, and was able to obtain a classification accuracy of 82.49%.
Table 7.
Overall classification accuracy.
As shown in Table 8, previous studies, such as by Katsigiannis and Song [48,49], also conducted emotion classification using EEG signals. However, the brainwave bands that they selected were only the theta, alpha, and beta bands compared to this study which uses all five bands (delta, theta, alpha, beta, and gamma). However, at the time of this study, there was little evidence from the existing literature of emotion classification being conducted specifically using a wearable EEG headset with VR as the emotional stimulus; hence, it was difficult to locate a fair and relevant comparison with our study. Nonetheless, the closest comparison for intra-subject variability results was obtained from the two prior studies found. Both studies [48,49] used the DREAMER dataset which stimulates their user’s emotional response obtained through a video stimulus shown on a large monitor. The researchers also collected their EEG samples using a wearable Emotiv Epoc+ EEG headset, which has 14 recording electrode channels. They obtained their results by running the last 60 s of their video samples to evaluate the user’s level of arousal and valence. However, due to the large number of emotional tags that could be associated with the video stimulus over such an extended time for viewing the videos, it would have been difficult to accurately identify the specific emotional classes for the particular timestamp since the user’s emotional state would have changed over that extended duration of viewing time.
Table 8.
Intra-subject classification accuracy.
Two studies were found for comparing for the classification results in terms of inter-subject variability [37,39], as shown in Table 9. One of the studies uses a dataset obtained from ASCERTAIN which uses video stimulus to obtain their EEG samples while the other study developed their own proprietary VR stimulus environment to stimulate emotional responses from the users, which closely resembles this study’s VR stimulus with slight differences. Marin-Morales’s [37] study uses varying architectural designs to measure the levels of arousal and valences and was able to obtain an average classification accuracy of 70.00% while Subramanian’s [39] approach, which used the common video stimulus approach, could only obtain a classification accuracy of 61.00%.
Table 9.
Inter-subject classification accuracy.
Both comparisons of intra-subject and inter-subject variability showed that using VR as a stimulus presentation method produced better classification results than the common video stimulus approach shown through a large monitor. The immersion level provided by a VR headset stimulates a greater emotional response from the user because of their feeling of “being there”, and the VR headset also narrows the user’s field of vision to only display in front of their eyes without external visual or noise interruptions from their surroundings.
To compare the performance of the proposed approach in terms of classification accuracy, Table 10, Table 11 and Table 12 present the confusion matrix of this study using the RBFK1 kernel and the comparison of the highest accuracies from the most closely related study [37] using the inter-subject approach, which was also conducted in VR, in terms of arousal and valence classifications, respectively. A direct four-class confusion matrix comparison is not possible because the existing study only presented biclassification results for arousal and valence separately and not as a single four-class classification, as conducted in this study. By comparing the simpler biclassification results of the existing study against the more complex four-class classification results of this study, this study’s approach can be seen to outperform the existing study’s approach for emotion classification in virtual reality.
Table 10.
Confusion matrix for this study (RBFK1).
Table 11.
Arousal classification comparison of proposed approach versus existing results.
Table 12.
Valence classification comparison of proposed approach versus existing results.
4.4. Suggested Implementations to Improve Classification Accuracy
Some weaknesses can be found in this research, most notably the attention span or engagement of the participants while being immersed inside the VR environment. Participants might become intrigued with other objects presented within the digital environment other than the intended emotional stimuli, or the participants might have just closed their eyes while viewing an object that was frightening to them. There was also another missing immersion capability, which was the ability for participants to be able to interact with objects inside the VR environment. These weaknesses can be addressed with EOG sensors to track the eye movements of participants and to provide them with trackable controllers to interact with objects inside the VR environment.
Other factors, such as tuning parameters for the classifiers, will also need to be further considered to improve the classification accuracy as well as improve computational resources by reducing the time spent on processing the data [50]. Other machine learning methods, such as convolutional neural network (CNN) and extreme learning machine classifier, as well as feature transformation methods including time-order representation (TOR), can also be considered, as shown by the researchers [51,52,53], where the results of its four-class emotion classification obtained accuracies of between 91–97%.
5. Conclusions
This work has presented the results of the classification performances using KNN, SVM, FANN, DRF, GBM, and NB using videos displayed in a VR headset which was paired together with a low-cost wearable EEG headset which had four recording electrode channels (TP9, TP10, AF7, and AF8) as well as inertial sensing data to classify the emotions of the participants into four distinct emotion classes. The results had shown that inter-subject variability was able to obtain an accuracy of 85.01% accuracy, whereby the complexity of a large dataset of 20,000 rows was higher compared to intra-subject variability with just approximately 640 rows, which was able to obtain an accuracy of 97.66%. A novelty of this research was that a live prediction emotion system was also developed to demonstrate the real-time emotion classification performances using the low-cost wearable EEG headset with only four channels to detect the four classes of emotions. The performances of the classifiers showed the capabilities of the classifiers using different preprocessing and input features, such as using interpolation, single bands, five bands in combination, as well as adopting inertial sensing data.
Author Contributions
Writing—original draft preparation, N.S.S.; writing—review and editing, J.M. and J.T.; supervision, J.M. and J.T.; project administration, J.T.; funding acquisition, J.T. All authors have read and agreed to the published version of the manuscript.
Funding
This work was supported by the research grant ref: IF0318M1003 (ICF0001-2018) received from the Ministry of Science, Technology, and Innovation (MOSTI), Malaysia.
Institutional Review Board Statement
The study was conducted in accordance with the Declaration of Helsinki, and approved by the Medical Research Ethics Committee of Universiti Malaysia Sabah (approval code: JKEtika 2/19 (16), approved: 20 August 2019).
Informed Consent Statement
Informed consent was obtained from all subjects involved in the study.
Data Availability Statement
The datasets used and/or analysed during the current study are available from the corresponding author on reasonable request.
Conflicts of Interest
The authors declare no conflict of interest.
References
- Davidson, R.; Jackson, D.C.; Kalin, N.H. Emotion, plasticity, context, and regulation: Perspectives from affective neuroscience. Psychol. Bull. 2000, 126, 890–909. [Google Scholar] [CrossRef] [PubMed]
- Selvakumarasamy, K.; Poornachandra, S.; Amutha, R. K–Shrinkage Function for ECG Signal Denoising. J. Med. Syst. 2019, 43, 248. [Google Scholar] [CrossRef] [PubMed]
- Araújo, F.; Ferreira, N.; Soares, S.; Valente, A.; Junior, G.S. Data Acquisition from the Integration of Kinect Quaternions and Myo Armband EMG Sensors to Aid Equinus Foot Treatment. In Proceedings of the 12th International Joint Conference on Biomedical Engineering Systems and Technologies, BIOSTEC 2019, Prague, Czech Republic, 22–24 February 2019; pp. 235–240. [Google Scholar] [CrossRef]
- Bhattacharjee, S.; Ghatak, S.; Dutta, S.; Chatterjee, B.; Gupta, M. A Survey on Comparison Analysis Between EEG Signal and MRI for Brain Stroke Detection. Adv. Intell. Syst. Comput. 2019, 814, 377–382. [Google Scholar] [CrossRef]
- Chen, Y.-H.; De Beeck, M.O.; Vanderheyden, L.; Carrette, E.; Mihajlović, V.; Vanstreels, K.; Grundlehner, B.; Gadeyne, S.; Boon, P.; Van Hoof, C. Soft, Comfortable Polymer Dry Electrodes for High Quality ECG and EEG Recording. Sensors 2014, 14, 23758–23780. [Google Scholar] [CrossRef] [PubMed] [Green Version]
- Demirel, C.; Kandemir, H.; Kose, H. Controlling a robot with extraocular muscles using EEG device. In Proceedings of the 26th IEEE Signal Processing and Communications Applications Conference, SIU 2018, Izmir, Turkey, 2–5 May 2018; pp. 1–4. [Google Scholar] [CrossRef]
- Dey, A.; Piumsomboon, T.; Lee, Y.; Billinghurst, M. Effects of Sharing Physiological States of Players in a Collaborative Virtual Reality Gameplay. In Proceedings of the 2017 CHI Conference on Human Factors in Computing Systems, Denver, CO, USA, 6–11 May 2017; pp. 4045–4056. [Google Scholar] [CrossRef]
- Fernandez-Blanco, E.; Rivero, D.; Pazos, A. Convolutional neural networks for sleep stage scoring on a two-channel EEG signal. Soft Comput. 2020, 24, 4067–4079. [Google Scholar] [CrossRef]
- Li, T.-H.; Liu, W.; Zheng, W.-L.; Lu, B.-L. Classification of Five Emotions from EEG and Eye Movement Signals: Discrimination Ability and Stability over Time. In Proceedings of the 2019 9th International IEEE/EMBS Conference on Neural Engineering (NER), San Francisco, CA, USA, 20–23 March 2019; pp. 607–610. [Google Scholar] [CrossRef]
- Ménard, M.; Richard, P.; Hamdi, H.; Daucé, B.; Yamaguchi, T. Emotion recognition based on heart rate and skin conductance. In Proceedings of the PhyCS 2015–2nd International Conference on Physiological Computing Systems, Angers, France, 11–13 February 2015; pp. 26–32. [Google Scholar] [CrossRef]
- Chen, J.X.; Zhang, P.W.; Mao, Z.J.; Huang, Y.F.; Jiang, D.M.; Zhang, Y.N. Accurate EEG-Based Emotion Recognition on Combined Features Using Deep Convolutional Neural Networks. IEEE Access 2019, 7, 44317–44328. [Google Scholar] [CrossRef]
- Gupta, A.; Sahu, H.; Nanecha, N.; Kumar, P.; Roy, P.P.; Chang, V. Enhancing Text Using Emotion Detected from EEG Signals. J. Grid Comput. 2018, 17, 325–340. [Google Scholar] [CrossRef]
- Islam, M.R.; Ahmad, M. Wavelet Analysis Based Classification of Emotion from EEG Signal. In Proceedings of the 2nd International Conference on Electrical, Computer and Communication Engineering, ECCE 2019, Cox’s Bazar, Bangladesh, 7–9 February 2019; pp. 3–8. [Google Scholar] [CrossRef]
- Cai, J.; Chen, W.; Yin, Z. Multiple Transferable Recursive Feature Elimination Technique for Emotion Recognition Based on EEG Signals. Symmetry 2019, 11, 683. [Google Scholar] [CrossRef] [Green Version]
- Chao, H.; Dong, L.; Liu, Y.; Lu, B. Emotion Recognition from Multiband EEG Signals Using CapsNet. Sensors 2019, 19, 2212. [Google Scholar] [CrossRef] [Green Version]
- Huang, H.; Xie, Q.; Pan, J.; He, Y.; Wen, Z.; Yu, R.; Li, Y. An EEG-Based Brain Computer Interface for Emotion Recognition and Its Application in Patients with Disorder of Consciousness. IEEE Trans. Affect. Comput. 2019, 12, 832–842. [Google Scholar] [CrossRef]
- Ekman, P.; Friesen, W.V.; O’Sullivan, M.; Chan, A.; Diacoyanni-Tarlatzis, I.; Heider, K.; Krause, R.; LeCompte, W.A.; Pitcairn, T.; Ricci-Bitti, P.E.; et al. Universals and cultural differences in the judgments of facial expressions of emotion. J. Personal. Soc. Psychol. 1987, 53, 712–717. [Google Scholar] [CrossRef]
- Plutchik, R. The Nature of Emotions. Am. Sci. 2001, 89, 344–350. [Google Scholar] [CrossRef]
- Russell, J.A. A circumplex model of affect. J. Pers. Soc. Psychol. 1980, 39, 1161–1178. [Google Scholar] [CrossRef]
- Jin, B.; Kim, G.; Moore, M.; Rothenberg, L. Consumer store experience through virtual reality: Its effect on emotional states and perceived store attractiveness. Fash. Text. 2021, 8, 1–21. [Google Scholar] [CrossRef]
- Magdin, M.; Balogh, Z.; Reichel, J.; Francisti, J.; Koprda, Š.; György, M. Automatic detection and classification of emotional states in virtual reality and standard environments (LCD): Comparing valence and arousal of induced emotions. Virtual Real. 2021, 25, 1029–1041. [Google Scholar] [CrossRef]
- Baker, C. Emotional Responses in Virtual Reality Environments; Liverpool John Moores University: Liverpool, UK, 2021. [Google Scholar]
- Andreoletti, D.; Luceri, L.; Peternier, A.; Leidi, T.; Giordano, S. The Virtual Emotion Loop: Towards Emotion-Driven Product Design via Virtual Reality. In Proceedings of the 16th Conference on Computer Science and Intelligence Systems, Online, 2–5 September 2021; Volume 25, pp. 371–378. [Google Scholar] [CrossRef]
- Li, B.; Bailenson, J.N.; Pines, A.; Greenleaf, W.; Williams, L.M. A Public Database of Immersive VR Videos with Corresponding Ratings of Arousal, Valence, and Correlations between Head Movements and Self Report Measures. Front. Psychol. 2017, 8, 2116. [Google Scholar] [CrossRef] [PubMed]
- Zhang, W.; Shu, L.; Xu, X.; Liao, D. Affective virtual reality system (avrs): Design and ratings of affective vr scenes. In Proceedings of the 2017 International Conference on Virtual Reality and Visualization, ICVRV 2017, Zhengzhou, China, 21–22 October 2017; pp. 311–314. [Google Scholar] [CrossRef]
- Horvat, M.; Dobrinic, M.; Novosel, M.; Jercic, P. Assessing emotional responses induced in virtual reality using a consumer EEG headset: A preliminary report. In Proceedings of the 2018 41st International Convention on Information and Communication Technology, Electronics and Microelectronics (MIPRO), Opatija, Croatia, 21–25 May 2018; pp. 1006–1010. [Google Scholar] [CrossRef]
- Marchewka, A.; Żurawski, Ł.; Jednoróg, K.; Grabowska, A. The Nencki Affective Picture System (NAPS): Introduction to a novel, standardized, wide-range, high-quality, realistic picture database. Behav. Res. Methods 2013, 46, 596–610. [Google Scholar] [CrossRef] [PubMed] [Green Version]
- Ullah, H.; Uzair, M.; Mahmood, A.; Ullah, M.; Khan, S.D.; Cheikh, F.A. Internal Emotion Classification Using EEG Signal With Sparse Discriminative Ensemble. IEEE Access 2019, 7, 40144–40153. [Google Scholar] [CrossRef]
- Xu, J.; Ren, F.; Bao, Y. EEG Emotion Classification Based on Baseline Strategy. In Proceedings of the 2018 5th IEEE International Conference on Cloud Computing and Intelligence Systems, CCIS 2018, Nanjing, China, 23–25 November 2018; pp. 43–46. [Google Scholar] [CrossRef]
- Li, Y.; Zheng, W.; Wang, L.; Zong, Y.; Cui, Z. From Regional to Global Brain: A Novel Hierarchical Spatial-Temporal Neural Network Model for EEG Emotion Recognition. IEEE Trans. Affect. Comput. 2019, 1. [Google Scholar] [CrossRef] [Green Version]
- Wu, S.; Xu, X.; Shu, L.; Hu, B. Estimation of valence of emotion using two frontal EEG channels. In Proceedings of the 2017 IEEE International Conference on Bioinformatics and Biomedicine (BIBM), Kansas City, MO, USA, 13–16 November 2017; pp. 1127–1130. [Google Scholar] [CrossRef]
- Mohutsiwa, L.O.; Jamisola, R.S. EEG-Based human emotion classification using combined computational techniques for feature extraction and selection in six machine learning models. In Proceedings of the 5th International Conference on Intelligent Computing and Control Systems, ICICCS 2021, Madurai, India, 6–8 May 2021; pp. 1095–1102. [Google Scholar] [CrossRef]
- An, Y.; Sun, S.; Wang, S. Naive Bayes classifiers for music emotion classification based on lyrics. In Proceedings of the 2017 IEEE/ACIS 16th International Conference on Computer and Information Science (ICIS), Wuhan, China, 24–26 May 2017; pp. 635–638. [Google Scholar] [CrossRef]
- Ramesh, S.; Gomathi, S.; Sasikala, S.; Saravanan, T.R. Automatic speech emotion detection using hybrid of gray wolf optimizer and naïve Bayes. Int. J. Speech Technol. 2021, 1–8. [Google Scholar] [CrossRef]
- Abujelala, M.; Abellanoza, C.; Sharma, A.; Makedon, F. Brain-EE: Brain enjoyment evaluation using commercial EEG headband. In Proceedings of the PETRA 2016, Corfu, Greece, 29 June–1 July 2016. [Google Scholar] [CrossRef]
- Fan, J.; Wade, J.W.; Key, A.P.; Warren, Z.E.; Sarkar, N. EEG-Based Affect and Workload Recognition in a Virtual Driving Environment for ASD Intervention. IEEE Trans. Biomed. Eng. 2018, 65, 43–51. [Google Scholar] [CrossRef] [PubMed]
- Marín-Morales, J.; Higuera-Trujillo, J.L.; Greco, A.; Guixeres, J.; Llinares, C.; Scilingo, E.P.; Alcañiz, M.; Valenza, G. Affective computing in virtual reality: Emotion recognition from brain and heartbeat dynamics using wearable sensors. Sci. Rep. 2018, 8, 1–15. [Google Scholar] [CrossRef]
- Saeed, S.M.U.; Anwar, S.M.; Majid, M.; Bhatti, A.M. Psychological stress measurement using low cost single channel EEG headset. In Proceedings of the 2015 IEEE International Symposium on Signal Processing and Information Technology, ISSPIT 2015, Abu Dhabi, United Arab Emirates, 7–10 December 2015; pp. 581–585. [Google Scholar] [CrossRef]
- Subramanian, R.; Wache, J.; Abadi, M.K.; Vieriu, R.L.; Winkler, S.; Sebe, N. Ascertain: Emotion and personality recognition using commercial sensors. IEEE Trans. Affect. Comput. 2018, 9, 147–160. [Google Scholar] [CrossRef]
- Mahajan, R.; Morshed, B.I.; Bidelman, G.M. Design and validation of a wearable “DRL-less” EEG using a novel fully-reconfigurable architecture. In Proceedings of the Annual International Conference of the IEEE Engineering in Medicine and Biology Society, EMBS, Orlando, FL, USA, 16–20 August 2016; pp. 4999–5002. [Google Scholar] [CrossRef]
- Velasco, P.F. Disorientation and self-consciousness: A phenomenological inquiry. Phenomenol. Cogn. Sci. 2020, 20, 1–20. [Google Scholar] [CrossRef] [Green Version]
- Kober, S.E.; Wood, G.; Hofer, D.; Kreuzig, W.; Kiefer, M.; Neuper, C. Virtual reality in neurologic rehabilitation of spatial disorientation. J. Neuroeng. Rehabil. 2013, 10, 17. [Google Scholar] [CrossRef] [Green Version]
- Smith, S.P.; Marsh, T. Evaluating design guidelines for reducing user disorientation in a desktop virtual environment. Virtual Real. 2004, 8, 55–62. [Google Scholar] [CrossRef]
- Young, P.; Munro, M. Visualising software in virtual reality. In Proceedings of the 6th International Workshop on Program Comprehension, IWPC’98 (Cat. No. 98TB100242), Ischia, Italy, 24–26 June 1998; pp. 19–26. [Google Scholar]
- Bablani, A.; Edla, D.R.; Dodia, S. Classification of EEG Data using k-Nearest Neighbor approach for Concealed Information Test. Procedia Comput. Sci. 2018, 143, 242–249. [Google Scholar] [CrossRef]
- Bishop, C.M. Pattern Recognition and Machine Learning. In EAI/Springer Innovations in Communication and Computing; Springer: New York, NY, USA, 2006. [Google Scholar] [CrossRef]
- Rajaguru, H.; Prabhakar, S.K. Non linear ICA and logistic regression for classification of epilepsy from EEG signals. In Proceedings of the 2017 International Conference of Electronics, Communication and Aerospace Technology (ICECA), Coimbatore, India, 20–22 April 2017; Volume 1, pp. 577–580. [Google Scholar]
- Katsigiannis, S.; Ramzan, N. DREAMER: A Database for Emotion Recognition Through EEG and ECG Signals From Wireless Low-cost Off-the-Shelf Devices. IEEE J. Biomed. Health Inform. 2018, 22, 98–107. [Google Scholar] [CrossRef] [Green Version]
- Song, T.; Zheng, W.; Song, P.; Cui, Z. EEG Emotion Recognition Using Dynamical Graph Convolutional Neural Networks. IEEE Trans. Affect. Comput. 2018, 3045, 1–10. [Google Scholar] [CrossRef] [Green Version]
- Khare, S.K.; Bajaj, V.; Sinha, G.R. Adaptive Tunable Q Wavelet Transform-Based Emotion Identification. IEEE Trans. Instrum. Meas. 2020, 69, 9609–9617. [Google Scholar] [CrossRef]
- Khare, S.; Nishad, A.; Upadhyay, A.; Bajaj, V. Classification of emotions from EEG signals using time-order representation based on the S-transform and convolutional neural network. Electron. Lett. 2020, 56, 135–1361. [Google Scholar] [CrossRef]
- Khare, S.K.; Bajaj, V. Time–Frequency Representation and Convolutional Neural Network-Based Emotion Recognition. IEEE Trans. Neural Netw. Learn. Syst. 2020, 32, 2901–2909. [Google Scholar] [CrossRef] [PubMed]
- Khare, S.K.; Bajaj, V. An Evolutionary Optimized Variational Mode Decomposition for Emotion Recognition. IEEE Sens. J. 2021, 21, 2035–2042. [Google Scholar] [CrossRef]
Publisher’s Note: MDPI stays neutral with regard to jurisdictional claims in published maps and institutional affiliations. |
© 2022 by the authors. Licensee MDPI, Basel, Switzerland. This article is an open access article distributed under the terms and conditions of the Creative Commons Attribution (CC BY) license (https://creativecommons.org/licenses/by/4.0/).