
Comparison of Object Detection in Head-Mounted and Desktop Displays for Congruent and Incongruent Environments


1
Center for Cognitive Science, University of Kaiserslautern, 67663 Kaiserslautern, Germany
2
Fraunhofer Institute for Industrial Mathematics ITWM, 67663 Kaiserslautern, Germany
3
Department of Computer Science, San Francisco State University, San Francisco, CA 94132, USA
*
Author to whom correspondence should be addressed.
†
These authors contributed equally to this work.
Big Data Cogn. Comput. 2022, 6(1), 28; https://doi.org/10.3390/bdcc6010028
Submission received: 30 December 2021
/
Revised: 15 February 2022
/
Accepted: 2 March 2022
/
Published: 7 March 2022
(This article belongs to the Special Issue Virtual Reality, Augmented Reality, and Human-Computer Interaction)
Abstract
:Virtual reality technologies, including head-mounted displays (HMD), can provide benefits to psychological research by combining high degrees of experimental control with improved ecological validity. This is due to the strong feeling of being in the displayed environment (presence) experienced by VR users. As of yet, it is not fully explored how using HMDs impacts basic perceptual tasks, such as object perception. In traditional display setups, the congruency between background environment and object category has been shown to impact response times in object perception tasks. In this study, we investigated whether this well-established effect is comparable when using desktop and HMD devices. In the study, 21 participants used both desktop and HMD setups to perform an object identification task and, subsequently, their subjective presence while experiencing two-distinct virtual environments (a beach and a home environment) was evaluated. Participants were quicker to identify objects in the HMD condition, independent of object-environment congruency, while congruency effects were not impacted. Furthermore, participants reported significantly higher presence in the HMD condition.
1. Introduction
The usage of virtual reality (VR) technologies, such as head-mounted displays (HMD) or projection-based systems, makes it possible to present its users with the virtual equivalents of environments they would encounter in the real world. The more effectively these technologies replace the cues the user expects from the real environment with digital cues, emerging from the virtual environment, the higher the immersion level of the utilized technology [1]. From a VR user’s point of view, this manifests in a strong sense of presence in terms of being there in the virtual environment [2]. At the same time, a more immersive VR technology is thought to allow VR users to react to the computer-generated environment in a manner that is more consistent with their experiences and reactions in an equivalent real world environment [3,4]. These equivalent reactions not only include volitional, conscious acts but also involuntary reactions of the autonomic nervous system, as well as perceptual processes [1].
Substantial research efforts have sought to evaluate the behavioral validity of VR (see, e.g., [5]) and to establish whether VR technologies can consequently be useful in the acquisition of a wide variety of skills (see, e.g., [6]). At the same time, comparatively less attention has been paid to the question, whether well-established perceptual effects also occur in virtual environments and whether their magnitude is impacted by the immersive quality of the utilized technology.
This is of special interest for the study of psychological phenomena, since VR technologies allow researchers to expand classical laboratory experiments into more realistic, ecologically valid environments [7], while still maintaining a high level of experimental control. As Biederman [8] remarked, outside the laboratory context, viewers see objects together with their context or setting. In everyday interactions, these context clues form the basis for expectations about these objects that are consistent with one’s previous experiences. This can result in so called context/object congruency effects on object detection, where objects that fit better into the presented environment tend to be easier to detect (see, e.g., [9]).
While such effects are well-established in a classical laboratory setup, often using static pictures for both the objects and environments, how more immersive VR technologies and the strong sense of presence they induce may impact such context/object congruency effects has not yet been tested. Thus, this study seeks to establish context/object congruency effects on object detection in a VR setup. Furthermore, the current study focuses on the impact of the degree of immersion of the utilized technology on congruency effects by comparing a head-mounted display-based VR presentation of the virtual environment to a desktop monitor-based presentation.
1.1. Effects of Context Congruency on Object Identification and Categorization
Context/object congruency effects, the effects of the congruency between the surrounding scene and the presented test stimulus on several response variables, such as the speed and accuracy of object identification, have been a long-standing topic of research. Congruency had already long been a subject of inquiry, e.g., in linguistic studies with singular words as test items in the wider context of sentences or paragraphs. As an example, Tulving and Gold [10] systematically varied the gained information from the content and the degree of congruency of presented word with pre-exposure contexts. In their study, sentences offered contextual clues (analogous to the environment), and participants were required to guess the target word. The authors concluded that the amount of stimulus information that participants needed varied inversely with the amount of available relevant contextual information.
Such early results led to expectations about congruency effects for object identification in line with Palmer’s [11] statement that an appropriate context should aid identification, while an inappropriate context should hinder it. Palmer [11] showed that a target object was recognized faster when the object was in a congruent context. Similarly, Joubert, Fize, Rousselet, and Fabre-Thorpe [12] demonstrated, in a series of related experiments, that performance in object categorization was impaired due to incongruent contextual information regardless of the particular contexts. Specifically, in their study, context incongruence induced a 10% drop of correct categorizations and a 16 ms increase in median reaction times. Such effects of congruence have also been shown to differ from simple effects of object identifiability in the distribution of the N300 component [13].
Context/object congruency effects seem to effect humans across population groups and even monkeys [14]. As an example, a study by Rémy et al. [9] compared participants in four different age groups (20–30 years of age, 45–55 years, 60–75 years, and >75 years). In this study, participants were presented with either “natural” or “man-made scenes”, where the response objects were either animals or pieces of furniture. Thus, test objects were either embedded in a congruent or incongruent context. Independent of age groups, the participant’s categorization performance, both in terms of accuracy and speed, was negatively affected when the objects were seen in an incongruent vs. a congruent context, with the oldest participants being particularly susceptible.
In studying context congruency effects, these classical laboratory studies typically present stimuli and environment as, e.g., pictures or photographs (e.g., [9,14]). More immersive VR technologies, on the other hand, can present environments while inducing a strong subjective feeling presence of being there in the virtual environment [4].
1.2. Effects of Immersion and Presence
An enduring debate in the presence literature concerns the so-called book problem: the question why even low immersive media, such as books, seemingly give rise to presence-like phenomena [15]. Consequently, it has been debated whether the subjective feeling of being transported to the world a reader encounters while reading a book is, at a fundamental level, the same phenomenon VR users encounter in a virtual environment [16]. The exact boundaries of the presence phenomenon’s domain are not clear a priori, i.e., it is not clear whether reading, watching a movie, viewing 360° experiences, or interacting in a virtual environment all lead to fundamentally the same type of subjective feeling of being there. Some would argue that even the static pictures of environments used in previous experiments have induced a certain sense of presence.
However, while Schubert and Crusius [17] have cautioned that the subjective feeling of presence that VR users experience is not only a direct function of the immersive properties of the VR technologies they utilize, empirically, the use of higher immersive technologies tends to lead to more pronounced reported levels of presence, e.g., when comparing desktop setups to HMD-based VR [18,19,20,21]. It has also been shown that using VR technologies can have a systematic impact on vision-based perceptual tasks, such as distance estimation, where VR users tend to underestimate distance in a virtual environment [22,23,24,25]. There are further indications that individual subjective reactions to the presented virtual world, such as the degree to which the VR user feels like they embody their VR avatar, can impact such an effect [26].
In the context of object identification, the VR user’s subjective reaction to the presented virtual environment, the feeling of being present therein and not only seeing it as if they were a picture, may be of interest. There are indications that a more pronounced sense of presence may lead to a different method of processing the environment, leading to a higher recall of the presented information [27,28,29,30], although the exact relationship between recall and presence is debated (compare [31]). This stronger feeling of presence, if it leads the VR user to process the presented environment differently, might potentially attenuate the effect of context/object congruency. To the best of our knowledge, no study to date has tested this possibility.
1.3. Practical Implications of Effects of Context Congruency in VR
The existence of context/object congruency effects for virtual objects and environments would have implications both for their further scientific study and for the usage of virtual environments in applications such as VR training. For researchers, the possibility of using virtual environments and objects to study how congruency impacts human perception and performance would offer advantages over more commonly used picture or video stimuli [9,14]. Here, the increased ecological validity of the explorable environments [7] would be more in line with our everyday experience [8], while the high degree of control over the virtual environments would provide researchers with a cost-effective method to rapidly present and change objects and environments in their studies. For more practical applications, congruency effects can affect performance through object recognition in both its response times and accuracy [9,12], as well as the quality of retained information and the number of errors during recollection [32]. For VR training purposes, the existence of context congruency effects could, therefore, indicate that beyond the objects the trainee interacts with, the surrounding environment and their fit with task relevant objects should be taken into account. Further implications may be observed in the design of ubiquitous computing applications [33], where user performance may be optimized if the context in which human–machine interaction takes place is considered.
Thus, in the current study, the following was hypothesized: (1) Usage of a higher immersive VR technology (HMD compared to a desktop setup) will lead to more pronounced feelings of presence; (2) Context/object congruency effects can be shown in both desktop and HMD presentation conditions; (3) Context/object effects are more pronounced in HMD compared with desktop conditions.
2. Methods
The study at hand was performed in accordance with the Declaration of Helsinki and its latest amendments. Participants provided written informed consent for their participation and received a financial compensation for their participation.
2.1. Prestudies for the Development of the Experiment Environments
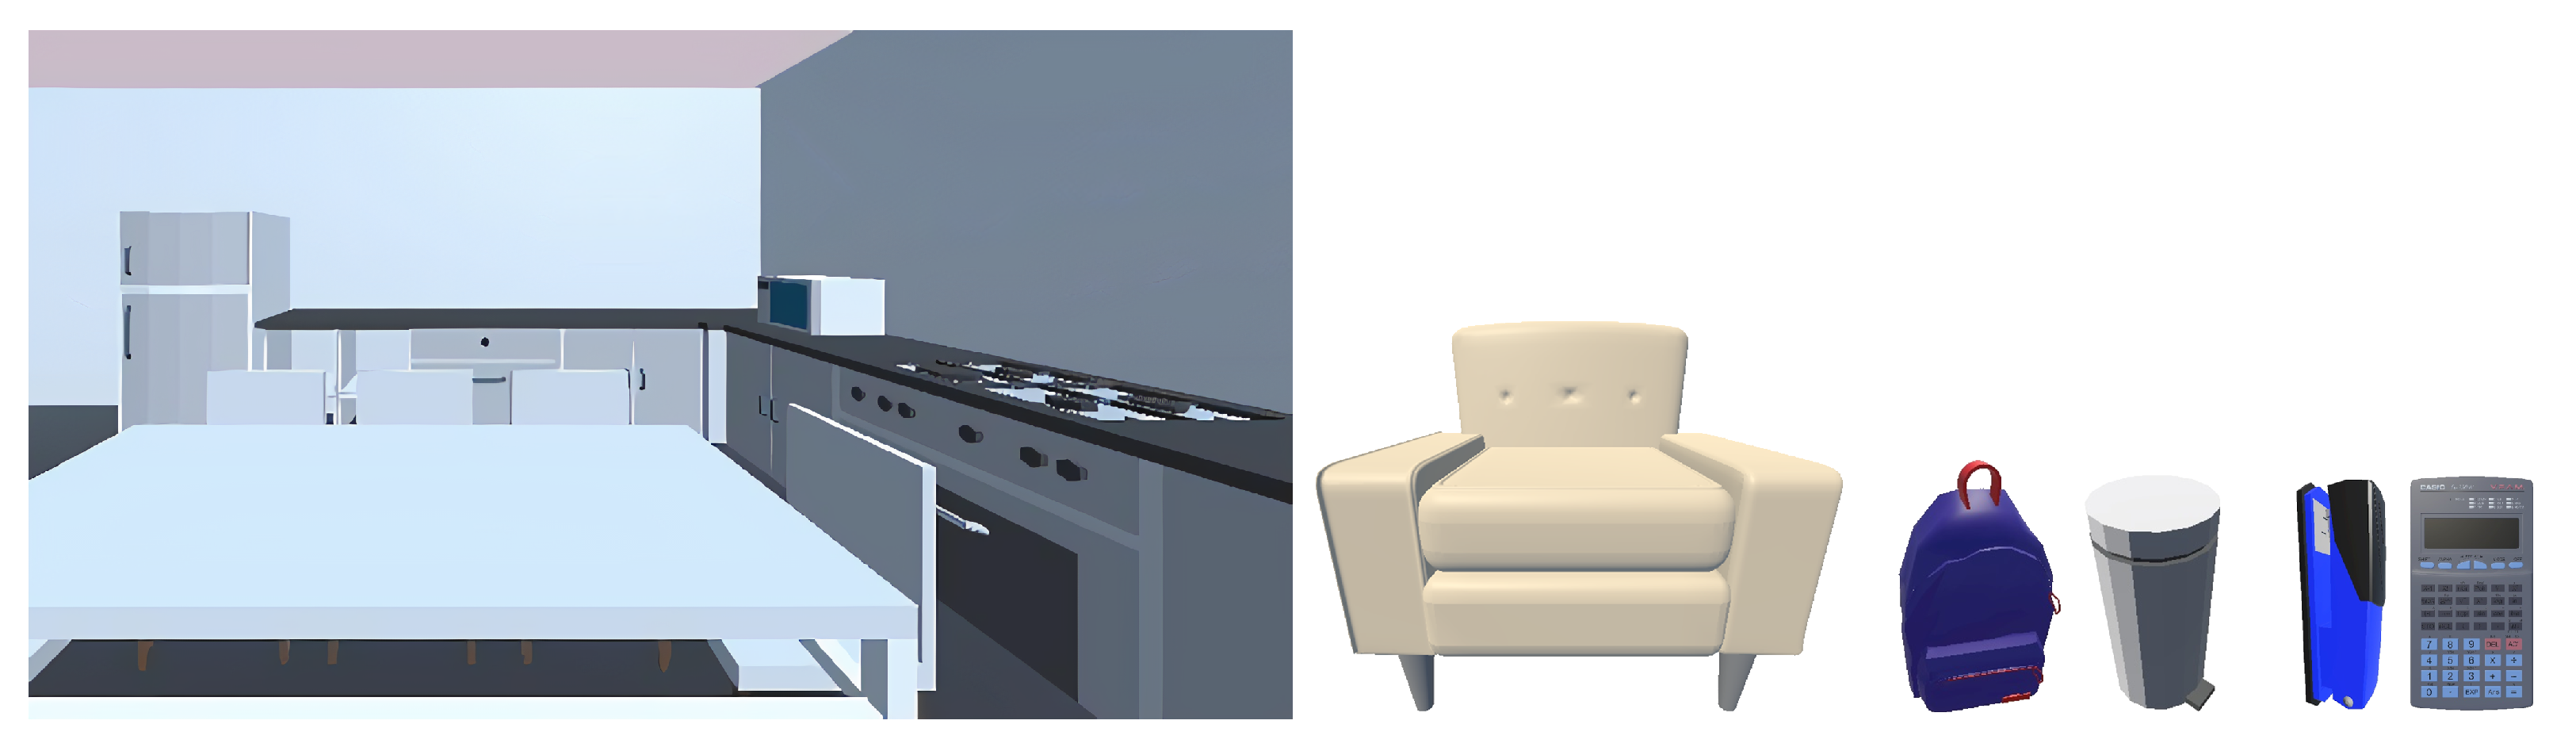
For the purposes of the current study, two virtual environments, a home environment and a beach virtual environment, were developed for usage in both the desktop display and in head-mounted display conditions. Two prestudies were conducted to evaluate the environments and objects utilized in the study. Both took the form of online surveys, with adult participants being recruited via mailing lists both from the University of Kaiserslautern and the Fraunhofer ITWM institute. The first survey-based prestudy was conducted to confirm that the constructed environments were consistently identified as the proposed home and beach environments. For both environments appropriate objects were needed, which were identified in the second survey based prestudy. For this purpose, an online survey was used to identify such items in a pool of 50 objects by classifying them as either one of three cases: belonging to the home environment, belonging to the beach environment, or without clear association with either environment (disparate or not belonging to either environment answers). Then, we created both virtual environments using the results of this survey. In the following subsections, first we provide details of the conducted survey and then about both environments. Figure 1 shows the 3D home environment with the corresponding experiment 3D objects, while Figure 2 shows the 3D beach environment with the corresponding experiment 3D objects.
2.1.1. Survey for the Design of the Experimental Environments (Home and Beach)
The colored 3D beach and home environments to be used in the experiment were created using Unity (Unity: https://unity3d.com/, (accessed on 14 February 2022)) (version 5.5), which is a development platform for building 2D and 3D environments for mobile, desktop, and VR/AR setups. We chose Unity as a development platform due to its compatibility to work with all popular VR platforms (e.g., Oculus, OpenVR, Google VR, etc.) (https://docs.unity3d.com/560/Documentation/Manual/VRDevices.html (accessed on 14 February 2022)) and the availability of a wide range of VR plugins. This made it easy for us to design and build the underlying VR environments in the experiment and execute it with available VR tools and devices. For both environments, five screenshots were taken that showed all different parts of the environments. Via an online survey implemented in Google Forms, nine participants (5 male and 4 female; average age: 24.2 years) rated all ten screenshots, with five pertaining to the beach and five pertaining to the home environment. The participants were shown each screenshot and were asked which of the listed environment types best fit the screenshot they were seeing. They were then given ten response options in a random order, which included Beach, Factory, Home, Nightclub, Office, Park, Restaurant, Shop, Street, and a rest category where they could type in another answer. The response of home was the most prevalent answer to home screenshots and the response beach was the most prevalent answer to beach screenshots. Across five screenshots per environment type, the beach environment was chosen as the most fitting answer in 85% of all answers to beach environment screenshots by the nine raters (between 67% and 100% in individual screenshots), while 93% of all answers in response to home environment screenshots named home as the best fitting environment type (between 78% and 100% in individual screenshots.
2.1.2. Survey for the Selection of Both Environments’ Objects
First, a pool of 50 colored 3D objects was collected from three online resources ((a) https://archive3d.net, (accessed on 15 April 2017); (b) https://www.turbosquid.com, (accessed on 15 April 2017); (c) http://3dmdb.com, (accessed on 15 April 2017)) for use in the online survey. These colored 3D objects were selected with a view on their possible association with either of the targeted virtual environments. The objects were also categorized into three categories with respect to their size (small, medium, and large). An online questionnaire survey (using Google Forms) was created where respondents were asked to provide their subjective judgments about the environment where they would expect to encounter these objects. Due to the high number of objects, they were further divided them into two pools. Therefore, two surveys were used instead of one long, more time consuming one so that respondents would not lose interest over time. The survey links were distributed through several different sources, i.e., on a university website board, via email lists of the research institute and on social media. In total, 56 individual responses were collected, where 33 respondents completed survey 1 and 23 respondents completed survey 2. In the beginning of each survey, participants were asked questions about sociodemographic characteristics, such as age (first group: 15 respondents were in the 18–25 age group, 14 were in the 26–30 age group, while 4 were in the above 30 age group; second group: 13 respondents were in the 18–25 age group, 7 were in the 26–30 age group, while 3 were in the above 30 age group) and gender (first group: 9 females, 23 males, and 1 other; second group: 10 females and 13 males), to understand respondent profiles.
For each object, respondents were asked to rate three statements about the underlying objects using a scale with response options ranging from 1 to 5, with an additional option for statement 2, while statement 3 was rated on two response items:
- How familiar are you with “object type X” such as the one pictured above?(scale: 1 for unfamiliar to 5 for familiar);
- To what extent, do you expect to see this “object X” in a living room or on a beach (or neither of them)?(scale: 1 for room to 5 for beach, and an extra option for “Neither of them”);
- What number on this rating scale best describes your emotional response to this “object X”?Response 1: (scale: 1 for calm to 5 for excited)Response 2: (scale: 1 for negative feelings to 5 for positive feelings).
2.1.3. Survey Results Analysis
During the analysis of the gathered data, first, the collected 56 responses for environment expectancy were fed into a K-means [34] clustering algorithm (in SPSS 24) to find groups (or clusters) of similar objects among the list of 50 underlying objects. The algorithm was fixed to find only three clusters in the dataset indicating home, beach, and no-category objects. The K-means algorithm was set to run 20 iterations or until the error rate was 0 with a running mean. During clustering analysis, the K-means algorithm was set to make pairwise deletions in cases of missing values and in cases where respondents skipped questions.
The raw clustering results did not include any semantic weighting, but they could be interpreted as beach objects if they are in cluster 1, home objects if they are in cluster 2, and unclear category objects if they are in cluster 3. Finally, we obtained the following objects in each of these three objects categories:
- Beach: beach ball, flip-flops, ship wheel, folding chair, cocktail, plastic shovel, volleyball, surfboard, hat, life preserver ring, sunglasses, menu stand, plastic bucket, and frisbee;
- Home: backgammon, backpack, book, calculator, lamp, mobile phone, stapler, present box, coffee machine, painting, projector, plant, sofa, trash box, chess board, pen, clock, globe, and fruit bowl;
- No-category: crown, dynamite, rooster, safety helmet, traffic barrel, traffic light, fire hydrant, skeleton, security camera, telescope, hockey stick, beer tap, and skateboard.
The no-category objects were discarded from the experiment because they fit neither clearly to a beach nor to a home environment. Final sets of items were chosen for the beach and home environments; thus, they had equal numbers of items in the three size categories.
3. Main User Study
A user study with 21 participants was conducted where participants experienced both environments (home and beach) in two display conditions (desktop display and HMD). In the following subsections, more details about the main study’s design and procedure is provided.
3.1. Study Goals and Aims
In the current study, two areas of psychological research were combined, i.e., visual perception research (by replicating context/object congruency effects) and immersion/presence research (by comparing display setups). Based on the established consensus in visual perception research, the congruency of the background scene and the test object should affect accuracy and reaction time of object perception in tasks such as object recognition or object categorization [9,11,12,13,14]. Specifically, when the object and the background environments are consistent, response time decreases and accuracy increases compared to inconsistent conditions. Accordingly, the goal of the study was to see whether these contextual congruency effect would be replicated using both HMD and desktop setups.
Additionally, the aim was also to see whether the subjective feeling of being present in the environment would be affected by the display device type used to present the virtual environment to the user. Slater et al. [1,35] translated more immersion as providing perceptual cues more in line with expectations from real world equivalent environments, which would be thought to lead to more presence in higher immersive setups [18,19,20,21]. In addition, it has been shown that the usage of virtual reality technologies can also lead to other effects, such as symptoms akin to motion sickness [36,37] that can affect behavior and evaluations of virtual reality users [38,39]. As such, it was also documented whether the display conditions differed in the severity of induced simulator sickness symptoms and in the alertness level of the participants.
By combining the above-mentioned two phenomena, the last aim of the study was to explore if the proposed stronger feelings of presence in the higher immersion condition (HMD) could result instronger context/object congruency effects by considering a higher order interaction between immersion level, environment type, and object type in the analysis of response times in an object identification task.
Based on the study’s goals and aims, the following hypotheses were investigated:
Hypothesis 1.
Usage of a higher immersive VR technology (HMD compared to a desktop setup) will lead to more pronounced feelings of presence;
Hypothesis 2.
Context/object congruency effects can be shown across display conditions (desktop and HMD presentation conditions). Faster response times are expected when scene and object category are congruent compared to incongruent environment/object combinations;
Hypothesis 3.
Context/object effects are more pronounced in HMD compared with desktop conditions.
3.2. Participants
A total of 21 participants (7 females and 14 males) completed the study. All participants were students from the University of Kaiserslautern and ranged in age from 21 to 30 years (mean = 24.3 years; SD = 2.87 years). This represented a convenience sample with participant acquisition conducted via mailing lists and individual recommendations by previous participants. The sample contained bachelor, master, and PhD students. All participants declared that they had normal or corrected to normal visual acuity and stereo vision ability. Due to the usage of VR display devices, an additional exclusion criterion included any history of seizure related diseases.
3.3. Experimental Setup: Apparatus
Two different display devices (i.e., an HMD and a desktop monitor) were used to present the two different virtual environments that were designed and tested in the prestudies (either the home or beach environment). The utilized HMD was an Oculus Rift DK2 with a display strapped to the participant’s head, which uses an internal gyroscope to track head movements and update the presented environment accordingly, as well as an external sensor to register positional changes, e.g., leaning behavior. The Oculus Rift DK2 had a 100° Field-of-View on an embedded display that is “halved” with a separator to display a shifted image for each eye at a resolution of 960 × 1080 per eye. The refresh rate was adjusted to 60 Hz to match with the desktop monitor. The desktop monitor was a full HD (1920 × 1080 pixels) Liyama 22 (16:10) (width: 47 cm, height: 30 cm, diagonal: 56 cm) widescreen monitor with a refresh rate of 60Hz.
Participants were providing responses using two Razer Hydra joysticks (one for left hand and one for right hand). They had neither access nor the need to use the regular computer keyboard or mouse setup. They only needed to navigate both environments and to provide responses to items by using the right or left joysticks. The Razer Hydra has a joystick with sub-10 ms latency according to its manufacturer, but it also registers movements of the hand, although with potentially higher latencies in the case of physical hand movements. However, in the current study, physical hand movements were not important for the experimental tasks. In HMD conditions, there were two possible methods to turn to one’s side: via bodily movements, i.e., turning one’s head or entire body to make a turn, or via the joysticks on the controllers, which could be used to rotate the virtual world around its vertical axis. In the case of the desktop monitor, the only way to turn to one’s side was to use the joystick. In either display conditions, participants could press the joystick forward or backward to move forward or backward relative to the direction they were facing (gaze-directed steering).
3.4. Experiment Procedure and Task Execution
At the beginning of experiment, participants were first verbally and in a written form informed about the general purpose, experimental procedure, possible health risks (e.g., simulator sickness due to HMD usage), and potential benefits (e.g., the possibility of experiencing a virtual environment with HMD) of the study. All participants signed an informed consent form and were provided with sufficient time to read and consider whether to participate in the study or not. To assess and evaluate the sample, participants completed a sociodemographic questionnaire prior engaging in the experimental tasks. The questions were related to sociodemographic factors such as age, sex, handedness, education level, and past experience with different display devices (e.g., average hours playing games, average hours using computer, and past virtual reality experience).
After signing the consent form and completing the sociodemographic questionnaire, participants started the experiment. The order of device type (HMD or desktop) and encountered environment (home or beach) were listwise randomized for each participant. Each combination of immersion level and environment type had the same chance of being tested first. When participants first encountered an HMD, participants were shown how to wear and adjust the HMD to a comfortable position and completed an procedure. In the case of the desktop condition, the chair was placed at a predefined distance for a comfortable siting position. After these arrangements, participants began with the first allocated environment and went through the instructions. These instructions were repeated as the initial steps in each environment and included two practice trials. Participants were instructed to respond as fast and accurate as possible to the test items. At the end of the instructions, they were given the opportunity to ask questions to the experimenter if needed; otherwise, they began to explore the underlying virtual environment by pressing a button on joystick.
Task Execution
Each participant completed a total of four parts of the experiment, i.e., all combinations of the two display devices (immersion levels, HMD, and desktop) and the two environments (home and beach). During the experiment, participants switched back and forth between HMD and the desktop monitor with short five minute breaks in between each combination. Before the start of any task, participants were given two minutes to freely explore the environment with a timer shown on screen. This exploration phase was meant to help the participants feel like they were inside the environment and to increase the feeling of presence for the purpose of contextual congruency effects. The navigation procedure in both environments (home and beach) was based on a task stemming from a pre-exisiting experiment conducted by Bowman et al. [40], where the authors presented a navigation task with an HMD.
In the main test phase of each environment (home or beach), there were four locations with each location further divided into two subparts. Participants first saw a red ball (see Figure 3a), which they needed to adjust to the center of their view and then the joystick button (on the controller in their hand) was pressed to indicate that they had achieved this. The aim of the red ball was to ensure that all participants viewed the objects from the same angle. Afterwards, a fixation cross appeared in the same location for two seconds (see Figure 3b). Then, an object was presented to the fovea for 48/96 or 144 milliseconds randomly (see Figure 3c). The presentation time was varied to test the participants on different levels of presentation times and to minimize the possible response priming effects in response times and error rates. Presentation times were matched across object categories and across all combinations of immersion level and environment type. Afterward, at the same location, three objects appeared (peripheral up, and to the left and right sides of where the objects had been earlier) to show options for which object had just briefly been presented. The object’s size variable was used to match the size of the choice array’s objects, i.e., to make sure that an object did not pop out because of being smaller or bigger in size amongst the other options. These options remained on screen for two seconds or until the participant provided a response (see Figure 3d).
Participants were required to recognize and select the object as soon as possible by moving the controller’s joystick of their dominant hand to the direction that showed the object that had previously been presented. They had only one chance to make the selection. When the selection was made, a blue bar appeared on the side of the selection indicating which object was selected as a response. If two seconds had elapsed and no answer had been given, then the trial was tagged as “No answer”, and was removed during the later data analysis. After completing the current test location, participants moved to next test location. For each environment in a particular setup, participants were presented with 192 trials containing an equal number of beach and home objects.
After completing an environment, pen and paper-based questionnaires were provided to the participant to document their experiences of the environment and display setup. The questionnaire set consisted of a presence questionnaire, a simulator sickness questionnaire, and a sleepiness questionnaire. For the presence questionnaire, the Slater-Usoh-Steed Questionnaire (SUS) proposed by Usoh et al. [41] was used. It consists of six items that were rated on a scale ranging from 1 to 7, with a higher score indicating greater presence. For the assessment of simulator sickness symptom severity, the Fast Motion Sickness (FMS) proposed by Keshavarz and Hecht [36] was used. This is a single item questionnaire that assessed overall symptoms, with responses ranging from 0 (no sickness at all) to 20 (frank sickness). Participants were informed to focus on nausea, general discomfort, and stomach problems while answering this questionnaire and less on other experiences such as boredom. For alertness, the Karolinska Sleepiness Questionnaire (KSS) proposed by Akerstedt and Gillberg [42] was used. This also comprised a single statement with responses in a range from 1 to 9, where lower scores indicated more alertness. The questionnaire filling period after each environment and display device combination took approximately two minutes of a five minute break per set. After completing the experiment, participants were asked if they wanted to be given a more detailed explanation of the study’s research aims. In total, an entire experiment took around 70–90 min for each participant.
3.5. Metrics
Each participant tested all four combinations of immersion level and environment type, i.e., two environments on two display setups in a list-wise predefined randomized order. The display device, the background environment, and the object category were manipulated. The following dependent variables were seen as a focus:
- Self-report questionnaires: During the experiment, after completing each set, participants were asked to complete a Presence Questionnaire (SUS), a Simulator Sickness Questionnaire (FMS), and a Alertness Questionnaire (KSS).
- Response time during task performance: Response time with the Razer Hydra controller’s joystick was considered.
4. Data Analysis Process
All analyses were conducted in R, version 3.2.3 using the lme4 package [43]. For data resulting from the presence questionnaire (SUS), participants rated six different questions regarding presence and the scores were calculated through counting six or seven scores in each questionnaire, as proposed by Usoh et al. [41]. To test whether the display device had an overall effect on presence values, a Generalized Linear Model in R was fit to the data for significance testing. In order to decide the appropriate distribution between the most likely candidates, the Poisson and the negative binomial distribution rootograms were taken into account. In accordance with Hypothesis 1, the model was built with a fixed effect for the immersion level, i.e., by comparing desktop and HMD conditions.
In the case of simulator sickness questionnaire (FMS), a generalized mixed model with gamma distribution was selected rather than the one-way factorial ANOVA proposed by Keshavarz and Hecht [36]. This approach was chosen because it was expected that the symptom severity ratings would skew to the right with most of answers on the lower ratings, as the factors causing sickness were minimal. Here, again, a comparison between display devices was considered to document any potential differences in simulator sickness across immersion levels.
In the case of the alertness questionnaire (KSS), a model comparison was chosen instead of the Friedman ANOVA proposed by Akerstedt and Gillberg [42]. This approach was deemed appropriate in order to evaluate and take the distribution of the data into account (while considering a potential normal distribution and a gamma distribution). Again, the display device was conceptualized as a fixed factor to document possible differences between display devices.
Response times were analyzed with several generalized mixed-effects regression models. In accordance with the literature, continuous unimodal skewed distributions with positive potential values, i.e., Gamma or inverse Gaussian distributions, were considered for reaction time analyses [39,44]. To see the differences between response times caused by independent variables, several models were compared using likelihood-ratio tests and Akaike Information criteria (AIC) to find models that showed a better balance between data fit to the response time data and model complexity. By stepwise additions of the effects of interest and conducting model comparisons between models that only differ in the added variable, the question of which of the two models shows a better balance between data fit and model complexity can be examined. First, a null model was fitted to the response time data. Then, in a second model, the effects of the object category and the environment type were added. To evaluate congruency effects across immersion levels, the interaction effect between object category and environment type was added in the next model. Afterwards, the difference between the display devices was considered. The fourth model added a main effect of the immersion level. This meant that it included main effects of object category, background environment, and display device, as well as the two-way interaction between object category and background environment. Finally, the last model further added a three-way interaction involving the display device, object category, and background environment to see if the display device affects contextual cueing. All models utilized per participant involved random effect structures.
4.1. Subjective Questionnaire Results
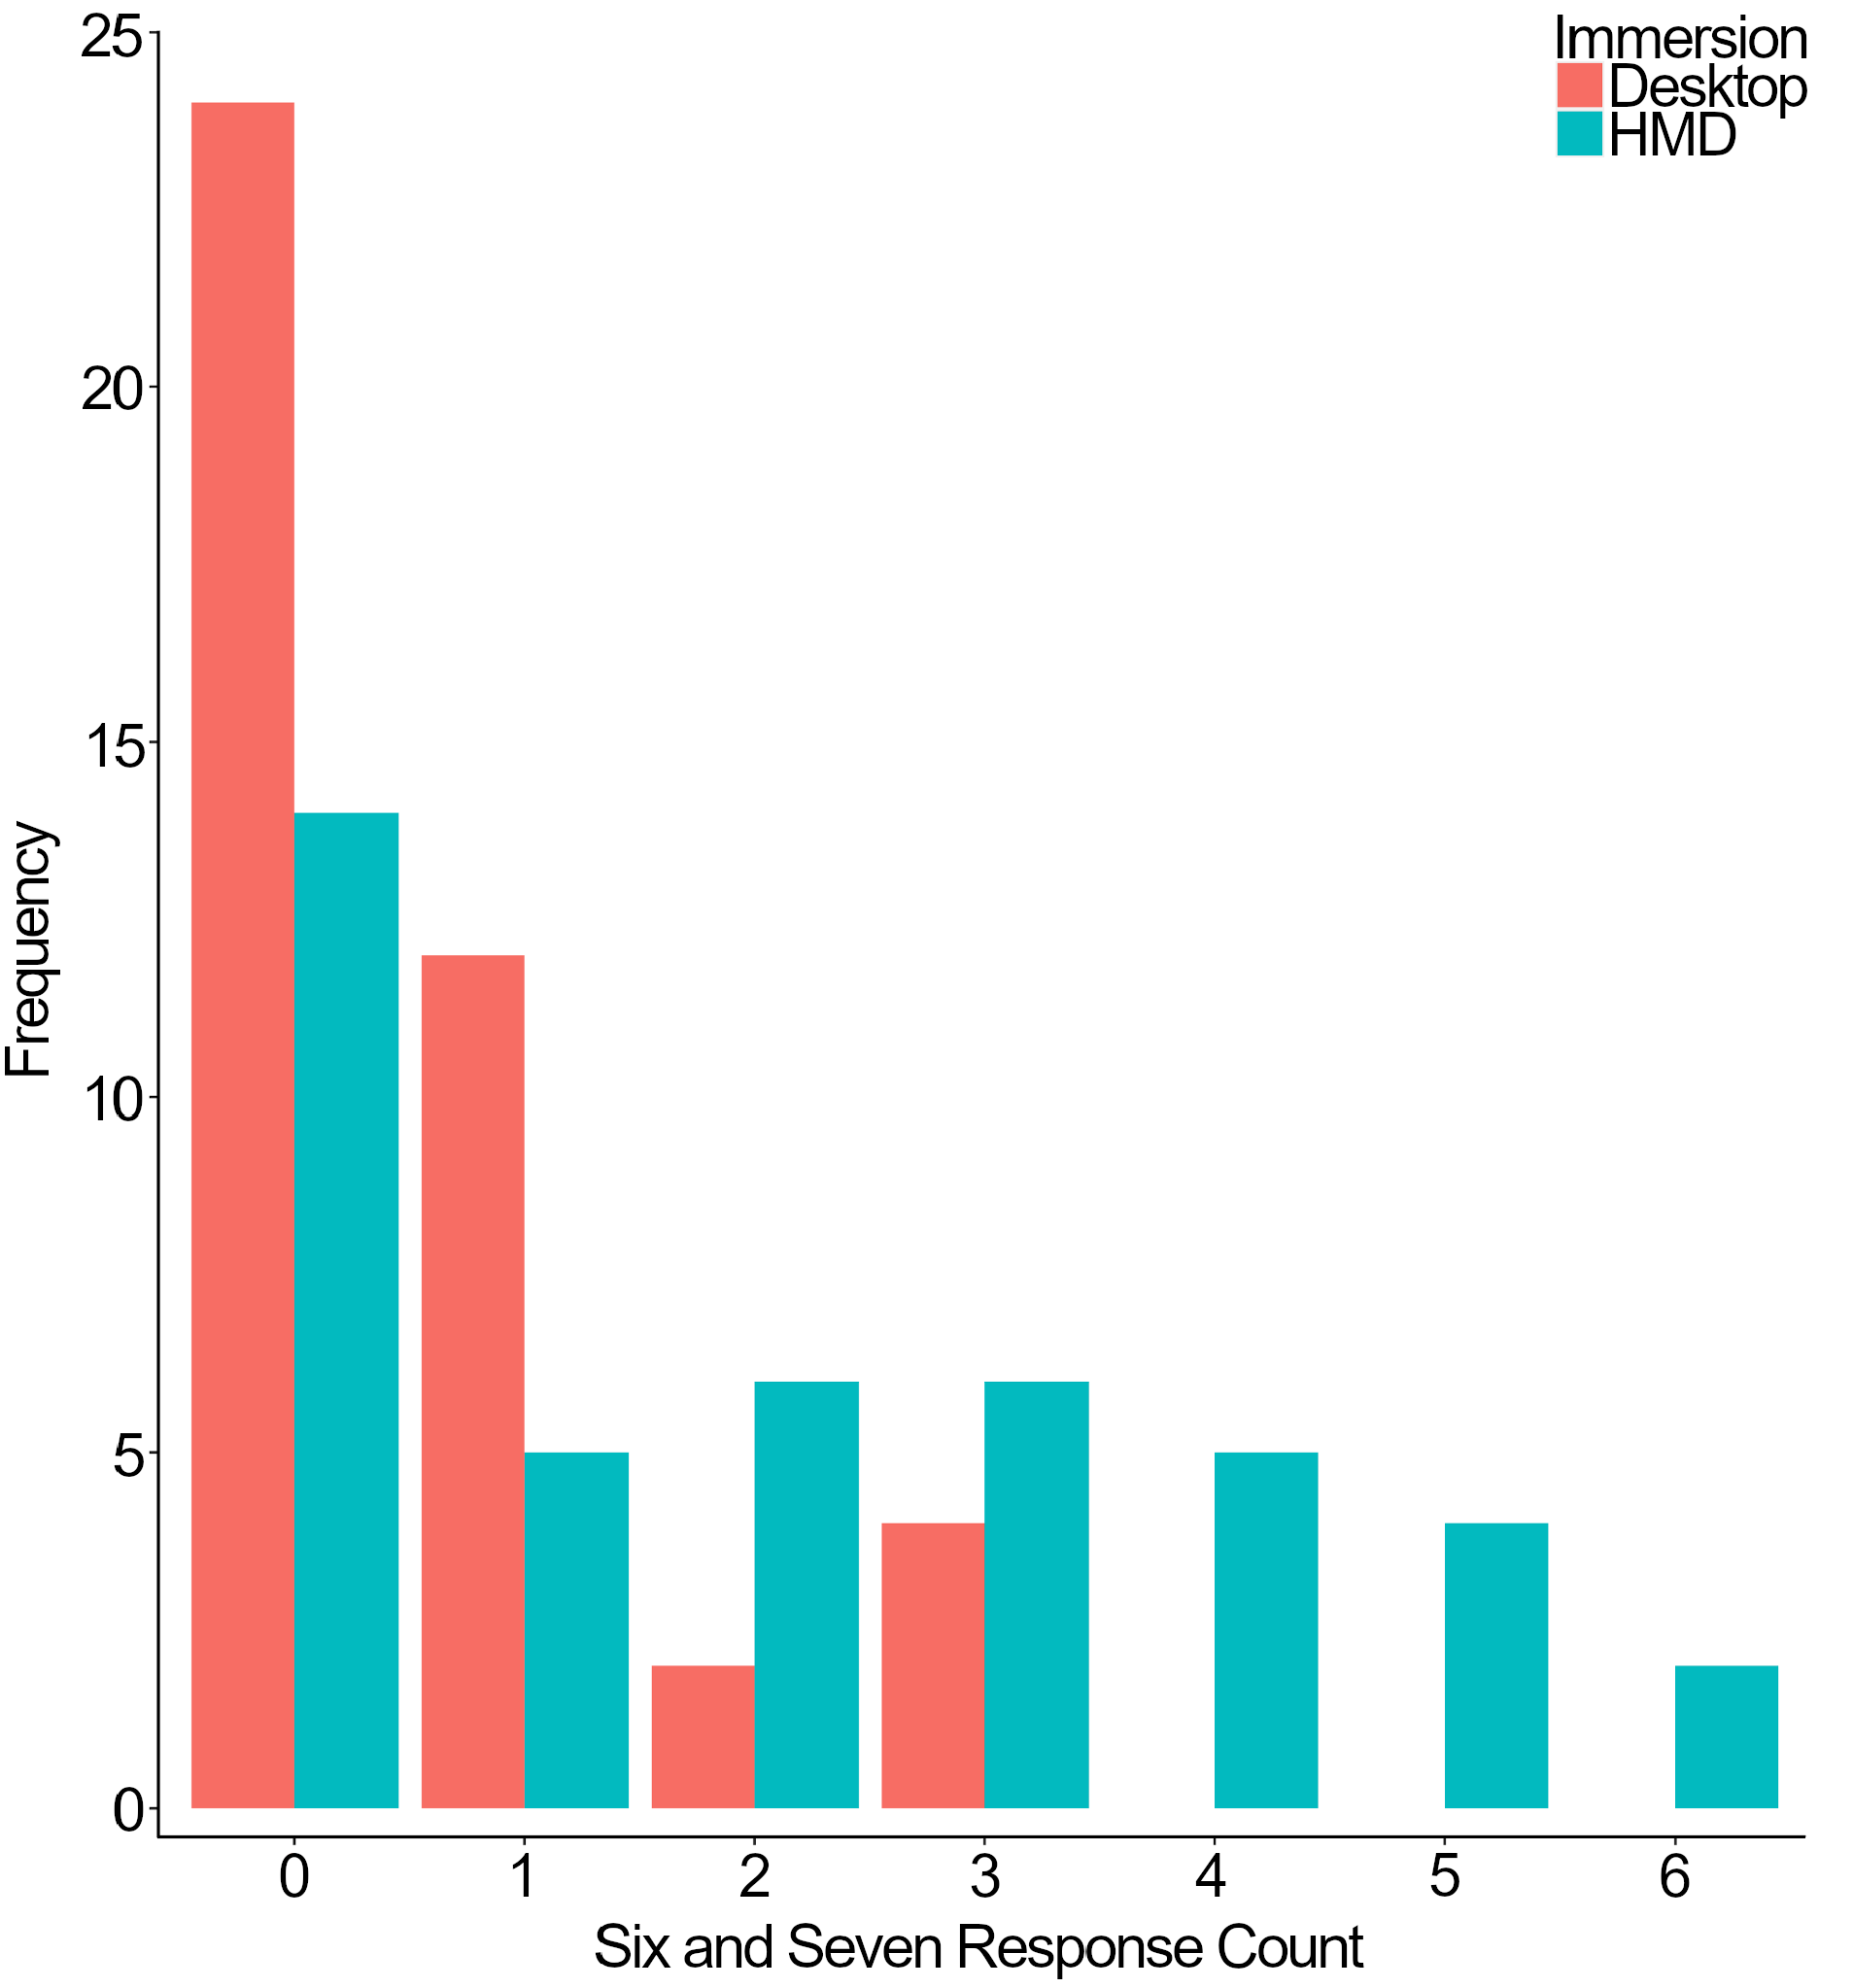
According to Hypothesis 1, which involves higher immersion, here, the HMD-based VR technology was expected to lead to increased feelings of presence. The collected presence questionnaire (SUS) responses were analyzed by fitting a Generalized Linear Model in R. Figure 4 shows rootogram outputs of the two compared models with regards to their AIC values. The model in Figure 4a used a Poisson distribution to fit data and had an AIC value of 305, while the model in Figure 4b fitted a negative binomial distribution and had an AIC value of 292. This indicates that the later model was preferable and was therefore select for further analyses. Figure 5 shows a bar chart of the raw data of the number of “six and seven” response counts in the six questions of the SUS questionnaire. The average count was 2.02 in desktop conditions and 3.30 under HMD conditions. It may be noted that there are no participants who rated 6 and 7 in more than three questions after experiencing the desktop display condition. The fixed effect of the display condition on the expression of strong presence feelings was significant in the negative binomial model ( = −0.81, SE = 0.24, p = 0.001).
Figure 6 shows the collected answers about symptom severity in the fast motion sickness scale (FMS) while comparing the two immersion levels. The FMS has a response range from 0 (no sickness at all) to 20 (frank sickness); however, the maximum given answer was 10 (overall mean = 2.9, desktop = 2.6, and HMD = 3.1). Based on the statistical tests, by fitting a Generalized Linear Model with a gamma distribution, the fixed effect of display device ( = −0.15, SE = 0.05, p = 0.009) had a significant effect on the subjective reports of simulator sickness severity.
Figure 7 shows the distribution of alertness responses (KSS) when comparing display setups. While the entire range of response options from one (extremely alert) to nine (extremely sleepy, fighting sleep) was used, it may be noted that the two answer categories indicating the highest alertness were only found after experiencing HMD conditions (overall mean = 6.1; desktop = 6.7; HMD = 5.6). The fitted Generalized Linear Model with a Gaussian distribution showed a significant fixed effect of display device ( = −0.03, SE = 0.01, p < 0.001) on the subjective reports of alertness.
4.2. Task Performance Results
Task performance was analyzed with generalized mixed-effects regression models. The distribution of response times was best described using a Gamma distribution (right skewed) with the shape parameter and the scale/rate parameter . In Figure 8, the distribution of response time data collected from all participants is reported by using a histogram (at a bin size of 0.1 s intervals). To evaluate the existence of congruency presence effects in response time data, the comparison of different Mixed-Effect models was used. The initial null model, which includes only a random global intercept for “participants”, was compared against the model including background environment and object category. The Chi-Square test between these models was significant, (2) = 27.56, p < 0.001. The AIC value of the null model was −17,431 and −17,455 for the later model. Adding the interaction effect of object category and environment type resulted in a model with an AIC value of −17,453. The model comparison to the model with only the related main effects did not reach significance, (2) = 0.00, p = 0.9762.
Effects of Immersion on Response Times
To evaluate the effects of the immersion level, Figure 9 shows the distribution of reaction times for each of the 21 participants by comparing HMD and desktop conditions using Box and Whisker diagrams.
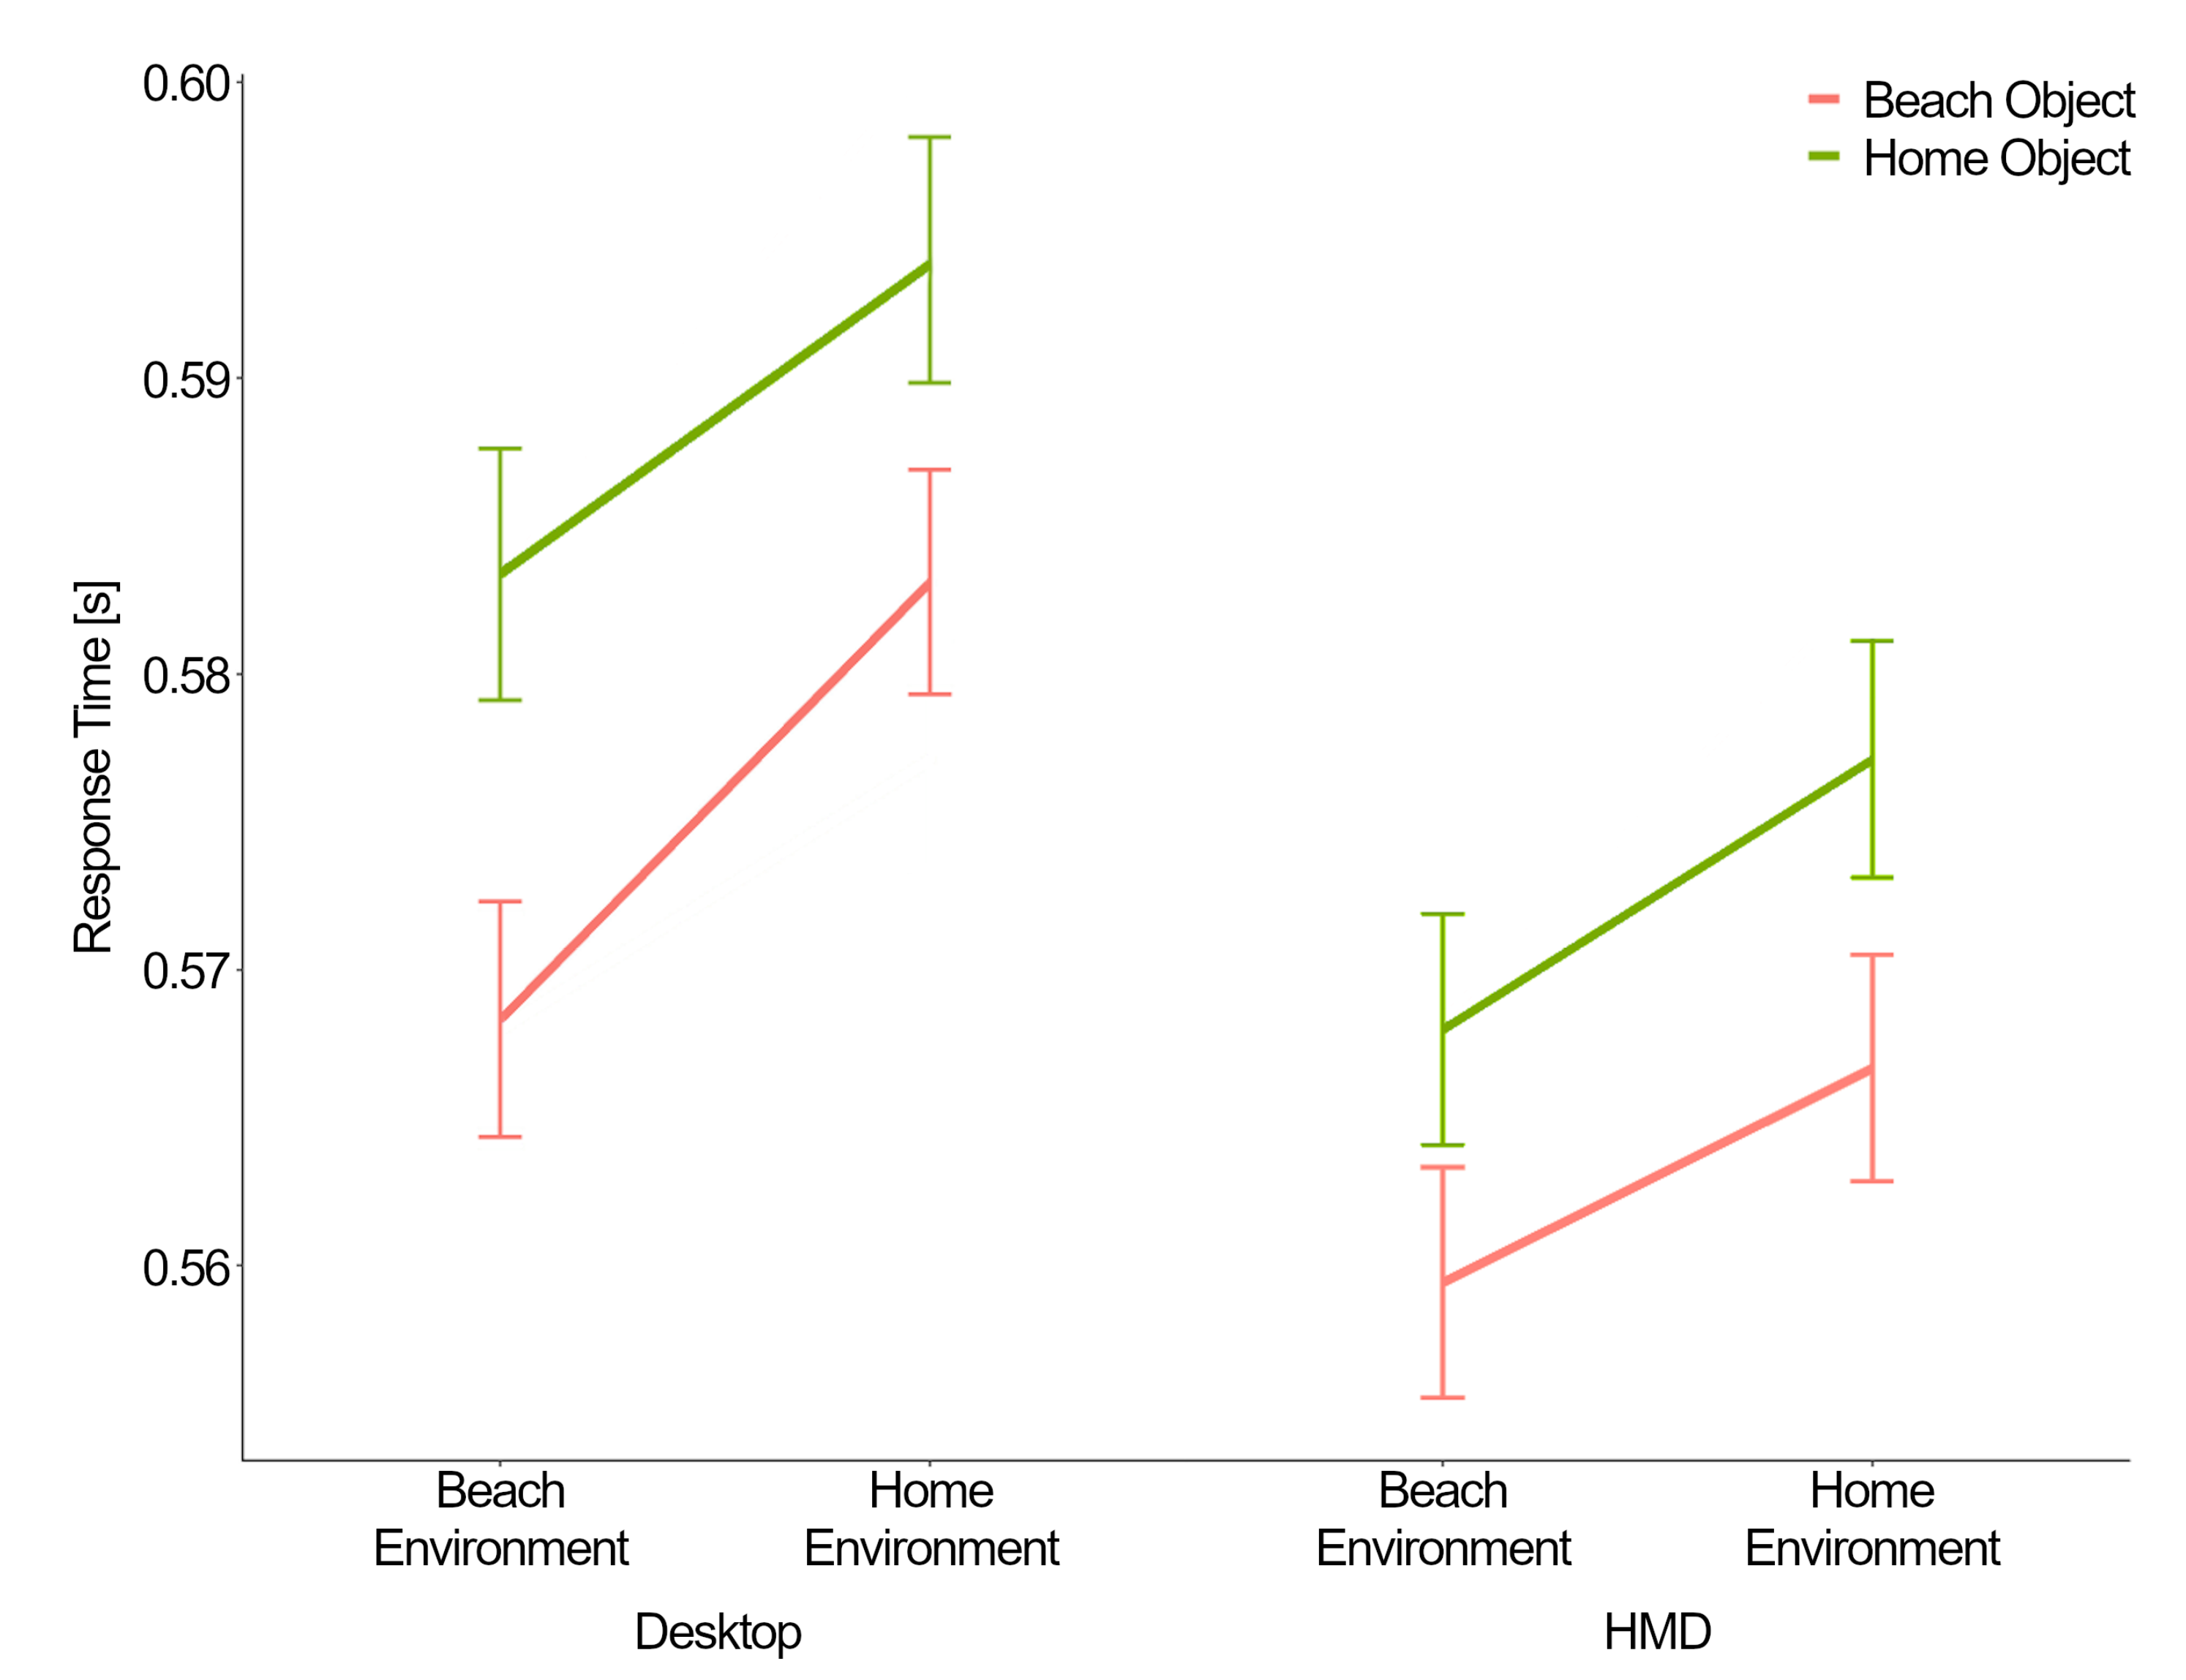
This effect was tested using model comparisons. The model with effects relating to the object and environment categories and their interaction was compared to a model that additionally included a main effect of the immersion level, comparing the display devices, as another fixed factor. Moreover, the model considers that each participant may have reacted to the different display devices differently through a random slope. A comparison of the models via a likelihood ratio tests showed a significant difference, (3) = 251.04, p < 0.001, with an AIC value of −17,453 for the former model and −17,698 for the later model with an effect of immersion. Potential effects of immersion levels on congruency effects are shown in Figure 10 by displaying potential interaction effects between test object category and the environments on response time separately for each display device.
A comparison between the previous model (AIC = −17,698) and a model that only added the 3-way interaction effect between immersion level, test object category, and environment type (AIC = −17,694) showed no significant improvement in the predictions of the model by adding this higher order interaction, (3) = 2.627, p = 0.453. Thus, the model that did not include the three-way interaction showed the best balance between data fit and model complexity. In this model, the effect of higher immersion level was predicted to result in a decrease in response time ( = −0.043, SE = 0.031), while environment type tended to lead to lowered response times in the beach environment compared to the home environment ( = 0.033, SE = 0.009). Lastly, regarding object category, beach type objects tended to lead to lower response times in item identification than home type items ( = 0.014, SE = 0.009).
5. Discussion
The study at hand sought to evaluate the impact of the display technology’s immersion level [1] on context/object congruency effects in item identification. For this purpose, two different environments, a beach and a home environment, were constructed. In the first survey prestudy, the constructed environments were shown to be identifiable as the intended environments. For these two environment types, groups of objects that were clearly associated with either environments were identified based on a survey prestudy. While previous studies often presented both objects and their context in pictorial form [9,14], the current study presented explorable environments either via a desktop monitor setup (low immersion) or via an HMD-based VR (high immersion). It was postulated that HMD-based VR would induce more pronounced feelings of presence in the virtual environments than the low immersion condition. Consequently, gains in object identification from objects appearing in an environment that they are typically expected to be found in were hypothesized to be larger in the high immersion group.
5.1. Individual Reactions to Different Immersion Levels
In accordance with Hypothesis 1, it could be shown that HMD-based VR resulted in a higher frequency of high presence reports on the SUS measure than the low immersion desktop condition. When confronted with virtual environments, participants had some time to freely explore, while they were more restricted in their movements during the main task to standardize the conditions under which the objects were seen. While this was sufficient to lead to more pronounced feelings of presence when using a VR setup, it should be noted that after 57% of desktop environments and 33% of VR environments, participants did not report pronounced feelings of presence. Generally, these results are in line with the majority of results in the literature, which also show higher reported presence when using more immersive setups [18,19,20,21]. At the same time, participants tended to report more severe simulator sickness symptoms after VR usage compared to desktop display conditions. After experiencing VR, participants also reported that they were feeling more alert compared to their reports after performing the same task using a desktop setup.
5.2. Effect of Context Congruency
For the two environments utilized in this study, the beach environment tended to lead to, on average, 14 ms lower response times than the home environment, independent of which item category was presented. At the same time, items categorized as beach items also tended to be identified about 33 ms quicker than home-type items independent of where they were shown. Based on the literature, we would have expected an additional advantage in response times of about 16 ms [12] to 23 ms [9] when objects were seen in a fitting environment. However, a model comparison could not establish context/object congruency effects across levels of immersion for these 3D environments. Since an interaction effect of immersion levels and this congruency effect was hypothesized, this should only be interpreted after also considering this potential interaction, since nonexistent effects or contradictory effects in one immersion level (e.g., under desktop display conditions) could have masked existing effects (e.g., under HMD conditions) when testing across immersion levels.
5.3. Effects of Immersion
In comparisons between a model including only terms for object and environment types, as well as an interaction indicating object-congruency, and a model that additionally included a fixed effect of immersion (HMD-based VR vs. desktop display), the model with a main effect of immersion showed a significantly better balance between data fit and model complexity. This presented itself in lowered response times across environments when they were presented using an HMD compared to a desktop display. Generalized mixed models estimated this effect to consist of an average 43 ms advantage when using HMD VR compared to desktop displays. Adding an additional interaction effect of immersion level and object congruency did not lead to a preferable model. Even in tendency, a stronger advantage of beach objects in beach compared to home environments was more apparent under desktop conditions. Thus, despite being able to induce stronger feelings of presence, HMD-based VR did not lead to stronger effects of context/object congruency. In fact, in the current study, no clear indications of a context/object congruency effect could be shown in high immersive conditions. This is a surprising effect given the robustness of reported congruency effects [9,11,12,13,14] and it is in clear contradiction to our third hypothesis, which held that the increased feelings of presence in the higher immersion condition would facilitate context/object congruency effects. The context/object congruency effect, while tendentially more pronounced, was also not readily apparent under desktop conditions. One possible explanation for less pronounced congruency effects in the current study could be that the objects were shown to lie in the environment, which could have been perceived as unnatural positioning for these items. This approach was chosen to increase standardization in the presentation between the presented environments, as more natural positions for items in a home environment did not find equally natural positions in a beach environment. It is also possible that the study at hand was underpowered to establish context/object congruency effects. This could be particularly relevant when trying to uncover a higher order interaction effect such as the one between immersion levels, object category, and environment type. Thus, further studies should seek to establish whether explorable 3D environments can result in robust context/object congruency effects and if they are less pronounced than effects found using static pictorial representations.
Further studies that expand on this first exploration of whether the virtual environments encountered in VR produce context effects akin to those found in traditional setups could establish if VR is a fitting paradigm for this research tradition and also inform VR applications such as VR training. Studying context effects in VR is an attractive proposition for researchers, as environments and objects can quickly and cheaply be presented and exchanged in VR, while at the same time a more pronounced feeling of presence in the virtual environment may result in higher ecological validity [7]. While the increased feeling of presence in VR compared to a Desktop setup was apparent in the current sample, the study at hand does not provide evidence that VR can be used to study the effect of context on object recognition. The proposed advantage of VR through more pronounced effects of context/object congruency could not be established. The quicker object recognition times and higher accuracies that the higher fit between the presented objects and environments offer [9,12], along with a more detailed and accurate later recall [32], may also impact task performance and subsequent retention of VR training. However, while in the current sample, HMD-based VR generally resulted in faster response times in object recognition compared to Desktop setups, no evidence of context/object congruency could be established. Thus, there is currently no evidence that VR training applications should place a special emphasis on the context surrounding the task relevant objects.
Overall, the study’s findings are valuable for audiences of the journal’s Special Issue on “Virtual Reality, Augmented Reality, and Human-Computer Interaction” (https://www.mdpi.com/journal/BDCC/special_issues/Virt_Reality, (accessed on 14 February 2022)). For example, this includes the implication of the existence of context/object congruency effects for virtual objects and environments (context awareness), the possibility of using of virtual environments in applications such as VR training (ensuring real-time capabilities), and the possibility of using virtual environments and objects to study how their congruency impacts human perception and performance (ensuring real-time capabilities and evaluating VR settings).
5.4. Conclusions
The current study indicates that using higher immersive setups can lead to more pronounced presence of feelings and can generally improve response times in object identification tasks. However, no evidence was found that pointed to the fact that this resulted in stronger congruency between the object to be identified and the environment it is displayed in due to the stronger feeling of being in this environment.
Author Contributions
Conceptualization and Methodology, R.R., E.T., S.R.H.; Implementation, E.T., R.R.; Data curation R.R. & E.T.; Data analysis, E.T.; Writing—original draft, R.R., E.T., S.R.H.; Writing—edits in final draft, R.R., E.T., S.R.H.; Supervision, R.R., S.R.H.; All authors have read and agreed to the published version of the manuscript.
Funding
This research received no external funding.
Institutional Review Board Statement
The study was conducted according to the guidelines of the Declaration of Helsinki. Approval for the study was not required.
Informed Consent Statement
Informed consent was obtained from all subjects involved in the study.
Data Availability Statement
The data presented are available on request from the corresponding author.
Conflicts of Interest
The authors declare no conflict of interest.
References
- Slater, M. A note on presence terminology. Presence Connect 2003, 3, 1–5. [Google Scholar]
- Bowman, D.A.; McMahan, R.P. Virtual Reality: How Much Immersion Is Enough? Computer 2007, 40, 36–43. [Google Scholar] [CrossRef]
- Biocca, F.; Levy, M.R. Communication in the Age of Virtual Reality, 1st ed.; Lawrence Erlbaum Associates: Mahwah, NJ, USA, 1995. [Google Scholar]
- Fox, J.; Arena, D.; Bailenson, J.N. Virtual Reality: A Survival Guide for the Social Scientist. J. Media Psychol. 2009, 21, 95–113. [Google Scholar] [CrossRef]
- Gumaa, M.; Khaireldin, A.; Youssef, A.R. Validity and Reliability of Interactive Virtual Reality in Assessing the Musculoskeletal System: A Systematic Review. Curr. Rev. Musculoskelet. Med. 2021, 14, 130–144. [Google Scholar] [CrossRef]
- Jensen, L.; Konradsen, F. Validity and A review of the use of virtual reality head-mounted displays in education and training. Educ. Inf. Technol. 2018, 23, 1515–1529. [Google Scholar] [CrossRef] [Green Version]
- Blascovich, J.; Loomis, J.; Beall, A.C.; Swinth, K.R.; Hoyt, C.L.; Bailenson, J.N. Immersive virtual environment technology as a methodological tool for social psychology. Psychol. Inq. 2002, 13, 103–124. [Google Scholar] [CrossRef]
- Biederman, I. Perceiving Real-World Scenes. Science 1972, 177, 77–80. [Google Scholar] [CrossRef]
- Rémy, F.; Saint-Aubert, L.; Bacon-Macé, N.; Vayssière, N.; Barbeau, E.; Fabre-Thorpe, M. Object recognition in congruent and incongruent natural scenes: A life-span study. Vis. Res. 2013, 91, 36–44. [Google Scholar] [CrossRef]
- Tulving, E.; Gold, C. Stimulus information and contextual information as determinants of tachistoscopic recognition of words. J. Exp. Psychol. 1963, 66, 319–327. [Google Scholar] [CrossRef]
- Palmer, T.E. The effects of contextual scenes on the identification of objects. Mem. Cogn. 1975, 3, 519–526. [Google Scholar] [CrossRef] [Green Version]
- Joubert, O.R.; Fize, D.; Rousselet, G.A.; Fabre-Thorpe, M. Early interference of context congruence on object processing in rapid visual categorization of natural scenes. J. Vis. 2008, 8, 11. [Google Scholar] [CrossRef]
- Truman, A.; Mudrik, L. Are incongruent objects harder to identify? The functional significance of the N300 component. Neuropsychologia 2018, 117, 222–232. [Google Scholar] [CrossRef]
- Collet, A.-C.; Fize, D.; VanRullen, R. Contextual Congruency Effect in Natural Scene Categorization: Different Strategies in Humans and Monkeys (Macaca mulatta). PLoS ONE 2015, 10, e0133721. [Google Scholar] [CrossRef] [PubMed]
- Turner, P. The “book problem” and its neural correlates. AI Soc. 2014, 29, 497–505. [Google Scholar] [CrossRef]
- IJsselsteijn, W.; Riva, G. Being there: The experience of presence in mediated environments. In Being There: Concepts, Effects and Measurements of User Presence in Synthetic Environments; Riva, G., Davide, F., IJsselsteijn, W.A., Eds.; IOS Press: Amsterdam, The Netherlands, 2003; pp. 3–16. [Google Scholar]
- Schubert, T.; Crusius, J. Five theses on the book problem. In Proceedings of the 5th Annual International Workshop on Presence, Porto, Portugal, 9–11 October 2002; International Society for Presence Research: Philadelphia, PA, USA, 2002; pp. 53–58. [Google Scholar]
- Ahn, S.J. Embodied Experiences in Immersive Virtual Environments: Effects on Pro-Environmental Self-Efficacy Behavior. Ph.D. Thesis, Stanford University, Stanford, CA, USA, 2011. [Google Scholar]
- Makransky, G.; Terkildsen, T.S.; Mayer, R.E. Adding immersive virtual reality to a science lab simulation causes more presence but less learning. Learn. Instr. 2017, 60, 225–236. [Google Scholar] [CrossRef]
- Persky, S.; Blascovich, J. Immersive Virtual Video Game Play and Presence: Influences on Aggressive Feelings and Behavior. Presence Teleoperators Virtual Environ. 2008, 17, 57–72. [Google Scholar] [CrossRef]
- Shu, Y.; Huang, Y.Z.; Chang, S.H.; Chen, M.Y. Do virtual reality head-mounted displays make a difference? A comparison of presence and self-efficacy between head-mounted displays and desktop computer-facilitated virtual environments. Virtual Real. 2018, 23, 437–446. [Google Scholar] [CrossRef]
- Steinicke, F.; Bruder, G.; Hinrichs, K.; Steed, A. Gradual transitions and their effects on presence and distance estimation. Comput. Graph. 2010, 34, 26–33. [Google Scholar] [CrossRef]
- Swan, J.E.; Jones, A.; Kolstad, E.; Livingston, M.A.; Smallman, H.S. Egocentric depth judgments in optical, see-through augmented reality. IEEE Trans. Vis. Comput. Graph. 2007, 313, 429–442. [Google Scholar] [CrossRef]
- Thompson, W.B.; Fleming, R.; Creem-Regehr, S.; Stefanucci, J.K. Visual Perception from a Computer Graphics Perspective; CRC Press: Boca Raton, FL, USA, 2011. [Google Scholar]
- Waller, D.; Richardson, A.R. Correcting distance estimates by interacting with immersive virtual environments: Effects of task and available sensory information. J. Exp. Psychology. Appl. 2008, 14, 61–72. [Google Scholar] [CrossRef]
- Gonzalez-Franco, M.; Abtahi, P.; Steed, A. Individual Differences in Embodied Distance Estimation in Virtual Reality. In Proceedings of the 2019 IEEE Conference on Virtual Reality and 3D User Interfaces (VR), Osaka, Japan, 23–27 March 2019; pp. 941–943. [Google Scholar] [CrossRef]
- Denny, J.; Atkin, D. Does “being there” improve memory: The impact of presence on recall. In Proceedings of the 9th Annual International Workshop on Presence, Cleveland, OH, USA, 24–26 August 2006; Bracken, C.C., Lombard, M., Eds.; International Society for Presence Research: Philadelphia, PA, USA, 2006; p. 65. [Google Scholar]
- Lin, J.J.-W.; Duh, H.B.L.; Parker, D.E.; Abi-Rached, H.; Furness, T.A. Effects of field of view on presence, enjoyment, memory, and simulator sickness in a virtual environment. In Proceedings of the IEEE Virtual Reality 2002, Orlando, FL, USA, 24–28 March 2002; Bracken, C.C., Lombard, M., Eds.; International Society for Presence Research: Philadelphia, PA, USA, 2002; pp. 164–171. [Google Scholar] [CrossRef]
- Makowski, D.; Sperduti, M.; Nicolas, S.; Piolino, P. “Being there” and remembering it: Presence improves memory encoding. Conscious. Cogn. 2017, 53, 194–202. [Google Scholar] [CrossRef] [PubMed] [Green Version]
- Mania, K.; Chalmers, A. The effects of levels of immersion on memory and presence in virtual environments: A reality centered approach. CyberPsychol. Behav. 2001, 4, 247–264. [Google Scholar] [CrossRef] [PubMed]
- Bailey, J.; Bailenson, J.N.; Won, A.S.; Flora, J.; Armel, K.C. Presence and Memory: Immersive Virtual Reality Effects on Cued Recall. In Proceedings of the International Society for Presence Research Annual Conference—ISPR 2012, Philadelphia, PA, USA, 24–26 October 2012; International Society for Presence Research: Philadelphia, PA, USA, 2012. [Google Scholar]
- Greene, M.R.; Botros, A.P.; Beck, D.M.; Li, F. What you see is what you expect: Rapid scene understanding benefits from prior experience. Atten. Percept. Psychophys. 2015, 77, 1239–1251. [Google Scholar] [CrossRef] [PubMed] [Green Version]
- Thakur, N.; Han, C.Y. An Ambient Intelligence-Based Human Behavior Monitoring Framework for Ubiquitous Environments. Information 2021, 12, 81. [Google Scholar] [CrossRef]
- Macqueen, J. Some methods for classification and analysis of multivariate observations. In 5th Berkeley Symposium on Mathematical Statistics and Probability; University of California Press: Berkeley, CA, USA, 1967; pp. 281–297. [Google Scholar]
- Slater, M.; Linakis, V.; Usoh, M.; Kooper, R.; Street, G. Immersion, Presence, and Performance in Virtual Environments: An Experiment with Tri-Dimensional Chess. In ACM Virtual Reality Software and Technology (VRST); Association for Computing Machinery (ACM): New York, NY, USA, 1996; pp. 163–172. [Google Scholar]
- Keshavarz, B.; Hecht, H. Validating an efficient method to quantify motion sickness. Hum. Factors 2011, 53, 415–426. [Google Scholar] [CrossRef] [Green Version]
- Reinhard, R.; Rutrecht, H.; Hengstenberg, P.; Tutulmaz, E.; Geissler, B.; Hecht, H.; Muttray, A. The best way to assess visually induced motion sickness in a fixed-base driving simulator. Transp. Res. Part F Traffic Psychol. Behav. 2017, 48, 74–88. [Google Scholar] [CrossRef]
- Reinhard, R.; Kleer, M.; Dreßler, K. The impact of individual simulator experiences on usability and driving behavior in a moving base driving simulator. Transp. Res. Part F Traffic Psychol. Behav. 2019, 61, 131–140. [Google Scholar] [CrossRef]
- Reinhard, R.; Tutulmaz, E.; Rutrecht, H.M.; Hengstenberg, P.; Geissler, B.; Hecht, H.; Muttray, A. Effects of visually induced motion sickness on emergency braking reaction times in a driving simulator. Hum. Factors 2019, 61, 1004–1018. [Google Scholar] [CrossRef]
- Bowman, D.A.; Datey, A.; Ryu, Y.S.; Farooq, U.; Vasnaik, O. Empirical Comparison of Human Behavior and Performance with Different Display Devices for Virtual Environments. In Proceedings of the Human Factors and Ergonomics Society Annual Meeting, Baltimore, MD, USA, 29 September–4 October 2002; SAGE Publishing: Thousand Oaks, CA, USA, 2002; Volume 46, pp. 2134–2138. [Google Scholar] [CrossRef]
- Usoh, M.; Catena, E.; Arman, S.; Slater, M. Using Presence Questionnaires in Reality. Presence Teleoperators Virtual Environ. 2000, 9, 497–503. [Google Scholar] [CrossRef]
- Akerstedt, T.; Gillberg, M. Subjective and Objective Sleepiness in the Active Individual. Int. J. Neurosci. 1990, 52, 29–37. [Google Scholar] [CrossRef]
- Bates, D.; Mächler, M.; Bolker, B.; Walker, S. itting Linear Mixed-Effects Models Using lme4. J. Stat. Softw. 2015, 67, 1–48. [Google Scholar] [CrossRef]
- Lo, S.; Andrews, S. To transform or not to transform: Using generalized linear mixed models to analyse reaction time data. Front. Psychol. 2015, 6, 1–16. [Google Scholar] [CrossRef] [PubMed] [Green Version]
Figure 1.
The created 3D home environment with exemplary corresponding objects, one from the large size and two from the medium size and two from the small size groups, chosen based on prestudy survey results.
Figure 1.
The created 3D home environment with exemplary corresponding objects, one from the large size and two from the medium size and two from the small size groups, chosen based on prestudy survey results.

Figure 2.
The created 3D beach environment with exemplary corresponding objects, one from the large size, two from the medium size, and two from the small size groups, chosen based on prestudy survey results.
Figure 2.
The created 3D beach environment with exemplary corresponding objects, one from the large size, two from the medium size, and two from the small size groups, chosen based on prestudy survey results.

Figure 3.
Steps in the execution of the object recognition task. (a) First, a red ball appeared until the participant centered their view and pressed the joystick button. (b) The fixation cross appeared for two seconds. (c) An object appeared at the location indicated by the fixation cross. (d) Finally, three objects appeared, and the participant was asked to quickly select the object that had just been displayed by using the controller’s joystick.

Figure 4.
Rootogram functions showing the over and under dispersions of the “six and seven answer” counts from the SUS questionnaires. (a) shows the fit to a Poisson distribution; (b) shows the fit to a negative binomial distribution.
Figure 4.
Rootogram functions showing the over and under dispersions of the “six and seven answer” counts from the SUS questionnaires. (a) shows the fit to a Poisson distribution; (b) shows the fit to a negative binomial distribution.

Figure 5.
Total count of “six and seven” responses, indicating high presence, in the SUS questionnaire.
Figure 5.
Total count of “six and seven” responses, indicating high presence, in the SUS questionnaire.

Figure 6.
Total count of simulator sickness symptom severity responses in the FMS questionnaire.

Figure 7.
Total count of alertness responses in the KSS questionnaire.

Figure 8.
Distribution of response times for all participants.

Figure 9.
Box-and-Whiskers Plots of response times of each participants comparing HMD and desktop display conditions. Lower and upper hinges correspond to the first and third quartiles (i.e., the 25th and 75th percentiles). Upper and lower whisker extends from the hinge to the largest value no further than 1.5 interquartile ranges from the hinge. The points indicate outliers evaluated as data points beyond the whiskers. P01 to P21 indicate individual participants.

Figure 10.
Three-way interaction effect between immersion level (Desktop/HMD), test object category (Beach/Home), and the environment type (Beach/Home) on response time.
Figure 10.
Three-way interaction effect between immersion level (Desktop/HMD), test object category (Beach/Home), and the environment type (Beach/Home) on response time.

Publisher’s Note: MDPI stays neutral with regard to jurisdictional claims in published maps and institutional affiliations. |
© 2022 by the authors. Licensee MDPI, Basel, Switzerland. This article is an open access article distributed under the terms and conditions of the Creative Commons Attribution (CC BY) license (https://creativecommons.org/licenses/by/4.0/).
Share and Cite
MDPI and ACS Style
Reinhard, R.; Telatar, E.; Humayoun, S.R. Comparison of Object Detection in Head-Mounted and Desktop Displays for Congruent and Incongruent Environments. Big Data Cogn. Comput. 2022, 6, 28. https://doi.org/10.3390/bdcc6010028
AMA Style
Reinhard R, Telatar E, Humayoun SR. Comparison of Object Detection in Head-Mounted and Desktop Displays for Congruent and Incongruent Environments. Big Data and Cognitive Computing. 2022; 6(1):28. https://doi.org/10.3390/bdcc6010028
Chicago/Turabian StyleReinhard, René, Erinchan Telatar, and Shah Rukh Humayoun. 2022. "Comparison of Object Detection in Head-Mounted and Desktop Displays for Congruent and Incongruent Environments" Big Data and Cognitive Computing 6, no. 1: 28. https://doi.org/10.3390/bdcc6010028