
Radiology Imaging Scans for Early Diagnosis of Kidney Tumors: A Review of Data Analytics-Based Machine Learning and Deep Learning Approaches

 , ,
, , 
 and
and
Abstract
:1. Introduction
2. Background
2.1. Kidney Disease (KD)
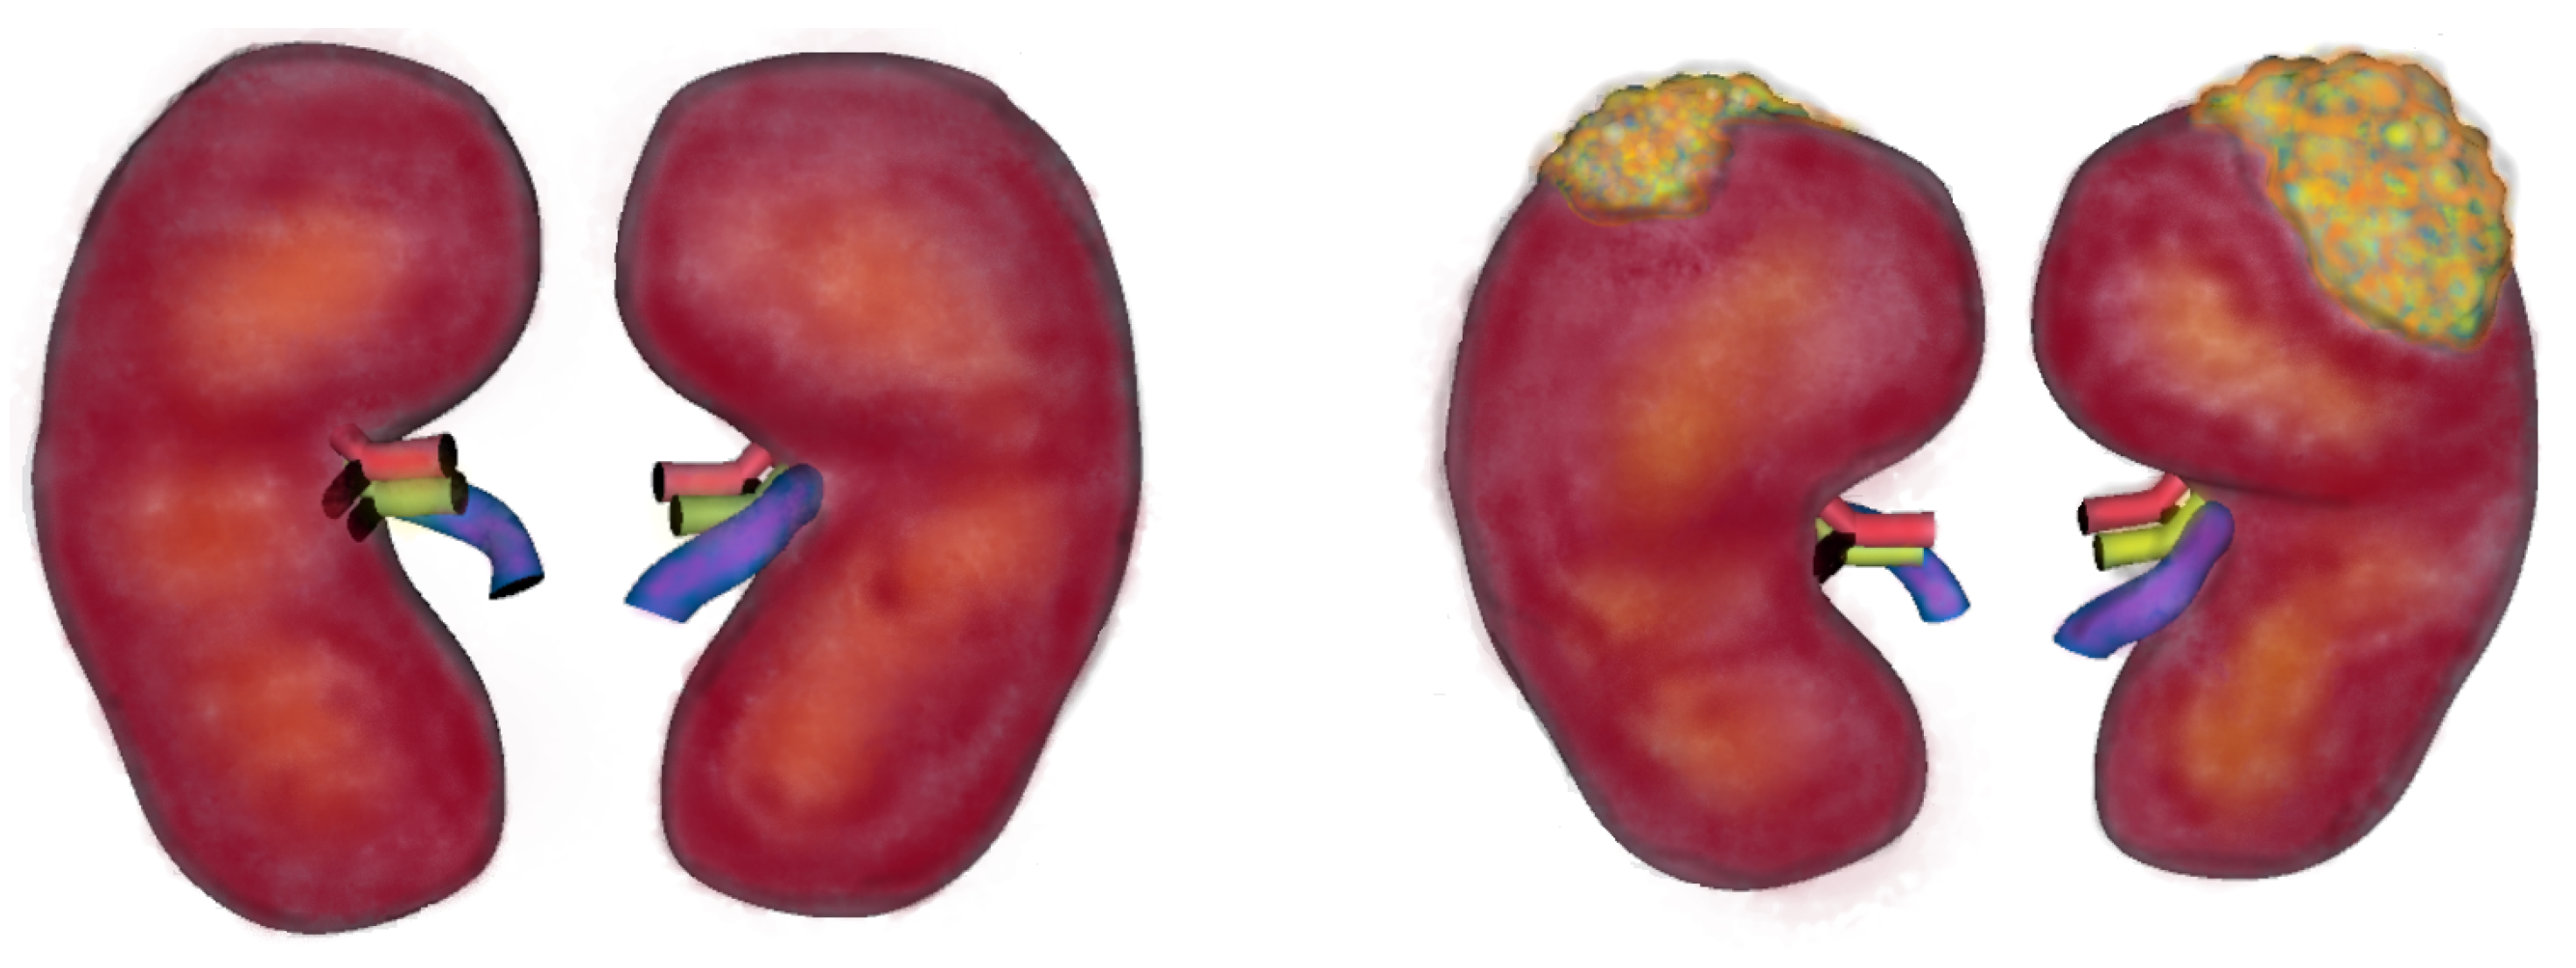
2.1.1. Kidney Tumors (KT)
2.1.2. Factors Affecting Tumor Formation
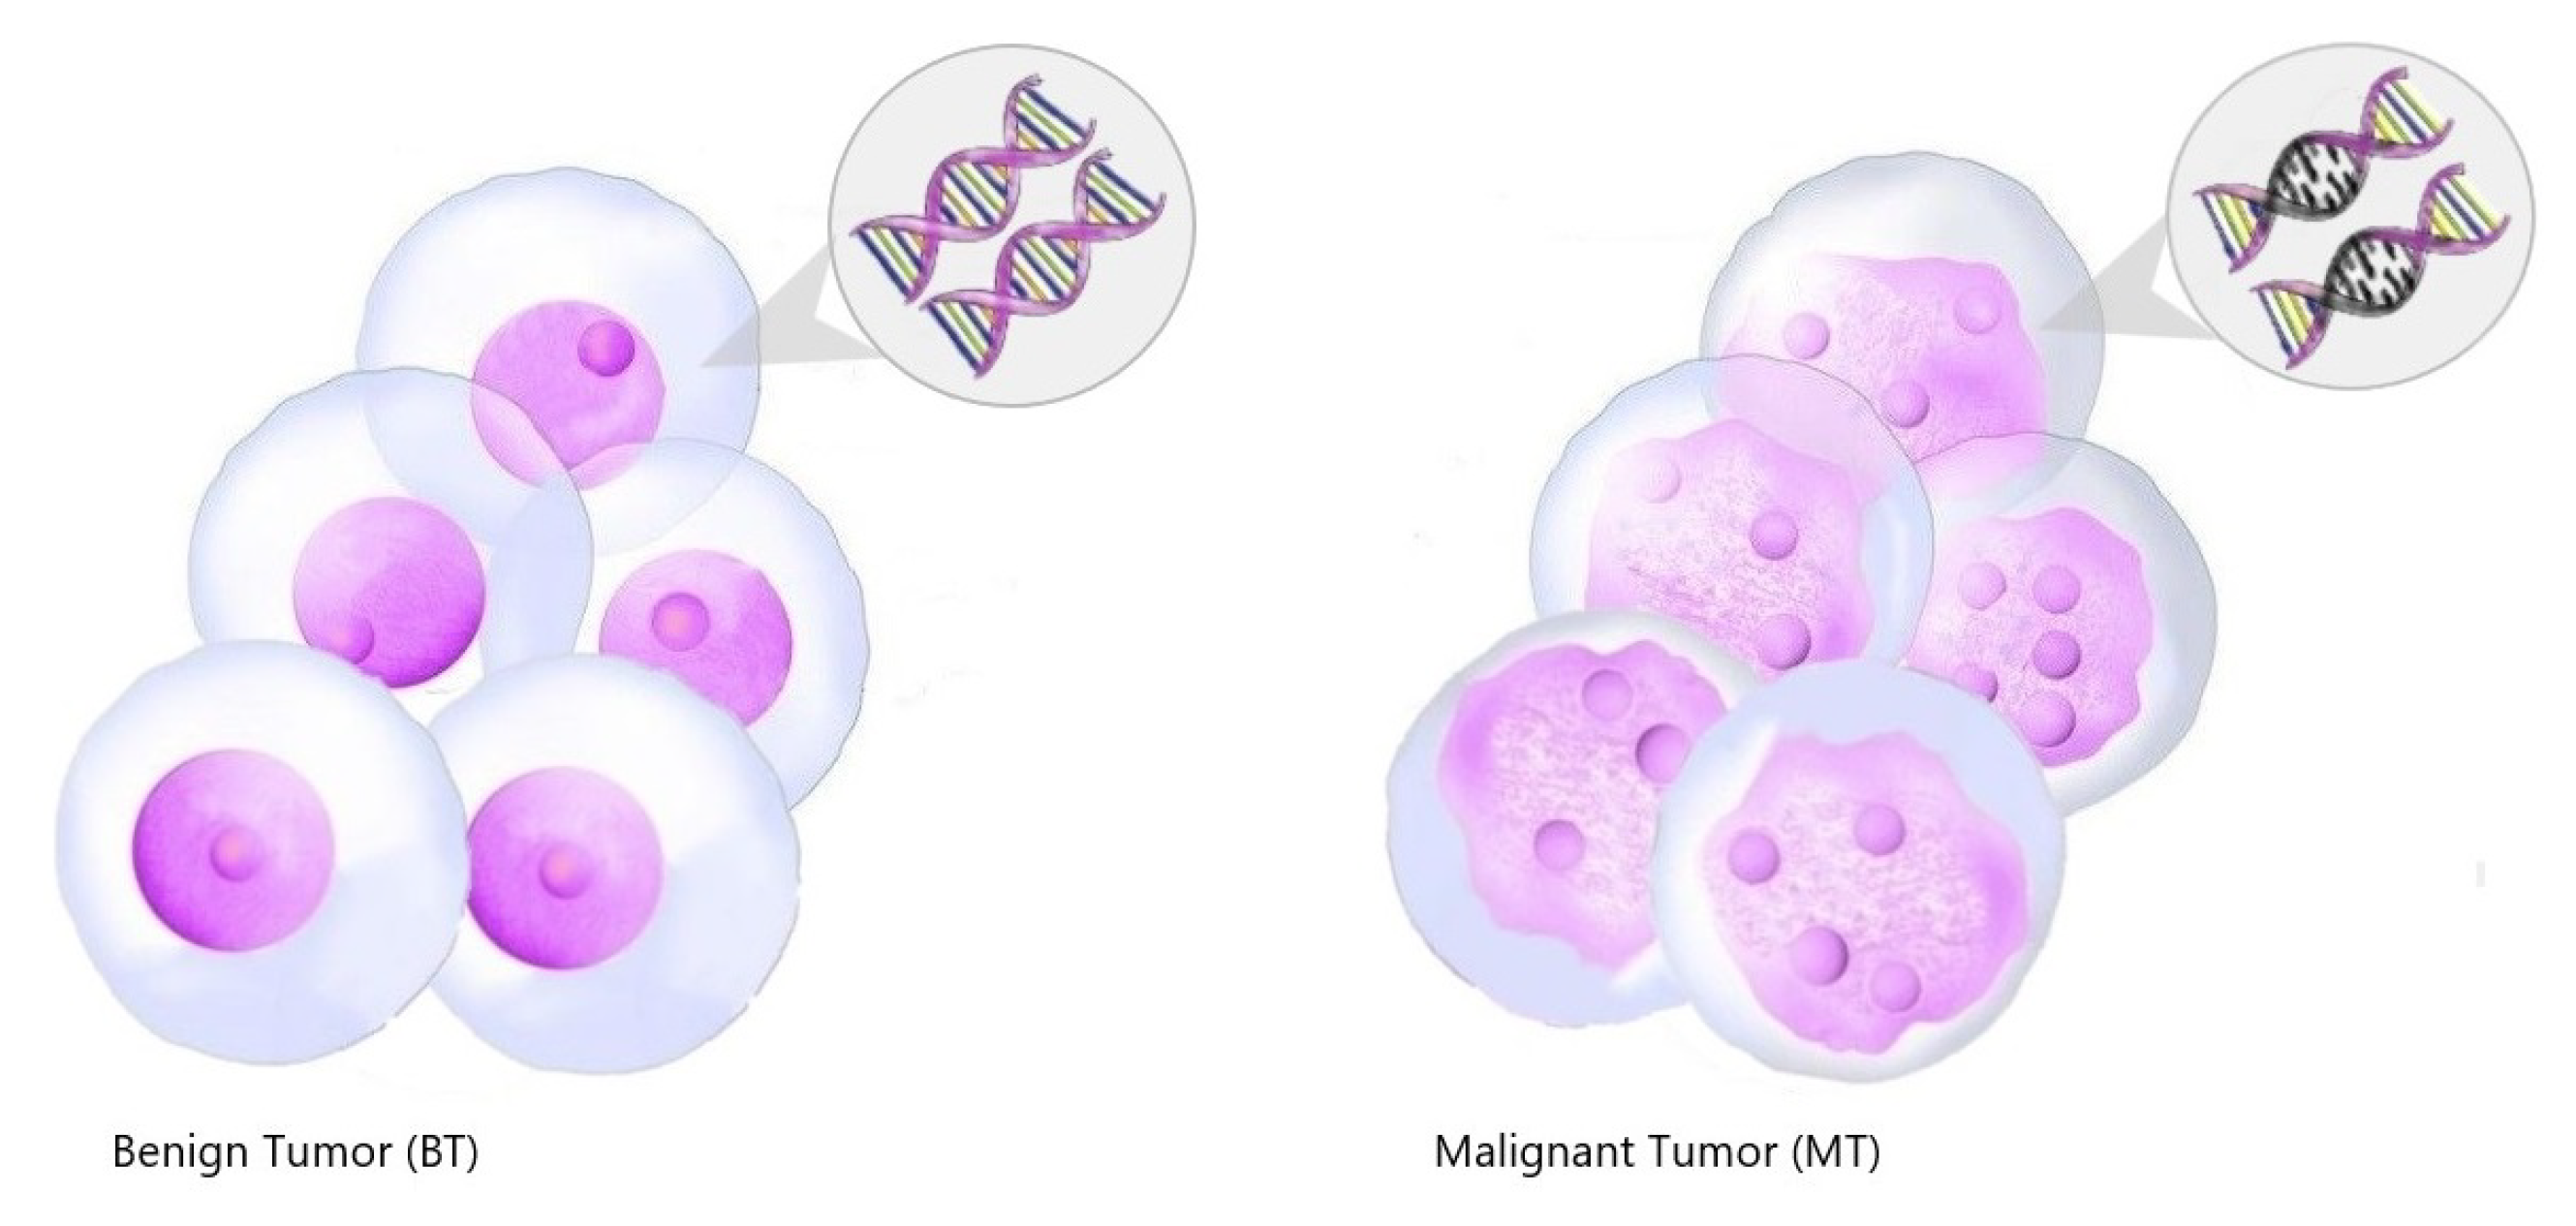
2.1.3. Kidney Tumor Types
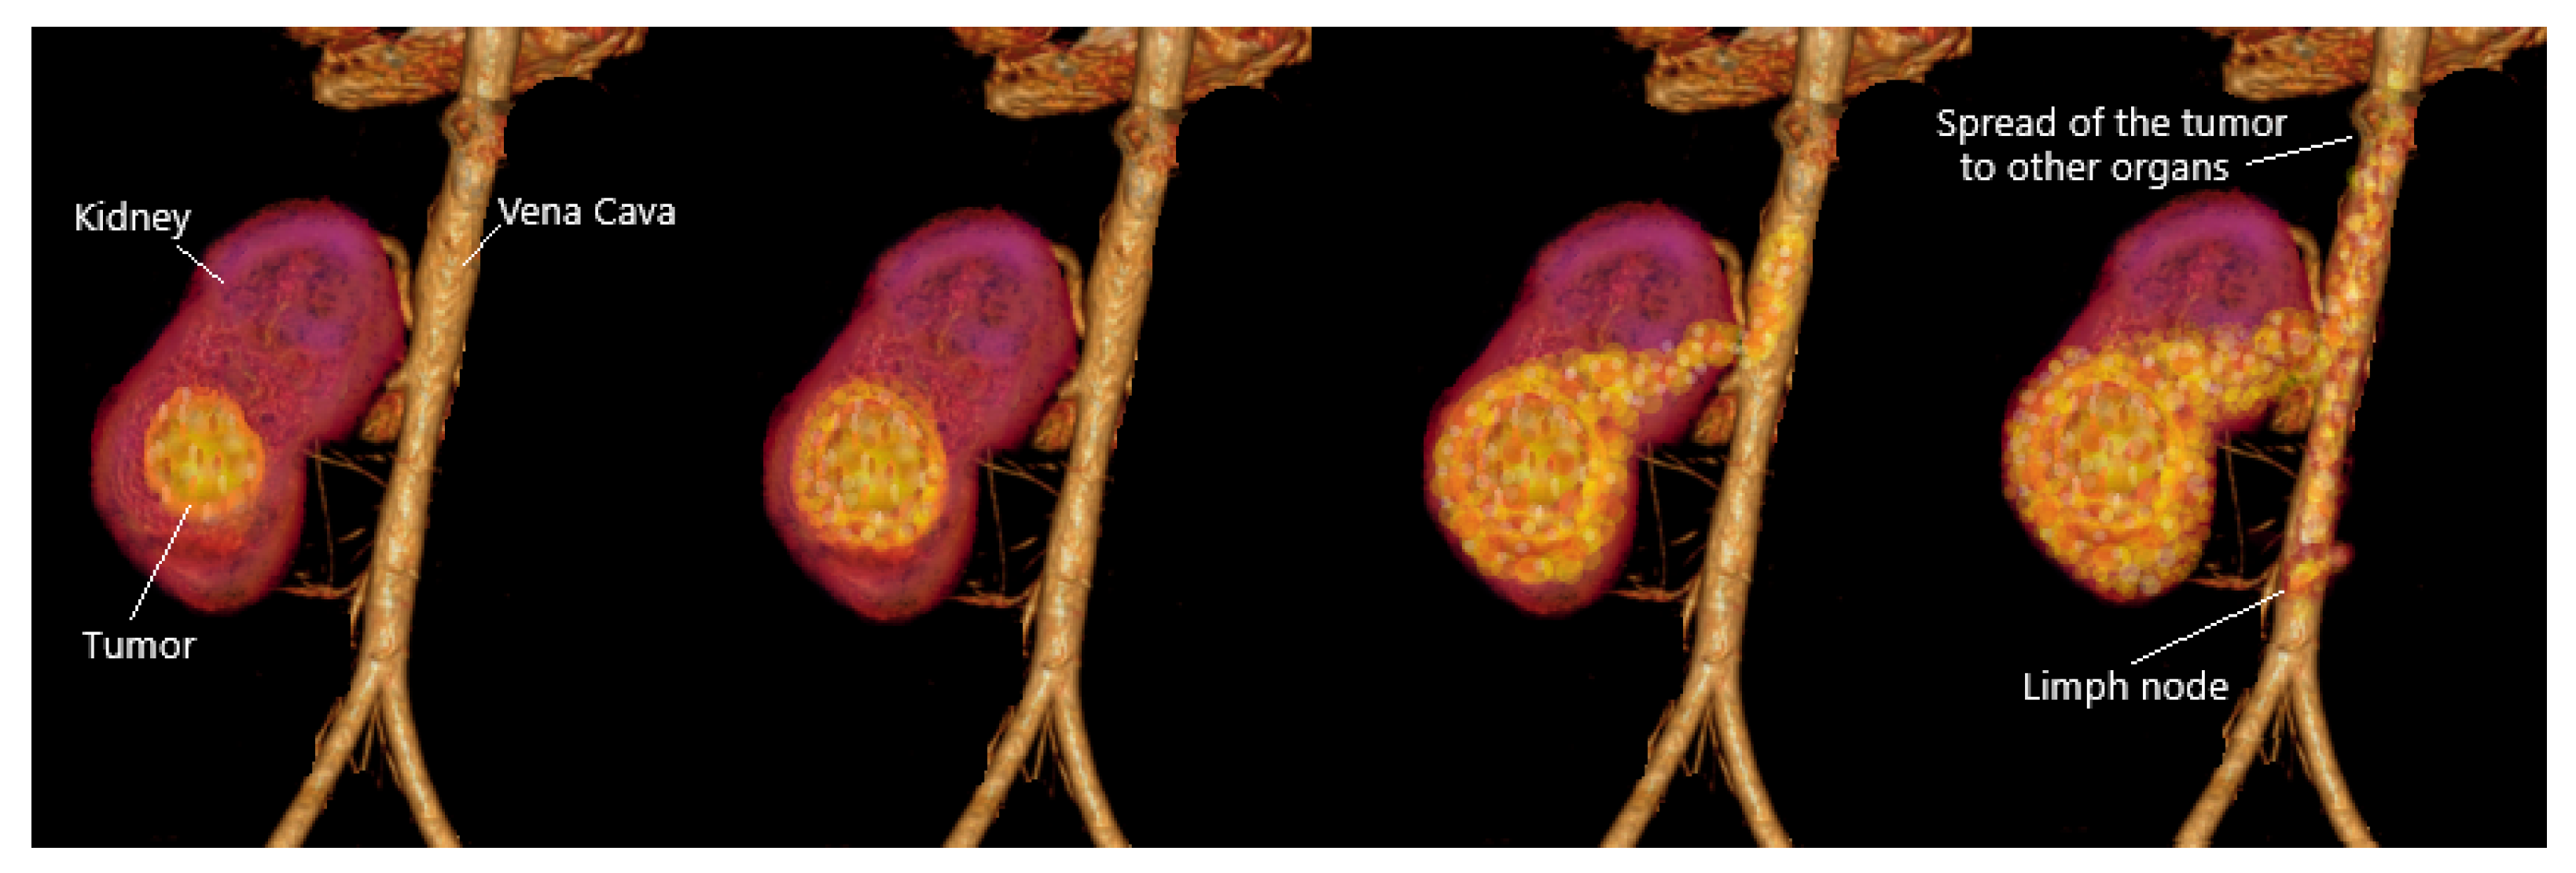
2.1.4. Kidney Tumor Stage
3. Radiology Imaging
- Ultrasound (US): Ultrasonography may be used to test doubtful asymptomatic Kidney Tumors and cystic renal tumors. Ultrasound is used to create an inner picture of the body in this safe and non-danger radiologic technique; the image may help detect renal cell carcinoma. Ultrasound scans may decide if the kidney mass is mostly stable or mostly fully saturated [19,25].
- Magnetic Resonance Imaging (MRI): Uses radio waves and heavy magnets to create an impression of the body’s soft tissues; if the patient has a sensitivity to the contrast media used in the procedure, MRI should be used instead of CT. An injectable of a contrasting substance called gadolinium is often taken directly to the MRI scan to make a more accurate image. This contrasting content can be avoided by diabetic patients and those with renal insufficiency because it may cause side effects [19,25].
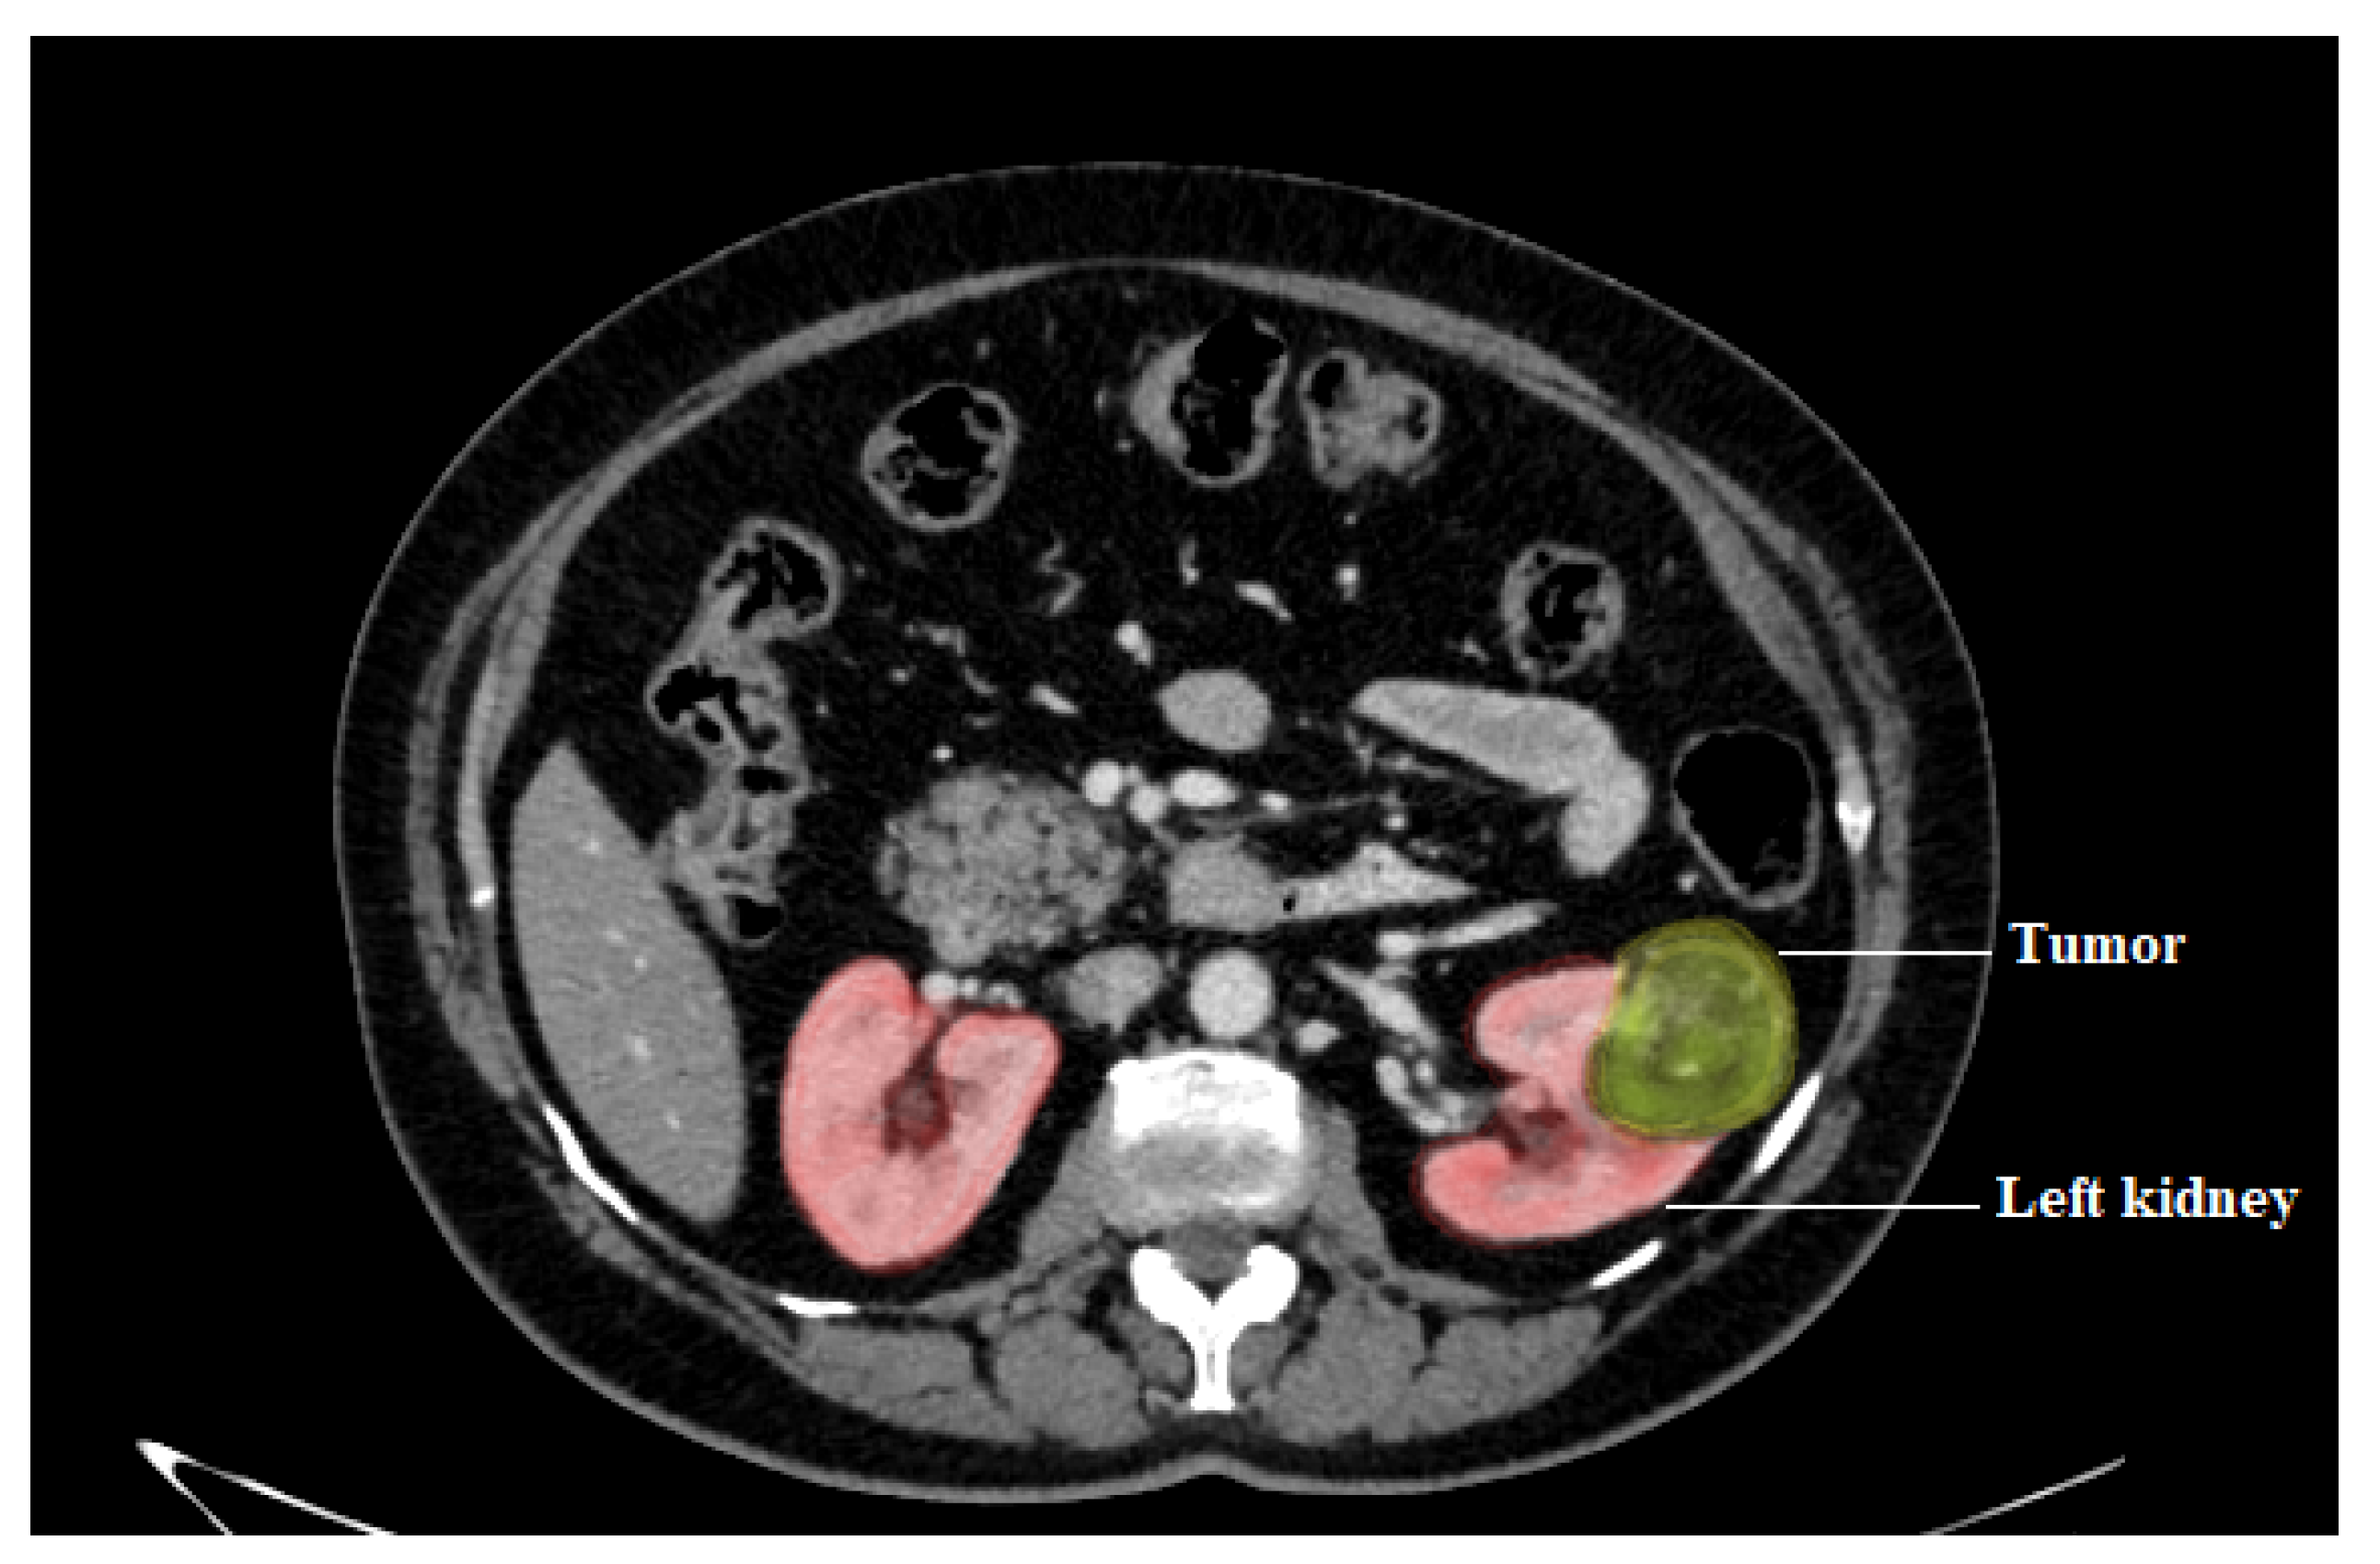
- Computed Tomography (CT): In the kidney areas, widely used to assess the level of RCC. CT scans can help differentiate solid masses from cyst masses and reveal details about the patient’s tumor location, level, and progression to other organs. According to a previous study, tomographic CT imaging features may be used to diagnose patients with RCC by showing cytogenic variations between these cells [19,23,28].
- Angiography (CTA): As a method for analyzing blood vessels in the kidneys, this radiography procedure helps diagnose renal cell carcinoma. The patient takes contrast in this diagnostic procedure, and the contrasting dye helps to demonstrate abnormally directed blood vessels that are thought to be associated with the tumor [23,28]. Table 1 below shows an overview of the uses, advantages, and disadvantages of radio-logical.

| Tool | Uses | Advantages | Disadvantages |
|---|---|---|---|
| US | Determine doubtful asymptomatic KT and cystic renal tumors | Safe, non-danger, and low cost | Small Kidney Tumors cannot be seen, and less accurate |
| MRI | Determine the extent of the tumor | Can tell the difference between a hollow cystic mass and a solid mass | Costly, May cause side effects to diabetic patients |
| CT | Determine KT, tumor type, and provide pictures of tissues, organs, and skeletal structure | Not needing a biopsy, because the biopsy for diagnosis may increase the possibility of spreading the tumor if any | Difficult to evaluate kidney vessels |
| CTA | Determine analyzing blood vessels in the kidneys | Short time study and High quality | Contrast can be harmful Inappropriate for patients with kidney problems |
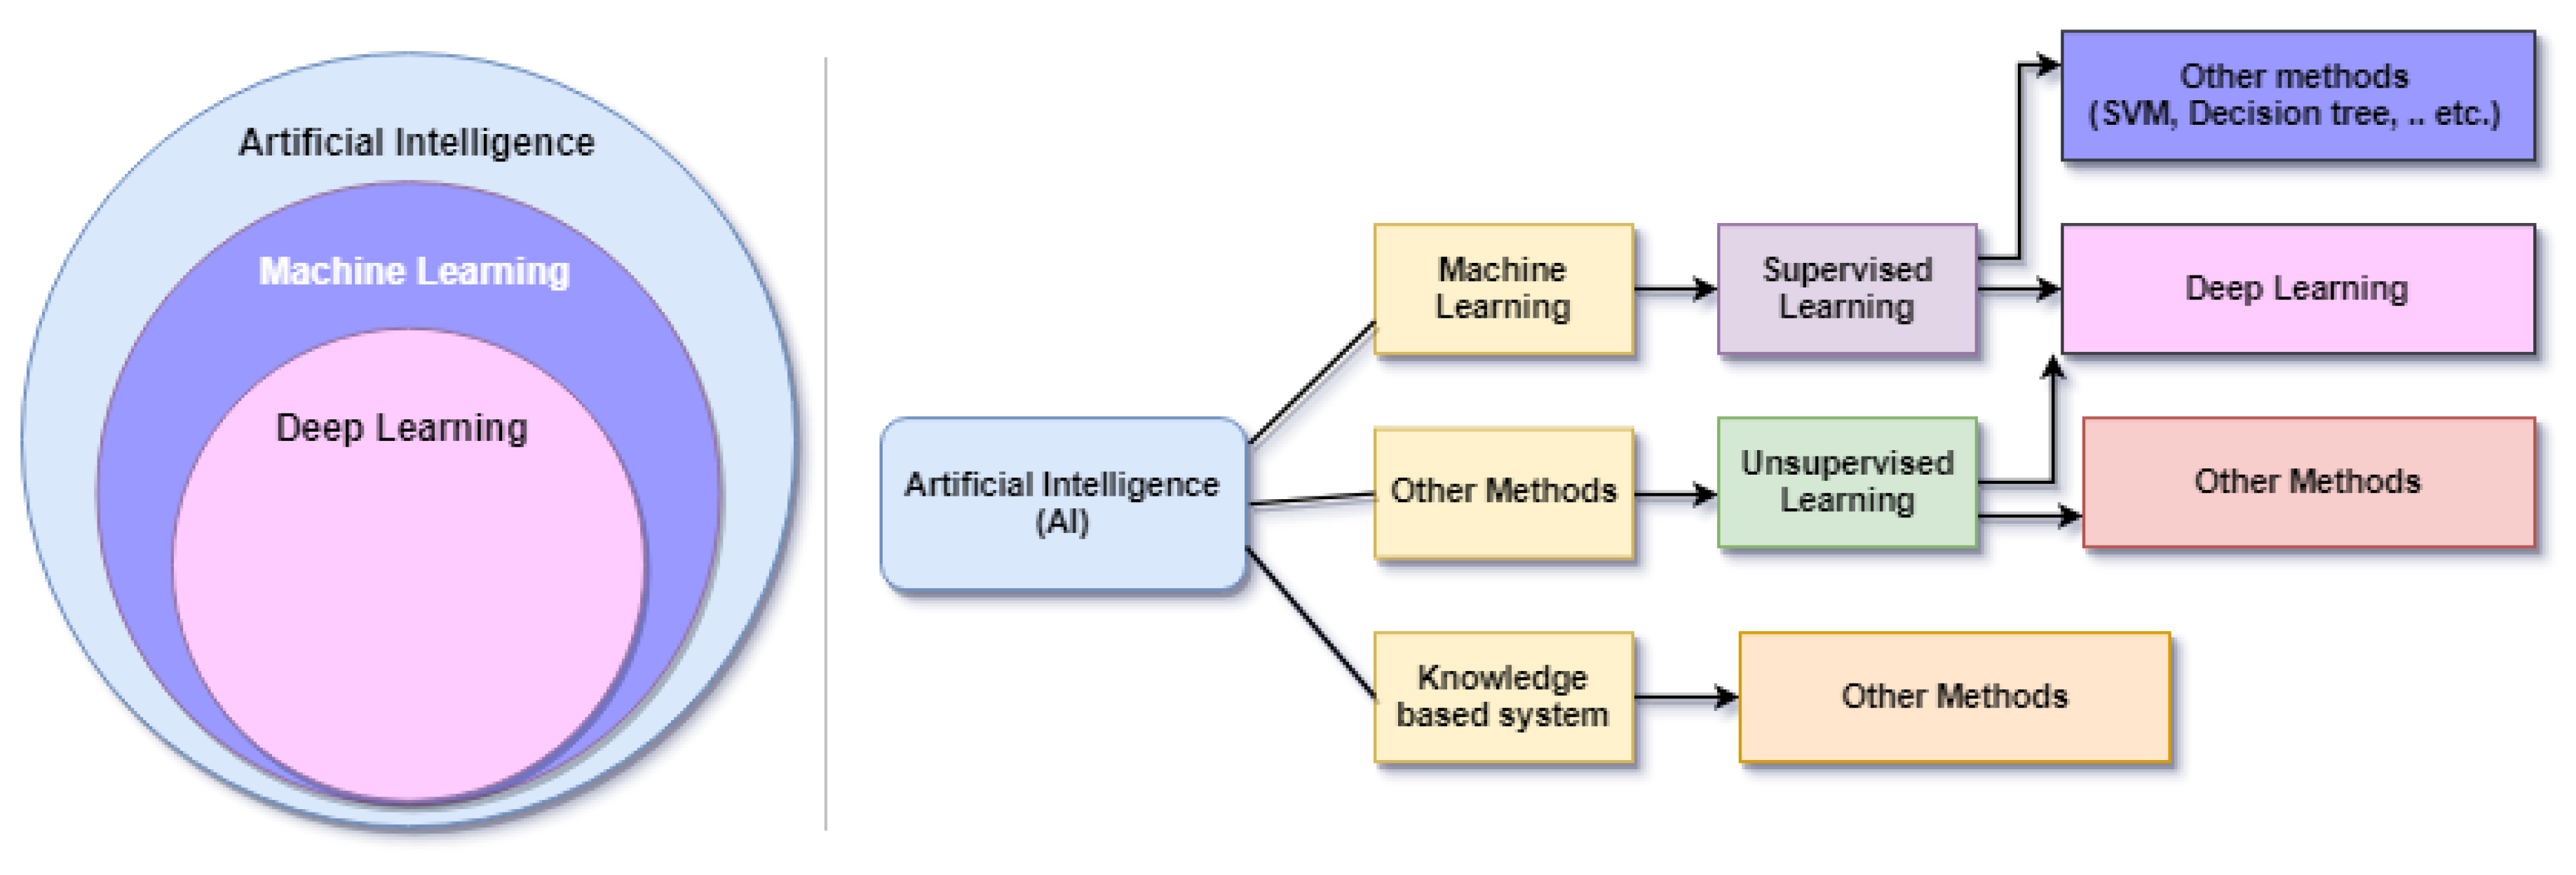
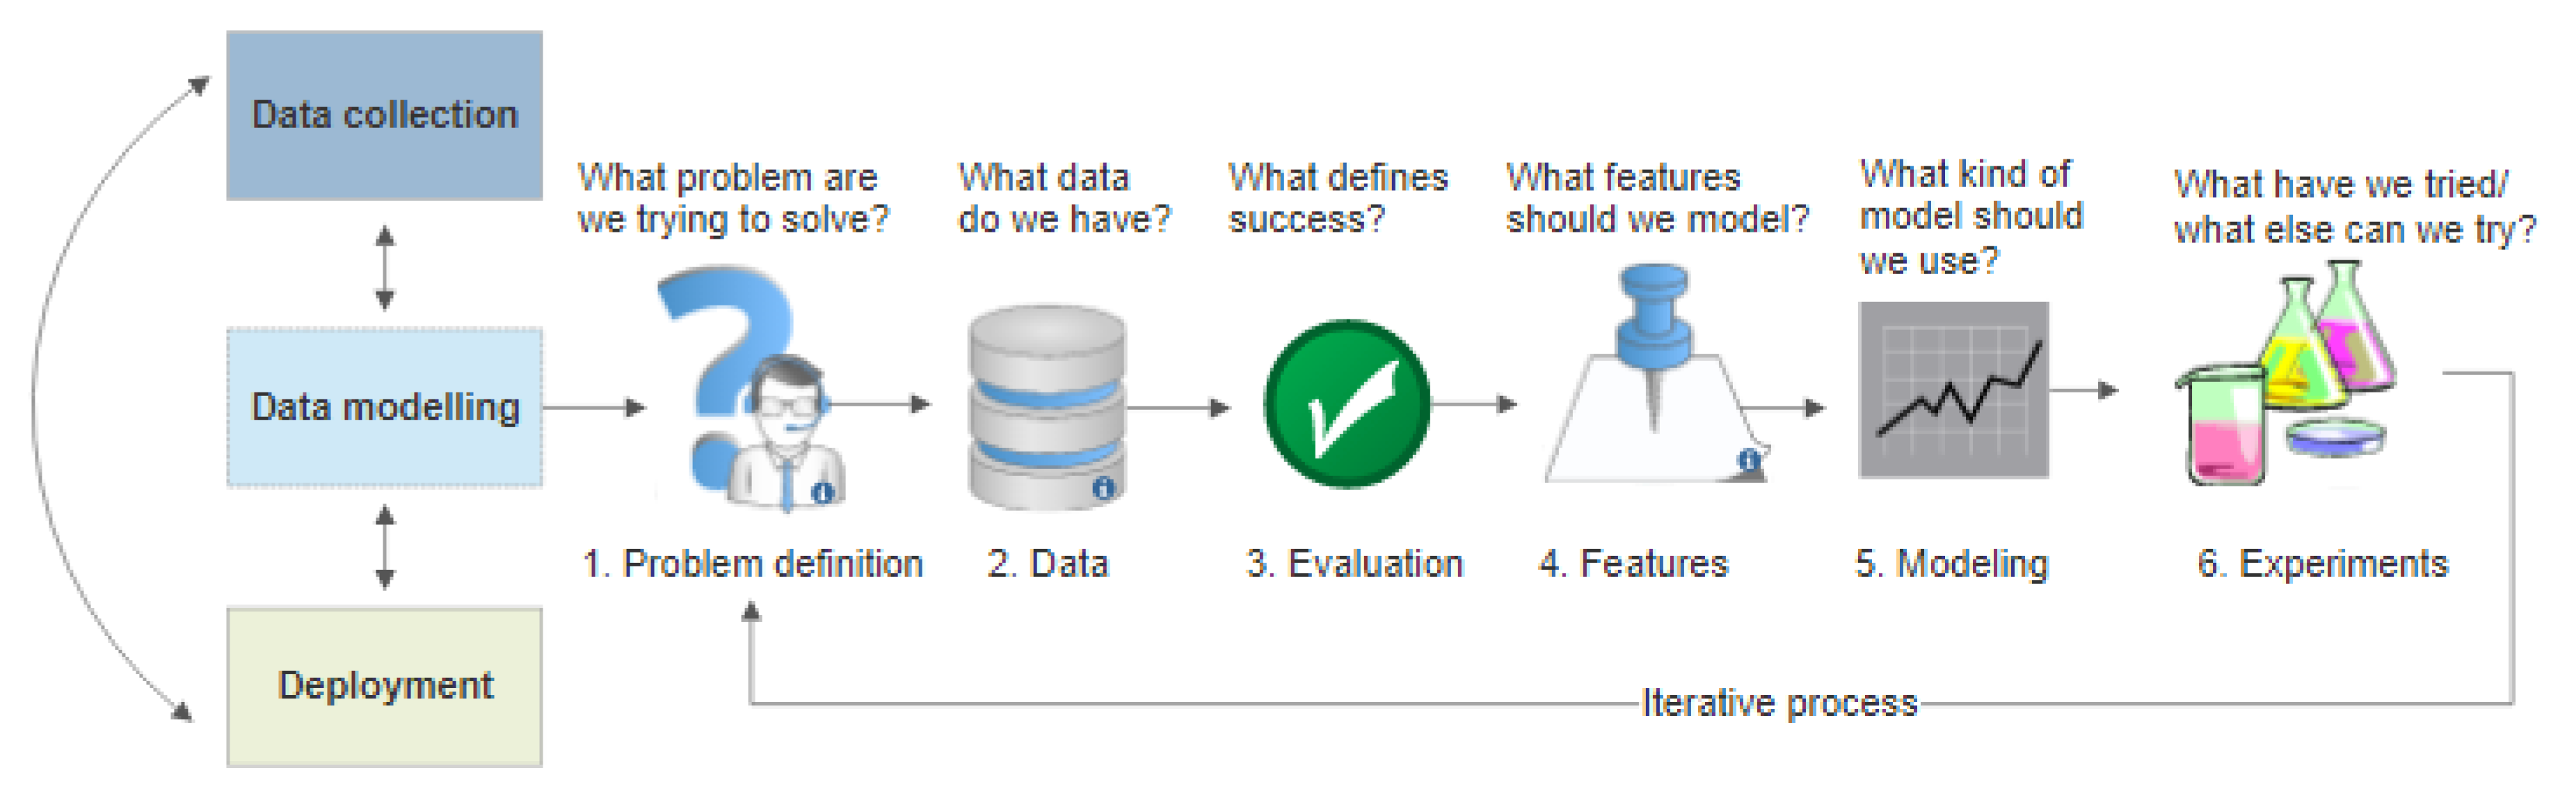
4. Machine Learning
5. Deep Learning
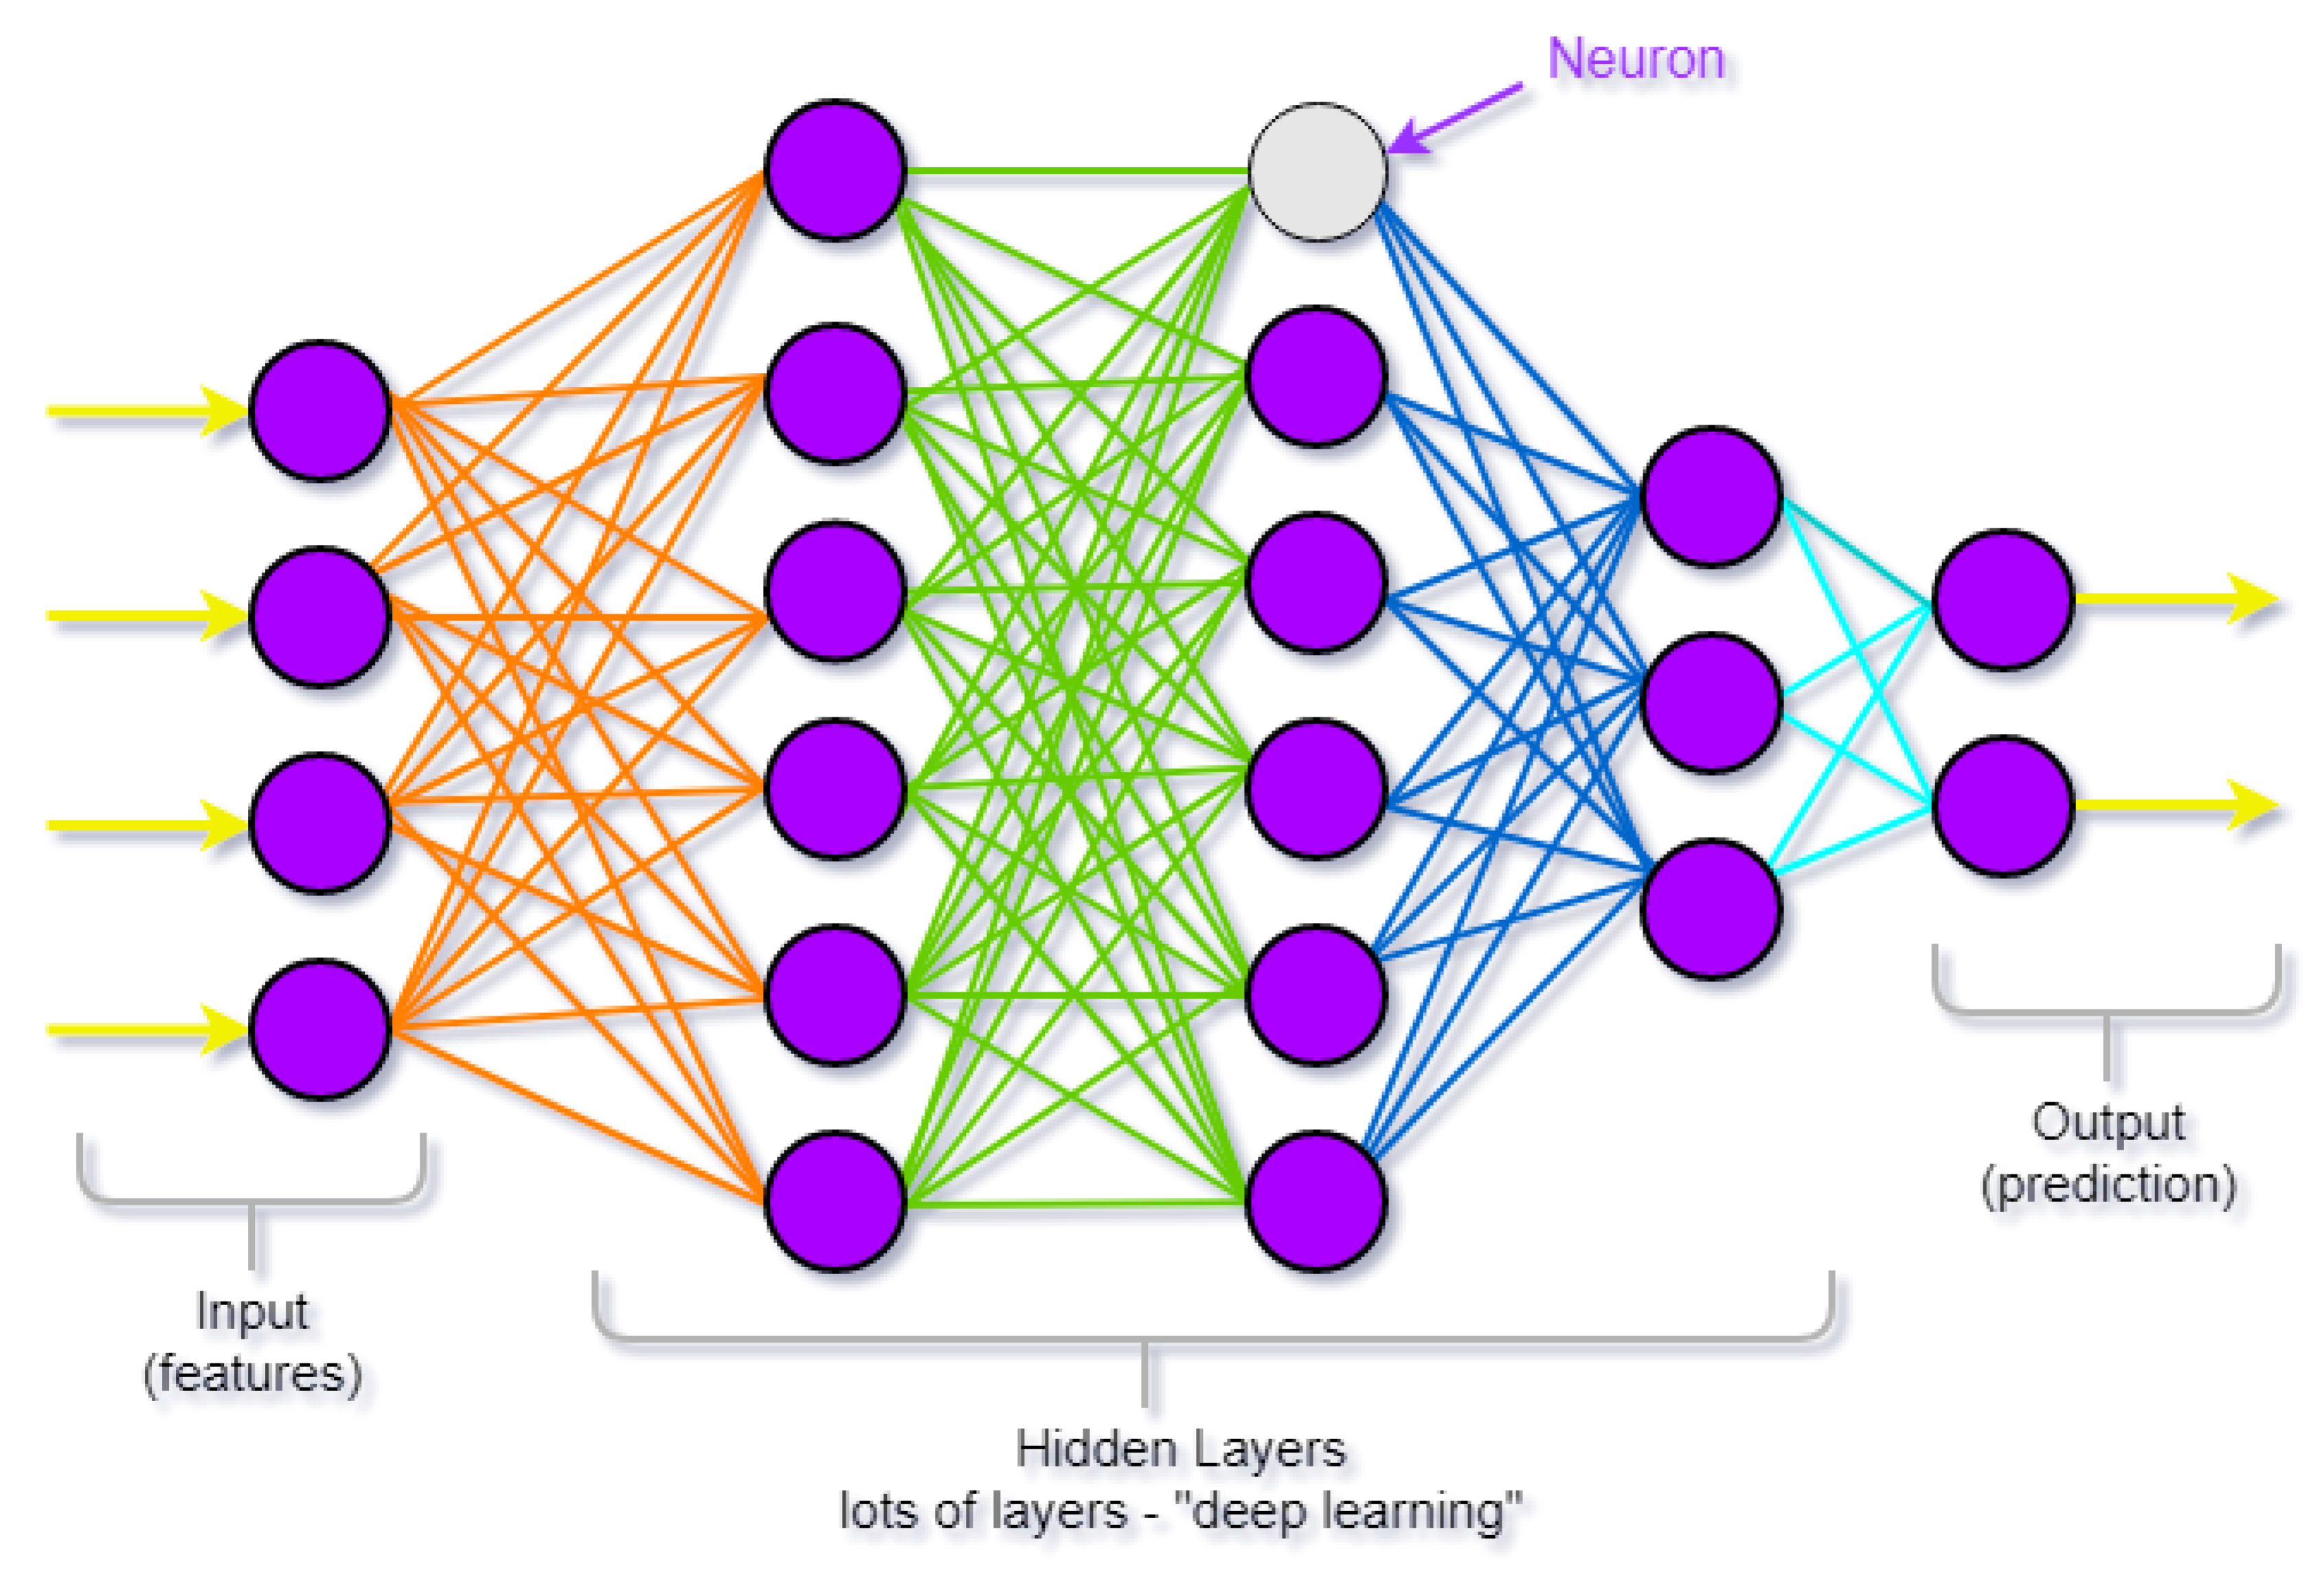
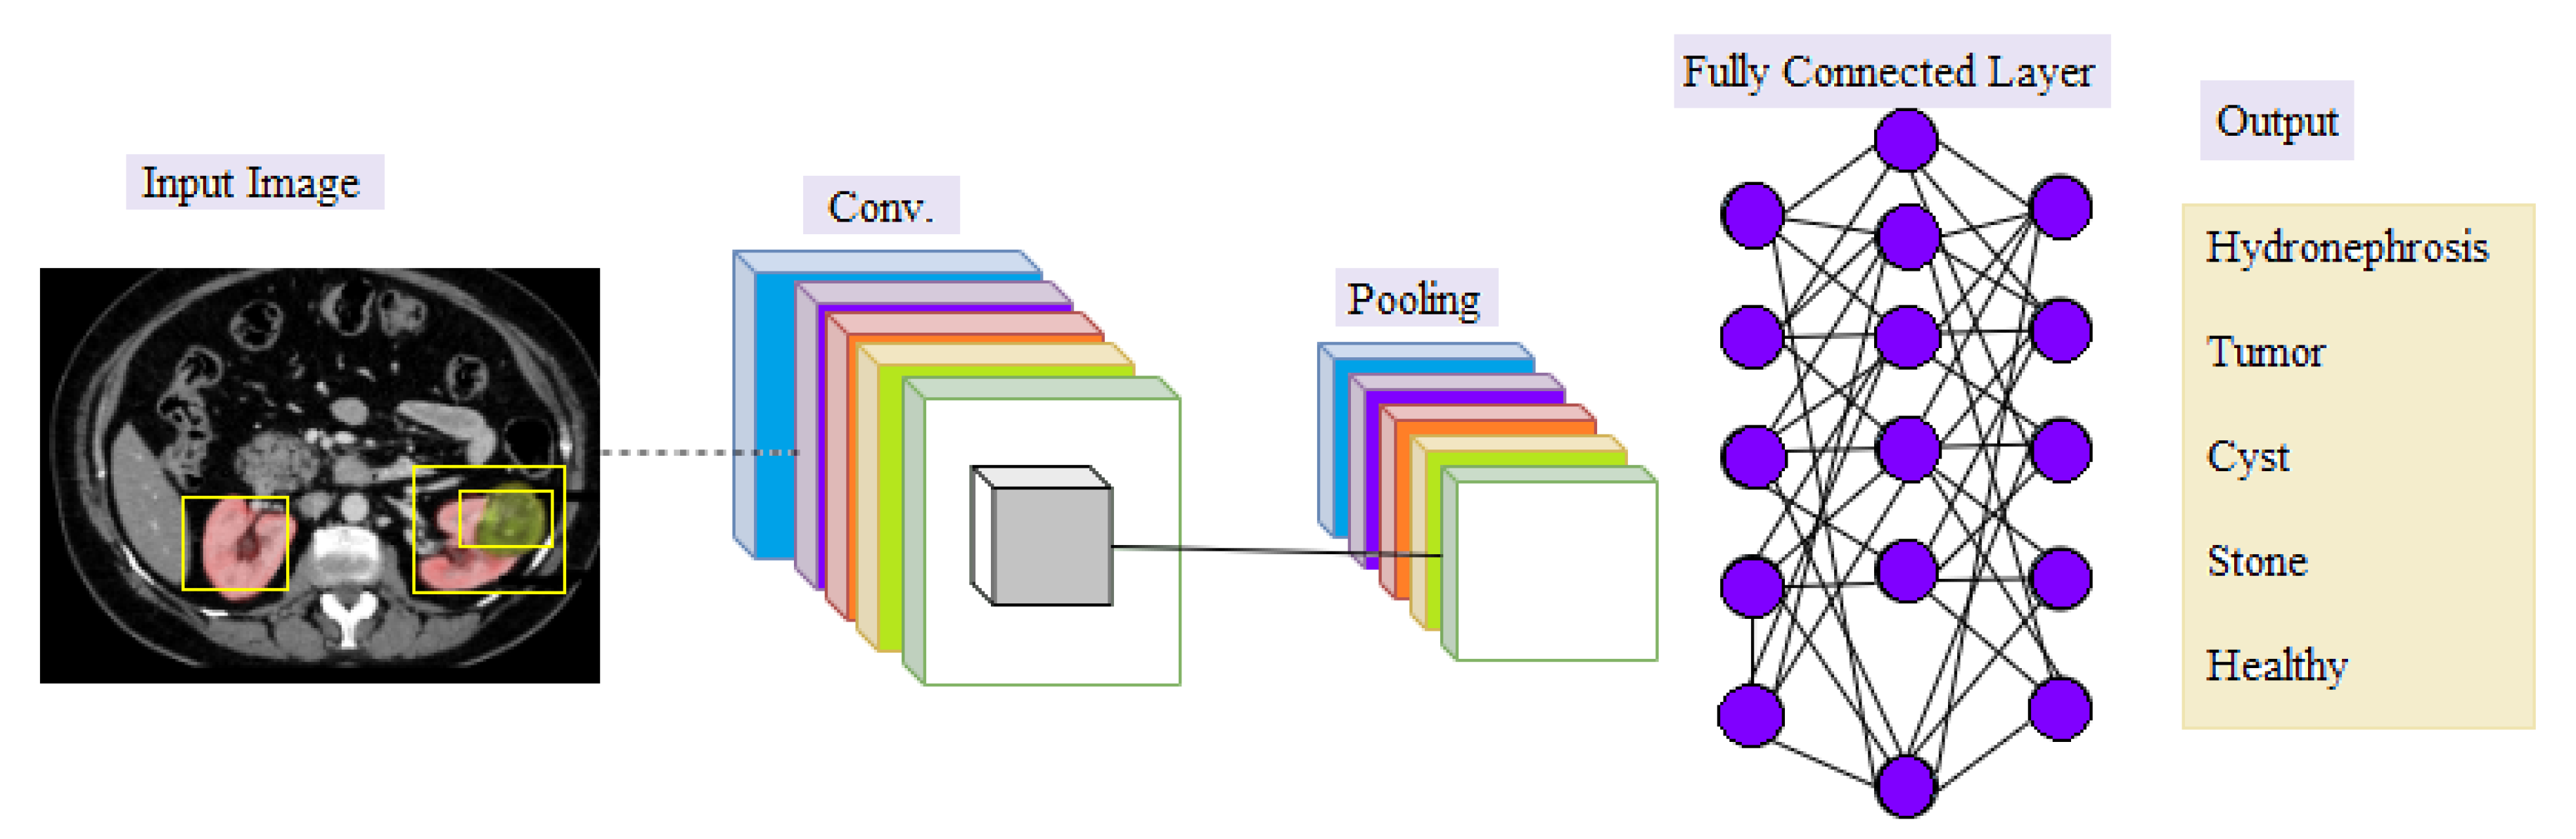
Convolutional Neural Network (CNN)
- Convolutional Layer: In the convolutional layer, a filter (known as a kernel) is used to determine the existence of patterns in the input images (original image), after which several filters can be employed to extract different features. The filter is a small size to have the ability to scan the whole image and apply the appropriate arithmetic between the filter and the pixels to extract the features. The filter settings are reset during the periodic training phase, and when the network has been trained for a sectionicular number of epochs (epochs imply all training samples have been entered simultaneously), these filters start looking for different characteristics in the image. Simple and evident features, such as edges in various directions, are extracted using the first hidden layers. The complexity of the attributes which must be recognized and extracted rises as we go deeper into the network’s hidden levels [42,43].
- Pooling Layer: The purpose of the pooling is to reduce the size of the activation maps. This is not necessary but prevents you from falling into an overfitting situation. The idea behind clustering is simple, as large arrays are scaled down [42].
- Fully-connected Layer: This layer is the last, where neurons are fully connected to all nodes of the previous layer. The final classification process takes place in it [44].
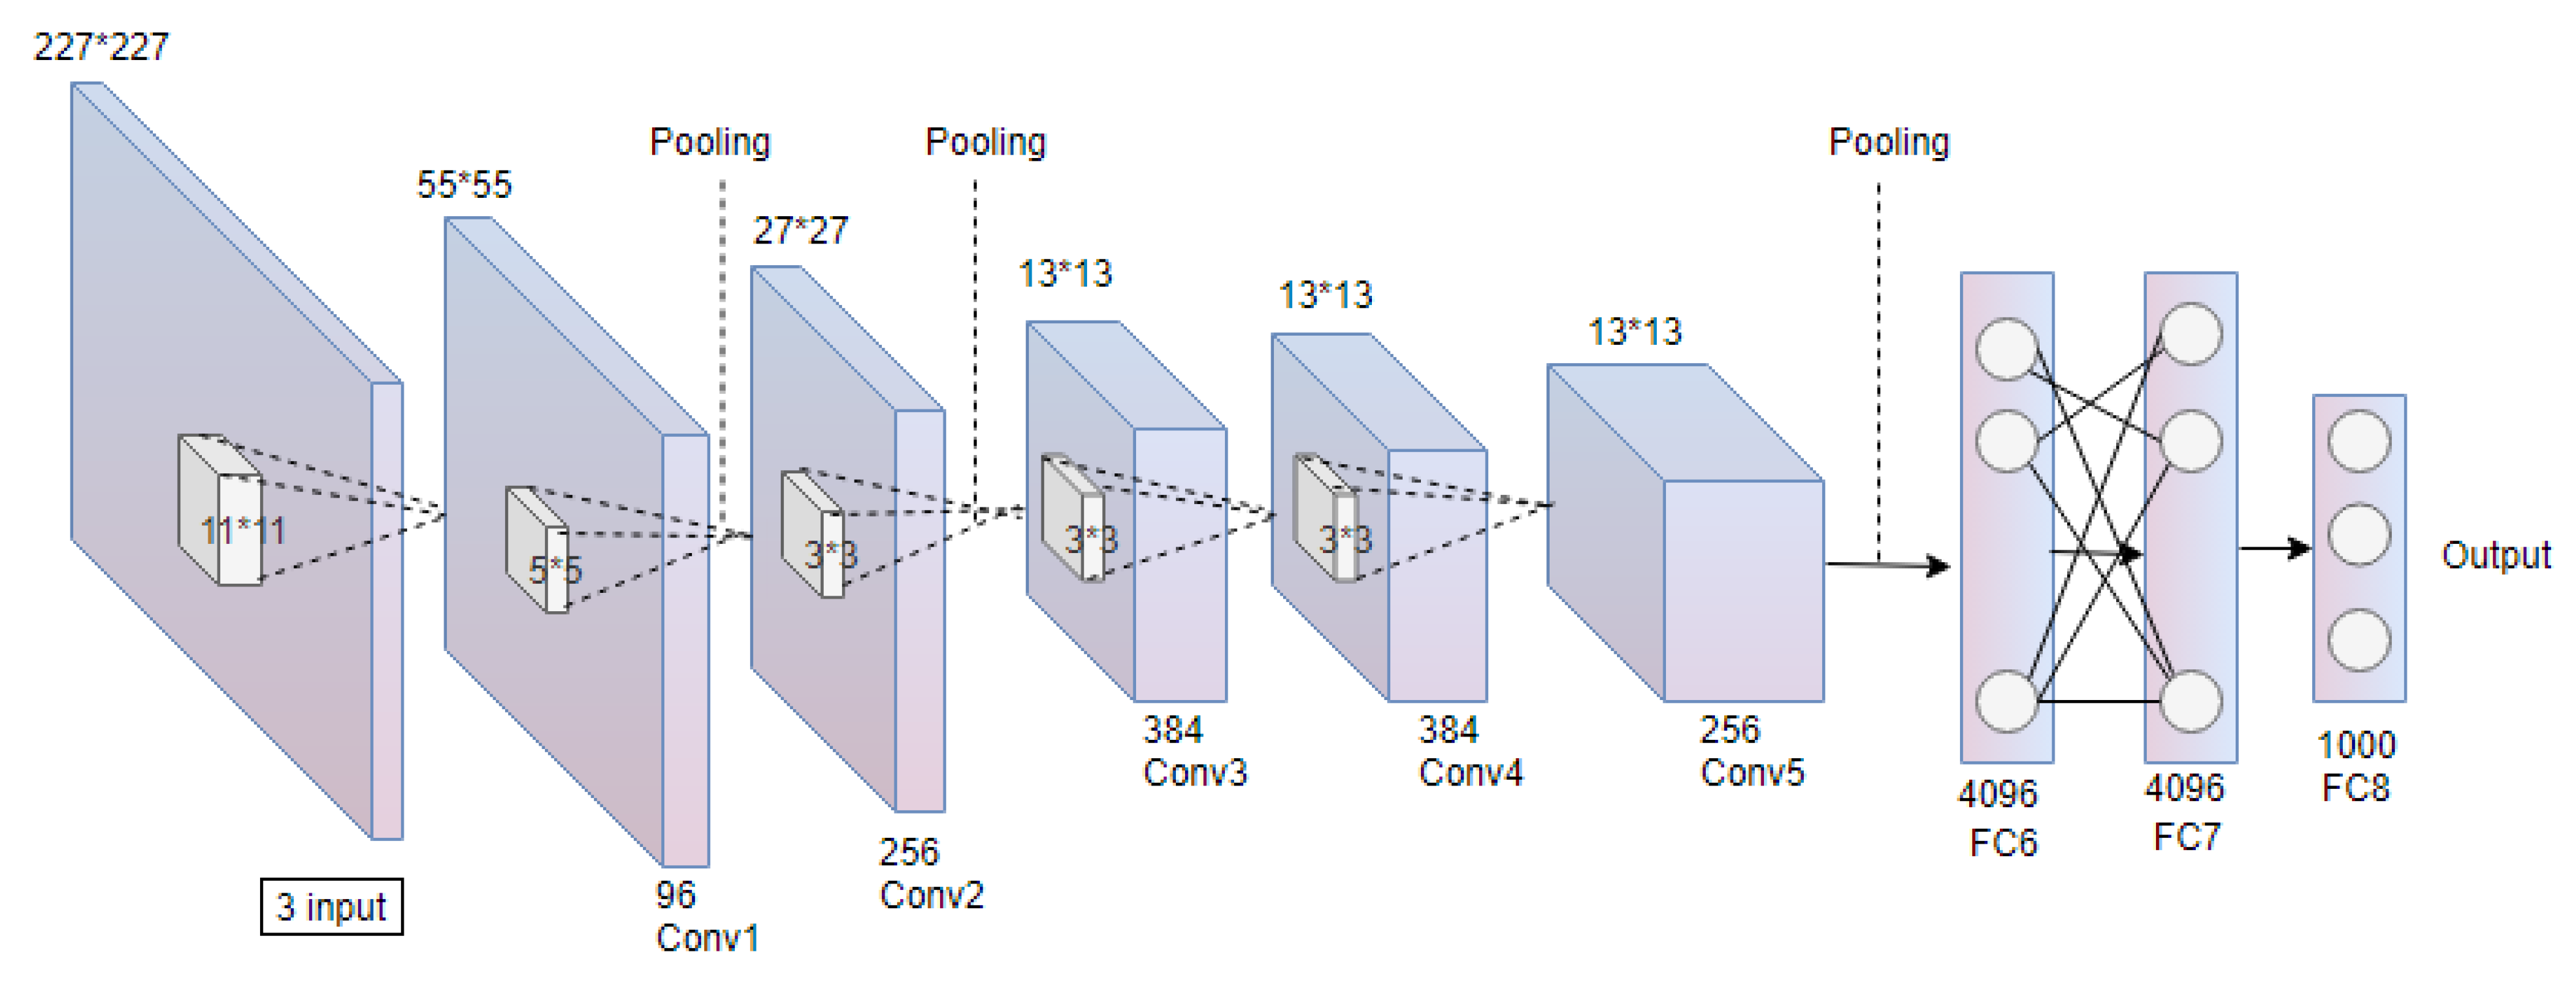
- AlexNetAlexNet is a convolutional neural network developed by Alex Krizhevsky et al. (2012) for the ImageNet competition, and they achieved 84.6%. The network contains eight layers, five Conv layers, and three FC layers. Besides, its learning time is 12.90 s [45]. Figure 8 shows an illustration of the AlexNet architecture. In this figure, * present the size dimension.

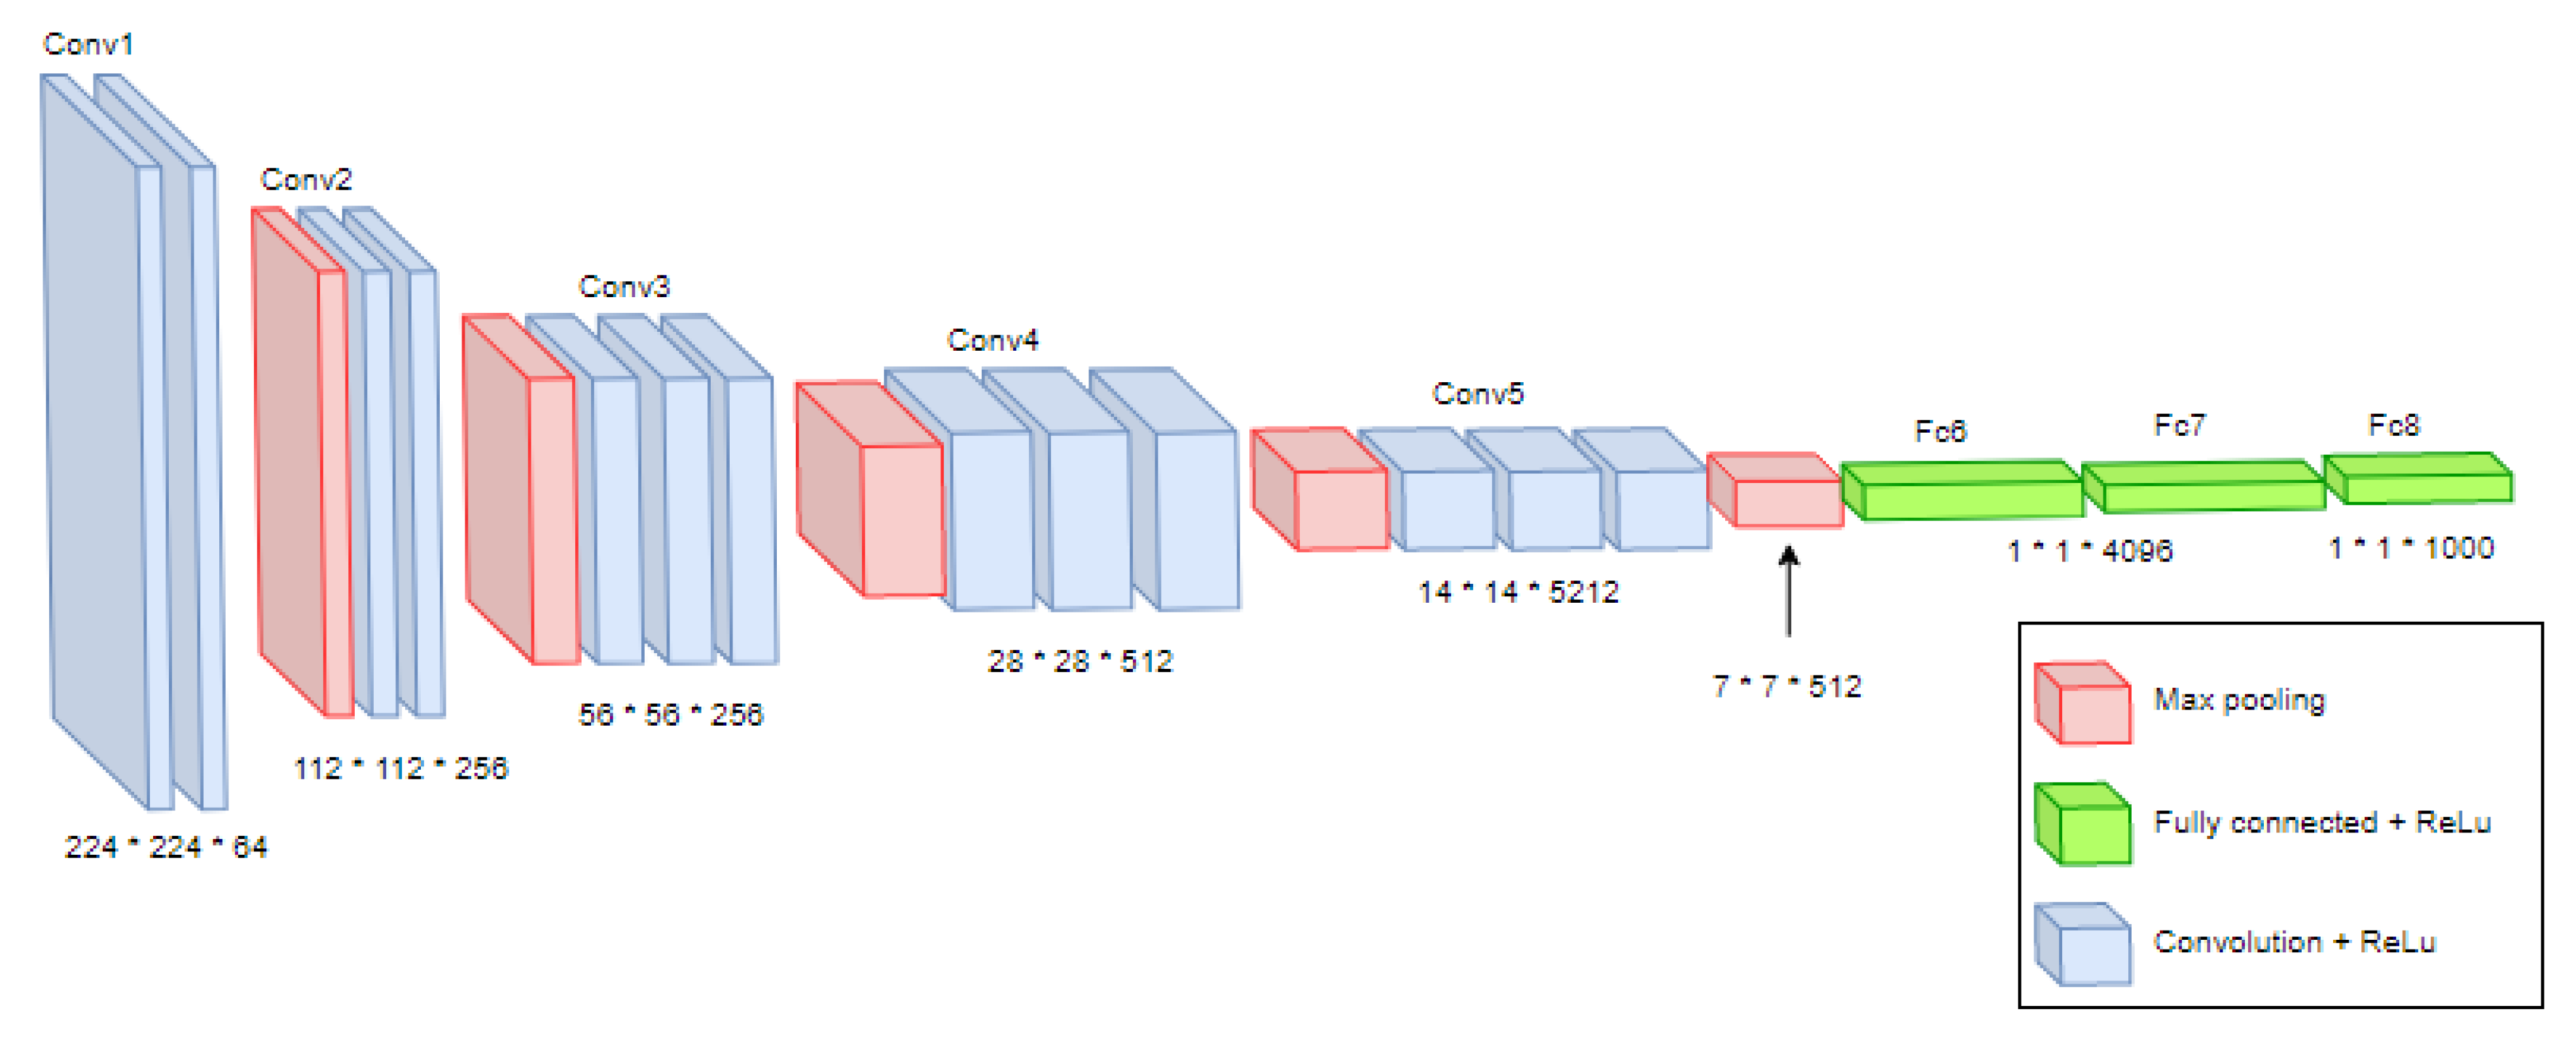
- VGG16

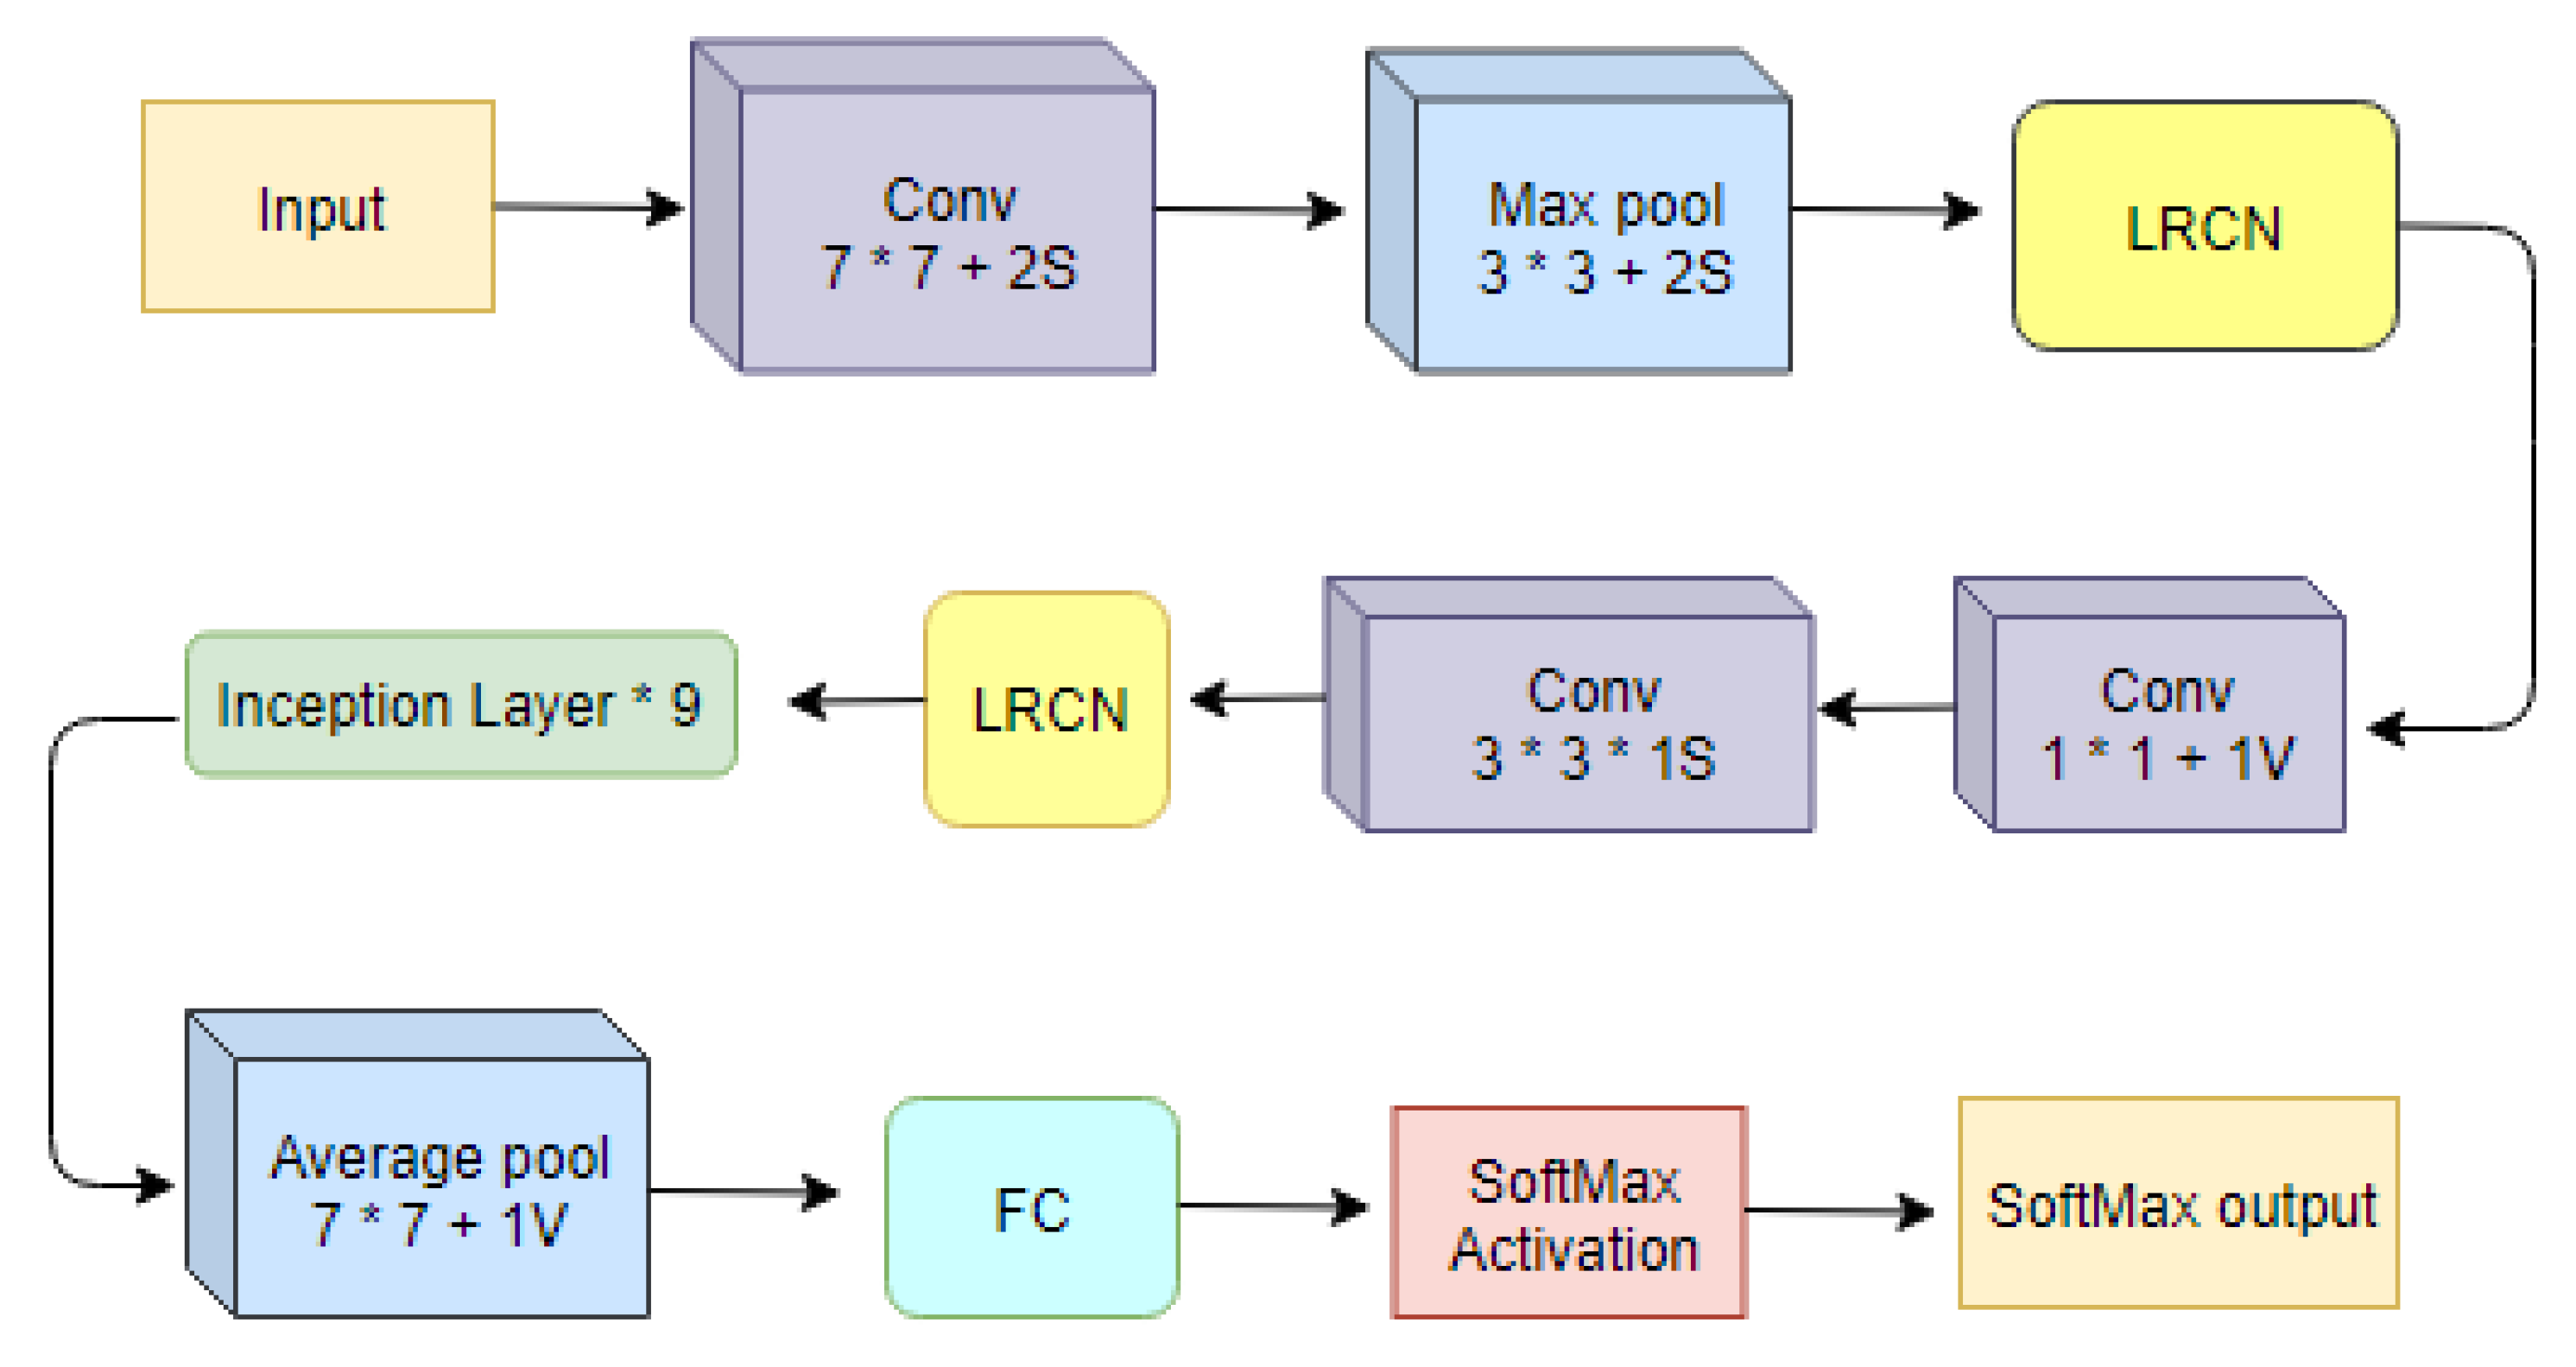
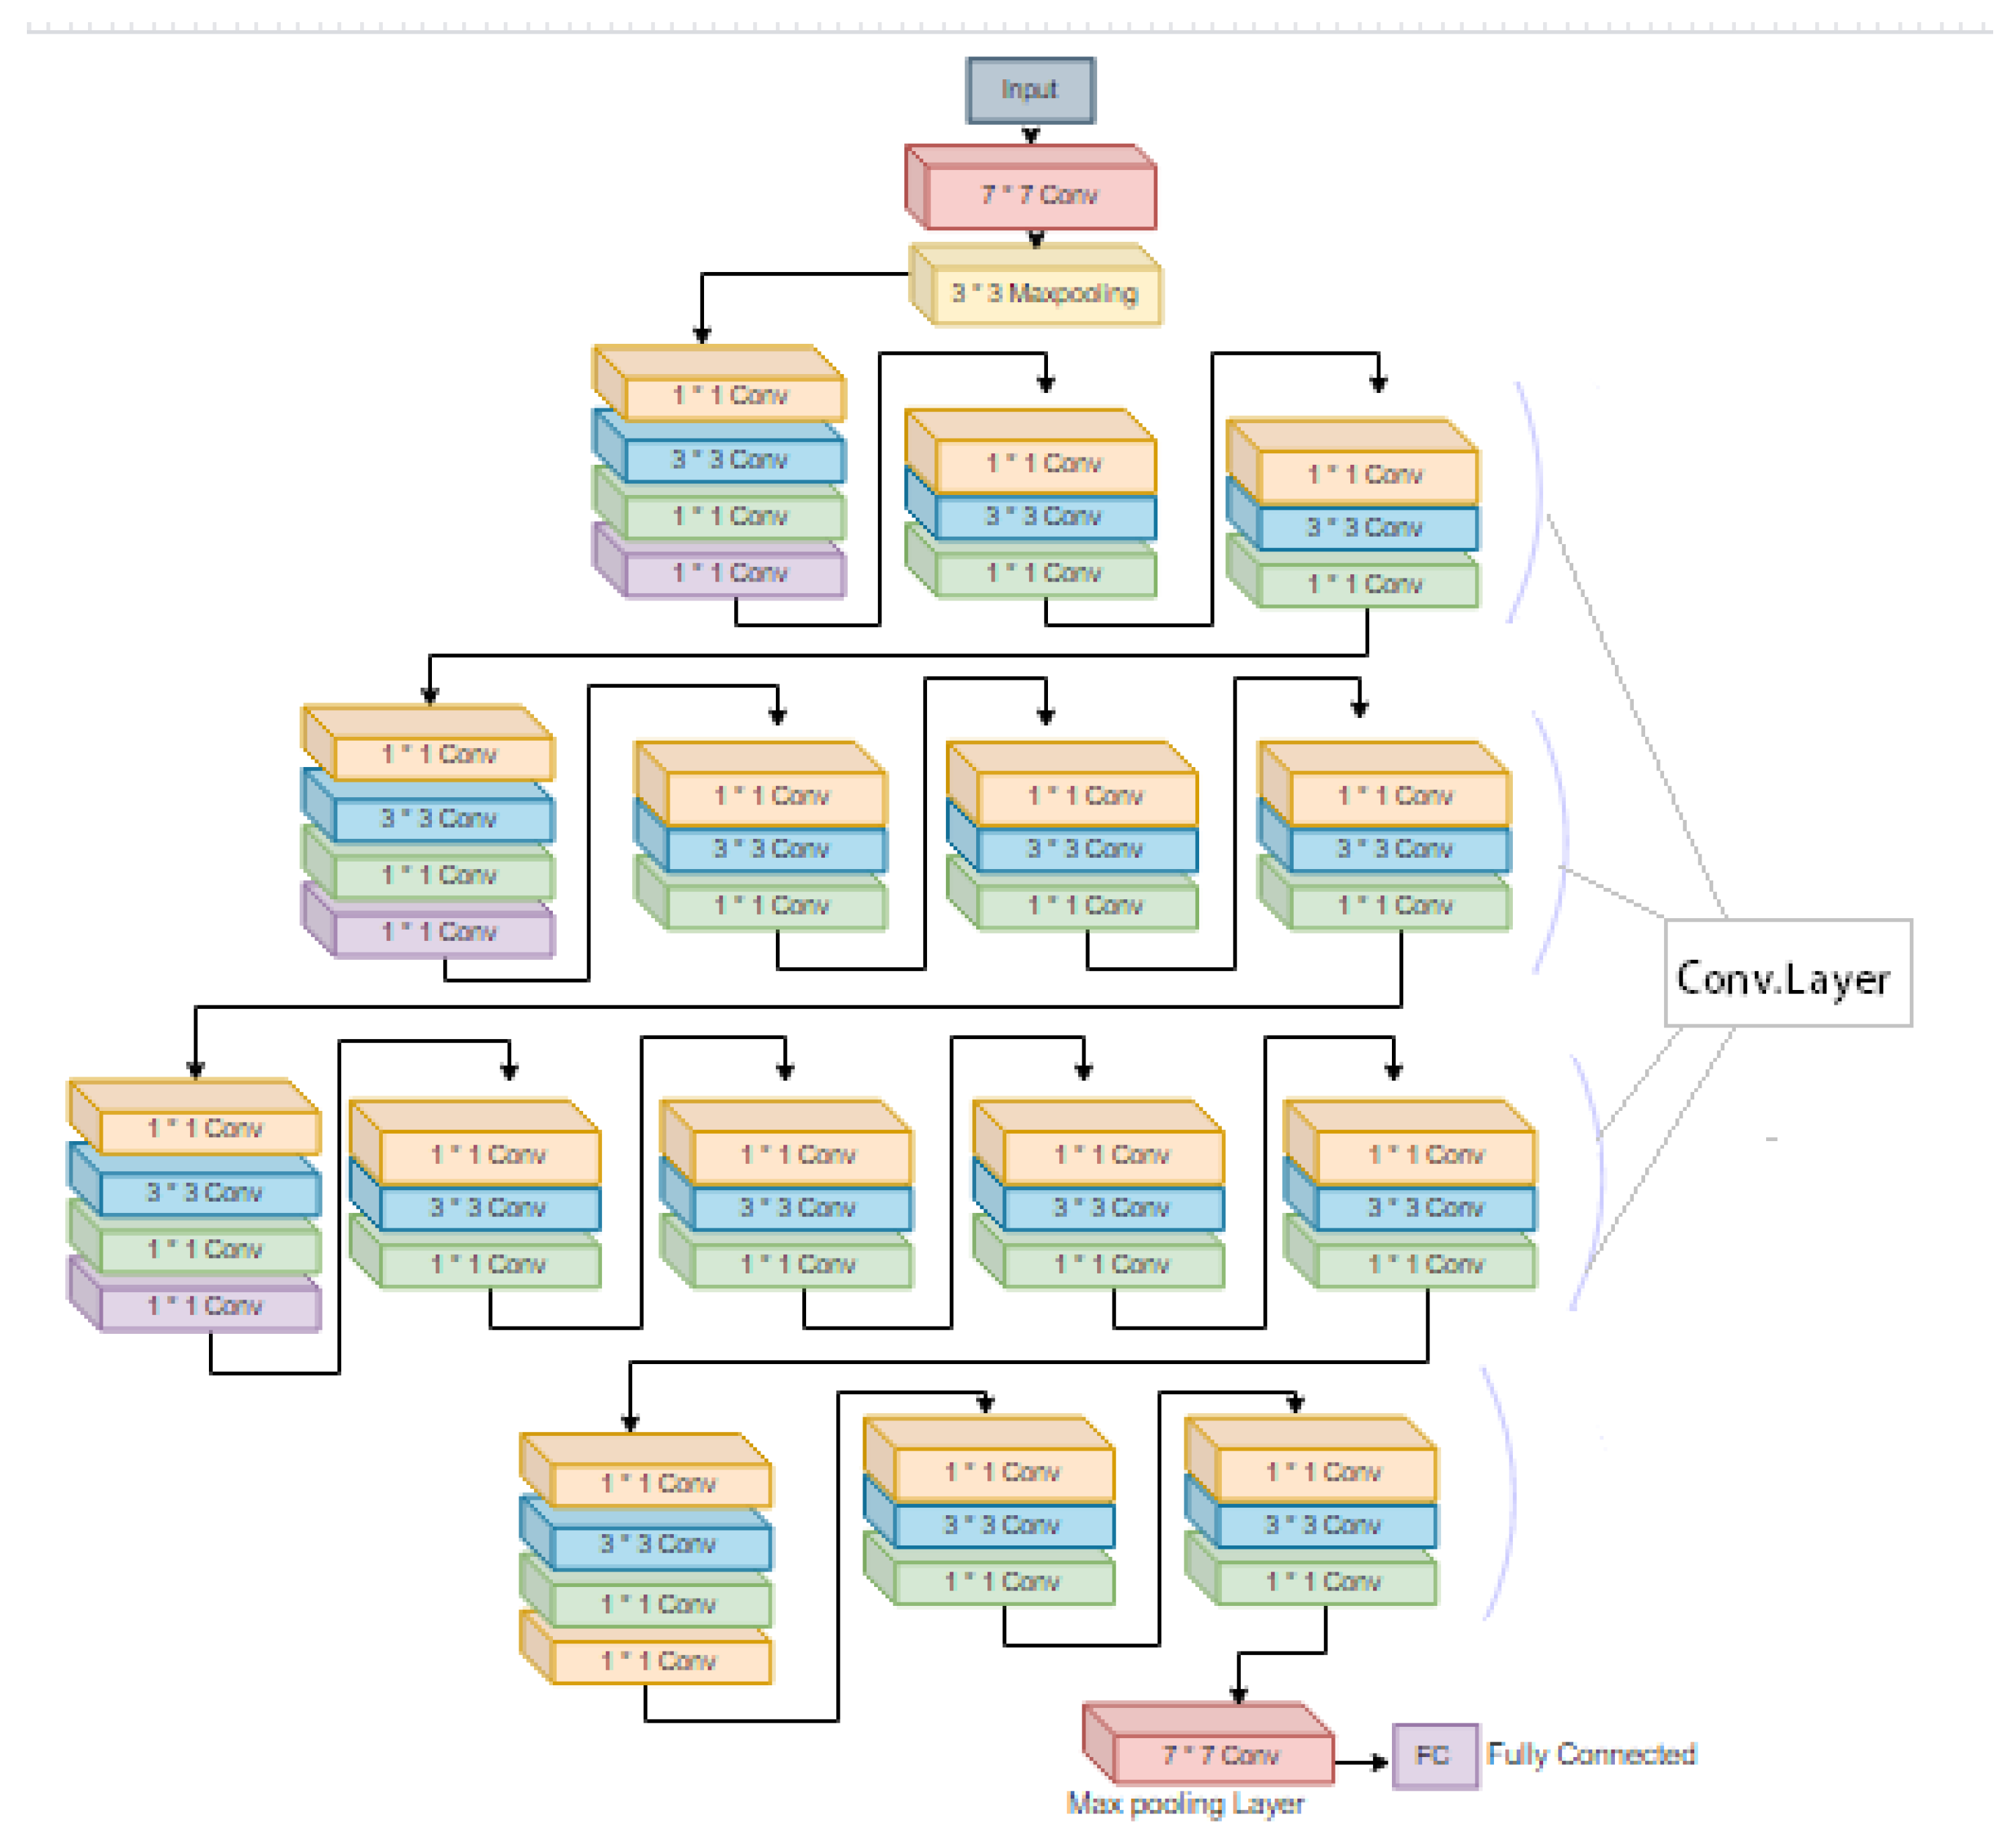
- GoogleNetGoogLeNet is a CNN developed in (2014); the first version of the Inception network is GoogleNet. It consists of 22 layers containing 21 Conv and 1 FC layer, with 27 pooling layers included. In addition, nine inception modules stacked linearly in total. In addition, the ends of the inception model are connected to the global average pooling layer. Besides, its learning time is 12.98 ms [47]. Figure 10 shows an illustration of the GoogleNet architecture.

- ResNet50

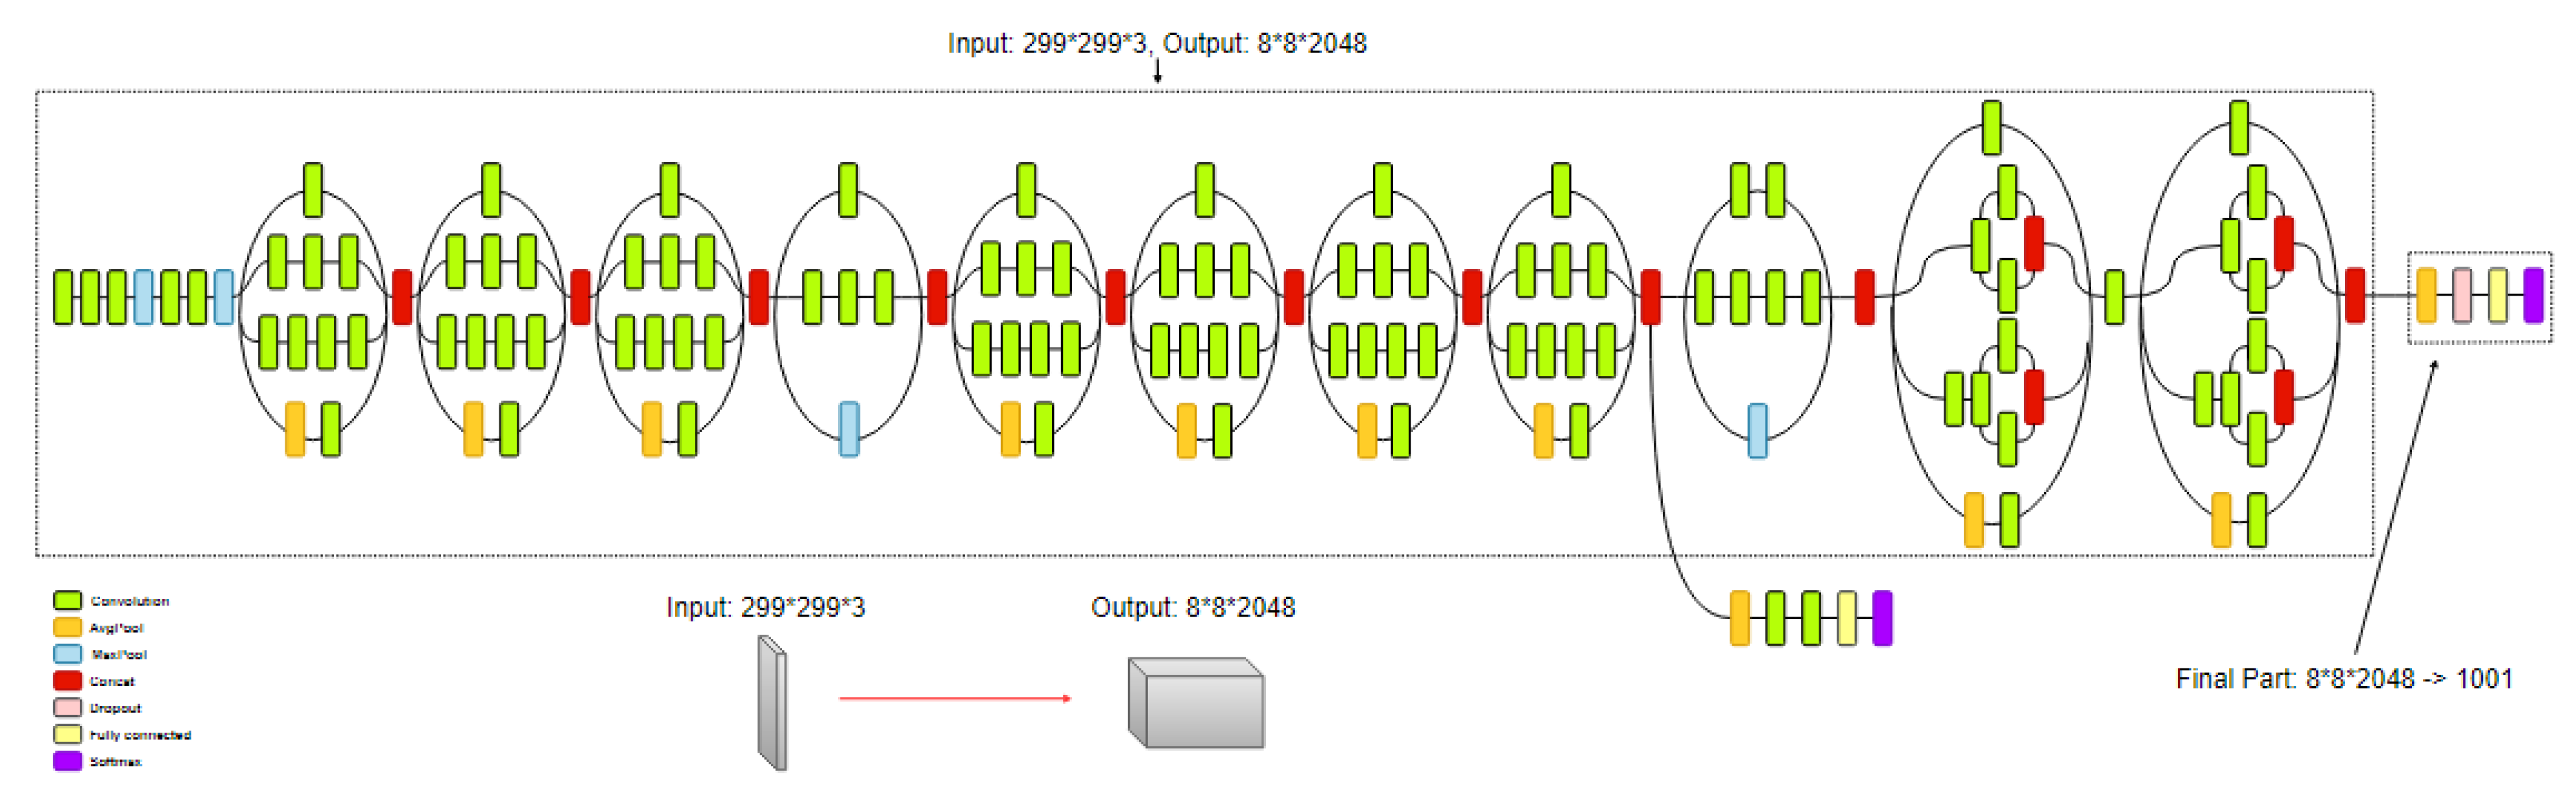
- InceptionV3

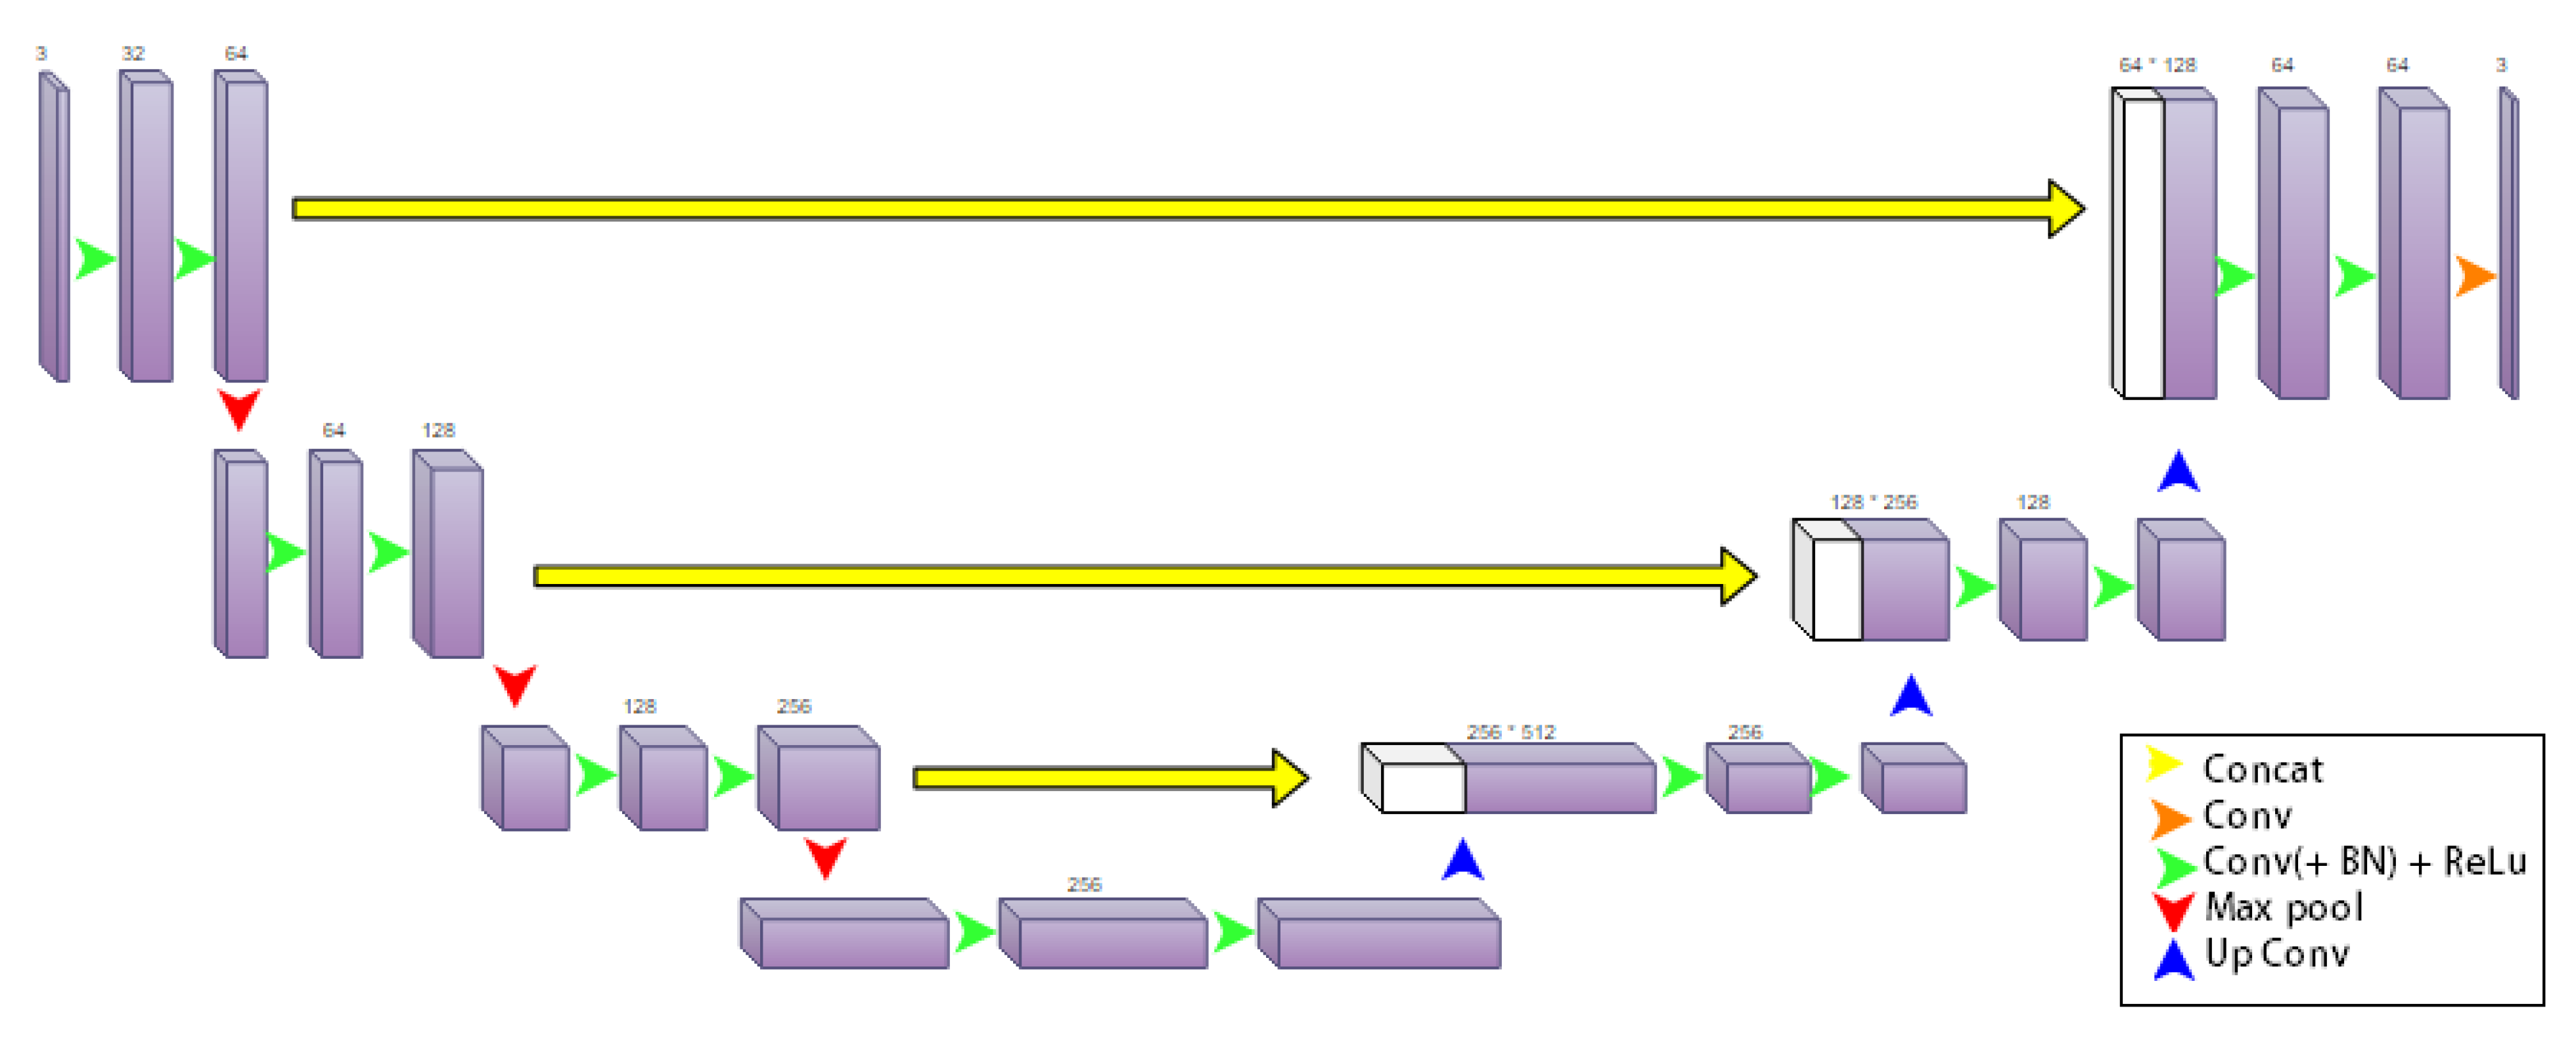
- 3D U-NetA CNN developed in (2016) for segmentation, learning dense volumetric from scattered annotation, it contains an analysis-synthesis path. In the analysis path, each layer contains two 3 × 3 × 3 Conv, each proceeded by a ReLU, and then a 2 × 2 × 2 max pooling with strides of 2 in each dimension. Besides, its learning time is 3.3 ms [47]. Figure 13 shows an illustration of the U-net architecture.

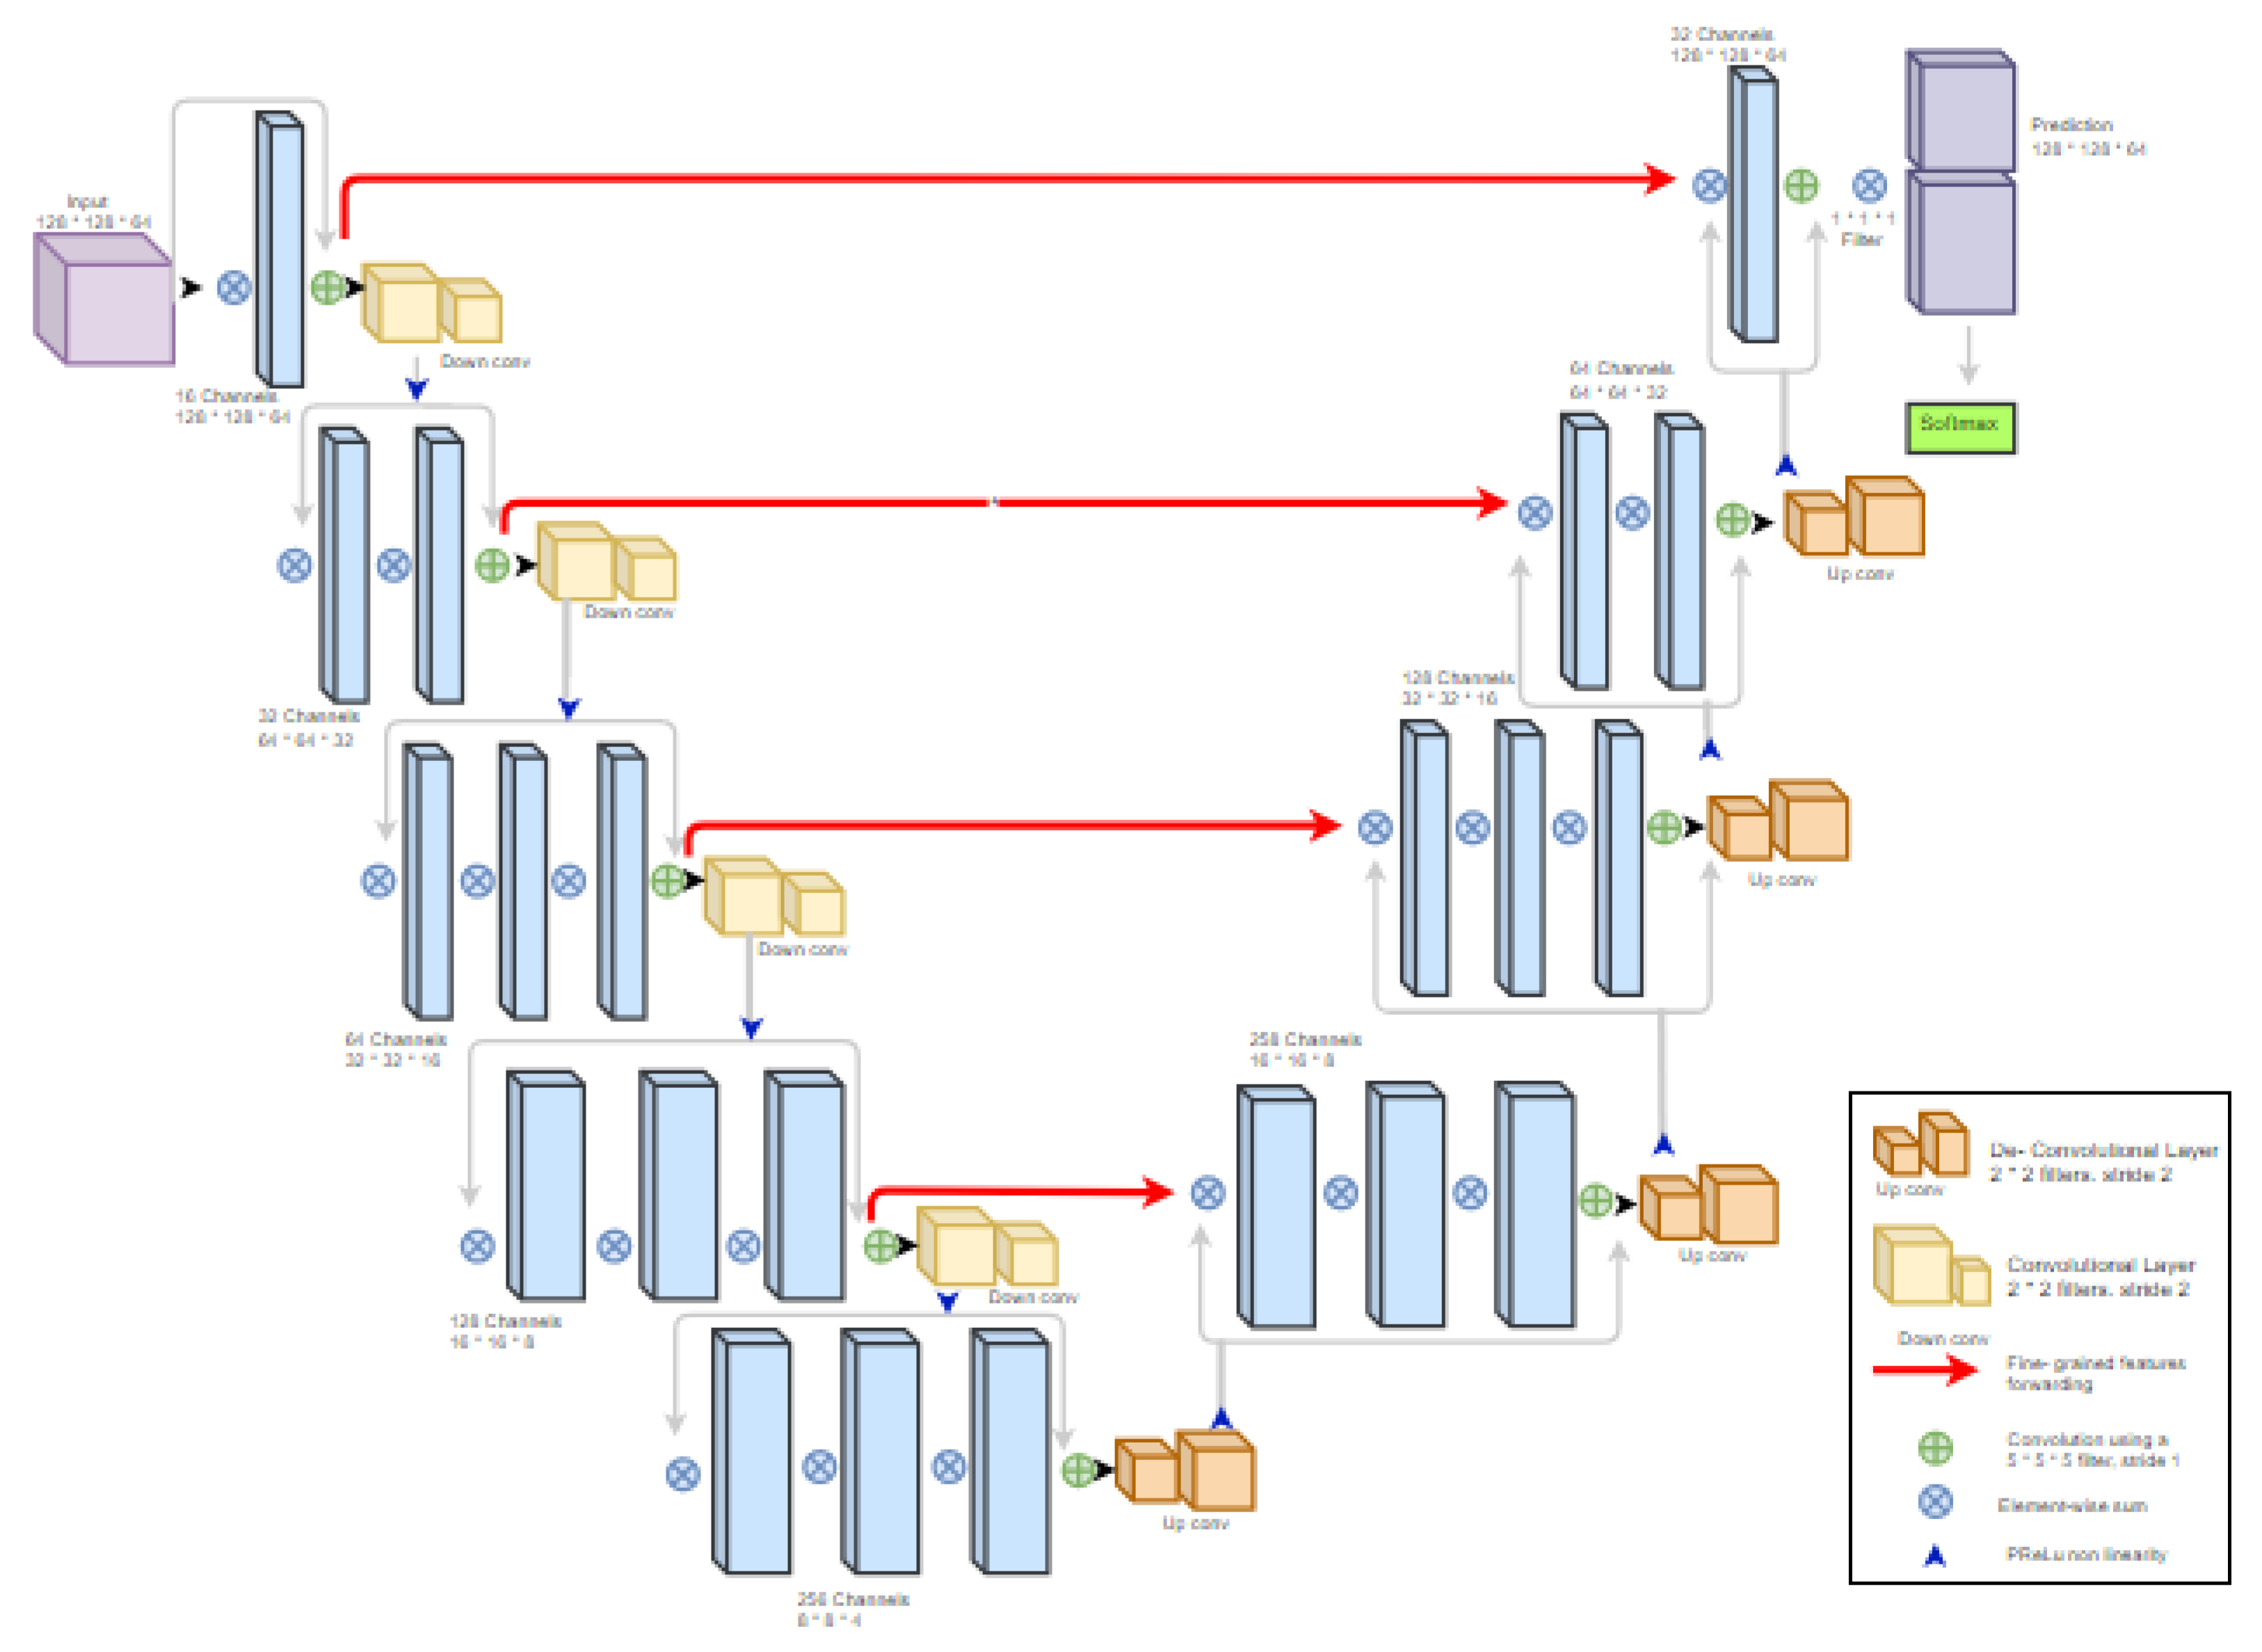
- V-NetV-Net is a CNN developed in (2016) for segmentation, and it is analogous to U-Net, but with few variations. The left half of the network compresses the signal, while the right half decompresses it until it reaches its original height. Besides, its learning time is 1.5 ms [47,48]. Figure 14 shows an illustration of the V-Net architecture.

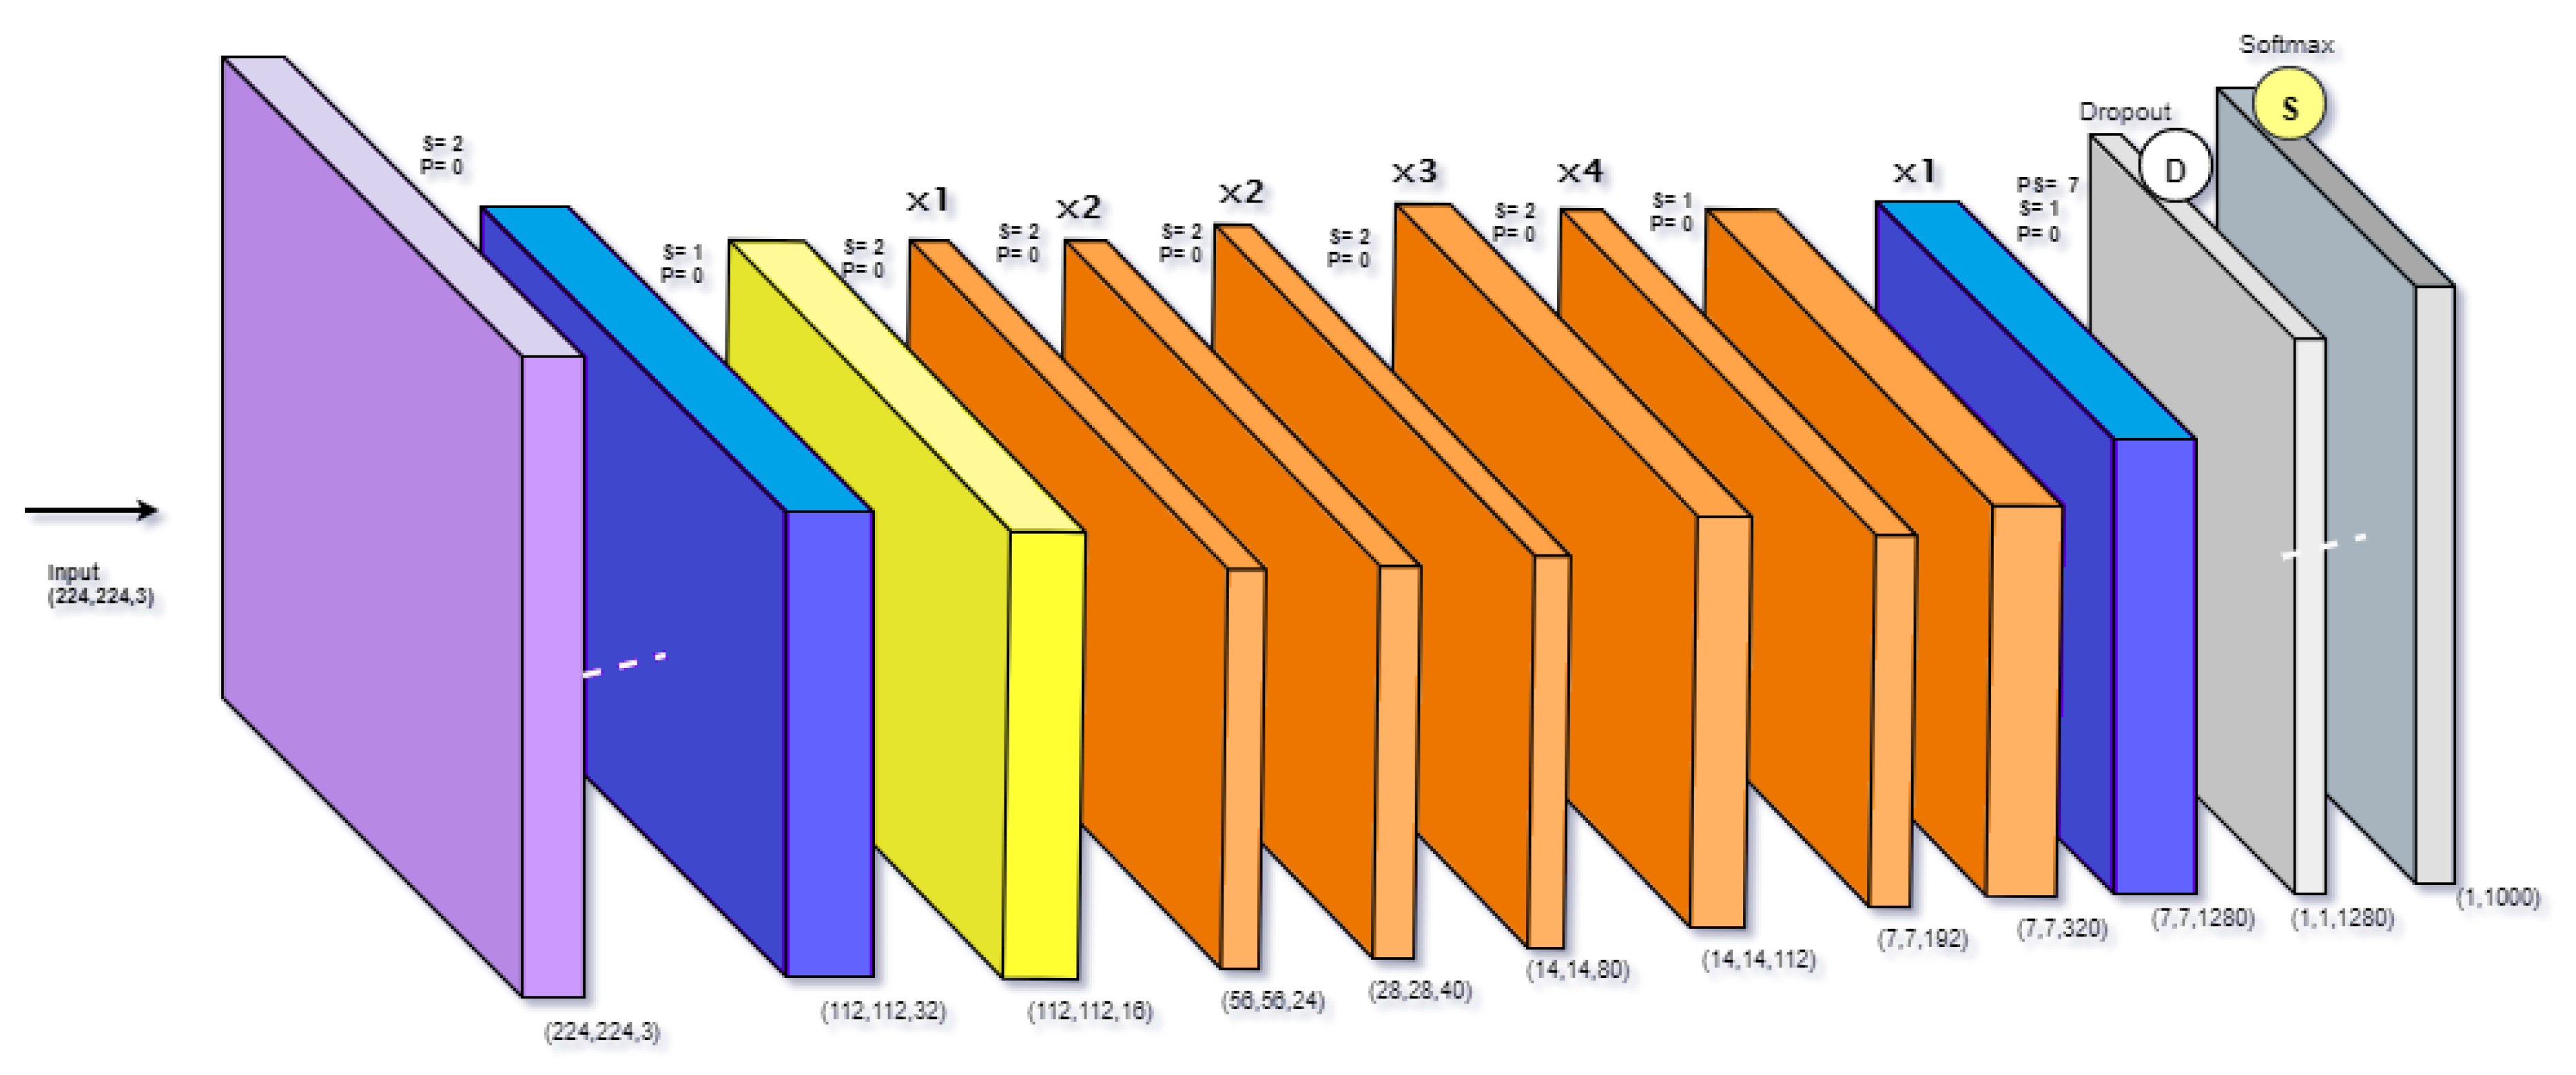
- EfficientNet

6. Literature Review
6.1. Object Detection
6.2. Classification
6.3. Image Segmentation
6.4. Multi-Modality
7. Discussion and Critical Analysis
8. Conclusions
Author Contributions
Funding
Institutional Review Board Statement
Informed Consent Statement
Data Availability Statement
Conflicts of Interest
References
- Yu, K.H.; Beam, A.L.; Kohane, I.S. Artificial intelligence in healthcare. Nat. Biomed. Eng. 2018, 2, 719–731. [Google Scholar] [CrossRef] [PubMed]
- Gharaibeh, M.; Almahmoud, M.; Ali, M.; Al-Badarneh, A.; El-Heis, M.; Abualigah, L.; Altalhi, M.; Alaiad, A.; Gandomi, A.H. Early Diagnosis of Alzheimer’s Disease Using Cerebral Catheter Angiogram Neuroimaging: A Novel Model Based on Deep Learning Approaches. Big Data Cogn. Comput. 2022, 6, 2. [Google Scholar] [CrossRef]
- Murdoch, T.B.; Detsky, A.S. The inevitable application of big data to health care. JAMA 2013, 309, 1351–1352. [Google Scholar] [CrossRef] [PubMed]
- Klepaczko, A.; Majos, M.; Stefańczyk, L.; Ejkefjord, E.; Lundervold, A. Whole kidney and renal cortex segmentation in contrast-enhanced MRI using a joint classification and segmentation convolutional neural network. Biocybern. Biomed. Eng. 2022, 42, 295–311. [Google Scholar] [CrossRef]
- Fuat, T.; Murat, L.; Barişçi, N. Machine Learning of Kidney Tumors and Diagnosis and Classification by Deep Learning Methods. Uluslararası Mühendislik Araştırma Geliştirme Derg. 2019, 11, 802–812. [Google Scholar]
- Myronenko, A.; Hatamizadeh, A. 3d kidneys and kidney tumor semantic segmentation using boundary-aware networks. arXiv 2019, arXiv:1909.06684. [Google Scholar]
- Thomas, R.; Kanso, A.; Sedor, J.R. Chronic kidney disease and its complications. Prim. Care Clin. Off. Pract. 2008, 35, 329–344. [Google Scholar] [CrossRef] [Green Version]
- Alelign, T.; Petros, B. Kidney stone disease: An update on current concepts. Adv. Urol. 2018, 2018, 3068365. [Google Scholar] [CrossRef]
- Ghaderian, S.B.; Beladi-Mousavi, S.S. The role of diabetes mellitus and hypertension in chronic kidney disease. J. Ren. Inj. Prev. 2014, 3, 109. [Google Scholar]
- Akhtar, M.; Taha, N.M.; Nauman, A.; Mujeeb, I.B.; Al-Nabet, A.D.M. Diabetic kidney disease: Past and present. Adv. Anat. Pathol. 2020, 27, 87–97. [Google Scholar] [CrossRef]
- Pirkle, J.L.; Freedman, B.I. Hypertension and chronic kidney disease: Controversies in pathogenesis and treatment. Minerva Urol. Nefrol. Ital. J. Urol. Nephrol. 2013, 65, 37. [Google Scholar]
- Leveridge, M.J.; Jewett, M.A. Recent developments in kidney cancer. Can. Urol. Assoc. J. 2011, 5, 195. [Google Scholar] [CrossRef] [PubMed]
- Li, Z.y.; Chen, Y.m.; Qiu, L.q.; Chen, D.q.; Hu, C.g.; Xu, J.y.; Zhang, X.h. Prevalence, types, and malformations in congenital anomalies of the kidney and urinary tract in newborns: A retrospective hospital-based study. Ital. J. Pediatr. 2019, 45, 1–7. [Google Scholar] [CrossRef] [PubMed]
- Rao, S.; Carter, W.B.; Mapes, D.L.; Kallich, J.D.; Kamberg, C.J.; Spritzer, K.L.; Hays, R.D. Development of subscales from the symptoms/problems and effects of kidney disease scales of the kidney disease quality of life instrument. Clin. Ther. 2000, 22, 1099–1111. [Google Scholar] [CrossRef]
- Vogelzang, N.J.; Stadler, W.M. Kidney cancer. Lancet 1998, 352, 1691–1696. [Google Scholar] [CrossRef]
- Linehan, W.M. Genetic basis of kidney cancer: Role of genomics for the development of disease-based therapeutics. Genome Res. 2012, 22, 2089–2100. [Google Scholar] [CrossRef] [Green Version]
- Ricketts, R.; Tamboli, P.; Czerniak, B.; Guo, C.C. Tumor-to-tumor metastasis: Report of 2 cases of metastatic carcinoma to angiomyolipoma of the kidney. Arch. Pathol. Lab. Med. 2008, 132, 1016–1020. [Google Scholar] [CrossRef]
- McAninch, J.W.; Lue, T.F. Smith & Tanagho’s General Urology. Ph.D. Thesis, Univerza v Ljubljani, Medicinska Fakulteta, Ljubljana, Slovenia, 2013. [Google Scholar]
- Society, A.C. Overview: Kidney Cancer. 2016. Available online: https://www.kidneycancer.org/ (accessed on 7 February 2022).
- Gago-Dominguez, M.; Yuan, J.M.; Castelao, J.E.; Ross, R.K.; Mimi, C.Y. Family history and risk of renal cell carcinoma. Cancer Epidemiol. Prev. Biomarkers 2001, 10, 1001–1004. [Google Scholar]
- Williams, P.T. Reduced risk of incident kidney cancer from walking and running. Med. Sci. Sport. Exerc. 2014, 46, 312. [Google Scholar] [CrossRef] [Green Version]
- Chow, W.H.; Gridley, G.; Fraumeni, J.F., Jr.; Järvholm, B. Obesity, hypertension, and the risk of kidney cancer in men. N. Engl. J. Med. 2000, 343, 1305–1311. [Google Scholar] [CrossRef]
- Tanagho, E.A.; McAninch, J.W. Smith’s General Urology; McGraw-Hill: New York, NY, USA, 1996. [Google Scholar]
- Corcoran, A.T.; Russo, P.; Lowrance, W.T.; Asnis-Alibozek, A.; Libertino, J.A.; Pryma, D.A.; Divgi, C.R.; Uzzo, R.G. A review of contemporary data on surgically resected renal masses—Benign or malignant? Urology 2013, 81, 707–713. [Google Scholar] [CrossRef] [PubMed]
- Decision Support in Medicine. Available online: https://www.thecardiologyadvisor.com/home/decision-support-in-medicine/ (accessed on 7 February 2022).
- Wagle, D.G.; Moore, R.H.; Murphy, G.P. Secondary carcinomas of the kidney. J. Urol. 1975, 114, 30–32. [Google Scholar] [CrossRef]
- Reznek, R.H. CT/MRI in staging renal cell carcinoma. Cancer Imaging 2004, 4, S25. [Google Scholar] [CrossRef] [PubMed]
- Quaia, E. Radiological Imaging of the Kidney; Springer: Berlin/Heidelberg, Germany, 2014. [Google Scholar]
- Herts, B.R. Imaging for renal tumors. Curr. Opin. Urol. 2003, 13, 181–186. [Google Scholar] [CrossRef]
- Semelka, R.; Shoenut, J.; Kroeker, M.; MacMahon, R.; Greenberg, H. Renal lesions: Controlled comparison between CT and 1.5-T MR imaging with nonenhanced and gadolinium-enhanced fat-suppressed spin-echo and breath-hold FLASH techniques. Radiology 1992, 182, 425–430. [Google Scholar] [CrossRef]
- Nazim, S.M.; Ather, M.H.; Hafeez, K.; Salam, B. Accuracy of multidetector CT scans in staging of renal carcinoma. Int. J. Surg. 2011, 9, 86–90. [Google Scholar] [CrossRef] [Green Version]
- Hallscheidt, P.J.; Fink, C.; Haferkamp, A.; Bock, M.; Luburic, A.; Zuna, I.; Noeldge, G.; Kauffmann, G. Preoperative staging of renal cell carcinoma with inferior vena cava thrombus using multidetector CT and MRI: Prospective study with histopathological correlation. J. Comput. Assist. Tomogr. 2005, 29, 64–68. [Google Scholar] [CrossRef]
- Bai, W.; Fadil, Y.; Chadli, A.; Dakir, M.; Debbagh, A.; Aboutaeib, R. Correlation between CT and anatomopathological staging of kidney cancer. Int. J. Surg. Case Rep. 2021, 80, 105687. [Google Scholar] [CrossRef]
- van Oostenbrugge, T.J.; Fütterer, J.J.; Mulders, P.F. Diagnostic imaging for solid renal tumors: A pictorial review. Kidney Cancer 2018, 2, 79–93. [Google Scholar] [CrossRef] [Green Version]
- Kotsiantis, S.B.; Zaharakis, I.; Pintelas, P. Supervised machine learning: A review of classification techniques. Emerg. Artif. Intell. Appl. Comput. Eng. 2007, 160, 3–24. [Google Scholar]
- Pu, Y.; Gan, Z.; Henao, R.; Yuan, X.; Li, C.; Stevens, A.; Carin, L. Variational autoencoder for deep learning of images, labels and captions. arXiv 2016, arXiv:1609.08976. [Google Scholar]
- Ongsulee, P. Artificial intelligence, machine learning and deep learning. In Proceedings of the 2017 15th International Conference on ICT and Knowledge Engineering (ICT&KE), Bangkok, Thailand, 22–24 November 2017; pp. 1–6. [Google Scholar]
- Krizhevsky, A.; Sutskever, I.; Hinton, G.E. Imagenet classification with deep convolutional neural networks. Adv. Neural Inf. Process. Syst. 2012, 25, 1097–1105. [Google Scholar] [CrossRef]
- Kang, L.; Zhou, Z.; Huang, J.; Han, W.; Member, I. Renal tumors segmentation in abdomen CT Images using 3D-CNN and ConvLSTM. Biomed. Signal Process. Control 2022, 72, 103334. [Google Scholar] [CrossRef]
- George, M.; Anita, H. Analysis of Kidney Ultrasound Images Using Deep Learning and Machine Learning Techniques: A Review. In Pervasive Computing and Social Networking; Springer: Berlin/Heidelberg, Germany, 2022; pp. 183–199. [Google Scholar]
- Yang, E.; Kim, C.K.; Guan, Y.; Koo, B.B.; Kim, J.H. 3D Multi-Scale Residual Fully Convolutional Neural Network for Segmentation of Extremely Large-Sized Kidney Tumor. Comput. Methods Programs Biomed. 2022, 72, 106616. [Google Scholar] [CrossRef] [PubMed]
- Aghdam, H.H.; Heravi, E.J. Guide to Convolutional Neural Networks; Springer: New York, NY, USA, 2017; Volume 10, pp. 973–978. [Google Scholar]
- Ciregan, D.; Meier, U.; Schmidhuber, J. Multi-column deep neural networks for image classification. In Proceedings of the 2012 IEEE Conference on Computer Vision and Pattern Recognition, Providence, RI, USA, 16–21 June 2012; pp. 3642–3649. [Google Scholar]
- Shin, H.C.; Roth, H.R.; Gao, M.; Lu, L.; Xu, Z.; Nogues, I.; Yao, J.; Mollura, D.; Summers, R.M. Deep convolutional neural networks for computer-aided detection: CNN architectures, dataset characteristics and transfer learning. IEEE Trans. Med. Imaging 2016, 35, 1285–1298. [Google Scholar] [CrossRef] [Green Version]
- Iandola, F.N.; Han, S.; Moskewicz, M.W.; Ashraf, K.; Dally, W.J.; Keutzer, K. SqueezeNet: AlexNet-level accuracy with 50x fewer parameters and< 0.5 MB model size. arXiv 2016, arXiv:1602.07360. [Google Scholar]
- Qassim, H.; Verma, A.; Feinzimer, D. Compressed residual-VGG16 CNN model for big data places image recognition. In Proceedings of the 2018 IEEE 8th Annual Computing and Communication Workshop and Conference (CCWC), Las Vegas, NV, USA, 8–10 January 2018; pp. 169–175. [Google Scholar]
- Szegedy, C.; Vanhoucke, V.; Ioffe, S.; Shlens, J.; Wojna, Z. Rethinking the inception architecture for computer vision. In Proceedings of the IEEE Conference on Computer Vision and Pattern Recognition, Las Vegas, NV, USA, 27–30 June 2016; pp. 2818–2826. [Google Scholar]
- Lin, S.; Jia, H.; Abualigah, L.; Altalhi, M. Enhanced Slime Mould Algorithm for Multilevel Thresholding Image Segmentation Using Entropy Measures. Entropy 2021, 23, 1700. [Google Scholar] [CrossRef]
- Tan, M.; Le, Q. Efficientnet: Rethinking model scaling for convolutional neural networks. In Proceedings of the International Conference on Machine Learning, PMLR, Long Beach, CA, USA, 9–15 June 2019; pp. 6105–6114. [Google Scholar]
- Rafi, M.; Shetty, A.; Gunja, N. Accuracy of computed tomography of the kidneys, ureters and bladder interpretation by emergency physicians. Emerg. Med. Australas. 2013, 25, 422–426. [Google Scholar] [CrossRef]
- Ghalib, M.R.; Bhatnagar, S.; Jayapoorani, S.; Pande, U. Artificial neural network based detection of renal tumors using CT scan image processing. Int. J. Eng. Technol. (IJET) 2014, 2, 28–35. [Google Scholar]
- Liu, J.; Wang, S.; Linguraru, M.G.; Yao, J.; Summers, R.M. Computer-aided detection of exophytic renal lesions on non-contrast CT images. Med. Image Anal. 2015, 19, 15–29. [Google Scholar] [CrossRef] [Green Version]
- Attia, M.W.; Abou-Chadi, F.; Moustafa, H.E.D.; Mekky, N. Classification of ultrasound kidney images using PCA and neural networks. Int. J. Adv. Comput. Sci. Appl. 2015, 6, 53–57. [Google Scholar]
- Mredhula, L.; Dorairangaswamy, M. Detection and Classification of tumors in CT images. Indian J. Comput. Sci. Eng. (IJCSE) 2015, 6. [Google Scholar]
- Feng, Z.; Rong, P.; Cao, P.; Zhou, Q.; Zhu, W.; Yan, Z.; Liu, Q.; Wang, W. Machine learning-based quantitative texture analysis of CT images of small renal masses: Differentiation of angiomyolipoma without visible fat from renal cell carcinoma. Eur. Radiol. 2018, 28, 1625–1633. [Google Scholar] [CrossRef] [PubMed]
- Kocak, B.; Yardimci, A.H.; Bektas, C.T.; Turkcanoglu, M.H.; Erdim, C.; Yucetas, U.; Koca, S.B.; Kilickesmez, O. Textural differences between renal cell carcinoma subtypes: Machine learning-based quantitative computed tomography texture analysis with independent external validation. Eur. J. Radiol. 2018, 107, 149–157. [Google Scholar] [CrossRef] [PubMed]
- Muhamed Ali, A.; Zhuang, H.; Ibrahim, A.; Rehman, O.; Huang, M.; Wu, A. A machine learning approach for the classification of kidney cancer subtypes using miRNA genome data. Appl. Sci. 2018, 8, 2422. [Google Scholar] [CrossRef] [Green Version]
- Tabibu, S.; Vinod, P.; Jawahar, C. Pan-Renal Cell Carcinoma classification and survival prediction from histopathology images using deep learning. Sci. Rep. 2019, 9, 1–9. [Google Scholar]
- Zhou, L.; Zhang, Z.; Chen, Y.C.; Zhao, Z.Y.; Yin, X.D.; Jiang, H.B. A deep learning-based radiomics model for differentiating benign and malignant renal tumors. Transl. Oncol. 2019, 12, 292–300. [Google Scholar] [CrossRef]
- Han, S.; Hwang, S.I.; Lee, H.J. The classification of renal cancer in 3-phase CT images using a deep learning method. J. Digit. Imaging 2019, 32, 638–643. [Google Scholar] [CrossRef] [Green Version]
- Hussain, M.A.; Hamarneh, G.; Garbi, R. ImHistNet: Learnable image histogram based DNN with application to noninvasive determination of carcinoma grades in CT scans. In Proceedings of the International Conference on Medical Image Computing and Computer-Assisted Intervention, Shenzhen, China, 13–17 October 2019; Springer: Berlin/Heidelberg, Germany, 2019; pp. 130–138. [Google Scholar]
- Zhao, W.; Jiang, D.; Queralta, J.P.; Westerlund, T. MSS U-Net: 3D segmentation of kidneys and tumors from CT images with a multi-scale supervised U-Net. Informatics Med. Unlocked 2020, 19, 100357. [Google Scholar] [CrossRef]
- Sun, X.Y.; Feng, Q.X.; Xu, X.; Zhang, J.; Zhu, F.P.; Yang, Y.H.; Zhang, Y.D. Radiologic-radiomic machine learning models for differentiation of benign and malignant solid renal masses: Comparison with expert-level radiologists. Am. J. Roentgenol. 2020, 214, W44–W54. [Google Scholar] [CrossRef]
- Nazari, M.; Shiri, I.; Hajianfar, G.; Oveisi, N.; Abdollahi, H.; Deevband, M.R.; Oveisi, M.; Zaidi, H. Noninvasive Fuhrman grading of clear cell renal cell carcinoma using computed tomography radiomic features and machine learning. Radiol. Medica 2020, 125, 754–765. [Google Scholar] [CrossRef] [PubMed] [Green Version]
- Zabihollahy, F.; Schieda, N.; Krishna, S.; Ukwatta, E. Automated classification of solid renal masses on contrast-enhanced computed tomography images using convolutional neural network with decision fusion. Eur. Radiol. 2020, 30, 5183–5190. [Google Scholar] [CrossRef] [PubMed]
- Vendrami, C.L.; McCarthy, R.J.; Villavicencio, C.P.; Miller, F.H. Predicting common solid renal tumors using machine learning models of classification of radiologist-assessed magnetic resonance characteristics. Abdom. Radiol. 2020, 45, 2797–2809. [Google Scholar] [CrossRef] [PubMed]
- Schieda, N.; Nguyen, K.; Thornhill, R.E.; McInnes, M.D.; Wu, M.; James, N. Importance of phase enhancement for machine learning classification of solid renal masses using texture analysis features at multi-phasic CT. Abdom. Radiol. 2020, 45, 2786–2796. [Google Scholar] [CrossRef]
- Yang, R.; Wu, J.; Sun, L.; Lai, S.; Xu, Y.; Liu, X.; Ma, Y.; Zhen, X. Radiomics of small renal masses on multiphasic CT: Accuracy of machine learning–based classification models for the differentiation of renal cell carcinoma and angiomyolipoma without visible fat. Eur. Radiol. 2020, 30, 1254–1263. [Google Scholar] [CrossRef]
- Yap, F.Y.; Varghese, B.A.; Cen, S.Y.; Hwang, D.H.; Lei, X.; Desai, B.; Lau, C.; Yang, L.L.; Fullenkamp, A.J.; Hajian, S.; et al. Shape and texture-based radiomics signature on CT effectively discriminates benign from malignant renal masses. Eur. Radiol. 2020, 31, 1011–1021. [Google Scholar] [CrossRef]
- Uhlig, J.; Leha, A.; Delonge, L.M.; Haack, A.M.; Shuch, B.; Kim, H.S.; Bremmer, F.; Trojan, L.; Lotz, J.; Uhlig, A. Radiomic Features and Machine Learning for the Discrimination of Renal Tumor Histological Subtypes: A Pragmatic Study Using Clinical-Routine Computed Tomography. Cancers 2020, 12, 3010. [Google Scholar] [CrossRef]
- Türk, F.; Lüy, M.; Barışçı, N. Kidney and renal tumor segmentation using a hybrid V-Net-Based model. Mathematics 2020, 8, 1772. [Google Scholar] [CrossRef]
- Sudharson, S.; Kokil, P. An ensemble of deep neural networks for kidney ultrasound image classification. Comput. Methods Programs Biomed. 2020, 197, 105709. [Google Scholar] [CrossRef]
- Haji-Momenian, S.; Lin, Z.; Patel, B.; Law, N.; Michalak, A.; Nayak, A.; Earls, J.; Loew, M. Texture analysis and machine learning algorithms accurately predict histologic grade in small (<4 cm) clear cell renal cell carcinomas: A pilot study. Abdom. Radiol. 2020, 45, 789–798. [Google Scholar]
- Pedersen, M.; Andersen, M.B.; Christiansen, H.; Azawi, N.H. Classification of renal tumour using convolutional neural networks to detect oncocytoma. Eur. J. Radiol. 2020, 133, 109343. [Google Scholar] [CrossRef]
- Luo, X.; Zeng, W.; Fan, W.; Zheng, S.; Chen, J.; Liu, R.; Liu, Z.; Chen, Y. Towards cascaded V-Net for automatic accurate kidney segmentation from abdominal CT images. In Proceedings of the Medical Imaging 2021: Image Processing. International Society for Optics and Photonics, San Diego, CA, USA, 14–18 February 2021; Volume 11596, p. 1159619. [Google Scholar]
- Akram, Z. Cancerous Tumor Segmentation of Kidney Images and Prediction of Tumor Using Medical Image Segmentation and Deep Learning Techniques. Clin. Oncol. 2021, 4, 1–9. [Google Scholar]
- Ker, J.; Wang, L.; Rao, J.; Lim, T. Deep learning applications in medical image analysis. IEEE Access 2017, 6, 9375–9389. [Google Scholar] [CrossRef]
- Abualigah, L.; Diabat, A.; Mirjalili, S.; Abd Elaziz, M.; Gandomi, A.H. The arithmetic optimization algorithm. Comput. Methods Appl. Mech. Eng. 2021, 376, 113609. [Google Scholar] [CrossRef]
- Abualigah, L.; Yousri, D.; Abd Elaziz, M.; Ewees, A.A.; Al-Qaness, M.A.; Gandomi, A.H. Aquila optimizer: A novel meta-heuristic optimization algorithm. Comput. Ind. Eng. 2021, 157, 107250. [Google Scholar] [CrossRef]
- Abualigah, L.; Abd Elaziz, M.; Sumari, P.; Geem, Z.W.; Gandomi, A.H. Reptile Search Algorithm (RSA): A nature-inspired meta-heuristic optimizer. Expert Syst. Appl. 2022, 191, 116158. [Google Scholar] [CrossRef]
- Aggarwal, C.C.; Zhai, C. A survey of text classification algorithms. In Mining Text Data; Springer: Berlin/Heidelberg, Germany, 2012; pp. 163–222. [Google Scholar]
- Oyelade, O.N.; Ezugwu, A.E.; Mohamed, T.I.; Abualigah, L. Ebola Optimization Search Algorithm: A new nature-inspired metaheuristic algorithm. IEEE Access 2022, 10, 16150–16177. [Google Scholar] [CrossRef]
- Agushaka, J.O.; Ezugwu, A.E.; Abualigah, L. Dwarf Mongoose Optimization Algorithm. Comput. Methods Appl. Mech. Eng. 2022, 391, 114570. [Google Scholar] [CrossRef]
- Houssein, E.H.; Hussain, K.; Abualigah, L.; Abd Elaziz, M.; Alomoush, W.; Dhiman, G.; Djenouri, Y.; Cuevas, E. An improved opposition-based marine predators algorithm for global optimization and multilevel thresholding image segmentation. Knowl.-Based Syst. 2021, 229, 107348. [Google Scholar] [CrossRef]
- Abualigah, L.; Diabat, A.; Sumari, P.; Gandomi, A.H. A novel evolutionary arithmetic optimization algorithm for multilevel thresholding segmentation of covid-19 ct images. Processes 2021, 9, 1155. [Google Scholar] [CrossRef]
- Ewees, A.A.; Abualigah, L.; Yousri, D.; Sahlol, A.T.; Al-qaness, M.A.; Alshathri, S.; Elaziz, M.A. Modified Artificial Ecosystem-Based Optimization for Multilevel Thresholding Image Segmentation. Mathematics 2021, 9, 2363. [Google Scholar] [CrossRef]
- Unnikrishnan, R.; Pantofaru, C.; Hebert, M. Toward objective evaluation of image segmentation algorithms. IEEE Trans. Pattern Anal. Mach. Intell. 2007, 29, 929–944. [Google Scholar] [CrossRef] [PubMed] [Green Version]
- Guo, Z.; Li, X.; Huang, H.; Guo, N.; Li, Q. Deep learning-based image segmentation on multimodal medical imaging. IEEE Trans. Radiat. Plasma Med. Sci. 2019, 3, 162–169. [Google Scholar] [CrossRef] [PubMed]
- Xu, T.; Zhang, H.; Huang, X.; Zhang, S.; Metaxas, D.N. Multimodal deep learning for cervical dysplasia diagnosis. In Proceedings of the International Conference on Medical Image Computing and Computer-Assisted Intervention, Athens, Greece, 17–21 October 2016; Springer: Berlin/Heidelberg, Germany, 2016; pp. 115–123. [Google Scholar]
- Comito, C.; Talia, D. GDIS: A service-based architecture for data integration on grids. In Proceedings of the OTM Confederated International Conferences “On the Move to Meaningful Internet Systems”, Agia Napa, Cyprus, 25–29 October 2004; Springer: Berlin/Heidelberg, Germany, 2004; pp. 88–98. [Google Scholar]


| CNN’s | Year | #Layer | Architecture | Learning-Time | ImageNet (top-1) |
|---|---|---|---|---|---|
| AlexNet | 2012 | 8 | 5 conv, 3 FC | 12.90 ms | 0.633 |
| VGG16 | 2014 | 16 | 13 conv, 3 FC | 16.55 ms | 0.715 |
| GoogleNet | 2014 | 22 | 21 conv, 1 FC | 12.98 ms | 0.687 |
| InceptionV3 | 2015 | 48 | 34 conv, 14 FC | 12.83 ms | 0.788 |
| ResNet50 | 2015 | 50 | 49 conv, 1 FC | 12.83 ms | 0.759 |
| 3D U-Net | 2016 | 23 | 18 conv, 5 FC | 3.3 ms | 0.637 |
| V-Net | 2016 | 30 | 22 conv, 4 FC | 1.5 ms | - |
| EfficientNet | 2019 | - | - | - | - |
| Date | Main Goal | #Data | Methods | Results |
|---|---|---|---|---|
| 2014 | Build a model for renal tumors detection using DL | Unspecified | SOM, ANN, K-means | 85% |
| 2015 | Build a model for exophytic renal lesions detection using ML | 109 CT | HOG, MMD, LBP, SURF | 95% |
| 2015 | Build a model for Kidney Tumors detection using DL, ML | 28 CT | ASNN, FCM, Gabor filter | Not provided |
| 2019 | Build a model for survival prediction for RCC patients using DL | 169 CT | DAG-SVM, CNN, InceptionV3 | 93% |
| 2021 | Build a model for kidney tumor detection using DL | 300 CT | Modified CNN, 3 cross folds | 90–99% |
| Data | Main Goal | #Data | Methods | Results |
|---|---|---|---|---|
| 2015 | Build a model for the classification of kidney tumor using DL | 66 US | ROI, PCA, NN | 97% |
| 2018 | Build a model for the classification of RCC using ML | 58 CT | ROI, SMOTE, SVM | 93.9% |
| 2018 | Build models for kidney RCC subtype classification using ML, DL | 94 CT | ANN SVM | 84.6% 69.2% |
| 2018 | Build a model for the classification of kidney tumor subtypes using ML | 38 MiRNA,CT | NCA, LSTM | 95% |
| 2019 | Build a model for the classification of RCC using DL | 169 CT | GAG-SVM, CNN, Inception V3 | 93.39% |
| 2019 | Build a model for the classification of renal tumors using DL | 192 CT | CNN, GoogleNet | 97% |
| 2019 | Build a model for the classification of renal cancer using DL | 169 CT | CNN, LIH, ImHistNet | 85% |
| 2019 | Build a model for the classification of grading carcinoma using DL | 159 CT | 3D U-net | 80% |
| 2020 | Build a model for the classification of renal masses using ML | 254 CT, MRI | SVM, ROI, Inception | 90% |
| 2020 | Build a model for the classification of clear RCC using ML | 61 CT | SVM, RF, LR, Laplacian of gaussian, wavelet filter | 78% |
| 2020 | Build a model for the classification of solid renal masses using DL | 315 CT | CNN, Decision fusion | 83% |
| 2020 | Build a model for the classification of renal tumors using ML | 330 MRI | RF, GBM | 81.2% |
| 2020 | Build a model for the classification of solid renal masses using ML | 177 CT | XGBoost | 70% |
| 2020 | Build a model for the classification of small renal using ML | 163 CT | ROI, ITK-SNAP, SVM | 90% |
| 2020 | Build a model for the classification of renal masses using ML | 735 CT | AdaBoostm, RF | 68–75% |
| 2020 | Build a model for the classification of tumor subtypes using ML | 204 CT | ROI, RF | 78% |
| 2020 | Build a model for the classification of kidney disorders using DL | 4940 US | V-net | 96.54% |
| 2020 | Build a model for the classification of small RCC subtypes using ML | 55 CT | SVM, KNN, RF, Decision Tree | 97% |
| 2020 | Build a model for evaluation of kidney masses classification using DL | 369 CT | ResNet50V2 | 97.3% |
| Data | Main Goal | #Data | Methods | Results |
|---|---|---|---|---|
| 2020 | Build a model for segmentation Kidney tumor using DL | 210 CT | 3D U-net | 96.9% |
| 2020 | Build a models for segmentation kidney and renal masses using DL | 210 CT | V-Net | 86.5%, 97.7% |
| 2021 | Build a model for segmentation kidney tumor using DL | 210 CT | V-net, ResNet50, ReLU | 95% |
| 2021 | Build a model for segmentation kidney tumor using DL | 300 CT | Modified CNN, 3 cross fold | 90–99% |
| Data | Main Goal | #Data | Methods | Results |
|---|---|---|---|---|
| 2018 | Build two models for kidney RCC subtype classification using ML, DL | 94 | ANN SVM | 84.6% 69.2% |
| 2019 | Build two models for RCC classification and the survival prediction using DL | 196 | DAG-SVN, CNN, InceptionV3 | 93.39% 94.07% |
| 2020 | Build a hybrid model for kidney and renal segmentation using DL | 210 | V-net, ResNet50 | 86.5% 97.7% |
| 2021 | Build two models for kidney tumor detection and segmentation using DL | 300 | Modified CNN, 3 cross fold | 90–99% 70–100% |
Publisher’s Note: MDPI stays neutral with regard to jurisdictional claims in published maps and institutional affiliations. |
© 2022 by the authors. Licensee MDPI, Basel, Switzerland. This article is an open access article distributed under the terms and conditions of the Creative Commons Attribution (CC BY) license (https://creativecommons.org/licenses/by/4.0/).
Share and Cite
Gharaibeh, M.; Alzu’bi, D.; Abdullah, M.; Hmeidi, I.; Al Nasar, M.R.; Abualigah, L.; Gandomi, A.H. Radiology Imaging Scans for Early Diagnosis of Kidney Tumors: A Review of Data Analytics-Based Machine Learning and Deep Learning Approaches. Big Data Cogn. Comput. 2022, 6, 29. https://doi.org/10.3390/bdcc6010029
Gharaibeh M, Alzu’bi D, Abdullah M, Hmeidi I, Al Nasar MR, Abualigah L, Gandomi AH. Radiology Imaging Scans for Early Diagnosis of Kidney Tumors: A Review of Data Analytics-Based Machine Learning and Deep Learning Approaches. Big Data and Cognitive Computing. 2022; 6(1):29. https://doi.org/10.3390/bdcc6010029
Chicago/Turabian StyleGharaibeh, Maha, Dalia Alzu’bi, Malak Abdullah, Ismail Hmeidi, Mohammad Rustom Al Nasar, Laith Abualigah, and Amir H. Gandomi. 2022. "Radiology Imaging Scans for Early Diagnosis of Kidney Tumors: A Review of Data Analytics-Based Machine Learning and Deep Learning Approaches" Big Data and Cognitive Computing 6, no. 1: 29. https://doi.org/10.3390/bdcc6010029