
Impulsive Aggression Break, Based on Early Recognition Using Spatiotemporal Features

1
College of Computers and Artificial Intelligence, Helwan University, Cairo 11795, Egypt
2
College of Computing and Information Technology, Arab Academy for Science, Technology & Maritime Transport (AASTMT), Smart Village, Giza 12577, Egypt
*
Author to whom correspondence should be addressed.
Big Data Cogn. Comput. 2023, 7(3), 150; https://doi.org/10.3390/bdcc7030150
Submission received: 2 August 2023
/
Revised: 5 September 2023
/
Accepted: 11 September 2023
/
Published: 14 September 2023
(This article belongs to the Special Issue Applied Data Science for Social Good)
Abstract
:The study of human behaviors aims to gain a deeper perception of stimuli that control decision making. To describe, explain, predict, and control behavior, human behavior can be classified as either non-aggressive or anomalous behavior. Anomalous behavior is any unusual activity; impulsive aggressive, or violent behaviors are the most harmful. The detection of such behaviors at the initial spark is critical for guiding public safety decisions and a key to its security. This paper proposes an automatic aggressive-event recognition method based on effective feature representation and analysis. The proposed approach depends on a spatiotemporal discriminative feature that combines histograms of oriented gradients and dense optical flow features. In addition, the principal component analysis (PCA) and linear discriminant analysis (LDA) techniques are used for complexity reduction. The performance of the proposed approach is analyzed on three datasets: Hockey-Fight (HF), Stony Brook University (SBU)-Kinect, and Movie-Fight (MF), with accuracy rates of 96.5%, 97.8%, and 99.6%, respectively. Also, this paper assesses and contrasts the feature engineering and learned features for impulsive aggressive event recognition. Experiments show promising results of the proposed method compared to the state of the art. The implementation of the proposed work is available here.
1. Introduction
Impulsive aggression is characterized by abrupt reactions to situations that are more emotional than is needed for the situation, in order to cause harm to another person. People frequently unconsciously imitate other people’s actions in a phenomenon known as emotional contagion [1]. A group could unknowingly be affected by a group member, who could cause the entire group to feel certain emotions, leading to misbehavior. Hatfield et al. [2] traced the hysterical emotional contagion process. They inferred that negative emotions have a more emotional impact than positive ones. Moreover, Slutkin and Ransford [3] add that impulsive aggressive behavior is similar to a contagious disease in many ways, including spreading. Impulsive aggressive behavior can occur in numerous situations, such as a violent outbreak of riots among the masses. Once it is detected, its transmission between people might be prevented. The detection of such behaviors at their initial spark breaks their chain reaction, leads to public safety decisions, and is a key to security. Detecting impulsive aggressive behavior in surveillance footage encounters challenges, as shown in Figure 1.
Due to a variety of problems, including a lack of previous knowledge of what to look for and an overwhelming number of video screens to monitor, human-based monitoring does not support an effective security system. According to Green [4] most people’s attention drops below an acceptable level after only 20 min of observing video surveillance screens. Combining computer vision and behavioral sciences provides a potential for developing technology that helps in that aspect.
Feature extraction is one of the major problems in computer vision for recognizing impulsive aggressive actions in video surveillance [5]. Most aggressive behaviors are related to bodily movement. A significant amount of raw data are needed to represent them. The raw data can be downsized into more manageable sets for processing by using a feature-extraction technique. Various methods tackle the problem: handcrafted features and deep learning are two approaches presented for feature extraction. The handcrafted features-based approach provides a way to visualize and analyze features. Still, feature representation has wide-ranging features that increase computational complexity [5]. The deep learning-based approach extracts features automatically, with no human interaction. However, due to its layered nature, it is hard to track [6]. The extracted features vary between appearance and motion features. The appearance feature-based method concentrates on the contour of human bodies. It is either through a set of interest points or local appearance. The motion feature-based method focuses on the direction of moving body parts. It extracts a motion vector per block of pixels, around a sample of points, or for each pixel in the frame [7].
The contribution of this paper is to present a method for impulsive aggressive-event recognition that provides an innovative solution to optimize accuracy and computational cost. To generate discriminative features, a fusion strategy is used. The appearance and motion features are combined in a single descriptive vector to gain advantages of both. The histograms of oriented gradients (HOG), and dense optical flow extract appearance and motion features, respectively. Regarding computational complexity, the extracted features are employed in principal component analysis (PCA), and linear discriminant analysis (LDA). They maintain the original key characteristics while downsizing them from a high-dimensional space to a lower one. Also, this paper provides a comparative analysis of impulsive aggressive behavior recognition based on feature engineering and learned features. Experimental results demonstrate that the proposed method performs favorably against state-of-the-art approaches.
2. Literature Review
Human behavior refers to how individuals engage with their environment; it can be usual or anomalous. The main objective of impulsive aggressive-event detection is to detect the occurrences of events and classify them as non-aggressive or anomalous events. The automatic detection of such events has a critical role in public safety and security. Several approaches have been proposed in the literature, varying between handcrafted features and deep learning models.
2.1. Handcrafted Features
The handcrafted feature-based approach provides a way of visualizing and analyzing features through appearance and motion features. The appearance features focus on the contour of human bodies throughout actions. They vary between a set of interest points or on a local appearance. The interest point-based methods extract features localized around a point of interest in an image, while the local appearance describes the local object shape within an image. Lejmi et al. [8] proposed a fusion strategy of feature-extraction algorithms, a Harris corner detector (HCD), sped-up robust features (SURF), and a histogram of oriented gradient (HOG), then submitted it to a classifier to determine whether the input action was violent or non-violent. Khan et al. [9] employed the scale-invariant feature transform method (SIFT), which focused on the local surroundings around a set of points for violent content detection in animated cartoons. Das et al. [10] extracted features using the HOG, which focused on the structure of the human body throughout the action by using the magnitude and gradient angle to compute the features, and achieved an accuracy rate of 86% for violence detection using the random forest (RF) classifier. Salman et al. [11] used SURF for feature extraction and fed it into the SVM classifier, achieving an average accuracy of 87% for violent-activity recognition. Lamba and Nain [12] used the HCD to extract features that represented human body edges and corners during an action. Tests were conducted on multiple publicly available benchmark datasets, achieving an average accuracy of 95% on the violent-flows (VF) dataset. Nadeem et al. [13] compared SIFT, SURF, and HOG features for discriminating between hot and cold fights using the SVM classifier. The HOG features achieved the highest sensitivity. Jahagirdar and Nagmode [14] proposed a new descriptor vector of salient wavelet features and a histogram of oriented gradients (SWFHOG). It detected abnormal behaviors using a feed-forward neural network (FNN), with an accuracy of 95% and 97% on the SBU and UT Interaction datasets, respectively. Motion features focus on the direction of the moving body parts. The motion magnitude and orientation represent a set of features. For motion features, the extraction of many algorithms is used, such as extracting a motion vector for each pixel in the frame, extracting a motion vector around a set of points of interest, or extracting a motion vector per block of pixels. Mahmoodi and Salajeghe [15] extracted motion attributes for each pixel in the frame and compared it to its adjacent frame to acquire meaningful changes in magnitude and orientation. Chen et al. [16] proposed a global descriptor based on the optical flow to estimate motion magnitude and orientation for each pixel in the frame. The accuracy rate of the HF dataset employed in their experiments was 92%. Yao et al. [17] used a sparse optical flow algorithm to extract motion magnitude and orientation features around key points of interest. Khalil et al. [18] divided the frame into 108 blocks and used a block-matching algorithm to extract one motion vector for each block, representing the displacement of each block of pixels between two consecutive frames. This motion information has been used as a feature for detecting violent material in cartoon videos that resulted in violent and aggressive behavior in a youngster. Hybrid features combine the benefits of both motion and appearance features to provide discriminative features. Tian et al. [19] adopted local trinary patterns (LTP) to capture spatiotemporal features and provided an adaptive sampling strategy based on a Shannon information measure in their study of action recognition. Wang et al. [20] extracted features representing both appearance and motion features via HOG and a histogram of optical flow (HOF). Deepak et al. [21] proposed a hybrid feature vector of optical flow data and a set of statistical features such as the mean, median, and mode. The extracted features were evaluated using different datasets, achieving an accuracy of 91.50% and 84% on the HF and VF datasets, respectively. Deepak et al. [22] extracted gradient-based autocorrelation features (STACOG) and evaluated its performance using SVM and K-Nearest neighbor (KKN) classifiers. The HF was one of the benchmark datasets used, and it achieved an accuracy of 83.4% and 90.4% using the KNN and the SVM, respectively. Febin et al. [23] combined optical flow feature, SIFT descriptor, and motion boundary histogram to form the MoBSIFT descriptor. The SVM, RF, and AdaBoost classifiers assessed the proposed model’s accuracy, with it achieving an accuracy of 98.9% using the RF classifier on the MF dataset. Pujol and Pertegal [24] studied accelerated movements as features for violent actions, as it is usually associated with high activation states. The acceleration features were represented by calculating local eccentricity (LE), calculating the histogram of optical acceleration (HOA), and the histogram of the spatial gradient of acceleration (HSGA) using optical flow data, achieving an accuracy of 97.85% using the SVM classifier on the SBU dataset. Lohithashva and Aradhya [25] proposed a spatial–temporal approach based on a texture feature descriptor named the local optimal oriented pattern (LOOP). Also, they provided a comparison between the handcrafted features, which varied between spatial and spatiotemporal features such as HOG, HOF, and LTP. The proposed features were evaluated on the HF and VF datasets using SVM. The model achieved a 92.2% and 91.5% accuracy on the HF and VF datasets, respectively. Detection based on handcrafted features suffers from wide-ranging features that increase computational complexity.
2.2. Deep Learning
The self-learning representations of a deep learning model omit the manual feature-extraction stage and work directly with the raw data. The deep learning model employs several models to capture the deep features of impulsive aggressive behaviors. The commonly used models are convolutional neural network (CNN) models and recurrent neural network (RNN) models. The MobileNet, ResNet, GoogleNet, VGGNet, DenseNet, 3D convolutional neural networks (3D-CNN), and deep belief networks (DBN) are the most often-used CNNs, whereas those of the RNNs are gated recurring units (GRUs), long-short term memory (LSTM), and bi-directional LSTM (BiLSTM).
Serrano et al. [26] achieved 99% accuracy on the MF dataset using 2D-CNN. Khan et al. [27] minimized time complexity by extracting features from the frame with the largest saliency using the MobileNet model, achieving an accuracy of 87% and 99.5% on the HF and MF dataset, respectively. Lejmi et al. [28] fed the optical flow information and HOG features into the LSTM model, achieving an accuracy of 84.6% in detecting violence with the SBU dataset. Su et al. [29] proposed a skeleton points interaction learning (SPIL) module to extract both appearance and temporal features based on the interactions between human skeleton points, achieving an accuracy rate of 98.5% on the MF dataset. She et al. [30] extracted deep features and fed them into a simple recurrent unit (SRU) algorithm followed by a global context-aware attention network (GCA-ST-SRU), achieving an overall accuracy of 94.3% on the SUB dataset. Sharma et al. [31] employed the Xception model as a spatial feature extractor followed by an LSTM model, achieving an accuracy of 96.55% and 98.32% on the HF and MF datasets, respectively. Chatterjee and Halder [32] employed a CNN to extract visual characteristics based on the first-level discrete wavelet transform (DWT), followed by BiLSTM for spatiotemporal feature extraction, achieving 94% accuracy on the HF dataset. Patel [33] produced a multi-deep network model to obtain discriminative features. They fed the extracted features from the ResNet model into the LSTM model, achieving an accuracy of 86.7% on the HF dataset. Similarly, Asad et al. [34] proposed a hybrid deep network model where the spatial features are extracted using a wide dense residual block with a 2D-CNN, followed by LSTM for the temporal feature extraction. The proposed model was evaluated on different datasets, achieving an accuracy of 99.1% and 97.1% on the MF and Crowd Violence datasets, respectively. In Imah et al. [35] a similar combination of DWT and gated recurrent units (GRU) achieved an accuracy of 96% on the MF dataset. Vijeikis et al. [36] extracted spatial features with the MobileNet-v2, followed by the LSTM model to extract temporal features. Results were obtained on several datasets, with 96.1% and 99.5% accuracy on the HF and MF datasets, respectively. Lejmi et al. [37] used the DBN model for automatic feature learning, achieving a 65.5% accuracy rate for violent action recognition on the SBU-Kinect dataset. Aktl et al. [38] tackled the problem of detecting violence from a single still image. For comparison, they employed various image-classification networks, such as ResNet-50 and Vision Transformer (ViT). Crowd Violence was one of the benchmark datasets used, achieving an accuracy of 98% on ViT and 97% on ResNet-50. Da Silva and Pereira [39] compared the performance of handcrafted MoSIFT features and deep VGG-19 features in detecting violence. The obtained results on the HF dataset were 89.6% and 88.4% with MoSIFT and VGG-19, respectively. Fernando et al. [40] detected violent activity using the CrimeNet model based on vision transformer and neural structured learning, achieving a 99% accuracy rate on both the UCF Crime and XD Violence datasets. Savadogo et al. [41] produced a dataset by collecting videos of elder abuse, concentrating on actions that caused a person suffering. An 85% accuracy rate was attained by applying a repeated frames extraction method using the 3D-CNN model. Verma et al. [42] proposed a traversal-based primary three-layer neural network (TNN), followed by a pairwise interaction framework (PIF) for human interaction recognition in videos. One of the benchmark datasets utilized was SBU, which included eight interaction classes, including violent ones like push, kick, and punch. It achieved a 93.9% accuracy rate on overall actions, whereas the recognition accuracies of push, kick, and punch were 88.8%, 90.4%, and 100%, respectively. Viktor et al. [43] detected violent action in surveillance footage based on extracting spatial and temporal features using the X3D model, achieving an accuracy rate of 97.5%, 90.1, and 93.5 across the HF dataset, the UCFS dataset, and the XD Violence dataset, respectively. Mohammadi and Nazerfard [44] proposed a semi-supervised hard attention (SSHA) model for video violence recognition, achieving an accuracy rate of 90.4% and 99.5% on the RWF and MF datasets, respectively. Elkhashab et al. [45] first used the DenseNet-121 model to extract spatial information, then used the LSTM model to extract spatial and temporal features, achieving 96% and 92% across the HF dataset and the real-life violence situations (RLVS) dataset, respectively. Islam et al. [46] combined 2D-CNN with ESN for feature representation and analysis. The proposed model was evaluated on different datasets, achieving an accuracy of 95.8% on the surveillance fight dataset.
Detection based on a deep learning model depends on the quality and quantity of data. It is also difficult to trace, because of its multilayer structure, whereas the detection based on handcrafted features suffers from wide-ranging features that increase computational complexity. Here, in this paper, we aim to present a comparative analysis of impulsive aggressive-behavior recognition based on both models.
3. Proposed Work
The aim of this paper is to provide an innovative solution that optimizes accuracy and computational cost for impulsive aggressive-event recognition. The accuracy rate depends on the quality of the features generated from the data set, while computational cost is affected by its length [5]. As a result, two methods for impulsive aggressive event recognition are utilized, featuring an engineering method and the learned-features method.
3.1. Feature Engineering
The proposed feature engineering method focuses on producing discriminative features that generate high accuracy with minimal computing cost. Figure 2 depicts the workflow architecture.
Aggressive behaviors are related to the shape of the human body and the motion information of the moving body parts during actions. So, the spatial and temporal features complement each other in this case. Therefore, a combination of two feature-extraction techniques into a single spatiotemporal (ST) descriptive vector is utilized here. Using the HOG, Dalal and Triggs [47] captured the spatial shape of human bodies during the action and the dense optical flow; Farnebäck [48] focused on the motion magnitude and direction of moving body parts. However, each of these features requires a preprocessing step for reducing their problems and extracting discriminative features.
3.1.1. Preprocessing Step
Extracting features is challenging due to redundancy and lighting variations that may lead to weak features. Therefore, to extract features with minimal error, a set of preprocessing techniques was used to extract discriminative features. (1) The frame was resized to 64 × 128 pixels, then a histogram equalization was used to modify the illuminance and contrast. (2) Subsequent frames contained redundant data due to minor alterations between frames. For this problem, a skipping interval algorithm was proposed in [23]. It represents a set of dropped frames bound to time by selecting a skipping interval dynamically for each video. It is equal to the video frame rate × information rate. If the required information is for every 0.2 s, and the video frame rate is 40 FPS, the skipping interval will be eight video frames. The skipping interval algorithm helps in processing only a set of video frames, which reduces redundant data without affecting the accuracy. Additional steps are needed for temporal features as extracting temporal features is challenging due to complicated backgrounds. So, we isolated the moving elements and eliminated the motionless parts. The motion region was highlighted using a Gaussian Mixture model (GMM)-based background subtraction algorithm [49], which allows better adaptions to scene changes. Then, a median filter of kernel size 9 was applied to eliminate the noise generated from the GMM without affecting the extracted moving elements. To eliminate the unwanted background pixels that are wrongly included in the extracted area, a morphological processing with a structuring element of size 7 × 7 was utilized to solve this problem. An opening operation removes the rest of the background noise points and smooth edges, followed by a closing operation to connect separate parts and fill in the holes and gaps caused by noise removal.
3.1.2. Spatiotemporal (ST) Feature Vector
After preprocessing, each of spatial and temporal features was extracted independently, then a fusion of these features was performed.
Spatial Features: The HOG [47] is a frame-based global descriptor, and describes the entire action. The frame was split into 8 × 16 cells of 8 × 8 pixels each to reduce the noise effect, and the nine bins of gradient orientation were used for computing the histogram. The Sobel filter detected changes in the x and y directions for calculating the gradient magnitude and orientation for each pixel using Equations (1) and (2). In each cell, the pixel casted a weighted vote for a histogram orientation bin based on the values found in the gradient computation. For better illumination variation, every four cells were grouped into larger blocks. The cell contributed more than once, yielding 7 × 15 overlapping blocks of a 36 × 1 element vector per block, where their local histograms were contrast-normalized by dividing all the values in the vector with the square root of the sum of their squares. The output was the HOG descriptor with a fixed vector size.
where .
and .
- Temporal features: Optical flow is a commonly used method for temporal feature extraction. It represents the luminance variation of the motion region. The optical flow methods are made up of two types: sparse optical flow and dense optical flow. Sparse optical flow extracts motion features around points of interest as edges within the frame, while dense optical flow extracts motion features for all points in the frame. Dense optical flow shows a higher accuracy at the cost of being computationally expensive. After identifying the motion region in the video frame, the dense optical flow components and are extracted using the Gunnar method [48] for reliable accuracy. The temporal feature is the magnitude of vectors u and v for all pixels calculated using Equation (3).
ST feature vector: Spatial features offer the relationship between persons within the same frame, where each frame is valued separately. The temporal features provide the relation between subsequent frames. To provide a representative element, a combination of the HOG features with dense features gives a Spatiotemporal (ST) feature vector.
3.1.3. STPCA Feature Vector
The spatial and temporal feature fusion provides representative elements in a high-dimensional space, which may cause overfitting and computational cost problems. So, principal component analysis (PCA) [50] was applied to ST features. The PCA effectively joins the features vector to reduce the feature space. It eliminates powerless characteristics while keeping the most variation of all the data through the following steps:
- //. Center data by subtracting input feature from its mean.
- //. Compute covariance matrix, where N is number of features.
- Determined //. Compute eigenvalues.
- Select eigenvalues for PCA n features which sustain the needed variance.
- //. Compute the eigenvectors matrix according to their eigenvalues.
- PCA features = .
3.1.4. STPCA + LDA Feature Vector
After PCA, linear discriminant analysis (LDA) [51] was applied. LDA increases the diversity between various classes and reduces it within a single class by the following steps.
- //Center data
Compute each class as mean M1 and M2, then subtract the input feature from its mean.
- //. Compute within-class covariance, where
- //. Compute eigenvectors
- LDA features = input features
PCA and LDA maintain key components while reducing the feature dimension from a high- to a low-dimensional space.
3.1.5. Classification
For performance evaluation, the ST, STPCA, and STPCA + LDA features of the proposed work were evaluated in terms of total training time (TR_t) for computational cost comparison, classification accuracy (ACC), F1 score, precision (Pr), and true-positive rate (TPR). The ACC, F1 score, Pr, and TPR were calculated using Equations (4)–(7), respectively. To choose the optimum features, two machine learning classifiers were used: Support vector machine (SVM) and Multi-Layer Perceptron (MLP). For the SVM classifier, the linear kernel (LK) and radial bases kernel (RBF) were used. The MLP consists of three layers: an input associated with the number of features, one hidden layer with 80 neurons, and an output layer associated with the behavior labels. The initial weights were set to zero, a sigmoid activation function was used and the number of training epochs was set to 100. In addition, MLP backpropagation (BP) learning techniques and resilient backpropagation (Rprop) were used for comparison.
3.2. Learned Features
The learned features were obtained after training the deep-learning model for classification. Training a deep learning model requires lots of training data, powerful GPUs, and memory space to achieve optimal performance. Training a deep-learning model from the starting point is challenging. As a result, a pre-trained model of a similar problem expedites the training process. It is known as the transfer learning method. It involves modifying the last fully connected layer to represent the new classes and the remaining layers of the architecture extract features for the new related problem. For impulsive aggressive event detection, two CNN architectures were used—the GoogleNet model [52] and the ResNet model [53]—which have been shown to be more robust than other models [54]. The learned-feature results of the GoogleNet model of 22 layers deep were compared to the ResNet model of 50 layers deep, both of which were pre-trained on the ImageNet dataset. Figure 3 represents the learned-feature model, where the input frames were resized to 224 × 224 pixels to fit the model input, and the models were trained for 35 epochs using SoftMax as the activation function, cross entropy as the loss function, and Adam as the optimizer.
4. Results and Discussion
This section clarifies the results of the different methods and compares them with the literature. But firstly, we need to clarify the benchmark datasets used for assessing and comparing the performances of various approaches. Therefore, three benchmark datasets, the SBU Kinect dataset [55], the Hockey fight (HF) dataset [56], and the Movie fight (MF) dataset [56], were used for evaluation. The SBU dataset consisted of 282 interaction clips in eight categories of non-aggressive and aggressive actions, in a ratio of 60% to 40%, respectively. The HF dataset is a sports dataset that incorporates significant amounts of motion, even in non-aggressive actions. It contains 1000 clips from National Hockey League games. The MF dataset contains close-ups of person-on-person combat from 200 action movie clips. The MF and the HF dataset clips were equally split into aggressive and non-aggressive actions. Each dataset was divided into two sections: 70% was dedicated for training, and 30% was for testing. The model was calibrated using training data, and its performance was measured using test data. The following sections present the results of the proposed methods and a comparison between them. Finally, a comparison was made between the proposed methods and the state-of-the-art methodologies.
4.1. Feature Engineering Results
In the preprocessing step, the acquired information was for every 0.05 s, and the video frame rate was 40 FPS. So, the skipping interval was two video frames. To eliminate the motionless parts, GMM was applied to the input frame. However, its output had too much noise, as shown in Figure 4b. So, a median filter was employed to eliminate noise while preserving the extracted motion region, as shown in Figure 4c. Finally, opening and closing morphological operations were applied to isolate the final moving element with smooth edges and noise removal, as shown in Figure 4d.
Then, the spatiotemporal (ST) feature vector was performed by concatenating spatial and temporal features into a single vector. The spatial and temporal features were extracted using the HOG descriptor, and dense optical flow, respectively. The overall size of the HOG vector was 3780, while that of the dense optical flow was 8129. So, the fusion ST feature vector was of a size of 11,972 features. After applying PCA and LDA, the STPCA + LDA feature space for the HF dataset became 1425 features, with around an 88% feature reduction.
For classification, Table 1 shows the results of the MLP backpropagation (BP) learning techniques vs. those of resilient backpropagation (Rprop), whereas Table 2 shows the results of the support vector machine (SVM) classifier using a linear kernel (LK) vs. radial bases kernel (RBF). The best accuracy for each benchmark is in bold and underlined in Table 1 and Table 2, to define the suitable learning. From the results, we deduced that the MLP with Rprop performed better than the BP, and the SVM with the RBF kernel performed better than the linear kernel.
Figure 5 shows the comparison of results of the ST, STPCA, and STPCA + LDA utilizing the two machine-learning classifiers. Figure 5a represents the accuracy results of the extracted features using the MLP classifier. From the figure, the ST features had the best accuracy for the HF dataset, while the STPCA + LDA features had the best results for the MF datasets using MLP. Figure 5b shows the results of the SVM classifier for recognizing impulsive aggressive events of the extracted features. The results show that STPCA + LDA features performed better on the three benchmark datasets. Figure 6 illustrates the best accuracy results of both classifiers for the three datasets. Although STPCA + LDA did not perform best using the MLP classifier for the SBU and HF datasets, it achieved the best results using the SVM classifier when compared to the other MLP results, indicating its superiority among the extracted features. Other evaluation parameters, such as the total training time (TR_t) for computational cost comparison, F1 score, precision (Pr), and true-positive rate (TPR), were further used for the assessment of extracted features, as shown in Table 3, using the SVM classifier with radial bases kernel (RBF). The assessment parameter shows the superiority of STPCA_LDA features on both accuracy and computation cost.
4.2. Learned Feature Results
The learning rate is critical: if it is too high, the best possible outcome is missed, and if it is too low, too many iterations will be required. Therefore, several learning rates were examined for achieving reliable results from the model. The best accuracy for each benchmark is in bold and underlined in Table 4 to define the suitable learning rate.
Figure 7 shows the results of recognizing impulsive aggressive behaviors of the learned features using ResNet and GoogleNet models under different learning rates. It demonstrates the best accuracy obtained with the learning rate of both models for the three benchmark datasets. The further evaluation matrices average training time per epoch (ATR_t), ACC, F1 score, Pr, and TPR, were used for the model assessment, as shown in Table 5 with the learning rate. From the results shown, the GoogleNet model had a higher performance than the ResNet model for the SBU and the MF datasets, while the ResNet performed better for the HF dataset.
Table 6 shows the evaluation parameters of the learned features of the GoogleNet model with the learning rate vs. the feature engineering STPCA_LDA of SVM with the RBF kernel. From the results shown, both showed an equal performance for the MF dataset in terms of ACC, F1, and Pr, but the feature engineering outperformed the learned features in terms of training time and TPR. The learned features performed better on the HF dataset, while the feature engineering performed better on the SBU dataset. Figure 8 illustrates a comparison of the results of both methods for the three datasets. It reveals that the two methods achieved comparable performances.
4.3. Comparison with the Literature
Following the result analysis of the proposed methods, Table 7, Table 8 and Table 9 compare the proposed method with the state-of-the-art methodologies for the SBU, HF, and MF datasets, respectively. The evaluation of the results indicates that the proposed method achieved reliable accuracy. The tables also illustrate the increased effectiveness of the feature engineering method compared with the learned features method in the SBU dataset, but they performed equally on the MF dataset, while the learned features outperformed the feature engineering method for the HF dataset.
5. Conclusions
The impact of impulsive aggression behaviors is detrimental to others since they are unplanned and typically occur at the time of action. Furthermore, a group may inadvertently be impacted by the aggressive behavior of others, causing it to spread. The detection of such behaviors at the initial spark breaks their chain reaction and prevents its spreading among people. This paper offers an impulsive aggressive-event recognition method that optimizes accuracy and computing cost. Because recognition performance depends on the produced features from the dataset, we compared two methods that use feature engineering and learned features, respectively. The traditional feature engineering method requires a large memory capacity and computation cost. The experiments revealed that combining spatial and temporal features with PCA and LDA provided discriminative features. These discriminative features outperformed the original features and provided a solution that optimized accuracy and computing cost. Even though the learned features method provided an end-to-end problem solution, it was greedy for data as it worked more effectively on large datasets than on small ones. Although it outperformed the feature engineering method on the HF dataset, it did worse on the SBU dataset. One of the main challenges in recognizing aggressive behaviors is the lack of positive samples compared to negative ones. Therefore, the feature engineering method is more appropriate than the data-greedy method. As a result, learned features cannot always be considered superior and cannot replace the feature engineering method. Future research recommendations are based on experiments on hybrid features, in which spatiotemporal features are given input into a deep learning model.
Author Contributions
Conceptualization, A.A.A.Y. and W.H.E.-B.; data curation, M.M.F.D.; formal analysis, M.M.F.D. and A.A.A.Y.; investigation, W.H.E.-B.; methodology, M.M.F.D.; supervision, A.A.A.Y.; validation, W.H.E.-B.; writing—original draft, M.M.F.D.; writing—review and editing, A.A.A.Y. and W.H.E.-B. All authors have read and agreed to the published version of the manuscript.
Funding
This research received no external funding.
Informed Consent Statement
Informed consent was not required for this study, as we used benchmark public datasets, and the figures with humans were obtained from public sources.
Data Availability Statement
SBU Kinect dataset, Hockey fight dataset, and Movie fight (MF) dataset.
Conflicts of Interest
All authors declare that they have no conflict of interest.
References
- Barsade, S.G. The ripple effect: Emotional contagion and its influence on group behavior. Adm. Sci. Q. 2002, 47, 644–675. [Google Scholar] [CrossRef]
- Hatfield, E.; Carpenter, M.; Rapson, R.L. Emotional contagion as a precursor to collective emotions. In Collective Emotions: Perspectives from Psychology, Philosophy, and Sociology; OUP Oxford: Oxford, UK, 2014; pp. 108–122. [Google Scholar]
- Slutkin, G.; Ransford, C. Violence is a contagious disease: Theory and practice in the USA and abroad. In Violence, Trauma, and Trauma Surgery: Ethical Issues, Interventions, and Innovations; Springer: New York, NY, USA, 2020; pp. 67–85. [Google Scholar]
- Green, M.W. The Appropriate and Effective Use of Security Technologies in US Schools: A Guide for Schools and Law Enforcement Agencies; US Department of Justice, Office of Justice Programs, National Institute of Justice: Washington, DC, USA, 1999.
- Khalid, S.; Khalil, T.; Nasreen, S. A survey of feature selection and feature extraction techniques in machine learning. In Proceedings of the 2014 Science and Information Conference, London, UK, 27–29 August 2014; IEEE: New York, NY, USA, 2014; pp. 372–378. [Google Scholar]
- Buhrmester, V.; Münch, D.; Arens, M. Analysis of explainers of black box deep neural networks for computer vision: A survey. Mach. Learn. Knowl. Extr. 2021, 3, 966–989. [Google Scholar] [CrossRef]
- Lin, C.E. Introduction to Motion Estimation with Optical Flow. 2020. Available online: https://nanonets. com/blog/optical-flow (accessed on 11 September 2023).
- Lejmi, W.; Khalifa, A.B.; Mahjoub, M.A. Fusion strategies for recognition of violence actions. In Proceedings of the 2017 IEEE/ACS 14th International Conference on Computer Systems and Applications (AICCSA), Hammamet, Tunisia, 30 October–3 November 2017. [Google Scholar]
- Khan, M.; Tahir, M.A.; Ahmed, Z. Detection of violent content in cartoon videos using multimedia content detection techniques. In Proceedings of the 2018 IEEE 21st International Multi-Topic Conference (INMIC), Karachi, Pakistan, 1–2 November 2018; pp. 1–5. [Google Scholar]
- Das, S.; Sarker, A.; Mahmud, T. Violence detection from videos using hog features. In Proceedings of the 2019 4th International Conference on Electrical Information and Communication Technology (EICT), Khulna, Bangladesh, 20–22 December 2019; IEEE: New York, NY, USA, 2019; pp. 1–5. [Google Scholar]
- Salman, M.; Yar, H.; Jan, T.; Rahman, K.U. Real-time Violence Detection in Surveillance Videos using RPi. In Proceedings of the 5th International Conference on Next Generation Computing, Chiang Mai, Thailand, 20–21 December 2019. [Google Scholar]
- Lamba, S.; Nain, N. Detecting anomalous crowd scenes by oriented Tracklets’ approach in active contour region. Multimed. Tools Appl. 2019, 78, 31101–31120. [Google Scholar] [CrossRef]
- Nadeem, M.S.; Franqueira, V.N.; Kurugollu, F.; Zhai, X. WVD: A new synthetic dataset for video-based violence detection. In Proceedings of the Artificial Intelligence XXXVI: 39th SGAI International Conference on Artificial Intelligence, Cambridge, UK, 17–19 December 2019. [Google Scholar]
- Jahagirdar, A.; Nagmode, M. A Novel Human Action Recognition and Behaviour Analysis Technique using SWFHOG. Int. J. Adv. Comput. Sci. Appl. 2020, 11. [Google Scholar] [CrossRef]
- Mahmoodi, J.; Salajeghe, A. A classification method based on optical flow for violence detection. Expert Syst. Appl. 2019, 127, 121–127. [Google Scholar] [CrossRef]
- Chen, S.; Li, T.; Niu, Y.; Cai, G. Fighting Detection Based on Hybrid Features. In Fuzzy Information and Engineering; John Wiley & Sons, Inc.: New York, NY, USA, 2020; pp. 37–50. [Google Scholar]
- Yao, C.; Su, X.; Wang, X.; Kang, X.; Zhang, J.; Motion, J.R. Direction Inconsistency-Based Fight Detection for Multiview Surveillance Videos. Wirel. Commun. Mob. Comput. 2021, 2021, 9965781. [Google Scholar] [CrossRef]
- Khalil, T.; Bangash, J.I.; Khan, A.W.; Lashari, S.A.; Khan, A.; Ramli, D.A. Detection of Violence in Cartoon Videos Using Visual Features. Procedia Comput. Sci. 2021, 192, 4962–4971. [Google Scholar] [CrossRef]
- Tian, Q.; Arbel, T.; Clark, J.J. Shannon information based adaptive sampling for action recognition. In Proceedings of the 2016 23rd International Conference on Pattern Recognition (ICPR), Cancun, Mexico, 4–8 December 2016; IEEE: New York, NY, USA, 2016; pp. 967–972. [Google Scholar]
- Wang, W.; Cheng, Y.; Liu, Y. A new method for violence detection based on the three dimensional scene flow. In Proceedings of the Three-Dimensional Image Acquisition and Display Technology and Applications, Beijing, China, 22–24 May 2018; Volume 10845, pp. 150–155. [Google Scholar]
- Deepak, K.; Vignesh, L.K.P.; Srivathsan, G.; Roshan, S.; Chandrakala, S. Statistical Features-Based Violence Detection in Surveillance Videos. In Cognitive Informatics and Soft Computing; Springer: Singapore, 2020; pp. 197–203. [Google Scholar]
- Deepak, K.; Vignesh, L.K.P.; Chandrakala, S.J. Autocorrelation of gradients based violence detection in surveillance videos. ICT Express 2020, 6, 155–159. [Google Scholar]
- Febin, I.P.; Jayasree, K.; Joy, P.T. Violence detection in videos for an intelligent surveillance system using MoBSIFT and movement filtering algorithm. Pattern Anal. Appl. 2020, 23, 611–623. [Google Scholar] [CrossRef]
- Pujol, F.A.; Mora, H.; Pertegal, M.L. A soft computing approach to violence detection in social media for smart cities. Soft Comput. 2020, 24, 11007–11017. [Google Scholar] [CrossRef]
- Lohithashva, B.H.; Aradhya, V.M. Violent video event detection: A local optimal oriented pattern based approach. In Proceedings of the Applied Intelligence and Informatics: First International Conference, AII 2021, Nottingham, UK, 30–31 July 2021; Proceedings 1. pp. 268–280. [Google Scholar]
- Serrano, I.; Deniz, O.; Espinosa-Aranda, J.L.; Bueno, G. Fight recognition in video using hough forests and 2D convolutional neural network. IEEE Trans. Image Process. 2018, 27, 4787–4797. [Google Scholar] [CrossRef] [PubMed]
- Khan, S.U.; Haq, I.U.; Rho, S.; Baik, S.W.; Lee, M.Y. Cover the violence: A novel Deep-Learning-Based approach towards violence-detection in movies. Appl. Sci. 2019, 9, 4963. [Google Scholar] [CrossRef]
- Lejmi, W.; Khalifa, A.B.; Mahjoub, M.A. A Novel Spatio-Temporal Violence Classification Framework Based on Material Derivative and LSTM Neural Network. Trait. Du Signal 2020, 37, 687–701. [Google Scholar] [CrossRef]
- Su, Y.; Lin, G.; Zhu, J.; Wu, Q. Human interaction learning on 3d skeleton point clouds for video violence recognition. In Proceedings of the Computer Vision–ECCV 2020: 16th European Conference, Glasgow, UK, 23–28 August 2020; Proceedings, Part IV 16. pp. 74–90. [Google Scholar]
- She, Q.; Mu, G.; Gan, H.; Fan, Y. Spatio-temporal SRU with global context-aware attention for 3D human action recognition. Multimed. Tools Appl. 2020, 79, 12349–12371. [Google Scholar] [CrossRef]
- Sharma, S.; Sudharsan, B.; Naraharisetti, S.; Trehan, V.; Jayavel, K. A fully integrated violence detection system using CNN and LSTM. Int. J. Electr. Comput. Eng. 2021, 11, 2088–8708. [Google Scholar] [CrossRef]
- Chatterjee, R.; Halder, R. Discrete Wavelet Transform for CNN-BiLSTM-Based Violence Detection. In Advances in Systems, Control and Automations; Springer: Singapore, 2021; pp. 41–52. [Google Scholar]
- Patel, M. Real-Time Violence Detection Using CNN-LSTM. arXiv 2021, arXiv:2107.07578. [Google Scholar]
- Asad, M.; Yang, J.; He, J.; Shamsolmoali, P.; He, X. Multi-frame feature-fusion-based model for violence detection. Vis. Comput. 2021, 37, 1415–1431. [Google Scholar] [CrossRef]
- Imah, E.M.; Laksono, I.K.; Karisma, K.; Wintarti, A. Detecting violent scenes in movies using Gated Recurrent Units and Discrete Wavelet Transform. Regist. J. Ilm. Teknol. Sist. Inf. 2022, 8, 94–103. [Google Scholar] [CrossRef]
- Vijeikis, R.; Raudonis, V.; Dervinis, G. Efficient violence detection in surveillance. Sensors 2022, 22, 2216. [Google Scholar] [CrossRef]
- Lejmi, W.; Khalifa, A.B.; Mahjoub, M.A. An Innovative Approach Towards Violence Recognition Based on Deep Belief Network. In Proceedings of the 2022 8th International Conference on Control, Decision and Information Technologies (CoDIT), Istanbul, Turkey, 17–20 May 2022. [Google Scholar]
- Aktl, Ş.; Ofli, F.; Imran, M.; Ekenel, H.K. Fight detection from still images in the wild. In Proceedings of the IEEE/CVF Winter Conference on Applications of Computer Vision, Waikoloa, HI, USA, 3–8 January 2022; pp. 550–559. [Google Scholar]
- Da Silva, A.V.B.; Pereira, L.F.A. Handcrafted vs. Learned Features for Automatically Detecting Violence in Surveillance Footage. In Anais do XLIX Seminário Integrado de Software e Hardware; SBC: Porto Alegre, Brazil, 2022; pp. 82–91. [Google Scholar]
- Rendón-Segador, F.J.; Álvarez-García, J.A.; Salazar-González, J.L.; Tommasi, T. Crimenet: Neural structured learning using vision transformer for violence detection. Neural Netw. 2023, 161, 318–329. [Google Scholar] [CrossRef]
- Savadogo, W.A.R.; Lin, C.C.; Hung, C.C.; Chen, C.C.; Liu, Z.; Liu, T. A study on constructing an elderly abuse detection system by convolutional neural networks. J. Chin. Inst. Eng. 2023, 46, 1–10. [Google Scholar] [CrossRef]
- Verma, A.; Meenpal, T.; Acharya, B. Human interaction recognition in videos with body pose traversal analysis and pairwise interaction framework. IETE J. Res. 2023, 69, 46–58. [Google Scholar] [CrossRef]
- Huszár, V.D.; Adhikarla, V.K.; Négyesi, I.; Krasznay, C. Toward Fast and Accurate Violence Detection for Automated Video Surveillance Applications. IEEE Access 2023, 11, 18772–18793. [Google Scholar] [CrossRef]
- Mohammadi, H.; Nazerfard, E. Video violence recognition and localization using a semi-supervised hard attention model. Expert Syst. Appl. 2023, 212, 118791. [Google Scholar] [CrossRef]
- Elkhashab, Y.R.; El-Behaidy, W.H. Violence Detection Enhancement in Video Sequences Based on Pre-trained Deep Models. Int. J. Bull. Inform. 2023, 5, 23–28. [Google Scholar] [CrossRef]
- Islam, M.; Dukyil, A.S.; Alyahya, S.; Habib, S. An IoT Enable Anomaly Detection System for Smart City Surveillance. Sensors 2023, 23, 2358. [Google Scholar] [CrossRef]
- Dalal, N.; Triggs, B. Histograms of oriented gradients for human detection. In Proceedings of the 2005 IEEE Computer Society Conference on Computer Vision and Pattern Recognition (CVPR’05), San Diego, CA, USA, 20–25 June 2005. [Google Scholar]
- Farnebäck, G. Two-frame motion estimation based on polynomial expansion. In Proceedings of the Image Analysis: 13th Scandinavian Conference, SCIA 2003, Halmstad, Sweden, 29 June–2 July 2003. [Google Scholar]
- Zivkovic, Z.; Van Der Heijden, F. Efficient adaptive density estimation per image pixel for the task of background subtraction. Pattern Recognit. Lett. 2006, 27, 773–780. [Google Scholar] [CrossRef]
- Song, F.; Guo, Z.; Mei, D. Feature selection using principal component analysis. In Proceedings of the 2010 International Conference on System Science, Engineering Design and Manufacturing Informatization, Yichang, China, 12–14 November 2010; IEEE: New York, NY, USA, 2010; Volume 1, pp. 27–30. [Google Scholar]
- Gu, Q.; Li, Z.; Han, J. Linear discriminant dimensionality reduction. In Proceedings of the Machine Learning and Knowledge Discovery in Databases: European Conference, ECML PKDD 2011, Athens, Greece, 5–9 September 2011. [Google Scholar]
- Szegedy, C.; Liu, W.; Jia, Y.; Sermanet, P.; Reed, S.; Anguelov, D.; Rabinovich, A. Going deeper with convolutions. In Proceedings of the IEEE Conference on Computer Vision and Pattern Recognition, Boston, MA, USA, 7–12 June 2015; pp. 1–9. [Google Scholar]
- He, K.; Zhang, X.; Ren, S.; Sun, J. Deep residual learning for image recognition. In Proceedings of the IEEE Conference on Computer Vision and Pattern Recognition, Las Vegas, NV, USA, 26 June–1 July 2016; pp. 770–778. [Google Scholar]
- Dallora, A.L.; Berglund, J.S.; Brogren, M.; Kvist, O.; Ruiz, S.D.; Dübbel, A.; Anderberg, P. Age assessment of youth and young adults using magnetic resonance imaging of the knee: A deep learning approach. JMIR Med. Inform. 2019, 7, e162. [Google Scholar] [CrossRef]
- Yun, K.; Honorio, J.; Chattopadhyay, D.; Berg, T.L.; Samaras, D. Two-person interaction detection using body-pose features and multiple instance learning. In Proceedings of the 2012 IEEE Computer Society Conference on Computer Vision and Pattern Recognition Workshops, Providence, RI, USA, 16–21 June 2012; IEEE: New York, NY, USA, 2012; pp. 28–35. [Google Scholar]
- Bermejo Nievas, E.; Deniz Suarez, O.; Bueno García, G.; Sukthankar, R. Violence detection in video using computer vision techniques. In Proceedings of the Computer Analysis of Images and Patterns: 14th International Conference, CAIP 2011, Seville, Spain, 29–31 August 2011. [Google Scholar]
Figure 1.
Impulsive aggressive-behavior detection challenges.
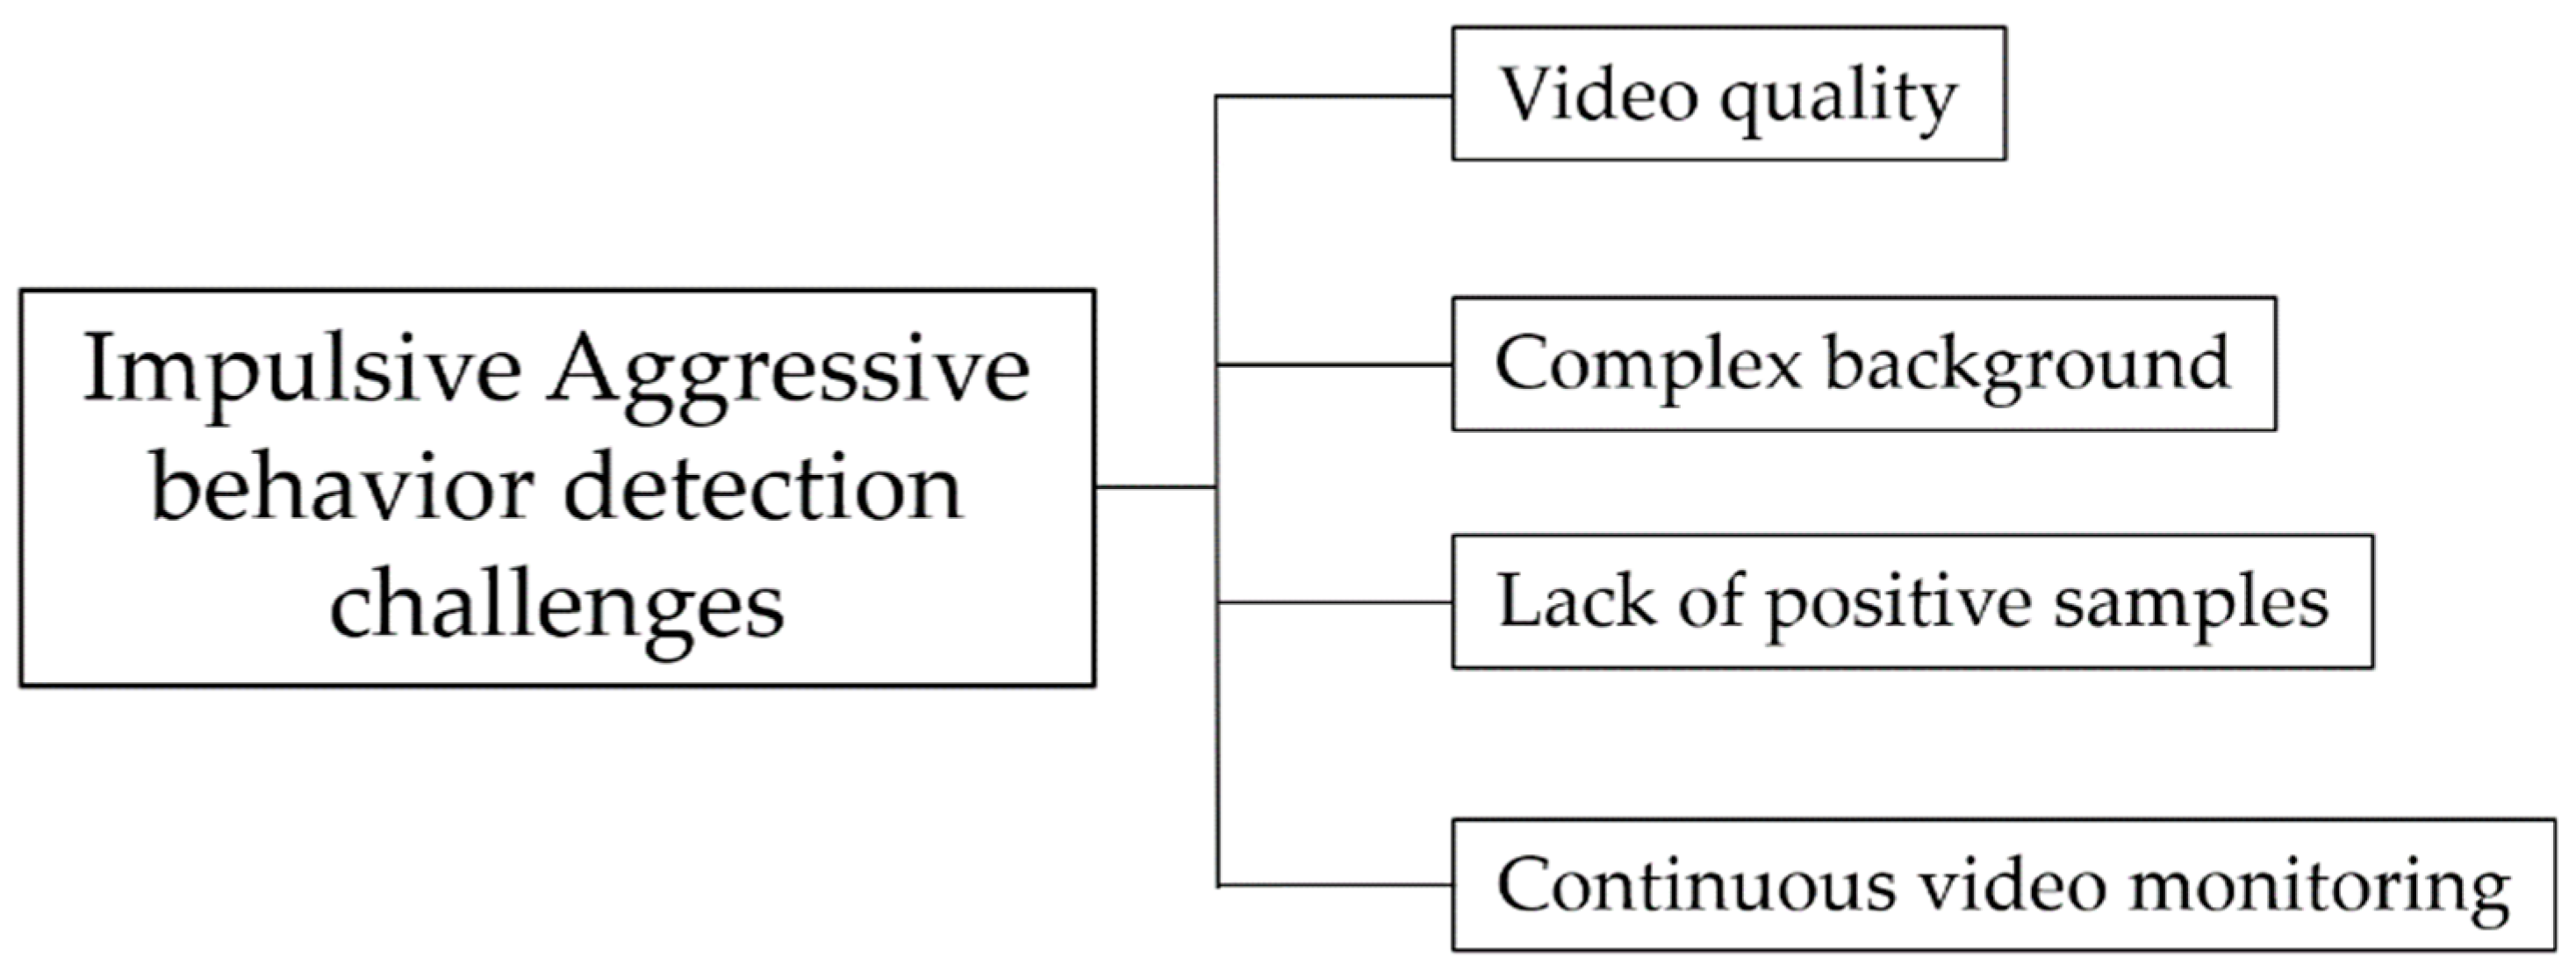
Figure 2.
Description of the proposed feature engineering workflow.

Figure 3.
Structure diagram of learned feature model.
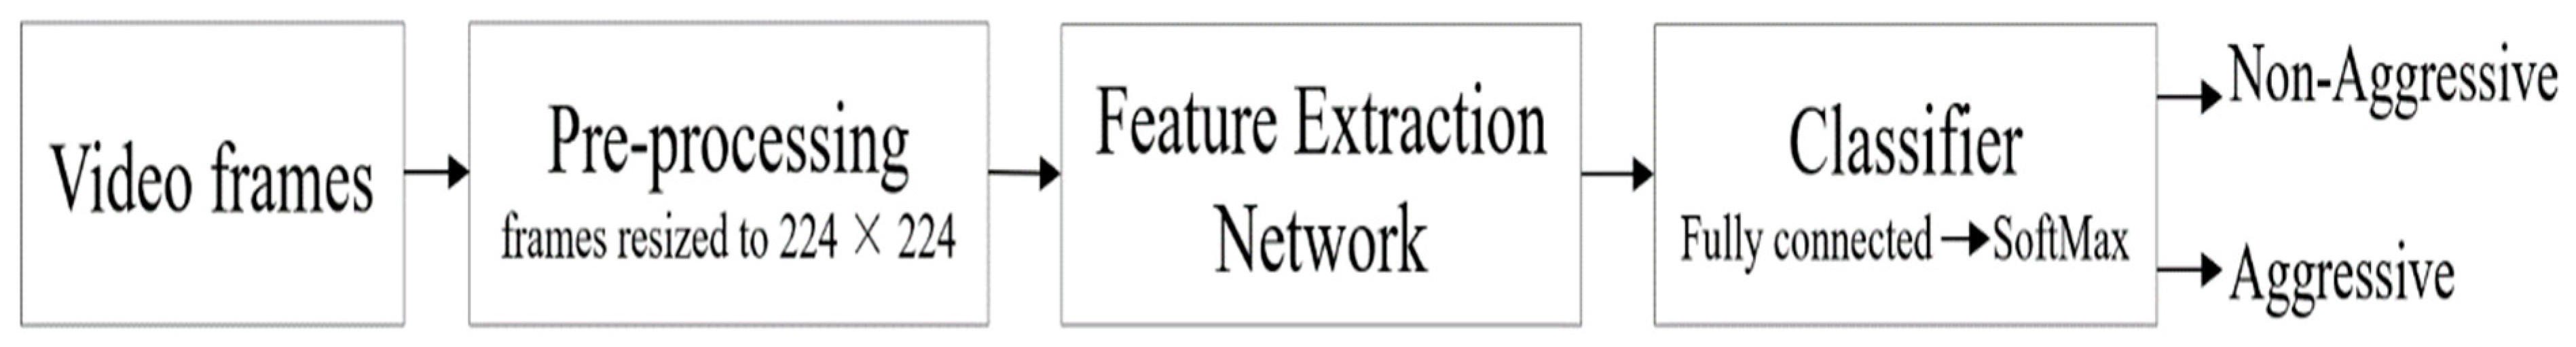
Figure 4.
Motion region-detection steps: (a) input frame; (b) GMM detection; (c) median filtering; and (d) morphological processing.
Figure 4.
Motion region-detection steps: (a) input frame; (b) GMM detection; (c) median filtering; and (d) morphological processing.
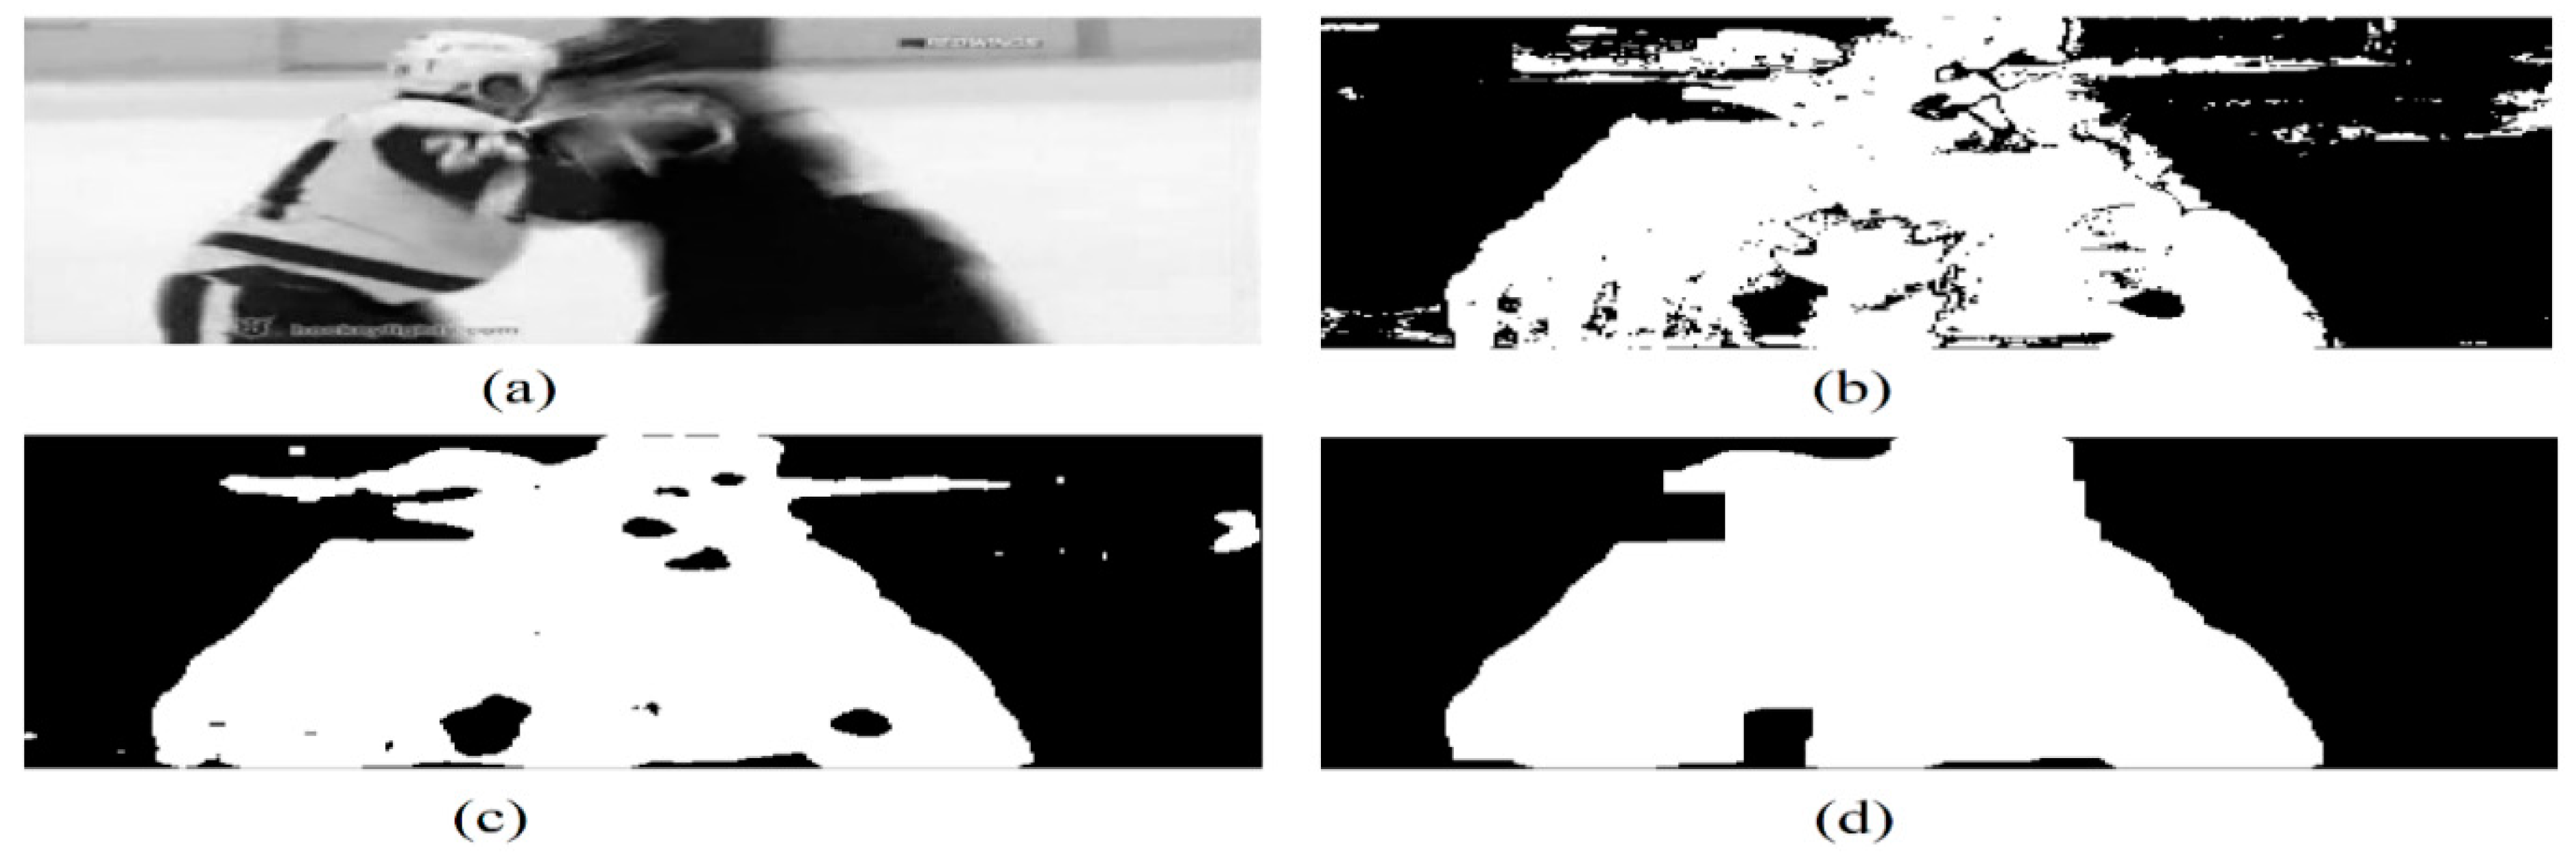
Figure 5.
Feature engineering results: (a) MLP results, and (b) SVM results.
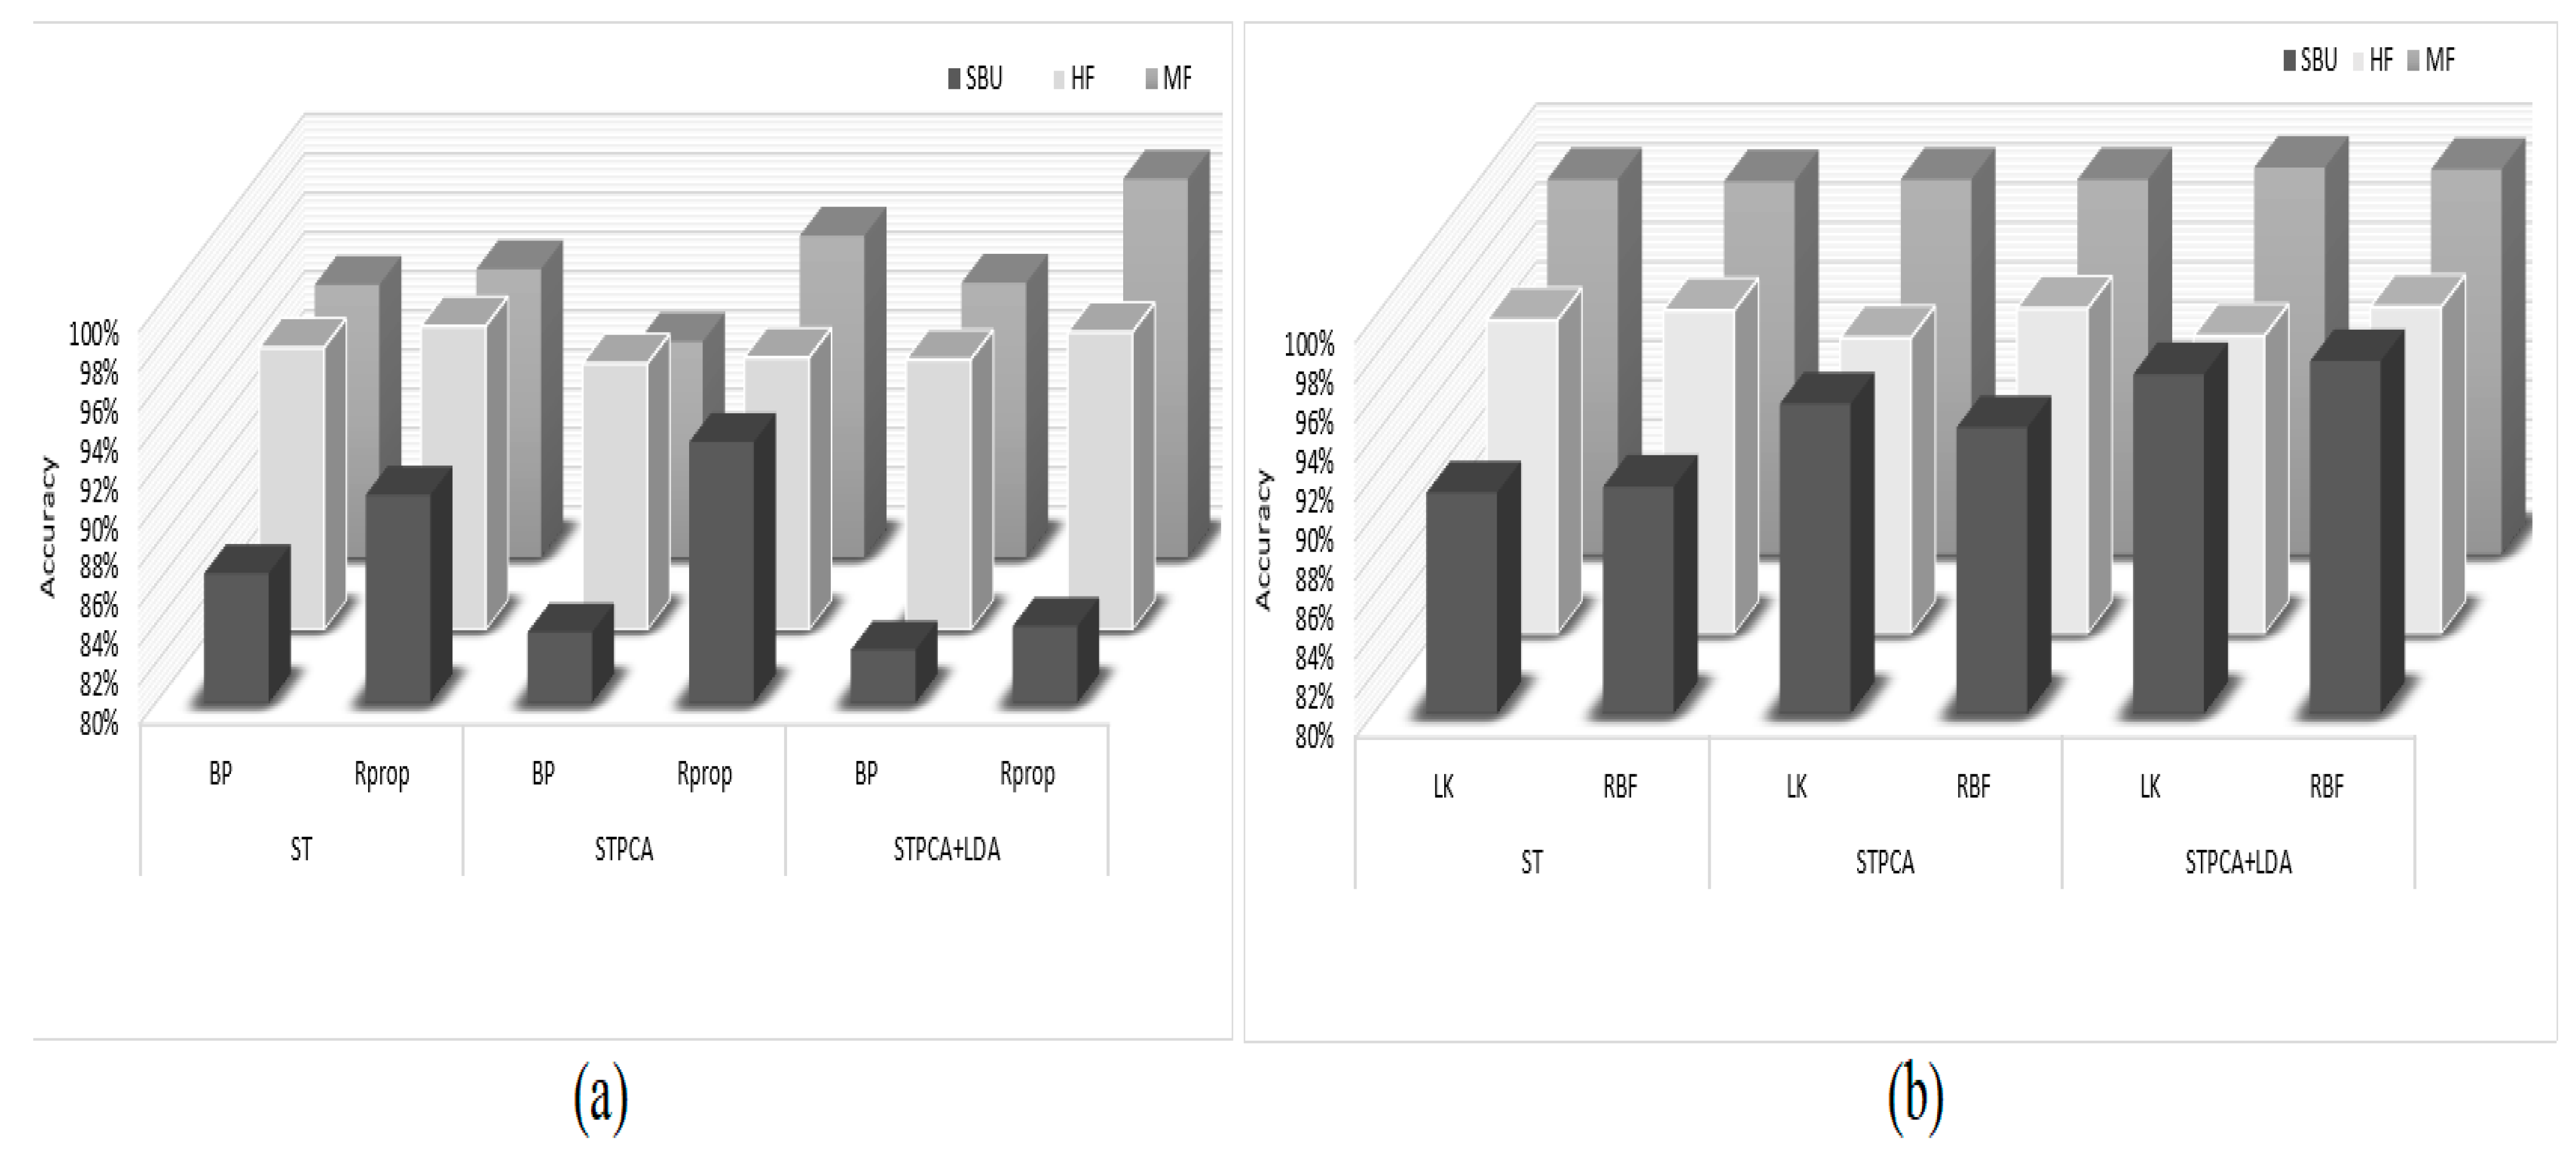
Figure 6.
Accuracy results comparison of MLP vs. SVM.
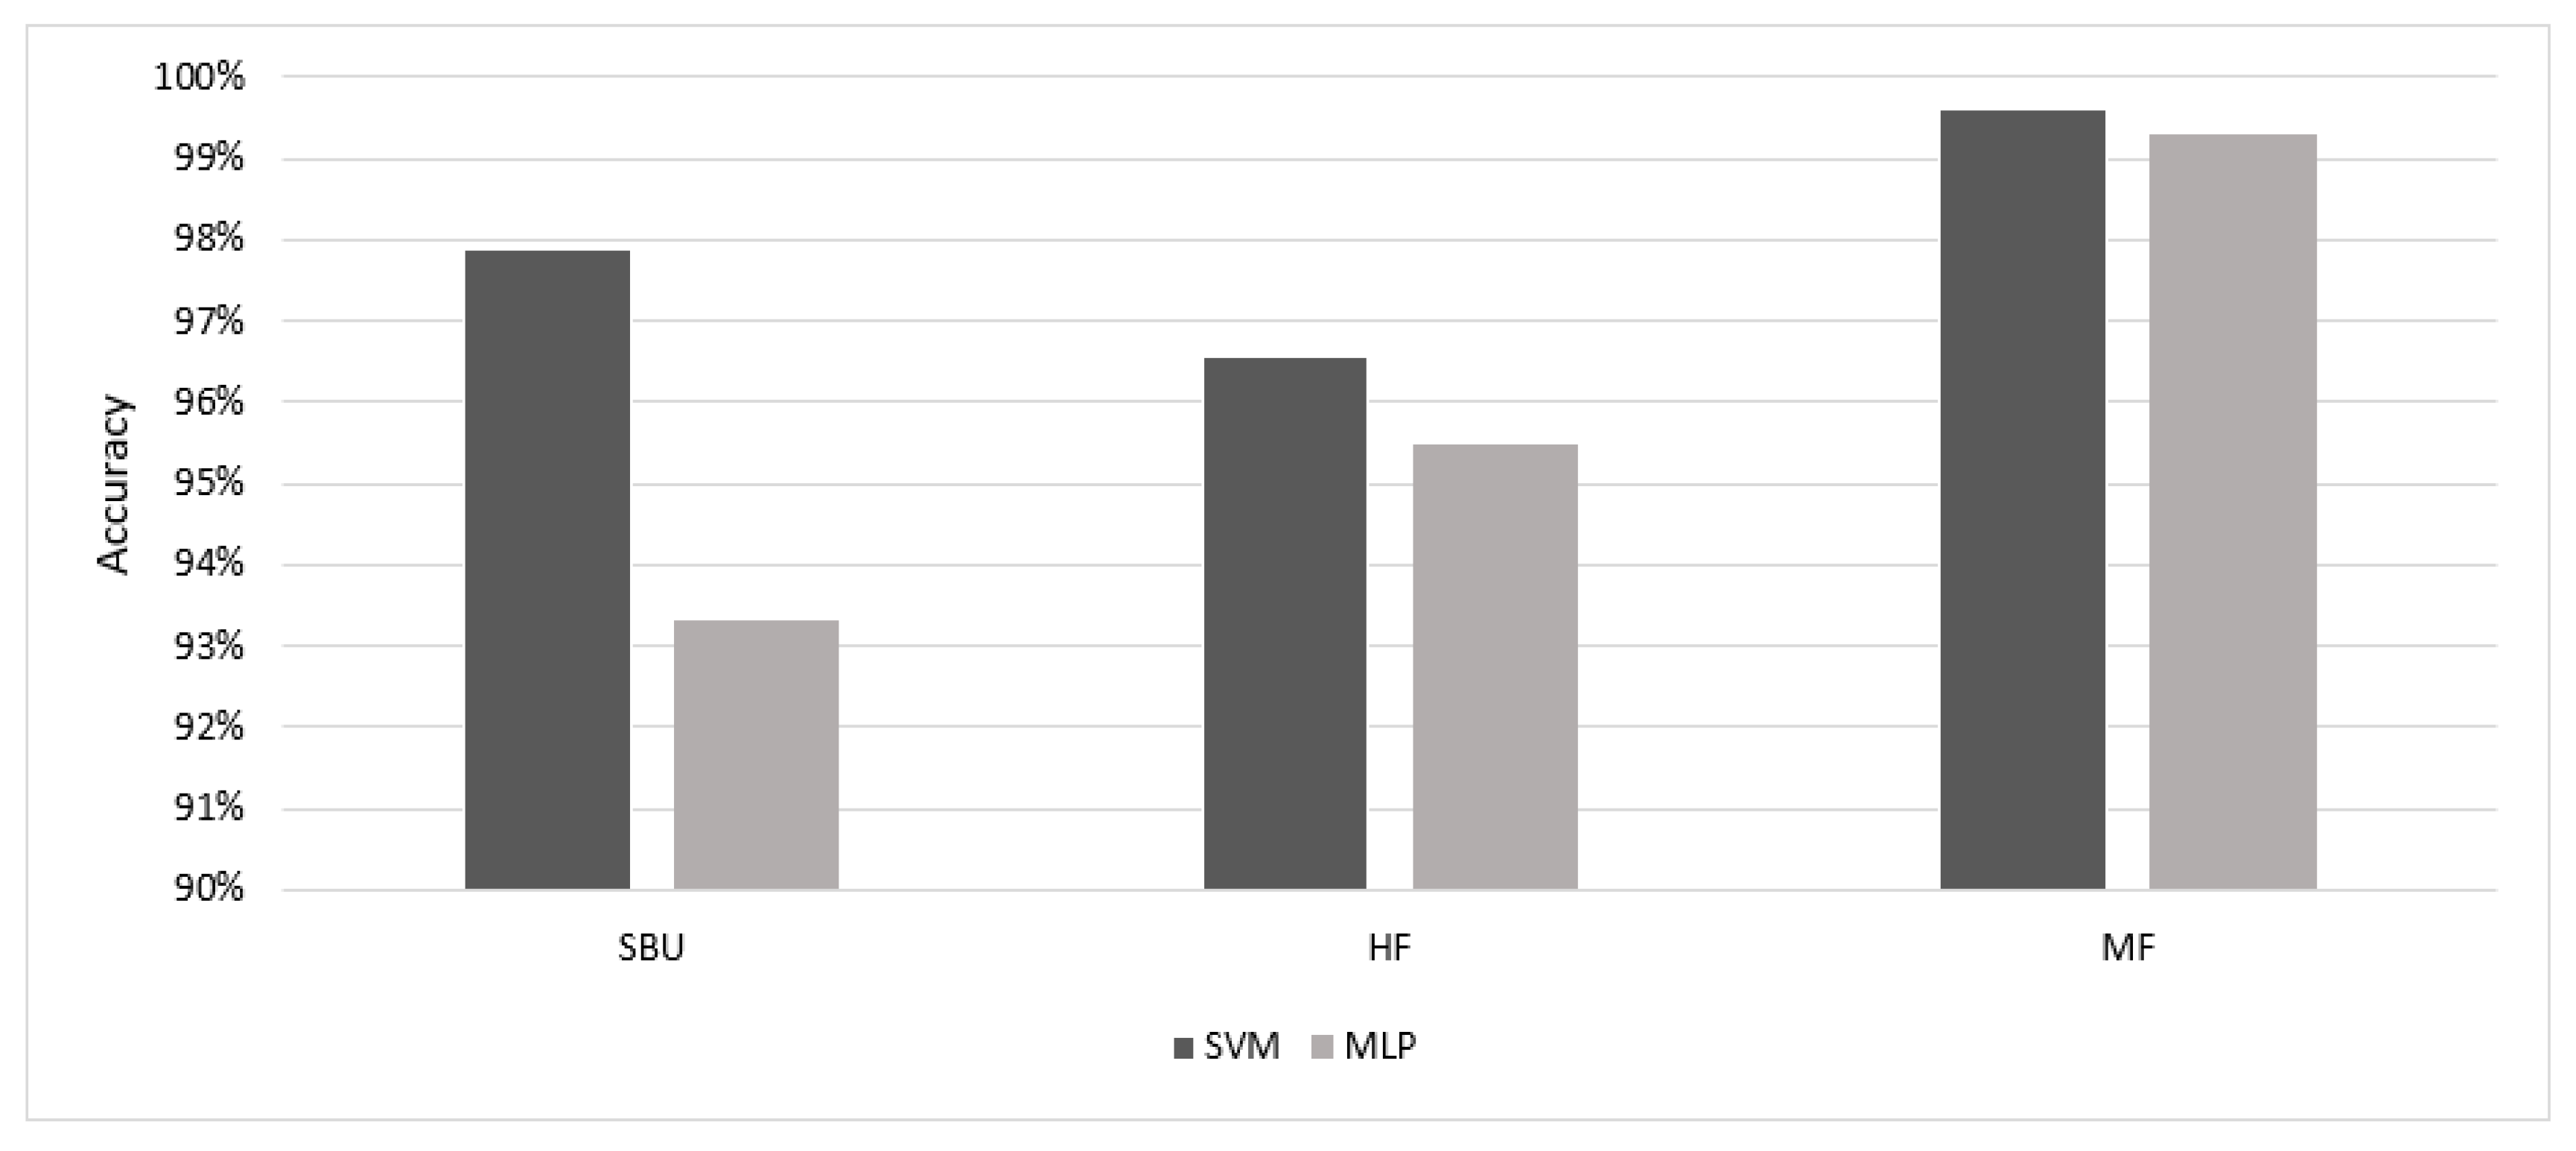
Figure 7.
Comparison of accuracy results of learned features of ResNet vs. GoogleNet models.
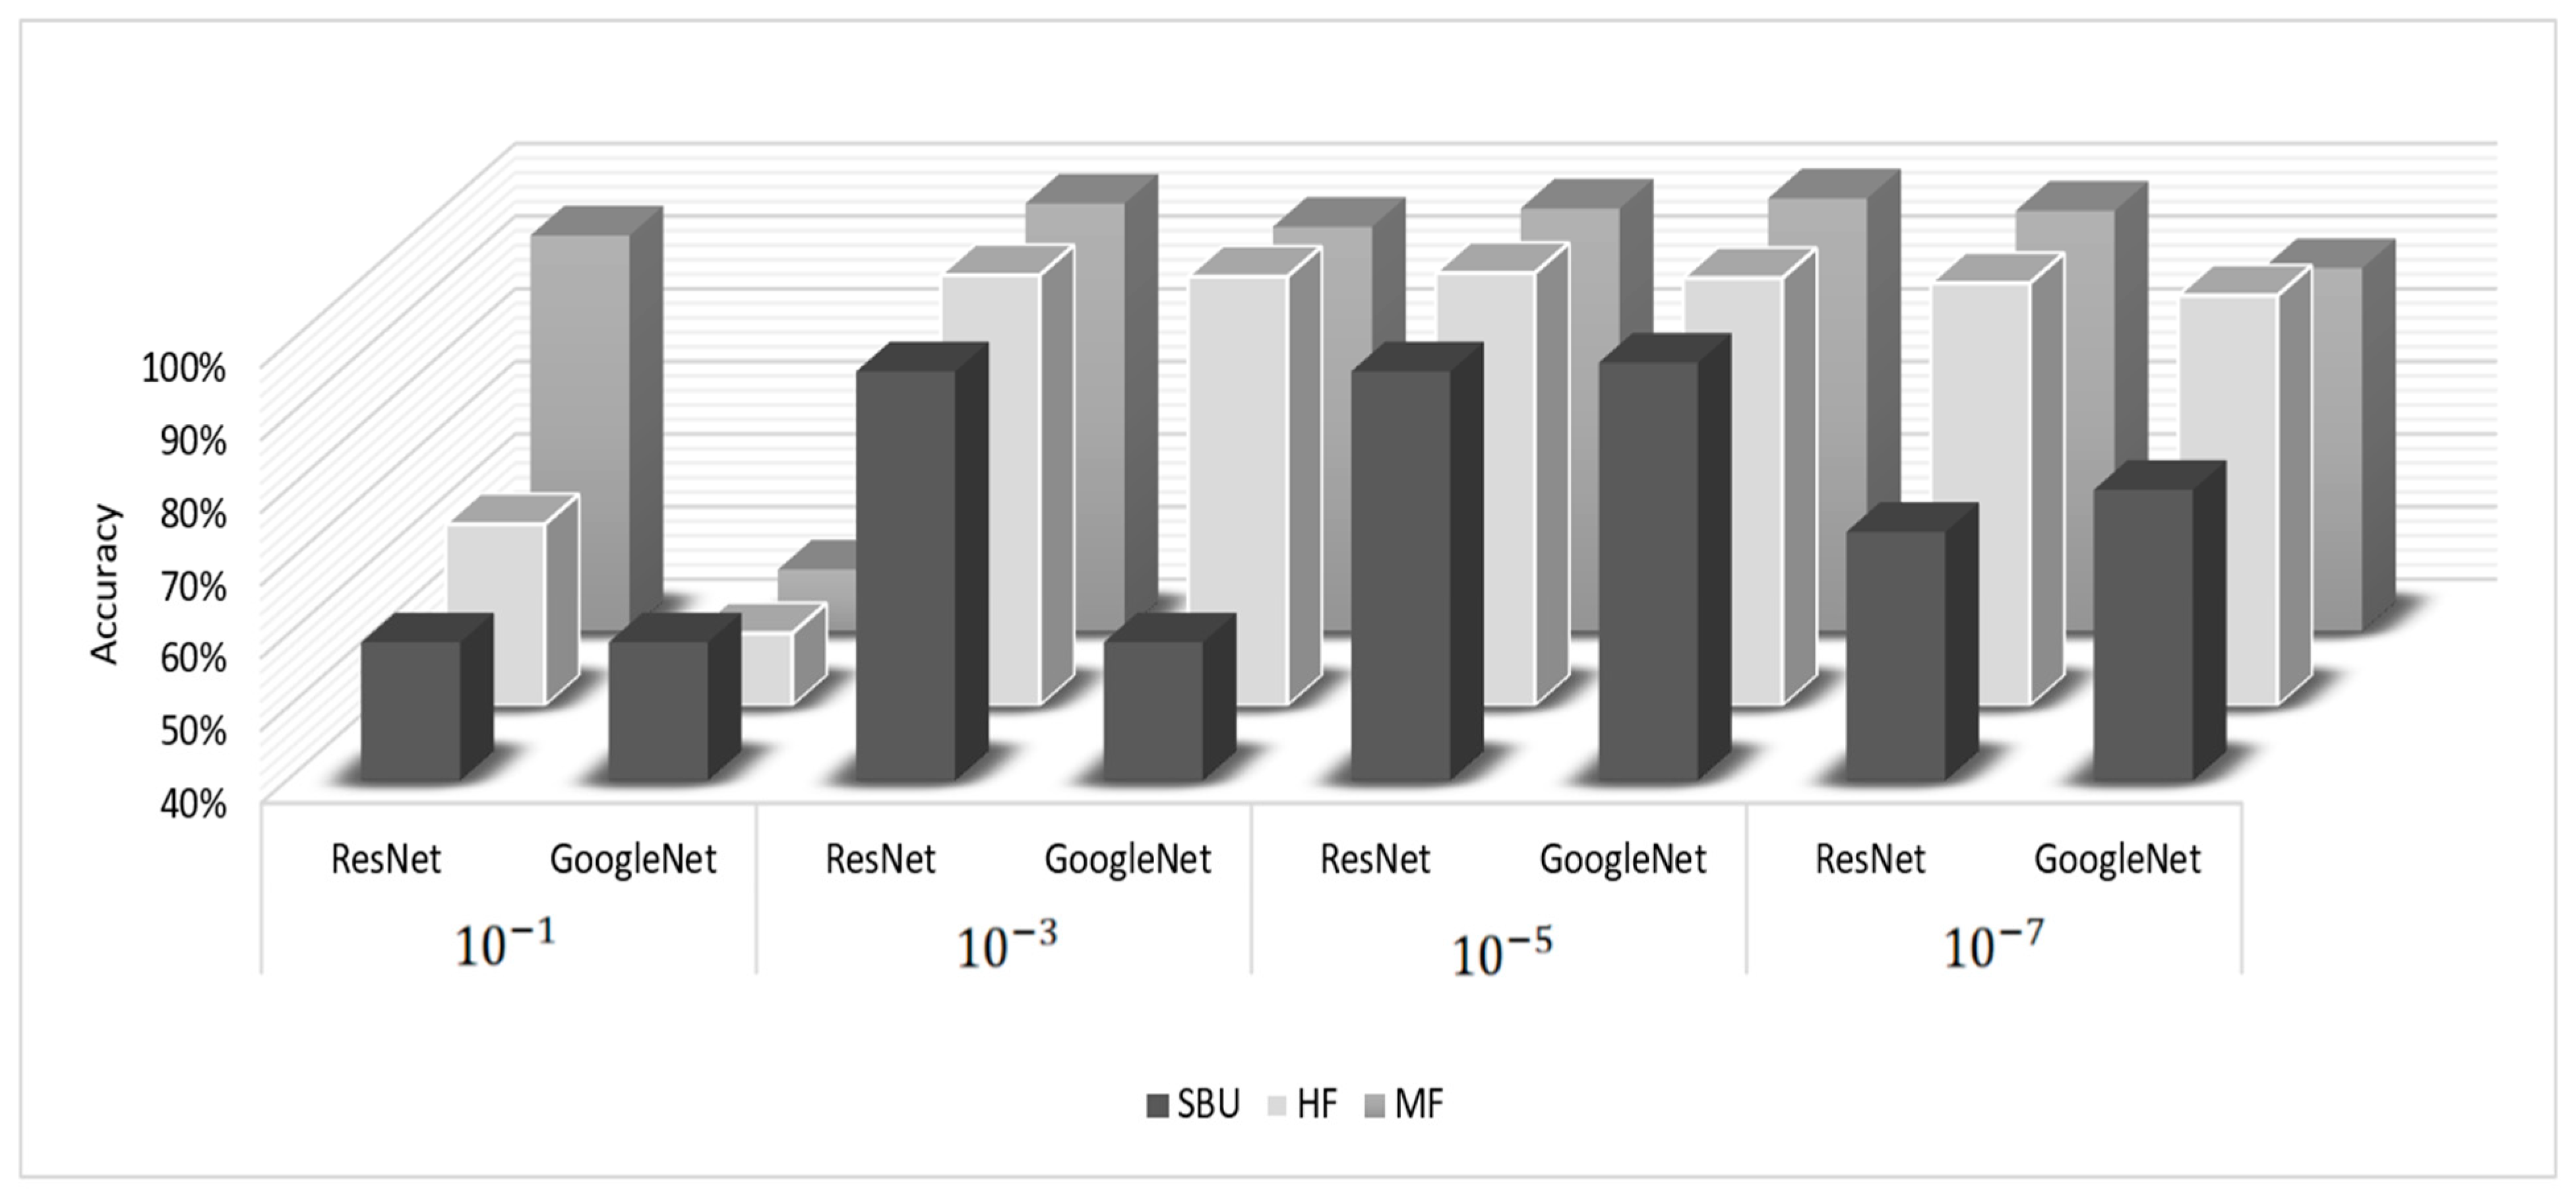
Figure 8.
Accuracy results comparison of feature engineering vs. learned feature.


Table 1.
MLP accuracy comparison.
| SBU | HF | MF | ||
|---|---|---|---|---|
| ST | BP | 86.6% | 94.4% | 93.9% |
| Rprop | 90.6% | 95.5% | 94.7% | |
| STPCA | BP | 83.6% | 93.6% | 91% |
| Rprop | 93.3% | 93.9% | 96.4% | |
| STPCA + LDA | BP | 82.7% | 93.8% | 94% |
| Rprop | 83.9% | 95.2% | 99.3% |
Table 2.
SVM accuracy comparison.
| SBU | HF | MF | ||
|---|---|---|---|---|
| ST | LK | 91.2% | 95.9% | 99% |
| RBF | 91.5% | 96.4% | 98.9% | |
| STPCA | LK | 95.7% | 95% | 99% |
| RBF | 94.5% | 96.50% | 99% | |
| STPCA + LDA | LK | 97.2% | 95.1% | 99.6% |
| RBF | 97.87% | 96.57% | 99.5% |
Table 3.
Feature engineering performance evaluation metrics.
| SBU_Dataset | HF_Dataset | MF_Dataset | |||||||||||||
|---|---|---|---|---|---|---|---|---|---|---|---|---|---|---|---|
| TR_t | ACC | F1 | Pr | TPR | TR_t | ACC | F1 | Pr | TPR | TR_t | ACC | F1 | Pr | TPR | |
| ST | 1.31 m | 91.5% | 0.897 | 0.89 | 0.9 | 22.08 m | 96.4% | 0.964 | 0.965 | 0.96 | 4.4 m | 98.9% | 0.989 | 0.984 | 0.99 |
| STPCA | 1.08 m | 94.5% | 0.93 | 0.93 | 0.92 | 9.45 m | 96.5% | 0.964 | 0.97 | 0.96 | 3.55 m | 99.07% | 0.99 | 0.98 | 0.99 |
| STPCA_LDA | 1.06 m | 97.8% | 0.974 | 0.97 | 0.977 | 9.3 m | 96.57% | 0.965 | 0.97 | 0.96 | 3.51 m | 99.6% | 0.99 | 0.99 | 1 |
Table 4.
Comparison of features of learned based on different learning rates.
| Learning Rate | Model | SBU | HF | MF |
|---|---|---|---|---|
| ResNet | 59.0% | 65.0% | 94.5% | |
| GoogleNet | 59.0% | 50.0% | 48.5% | |
| ResNet | 96.3% | 99.3% | 98.9% | |
| GoogleNet | 59.0% | 99.1% | 95.7% | |
| ResNet | 96.3% | 99.6% | 98.2% | |
| GoogleNet | 97.5% | 98.9% | 99.6% | |
| ResNet | 74.2% | 98.2% | 97.9% | |
| GoogleNet | 80% | 96.5% | 90.0% |
Table 5.
Performance evaluation metrics of learned features.
| SBU_Dataset | HF_Dataset | MF_Dataset | |||||||||||||
|---|---|---|---|---|---|---|---|---|---|---|---|---|---|---|---|
| ATR_t | ACC | F1 | Pr | TPR | ATR_t | ACC | F1 | Pr | TPR | ATR_t | ACC | F1 | Pr | TPR | |
| ResNet | 14.1 m | 96.36% | 0.95 | 0.96 | 0.94 | 2.81 h | 99.6% | 0.99 | 0.99 | 0.99 | 46.37 m | 98.28% | 0.98 | 0.96 | 1 |
| GoogleNet | 5.26 m | 97.5% | 0.97 | 0.97 | 0.97 | 1.46 h | 98.9% | 0.98 | 0.98 | 0.99 | 21.86 m | 99.6% | 0.99 | 0.99 | 0.99 |
Table 6.
Performance evaluation metrics of learned features vs. feature engineering.
| SBU_Dataset | HF_Dataset | MF_Dataset | |||||||||||||
|---|---|---|---|---|---|---|---|---|---|---|---|---|---|---|---|
| TR_t | ACC | F1 | Pr | TPR | TR_t | ACC | F1 | Pr | TPR | TR_t | ACC | F1 | Pr | TPR | |
| GoogleNet | 5.26 m | 97.5% | 0.97 | 0.97 | 0.97 | 1.46 h | 98.9% | 0.98 | 0.98 | 0.99 | 21.86 m | 99.6% | 0.99 | 0.99 | 0.99 |
| STPCA_LDA | 1.06 m | 97.8% | 0.974 | 0.97 | 0.977 | 9.3 m | 96.57% | 0.965 | 0.97 | 0.96 | 3.51 m | 99.6% | 0.99 | 0.99 | 1 |
Table 7.
Accuracy comparison of the proposed model with others over SBU dataset.
| Author | Method | Acc |
|---|---|---|
| Lejmi et al. [37] | DBN | 65.5% |
| Lejmi et al. [28] | LSTM | 84.62% |
| Verma et al. [42] | TNN/PIF | 93.9% |
| She et al. [30] | GCA-ST_SRU | 94% |
| Jahagirdar and Nagmode [14] | SWFHOG_FNN | 95.74% |
| Pujol et al. [24] | LE + HOA + HSGA_SVM | 97.85% |
| Learned features | GoogleNet | 97.5% |
| Feature engineering | STPCA + LDA-SVM | 97.87% |
Table 8.
Accuracy comparison of the proposed model with others over HF dataset.
| Author | Method | Acc |
|---|---|---|
| Khan et al. [27] | MobileNet | 87% |
| Da Silva and Pereira [39] | VGG-19 | 88.4% |
| Patel [33] | ResNet-LSTM | 89.5% |
| Deepak et al. [22] | STACOG_SVM | 90.4% |
| Deepak et al. [21] | HoF + statistical features_SVM | 91.5% |
| Chen et al. [16] | optical flow_SVM | 92.7% |
| Chatterjee and Halder [32] | CNN-BiLSTM | 94.06% |
| Elkhashab et al. [45] | DenseNet_121-LSTM | 96% |
| Vijeikis et al. [36] | MobileNet-LSTM | 96.1% |
| Learned features | Resnet-50 | 99.6% |
| Feature engineering | STPCA + LDA-SVM | 96.57% |
Table 9.
Accuracy comparison of the proposed model with others over MF dataset.
| Author | Method | Acc |
|---|---|---|
| Imah et al. [35] | DWT-GRU | 96% |
| Sharma et al. [31] | Xception-LSTM | 98.32% |
| Su et al. [29] | SPIL | 98.5% |
| Febin et al. [23] | MoBSIFT_RF | 98.9% |
| Serrano et al. [26] | 2D-CNN | 99% |
| Asad et al. [34] | 2D-CNN-LSTM | 99.1% |
| Vijeikis et al. [36] | MobileNet-LSTM | 99.5% |
| Khan et al. [27] | MobileNet | 99.5% |
| Mohammadi and Nazerfard [44] | SSHA | 99.5% |
| Learned features | GoogleNet | 99.6% |
| Feature engineering | STPCA + LDA-SVM | 99.6% |
Disclaimer/Publisher’s Note: The statements, opinions and data contained in all publications are solely those of the individual author(s) and contributor(s) and not of MDPI and/or the editor(s). MDPI and/or the editor(s) disclaim responsibility for any injury to people or property resulting from any ideas, methods, instructions or products referred to in the content. |
© 2023 by the authors. Licensee MDPI, Basel, Switzerland. This article is an open access article distributed under the terms and conditions of the Creative Commons Attribution (CC BY) license (https://creativecommons.org/licenses/by/4.0/).
Share and Cite
MDPI and ACS Style
Donia, M.M.F.; El-Behaidy, W.H.; Youssif, A.A.A. Impulsive Aggression Break, Based on Early Recognition Using Spatiotemporal Features. Big Data Cogn. Comput. 2023, 7, 150. https://doi.org/10.3390/bdcc7030150
AMA Style
Donia MMF, El-Behaidy WH, Youssif AAA. Impulsive Aggression Break, Based on Early Recognition Using Spatiotemporal Features. Big Data and Cognitive Computing. 2023; 7(3):150. https://doi.org/10.3390/bdcc7030150
Chicago/Turabian StyleDonia, Manar M. F., Wessam H. El-Behaidy, and Aliaa A. A. Youssif. 2023. "Impulsive Aggression Break, Based on Early Recognition Using Spatiotemporal Features" Big Data and Cognitive Computing 7, no. 3: 150. https://doi.org/10.3390/bdcc7030150