
A Fractal Permeability Model of Tight Oil Reservoirs Considering the Effects of Multiple Factors

1
College of Petroleum Engineering, China University of Petroleum (East China), Qingdao 266580, China
2
Key Laboratory of Unconventional Oil & Gas Development, China University of Petroleum (East China), Ministry of Education, Qingdao 266580, China
3
Exploration and Development Research Institute, Shengli Oilfield Company, SINOPEC, Dongying 257015, China
*
Author to whom correspondence should be addressed.
Fractal Fract. 2022, 6(3), 153; https://doi.org/10.3390/fractalfract6030153
Submission received: 16 January 2022
/
Revised: 10 February 2022
/
Accepted: 22 February 2022
/
Published: 11 March 2022
(This article belongs to the Special Issue Applications of Fractal Geometry Theory in Porous Media)
Abstract
:The prediction of permeability and the evaluation of tight oil reservoirs are very important to extract tight oil resources. Tight oil reservoirs contain enormous micro/nanopores, in which the fluid flow exhibits micro/nanoscale flow and has a slip length. Furthermore, the porous size distribution (PSD), stress sensitivity, irreducible water, and pore wall effect must also be taken into consideration when conducting the prediction and evaluation of tight oil permeability. Currently, few studies on the permeability model of tight oil reservoirs have simultaneously taken the above factors into consideration, resulting in low reliability of the published models. To fill this gap, a fractal permeability model of tight oil reservoirs based on fractal geometry theory, the Hagen–Poiseuille equation (H–P equation), and Darcy’s formula is proposed. Many factors, including the slip length, PSD, stress sensitivity, irreducible water, and pore wall effect, were coupled into the proposed model, which was verified through comparison with published experiments and models, and a sensitivity analysis is presented. From the work, it can be concluded that a decrease in the porous fractal dimension indicates an increase in the number of small pores, thus decreasing the permeability. Similarly, a large tortuous fractal dimension represents a complex flow channel, which results in a decrease in permeability. A decrease in irreducible water or an increase in slip length results in an increase in flow space, which increases permeability. The permeability decreases with an increase in effective stress; moreover, when the mechanical properties of rock (elastic modulus and Poisson’s ratio) increase, the decreasing rate of permeability with effective stress is reduced.
1. Introduction
With the development of conventional resources, much attention has been paid to unconventional resources, especially for tight oil [1,2]. In 2019, the Changqing oil field, which is the biggest oil field in China, extracted more than 5700 t of oil, 90% of which was tight oil [3]. The porous medium of tight reservoirs is different from that of conventional reservoirs and shale reservoirs. Compared with the conventional reservoir, the porous size of tight reservoirs is small, and the medium in tight reservoirs exhibits stress sensitivity [4]. The fluid flow in tight reservoirs is more complex than that in conventional reservoirs. Although there are many micro/nanopores in shale reservoirs, similarly to tight reservoirs, the pores are divided into organic pores and inorganic pores, which have different properties [5,6,7]. The fluid flow in shale reservoirs is distinct from that in tight reservoirs. Thus, an investigation into the flow capability, which is characterized by permeability, of fluid flow in tight reservoirs is urgently needed.
Tight reservoirs contain enormous micro/nanopores, in which the fluid flow exhibits micro/nanoscale flow [8,9,10]. The oil flow in micro/nanoscale pores is distinct from that at a macroscopic level [11], and many indoor experiments on fluid flow through micro/nanopores have been conducted. Majumder et al. [12] conducted experiments on water flowing through a freshly fabricated membrane consisting of aligned multiwalled carbon nanotubes with a diameter of about 7 nm. They found that the flow rates were four to five orders of magnitude faster than conventional fluid flow as predicted for pores 7 nm in diameter using the Hagen–Poiseuille equation (H–P equation) with ‘no slip’. The reason for this scenario was water slippage, and the slip length ranged from 3 to 68 μm. In the next year, Holt et al. [13] reported water flow measurements through microfabricated membranes in which aligned carbon nanotubes with diameters of less than 2 nm served as pores. They found that the measured water flow exceeded the value calculated from continuum hydrodynamics models by more than three orders of magnitude. Qin et al. [14] presented an experimental approach for measuring the water flow rate through individual ultralong carbon nanotubes. They exhibited a rate enhancement of 882–51 and a slip length of 53–8 nm for ultralong carbon nanotubes with diameters of 0.81–1.59 nm. Whitby et al. [15] conducted many flow experiments using different fluids, including water, ethanol, and decane, through carbon nanopipes with an inner diameter of 43 nm. They found that the flow rate of decane is larger than that of water. Secchi et al. [16] conducted a comparison between the water slip length on carbon nanotubes and that on boron nitride nanotubes through indoor experiments. They revealed an unexpectedly large slip length in carbon nanotubes, whereas they observed no slippage in boron nitride nanotubes. From the experiments above, it can be concluded that there is a slip length when fluid flows through tight reservoirs with micro/nanopores [12,13,14], and the length of slippage is related to the properties of the pore and fluid [15,16]. In addition, the fluid viscosity at the interface region is higher than that at the bulk region due to the pore wall effect. Tight reservoirs have abundant irreducible water [17,18], and the medium in these reservoirs exhibits stress sensitivity [4]. Thus, it is challenging to investigate the flow capability, which is characterized by permeability, of fluid flowing in tight reservoirs while considering the effects of multiple factors, such as fluid/oil slip, irreducible water, stress sensitivity, and the pore wall effect.
The fractal theory has been widely used to characterize permeability [19,20]; however, not all scholars have published studies showing that the pore size distribution (PSD) follows a fractal dimension [21,22]. Guarracino [23] presented a physical conceptual model for water retention in self-similar fractured hard rocks, and all model parameters could be calculated from the density of the main fractures, the maximum and minimum values of the fracture aperture, and the residual water content. In 2014, Guarracino et al. [24] proposed a fractal model to describe the evolution of multiphase flow properties during mineral dissolution. Nguyen et al. [25] developed a permeability model for fractal porous mediums saturated by one or two fluid phases. The model was related to the microstructural property of porous media, such as the fractal dimension for the pore space, fractal dimension for tortuosity, porosity, maximum radius, ratio of minimum pore radius and maximum pore radius, water saturation, and irreducible water saturation. On the basis of the hysteresis effect, Chen et al. [26] and Solidi et al. [22] presented analytical capillary models using fractal theory. The above studies were related to the fractal permeability of a porous medium without micro/nanopores, which is distinctly different from that of tight porous media.
The medium of tight reservoirs exhibits stress sensitivity, indicating that the pore is subject to deformation with the variation in effective stress. Makhnenko et al. [27] investigated the poroelastic and inelastic deformation of a porous, fluid-saturated rock under different limiting regimes, and they found that the material under undrained conditions was stiffer than under drained conditions. Pride et al. [28] provided an analytical model to describe the fluid flow permeability of rocks as a function of stress and fluid pressure. On the basis of mechanics of materials and the fractal characteristics of solid cluster size distribution, Tan et al. [29,30] proposed a permeability model of porous media considering the stress sensitivity. Lei et al. [31,32] proposed a fractal model of permeability in microporous media with lower permeability by considering the stress sensitivity effect. The proposed permeability model was expressed as a function of the effective stress, rock elastic modulus, microstructural parameters, initial irreducible water saturation, etc. Each parameter had clear physical meaning without the use of empirical constants. However, in the studies of Lei et al. [31,32], the effects of fluid/oil slip and the pore wall on flow behaviors were ignored.
Wang et al. [33] and Huang et al. [34] built fractal permeability models for oil transport in tight reservoirs by considering the effect of the boundary layer, and they found that the permeability was related to the fluid viscosity, pore structure, driving pressure, etc. The reason for this scenario is that the thickness of the boundary layer in their works was related to the fluid viscosity, pore structure, and driving pressure, etc. On the basis of the assumption that tight sandstones with natural microfractures can be represented by a bundle of tortuous capillary tubes and parallel plate fractures, Wang and Cheng [35] proposed a fractal stress-sensitive permeability model of tight sandstones considering the effect of tortuosity, and they compared their model with the permeability expression derived from classic theory. Dong et al. [36] developed a permeability model by considering the microstructural parameters and tortuosity effects of low-permeability sandstone using fractal geometry theory. All of the above studies presented a method for calculating the permeability of tight oil reservoirs, with each only partially considering the factors and not their combined effect. In addition, these studies did not take the effects of pore walls and fluid/oil slip into consideration. However, the effects of pore walls and especially fluid/oil slip on permeability are great.
As stated above, there is no permeability model simultaneously considering the effects of multiple factors, such as fluid/oil slip, irreducible water, stress sensitivity, PSD, and the effect of pore walls. To fill this gap, this paper proposes a fractal permeability model of tight oil reservoirs considering the effects of multiple factors based on the fractal geometry theory, H–P equation, and Darcy’s formula. To this end, the fractal geometry theory is presented in Section 2, and then the fractal permeability model of tight oil reservoirs is described in Section 3. The model verifications and analysis are presented in Section 4, while the conclusions are drawn in Section 5.
2. Fractal Geometry Theory
The fractal scaling law has been widely utilized for porous medium in petroleum fields and presents a relationship between pore number and pore radius as follows [37,38,39,40]:
where N denotes the number of pores; denotes the length scale; and are the pore radius and the maximum pore radius, respectively; denotes the pore fractal dimension; and the value of ranges from 1 to 2 in two dimensions or ranges from 2 to 3 in three dimensions.
According to the work of Yu [38], the expression of the pore fractal dimension is
where is the Euclidean dimension; denotes the porosity of pore media; and represents the minimum pore radius.
By differentiating Equation (1), the expression of pore numbers in a limited scope of pore size is, as follows [37]:
When the is equal to in Equation (1), the expression of total pore number is as follows [37]:
where denotes the total pore number.
Combining Equations (3) and (4), we can obtain
From Equation (5), the probability density function is defined as follows [37]:
where denotes the probability density function.
In reality, the flow path in porous medium is tortuous. According to published works [37], the length of a tortuous pore obeys the fractal scaling law as follows:
where denotes the length of a tortuous pore; denotes the distance between the inlet and outlet of the tortuous pore; and is the tortuosity fractal dimension, the expression of which is as follows [41,42]:
where and are, respectively, the average pore radius [42] and the average tortuosity [43], the expressions of which are as follows:
Equations (1)–(10) are the fractal geometry theory used in the paper.
3. Fractal Permeability Model of Tight Oil Reservoirs
For a tight core composed of numerous tortuous micro/nano pores (Figure 1a), the flow capacity of the core equals the sum of the flow capacity of all tortuous pores. Thus, the flow capacity of a pore must be determined first, and then the core flow capacity is obtained by summing all these together. A cross-section named AB in Figure 1a was taken as an example to investigate the oil flow in the pore seen in Figure 1b, which is the oil flow velocity profile considering the effects of multiple factors, including the oil slip, irreducible water, and pore wall effect. As seen in Figure 1b, the irreducible water is as an immovable water film in the pore. The oil flow region can be divided into the bulk region and interface region [44]. The oil viscosity in the interface region is different from that in the bulk region due to the effect of pore walls [45].
According to the definition of irreducible water saturations, we can obtain the following expression:
where denotes the irreducible water saturation; denotes a pore radius in the core (m); denotes the ratio of the thickness of the irreducible water film to the pore radius, which is a constant [39].
Simplifying Equation (11), we can obtain a relationship between irreducible water saturation and the ratio of the thickness of the irreducible water film to the pore radius, as follows:
Based on the physical model of fluid flowing in a pore in Figure 1b and the Tolstoi model [46], we can obtain the flow velocity profile as follows:
where and are the velocity in bulk region and interface region (m/s), respectively; and are the fluid viscosity without a pore wall effect and that without a pore wall effect (Pa·s), respectively; and and are the undetermined coefficients. is the driving pressure (Pa); denotes the pore length (m); and is the thickness of interface region (m).
The boundary conditions for ensuring the continuity of velocity and shear stress are as follows:
where denotes the oil slip length (m), the expression of which is as follows [44]:
where denotes the surface diffusion coefficient (m2/s); denotes the Boltzmann’s constant (J/K); is the temperature (K); and is the number of molecules per unit volume (1/m3).
According to the published works [44,47], there is a relationship between the adhesion work and as follows:
where denotes the work of adhesion (J/m2).
Substituting Equation (20) into Equation (19), we can obtain
In addition, the viscosity of oil considering the pore wall effect can be calculated by [45]
where is the contact angle (°).
Combining Equations (13) and (18), we can obtain the flow rate of fluid flow through a pore considering the multiple factors’ effects, including the oil slip, irreducible water, and pore wall effect, a detailed derivation of which is provided in Appendix A and the expression of which is as follows:
where is the flow rate of fluid flowing through a pore considering multiple factors’ effects (m3/s).
Combining Equations (6) and (23), we can obtain the flow rate of fluid flow through a core considering the effects of multiple factors based on the fractal theory, a detailed derivation of which can be seen in Appendix B and the expression of which is as follows:
where is the flow rate of fluid flowing through a core considering the effects of multiple factors (cm3/s).
Due to the decrease in pore sizes with the increase in effective stresses, we can obtain the relationship of the pore radius and effective stress using the classic Hertzian contact theory, the expression of which is as following [31,32]:
where denotes the pore radius when the effective stress is zero (cm); is effective stress (MPa); denotes Poisson’s ratio; denotes the rock elastic modulus (MPa); and is a power index related to the pore roughness, the value of which is 2/3 or 3/4 in the work of Lei et al. [31,32]
Combining Equations (24) and (25), we can obtain the flow rate of fluid flow through a core considering the effects of PSD, oil slip, irreducible water, stress sensitivity, and the pore wall. The expression of the flow rate is as follows:
where denotes the flow rate of fluid flowing through a core considering the effects of multiple factors (m3/s).
By combining this with the Darcy equation, we can obtain the permeability considering the effects of the PSD, oil slip, irreducible water, stress sensitivity, and pore wall. The expression of the permeability is as follows:
where is the unit conversion constant, the value of which is 10−15; is the cross-section of cores (m2); and is the reservoir permeability considering the effects of multiple factors (10−3 μm2).
4. Model Verifications and Analysis
4.1. Fractal Permeability Model Verification
In this section, we present verifications of the fractal permeability model by comparing it with published experimental results and models. Liu et al. [48] and Zhong et al. [49] conducted permeability stress sensitivity evaluation experiments of tight reservoirs by means of core flooding, thin-section analysis, and the nuclear magnetic resonance/high-pressure mercury intrusion. The core’s parameters in the works of Liu et al. [48] and Zhong et al. [49] are given in Table 1. By combining the data in Table 1 and Equations (3) and (8)–(10), we could obtain the pore fractal dimension and the tortuosity fractal dimension seen in Table 2.
By using the data in Table 1 and Table 2 and Equation (27), we could obtain the initial permeability and dimensionless permeability. The comparison between calculated results and experimental results are seen in Figure 2 and Figure 3 and Table 3 and Table 4. Figure 2 shows the comparison between initial permeability calculated by the proposed model and that found in experiments in the works of Liu et al. [48] and Zhong et al. [49]. From Figure 2, we can see that the initial permeability is consistent with that found in experiments in the works of Liu et al. [48] and Zhong et al. [49]. The relative errors ranged from 0 to 3.85%, which is less than 5%. Therefore, our presented model can calculate initial permeability accurately.
Table 3 and Table 4 present the comparison between the dimensionless permeability calculated by the proposed model and that found in experiments under various effective stress conditions. By extracting the relative errors and drawing the figure seen in Figure 3, we could see that the relative error varied greatly. The relative error was less than 5% when the effective stress was small. However, the relative error was larger than 5% when the effective stress was great. In Figure 3a, it can be seen that the relative error between permeability calculated by the proposed model and that found in experiments published by Zhong et al. [49] under the condition of effective stress smaller than 25 MPa was less than 5%. When the effective stress was 35 MPa or 40 MPa, the relative error was more than 5%. However, the absolute error of permeability ranged from just 0.021 × 10⁻³ μm2 to 0.049 × 10⁻³ μm2 when the effective stress was larger than 35 MPa (Table 3). Figure 3b shows the relative error between the permeability calculated by the proposed model and that published by Liu et al. [48]. When the effective stress was 20 MPa or 29 MPa, the relative error was more than 5%, but the absolute error was small and ranged from just 0.035 × 10⁻³ μm2 to 0.069 × 10⁻³ μm2 when the effective stress was larger than 20 MPa (Table 4). The reason for the scenario where the relative error is great when the effective stress increases is that the classic Hertzian contact theory is no longer applicable due to the rock nonlinear deformation. From the analysis above, we could conclude that our proposed model can accurately calculate the tight reservoir permeability under a small effective stress condition. For the scenario where the effective stress was great, although the relative error was larger than 5%, the absolute error was tiny at less than 0.069 × 10⁻³ μm2, which meets the field requirement.
In order to further verify the proposed model, we conducted a comparison (Figure 4) between the results of our model and those of Lei’s model [32]. The used parameters can be seen in the row with core No. S161-1 in Table 1 and Table 2. The essential difference between our model and Lei’s model [32] was that the oil slippage was ignored in Lei’s model. So, in Figure 4, four curves with different slip lengths are drawn. From Figure 4, we could see that the result of the proposed model without considering the effect of slippage is consistent with that of Lei’s model [32]. When the slippage length increased, the difference between the result of proposed model and that of Lei’s model [32] became greater.
4.2. The Effects of Multiple Factors on Tight Reservoir Permeability
This section shows the results from case studies we conducted to elaborate the effects of factors, including PSD, stress sensitivity, irreducible water, slip length, and rock’s mechanical property, on the tight reservoir’s permeability. The parameters used in this section are seen in Table 5. The other parameters used were the parameters of core M132-1.
Using the data from cases 1 and 2 in Table 5, we could obtain the effect of PSD on the permeability (Seen in Figure 5). Figure 5a shows the effect of pore fractal dimensions on permeability under various effective stresses. As seen in Figure 5a, the permeability decreased when the porous fractal dimension decreased. This is due to a decreasing porous fractal dimension indicating an increasing small-pore number, which made the flow capacity poor, and thus the permeability decreased. Figure 5b shows the effect of tortuosity fractal dimensions on permeability under various effective stress. As can be seen in Figure 5b, an increase in the tortuosity fractal dimension resulted in a decrease in the permeability. The reason for this scenario is that an increasing tortuosity fractal dimension indicates a more complex flow channel, which makes the permeability decrease. Meanwhile, the increase in effective stresses resulted in a decrease in pore sizes, which indicates that the permeability decreased.
Using the data from case 3 in Table 5, the effect of irreducible water on the permeability can be seen in Figure 6. From Figure 6, it can be seen that the permeability decreased with the increase in irreducible water. The effective flow channel decreased when the irreducible water increased, which resulted in a decrease in permeability. When the irreducible water increased from 0.35 to 0.55, the permeability decreased from 2.78 × 10⁻³ μm2 to 1.33 × 10⁻³ μm2.
Using the data from case 4 in Table 5, the effect of slip lengths on the permeability can be seen in Figure 7. Based on the work of Li et al. [44], it was concluded that the slip length ranges from 1 nm to 600 nm when the rock is oil wet, and the pore radius ranges from 0.001 μm to15 μm. Thus, it can be seen that the slip length ranged from 1 nm to 600 nm in Figure 7. Figure 7a presents the effect of slip length on permeability with various effective stresses. From Figure 7a, it could be determined that an increase in slip length results in an increasing actual flow channel, which makes permeability increase. Figure 7b shows the effect of slip lengths on the initial permeability and shows that the initial permeability linear increased with an increasing slip length. When the slip length increased from 1 nm to 600 nm, the initial permeability increased from 1.98 × 10⁻³ μm2 to 2.19 × 10⁻³ μm2, and the increase rate was 10%.
Using the data from cases 5 and 6 in Table 5, the effect of rock’s mechanical property on the permeability is seen in Figure 8. Figure 8a,b illustrate the effects of the rock elastic modulus and Poisson’s ratio on permeability, respectively. From Figure 8, it can be concluded that different rock elastic moduli and Poisson’s ratio indicate a different trend of permeability changing with the effective stress. An increase in the rock elastic modulus or Poisson’s ratio resulted in a decrease in permeability changing with the effective stress. For the scenario where Poisson’s ratio was 0.15, the permeability decreased from 1.41 × 10⁻³ μm2 to 0.71 × 10⁻³ μm2 when the rock elastic modulus decreased from 6 GP to 1 GP.
5. Conclusions
A fractal permeability model of tight oil reservoirs considering the effects of multiple factors by the fractal geometry theory, H-P equation, and Darcy’s formula is proposed. Many factors, including the PSD, oil slip, irreducible water, stress sensitivity, and pore wall, were coupled into the proposed model, which was verified by comparing it with published experiments and models. From this work, we can conclude:
- (1)
- A decreasing porous fractal dimension results in a decrease in permeability. The permeability decreases with the increase in tortuosity fractal dimension and irreducible water. When the irreducible water increased from 0.35 to 0.55, the permeability decreased from 2.78 × 10⁻³ μm2 to 1.33 × 10⁻³ μm2, and reduced by more than half the permeability.
- (2)
- An increase in slip length results in an increasing actual flow channel, which makes permeability increase. The initial permeability linear increases with an increasing slip lengths. When the slip length increased from 1 nm to 600 nm, the initial permeability increased from 1.98 × 10⁻³ μm2 to 2.19 × 10⁻³ μm2, and the increase rate was 10%.
- (3)
- The permeability decreases with the increase of effective stress. The porous fractal dimension, tortuosity fractal dimension, slip length, and irreducible water have a tiny effect on the permeability changing rate with effective stress. When the parameters of the rock’s mechanical property (the rock elastic modulus and Poisson’s ratio) increased, the permeability’s decreasing rate with effective stress became small.
Author Contributions
Conceptualization, Z.W. and X.C.; methodology, Z.W. and C.C.; software, Y.Y.; validation, C.Z.; formal analysis, J.W.; investigation, Z.W.; resources, Y.Y.; data curation, C.Z.; writing—original draft preparation, Z.W.; writing—review and editing, Z.W. and C.C.; visualization, C.C.; supervision, C.C.; project administration, Y.Y.; funding acquisition, Z.W. and C.C. All authors have read and agreed to the published version of the manuscript.
Funding
This research was funded by the National Natural Science Foundation of China under grant number 51974343, Independent Innovation Scientific Research Project (science and engineering) of China University of Petroleum (East China) under grant number 20CX06089A, Qingdao Postdoctoral Applied Research Project under grant number qdyy20200084, and China Postdoctoral Science Foundation under grant number 2021M703588.
Institutional Review Board Statement
Not applicable.
Informed Consent Statement
Not applicable.
Data Availability Statement
All data are contained within the paper, and a report of any other data is not included.
Acknowledgments
The work was supported by the National Natural Science Foundation of China, No. 51974343, Independent Innovation Scientific Research Project (science and engineering) of China University of Petroleum (East China), No. 20CX06089A, Qingdao Postdoctoral Applied Research Project, No. qdyy20200084, and China Postdoctoral Science Foundation, No. 2021M703588.
Conflicts of Interest
The authors declare no conflict of interest.
Appendix A. The Flow Rate of Fluid Flowing through a Pore considering Multiple Factors’ Effects
In this section, we present a detailed derivation of flow rate of fluid flowing through a pore considering multiple factors’ effects, including oil slip, irreducible water, and the pore wall effect. Combining Equations (13), (14), (17) and (18), we can obtain
Combing Equations (A1) and (A2), we can obtain the expression of undetermined parameters as follows:
Substituting Equation (A3) into Equation (13), we can obtain the flow velocity of oil in the bulk region of the pore as follows:
Substituting Equation (A4) into Equation (14), we can obtain the flow velocity of oil in the interface region of the pore as follows:
Considering that the flow rate of fluid flowing through a pore equals the sum of the flow rate flowing through the bulk region and that flowing through the interface region, we can obtain
where denotes the flow rate of fluid flowing through a pore (m3/s); and and are the flow rate flowing through the bulk region and that flowing through the interface region (m3/s), respectively. The expressions of and are as follows:
Substituting Equation (A5) into Equation (A8), we can obtain
Substituting Equation (A6) into Equation (A9), we can obtain
In general, the interface region is small, so we can obtain
Simplifying Equations (A10) and (A11) using Equations (A12) and (A13), we can obtain a novel flow rate as follows:
Substituting Equations (A14) and (A15) into Equation (A7), we can obtain
Appendix B. The Detailed Derivation of the Flow Rate of Fluid Flowing through a Core considering the Effects of Multiple Factors
In this appendix, a detailed derivation of the flow rate of fluid flowing through a core considering the effects of multiple factors is presented. The flow rate of fluid flowing through a core without considering the effect of tortuous pores is as follows:
where is the flow rate of fluid flowing through a core without considering the effect of tortuous pores (cm3/s).
Substituting Equations (6) and (23) into Equation (A17), we can obtain
With Equation (7), a corrected flow rate of fluid flowing through a core considering the effect of tortuous pores can be obtained, as follows:
where is the flow rate of fluid flowing through a core considering the effects of multiple factors (cm3/s).
Simplifying Equation (A19), we can obtain a new expression of the flow rate of fluid flowing through a core considering the effect of multiple factors as follows:
References
- Wu, Z.; Cui, C.; Ye, Y.; Cheng, X.; Trivedi, J. A fractal model for quantitative evaluating the effects of spontaneous imbibition and displacement on the recovery of tight reservoirs. J. Petrol. Sci. Eng. 2021, 198, 108120. [Google Scholar] [CrossRef]
- Wu, Z.; Cui, C.; Ye, Y.; Cheng, X.; Trivedi, J. A novel model for the proppant equilibrium height in hydraulic fractures for low-viscosity fracturing fluid treatment. Petrol. Sci. 2021, online. [Google Scholar] [CrossRef]
- Peng, Y.; Liu, J.; Zhang, G.; Pan, Z.; Ma, Z.; Wang, Y.; Hou, Y. A pore geometry-based permeability model for tight rocks and new sight of impact of stress on permeability. J. Nat. Gas Sci. Eng. 2021, 91, 103958. [Google Scholar] [CrossRef]
- Wu, Z.; Cui, C.; Lv, G.; Bing, S.; Cao, G. A multi-linear transient pressure model for multistage fractured horizontal well in tight oil reservoirs with considering threshold pressure gradient and stress sensitivity. J. Petrol. Sci. Eng. 2019, 172, 839–854. [Google Scholar] [CrossRef]
- Wu, Y.; Cheng, L.; Huang, S.; Bai, Y.; Jia, P.; Wang, S.; Xu, B.; Chen, L. An approximate semianalytical method for two-phase flow analysis of liquid-rich shale gas and tight light-oil wells. J. Petrol. Sci. Eng. 2019, 176, 562–572. [Google Scholar] [CrossRef]
- Wang, H.; Wu, W.; Chen, T.; Yu, J.; Pan, J. Pore structure and fractal analysis of shale oil reservoirs: A case study of the Paleogene Shahejie Formation in the Dongying Depression, Bohai Bay, China. J. Petrol. Sci. Eng. 2019, 177, 711–723. [Google Scholar] [CrossRef]
- Zhang, S.; Yan, J.; Hu, Q.; Wang, J.; Tian, T.; Chao, J.; Wang, M. Integrated NMR and FE-SEM methods for pore structure characterization of Shahejie shale from the Dongying Depression, Bohai Bay Basin. Mar. Petrol. Geol. 2019, 100, 85–94. [Google Scholar] [CrossRef]
- Wang, Y.; Gao, Y.; Fang, Z. Pore throat structure and classification of Paleogene tight reservoirs in Jiyang depression, Bohai Bay Basin, China. Petrol. Explor. Dev. 2021, 45, 208–322. [Google Scholar] [CrossRef]
- Wang, F.; Yang, K.; Zai, Y. Multifractal characteristics of shale and tight sandstone pore structures with nitrogen adsorption and nuclear magnetic resonance. Petrol. Sci. 2020, 17, 1209–1220. [Google Scholar] [CrossRef]
- Yin, X.; Shu, J.; Chen, S.; Wu, P.; Gao, W.; Gao, J.; Shi, X. Impact of rock type on the pore structures and physical properties within a tight sandstone reservoir in the Ordos Basin, NW China. Petrol. Sci. 2020, 17, 896–991. [Google Scholar] [CrossRef]
- Li, Z.; Xu, Z. The problems and progress in the experimental study of Mico/Nano-scale flow. J. Exp. Fluid Mech. 2014, 28, 1–11. [Google Scholar] [CrossRef]
- Majumder, M.; Chopra, N.; Andrews, R.; Hinds, B. Enhanced flow in carbon nanotubes. Nature 2005, 438, 44. [Google Scholar] [CrossRef] [PubMed]
- Holt, J.; Park, H.; Wang, Y.; Stadermann, M.; Artyukhin, A.; Grigoropoulos, C.; Aleksandr, N.; Bakajin, O. Fast mass transport through sub-2-nanometer carbon nanotubes. Science 2006, 312, 1034–1037. [Google Scholar] [CrossRef] [PubMed]
- Qin, X.; Yuan, Q.; Zhao, Y.; Xie, S.; Liu, Z. Measurement of the rate of water translocation through carbon nanotubes. Nano Lett. 2011, 11, 2173–2177. [Google Scholar] [CrossRef] [PubMed]
- Whitby, M.; Cagnon, L.; Thanou, M.; Quirke, N. Enhanced fluid flow through nanoscale carbon pipes. Nano Lett. 2008, 8, 2632–2637. [Google Scholar] [CrossRef] [PubMed]
- Secchi, E.; Marbach, S.; Nigues, A.; Stein, D.; Siria, A.; Bocquet, L. Massive radius-dependent flow slippage in carbon nanotubes. Nature 2016, 537, 210–213. [Google Scholar] [CrossRef] [PubMed]
- Chen, M.; Li, M.; Zhao, J.; Kuang, Y. Irreducible water distribution from nuclear magnetic resonance and constant-rate mercury injection methods in tight oil reservoirs. Int. J. Oil Gas Coal Technol. 2018, 17, 443–457. [Google Scholar] [CrossRef]
- Su, Y.; Fu, J.; Li, L.; Wang, W.; Zafar, A.; Zhang, M.; Ouyang, W. A new model for predicting irreducible water saturation in tight gas reservoirs. Petrol. Sci. 2020, 17, 1087–1100. [Google Scholar] [CrossRef] [Green Version]
- Xia, Y.; Wei, W.; Liu, Y.; Cai, Z.; Zhang, Q.; Cai, J. A fractal-based approach to evaluate the effect of microstructure on the permeability of two-dimensional porous media. Appl. Geochem. 2021, 131, 105013. [Google Scholar] [CrossRef]
- Zhang, Y.; Zeng, J.; Cai, J.; Feng, S.; Feng, X.; Qiao, J. A Mathematical Model for Determining Oil Migration Characteristics in Low-Permeability Porous Media Based on Fractal Theory. Transp. Porous Med. 2019, 129, 633–652. [Google Scholar] [CrossRef]
- Vinogradov, J.; Hill, R.; Jougnot, D. Influence of pore size distribution on the electrokinetic coupling coefficient in two-phase flow conditions. Water 2021, 13, 2316. [Google Scholar] [CrossRef]
- Soldi, M.; Guarracino, L.; Jougnot, D. A simple hysteretic constitutive model for unsaturated flow. Transp. Porous Med. 2017, 120, 271–285. [Google Scholar] [CrossRef] [Green Version]
- Guarracino, L. A fractal constitutive model for unsaturated flow in fractured hard rocks. J. Hydrol. 2006, 324, 154–162. [Google Scholar] [CrossRef]
- Guarracino, L.; Rötting, T.; Carrera, J. A fractal model to describe the evolution of multiphase flow properties during mineral dissolution. Adv. Water Resour. 2014, 67, 78–86. [Google Scholar] [CrossRef]
- Nguyen, V.; Damien, J.; Luong, D.; Phan, V.; Tran, T.; Dang, T.; Nguyen, M. Predicting water flow in fully and partially saturated porous media: A new fractal-based permeability model. Hydrogeol. J. 2021, 29, 2017–2031. [Google Scholar]
- Chen, H.; Chen, K.; Yang, M.; Xu, P. A fractal capillary model for multiphase flow in porous media with hysteresis effect. Int. J. Multiph. Flow 2020, 125, 103208. [Google Scholar] [CrossRef]
- Makhnenko, R.Y.; Labuz, J.F. Elastic and inelastic deformation of fluid-saturated rock. Philos. Trans. R. Soc. A 2016, 374, 20150422. [Google Scholar] [CrossRef] [Green Version]
- Pride, S.R.; Berryman, J.G.; Commer, M.; Nakagawa, S.; Newman, G.A.; Vasco, D.W. Changes in geophysical properties caused by fluid injection into porous rocks: Analytical models. Geophys. Prospect. 2017, 65, 766–790. [Google Scholar] [CrossRef] [Green Version]
- Tan, X.; Li, X.; Liu, J.; Zhang, L.; Cai, J. Fractal analysis of stress sensitivity of permeability in porous media. Fractals 2014, 23, 1550001. [Google Scholar] [CrossRef]
- Tan, X.; Li, X.; Liu, J.; Zhang, L.; Fan, Z. Study of the effects of stress sensitivity on the permeability and porosity of fractal porous media. Phys. Lett. A 2015, 397, 2458–2465. [Google Scholar] [CrossRef]
- Lei, G.; Dong, P.; Wu, Z.; Mo, S.; Gai, S.; Zhao, C.; Liu, Z. A fractal model for the stress-dependent permeability and relative permeability in tight sandstones. J. Can. Pet. Technol. 2015, 54, 36–48. [Google Scholar] [CrossRef]
- Lei, G.; Dong, Z.; Li, W.; Wen, Q.; Wang, C. Theoretical study on stress sensitivity of fractal porous media with irreducible water. Fractal 2018, 26, 1850004. [Google Scholar] [CrossRef]
- Wang, F.; Liu, Z.; Jiao, L.; Wang, C.; Guo, H. A fractal permeability model coupling boundary-lager effect for tight oil reservoir. Fractal 2017, 25, 1750042. [Google Scholar] [CrossRef]
- Huang, S.; Yao, Y.; Zhang, S.; Ji, J.; Ma, R. A fractal model for oil transport in tight porous media. Transp. Porous Med. 2018, 121, 725–739. [Google Scholar] [CrossRef]
- Wang, F.; Cheng, H. Effect of tortuosity on the stress-dependent permeability of tight sandstones: Analytical modelling and experimentation. Mar. Petrol. Geol. 2020, 120, 104524. [Google Scholar] [CrossRef]
- Dong, S.; Xu, L.; Dai, Z.; Xu, B.; Yu, Q.; Yin, S.; Zhang, X.; Zhang, C.; Zang, X.; Zhou, X.; et al. A novel fractal model for estimating permeability in low-permeable sandstone reservoirs. Fractals 2020, 28, 2040005. [Google Scholar] [CrossRef]
- Yu, B.; Cheng, P. A fractal permeability model for bi-dispersed porous media. Int. J. Heat Mass Tran. 2002, 45, 2983–2993. [Google Scholar] [CrossRef]
- Yu, B.; Li, J. Some fractal characters of porous media. Fractals 2001, 9, 365–372. [Google Scholar] [CrossRef]
- Wu, Z.; Cui, C.; Hao, Y.; Sun, Y.; Lv, G.; Sun, D.; Zhang, Z. Relative permeability model taking the roughness and actual fluid distributions into consideration for water flooding reservoirs. Arab. J. Sci. Eng. 2019, 44, 10513–10523. [Google Scholar] [CrossRef]
- Bonnet, E.; Bour, O.; Odling, N.; Davy, P.; Main, I.; Cowie, P.; Berkowitz, B. Scaling of fracture systems in geological media. Rev. Geophys. 2001, 39, 347–383. [Google Scholar] [CrossRef] [Green Version]
- Zheng, Q.; Yu, B.; Duan, Y.; Fang, Q. A fractal model for gas slippage factor in porous media in the slip flow regime. Chem. Eng. Sci. 2016, 87, 209–215. [Google Scholar] [CrossRef]
- Xu, P.; Yu, B. Developing a new form of permeability and Kozeny–Carman constant for homogeneous porous media by means of fractal geometry. Adv. Water Resour. 2008, 31, 74–81. [Google Scholar] [CrossRef]
- Yu, B.; Li, J. A Geometry Model for Tortuosity of Flow Path in Porous Media. Chin. Phys. Lett. 2004, 21, 1569–1571. [Google Scholar]
- Li, L.; Su, Y.; Wang, H.; Sheng, G.; Wang, W. A new slip length model for enhanced water flow coupling molecular interaction, pore dimension, wall roughness, and temperature. Adv. Polym. Technol. 2019, 6424012. [Google Scholar] [CrossRef] [Green Version]
- Wu, K.; Chen, Z.; Li, J.; Li, X.; Xu, J.; Dong, X. Wettability effect on nanoconfined water flow. Proc. Natl. Acad. Sci. USA 2019, 116, 3358–3363. [Google Scholar] [CrossRef] [Green Version]
- Mattia, D.; Calabro, F. Explaining high flow rate of water in carbon nanotubes via solid–liquid molecular interactions. Microfluid. Nanofluidics 2012, 13, 125–130. [Google Scholar] [CrossRef] [Green Version]
- Ma, C.; Chen, Y.; Sun, G.; Li, Q.; Gao, W.; Jiang, Q. Understanding water slippage through carbon nanotubes. R. Soc. Chem. 2021, 23, 14737. [Google Scholar] [CrossRef]
- Liu, G.; Yin, H.; Lan, Y.; Fei, S.; Yang, D. Experimental determination of dynamic pore-throat structure characteristics in a tight gas sandstone formation with consideration of effective stress. Mar. Petrol. Geol. 2020, 113, 104170. [Google Scholar] [CrossRef]
- Zhong, X.; Zhu, Y.; Liu, L.; Yang, H.; Li, Y.; Xie, Y.; Liu, L. The characteristics and influencing factors of permeability stress sensitivity of tight sandstone reservoirs. J. Petrol. Sci. Eng. 2020, 191, 107221. [Google Scholar] [CrossRef]
Figure 1.
Schematic representation of oil flow in tight reservoirs: (a) oil flow in a core with numerous tortuous pores; (b) oil velocity profile in a pore considering the effects of multiple factors, including oil slip, irreducible water, and the effect of the wall.
Figure 1.
Schematic representation of oil flow in tight reservoirs: (a) oil flow in a core with numerous tortuous pores; (b) oil velocity profile in a pore considering the effects of multiple factors, including oil slip, irreducible water, and the effect of the wall.

Figure 2.
The comparison between initial permeability calculated by the proposed model and that found in experiments.
Figure 2.
The comparison between initial permeability calculated by the proposed model and that found in experiments.

Figure 3.
The relative errors of the permeability calculated by the proposed model and that found in experiments under various effective stress conditions; ((a) the relative error when compared with the experimental data published by Zhong et al. [49]; (b) The relative error when compared with the experimental data published by Liu et al. [48]).
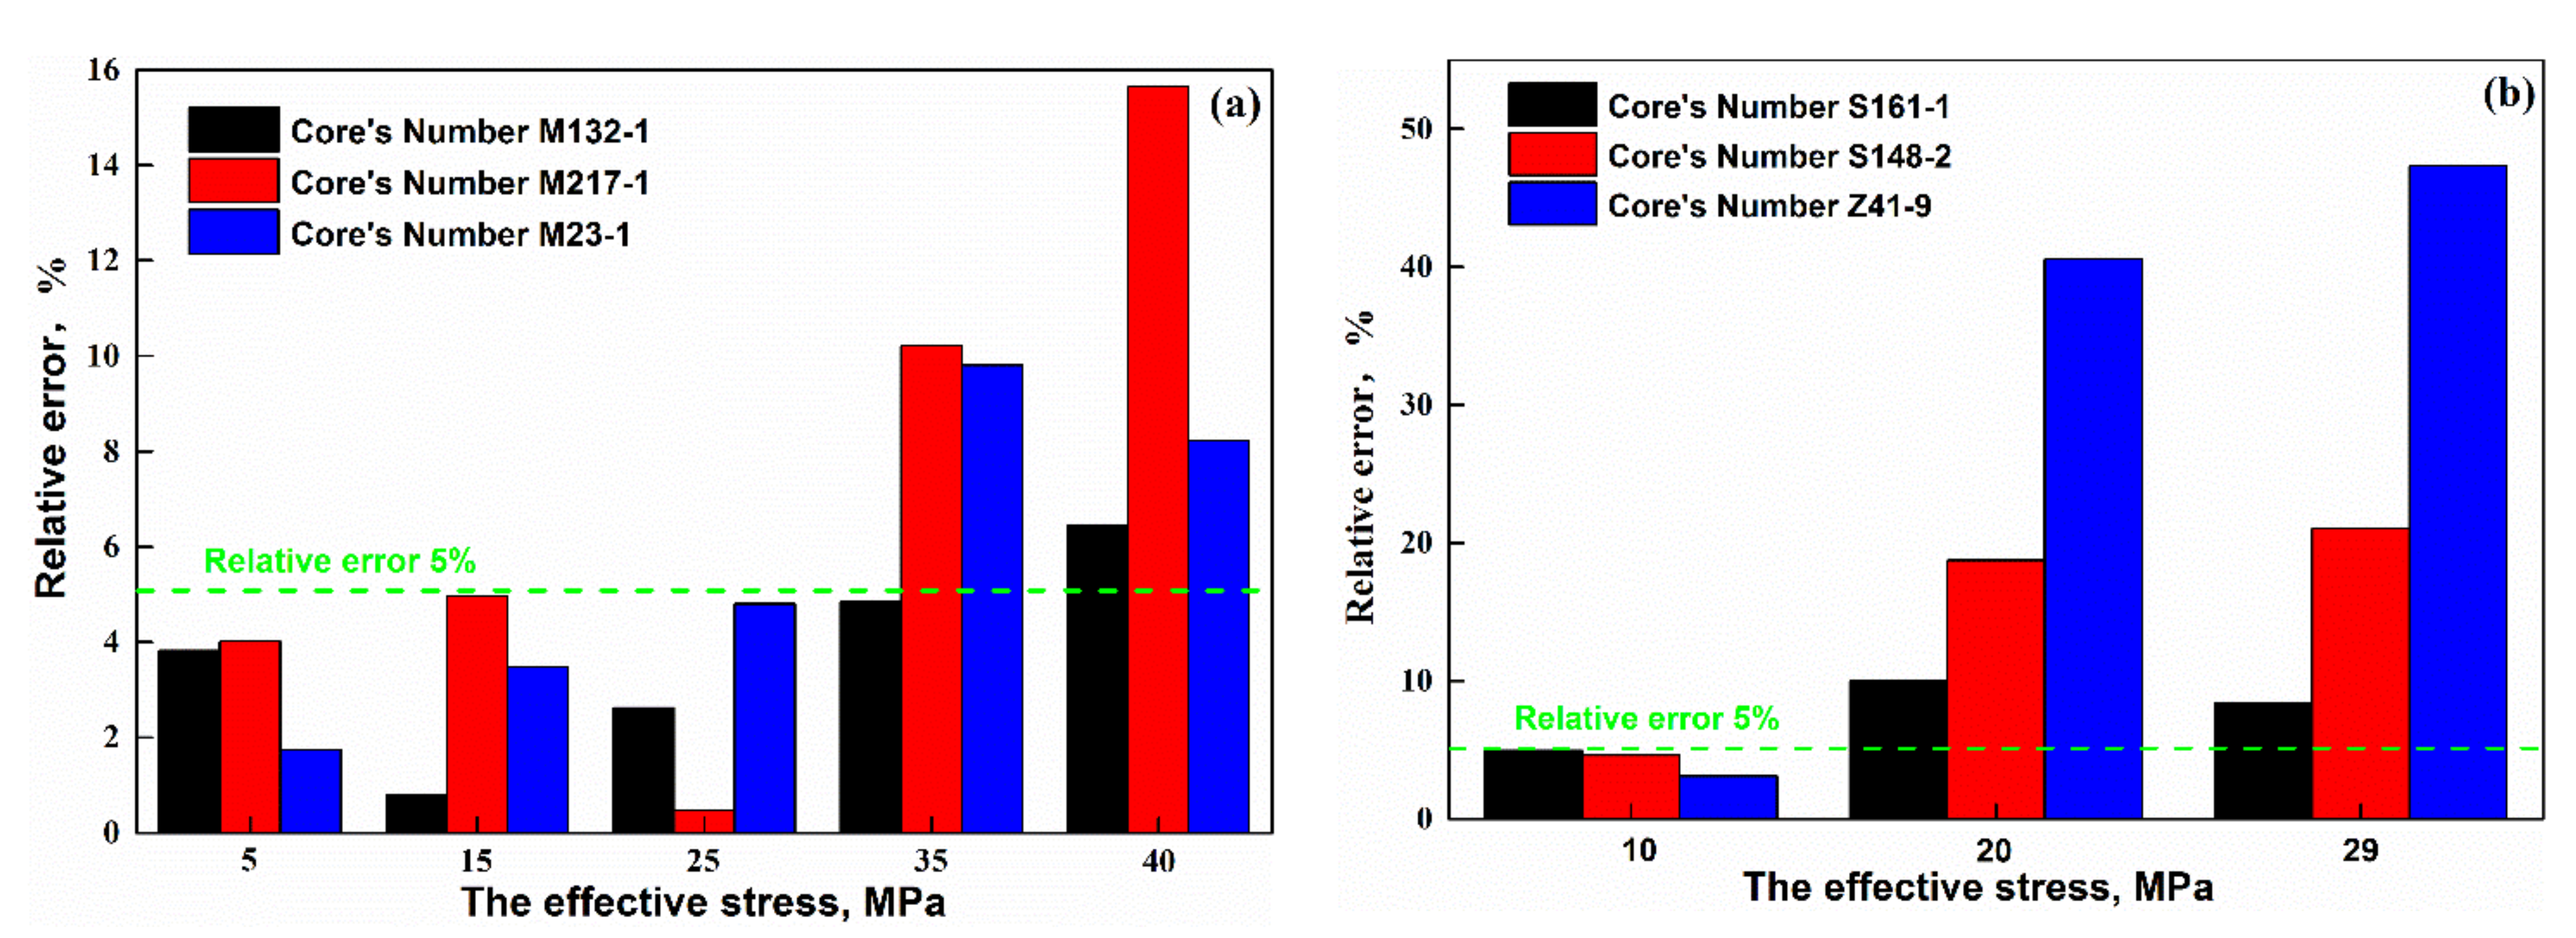
Figure 4.
The comparison between the results of our model and that of Lei’s model [32].
Figure 4.
The comparison between the results of our model and that of Lei’s model [32].
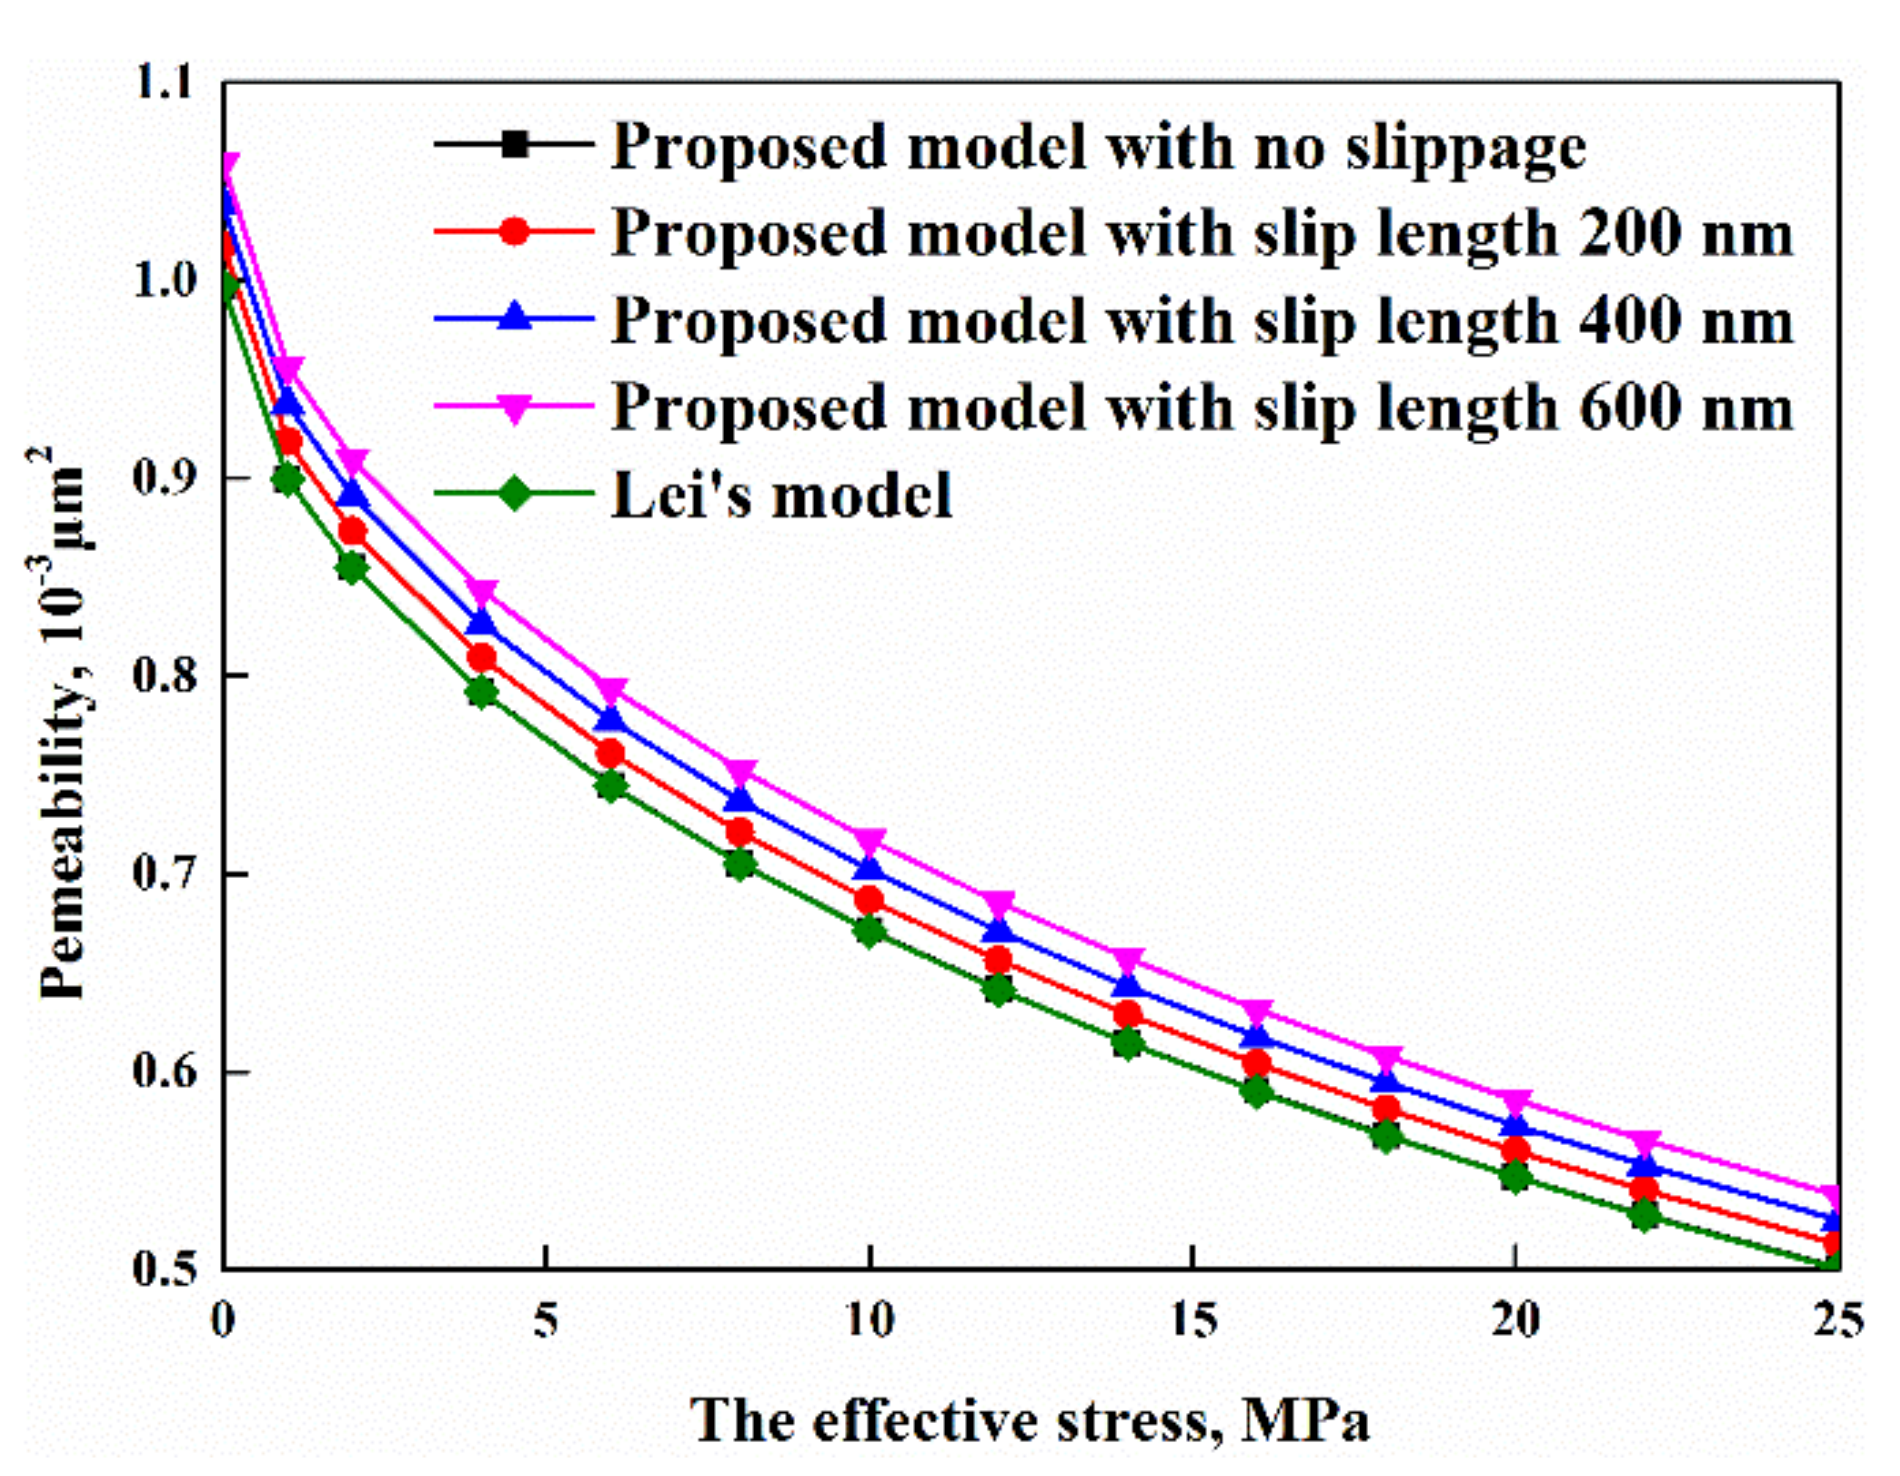
Figure 5.
The effect of PSD on permeability under various effective stresses. ((a) Pore fractal dimensions; (b) tortuosity fractal dimensions).
Figure 5.
The effect of PSD on permeability under various effective stresses. ((a) Pore fractal dimensions; (b) tortuosity fractal dimensions).
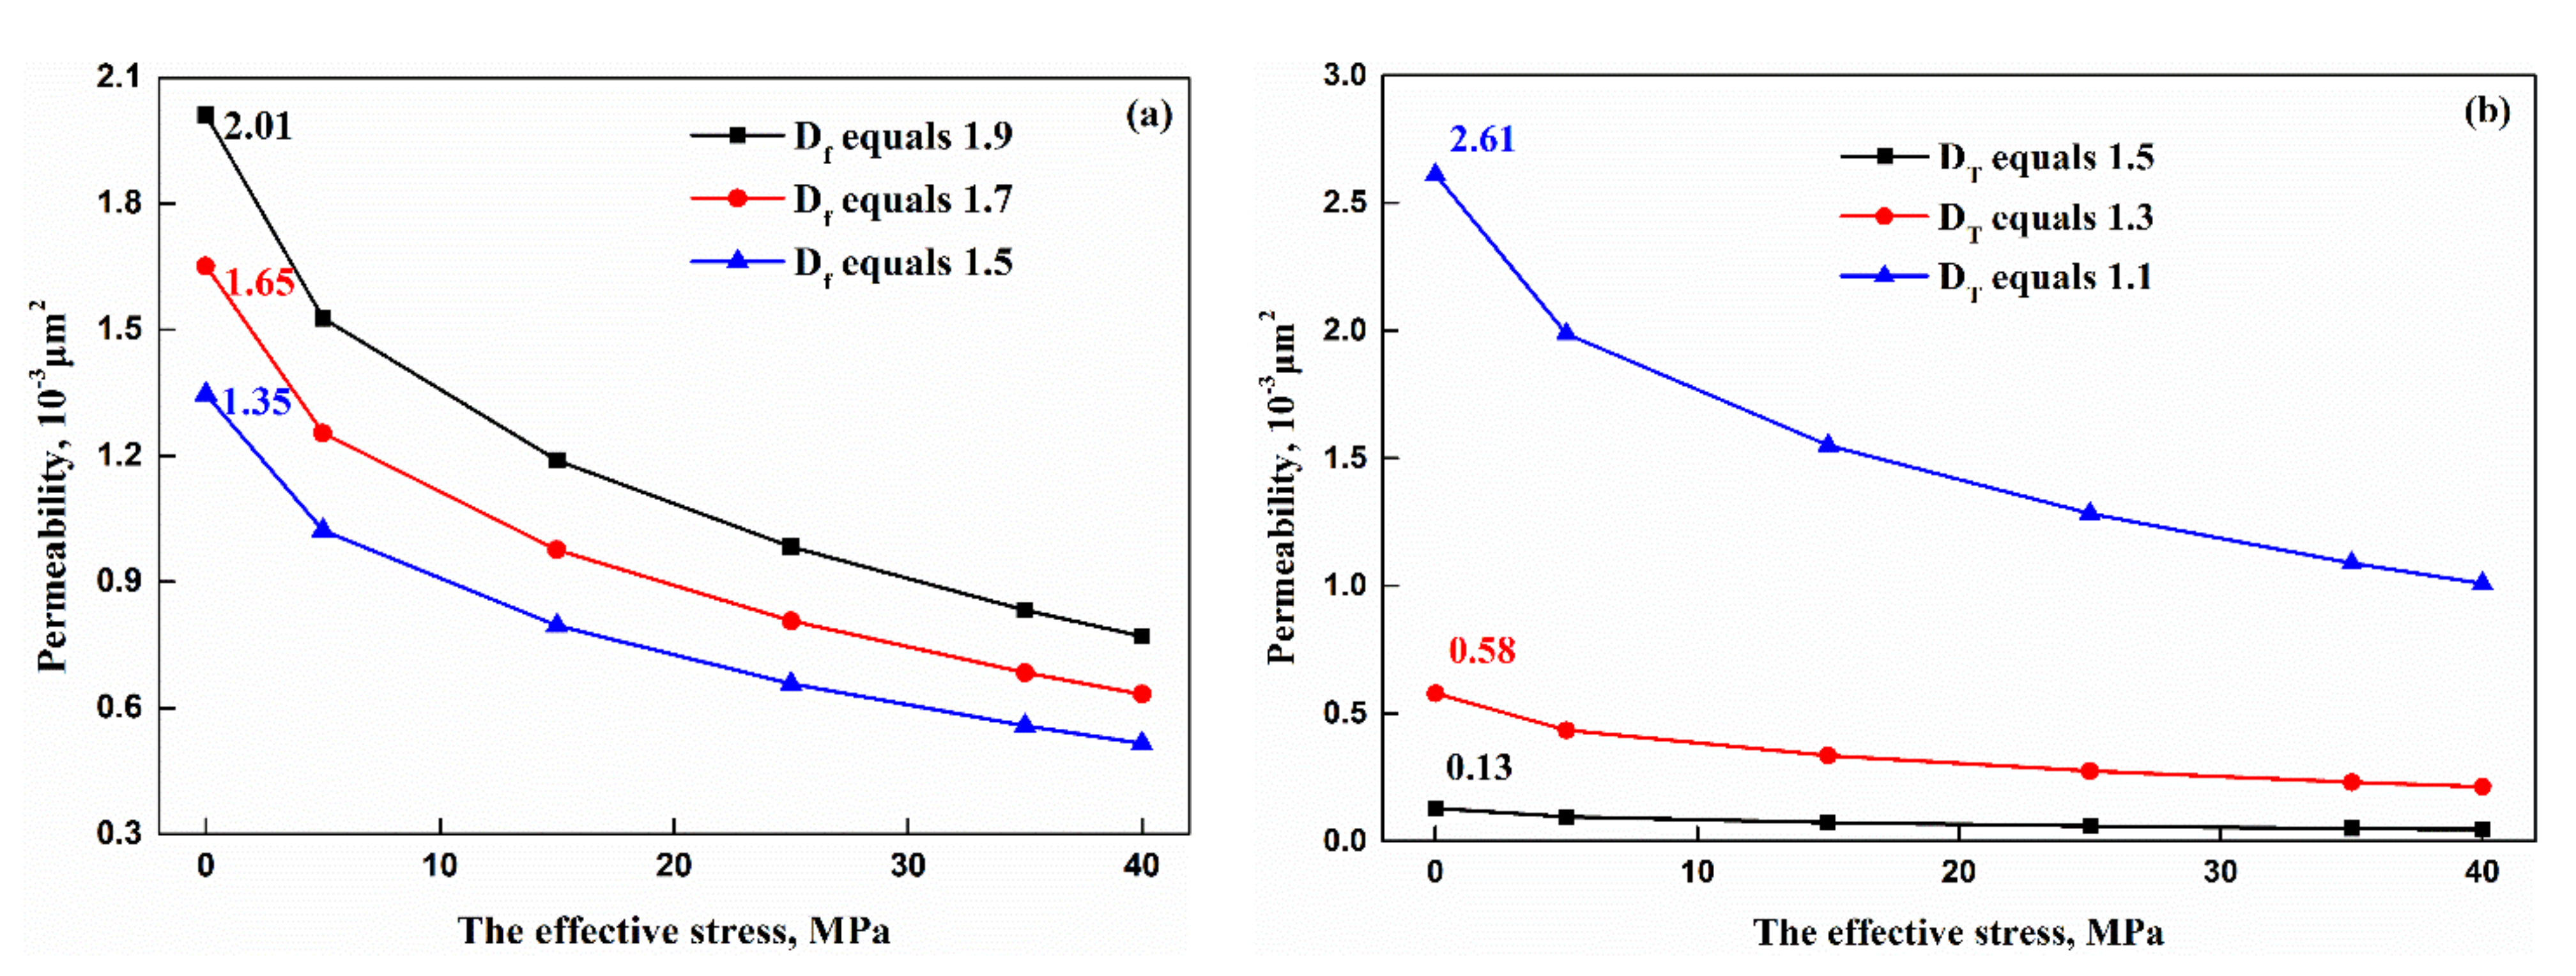
Figure 6.
The effect of irreducible water on permeability under various effective stresses.

Figure 7.
The effect of slip lengths on permeability: ((a) various effective stresses; (b) initial permeability).
Figure 7.
The effect of slip lengths on permeability: ((a) various effective stresses; (b) initial permeability).

Figure 8.
The effect of rock’s mechanical property on permeability: ((a) rock elastic modulus; (b) Poisson’s ratio).
Figure 8.
The effect of rock’s mechanical property on permeability: ((a) rock elastic modulus; (b) Poisson’s ratio).


| Sources | Core’s No. | Porosity,% | Permeability, 10−3 μm2 | Core’s Length, cm | Core’s Diameter, cm | The Maximum Pore Diameter, μm | The Minimum Pore Diameter, μm |
|---|---|---|---|---|---|---|---|
| Liu et al. [48] | S161-1 | 13.95 | 1.00 | 3 | 2.5 | 32.6482 | 0.0123 |
| S148-2 | 10.54 | 0.55 | 3 | 2.5 | 0.6701 | 0.0021 | |
| Z41-9 | 6.16 | 0.20 | 3 | 2.5 | 4.9643 | 0.0001 | |
| Zhong et al. [49] | M132-1 | 15.01 | 1.99 | 3.11 | 2.51 | 12.9105 | 0.0067 |
| M217-1 | 6.21 | 0.95 | 3.12 | 2.51 | 7.2083 | 0.0068 | |
| M23-1 | 3.06 | 0.22 | 2.97 | 2.52 | 2.3986 | 0.0068 |
Table 2.
The pore fractal dimension and the tortuosity fractal dimension.
| Sources | Core’s No. | The Pore Fractal Dimension | The Tortuosity Fractal Dimension |
|---|---|---|---|
| Liu et al. [48] | S161-1 | 1.8916 | 1.1374 |
| S148-2 | 1.8300 | 1.2100 | |
| Z41-9 | 1.8851 | 1.1632 | |
| Zhong et al. [49] | M132-1 | 1.8912 | 1.1358 |
| M217-1 | 1.8267 | 1.2298 | |
| M23-1 | 1.7418 | 1.3408 |
Table 3.
The comparison between the dimensionless permeability calculated by the proposed model and that found in experiments by Zhong et al. [49].
Table 3.
The comparison between the dimensionless permeability calculated by the proposed model and that found in experiments by Zhong et al. [49].
| The Effective Stress, MPa | Core’s Number: M132-1 | Core’s Number: M217-1 | Core’s Number: M23-1 | ||||||
|---|---|---|---|---|---|---|---|---|---|
| Experimental Results | Calculated Results | Relative Errors | Experimental Results | Calculated Results | Relative Errors | Experimental Results | Calculated Results | Relative Errors | |
| 0 | 1.000 | 1.000 | 0.000% | 1.0000 | 1.0000 | 0.000% | 1.000 | 1.000 | 0.000% |
| 5 | 0.731 | 0.759 | 3.818% | 0.6906 | 0.6629 | 4.014% | 0.629 | 0.640 | 1.741% |
| 15 | 0.596 | 0.591 | 0.802% | 0.4487 | 0.4710 | 4.984% | 0.430 | 0.445 | 3.484% |
| 25 | 0.502 | 0.489 | 2.622% | 0.3651 | 0.3668 | 0.469% | 0.357 | 0.340 | 4.801% |
| 35 | 0.435 | 0.414 | 4.846% | 0.3284 | 0.2949 | 10.208% | 0.298 | 0.269 | 9.806% |
| 40 | 0.410 | 0.383 | 6.443% | 0.3160 | 0.2665 | 15.651% | 0.263 | 0.242 | 8.230% |
Table 4.
The comparison between the dimensionless permeability calculated by the proposed model and that found in experiments by Liu et al. [48].
Table 4.
The comparison between the dimensionless permeability calculated by the proposed model and that found in experiments by Liu et al. [48].
| The Effective Stress, MPa | Dimensionless Permeability | ||||||||
|---|---|---|---|---|---|---|---|---|---|
| Core’s Number: S161-1 | Core’s Number: S148-2 | Core’s Number: Z41-9 | |||||||
| Experimental Results | Calculated Results | Relative Errors | Experimental Results | Calculated Results | Relative Errors | Experimental Results | Calculated Results | Relative Errors | |
| 0 | 1.000 | 1 | 0.000% | 1.000 | 1.000 | 0.00% | 1.000 | 1.000 | 0.000% |
| 10 | 0.709 | 0.674 | 4.937% | 0.585 | 0.558 | 4.62% | 0.531 | 0.515 | 3.107% |
| 20 | 0.462 | 0.508 | 10.043% | 0.264 | 0.314 | 18.75% | 0.170 | 0.239 | 40.588% |
| 29 | 0.415 | 0.450 | 8.386% | 0.219 | 0.265 | 21.05% | 0.110 | 0.162 | 47.364% |
Table 5.
The parameters used in case studies.
| Parameters | Case 1 | Case 2 | Case 3 | Case 4 | Case 5 | Case 6 |
|---|---|---|---|---|---|---|
| The pore fractal dimension | 1.5–1.7 | 1.8912 | 1.8912 | 1.8912 | 1.8912 | 1.8912 |
| The tortuosity fractal dimension | 1.1358 | 1.1–1.5 | 1.1358 | 1.1358 | 1.1358 | 1.1358 |
| Irreducible water | 0.45 | 0.45 | 0.35–0.55 | 0.45 | 0.45 | 0.45 |
| The length of slipage, nm | 23 | 23 | 23 | 1–200 | 23 | 23 |
| Poisson’s ratio | 0.15 | 0.15 | 0.15 | 0.15 | 0.15–0.35 | 0.15 |
| The rock elastic modulus, GPa | 1.8 | 1.8 | 1.8 | 1.8 | 1.8 | 1–6 |
Publisher’s Note: MDPI stays neutral with regard to jurisdictional claims in published maps and institutional affiliations. |
© 2022 by the authors. Licensee MDPI, Basel, Switzerland. This article is an open access article distributed under the terms and conditions of the Creative Commons Attribution (CC BY) license (https://creativecommons.org/licenses/by/4.0/).
Share and Cite
MDPI and ACS Style
Wu, Z.; Cui, C.; Yang, Y.; Zhang, C.; Wang, J.; Cai, X. A Fractal Permeability Model of Tight Oil Reservoirs Considering the Effects of Multiple Factors. Fractal Fract. 2022, 6, 153. https://doi.org/10.3390/fractalfract6030153
AMA Style
Wu Z, Cui C, Yang Y, Zhang C, Wang J, Cai X. A Fractal Permeability Model of Tight Oil Reservoirs Considering the Effects of Multiple Factors. Fractal and Fractional. 2022; 6(3):153. https://doi.org/10.3390/fractalfract6030153
Chicago/Turabian StyleWu, Zhongwei, Chuanzhi Cui, Yong Yang, Chuanbao Zhang, Jian Wang, and Xin Cai. 2022. "A Fractal Permeability Model of Tight Oil Reservoirs Considering the Effects of Multiple Factors" Fractal and Fractional 6, no. 3: 153. https://doi.org/10.3390/fractalfract6030153