Abstract
In this article, we investigate the market efficiency of global stock markets using the multifractal detrended fluctuation analysis methodology and analyze the results by dividing them into developed, emerging, and frontier groups. The static analysis results reveal that financially advanced countries, such as Switzerland, the UK, and the US, have more efficient stock markets than other countries. Rolling window analysis shows that global issues dominate the developed country group, while emerging markets are vulnerable to foreign capital movements and political risks. In the frontier group, intensive domestic market issues vary, making it difficult to distinguish similar dynamics. Our findings have important implications for international investors and policymakers. International investors can establish investment strategies based on the degree of market efficiency of individual stock markets. Policymakers in countries with significant fluctuations in market efficiency should consider implementing new regulations to enhance market efficiency. Overall, this study provides valuable insights into the market efficiency of global stock markets and highlights the need for careful consideration by international investors and policymakers.
1. Introduction
The efficient market hypothesis (EMH) posits that information in the stock market is promptly incorporated into stock prices. According to this theory, current stock prices already encompass all available information. Consequently, stock prices are subject to random movements and cannot be deemed undervalued or overvalued. Fama divides the efficient market hypothesis into three hypotheses based on the range of related information. A weak-form efficient market is a market that reflects historical information in the current price, and excess profits can be obtained if current or future information is used. The semi-strong-form efficient market reflects current information in addition to past information and can generate excess profits if future information is obtained. The strong-form efficient market hypothesis states that all market participants know all information, including future undisclosed information, and that no information analysis can generate excess profits.
Determining the specific efficient market hypothesis that governs the stock market holds significant implications for comprehending the information reflected in current stock prices. This understanding plays a vital role in effective risk management by facilitating the prediction of future stock price fluctuations. Furthermore, it facilitates effective resource allocation, leveraging the prevailing market prices for efficient growth. In cases where the market does not strictly adhere to a strong-form efficient market, valuable insights can be gained to guide decision making concerning the specific information and information analysis methods necessary for obtaining excess profits.
As market efficiency is important, many studies have been conducted on this topic. For example, Horta et al. [1] showed that financial crises significantly influenced most stock markets, and that markets lost efficiency during the subprime crisis. Hull and McGroarty [2] investigated the relationship between efficiency and market development. Rizvi et al. [3] revealed a relatively high efficiency ranking in developed markets in the short term and a medium efficiency ranking in the long term. Charfeddine and Khediri [4] researched the weak-form efficiency of the Gulf Cooperation Council stock markets, and concluded that while the GCC market has different degrees of efficiency over time, it is also improving over time. Ali et al. [5] compared the efficiency of conventional stock markets and their Islamic counterparts, and the result was that developed markets were relatively more efficient.
Two main methodologies have been employed to investigate the EMH. The first approach utilizes the Hurst–Mandelbrot–Walis R/S statistics, a statistical methodology. Based on this method, Horta et al. [1] discovered that stock price increments in the pre-crisis era align more closely with the random walk paradigm compared to the post-crisis period. Similarly, Hull and McGroarty [2] noted that more advanced emerging markets display lower levels of long-term persistence. The second methodology employed is the multifractal detrended fluctuation analysis (MF-DFA). By using the MF-DFA approach, Rizvi et al. [3] emphasized the efficient performance of Islamic markets during crises, while Horta et al. [1] suggested deviations that are indicative of long memory and reverting patterns. Charfeddine and Khediri [4] ranked Qatar as the most efficient market, while Bahrain and Oman were considered less efficient. Furthermore, Ali et al. [5] provided rankings of the efficiency of stock markets in non-Islamic, BRICS, and developed countries, as well as their corresponding Islamic counterparts.
This study investigated the efficiency of the stock markets of several countries around the world. Market efficiency was calculated using stock indices from 60 countries, and the results were analyzed by dividing them into developed, emergent, and frontier groups (MSCI market classification, https://www.msci.com/our-solutions/indexes/acwi accessed on 1 May 2023). We describe the stock index data in Section 3.
We employed the MF-DFA method to calculate market efficiency. Recently, this method has been widely used in research on the market efficiency hypothesis and multifractality of financial assets (e.g., Miloş et al. [6], Choi [7], Yin and Wang [8], Pak and Choi [9], Gaio et al. [10]). Furthermore, we performed both static and rolling window analyses in order to assess the market efficiency of global stock markets. Through this method, we analyzed market efficiency for the entire sample period and time-varying market efficiency.
This study contributes to the financial literature in two ways. First, the market efficiency of various countries around the world shows some differences between the developed, emerging, and frontier groups. Rather than focusing on individual countries, this research adopted a group perspective to analyze stock market efficiency. While studies on market efficiency in developed countries have been extensively reported, the attention given to emerging and frontier countries has been relatively limited. Previous research on emerging or frontier countries has primarily compared and analyzed market efficiencies among individual countries or a small number of countries (e.g., Caraiani [11], Arshad et al. [12], Aslam et al. [13], and Nargunam and Lahiri [14]). In contrast, this study aims to overcome these limitations by incorporating as many stock markets as possible, spanning developed, emerging, and frontier countries. This approach provides a comparative advantage in terms of the number of stock markets considered compared to previous studies (e.g., Rizvi et al. [3], Ali et al. [5], Lee et al. [15], and Aslam et al. [16]).
Second, we methodologically investigated how market efficiency in individual countries changes over time using rolling window analysis. In particular, we analyzed and compared the degree of response of individual markets to systematic risks, such as the 2008 global financial crisis and COVID-19 pandemic, while several studies have examined the impact of the COVID-19 pandemic on stock market efficiency (e.g., Aslam et al. [17], Mensi et al. [18], and Saadaoui [19]), the range of stock markets considered in these studies was narrower than that of our research. By employing rolling window analysis, this study provides valuable insights into the evolving nature of market efficiency in individual countries over time.
Overall, this study contributes to the financial literature by examining stock market efficiency from a group perspective and incorporating a wide range of stock markets from developed, emerging, and frontier countries. Furthermore, it enhances the understanding of how market efficiency changes within individual countries over time by investigating their responsiveness to systematic risks. The findings of this study have implications for investors, policymakers, and researchers seeking to comprehend and navigate the dynamics of global financial markets.
The remainder of this paper is organized as follows. In the following section, we introduce previous studies on market efficiency. Section 3 describes global stock market data and provides a preliminary statistical analysis. In Section 4, we briefly review the MF-DFA method. Section 5 presents the results of static and rolling window analyses. Section 6 presents the summary and concluding remarks.
2. Literature Review
2.1. Global Stock Markets
Many studies have compared national stock market efficiencies. Studies on efficiency suggest that most developed markets are more efficient than emerging markets. Lim [20] defined the sequence of efficiency of the US, Korea, Taiwan, Japan, Thailand, Philippines, Brazil, Mexico, India, Indonesia, Malaysia, Chile, and Argentina, with emerging and developed markets using H-statistic. The relationship between market efficiency and market development was investigated by Hull and McGroarty [2]. Their study employed the Hurst–Mandelbrot–Walis R/S statistic and the Jarque–Bera test to analyze markets categorized as either advanced or secondary. The findings indicated that advanced markets demonstrate higher levels of efficiency in comparison to secondary markets. Using MF-DFA, Rizvi et al. [3] showed that developed markets (e.g., the US, Japan, and Hong Kong) are more efficient, excluding Malaysia, Indonesia, and Turkey, which have Islamic and developed markets (e.g., Bahrain, Bangladesh, and Egypt). Further, Ali et al. [5] revealed that developed markets are the most efficient, followed by BRICS markets. In addition, every Islamic stock market, except Russia, Jordan, and Pakistan, is more efficient than its conventional counterparts, such as Turkey, the USA, and China. Anagnostidis et al. [21] investigated the effects of the 2008 financial crisis on Eurozone stock markets, using GHE (generalized Hurst exponent). They classified them into three groups according to how adversely they were affected by the crisis.
2.2. Time-Varying Market Efficiency
Several studies have investigated the evolution of market efficiency over time. For example, Rizvi and Arshad [22], using MF-DFA, examined the efficiency of East Asian stock markets during booms and busts. The study concluded that economic booms affected each market differently, with a decrease in efficiency during recession periods and an increase during boom periods. Interestingly, only Singapore’s market efficiency increased during these events. In another comprehensive examination of financial crises, Horta et al. [1] studied the impact of the 2008 and 2010 crises on stock markets. Their findings indicated the presence of market efficiency dynamics and financial contagion during these periods. Moreover, the study observed that developed markets were minimally affected by financial crises, while less-developed markets experienced significant impact.
Many studies have been conducted to examine the fluctuations in market efficiency levels. Smith [23] studied European emerging and developed stock markets and used variance ratio tests of the martingale hypothesis. They revealed that each country has different levels of efficiency; the most efficient market is Turkey and the least efficient markets are Malta and Ukraine. They also suggested that the global financial crisis had little effect on weak-form efficiency markets, such as Greece and Russia. Furthermore, according to the changing efficiency over time, the relative efficiency also changes. While the market with the largest improvement is Romania, that with the smallest improvement is Croatia. Sensoy [24] showed that the MENA stock markets have different levels of long-term dependence by using the rolling window technique. They also suggested that the most efficient markets, such as Turkey and Israel, reduce the capital costs of less-efficient markets, such as Iran and the UAE.
3. Data Description
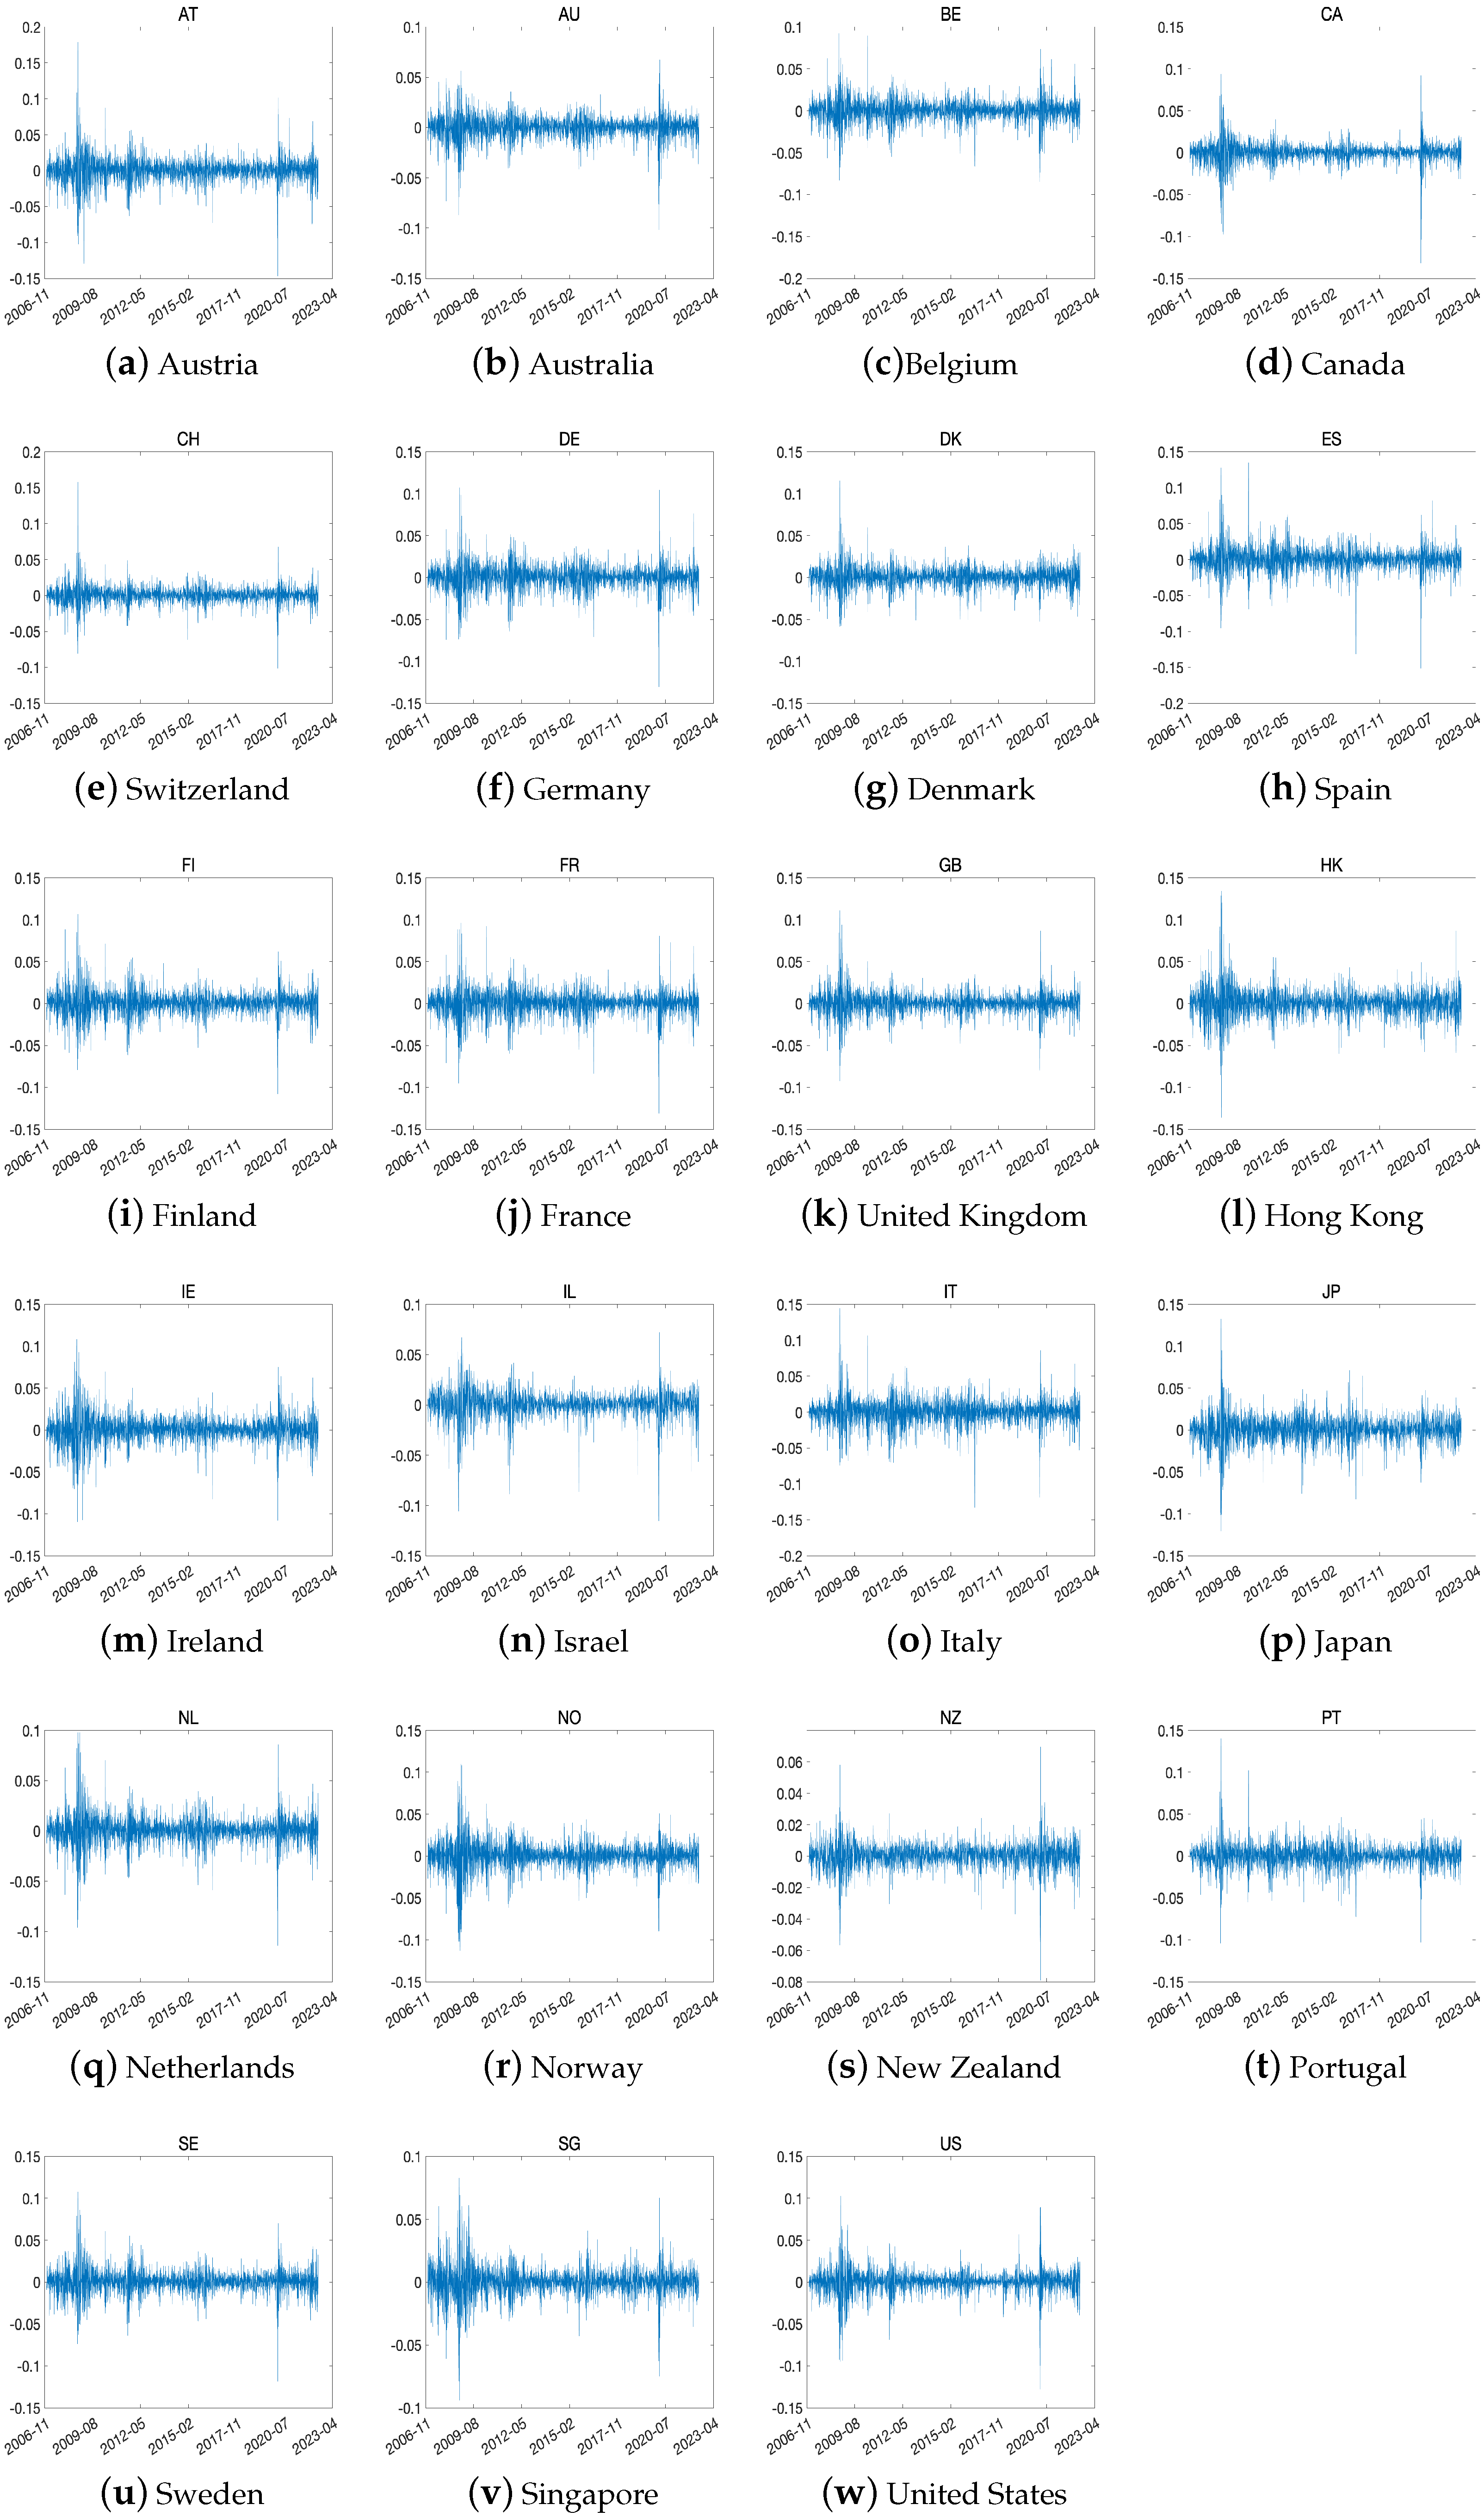
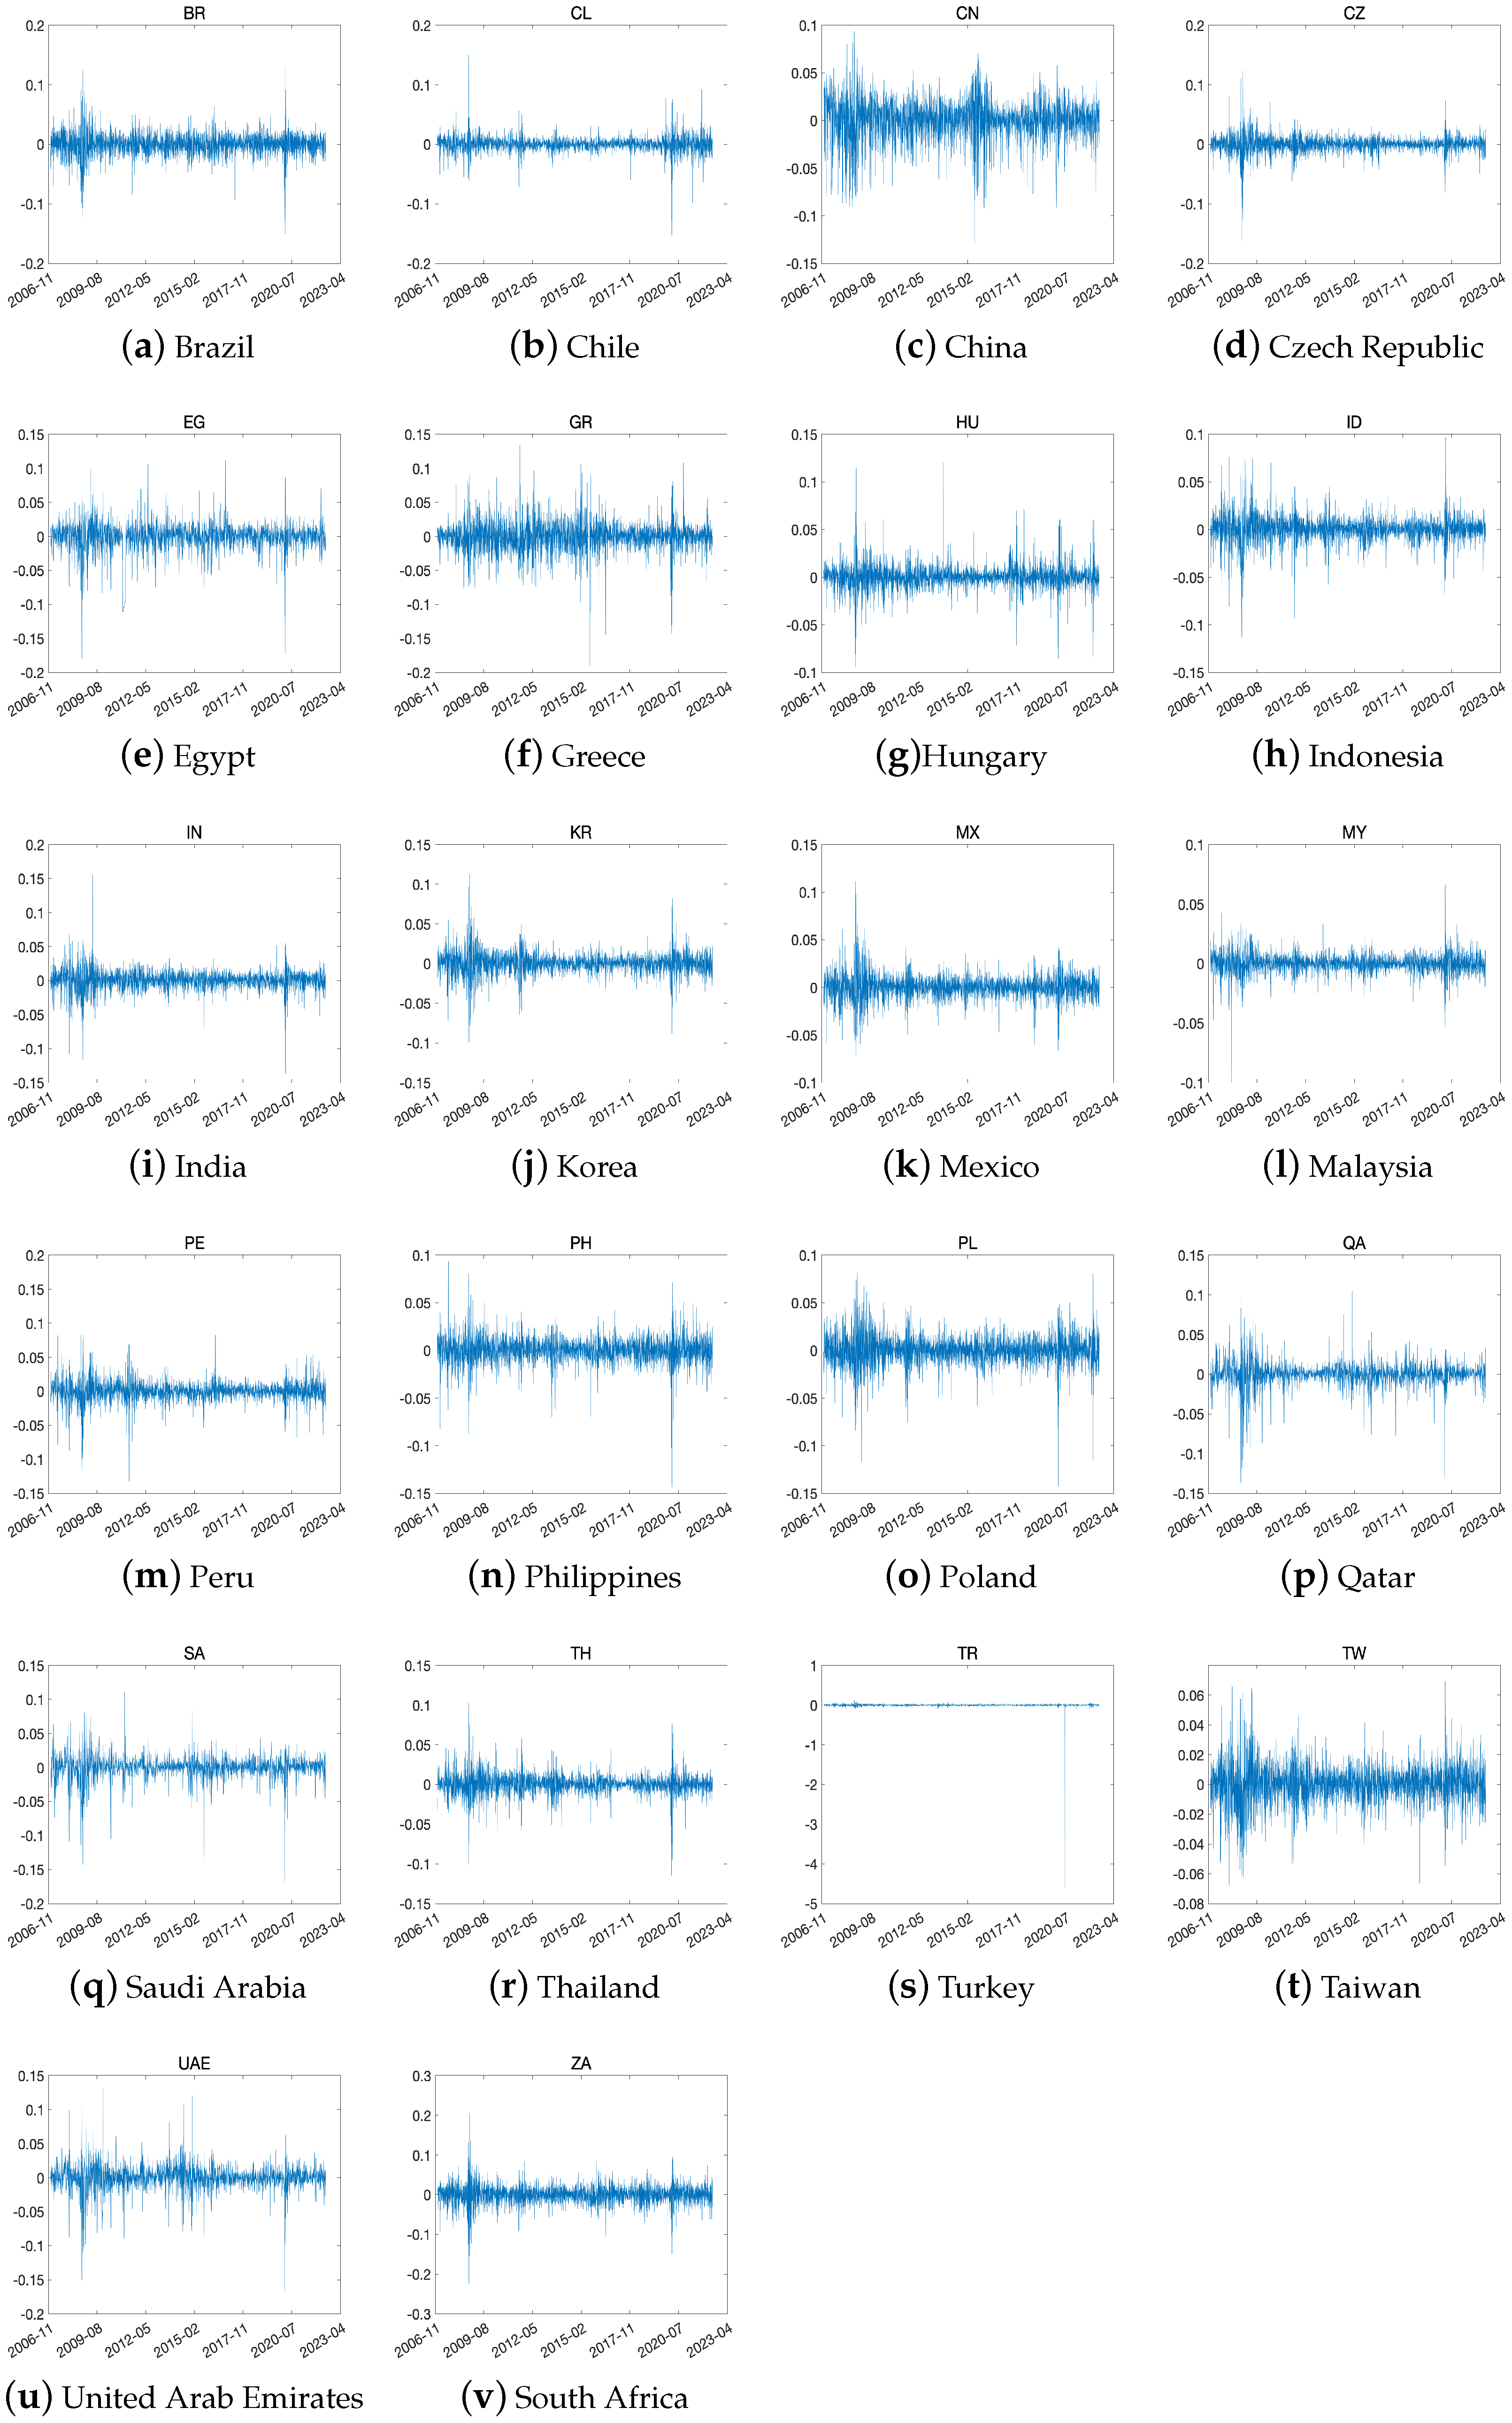
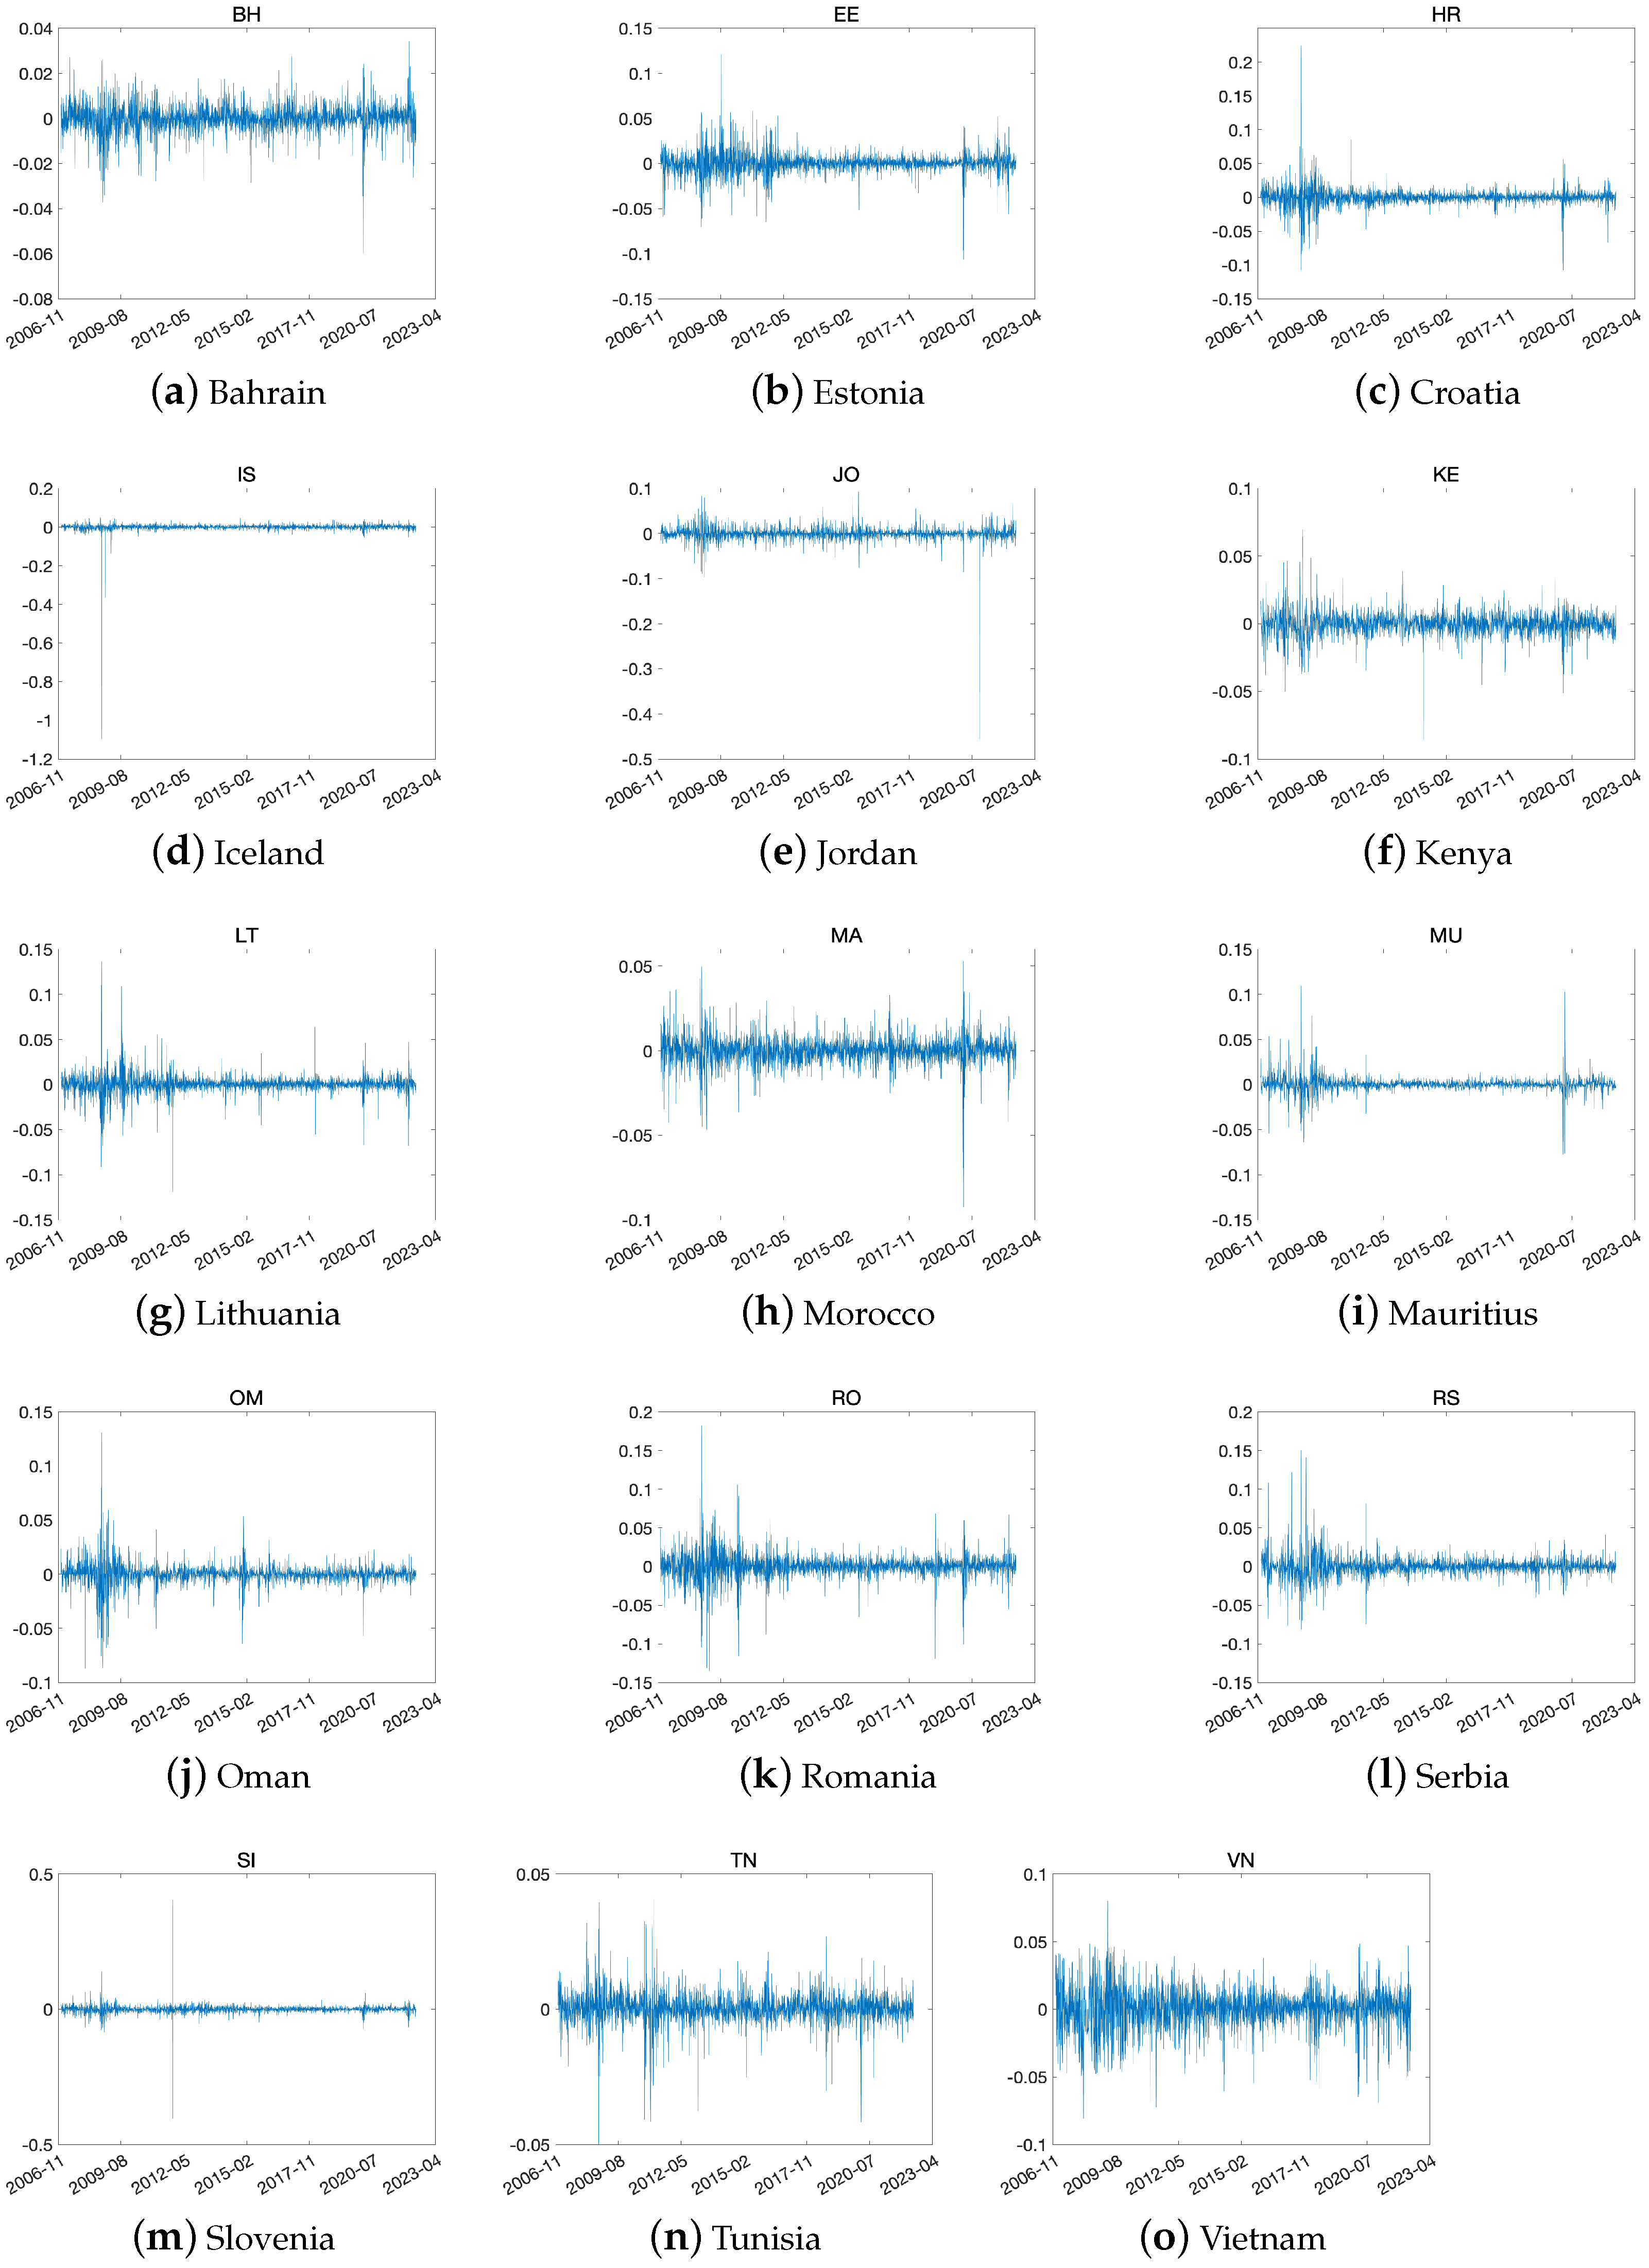
In our analysis, we utilized a range of global stock indices to capture market performance. Specifically, we considered stock price indices from 23 developed markets, 22 emerging markets, and 15 frontier markets. The data for these indices were sourced from Reuters, providing a comprehensive view of market trends and movements. Our analysis covered the period from January 2007 to June 2022, allowing us to examine the performance of these markets over a substantial time period. We display the log returns of the global stock indices in three groups in Figure 1, Figure 2 and Figure 3. Furthermore, Table 1 shows the summary statistics for the log returns of global stock indices. Based on the information provided in the above table, it can be observed that all three groups exhibit a bias towards the left side of the distribution. This indicates that the data do not follow a normal distribution. However, Vietnam is biased toward the right, showing lower-than-average profits. The average kurtosis is 19, 76, 84 (rounded from the first decimal place) for each group, and the emerging and frontier groups are greatly affected by extreme values, showing relatively unstable returns. In particular, Turkey has a value of 1239.4757 in the emerging group and Iceland has a value of 838.6851 among the frontier group, which is extreme within the group.
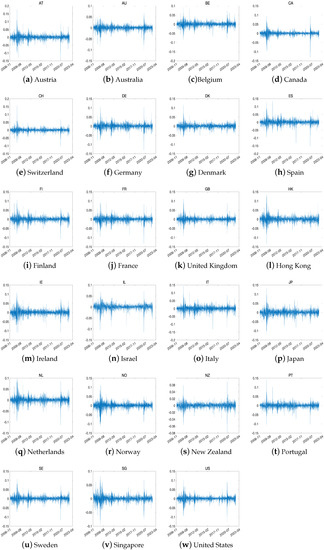
Figure 1.
The log return time series for all the indices in developed countries.
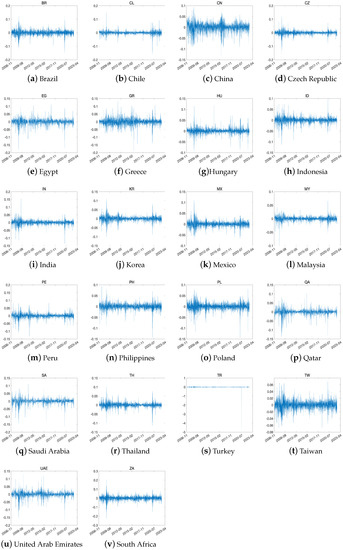
Figure 2.
The log return time series for all the indices in emerging countries.
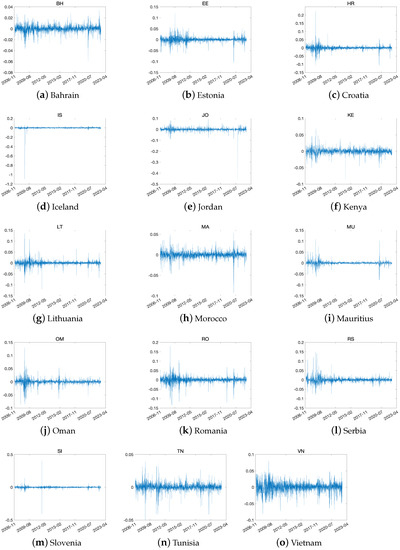
Figure 3.
The log return time series for all the indices in frontier countries.

Table 1.
Descriptive statistics of global stock indices in three groups. indicates rejection of the null hypothesis at the significance level. Note: Skew., Kurt., and J.-B. refer to skewness, kurtosis, and Jarque–Bera statistics, respectively.
Larger kurtosis values tend to increase J-B statistics. The following are the top five countries in each group: Canada, Norway, Belgium, the Netherlands, and the US in the developed group; Turkey, the Philippines, the Czech Republic, South Africa, and Thailand in the emerging group; and Iceland, Jordan, Slovenia, Mauritius, and Lithuania in the frontier group.
Comparing the Jarque–Bera statistics for each group, there are very large outliers such as Turkey, where the median is 1225.4, emerging is 22,025.8, and frontier is 30,942.2, showing that developed countries are relatively trying to follow the normal distribution, making the most stable return. Spain has the smallest value which can be considered stable, followed by Hong Kong.
4. Multifractal Detrended Fluctuation Analysis
The multifractal detrended fluctuation analysis (MF-DFA) method was used to assess the multifractal characteristics of the financial time series and rank market efficiency. It can be executed in five steps, as outlined by [25] and summarized by [26].
Let be a time series, where N is its length.
- Step 1. Determine the profilewhere
- Step 2. Divide the profile into non-overlapping segments of equal length s. To ensure that the entire sample is covered, the same procedure is repeated starting from the end of the sample. By doing so, a total of segments are obtained:
- Step 3. Calculate the local trend for each of the segments. To estimate the local trend in each segment, a least-squares fitting polynomial is used. Once the local trend has been determined, the variance is calculated accordingly.The fitting polynomial with order m in segment is denoted as . Typically, a linear (), quadratic (), or cubic () polynomial is used to estimate the local trend in each segment, as reported in previous studies ([27,28,29]). However, in this study, in order to avoid overfitting and simplify the calculation process, a linear polynomial () is employed, as suggested in [30,31].
- Step 4. Average over all the segments. Then, we obtain the q-th order fluctuation function:
- Step 5. Determine the scaling behavior of the fluctuation functions. To determine if a long-range power law correlation exists, the log–log plots of are compared for each value of q. If the series exhibits long-range power law correlation, will increase as s becomes large. The power law relationship can be expressed in the following form.where represents the generalized Hurst exponent. Equation (7) can be written as . After taking the logarithms of both sides,where c is a constant.
The value of the exponent depends on q. If is independent of q, then the time series is monofractal; otherwise, it is multifractal. When , is equivalent to the Hurst exponent ([32]); thus, is referred to as the generalized Hurst exponent. indicates that the time series are uncorrelated and follow a random walk process, suggesting that the market is weakly efficient ([32,33]). If , the time series is long-range dependent, meaning that an increase (decrease) is more likely to be followed by another increase (decrease). By contrast, indicates a non-persistent series, where an increase (decrease) is more likely to be followed by a decrease (increase).
According to Reference [25], the relationship between and multifractal scaling exponent can be expressed as follows:
To estimate multifractality, a Legendre transform was used to convert q and into and , respectively, using the following equations:
where is the multifractal or singularity spectrum and is the singularity strength.
In addition, a definition of the width of the multifractal spectrum is provided in References [34,35,36].
A wider multifractal spectrum implies a higher degree of multifractality. The next section presents the empirical results pertaining to the multifractality of the average return series for all sectors.
5. Empirical Results
This section provides a static and rolling window analysis of the market efficiencies of the three groups.
5.1. Static Analysis
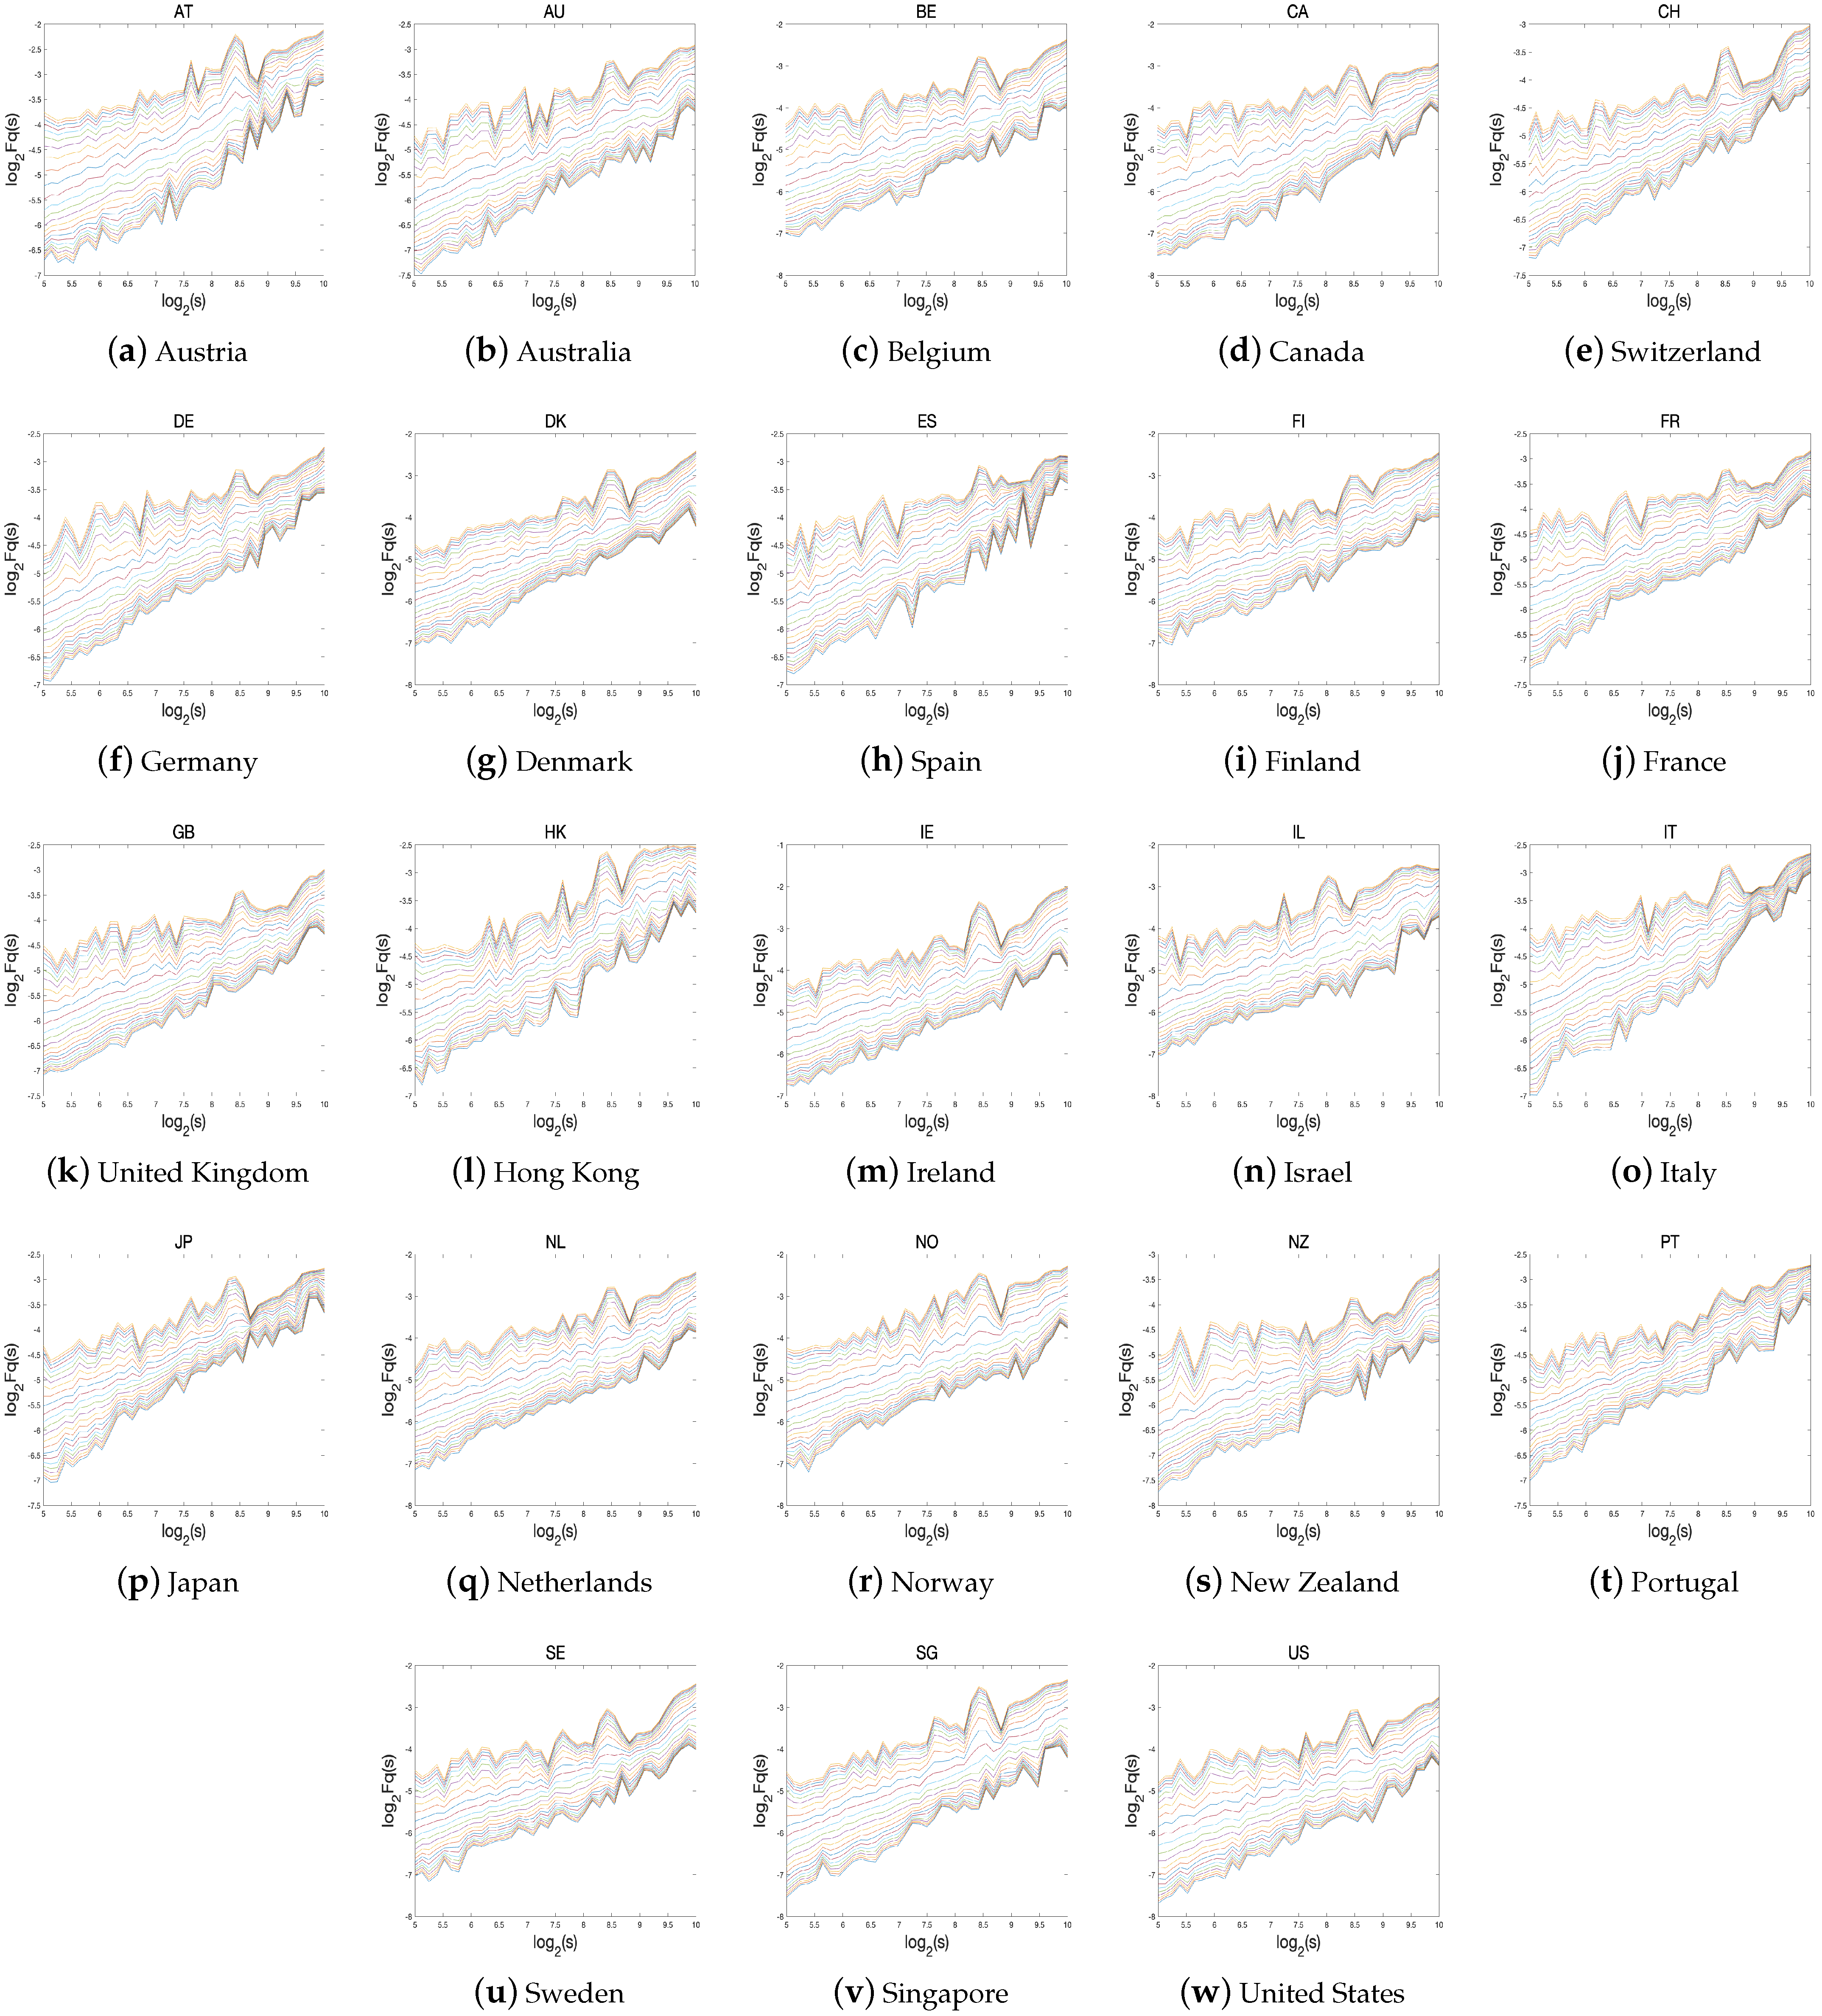
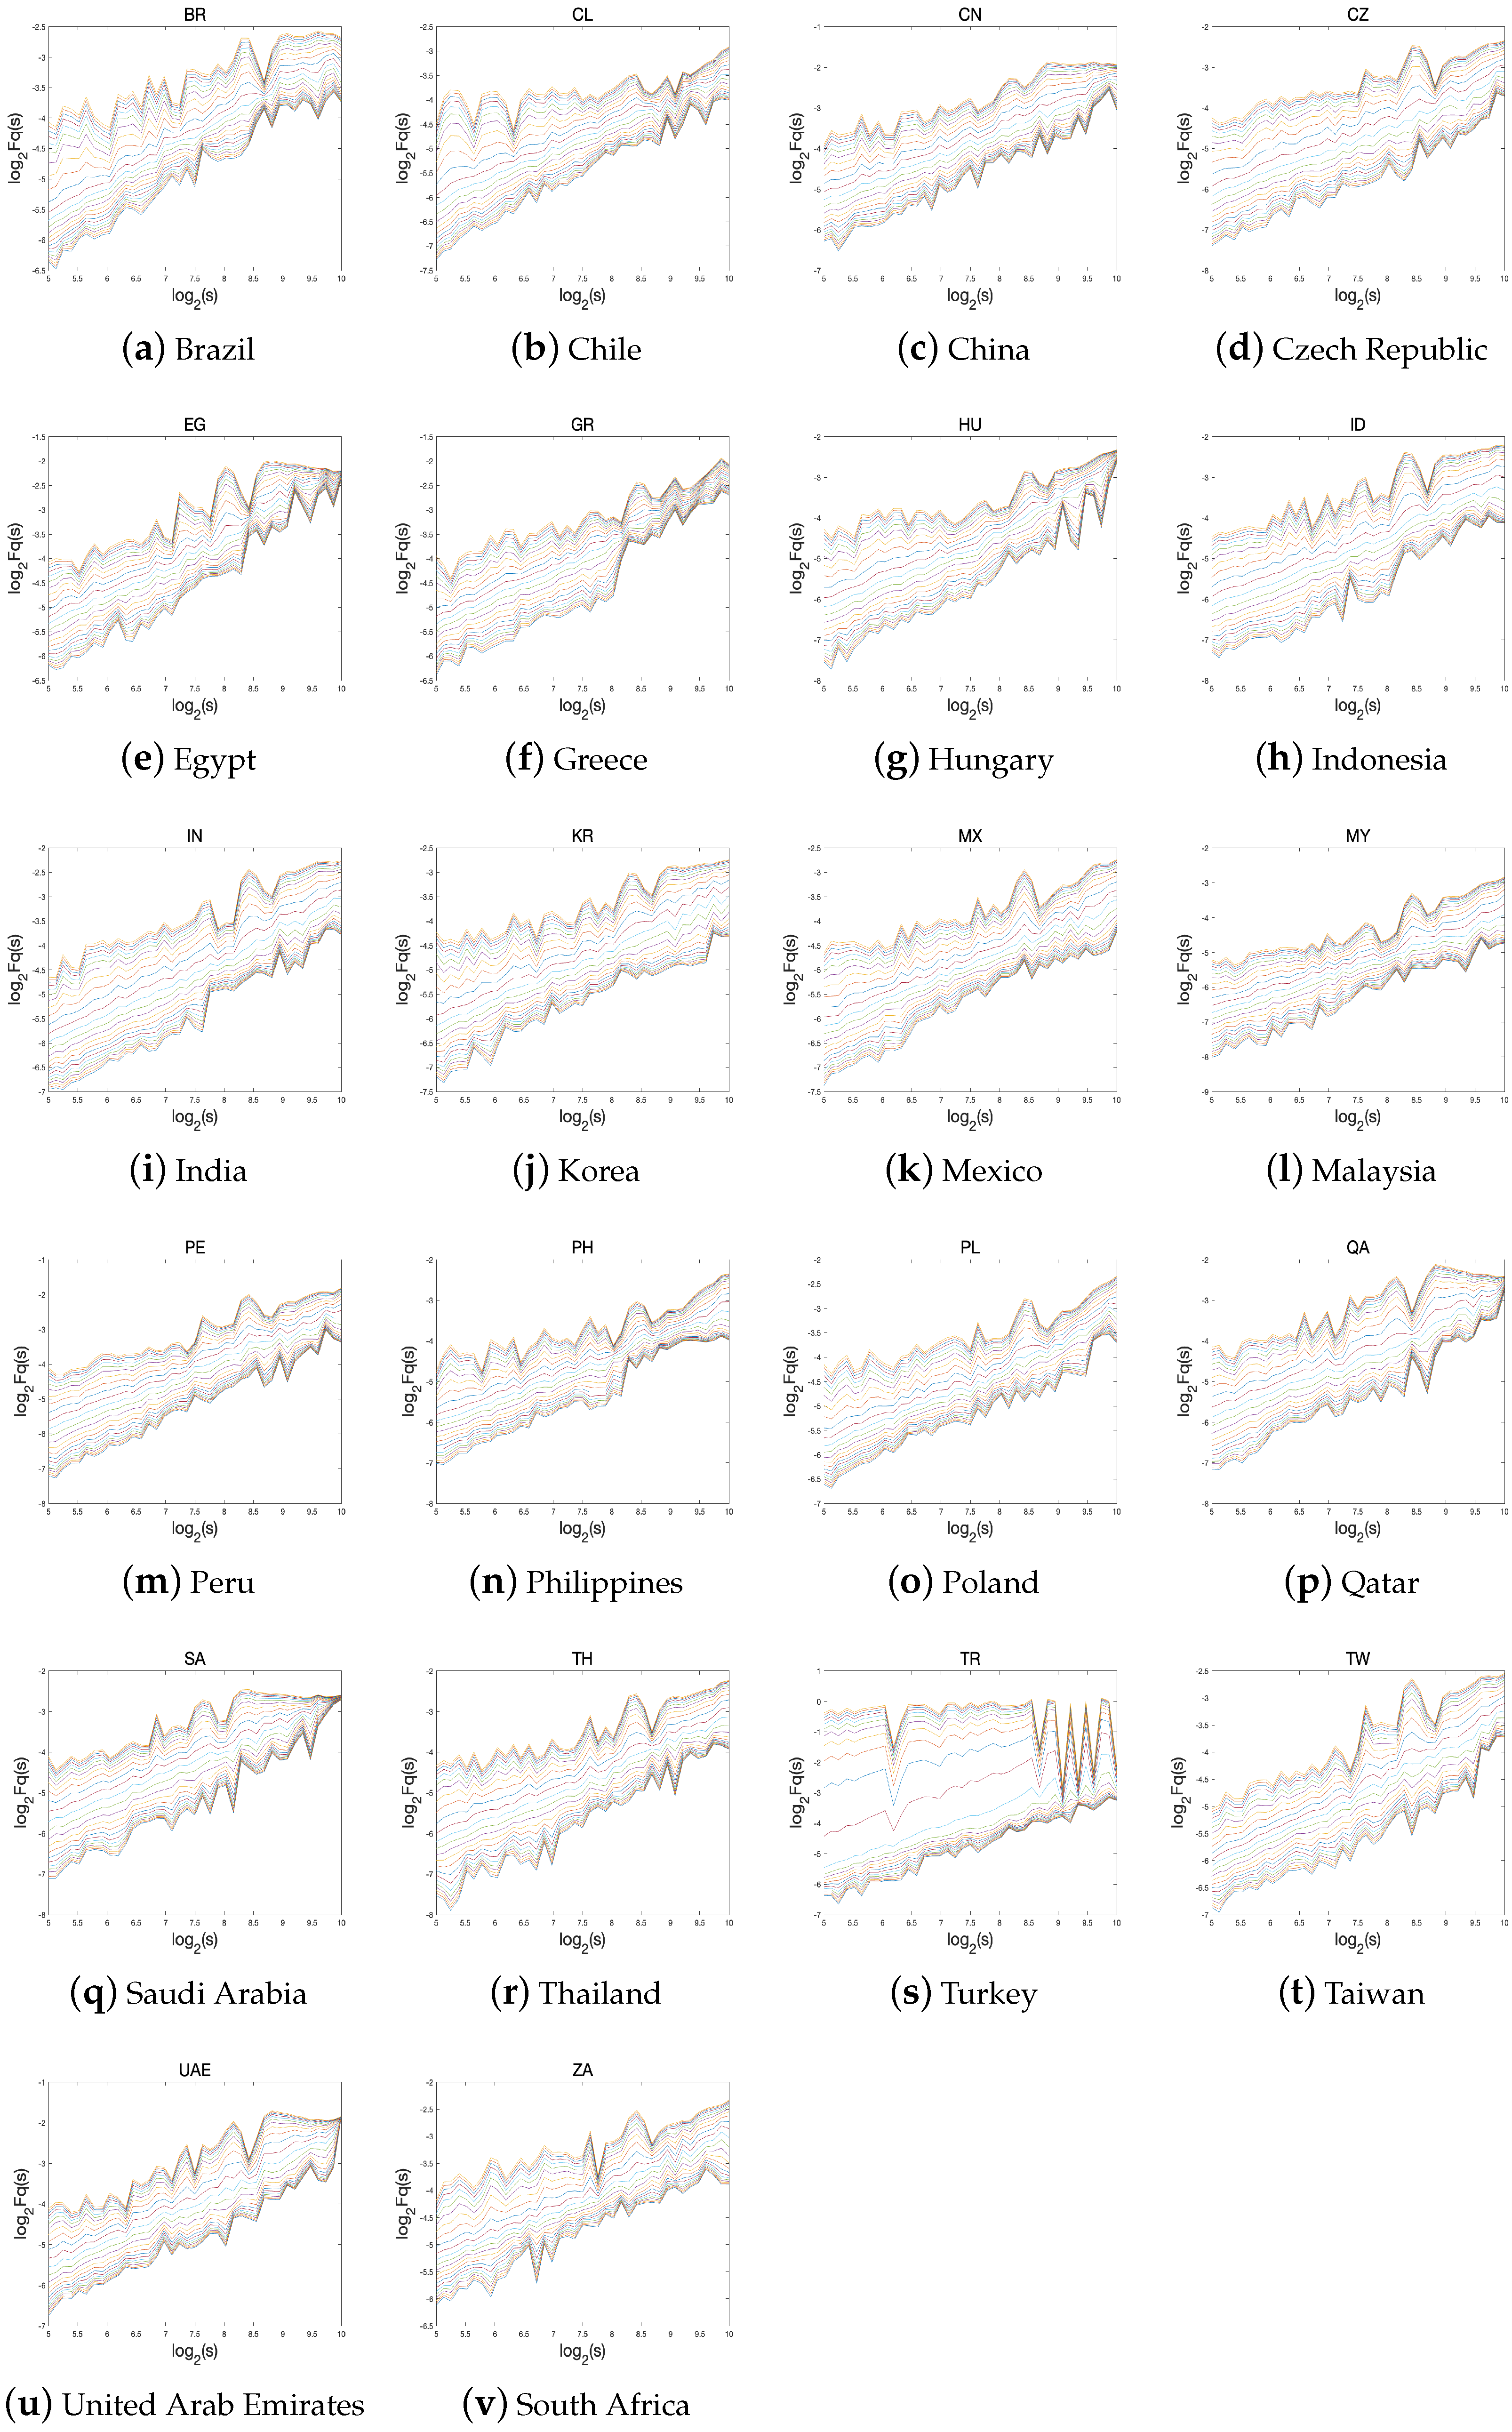
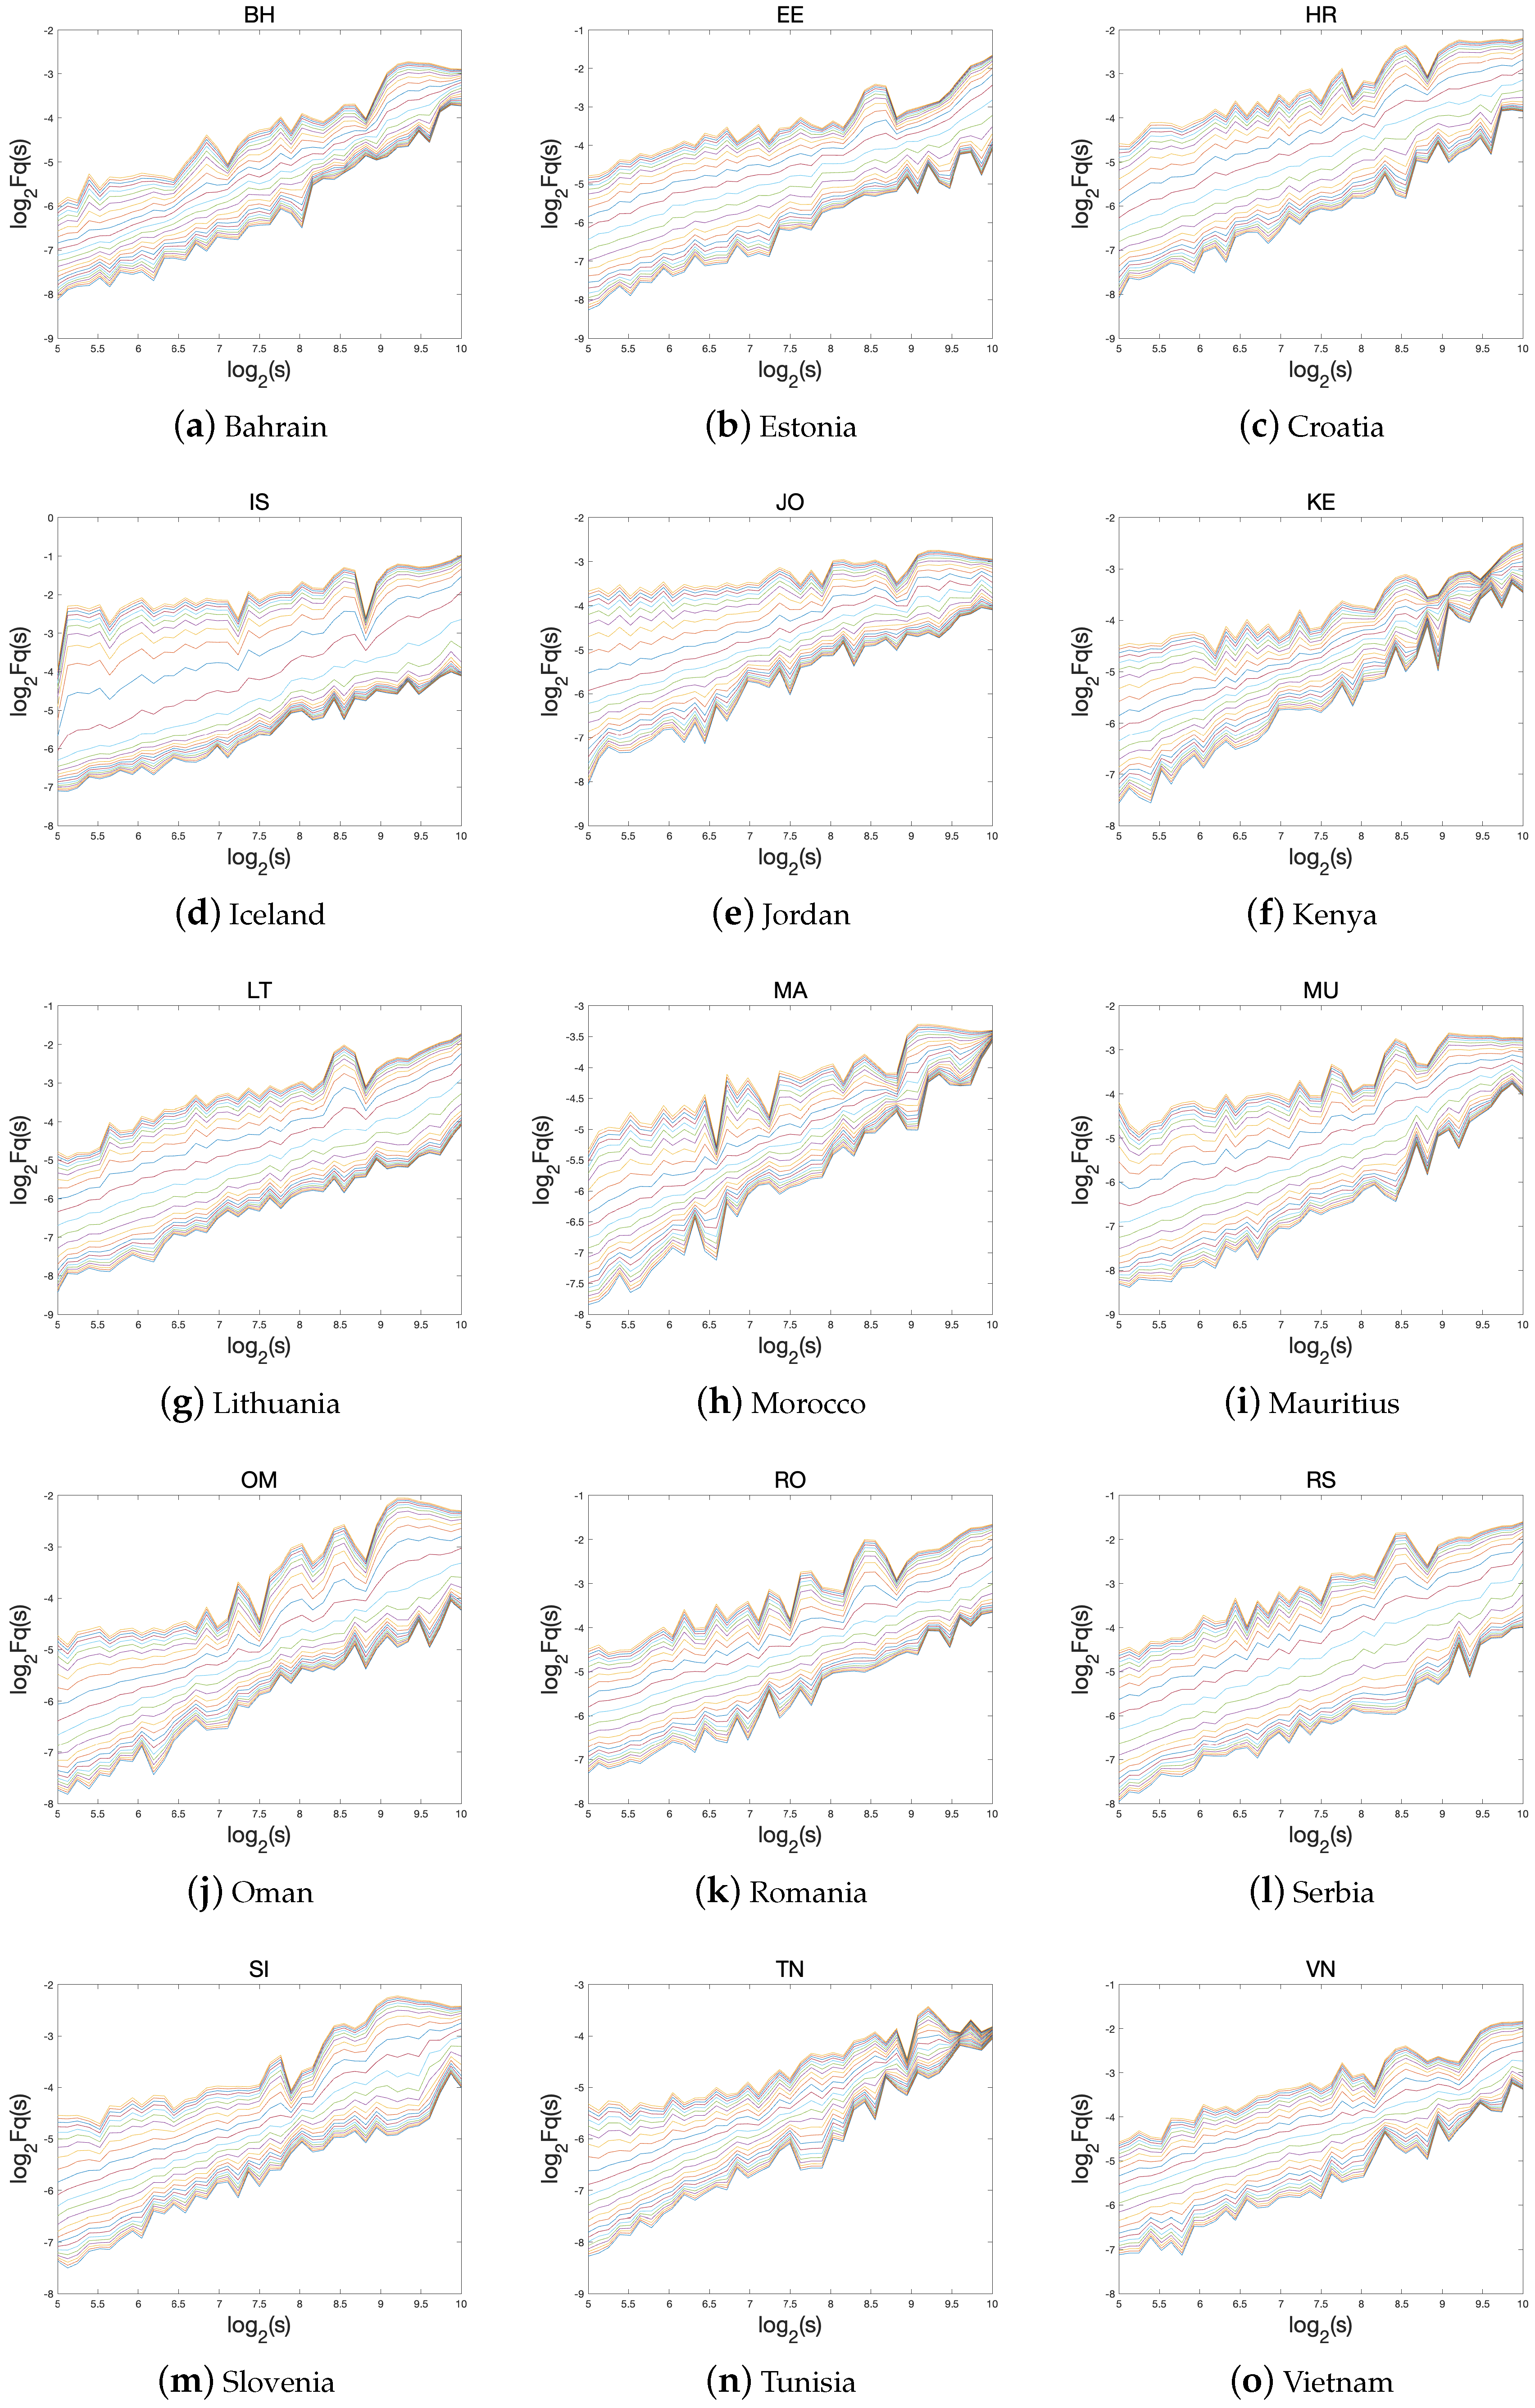
Figure 4, Figure 5 and Figure 6 show the log−log plots of compared with s for all average sector return series during the GFC and COVID-19 pandemic for corresponding to the curve from the bottom to the top when the polynomial order .
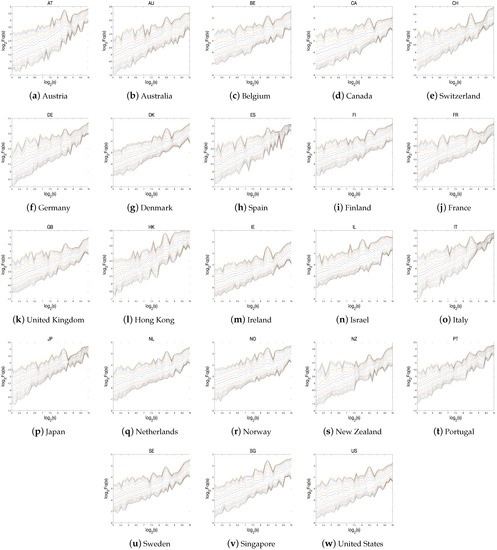
Figure 4.
The curve of the multifractal fluctuation function compared to s in a log–log plot of the average return for all the indices in developed countries.
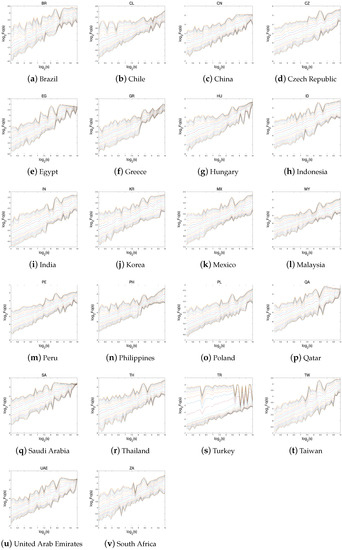
Figure 5.
The curve of the multifractal fluctuation function compared to s in a log–log plot of the average return for all the indices in emerging countries.
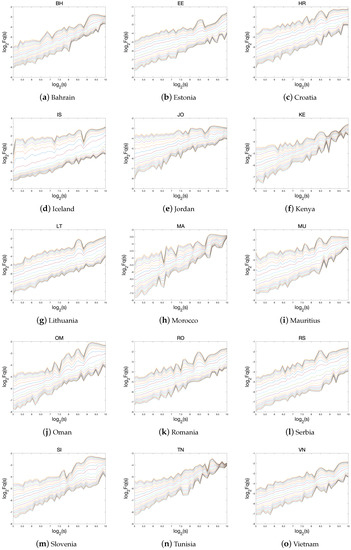
Figure 6.
The curve of the multifractal fluctuation function compared to s in a log–log plot of the average return for all the indices in frontier countries.
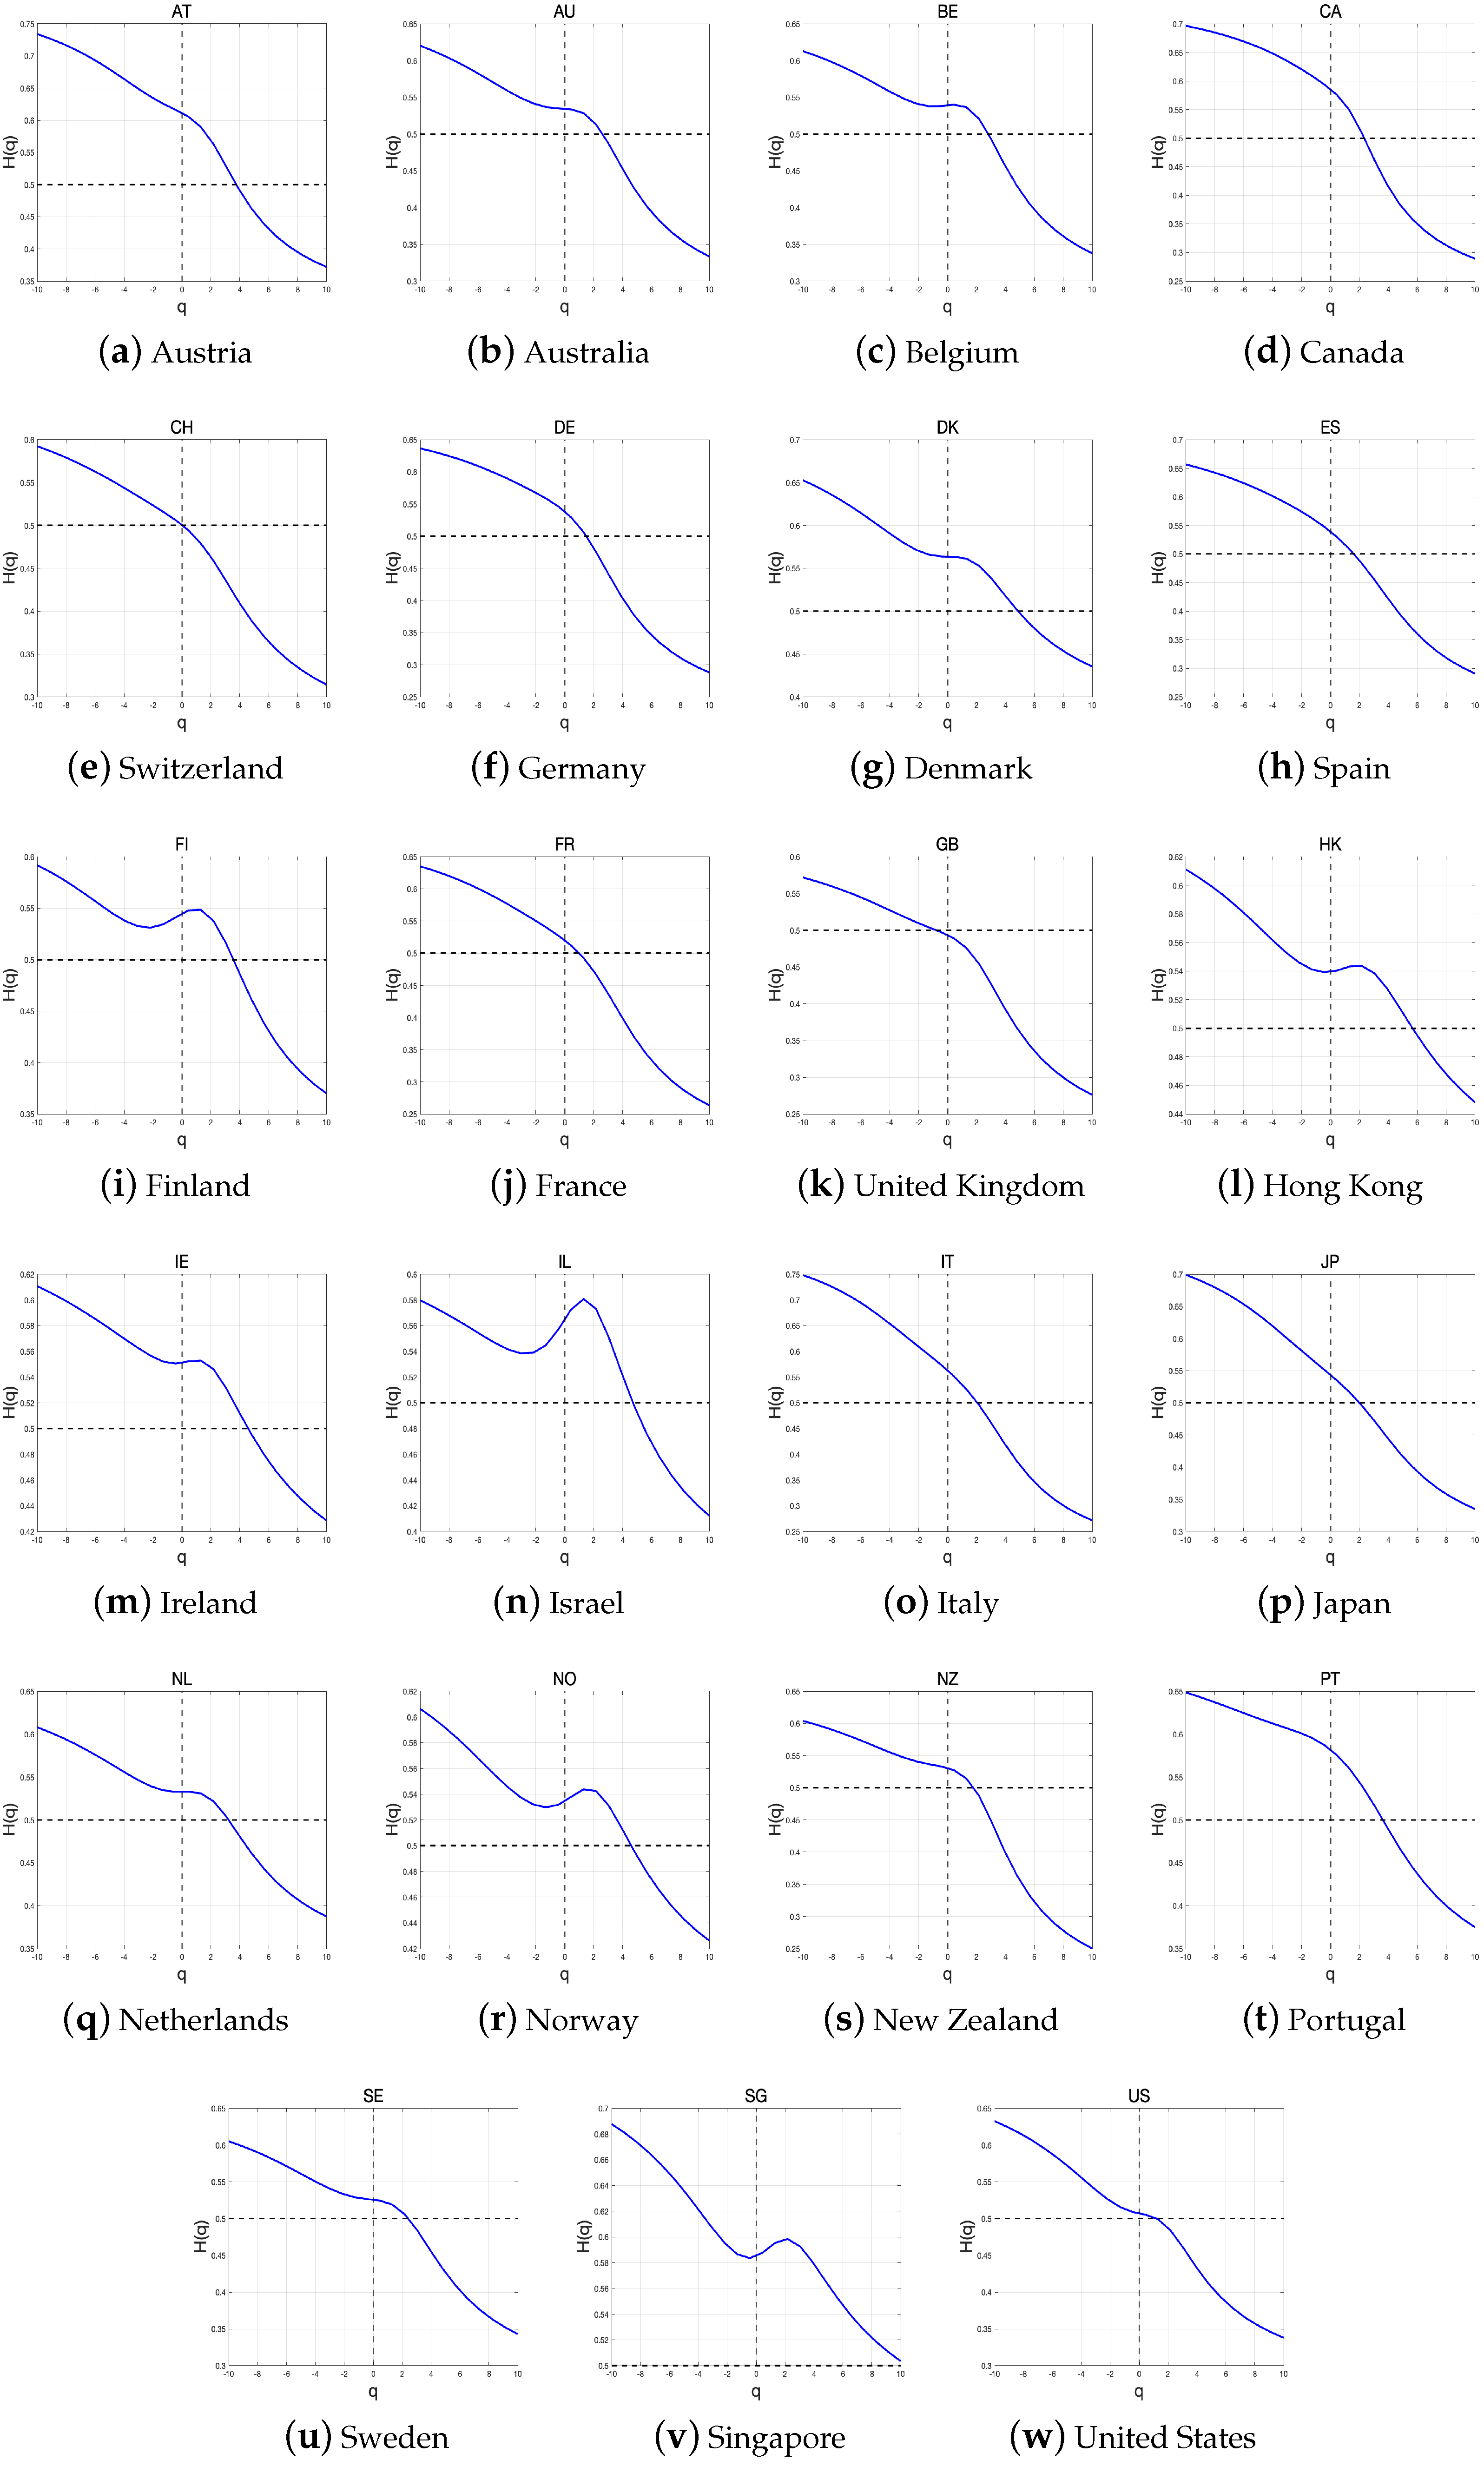
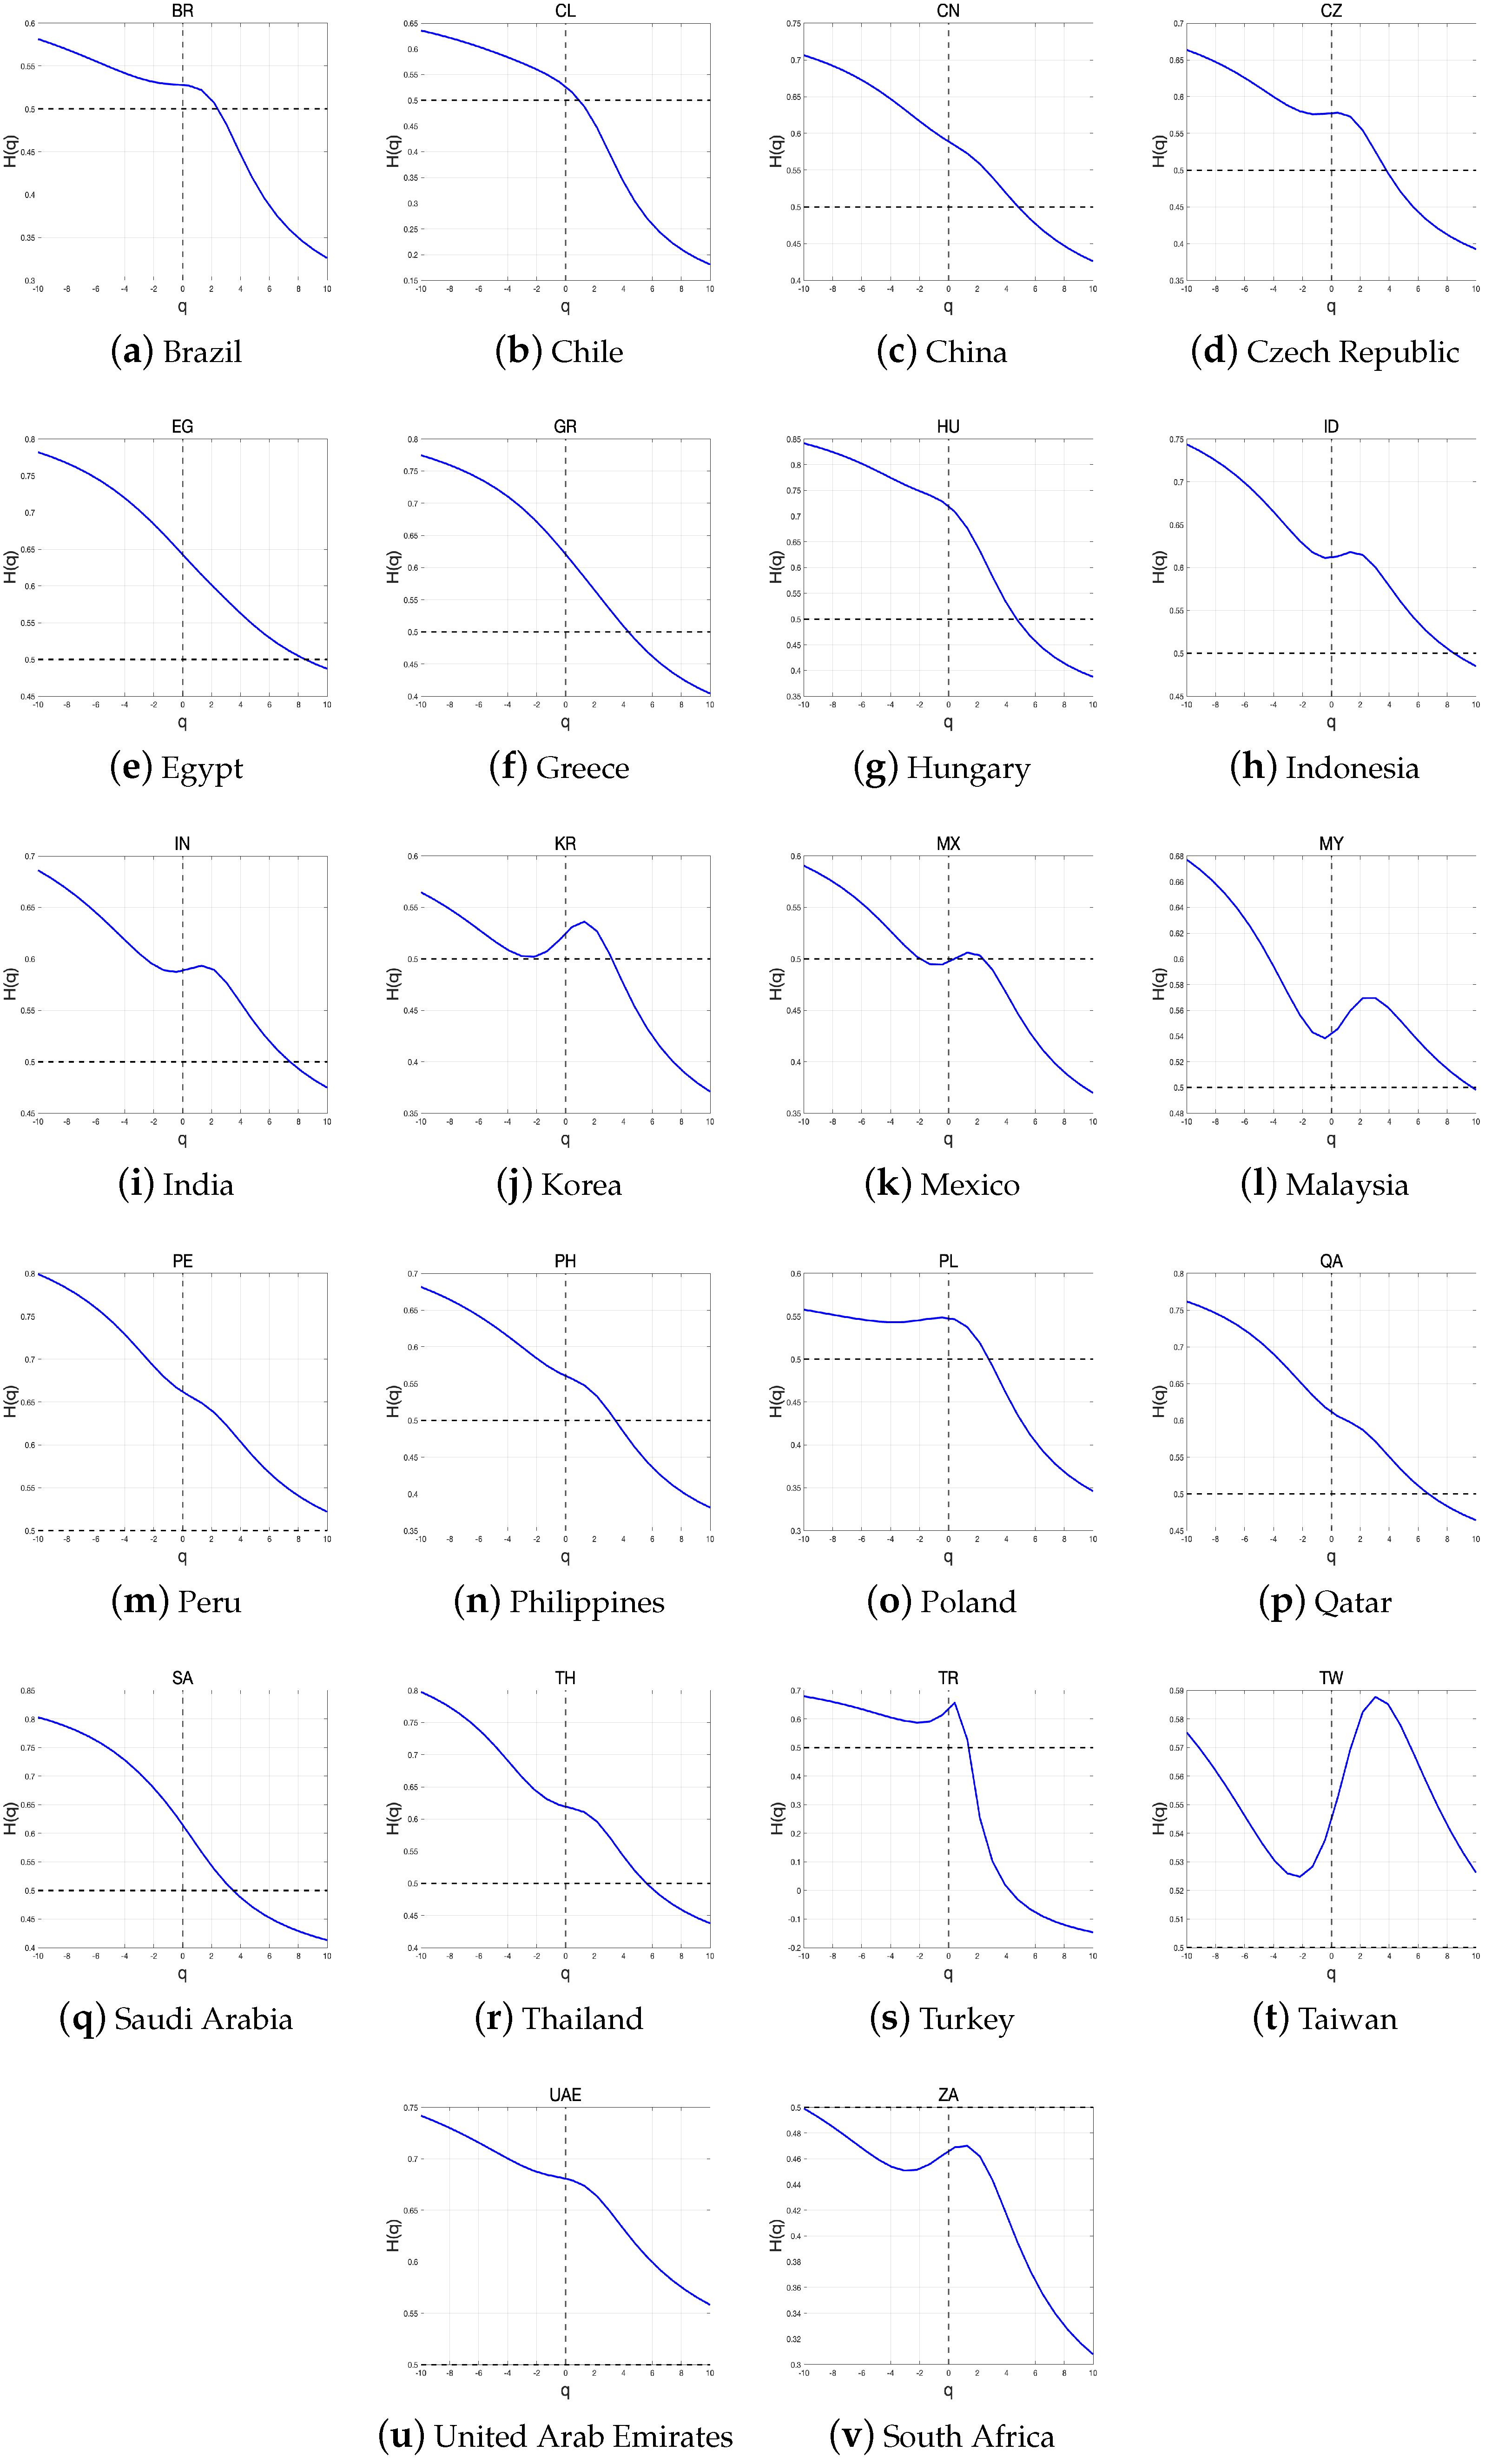
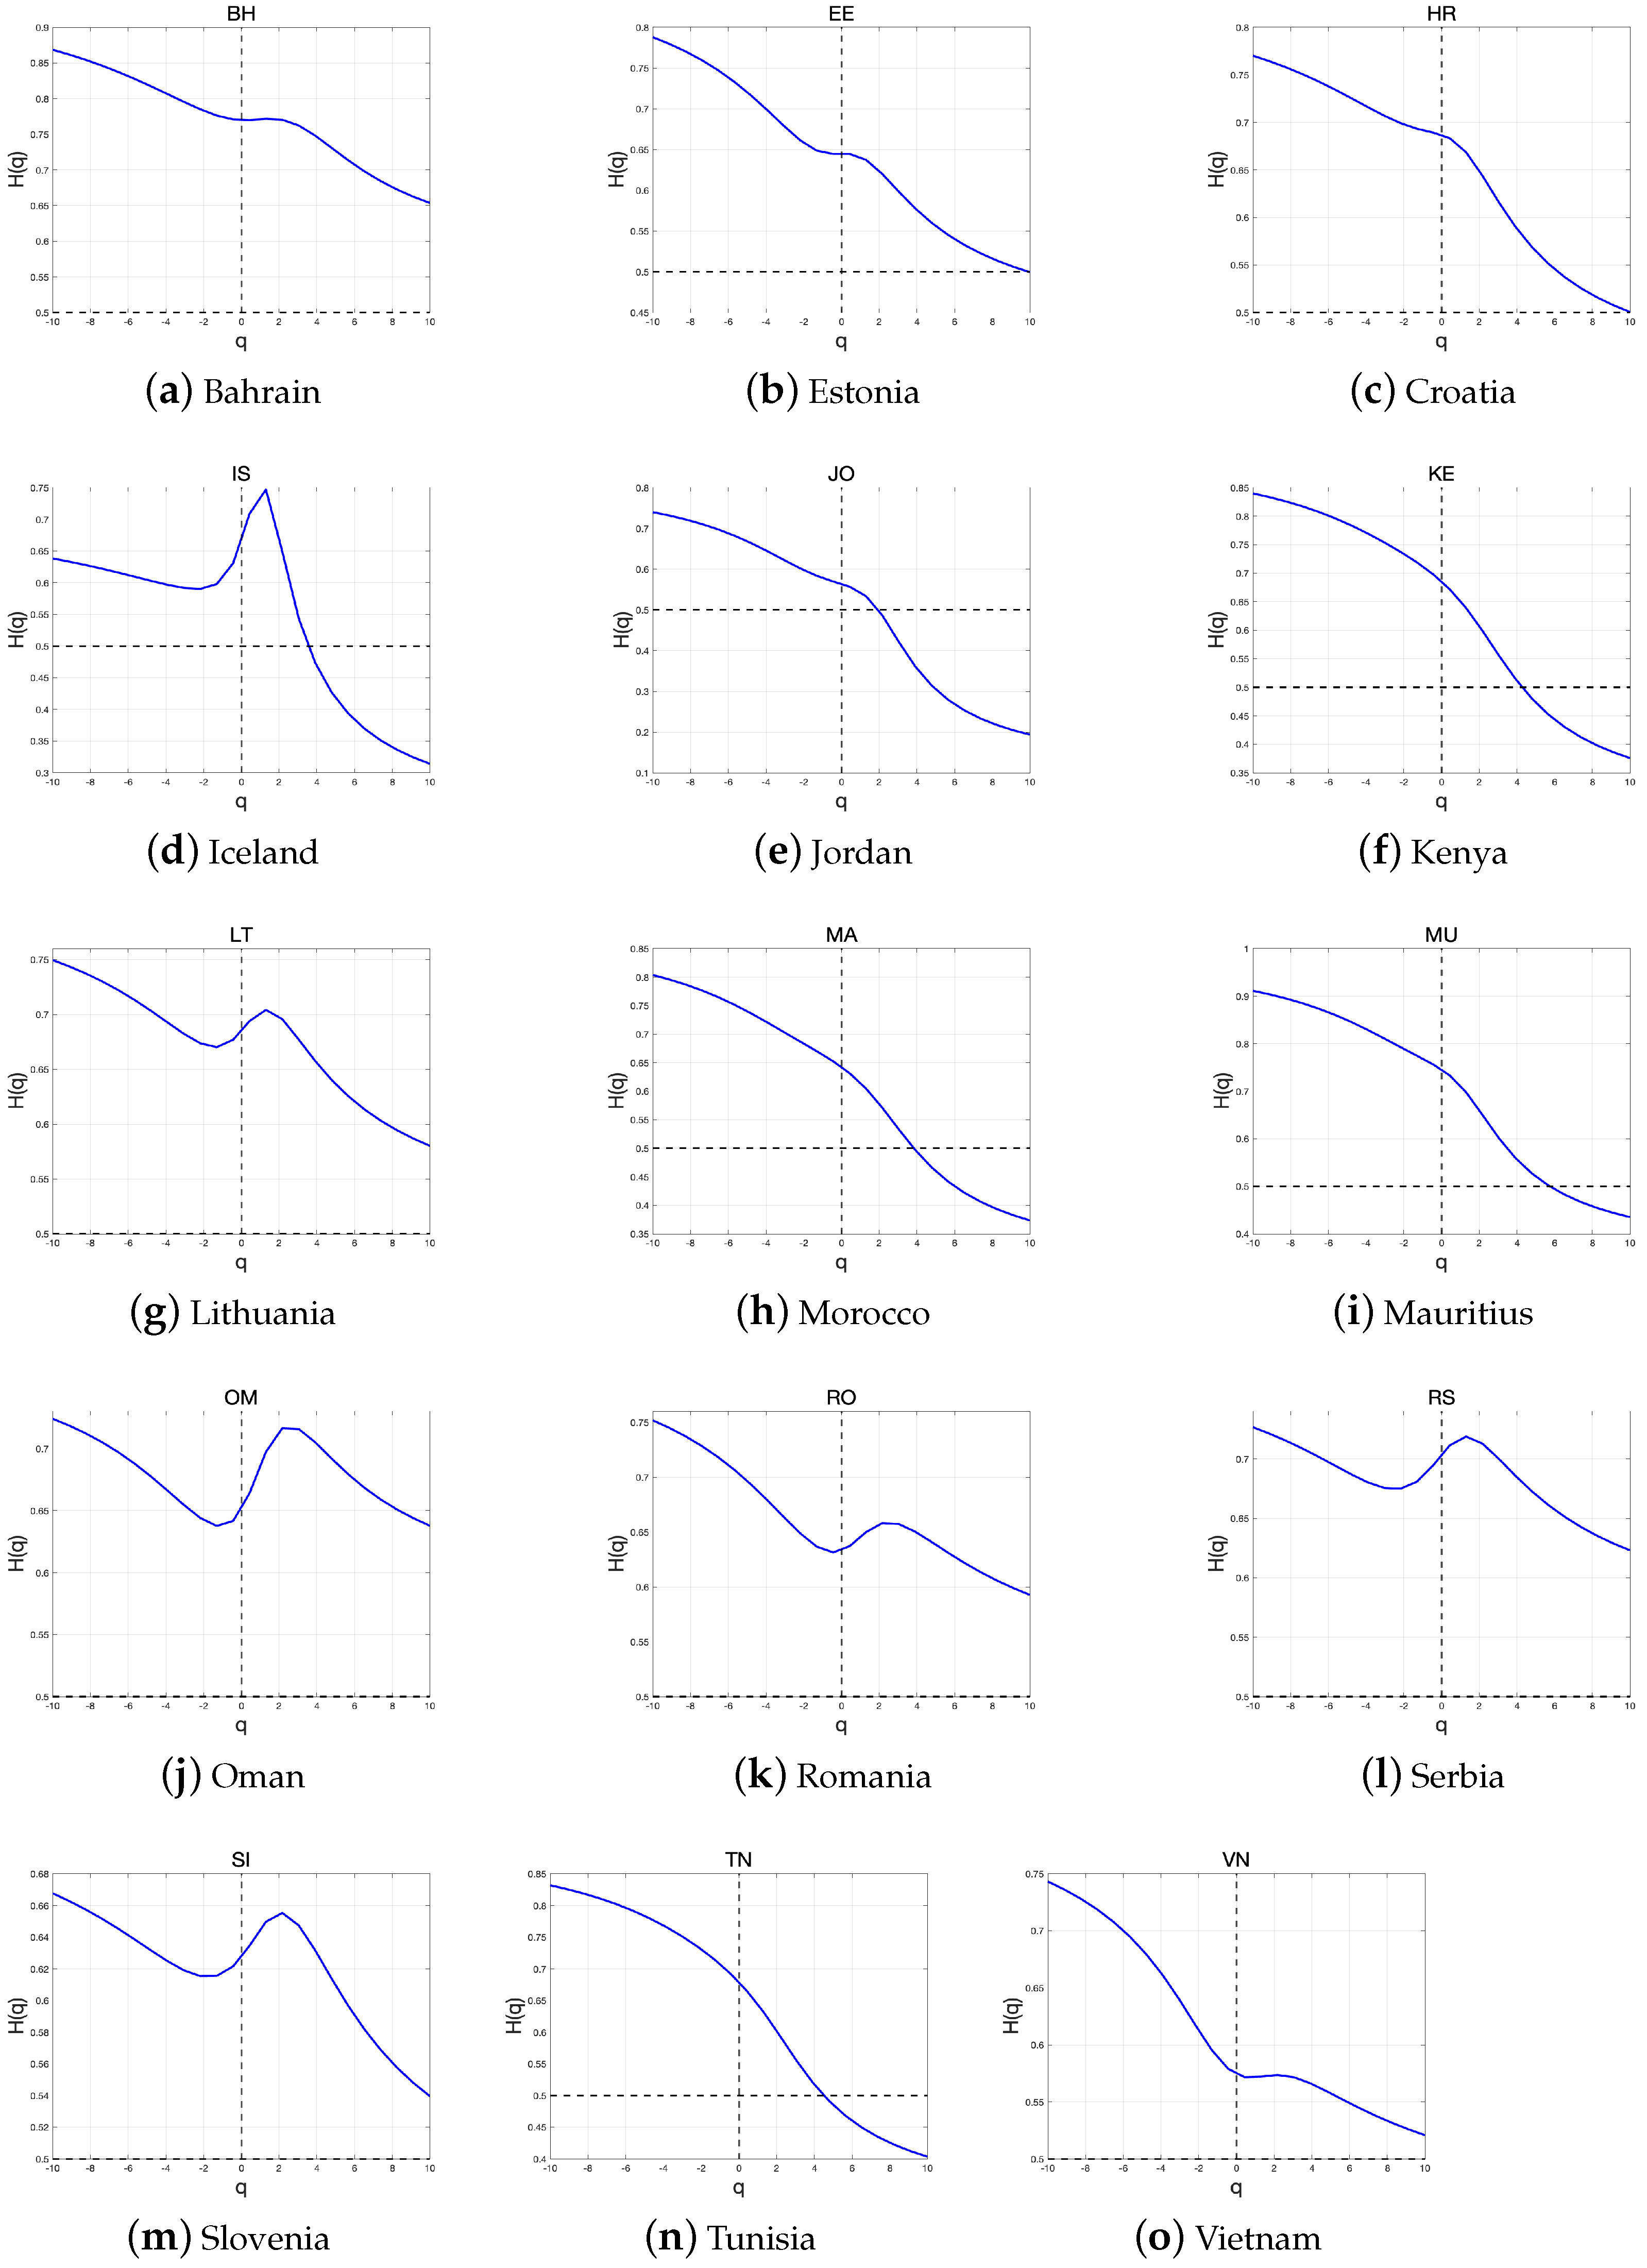
The Hurst exponent for developed, emerging, and frontier countries is shown in Figure 7, Figure 8 and Figure 9. As shown, the generalized Hurst exponent of the index return series decreases as q increases from to 10, indicating that the return series of all markets have clear multifractal characteristics. For , the generalized Hurst exponent is equal to the Hurst exponent. Most Hurst exponents differed from 0.5, providing evidence against the presence of the random-walk behavior. Furthermore, the Hurst exponents of all markets in the frontier group are greater than 0.5. In other words, the average return series for all the markets in the frontier group are persistent. In particular, the stock markets of Switzerland, the United Kingdom, and the United States have Hurst exponents close to 0.5, indicating that their stock markets are close to the efficiency market.
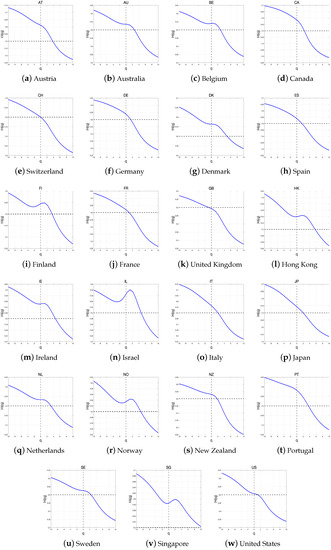
Figure 7.
Generalized Hurst exponents of the index return in developed countries.
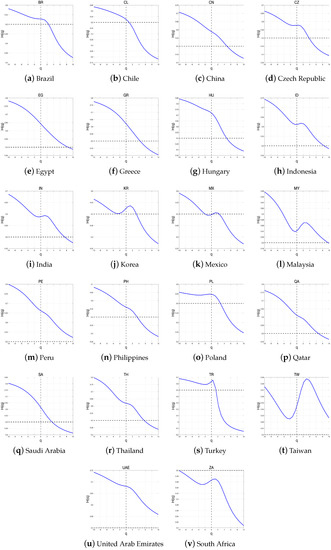
Figure 8.
Generalized Hurst exponents of the index return in emerging countries.
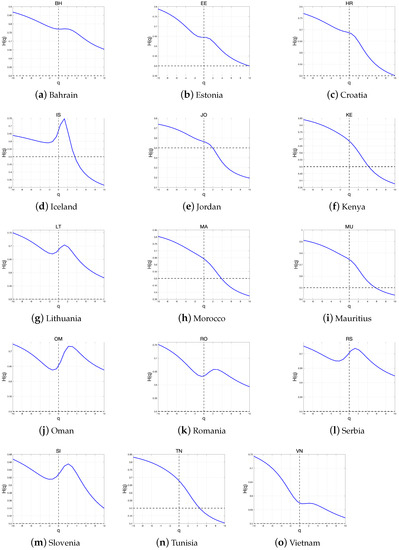
Figure 9.
Generalized Hurst exponents of the index return in frontier countries.
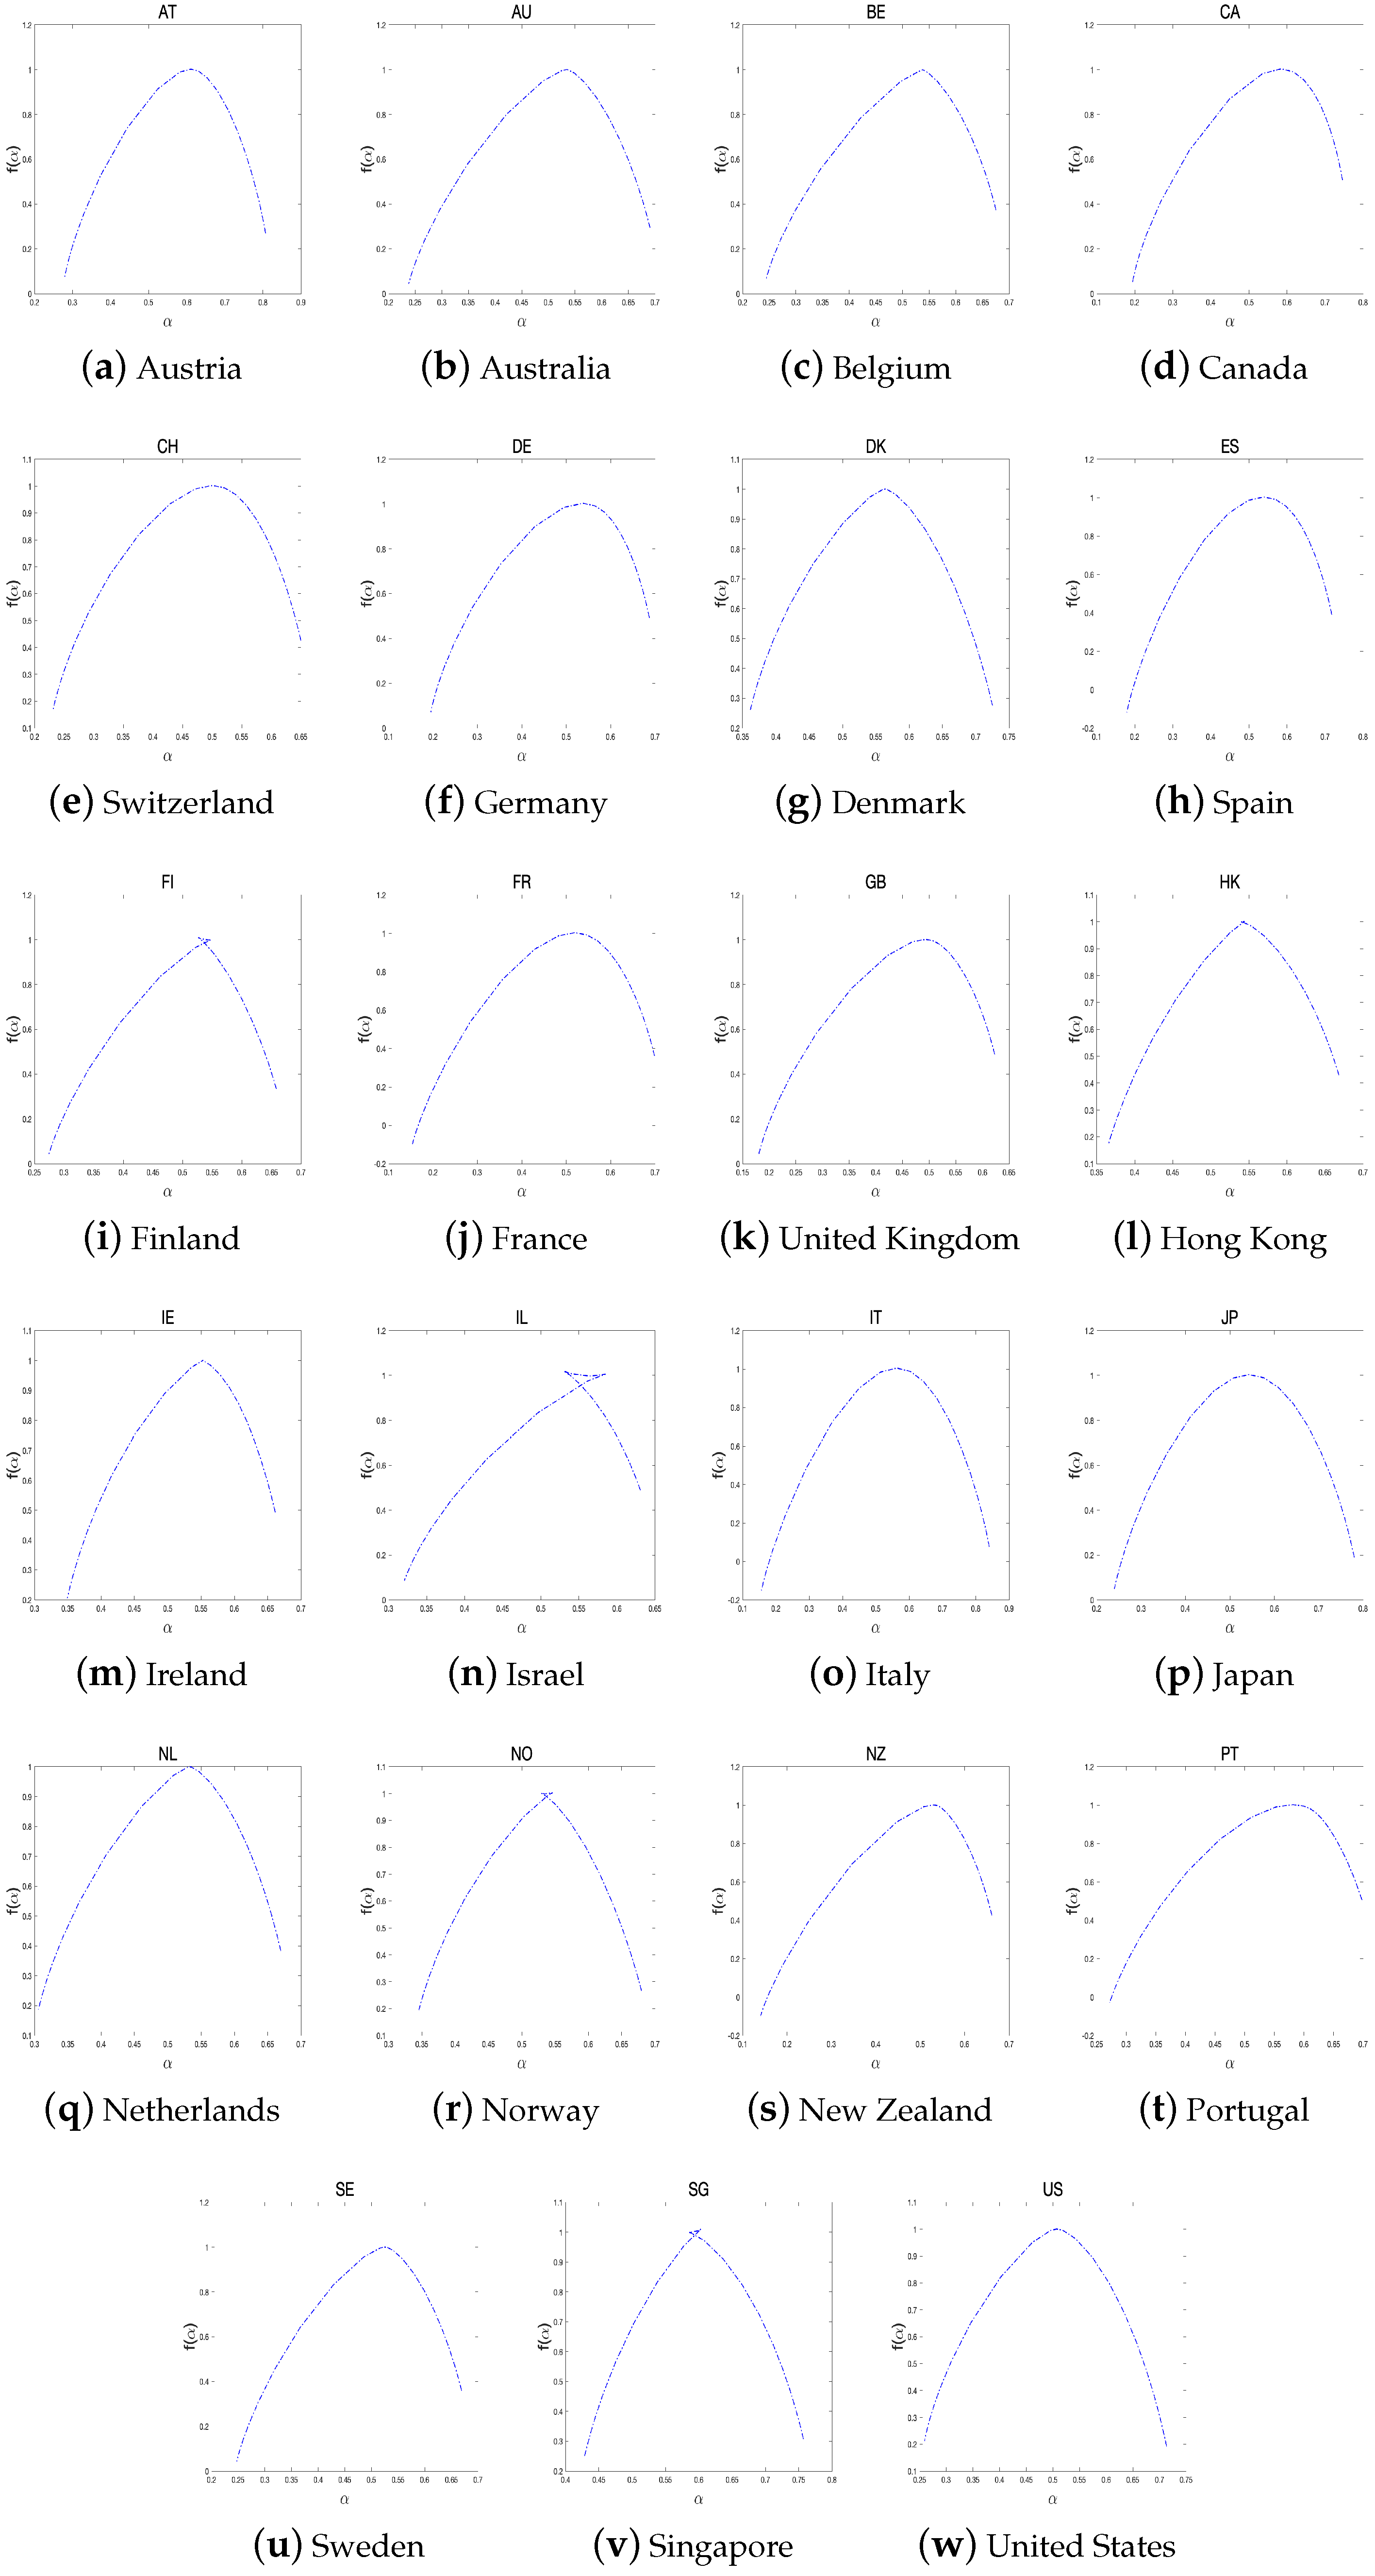
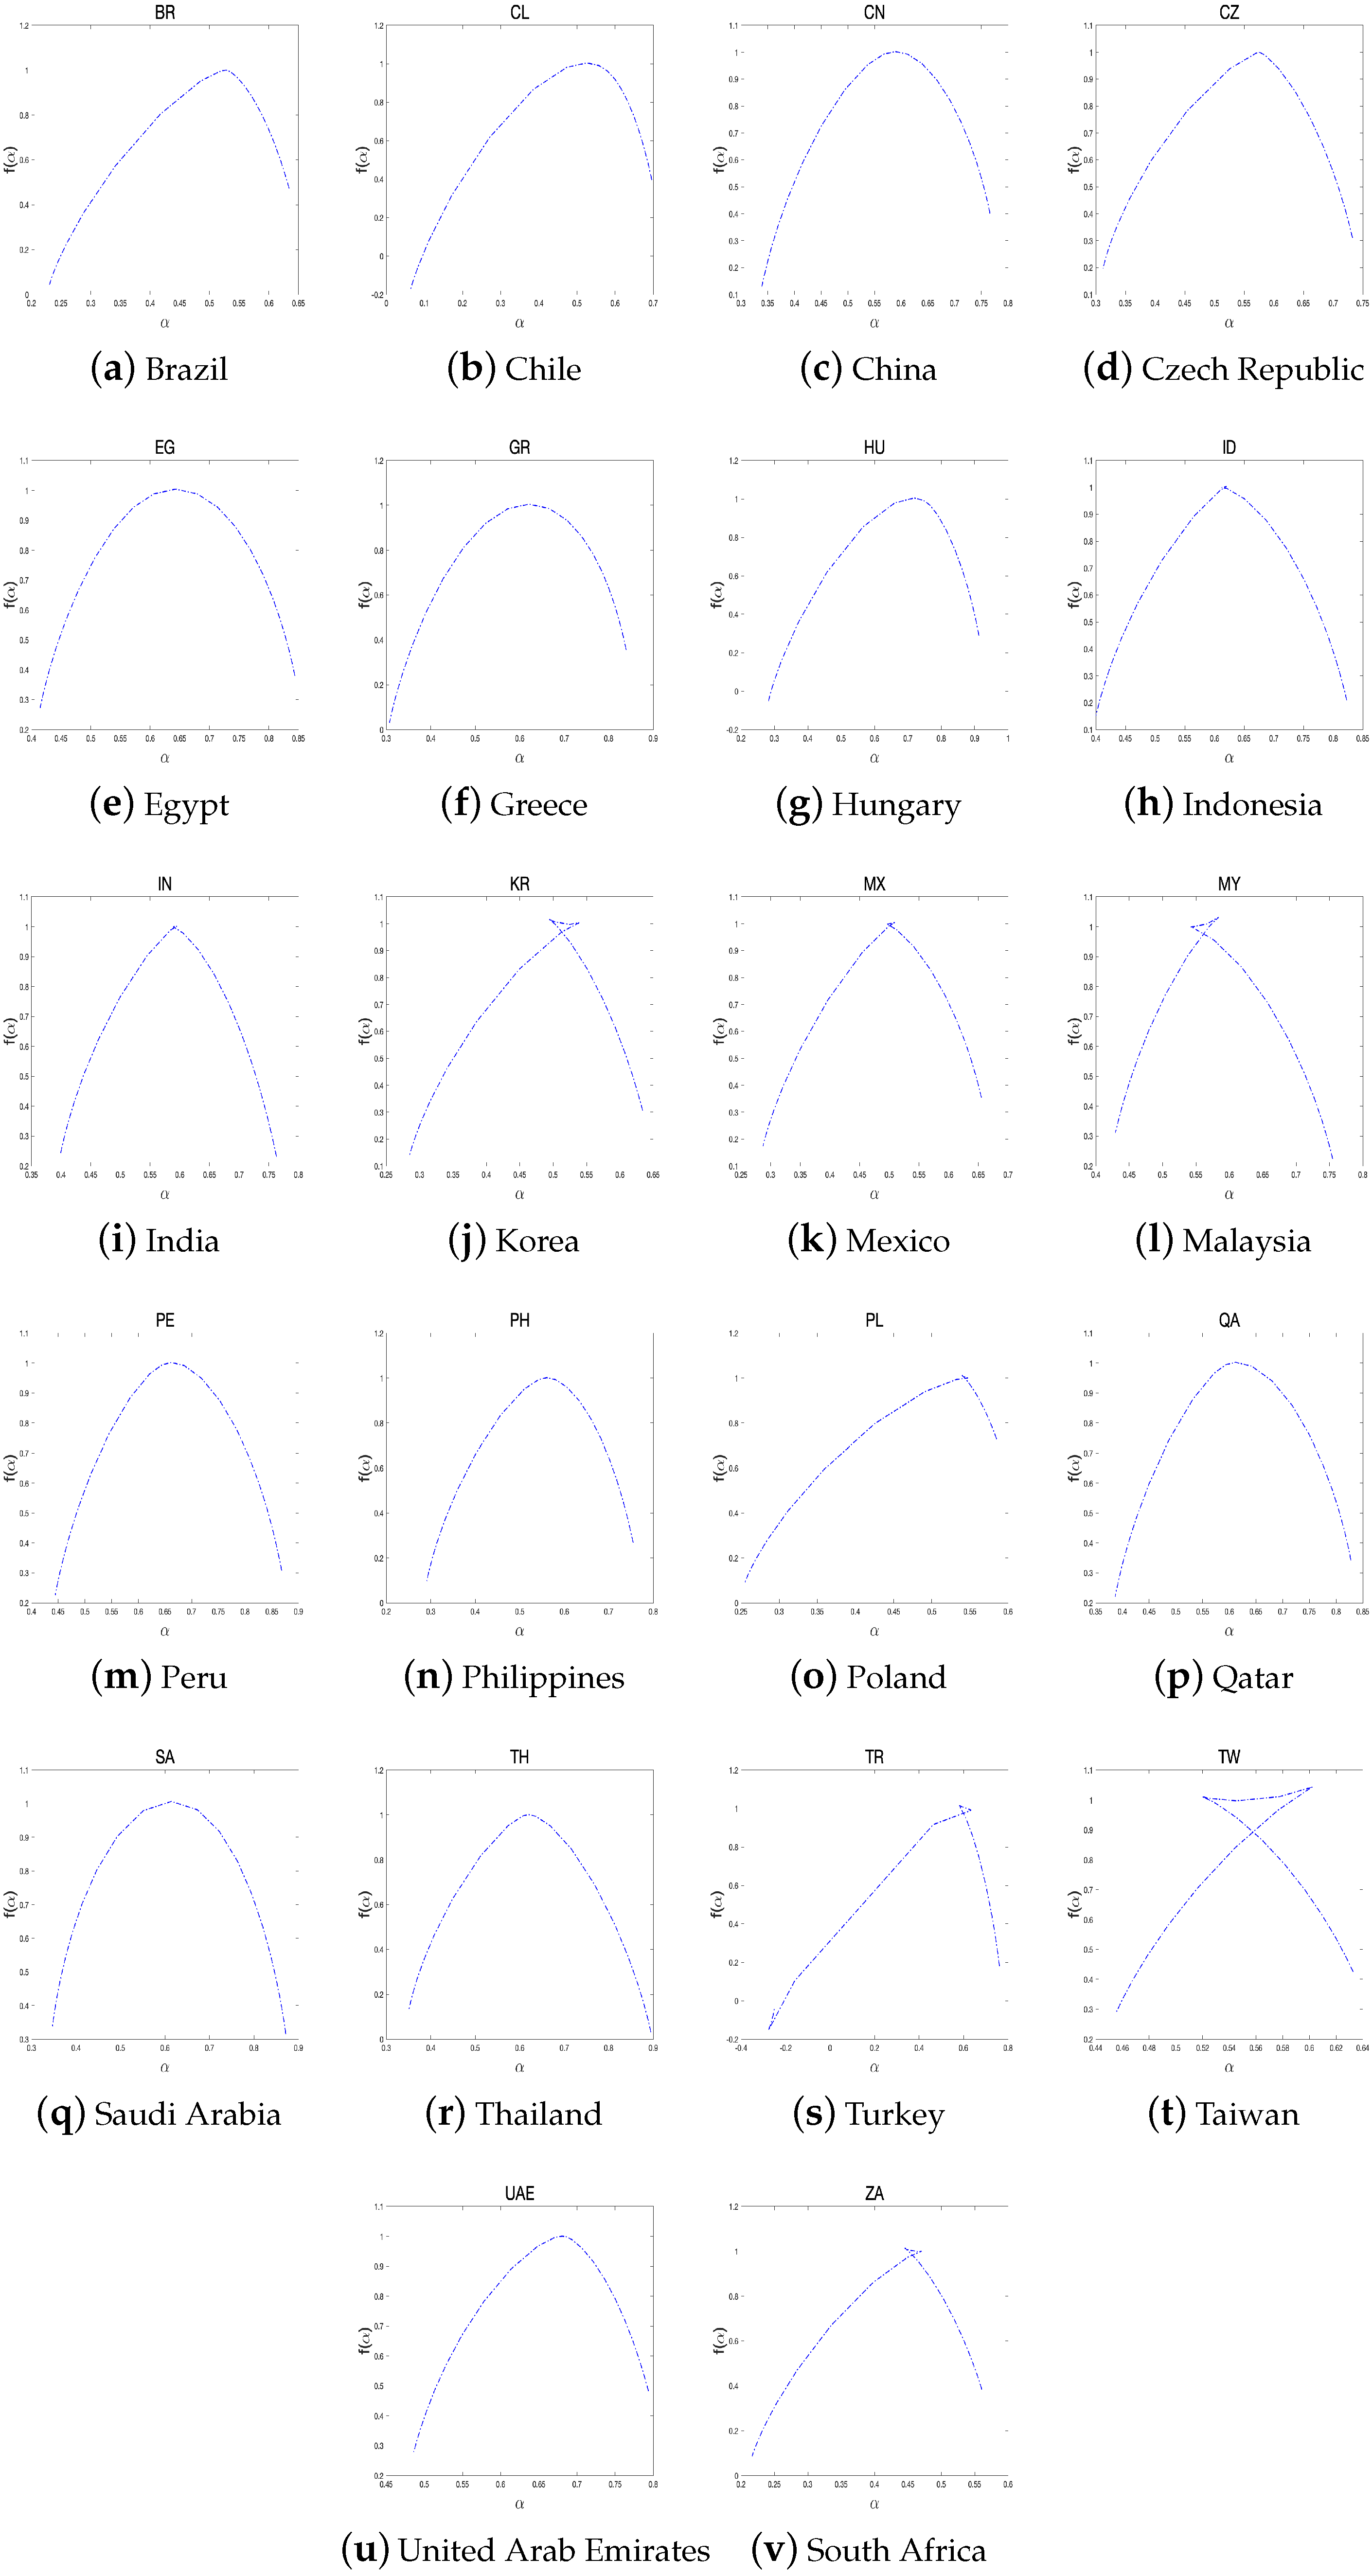
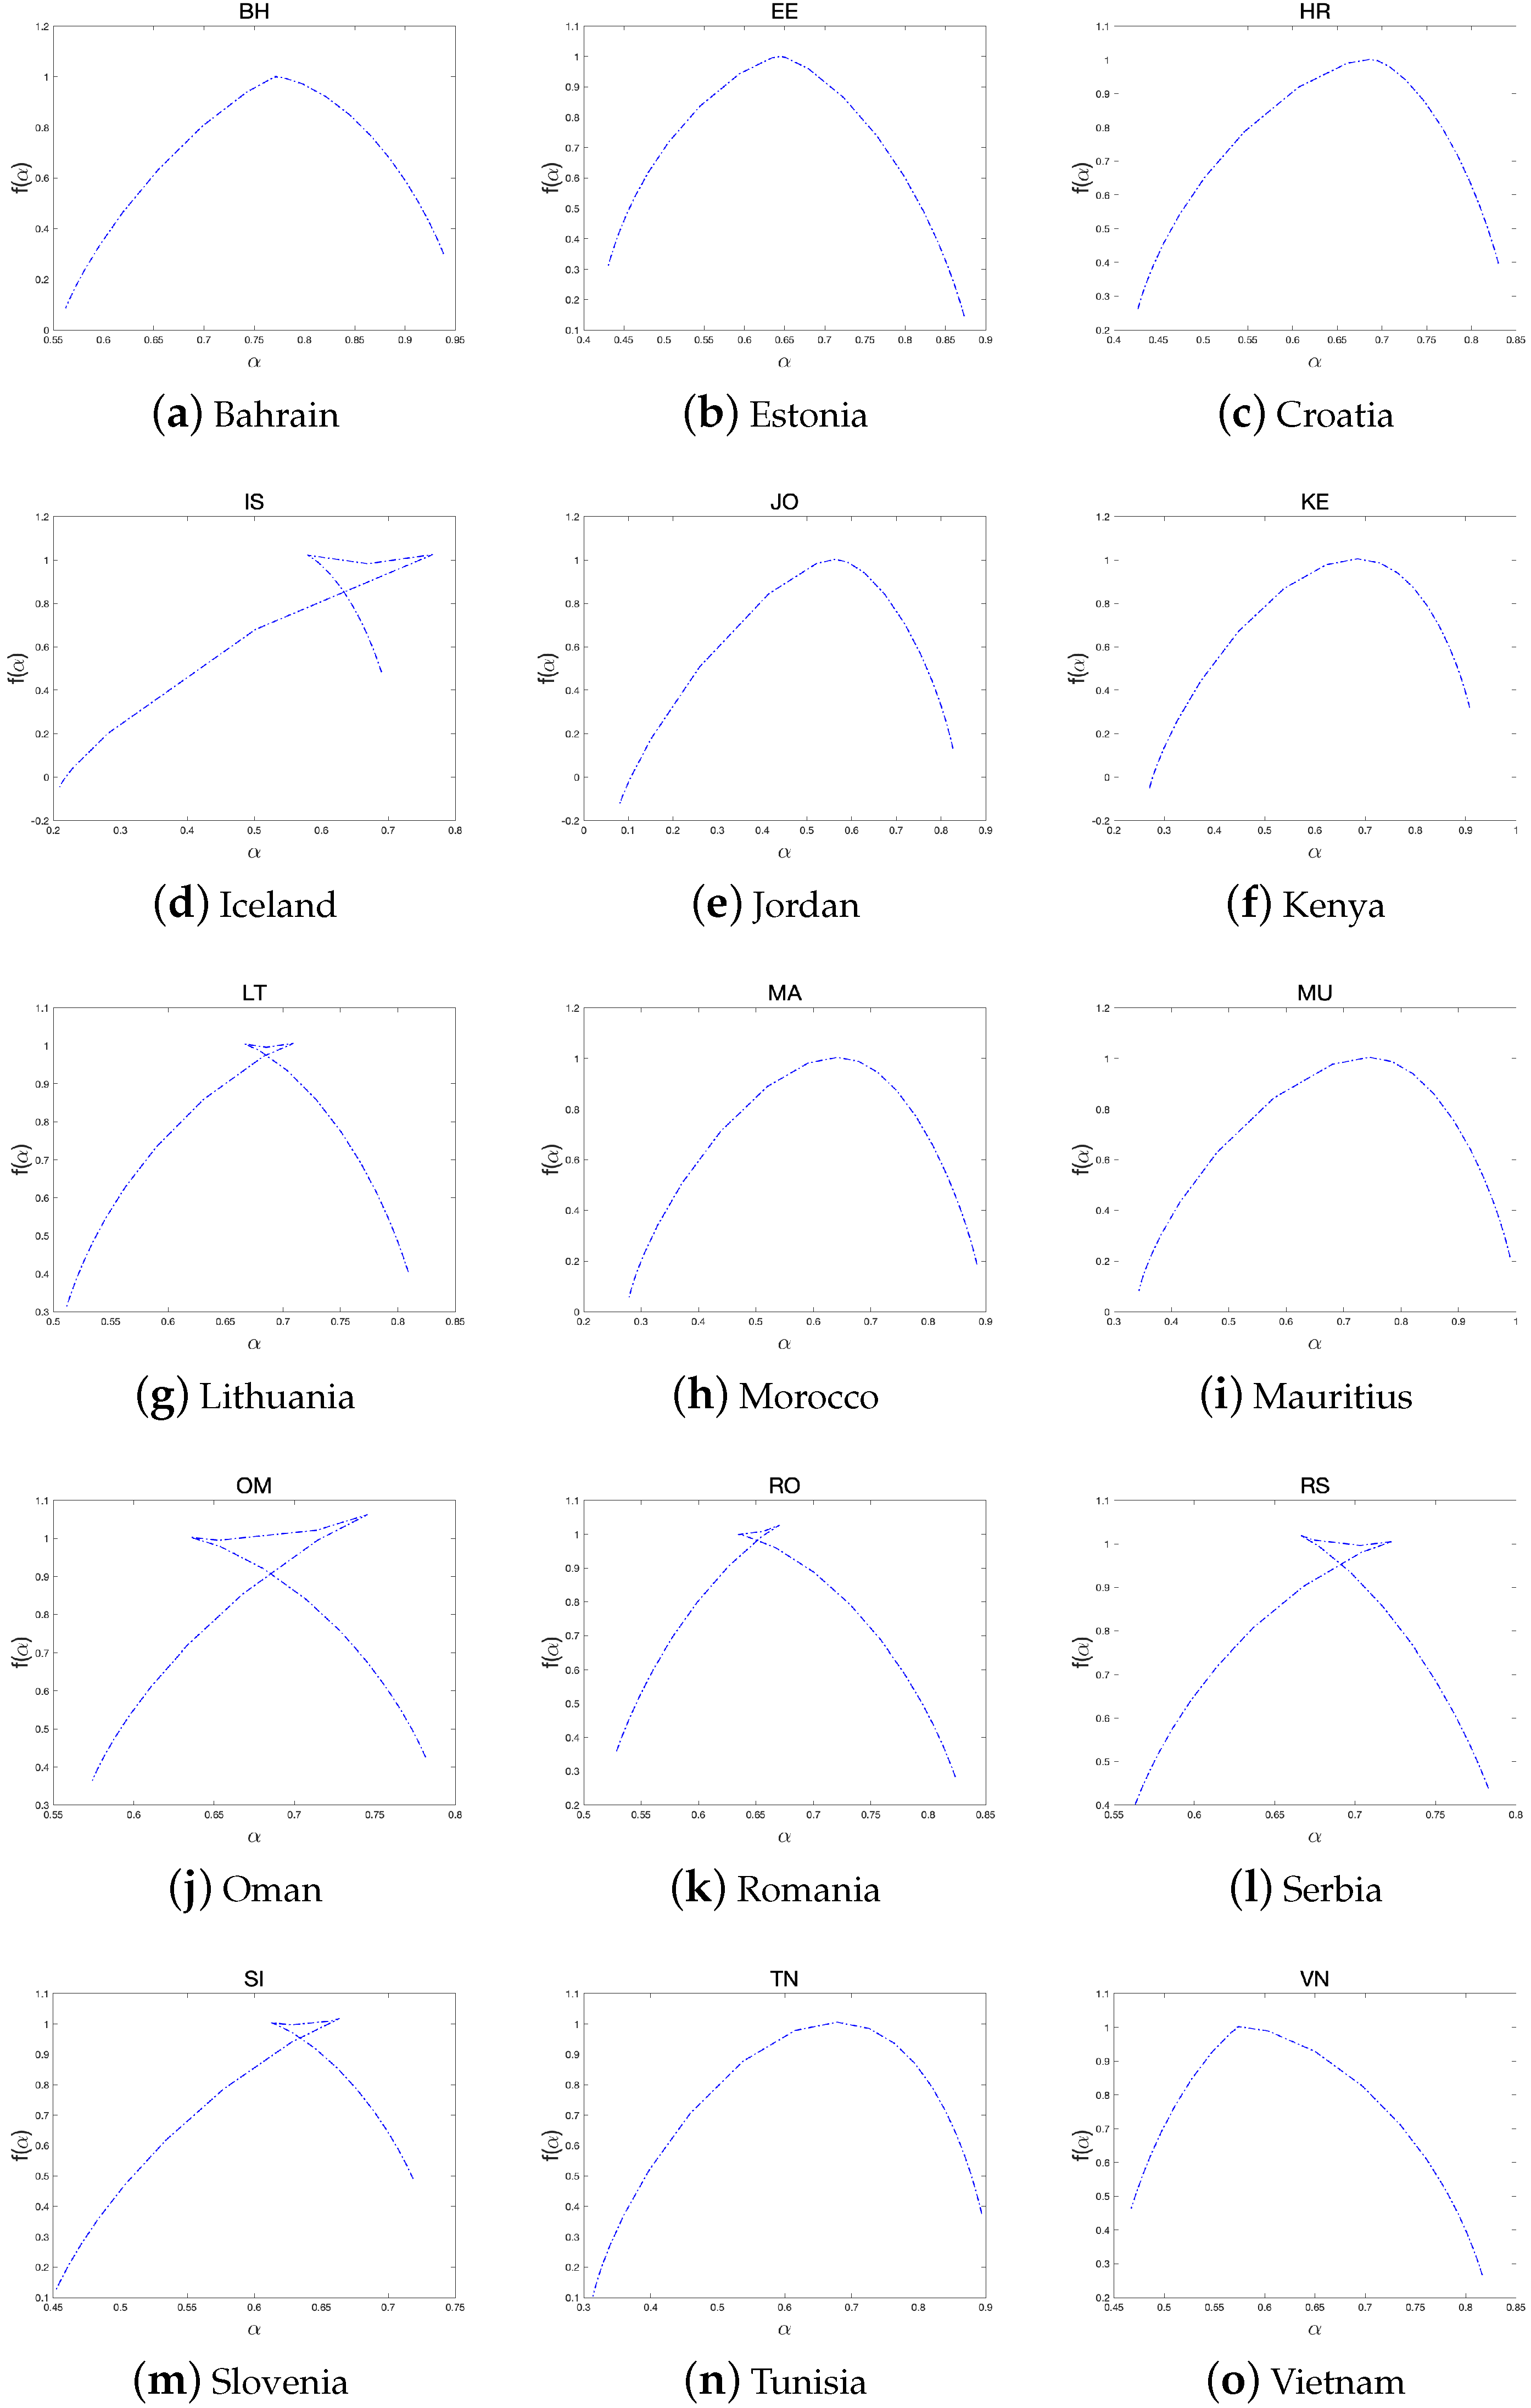
We rank the efficiency of each stock market using the measure in Table 2. Table 2 lists the efficiency rankings of the three groups. Although the rankings changed according to these two criteria, the higher and lower ranks remained the same. Furthermore, Figure 10, Figure 11 and Figure 12 plot the multifractal spectra of all the index returns. In several subfigures, a phenomenon called knotting phenomena occurs, in which the curve is twisted near the peak of the curve. This phenomenon can be attributed to several factors, including the scaling range, irregular fluctuation functions observed at large scales, and the non-monotonic behavior exhibited by the estimated generalized Hurst index function according to previous studies (Jiang et al. [27], Zhou et al. [37], Gao et al. [38]).

Table 2.
The width of the multifractal spectrum for the developed, emerging, and frontier groups.
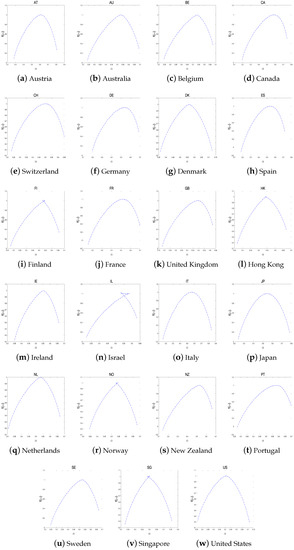
Figure 10.
The multifractal spectra of each index return in developed countries.
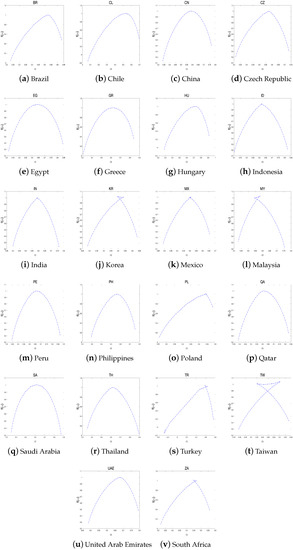
Figure 11.
The multifractal spectra of each index return in emerging countries.
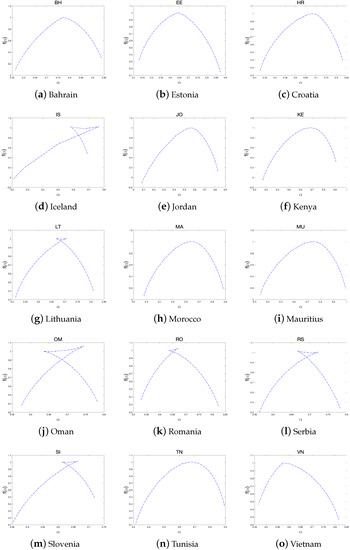
Figure 12.
The multifractal spectra of each index return in frontier countries.
According to Table 2, within the developed group, the stock market of Hong Kong is the most efficient, while the stock market of Italy is the least efficient. Within the emerging group, Taiwan and Turkey have the most- and least-efficient stock markets, respectively. Within the emerging group, Oman and Jordan have the most- and least-efficient stock markets, respectively, in the frontier group. Among all countries, Taiwan and Turkey have the highest and lowest stock market efficiencies, respectively.
Since the static analysis does not reflect changes in the market efficiency of a stock market over time, we investigate the dynamics of market efficiency using the rolling window analysis in the following section.
5.2. Rolling Window Analysis
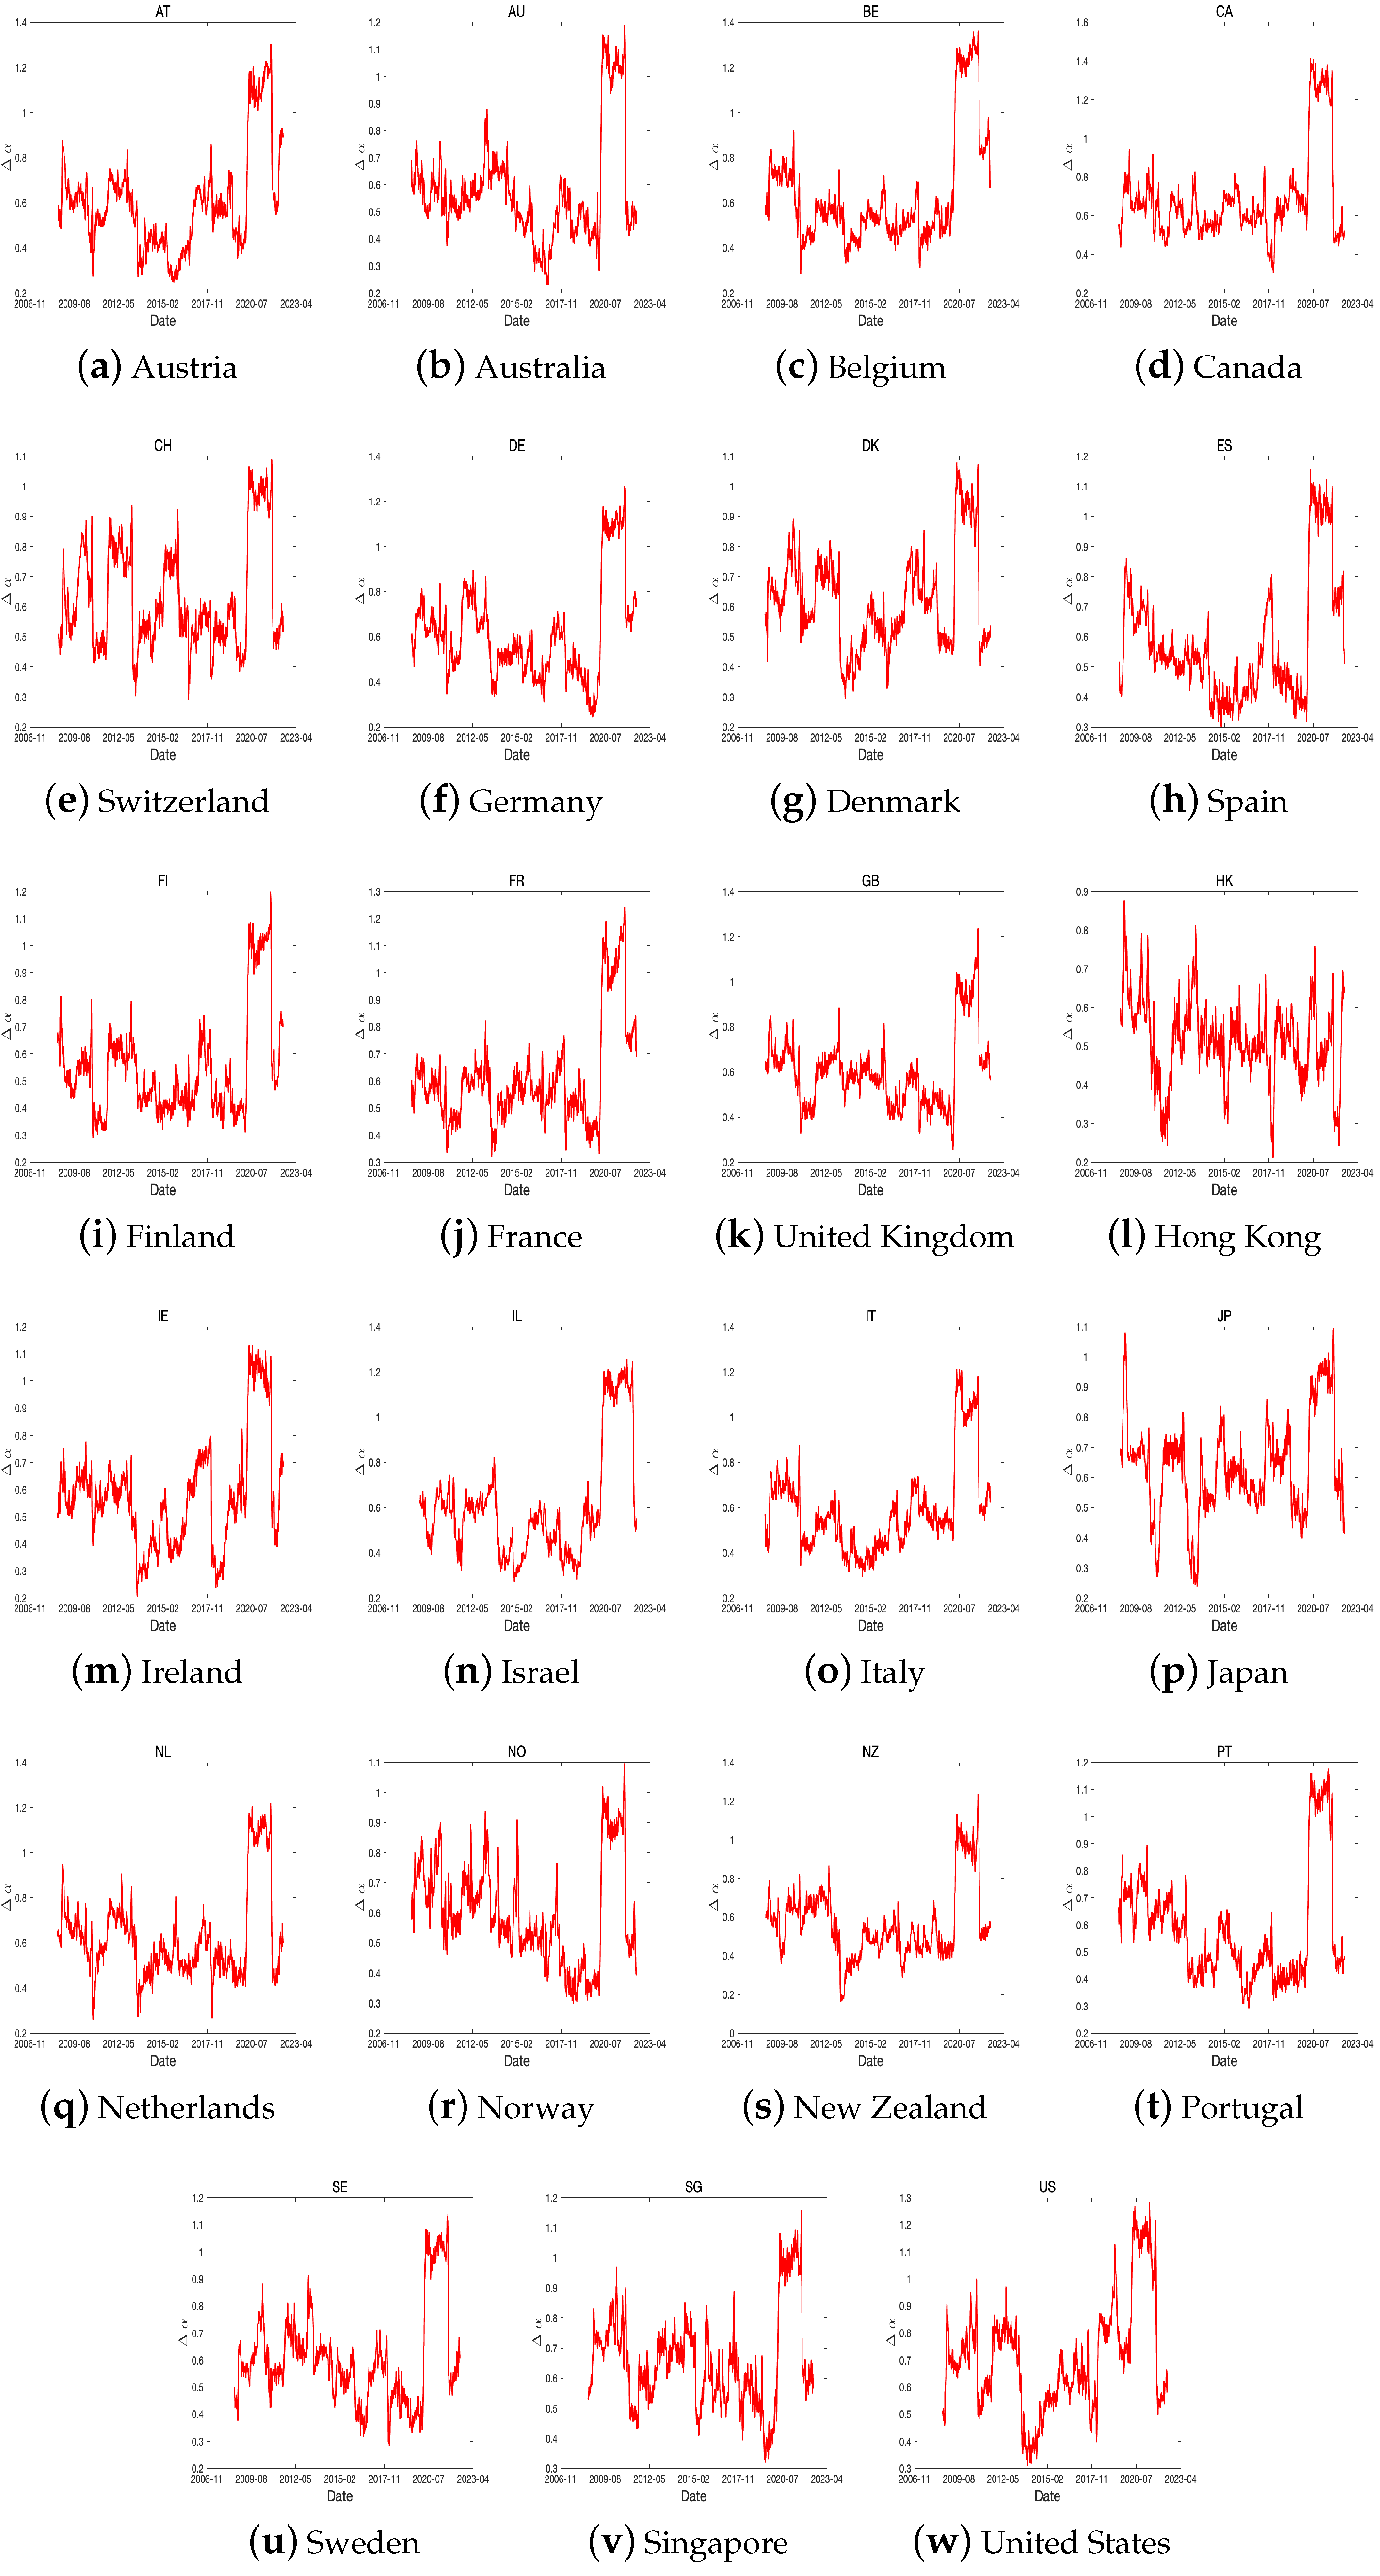
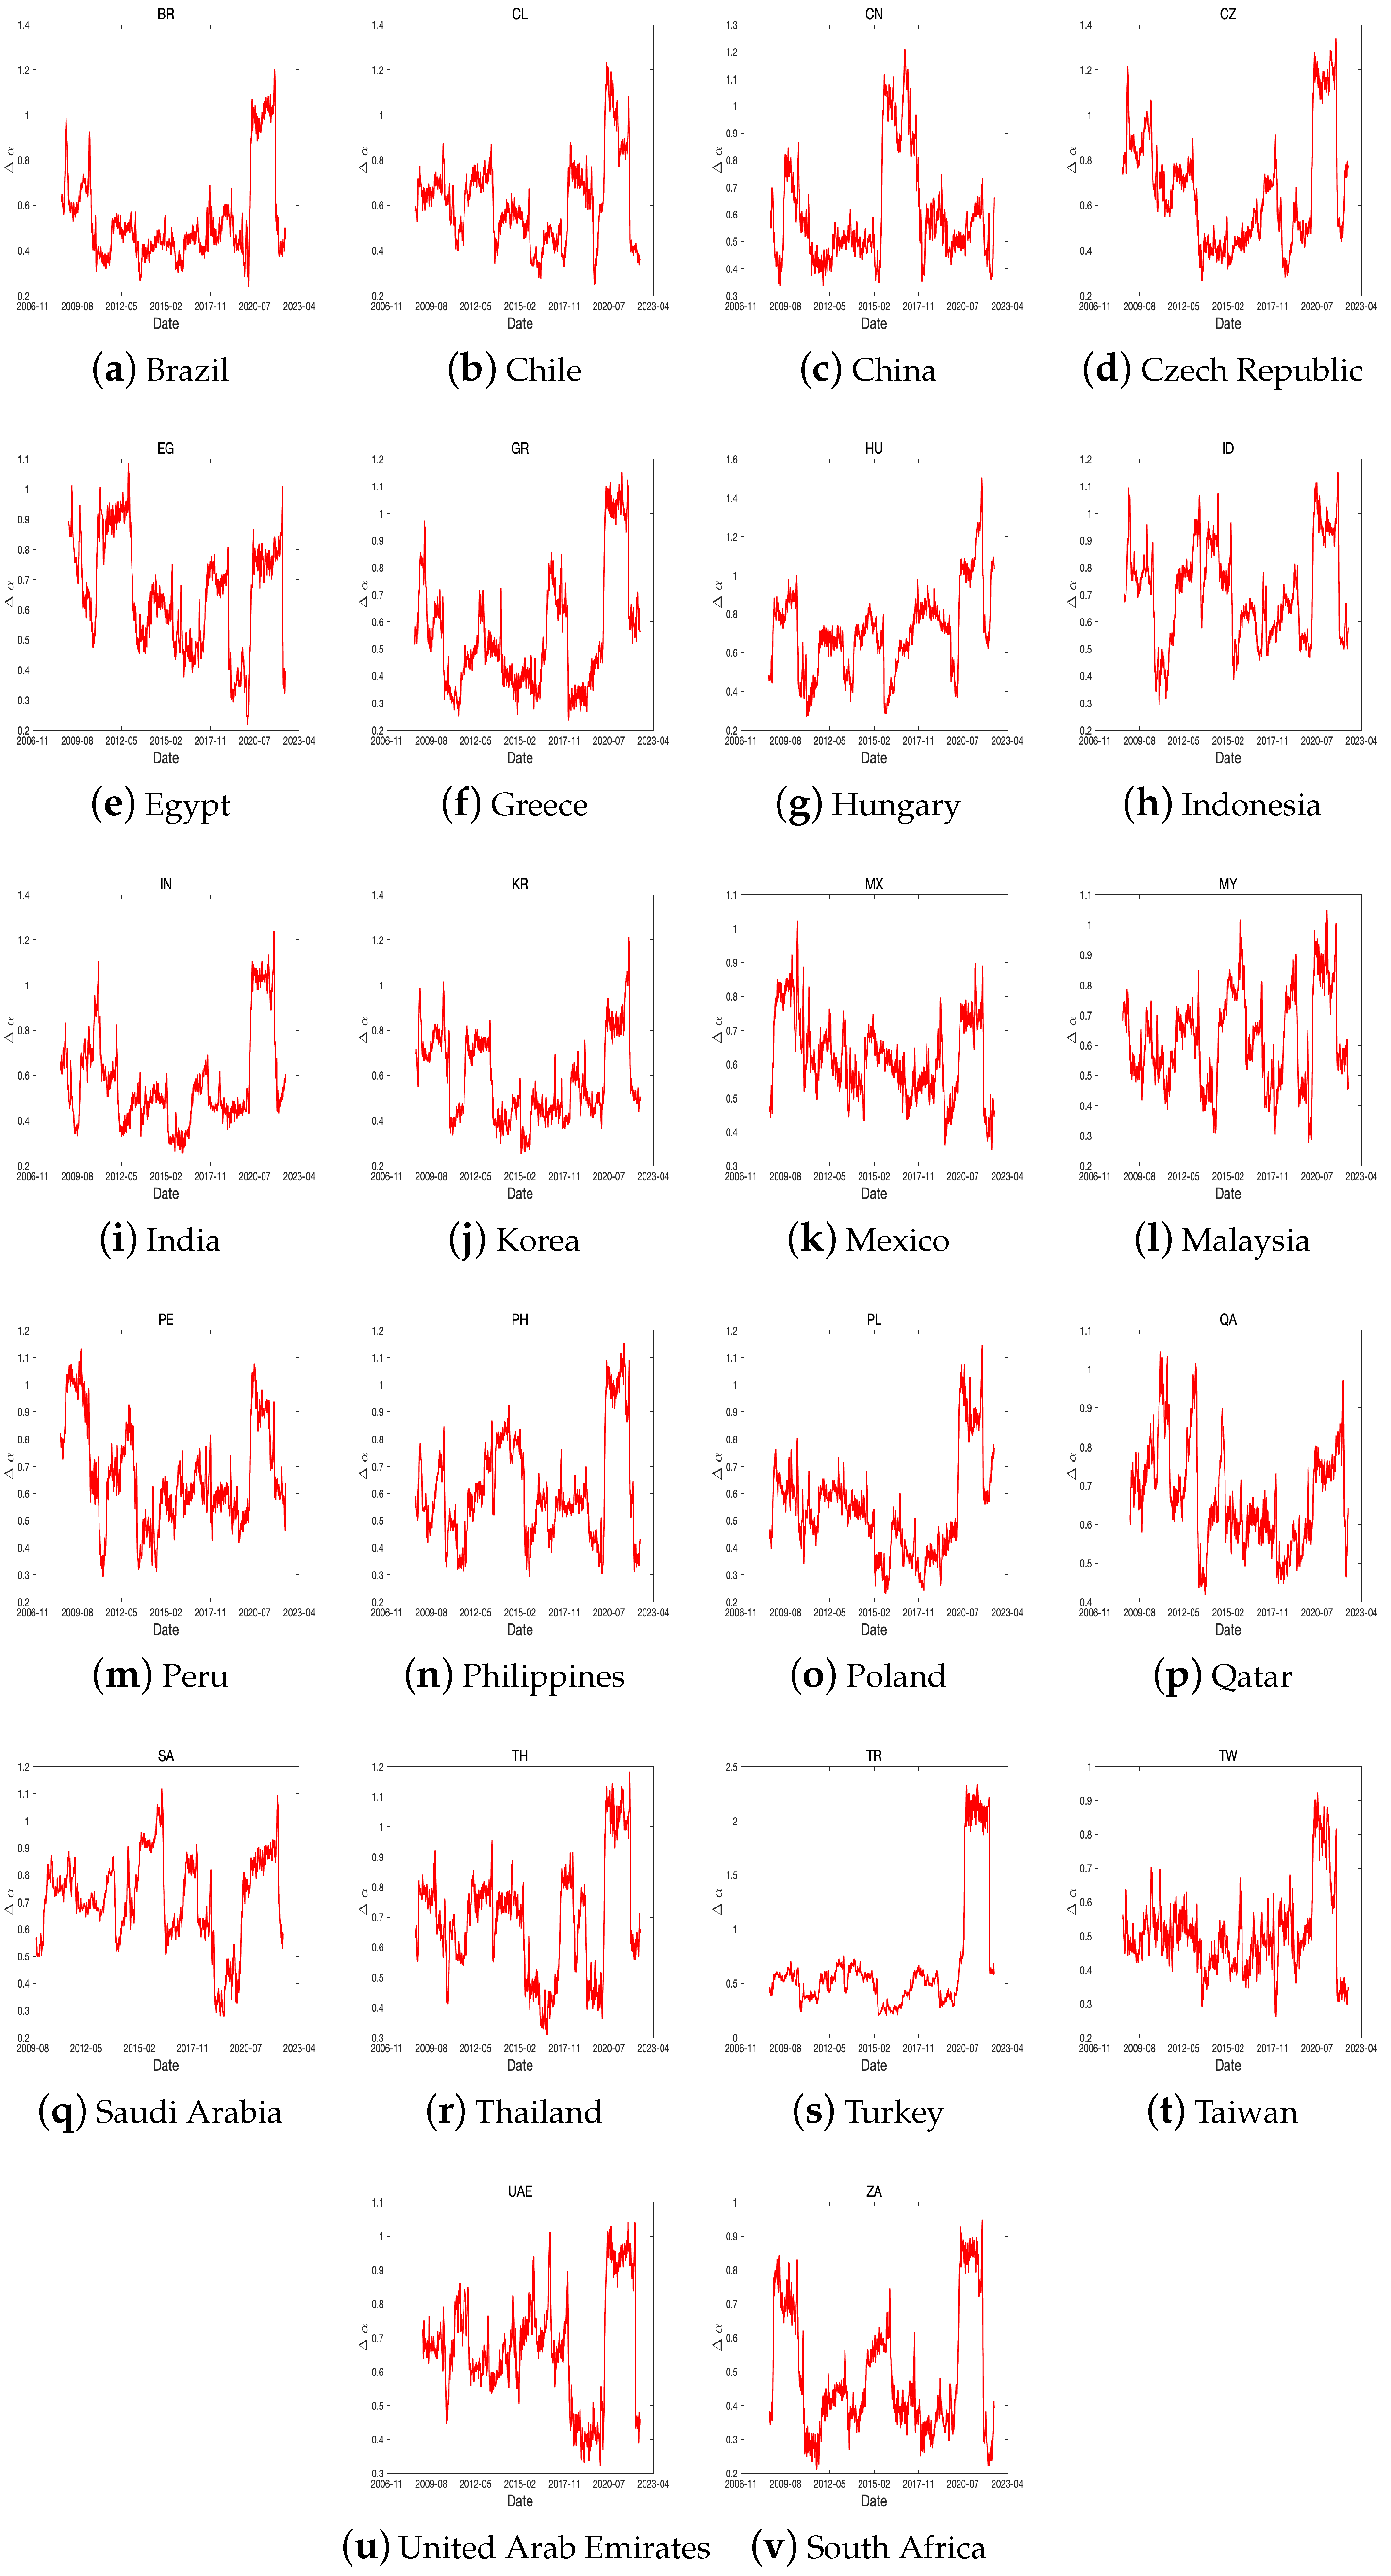
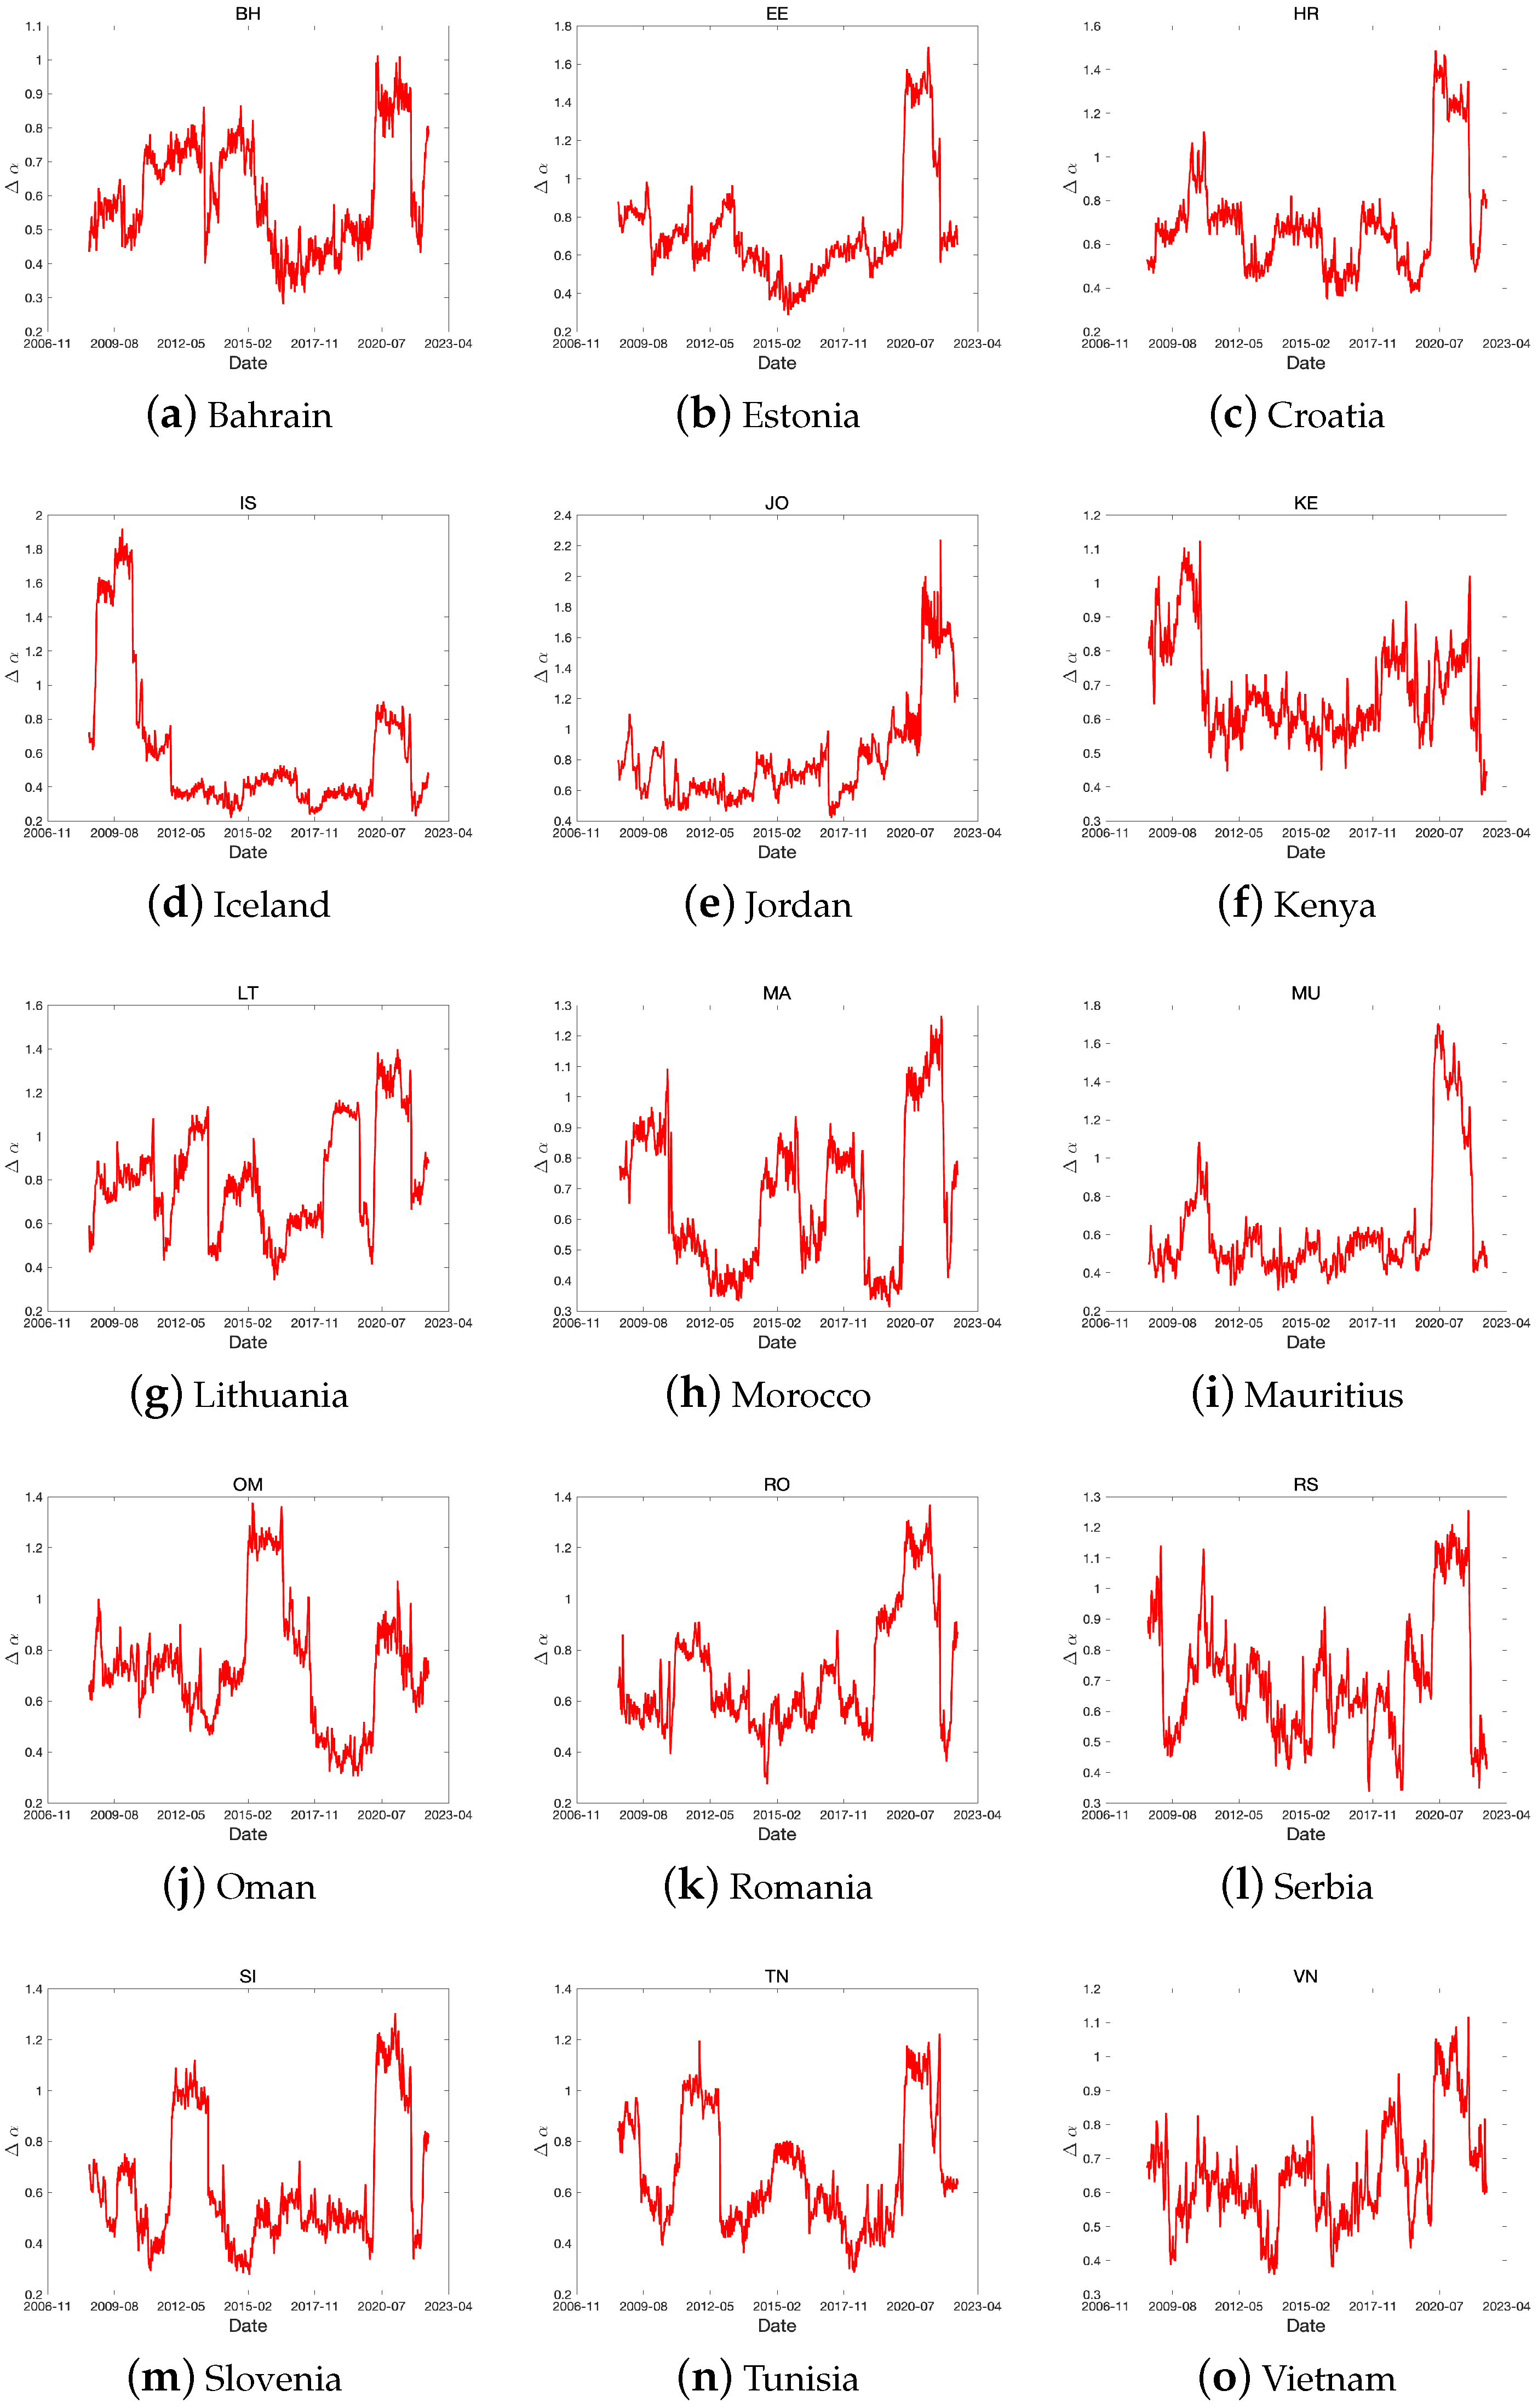
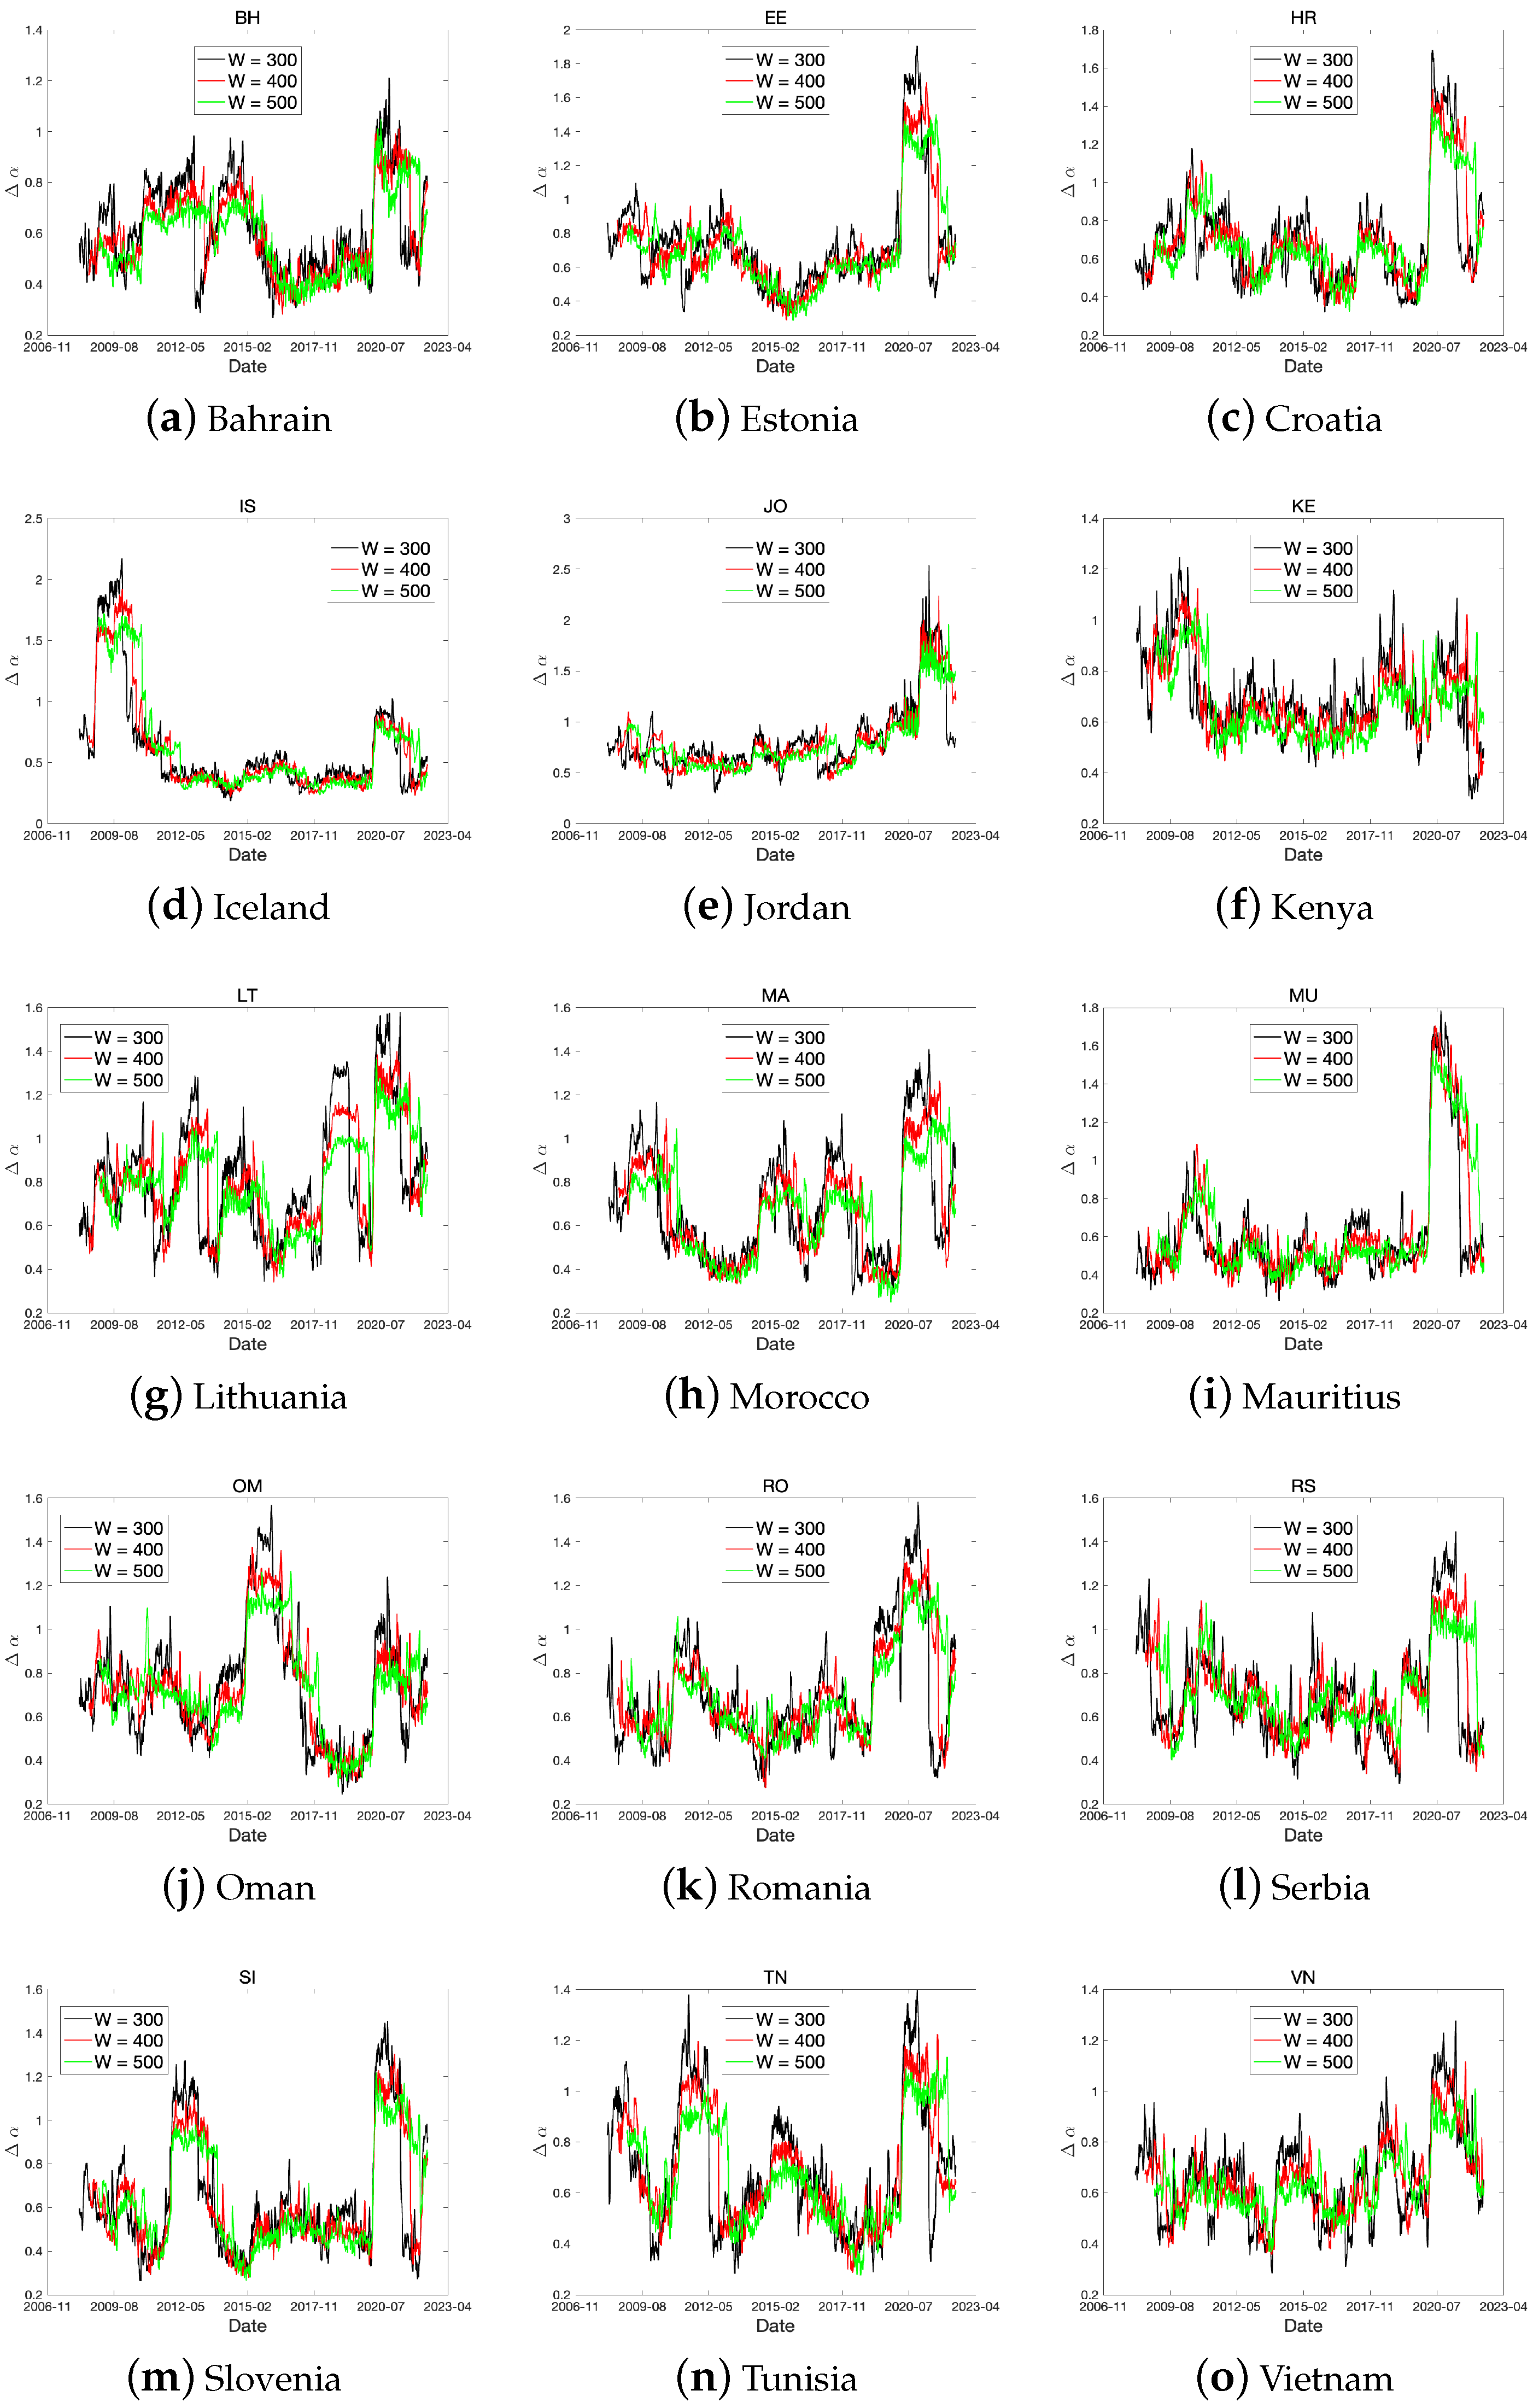
In this section, we provide the dynamics of for each stock-index return using rolling window analysis. This approach has been used in several studies on MF-DFA methods (Wang et al. [39], Sensoy and Tabak [40], Gajardo and Kristjanpoller [41], and Aloui et al. [42]). In this study, we chose a window length of 400 days to include the GFC period in our calculation and avoid severe fluctuations. In particular, we test the robustness of our spillover analysis results by comparing different rolling window sizes (300, 400, and 500 days). Figure A1–Figure A3 display the time series for each rolling window length. In the subfigure, the shows a similar fluctuation pattern under each variation of rolling window length. Therefore, our choice of widow size is reasonable for our investigation.
Figure 13, Figure 14 and Figure 15 illustrate the dynamics of for the three groups. We summarize the key features by developed, emerging, and frontier groups as follows.
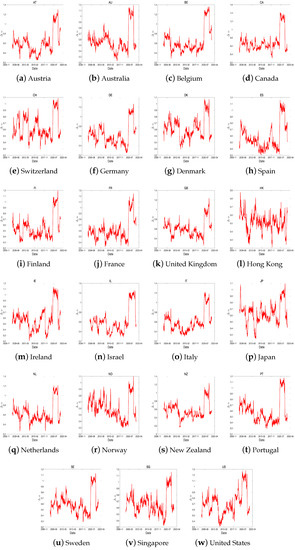
Figure 13.
The dynamics of using a rolling window for developed countries. The window length is 400 days.
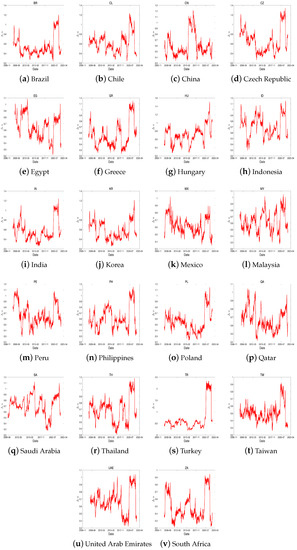
Figure 14.
The dynamics of using a rolling window for emerging countries. The window length is 400 days.
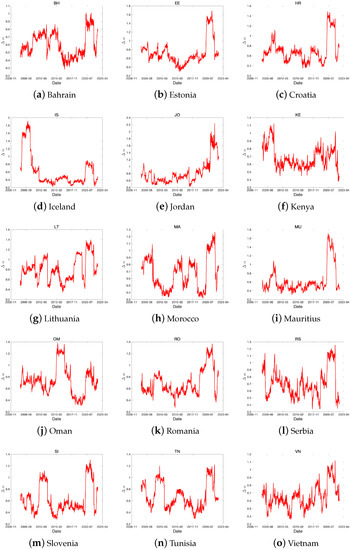
Figure 15.
The dynamics of using a rolling window for frontier countries. The window length is 400 days.
The fluctuations in the efficiencies of developed markets differ from country to country; however, they generally exhibit similar patterns. The key characteristics of these markets can be summarized as follows:
First, developed markets are highly sensitive to global issues. The dynamics of market efficiency often change rapidly, as observed during significant events such as the 2008 global financial crisis and the 2020 COVID-19 pandemic. The United States, with its large stock market and diverse range of market participants, is particularly susceptible to various issues. Notable changes in market efficiency were observed during events such as the 2010 European fiscal crisis and the 2018 US–China trade dispute. The United Kingdom, on the other hand, is influenced by changes in the energy industry and the financial sector (“15 February: Energy Firms Furthermore, Banks Lead Buoyant Market”, Forbes; “UK stocks close higher following Truss energy plan”, “Miners and energy stocks help FTSE 100 end volatile week higher”, Reuters).
Second, each developed country has its own unique factors that strongly influence its stock market dynamics. For instance, Japan is greatly affected by exchange rate and interest rate fluctuations due to its economic policy, as demonstrated during the 2013 Abenomics (Fukuda [43]) and the 2016 Negative Interest Rate and Yield Curve Control initiatives (Kawamoto et al. [44]).
Third, similar dynamics can be observed based on trade relations between countries, governance, and institutions. For example, countries within the North American Free Trade Agreement (NAFTA) such as Canada and the United States exhibit comparable patterns. Similarly, European countries within the EU share certain dynamics, and countries like England, Australia, and New Zealand, belonging to the Commonwealth of Nations, may display similar market behavior. Emerging markets exhibit similar trends to developed markets, but the dynamics of market efficiency within individual countries in this group show significant variations. Several factors contribute to these variations:
First, financial policies play a crucial role in shaping market efficiency dynamics. China, for example, has strict trading regulations and limited foreign investment, resulting in relatively low fluctuations in market dynamics during events such as the COVID-19 pandemic. Previous studies have also highlighted these observations (Hu et al. [45], Petry [46]). Similarly, in Egypt, stock returns are significantly influenced by EGP/USD exchange rates, which are impacted by various exchange rate systems (Ahmed [47]).
Second, compared to developed markets, emerging markets are more influenced by foreign capital. For instance, South Korea tends to follow foreign investment trends (Kim and Jo [48]), which greatly affect corporate dividend policies to attract foreign institutional investors (Kang et al. [49]). In Taiwan, stocks with high foreign ownership outperform those with low foreign ownership (Huang and Shiu [50]). In India, there is a positive relationship between foreign direct investment, foreign institutional investment, and stock market indices (Nagpal [51]).
Third, geopolitical and political risks are prevalent in this group. The risk of war exists in several regions, including South Korea, North Korea, Taiwan, and China. Conflicts also frequently occur in the Middle East and South America. Furthermore, significant fluctuations in market dynamics were observed during events such as the 2011 Egyptian Revolution and the 2013 military coup in Egypt.
Frontier markets often exhibit unique characteristics compared to developed and emerging markets, making it challenging to identify similar dynamics within the group. These distinctions arise due to the following factors:
First, frontier markets tend to experience significant impacts from crises, resulting in high levels of risk compared to other markets. Although it is difficult to pinpoint specific periods of rapid fluctuations beyond the 2008 financial crisis and the 2020 COVID-19 pandemic, it is worth noting that Iceland was greatly affected by the crisis (Reuters, “Iceland’s biggest taken over and all shares halted”).
Second, frontier markets are heavily influenced by specific industrial and regional issues. The key factors that affect their stock markets and subsequent dynamic fluctuations vary widely, largely due to their reliance on domestic markets. (Meziani [52]).
6. Discussion and Concluding Remarks
We investigated the market efficiency of each stock market using global stock market index data. To this end, we used the MF-DFA methodology and conducted static and rolling window analyses. We analyzed the results by categorizing them under developed, emerging, and frontier groups.
According to the static analysis results, Switzerland, the UK, and the US, known as financially advanced countries, have more efficient stock markets than other countries. Based on the several previous studies (Lim and Brooks [53], Ali et al. [5], and Bouoiyour et al. [54]), it has been observed that stock markets in developed countries demonstrate a higher degree of efficiency when compared to their emerging counterparts. This efficiency gap can be attributed to the incomplete nature of financial systems in emerging economies (Mookerjee and Yu [55], Islam et al. [56]), in contrast to the more advanced counterparts. On the other hand, advanced countries have relatively efficient stock markets, which can be explained by factors such as robust economic growth rates, larger market sizes, and the presence of open financial markets (Zunino et al. [57], Tongurai and Vithessonthi [58]). In order to minimize the disparity in stock market efficiency between developed and emerging countries, scholars have put forth proposals for laws pertaining to foreign investment, financial liberalization, and de-politicization (Vo [59], Rejeb and Boughrara [60], Goodell et al. [61]).
The notable findings of the rolling window analysis are as follows: First, markets cannot be insulated from global issues such as the 2008 financial crisis and the COVID-19 pandemic. These issues dominate, particularly in the developed country group, including the United States and the United Kingdom. Asian countries in this group, such as Japan, are impacted differently due to their strong domestic markets. Similar dynamics are also found in countries that are part of international trade blocs, such as NAFTA, the EU, and the Commonwealth. Second, emerging markets are vulnerable to foreign capital movement, and financial policies related to foreign investment heavily influence them. This is evident in the cases of China and Egypt, for example. Emerging markets also tend to follow foreign investment trends, as observed in South Korea, Taiwan, and India. Additionally, geopolitical risk is a critical issue, including the risk of war in South Korea, North Korea, Taiwan, and China, as well as frequent conflicts in the Middle East, South America, and Egypt. Third, distinguishing similar dynamics within the frontier group is difficult due to the varying intensive domestic market issues. Some frontier markets have been significantly affected by global issues, as was the case in Iceland during the 2008 financial crisis. Therefore, investment in frontier group markets should be approached with careful consideration compared to the other groups.
These findings have important implications for international investors and policymakers. First, international investors can establish investment strategies based on the degree of efficiency of individual stock markets. In other words, data on long-term memory and the degree of persistence over time can be utilized by global investors to gain an edge in the market and achieve above-average returns. However, the efficient nature of stock markets implies that consistently outperforming it through individual stock selection or timing is challenging. Therefore, investors may opt for a passive investment approach, such as investing in index funds that strive to match the market’s performance. Second, while the efficient market hypothesis assumes that the market is self-regulating and does not require government intervention, discovering market inefficiencies may require more regulations to safeguard investors and preserve market stability. Consequently, policymakers in countries with significant variations in market efficiency should consider implementing new regulations to enhance market efficiency.
As an additional research topic, we propose to analyze the market efficiency of the three groups of countries from a behavioral finance perspective. The efficient market hypothesis assumes that all investors have access to the same information and make rational decisions based on this information. However, behavioral finance research has shown that investors often make irrational decisions based on emotions, biases, and heuristics. Therefore, the proposed research can help inform our understanding of how individual markets function and investors make decisions. Furthermore, we suggest employing clustering analysis for time series data. This approach can help identify distinct patterns in movements within each country or confirm the similarity of these patterns through cluster analysis. By conducting such future studies, we can enhance the robustness of our findings and gain further insights from this research.
Author Contributions
Conceptualization, S.-Y.C.; methodology, S.-Y.C.; software, S.-Y.C.; formal analysis, M.-J.L. and S.-Y.C.; investigation, M.-J.L. and S.-Y.C.; writing—original draft, M.-J.L. and S.-Y.C.; writing—review and editing, M.-J.L. and S.-Y.C.; funding acquisition S.-Y.C. All authors have read and agreed to the published version of the manuscript.
Funding
The work of S.-Y. Choi was supported by the National Research Foundation of Korea (NRF) grant funded by the Korean government (MSIT) (No. 2021R1F1A1046138).
Data Availability Statement
The data that support the findings of this study are available from the corresponding author upon reasonable request.
Acknowledgments
We thank the anonymous reviewers; their comments and suggestions helped improve and refine this manuscript.
Conflicts of Interest
The authors declare no conflict of interest.
Appendix A

Table A1.
The stock index for each country.
Table A1.
The stock index for each country.
| Developed | Emerging | Frontier | |||
|---|---|---|---|---|---|
| Country | Index | Country | Index | Country | Index |
| Austria | Austrian Traded Index | Brazil | IBOVESPA | Bahrain | Bahrain BHSEASI |
| Australia | S&P/ASX 200 | Chile | S&P/CLX | Estoina | Tallinn SE General |
| Belgium | BEL 20 | China | CSI 300 | Croatia | CROBEX |
| Canda | S&P/TSX | Czech Republic | PX | Iceland | OMX Iceland All-Share |
| Switzerland | SMI | Egypt | EGX 30 | Jordan | MSCI JORDAN US |
| Germany | DAX | Greece | FTSE Athex Large Cap | Kenya | Kenya NSE 20 |
| Denmark | OMX Copenhagen 25 | Hungary | BUMIX | Lituania | Vilnius SE General |
| Spain | IBEX 35 | Indonesia | IDX | Morocco | Morocco MASI |
| Finland | OMX Helsinki 25 | India | NIFTY 50 | Mauritius | Semdex |
| France | CAC 40 | Korea | KOSPI | Oman | Oman MSM |
| United Kingdom | UK 100 | Mexico | S&P/BMV IPC | Romania | BET |
| Hong Kong | Hang Senng | Malaysia | KLCI | Serbia | Belex 15 |
| Ireland | ISEQ 20 | Peru | S&P Lima General | Slovenia | SLOVENIAN BLUE CHIP |
| Israel | TA 125 | Philippines | PSEi | Tunisia | Tunindex |
| Italy | Italy 40 | Poland | WIG 20 | Vietnam | VNI |
| Japan | Nikkei 225 | Qatar | QE General | ||
| Netherlands | AEX | Saudi Arabia | Tadawul All Share | ||
| Norway | OBX Price | Thailand | SET | ||
| New Zealand | S&P/NZX 50 | Turkey | BIST 100 | ||
| Portugal | PSI | Taiwan | TSEC Taiwan 50 | ||
| Sweden | OMX Stockholm 30 | United Arab Emirates | DFM General | ||
| Singapore | FTSE Singapore | South Africa | iShares MSCI South Africa | ||
| United States | S&P 500 | ||||
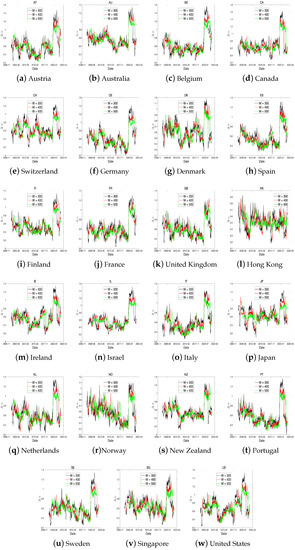
Figure A1.
The dynamics of using a rolling window for developed countries with the window length (300, 400, 500 days).
Figure A1.
The dynamics of using a rolling window for developed countries with the window length (300, 400, 500 days).
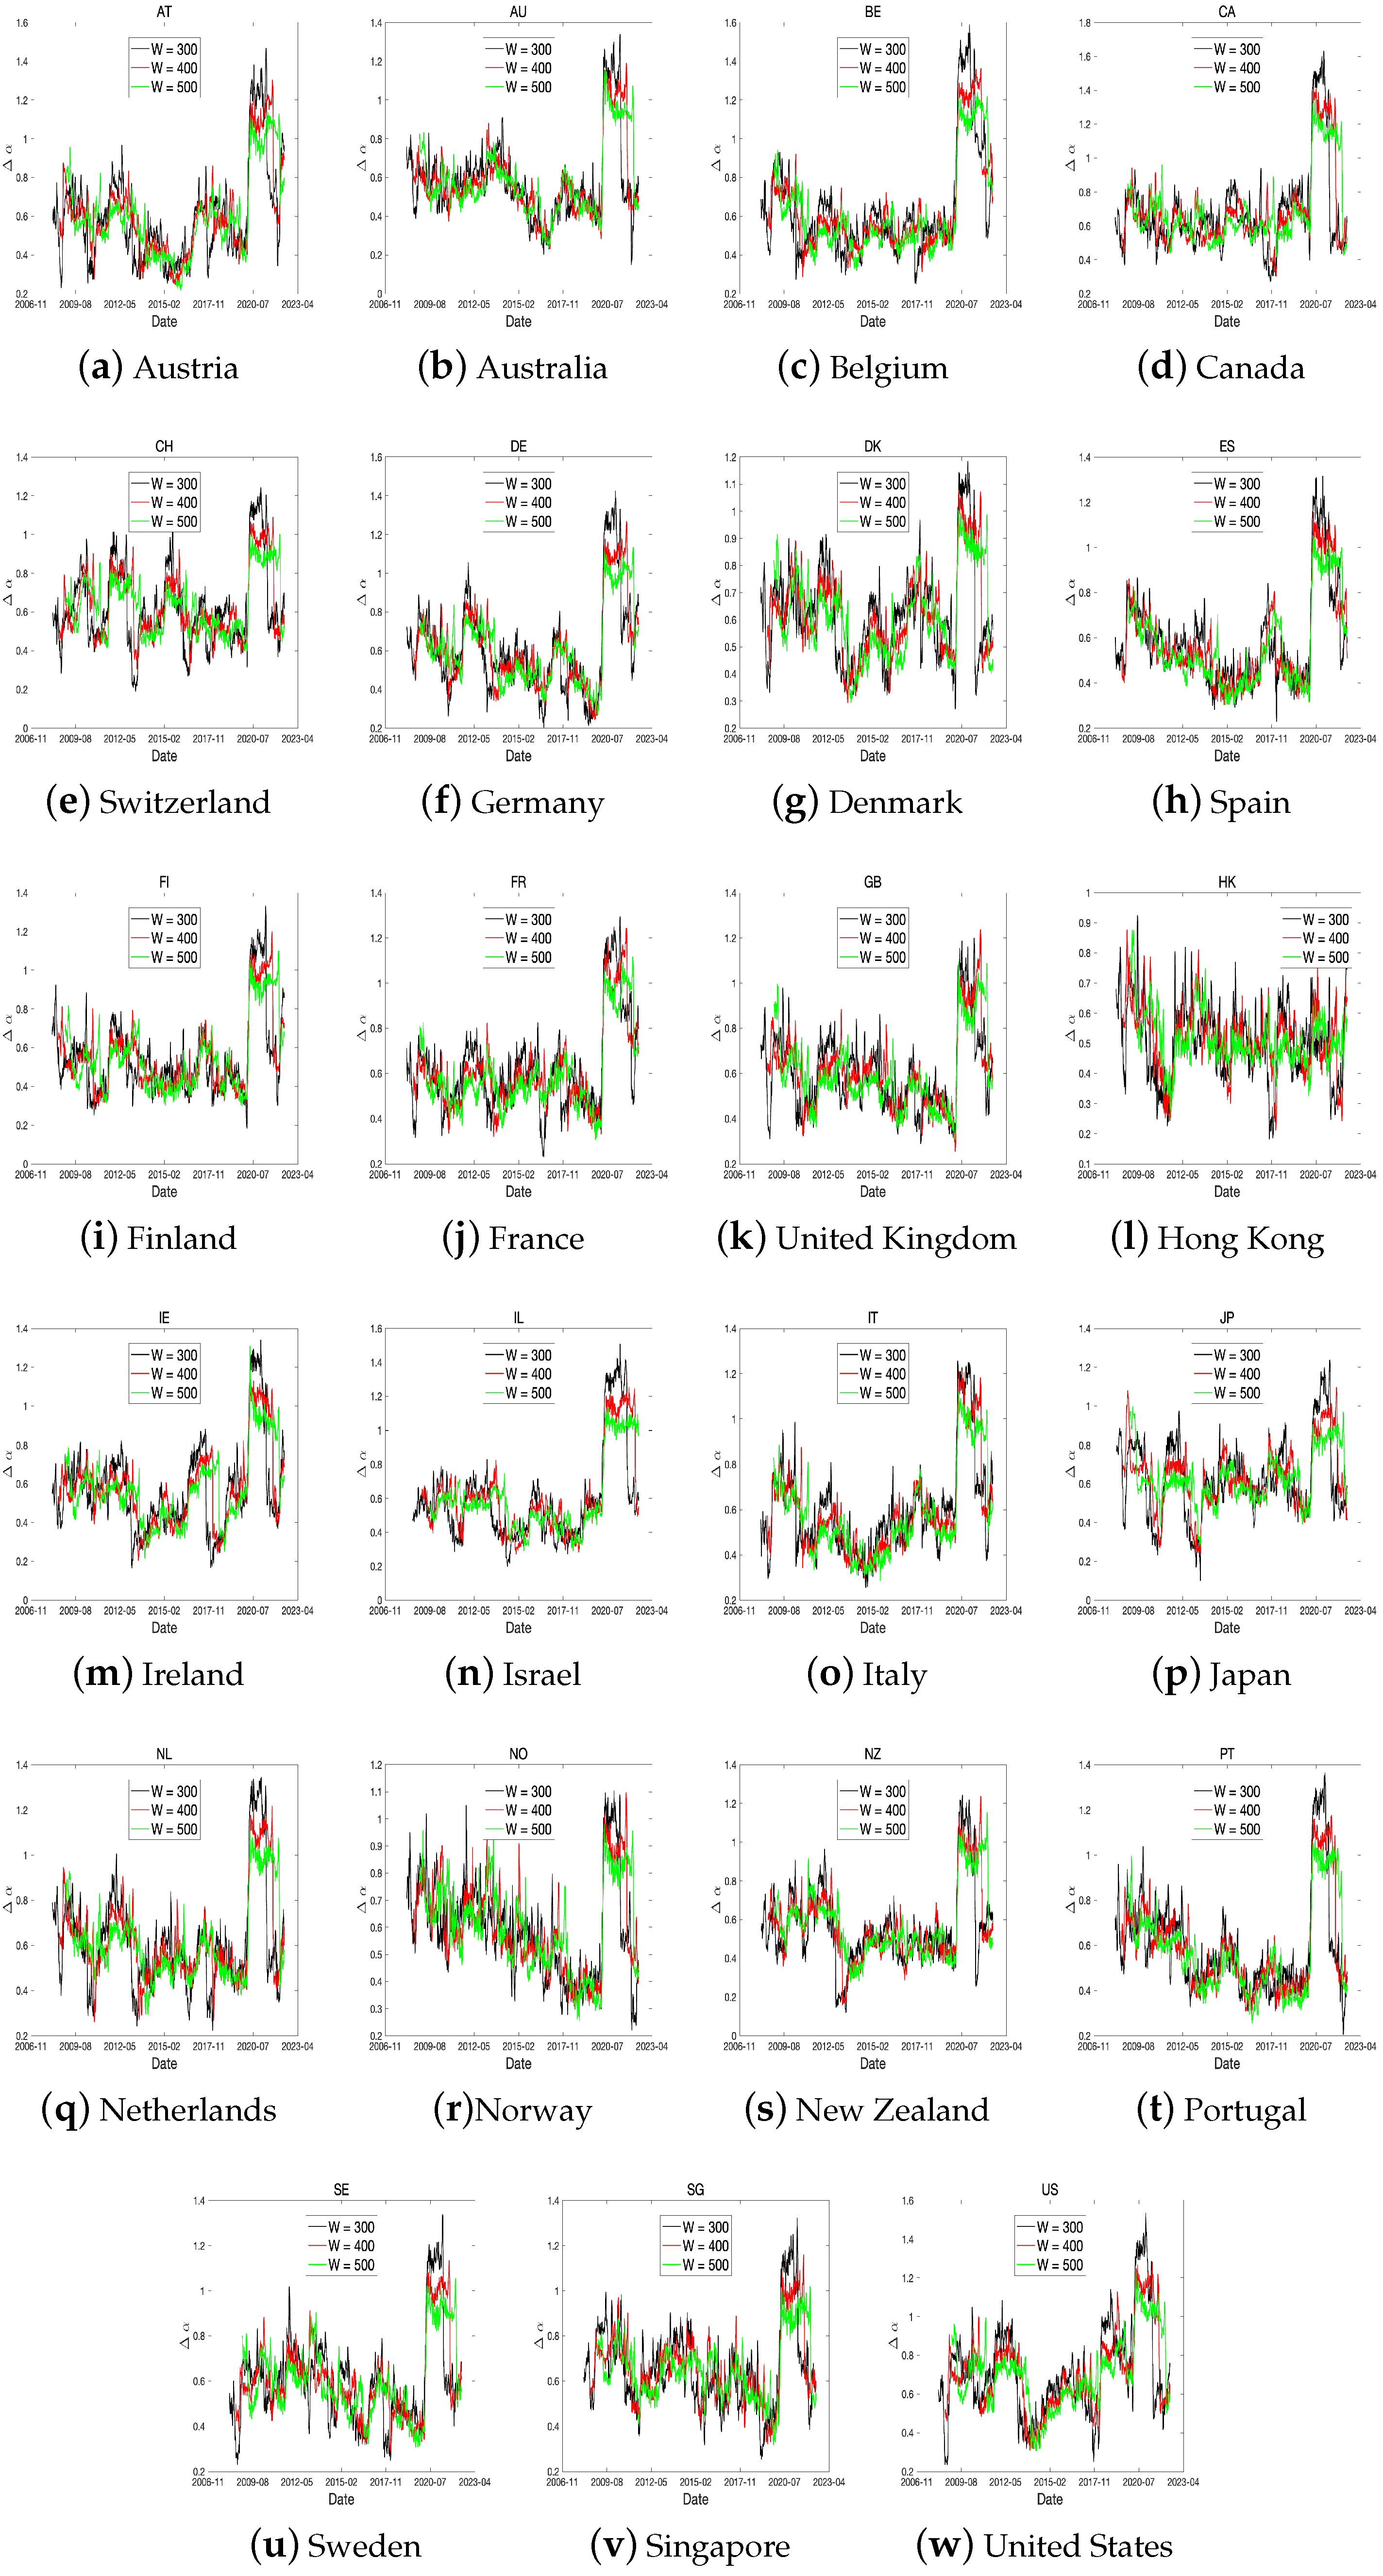
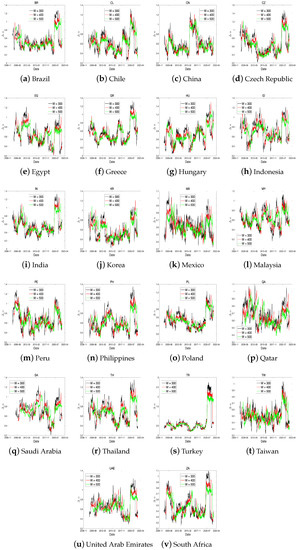
Figure A2.
The dynamics of using a rolling window for emerging countries with the window length (300, 400, 500 days).
Figure A2.
The dynamics of using a rolling window for emerging countries with the window length (300, 400, 500 days).
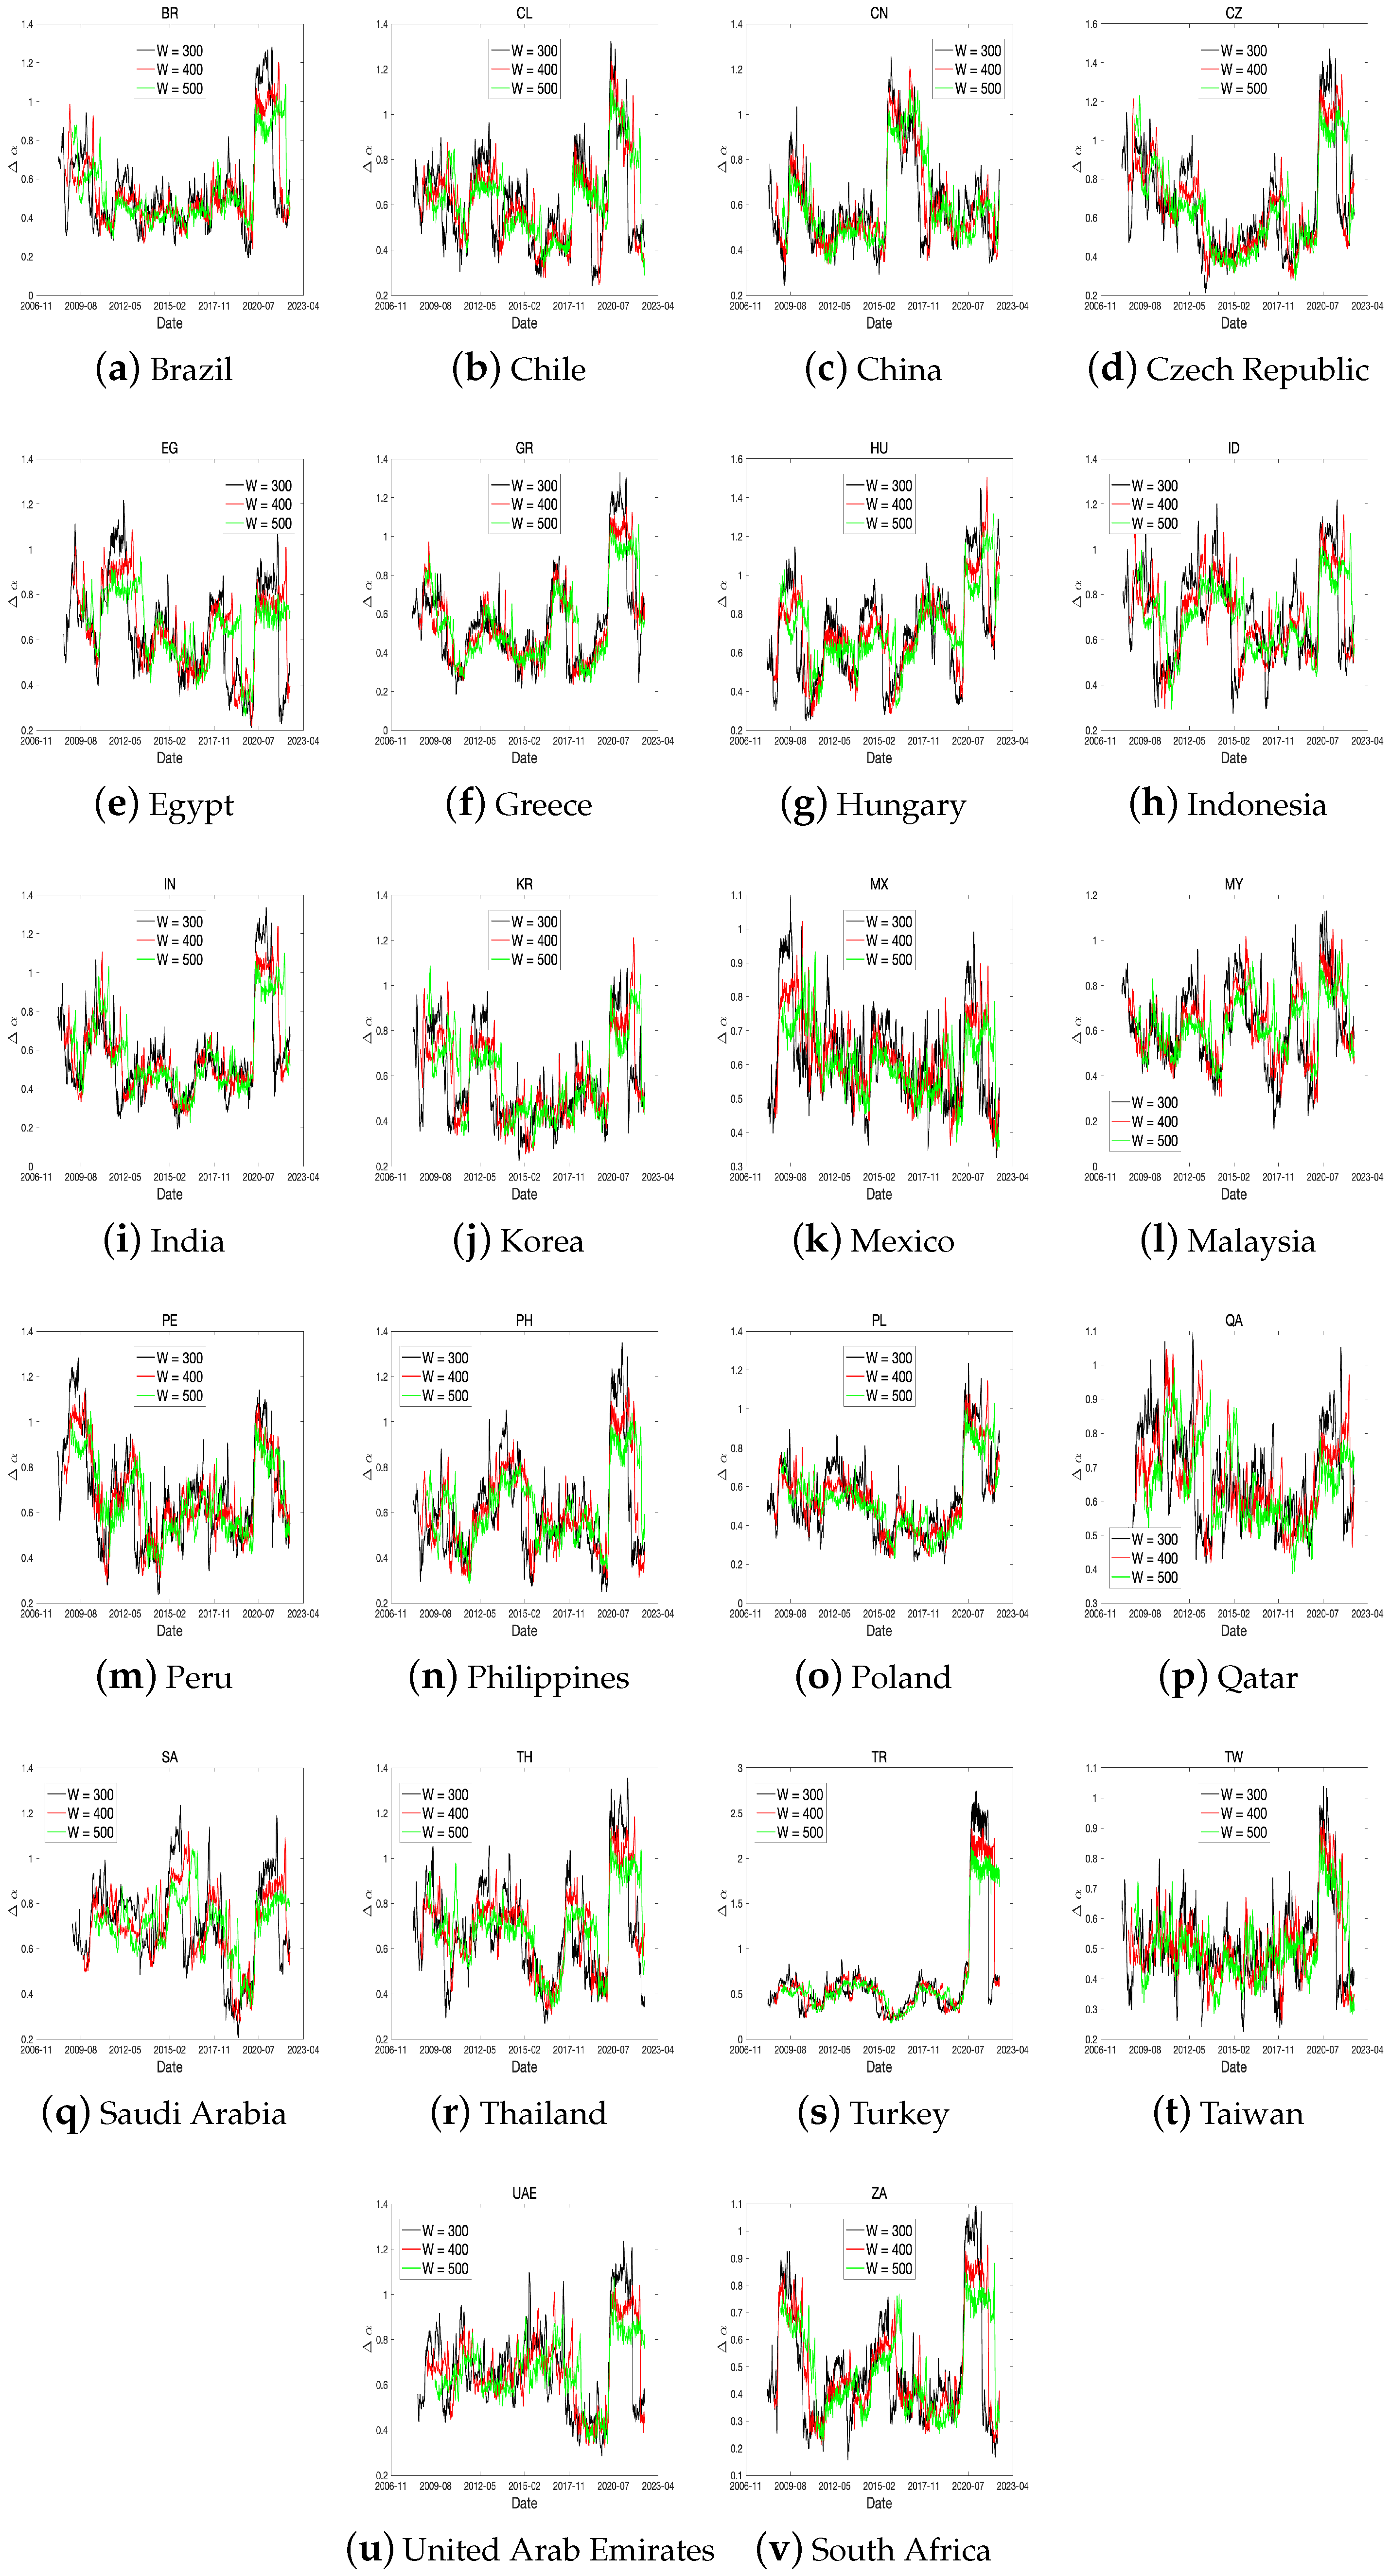
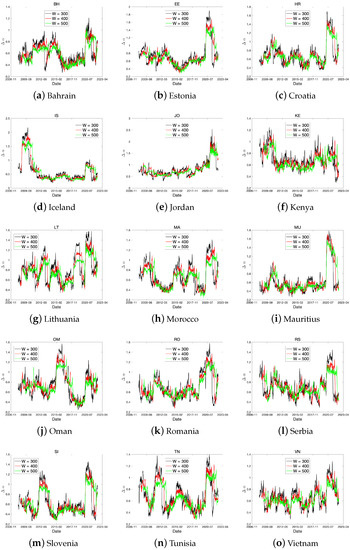
Figure A3.
The dynamics of using a rolling window for frontier countries with the window length (300, 400, 500 days).
Figure A3.
The dynamics of using a rolling window for frontier countries with the window length (300, 400, 500 days).
References
- Horta, P.; Lagoa, S.; Martins, L. The impact of the 2008 and 2010 financial crises on the Hurst exponents of international stock markets: Implications for efficiency and contagion. Int. Rev. Financ. Anal. 2014, 35, 140–153. [Google Scholar] [CrossRef]
- Hull, M.; McGroarty, F. Do emerging markets become more efficient as they develop? Long memory persistence in equity indices. Emerg. Mark. Rev. 2014, 18, 45–61. [Google Scholar] [CrossRef]
- Rizvi, S.A.R.; Dewandaru, G.; Bacha, O.I.; Masih, M. An analysis of stock market efficiency: Developed vs. Islamic stock markets using MF-DFA. Phys. A Stat. Mech. Its Appl. 2014, 407, 86–99. [Google Scholar] [CrossRef]
- Charfeddine, L.; Khediri, K.B. Time varying market efficiency of the GCC stock markets. Phys. A Stat. Mech. Its Appl. 2016, 444, 487–504. [Google Scholar] [CrossRef]
- Ali, S.; Shahzad, S.J.H.; Raza, N.; Al-Yahyaee, K.H. Stock market efficiency: A comparative analysis of Islamic and conventional stock markets. Phys. A Stat. Mech. Its Appl. 2018, 503, 139–153. [Google Scholar] [CrossRef]
- Miloş, L.R.; Haţiegan, C.; Miloş, M.C.; Barna, F.M.; Boțoc, C. Multifractal detrended fluctuation analysis (MF-DFA) of stock market indexes. Empirical evidence from seven central and eastern European markets. Sustainability 2020, 12, 535. [Google Scholar] [CrossRef]
- Choi, S.Y. Analysis of stock market efficiency during crisis periods in the US stock market: Differences between the global financial crisis and COVID-19 pandemic. Phys. A Stat. Mech. Its Appl. 2021, 574, 125988. [Google Scholar] [CrossRef]
- Yin, T.; Wang, Y. Market efficiency and nonlinear analysis of soybean futures. Sustainability 2021, 13, 518. [Google Scholar] [CrossRef]
- Pak, D.; Choi, S.Y. Economic Policy Uncertainty and Sectoral Trading Volume in the US Stock Market: Evidence from the COVID-19 Crisis. Complexity 2022, 2022, 2248731. [Google Scholar] [CrossRef]
- Gaio, L.E.; Stefanelli, N.O.; Júnior, T.P.; Bonacim, C.A.G.; Gatsios, R.C. The impact of the Russia-Ukraine conflict on market efficiency: Evidence for the developed stock market. Financ. Res. Lett. 2022, 50, 103302. [Google Scholar] [CrossRef]
- Caraiani, P. Evidence of multifractality from emerging European stock markets. PLoS ONE 2012, 7, e40693. [Google Scholar] [CrossRef] [PubMed]
- Arshad, S.; Rizvi, S.A.R.; Ghani, G.M.; Duasa, J. Investigating stock market efficiency: A look at OIC member countries. Res. Int. Bus. Financ. 2016, 36, 402–413. [Google Scholar] [CrossRef]
- Aslam, F.; Ferreira, P.; Mohti, W. Investigating efficiency of frontier stock markets using multifractal detrended fluctuation analysis. Int. J. Emerg. Mark. 2021; ahead of print. [Google Scholar]
- Nargunam, R.; Lahiri, A. Persistence in daily returns of stocks with highest market capitalization in the Indian market. Digit. Financ. 2022, 4, 341–374. [Google Scholar] [CrossRef]
- Lee, M.; Song, J.W.; Kim, S.; Chang, W. Asymmetric market efficiency using the index-based asymmetric-MFDFA. Phys. A Stat. Mech. Its Appl. 2018, 512, 1278–1294. [Google Scholar] [CrossRef]
- Aslam, F.; Latif, S.; Ferreira, P. Investigating long-range dependence of emerging Asian stock markets using multifractal detrended fluctuation analysis. Symmetry 2020, 12, 1157. [Google Scholar] [CrossRef]
- Aslam, F.; Ferreira, P.; Ali, H.; Kauser, S. Herding behavior during the COVID-19 pandemic: A comparison between Asian and European stock markets based on intraday multifractality. Eurasian Econ. Rev. 2021, 12, 333–359. [Google Scholar] [CrossRef]
- Mensi, W.; Yousaf, I.; Vo, X.V.; Kang, S.H. Multifractality during upside/downside trends in the MENA stock markets: The effects of the global financial crisis, oil crash and COVID-19 pandemic. Int. J. Emerg. Mark. 2022; ahead of print. [Google Scholar]
- Saâdaoui, F. Skewed multifractal scaling of stock markets during the COVID-19 pandemic. Chaos Solitons Fractals 2023, 170, 113372. [Google Scholar] [CrossRef]
- Lim, K.P. Ranking market efficiency for stock markets: A nonlinear perspective. Phys. A Stat. Mech. Its Appl. 2007, 376, 445–454. [Google Scholar] [CrossRef]
- Anagnostidis, P.; Varsakelis, C.; Emmanouilides, C.J. Has the 2008 financial crisis affected stock market efficiency? The case of Eurozone. Phys. A Stat. Mech. Its Appl. 2016, 447, 116–128. [Google Scholar] [CrossRef]
- Rizvi, S.A.R.; Arshad, S. Investigating the efficiency of East Asian stock markets through booms and busts. Pac. Sci. Rev. 2014, 16, 275–279. [Google Scholar] [CrossRef]
- Smith, G. The changing and relative efficiency of European emerging stock markets. Eur. J. Financ. 2012, 18, 689–708. [Google Scholar] [CrossRef]
- Sensoy, A. Generalized Hurst exponent approach to efficiency in MENA markets. Phys. A Stat. Mech. Its Appl. 2013, 392, 5019–5026. [Google Scholar] [CrossRef]
- Kantelhardt, J.W.; Zschiegner, S.A.; Koscielny-Bunde, E.; Havlin, S.; Bunde, A.; Stanley, H.E. Multifractal detrended fluctuation analysis of nonstationary time series. Phys. A Stat. Mech. Its Appl. 2002, 316, 87–114. [Google Scholar] [CrossRef]
- Wang, F.; Ye, X.; Wu, C. Multifractal characteristics analysis of crude oil futures prices fluctuation in China. Phys. A Stat. Mech. Its Appl. 2019, 533, 122021. [Google Scholar] [CrossRef]
- Jiang, Z.Q.; Chen, W.; Zhou, W.X. Detrended fluctuation analysis of intertrade durations. Phys. A Stat. Mech. Its Appl. 2009, 388, 433–440. [Google Scholar] [CrossRef]
- Qian, X.Y.; Gu, G.F.; Zhou, W.X. Modified detrended fluctuation analysis based on empirical mode decomposition for the characterization of anti-persistent processes. Phys. A Stat. Mech. Its Appl. 2011, 390, 4388–4395. [Google Scholar] [CrossRef]
- Han, C.; Wang, Y.; Xu, Y. Efficiency and multifractality analysis of the Chinese stock market: Evidence from stock indices before and after the 2015 stock market crash. Sustainability 2019, 11, 1699. [Google Scholar] [CrossRef]
- Lashermes, B.; Abry, P.; Chainais, P. New insights into the estimation of scaling exponents. Int. J. Wavelets Multiresolut. Inf. Process. 2004, 2, 497–523. [Google Scholar] [CrossRef]
- Ning, Y.; Wang, Y.; Su, C.w. How did China’s foreign exchange reform affect the efficiency of foreign exchange market? Phys. A Stat. Mech. Its Appl. 2017, 483, 219–226. [Google Scholar] [CrossRef]
- Calvet, L.; Fisher, A. Multifractality in asset returns: Theory and evidence. Rev. Econ. Stat. 2002, 84, 381–406. [Google Scholar] [CrossRef]
- Alvarez-Ramirez, J.; Cisneros, M.; Ibarra-Valdez, C.; Soriano, A. Multifractal Hurst analysis of crude oil prices. Phys. A Stat. Mech. Its Appl. 2002, 313, 651–670. [Google Scholar] [CrossRef]
- Wang, Y.; Wu, C.; Pan, Z. Multifractal detrending moving average analysis on the US Dollar exchange rates. Phys. A Stat. Mech. Its Appl. 2011, 390, 3512–3523. [Google Scholar] [CrossRef]
- da Silva Filho, A.C.; Maganini, N.D.; de Almeida, E.F. Multifractal analysis of Bitcoin market. Phys. A Stat. Mech. Its Appl. 2018, 512, 954–967. [Google Scholar] [CrossRef]
- Ruan, Q.; Zhang, S.; Lv, D.; Lu, X. Financial liberalization and stock market cross-correlation: MF-DCCA analysis based on Shanghai-Hong Kong Stock Connect. Phys. A Stat. Mech. Its Appl. 2018, 491, 779–791. [Google Scholar] [CrossRef]
- Zhou, W.; Dang, Y.; Gu, R. Efficiency and multifractality analysis of CSI 300 based on multifractal detrending moving average algorithm. Phys. A Stat. Mech. Its Appl. 2013, 392, 1429–1438. [Google Scholar] [CrossRef]
- Gao, X.L.; Shao, Y.H.; Yang, Y.H.; Zhou, W.X. Do the global grain spot markets exhibit multifractal nature? Chaos Solitons Fractals 2022, 164, 112663. [Google Scholar] [CrossRef]
- Wang, Y.; Wei, Y.; Wu, C. Analysis of the efficiency and multifractality of gold markets based on multifractal detrended fluctuation analysis. Phys. A Stat. Mech. Its Appl. 2011, 390, 817–827. [Google Scholar] [CrossRef]
- Sensoy, A.; Tabak, B.M. Time-varying long term memory in the European Union stock markets. Phys. A Stat. Mech. Its Appl. 2015, 436, 147–158. [Google Scholar] [CrossRef]
- Gajardo, G.; Kristjanpoller, W. Asymmetric multifractal cross-correlations and time varying features between Latin-American stock market indices and crude oil market. Chaos Solitons Fractals 2017, 104, 121–128. [Google Scholar] [CrossRef]
- Aloui, C.; Shahzad, S.J.H.; Jammazi, R. Dynamic efficiency of European credit sectors: A rolling-window multifractal detrended fluctuation analysis. Phys. A Stat. Mech. Its Appl. 2018, 506, 337–349. [Google Scholar] [CrossRef]
- Fukuda, S.i. Abenomics: Why was it so successful in changing market expectations? J. Jpn. Int. Econ. 2015, 37, 1–20. [Google Scholar] [CrossRef]
- Kawamoto, T.; Nakazawa, T.; Kishaba, Y.; Matsumura, K.; Nakajima, J. Estimating the macroeconomic effects of Japan’s expansionary monetary policy under Quantitative and Qualitative Monetary Easing during 2013–2020. Econ. Anal. Policy 2023, 78, 208–224. [Google Scholar] [CrossRef]
- Hu, G.X.; Pan, J.; Wang, J. Chinese Capital Market: An Empirical Overview; NBER: Cambridge, MA, USA, 2018. [Google Scholar]
- Petry, J. Same same, but different: Varieties of capital markets, Chinese state capitalism and the global financial order. Compet. Change 2021, 25, 605–630. [Google Scholar] [CrossRef]
- Ahmed, W.M. Asymmetric impact of exchange rate changes on stock returns: Evidence of two de facto regimes. Rev. Account. Financ. 2020, 19, 147–173. [Google Scholar] [CrossRef]
- Kim, Y.; Jo, G.J. The impact of foreign investors on the stock price of Korean enterprises during the global financial crisis. Sustainability 2019, 11, 1576. [Google Scholar] [CrossRef]
- Kang, S.; Sul, W.; Kim, S. Impact of foreign institutional investors on dividend policy in Korea: A stock market perspective. J. Financ. Manag. Anal. 2010, 23, 10–26. [Google Scholar]
- Huang, R.D.; Shiu, C.Y. Local effects of foreign ownership in an emerging financial market: Evidence from qualified foreign institutional investors in Taiwan. Financ. Manag. 2009, 38, 567–602. [Google Scholar] [CrossRef]
- Nagpal, P. An empirical study on impact of flow of FDI & FII on Indian stock market. SSRN 2016, 3, 19–25. [Google Scholar]
- Meziani, A.S. Frontier Markets: Understanding the Risks. J. Beta Invest. Strateg. 2020, 11, 43–56. [Google Scholar] [CrossRef]
- Lim, K.P.; Brooks, R.D. The Evolving and Relative Efficiencies of Stock Markets: Empirical Evidence from Rolling Bicorrelation Test Statistics; SSRN: Rochester, NY, USA, 2006. [Google Scholar]
- Bouoiyour, J.; Selmi, R.; Wohar, M.E. Are Islamic stock markets efficient? A multifractal detrended fluctuation analysis. Financ. Res. Lett. 2018, 26, 100–105. [Google Scholar] [CrossRef]
- Mookerjee, R.; Yu, Q. An empirical analysis of the equity markets in China. Rev. Financ. Econ. 1999, 8, 41–60. [Google Scholar] [CrossRef]
- Islam, S.M.; Watanapalachaikul, S.; Clark, C. Some tests of the efficiency of the emerging financial markets: An analysis of the Thai stock market. J. Emerg. Mark. Financ. 2007, 6, 291–302. [Google Scholar] [CrossRef]
- Zunino, L.; Bariviera, A.F.; Guercio, M.B.; Martinez, L.B.; Rosso, O.A. On the efficiency of sovereign bond markets. Phys. A Stat. Mech. Its Appl. 2012, 391, 4342–4349. [Google Scholar] [CrossRef]
- Tongurai, J.; Vithessonthi, C. Financial Openness and Financial Market Development. J. Multinatl. Financ. Manag. 2023, 67, 100782. [Google Scholar] [CrossRef]
- Vo, X.V. Do foreign investors promote stock price efficiency in emerging markets? Int. Rev. Financ. 2019, 19, 223–235. [Google Scholar] [CrossRef]
- Rejeb, A.B.; Boughrara, A. Financial liberalization and stock markets efficiency: New evidence from emerging economies. Emerg. Mark. Rev. 2013, 17, 186–208. [Google Scholar] [CrossRef]
- Goodell, J.W.; Li, M.; Liu, D.; Peng, H. Depoliticization and market efficiency: Evidence from China. Financ. Res. Lett. 2022, 47, 102712. [Google Scholar] [CrossRef]
Disclaimer/Publisher’s Note: The statements, opinions and data contained in all publications are solely those of the individual author(s) and contributor(s) and not of MDPI and/or the editor(s). MDPI and/or the editor(s) disclaim responsibility for any injury to people or property resulting from any ideas, methods, instructions or products referred to in the content. |
© 2023 by the authors. Licensee MDPI, Basel, Switzerland. This article is an open access article distributed under the terms and conditions of the Creative Commons Attribution (CC BY) license (https://creativecommons.org/licenses/by/4.0/).

