Article

Using Fractal Theory to Study the Influence of Movable Oil on the Pore Structure of Different Types of Shale: A Case Study of the Fengcheng Formation Shale in Well X of Mahu Sag, Junggar Basin, China

1
Institute of Energy, Peking University, Beijing 100871, China
2
Petro China Xinjiang Oilfield Company, Karamay 834000, China
*
Author to whom correspondence should be addressed.
Fractal Fract. 2024, 8(4), 242; https://doi.org/10.3390/fractalfract8040242
Submission received: 14 March 2024 / Revised: 2 April 2024 / Accepted: 19 April 2024 / Published: 20 April 2024
(This article belongs to the Special Issue Flow and Transport in Fractal Models of Rock Mechanics)

Abstract

:
This study investigated the influence of movable oil on the pore structure of various shale types, analyzing 19 shale samples from Well X in the Mahu Sag of the Junggar Basin. Initially, X-ray diffraction (XRD) analysis classified the shale samples. Subsequently, the geochemical properties and pore structures of the samples, both pre and post oil Soxhlet extraction, were comparatively analyzed through Total Organic Carbon (TOC) content measurement, Rock-Eval pyrolysis, and nitrogen adsorption experiments. Additionally, fractal theory quantitatively described the impact of movable oil on the pore structure of different shale types. Results indicated higher movable oil content in siliceous shale compared to calcareous shale. Oil extraction led to a significant increase in specific surface area and pore volume in all samples, particularly in siliceous shale. Calcareous shale predominantly displays H2–H3 type hysteresis loops, indicating a uniform pore structure with ink-bottle-shaped pores. Conversely, siliceous shale exhibited diverse hysteresis loops, reflecting its complex pore structure. The fractal dimension in calcareous shale correlated primarily with pore structure, exhibiting no significant correlation with TOC content before or after oil extraction. Conversely, the fractal dimension changes in siliceous shale samples do not have a clear correlation with either TOC content or pore structure, suggesting variations may result from both TOC and pore structure.

1. Introduction

Unconventional oil and gas resources hold significant strategic importance within the global energy landscape. As research into shale gas advances and exploration and development activities rapidly progress, shale oil has emerged as a topic of widespread interest and importance in recent years. Currently, the industrial-scale production of shale oil has been successfully achieved in various geological basins worldwide, notably in the Upper Paleozoic and Mesozoic basins in the United States (e.g., Bakken Basin, Permian Basin, Eagle Ford Basin) and the Mesozoic–Cenozoic basins in China (e.g., Songliao Basin, Bohai Bay Basin, Junggar Basin) [1,2,3,4]. Shale oil, herein referred to as petroleum, that has been generated and is still contained within micro- and nano-scale reservoir spaces within organic-rich mud shale formations, presents a complex reservoir system characterized by diverse pore types. These pores include interparticle mineral pores, intraparticle mineral pores, organic-matter (OM) pores, and microfractures [4,5]. Consequently, the development and characterization of shale pores stand as pivotal factors influencing the distribution and retention of shale oil within reservoirs.
The development of pores within shale formations is predominantly governed by multiple factors, including total organic carbon (TOC) content, maturity, and the composition of minerals [6,7]. The organic matter fosters hydrocarbon generation, thereby inducing a notable augmentation in organic matter pores and consequent enhancing shale reservoir porosity [8]. In the case of early-mature or mature lacustrine shales, the presence of residual bitumen and hydrocarbons within pores significantly influences pore structure [9,10]. Mineral composition also plays a crucial role, with quartz exhibiting resistance to compaction and preserving intergranular pores, while minerals such as feldspar and calcite are prone to dissolution, resulting in the formation of secondary pores [11,12,13]. Many techniques are currently available for quantitatively or qualitatively characterizing shale pore structure, such as Low-temperature N2 adsorption (LTNA), High-pressure mercury porosimetry (HPMP), nuclear magnetic resonance (NMR). Their experimental data can be used to calculate pore structure parameters such as specific surface area, pore volume [14,15,16,17]. Given the complex and self-similar nature of shale reservoirs, fractal theory serves as a valuable tool for characterizing the roughness and complexity of shale pore surfaces and structures [18]. Currently, experimental data derived from nitrogen adsorption are analyzed using fractal theory, often utilizing approaches such as the Frenkel–Halsey–Hill (FHH) theory, alongside the Neimark and Wang–Li theories [17,19,20,21].
For lacustrine shale with strong heterogeneity, movable oil is the most realistic shale oil resource that can be exploitable. The Junggar Basin is an important oil-producing basin in China, with the Mahu Sag being a significant oil-rich sag in the basin. This sag stands as a critical area for augmenting shale oil production within the country [22,23]. However, the emphasis on factors affecting the mobility of shale oil varies from region to region. The main influencing factors include burial depth, external temperature and pressure, reservoir physical properties, and organic matter abundance [24]. For example, in the lower sub-member of the Shahejie Formation in the Dongying Sag, the abundance of movable shale oil resources is mainly influenced by burial depth [25]. The mobility of low-maturity shale oil in the Nenjiang Formation in the sag is affected by TOC, lithofacies and mineral composition [26]. The pore structure of the Chang 7 Member shale oil reservoir in the Ordos Yanchang Formation plays a major role in controlling fluid mobility [27]. The Fengcheng Formation in the Mahu Sag is a typical alkali lake deposit. Compared with freshwater lake basins, saline lake basins have the characteristics of mixed lithologies of terrigenous clastic and endogenous carbonates, resulting in complex reservoir physical properties [28]. To date, research on shale oil within the Fengcheng Formation has predominantly centered on shale oil reservoir typology, pore diameter distribution, and organic matter abundance [29,30,31]. However, studies exploring the impact of reservoir mineral composition on shale oil distribution remain limited, with scarce utilization of fractal theory for related investigations.
In this study, 19 core samples were meticulously selected from the oil window maturity range within the Fengcheng Formation shale of Well X located in the Mahu Sag of the Junggar Basin, China. Employing a combination of X-ray diffraction, rock pyrolysis, and low-pressure nitrogen adsorption/desorption techniques, a comprehensive comparison of Total Organic Carbon (TOC) content and pore structure was conducted on the samples before and after Soxhlet extraction. Furthermore, the analysis was augmented with an examination of the fractal dimension using the Wang-Li model, facilitating a thorough understanding of the shale’s characteristics.
The main purpose of this study are as follows: (1) to compare the movable oil content in different types of shale samples; (2) to determine the changes in pore volume and pore structure between shale samples before and after extraction, and propose a possible mechanism for the changes in pore structure; and (3) to discuss the relationship between TOC, pore structure parameters, and fractal dimension of different types of shale samples.

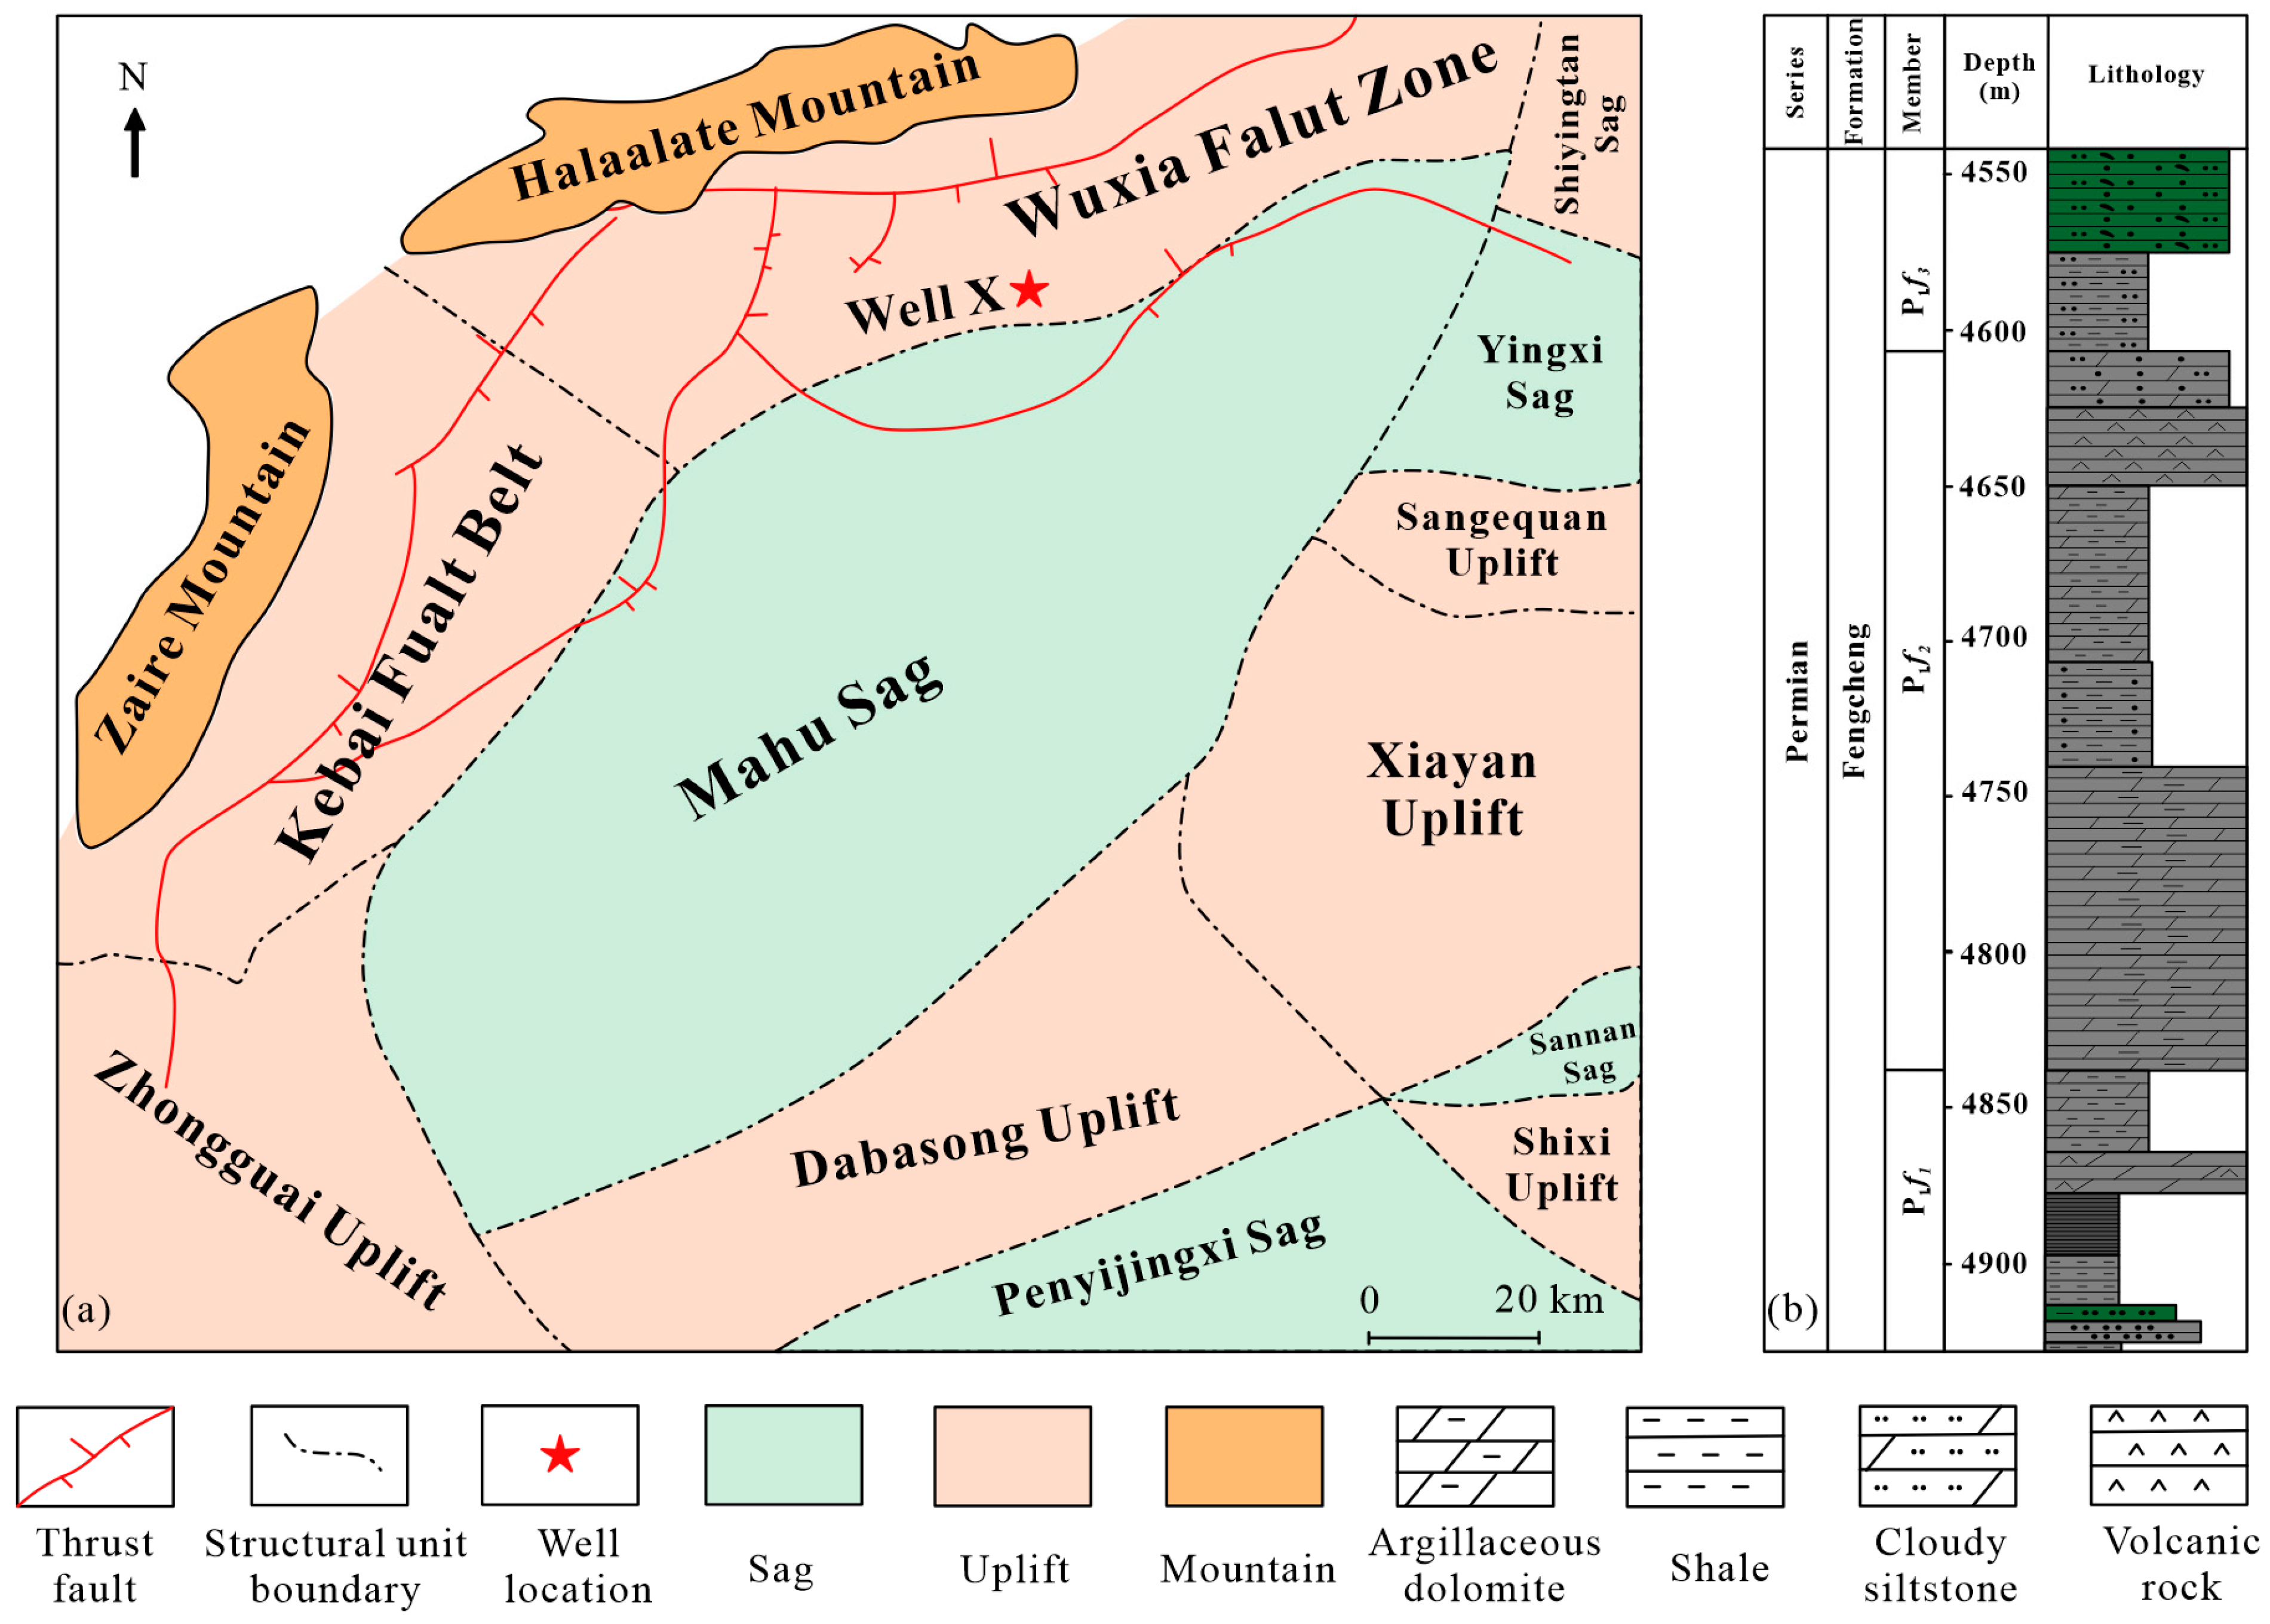
2. Geological Setting and Sample

The Mahu Sag, situated in the northwestern region of the Junggar Basin as illustrated in Figure 1a, constitutes a secondary negative structural unit within the Central Depression, spanning approximately 5000 km2. Adjacent to the western perimeter of the sag lie the Wuxia Fault Zone, Kebai Fault Belt, and Zhongguai Uplift, arranged from north to south. Conversely, the eastern sector of the depression comprises the Shiyingtan Uplift, Yingxi Sag, Sangequan Uplift, Xiayan Uplift, and Dabasong Uplift, in sequential order [32,33,34]. Previous investigations [23,34,35], alongside empirical exploration endeavors, affirm the Fengcheng Formation as a principal oil-yielding stratum within the Mahu Sag. Throughout the depositional epoch of the Fengcheng Formation, alternating seasonal humid and arid conditions prevailed, contributing to high salinity levels in the lake waters. This depositional phase epitomizes a characteristic closed semi-deep to deep alkaline lake sedimentation regime, typified by the emergence of fan-delta to lacustrine sedimentary systems [36,37].
The sedimentary thickness of the Fengcheng Formation ranges from 500 to 1580 m, and the thickness became thinner from west to east until it pinched out. Vertically, the lower Permian Fengcheng Formation can be divided into three members (in sequence from bottom to top) according to the different lithological associations and well logging characteristics, which is the lower member (P1f1), the middle member (P1f2) and the upper member (P1f3). Among these, P1f2 and P1f3 are typical source -reservoir integrated shale oil reservoirs [39]. During the early depositional period of the lower member (P1f1), there was frequent volcanic activity and intense tectonic activity. A large of amount of pyroclastic rocks and sedimentary pyroclastic rocks were deposited, followed by organic-rich mudstone, dolomite, and dolomitic rocks [35,40]. Subsequently, the salinity of the water inside the lake basin gradually increased, resulting in the deposition of alkaline minerals such as wegscheiderite and shortite mainly in the central part of the depression during the depositional of the middle member (P1f2). During the upper member’s (P1f3) depositional period, a decline in lake basin salinity was observed, concomitant with an increased influx of terrestrial clastic sediments, particularly concentrated in the vicinity of Zaire Mountain. Notably, the content and grain size of these clastic rocks exhibited a gradual upward trend [33,36,41].
Core samples utilized in this study were extracted from the Early Cretaceous Fengcheng Formation section of Well X (refer to Figure 1a). Specifically, the sampling site ranged from a depth of 4716.34 to 4851.11 m (see Figure 1b), spanning both the lower member (P1f1) and the middle member (P1f2) of the formation.

3. Experimental Methods

To achieve a systematic and comprehensive understanding of the physical properties, microstructure, and fractal characteristics of rocks, this study conducted a series of experiments. These experiments included X-ray diffraction (XRD) analysis, total organic carbon (TOC) content testing, Rock-Eval pyrolysis, Soxhlet extraction, and low-temperature N2 adsorption/desorption analysis. We divided the sample into three parts, one for XRD experiment, one for TOC content testing and Rock-Eval pyrolysis tests, and one for Soxhlet extraction and nitrogen adsorption/desorption test.

3.1. Mineral Composition Analysis

Each mineral exhibits a unique X-ray diffraction pattern in its crystal formation [42]. The shale samples were finely ground to 300 mesh and analyzed by quantitative X-ray diffraction using a Bruker AXS X-ray diffractometer. The mineral compositions and relative mineral percentages of the shale samples were determined according to the Chinese oil and gas industry standard SY/T 5163-2010 [43].

3.2. Geochemistry Analysis

The shale samples underwent crushing to a fineness of 200 mesh for Total Organic Carbon (TOC) content testing. Initially, dilute hydrochloric acid was employed to dissolve carbonates present in the rocks. Subsequently, the organic carbon within the samples was oxidized to CO2 through combustion in a high-temperature oxygen stream using a CS-230 analyzer. The TOC value was then determined using an infrared detector, following the guidelines outlined in the Chinese national standard GB/T 19145-2003 [44]. Rock-Eval pyrolysis tests were performed using a core pyrolysis analyzer according to the Chinese national standard GB/T 18602-2012 [45], and the geochemical parameters obtained include the free hydrocarbon (S1), the cracking hydrocarbon of kerogen (S2), the thermal maturity parameter (Tmax) and the hydrogen index (HI).

3.3. Oil Extraction

The original shale samples were finely crushed to a particle size of 60–70 mesh and subsequently dried at 105 °C. Chloroform was utilized as a solvent in the Soxhlet extraction process to extract hydrocarbons from the shale samples. The extraction procedure was carried out at a temperature of 70 °C for a duration of 48 h to maximize the removal of movable oil from the shale samples. Upon completion of the extraction experiment, the shale sample particles devoid of movable oil were recovered and subjected to re-drying at 105 °C. Subsequently, Total Organic Carbon (TOC) experiments were conducted anew on these extracted samples.

3.4. N2 Adsorption/Desorption

The samples, both pre- and post-oil extraction, were selected for further analysis. They were subjected to vacuum conditions at pressures of 30 mmHg, maintained at temperatures of 60 °C and 100 °C, and subsequently dried at 100 °C for a duration of 24 h to eliminate excess water and impurity gases. Using the low-temperature nitrogen adsorption equipment ASAP2420, nitrogen adsorption and desorption measurements were conducted at critical temperatures. Experimental data were processed according to the standards outlined in SY/T 6154-1995 [46], including the acquisition of low-temperature nitrogen adsorption and desorption curves, as well as pore size distribution before and after extraction. In this study, the Brunauer–Emmett–Teller (BET) model was selected for the determination of specific surface area (SSA) [47], while the Barrett–Joyner–Halenda (BJH) model was employed for the calculation of pore volume and average pore size [47,48].

3.5. Fractal Analysis

Fractal analysis serves as a valuable tool for characterizing the geometric and structural properties of solid surfaces. The quantitative assessment of fractal geometry typically involves the determination of the fractal dimension value, denoted as D, which serves as an indicator of solid surface roughness or structural irregularity [38,49,50]. The fractal dimension is constrained within a range from 2 to 3, where a value of 3 indicates completely irregular or rough surfaces, while a value of 2 signifies completely smooth surfaces [49]. Hence, the determination of the fractal dimension can be accomplished through the application of the Wang-Li fractal model utilizing N2 adsorption data. The Wang-Li model can be elucidated as follows [21]:
Let
A X = N X N m a x ln X d N X r 2 X , B X = N m a x N ( X ) 1 / 3 r ( X )
then the fractal dimension can be calculated by this equation:
l n A X = c o n s t a n t + D × l n B ( X )
where X = P/P0 is the relative pressure; P is the equilibrium pressure on the sample and P0 is the saturation pressure of nitrogen at 77 K; N is the adsorption amount at the relative pressure P/P0 and absolute temperature T; Nmax is the amount adsorbed at X tending to 1; respectively; r is the average radius of curvature of the meniscus at the condensation adsorbate-gas interface calculated using Kelvin’s equation, which increases with the increase in relative pressure X increases; D is the fractal dimension. Therefore, according to the Wang–Li model, the plot of lnA(X) versus lnB(X) shows a liner relationship, and the slope is the fractal dimension D.

4. Results and Discussions

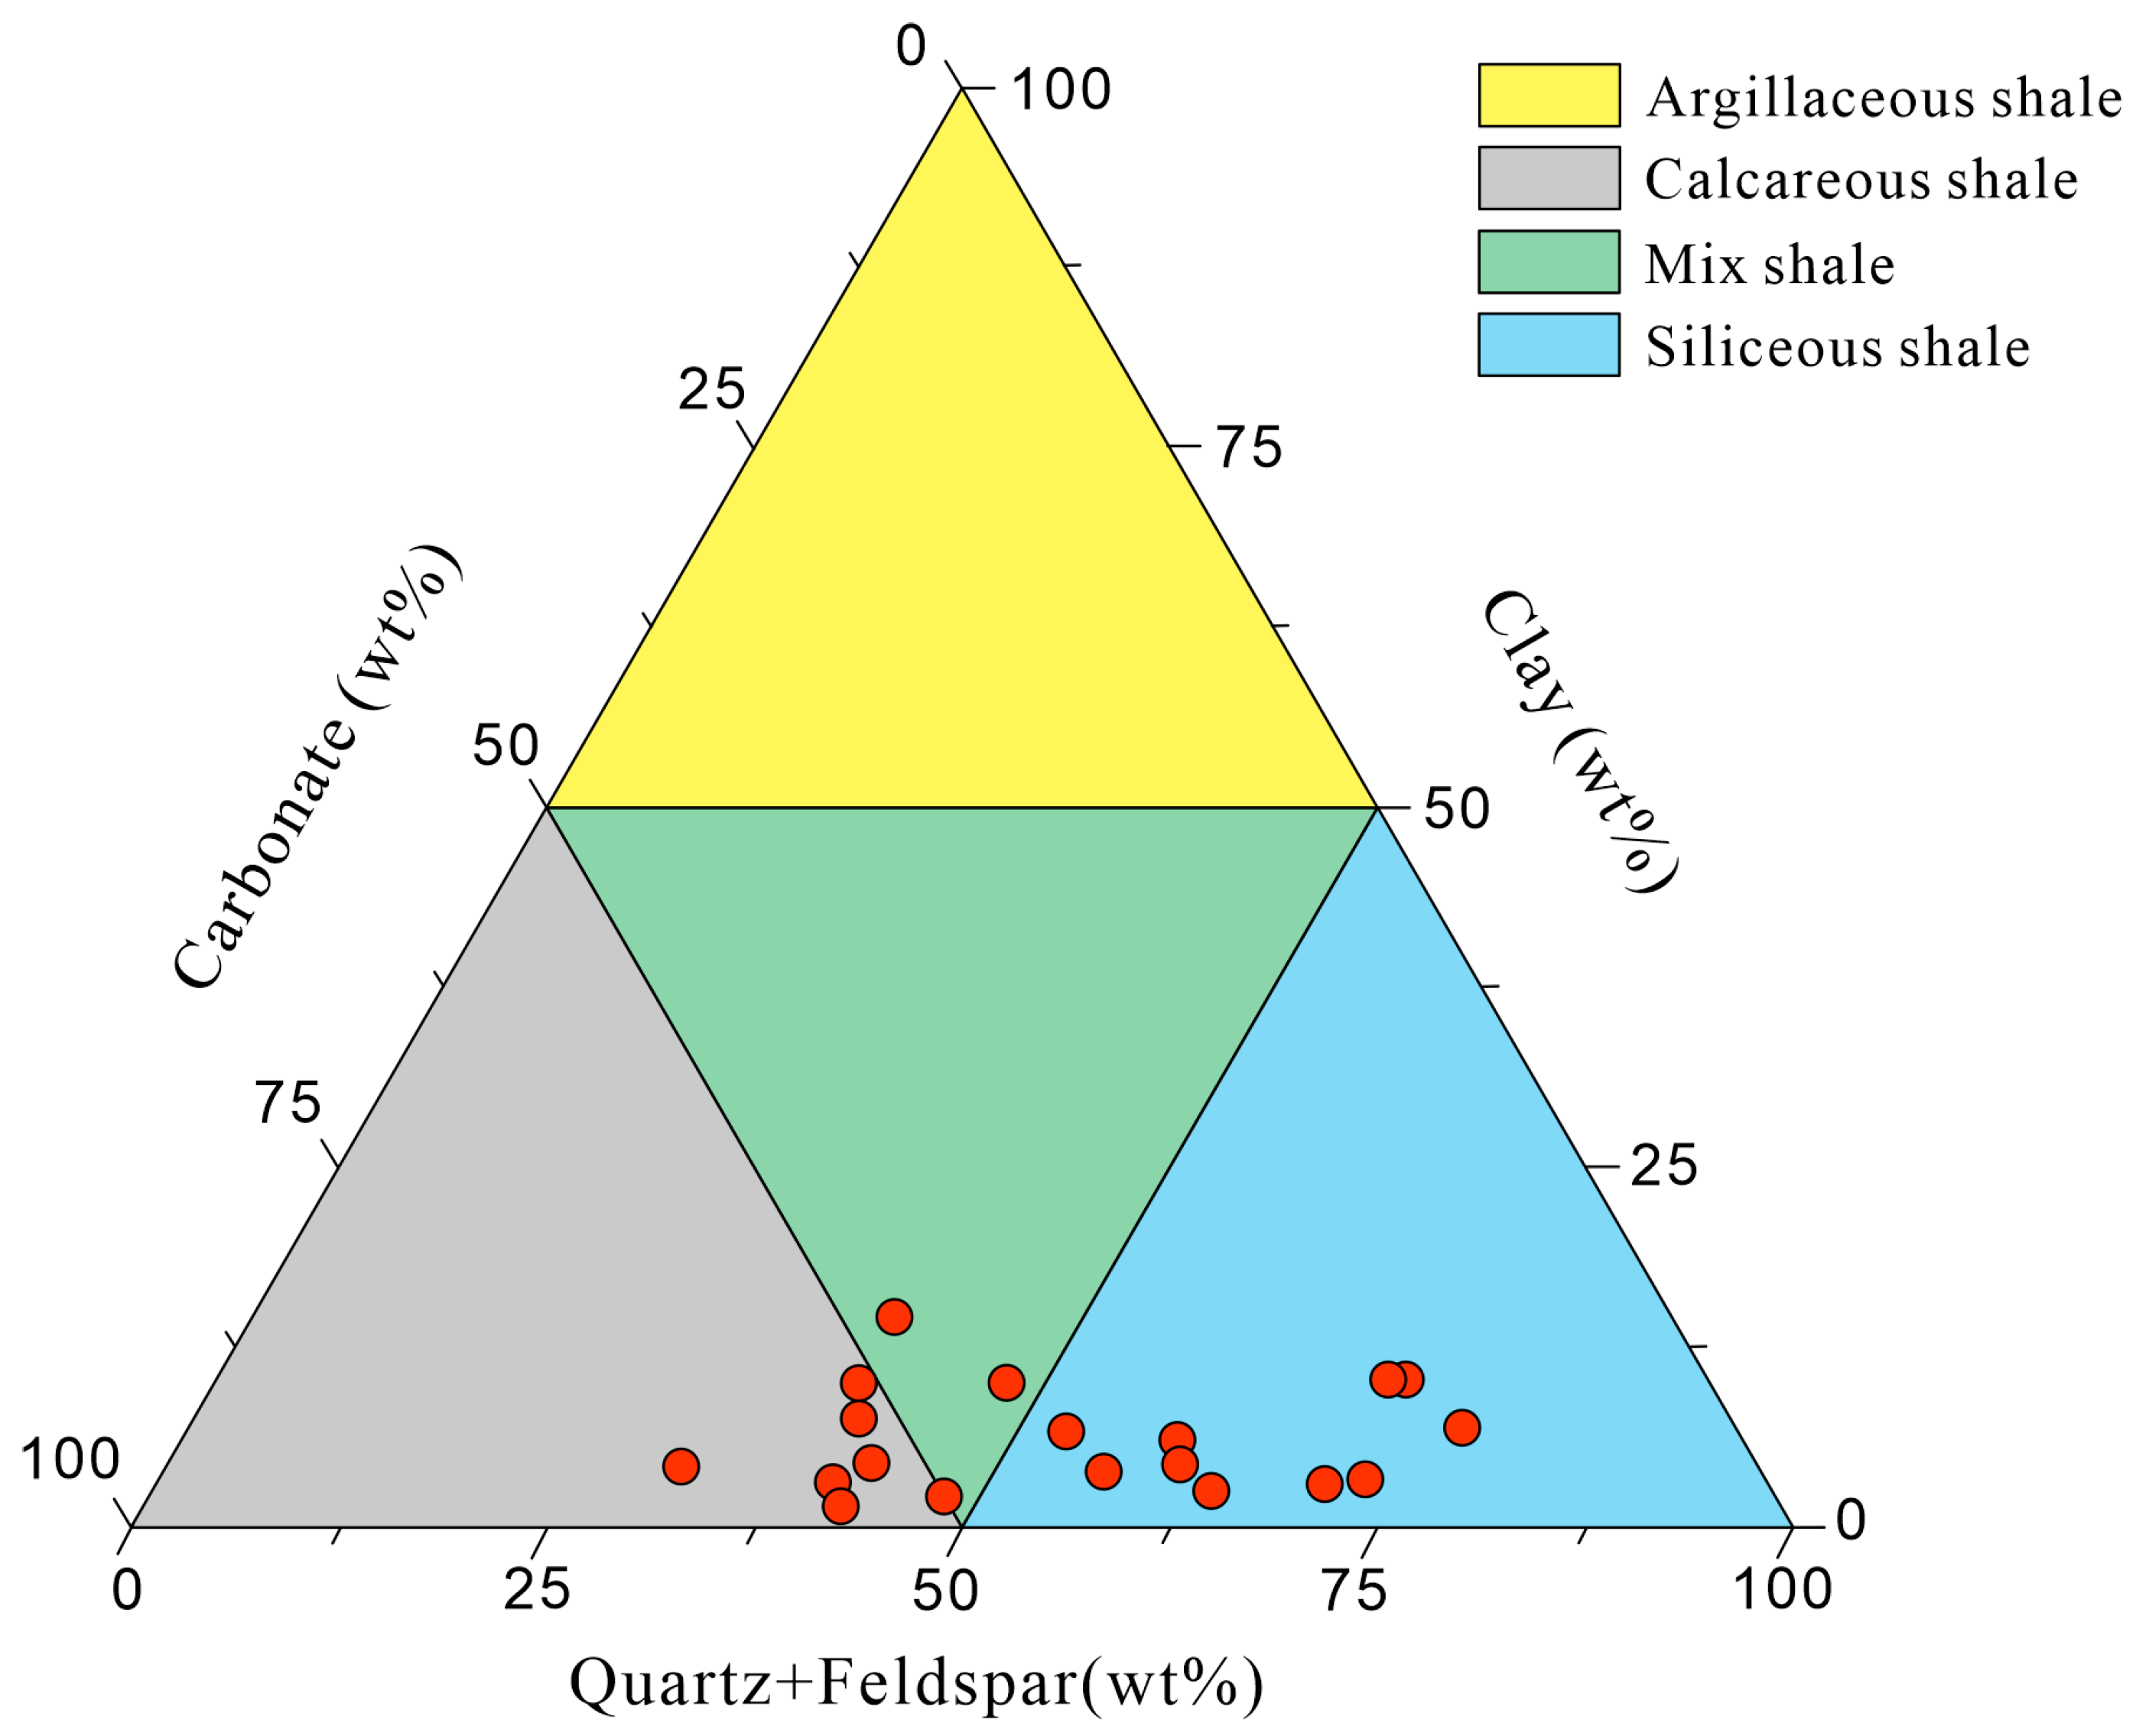
4.1. Mineral Compositions

The X-ray diffraction (XRD) results, as depicted in Table 1, reveal the predominant mineral compositions present in the samples, notably felsic minerals (ranging from 29.7% to 69.9%) and carbonate minerals (ranging from 15.5% to 62.5%), with a lesser abundance of clay minerals (ranging from 1.2% to 13.7%), predominantly illite and illite/smectite formation (I/S). Considering the depositional environment of the Fengcheng Formation within the Mahu Sag, characterized by semi-deep to deep alkaline lake phases, we adopt the classification scheme devised for fine-grained rocks from China’s saline lakes [51]. In accordance with this classification scheme, the samples are categorized into three distinct types based on the predominance of (quartz + feldspar), (dolomite + calcite), and (clay) minerals as the three end members, with a typical mineral content of 50% serving as the threshold (refer to Figure 2). Type I samples exhibit a carbonate mineral content exceeding 50%, thus classified as calcareous shale (depicted by the gray area in Figure 2). Conversely, Type II samples demonstrate a felsic mineral content surpassing 50%, designating them as siliceous shale (represented by the blue area in Figure 2). Type III encompasses samples wherein the combined content of carbonate and felsic minerals falls below 50%, identified as calcareous-siliceous mixed shale (depicted by the green area in Figure 2). Given the limited number of Type III samples, they were not subject to further analysis. Subsequent analysis and discussions centered on Type I and Type II samples.

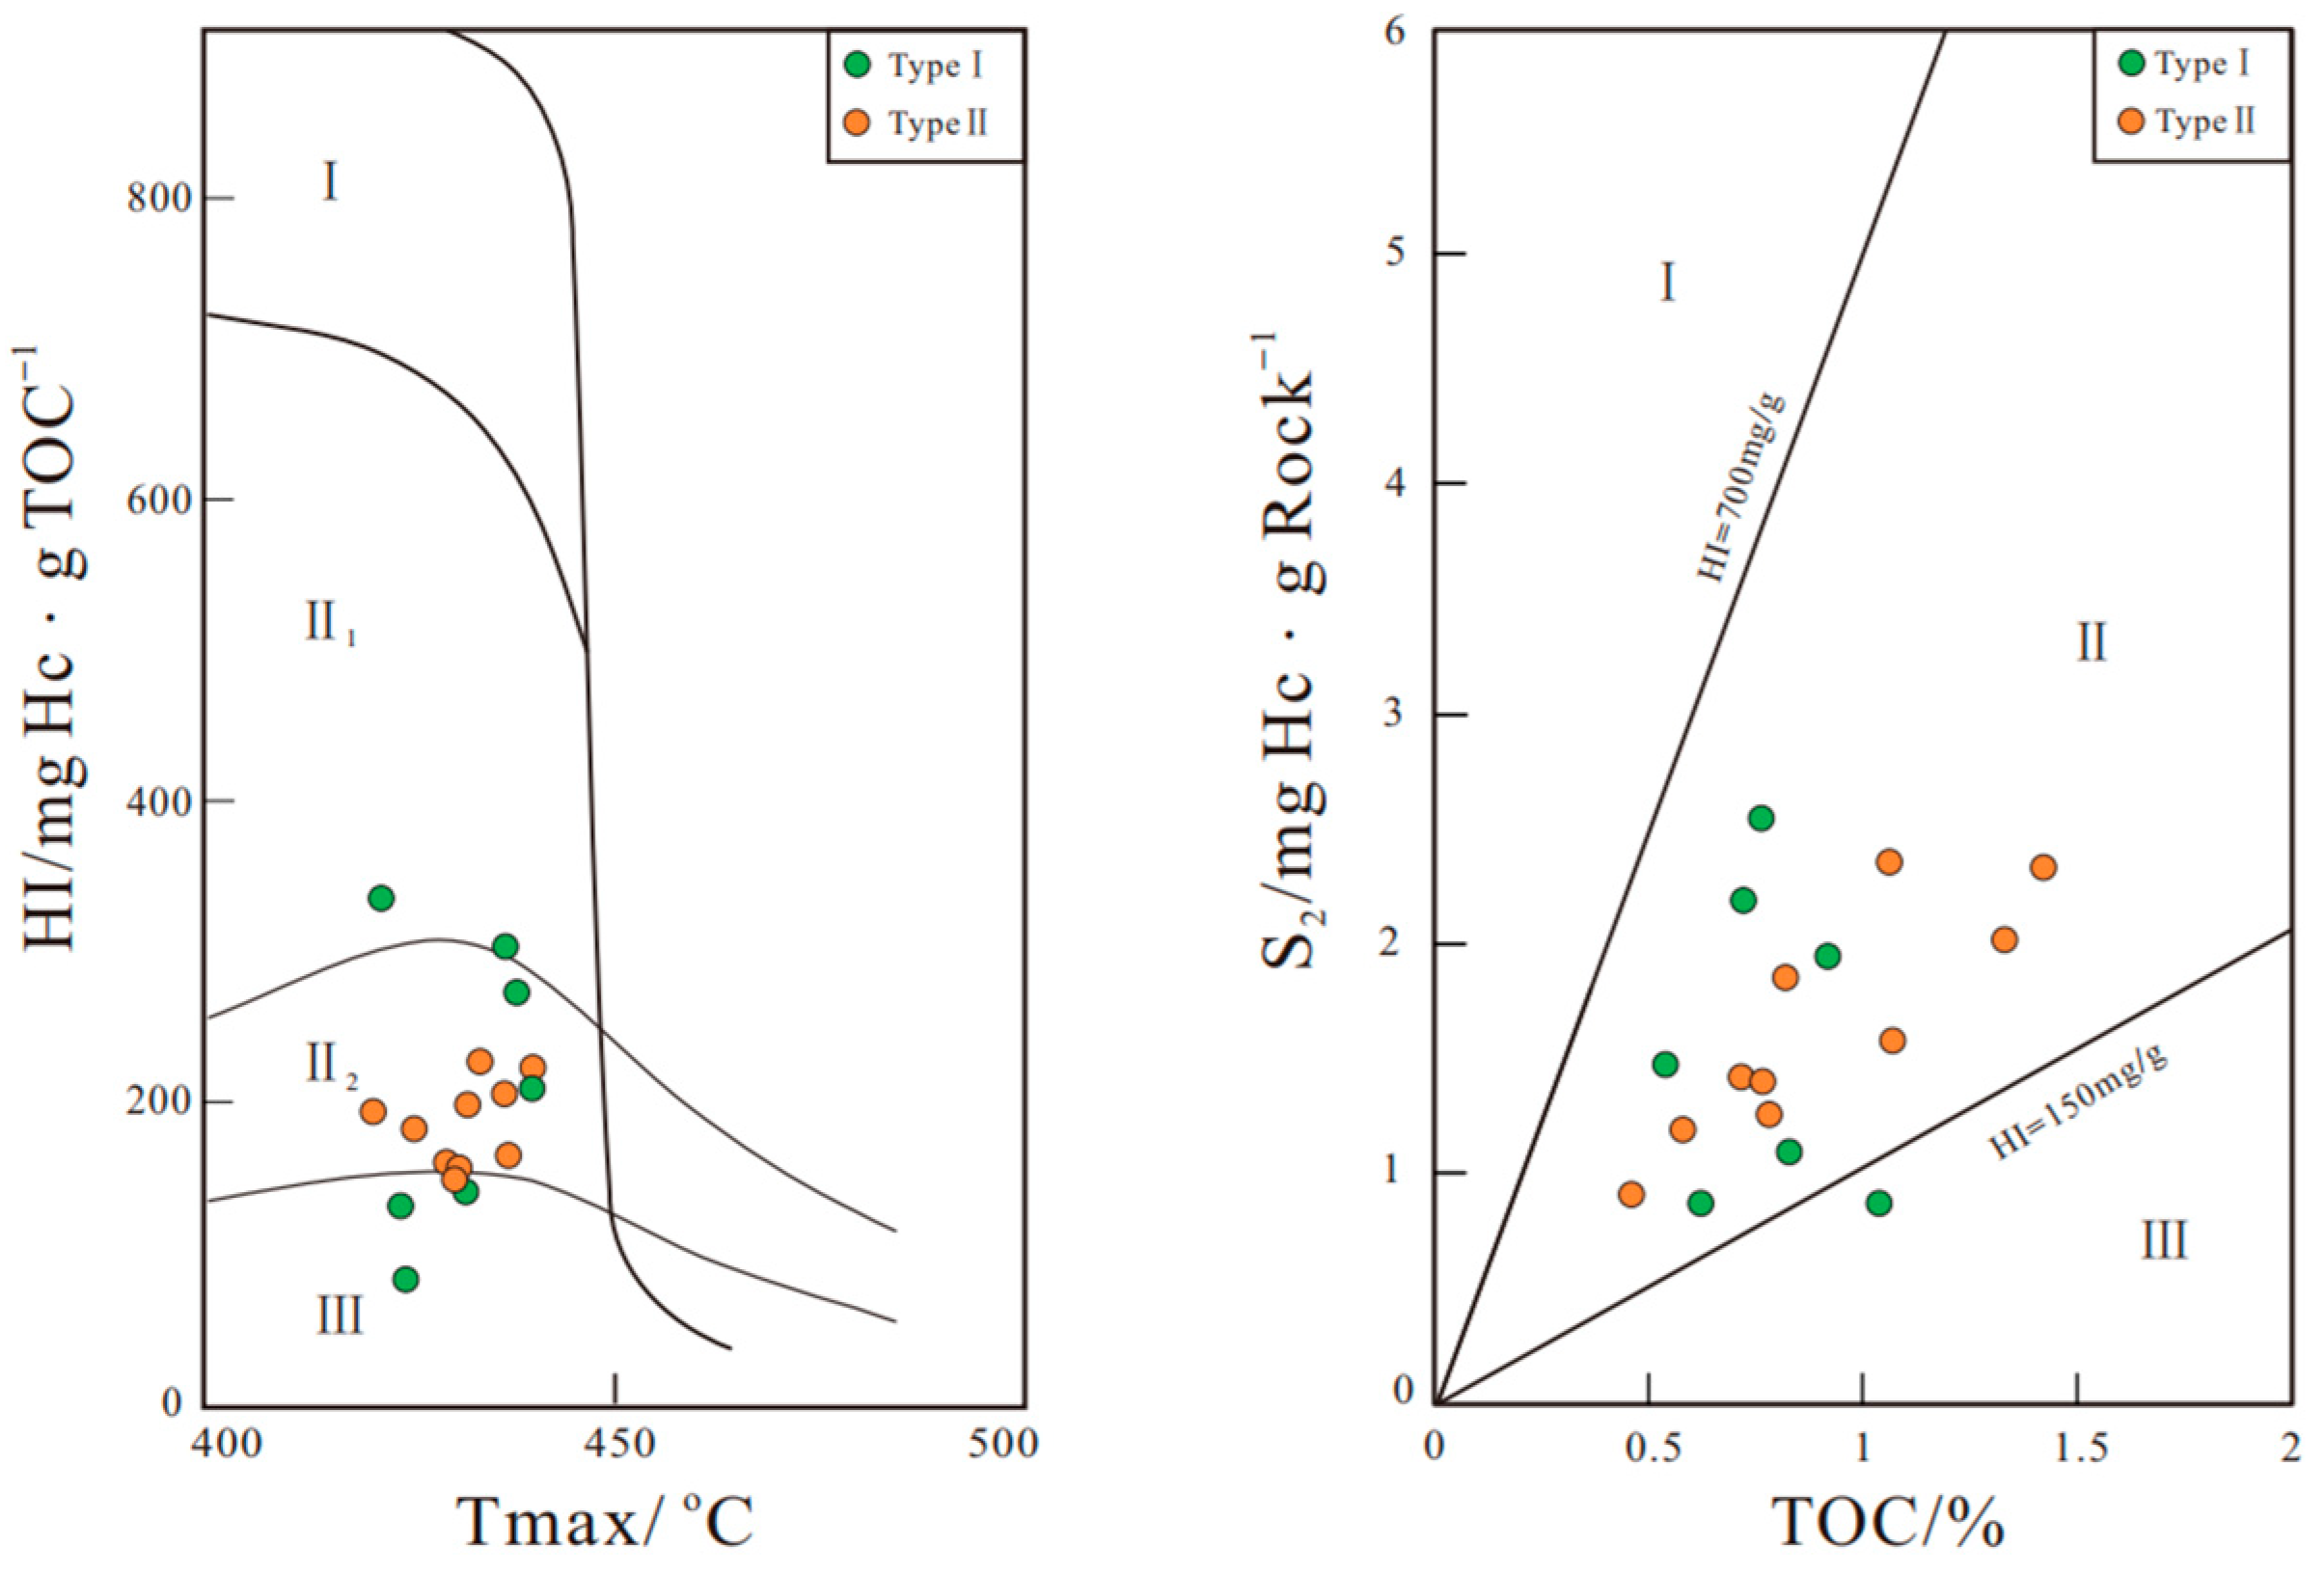
4.2. Geochemical Properties

Before oil extraction, the TOC content of all samples varied from 0.46% to 1.42%. After extraction, the TOC content of the samples slightly decreased to a range of 0.27% to 0.94% (Table 2). The hydrogen index and Tmax can be used to determine the type of kerogen [52]. Therefore, based on the HI-Tmax and S2-TOC crossplot (Figure 3), the type of organic matter in the sample is mainly Type II kerogen, and the organic matter abundance ranging from poor to moderate.
The pyrolysis peak temperatures observed in the shale samples ranged from 420 °C to 440 °C. Drawing upon insights gleaned from previous research and production practices [53,54], it is inferred that samples extracted from the depths of Well X are situated within a maturity stage conducive to the generation of liquid hydrocarbons. Furthermore, a substantial volume of hydrocarbons is retained within the shale matrix, occupying a significant portion of pore space. During the extraction process, organic solvents dissolve hydrocarbon molecules trapped within the shale pores, thereby facilitating their removal and consequent alteration of the pore structure [55].
Before extraction, the TOC content of Type I samples (calcareous shale) changed from 0.54% to 1.04%, with an average value of 0.78%. After extraction, the TOC content of the samples changed from 0.38% to 0.94%, with an average value of 0.58%.
Prior to extraction, the Total Organic Carbon (TOC) content of Type II samples (siliceous shale) spanned from 0.46% to 1.42%, yielding an average value of 0.90%. Following extraction, the TOC content of these samples ranged from 0.27% to 0.85%, with an average value of 0.55%.
Through the statistical analysis of the TOC changes before and after extraction for the two types of samples, we found that the extraction process has a certain impact on samples of different types. The rationale behind this phenomenon lies in the action of organic solvents during extraction, which effectively rinses away a significant portion of movable oil contained within the pore spaces. Therefore, based on the difference in TOC between the two types of samples before and after extraction (0.3% and 0.35%), it is deduced that siliceous shale harbors a greater amount of movable oil compared to calcareous shale.

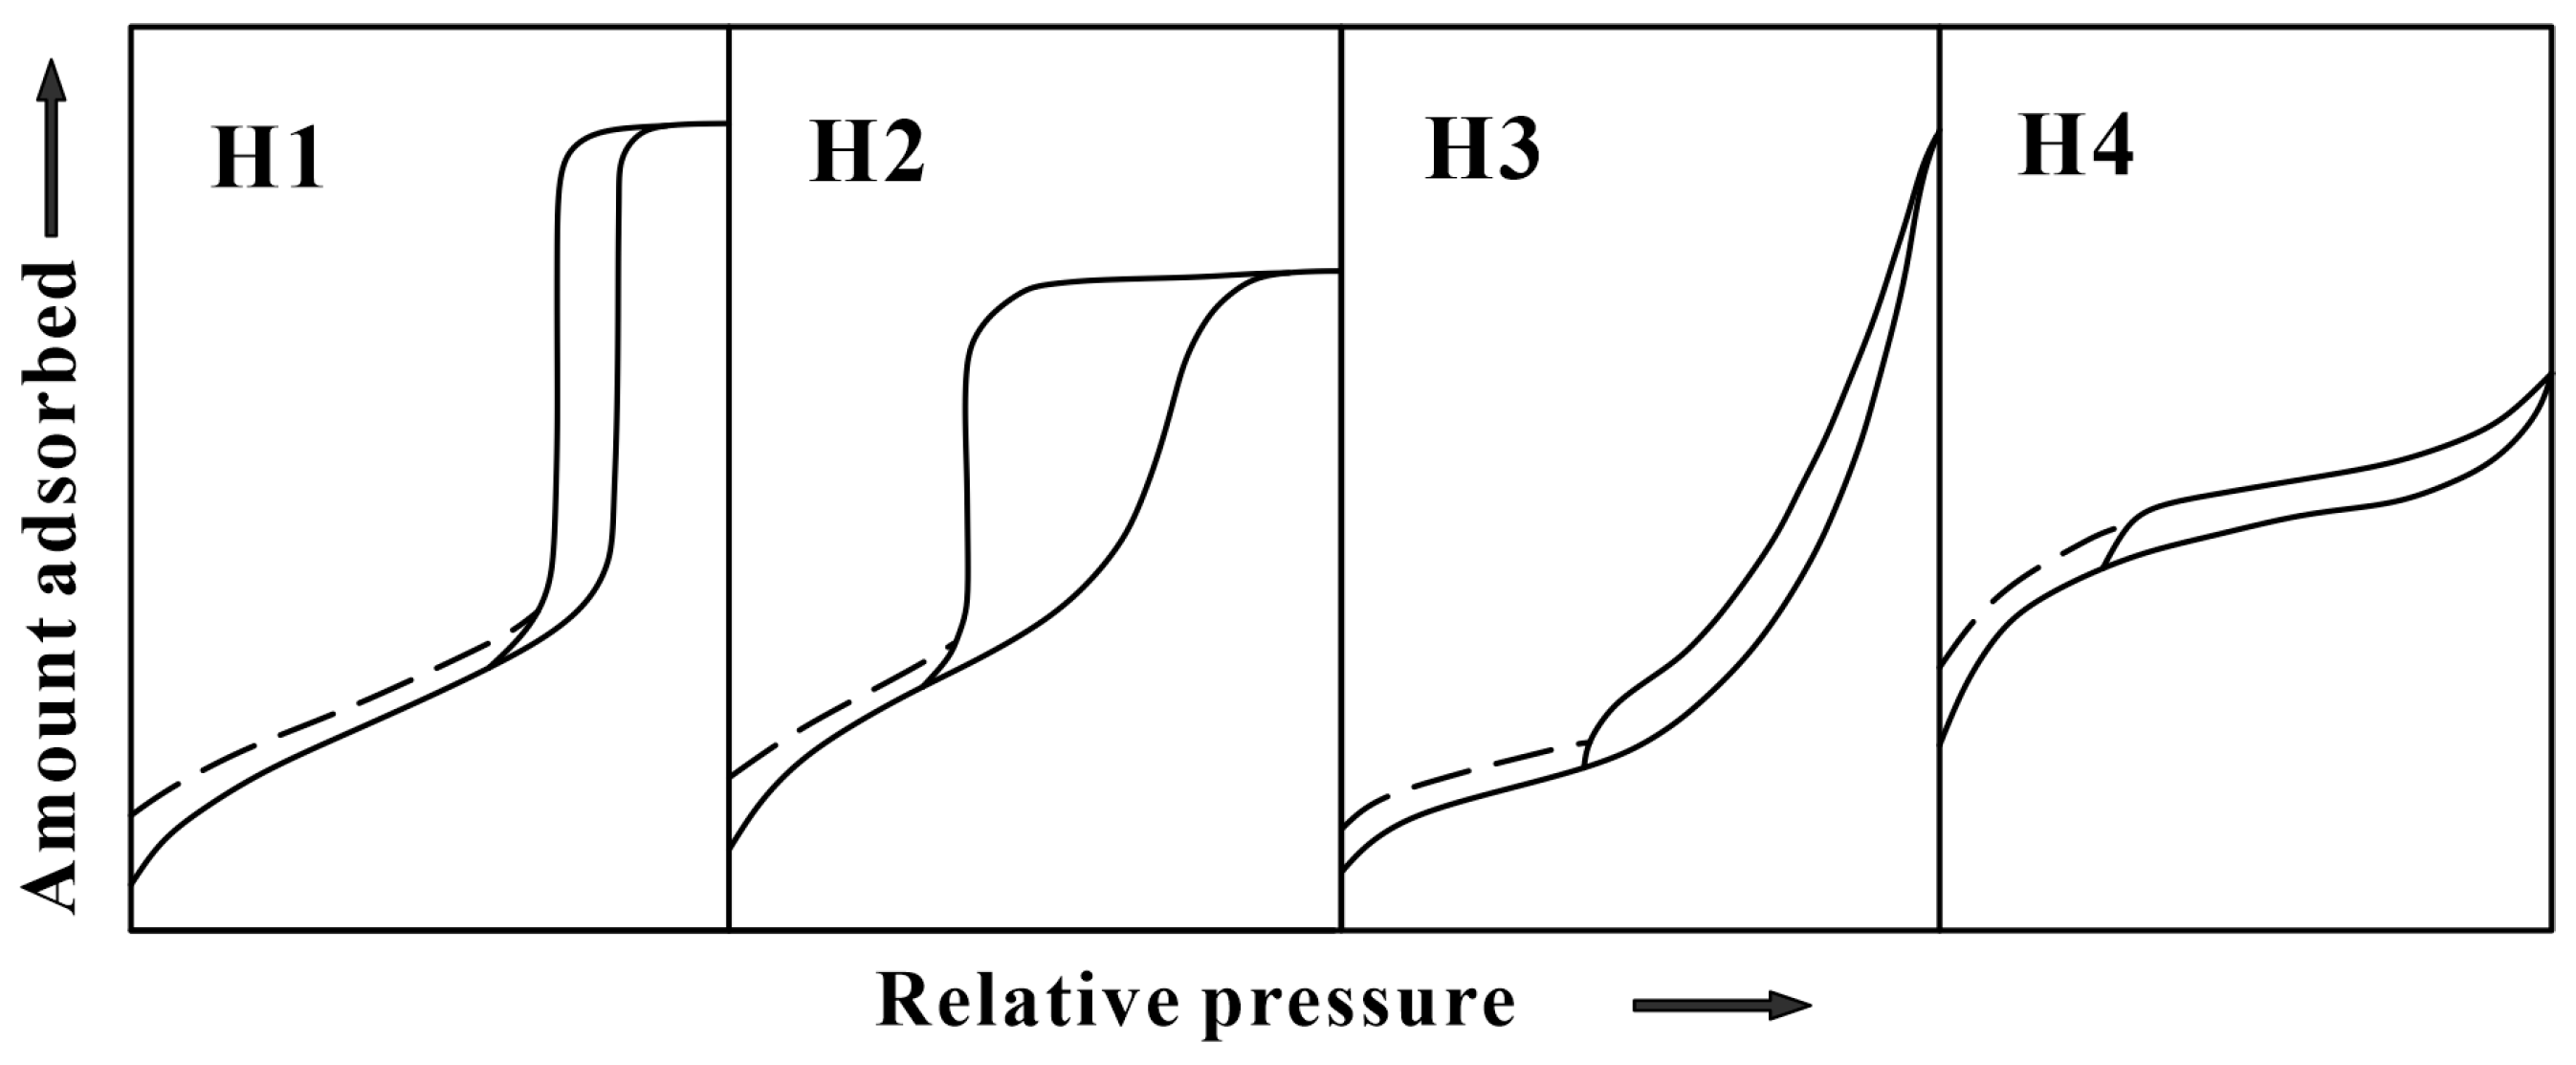
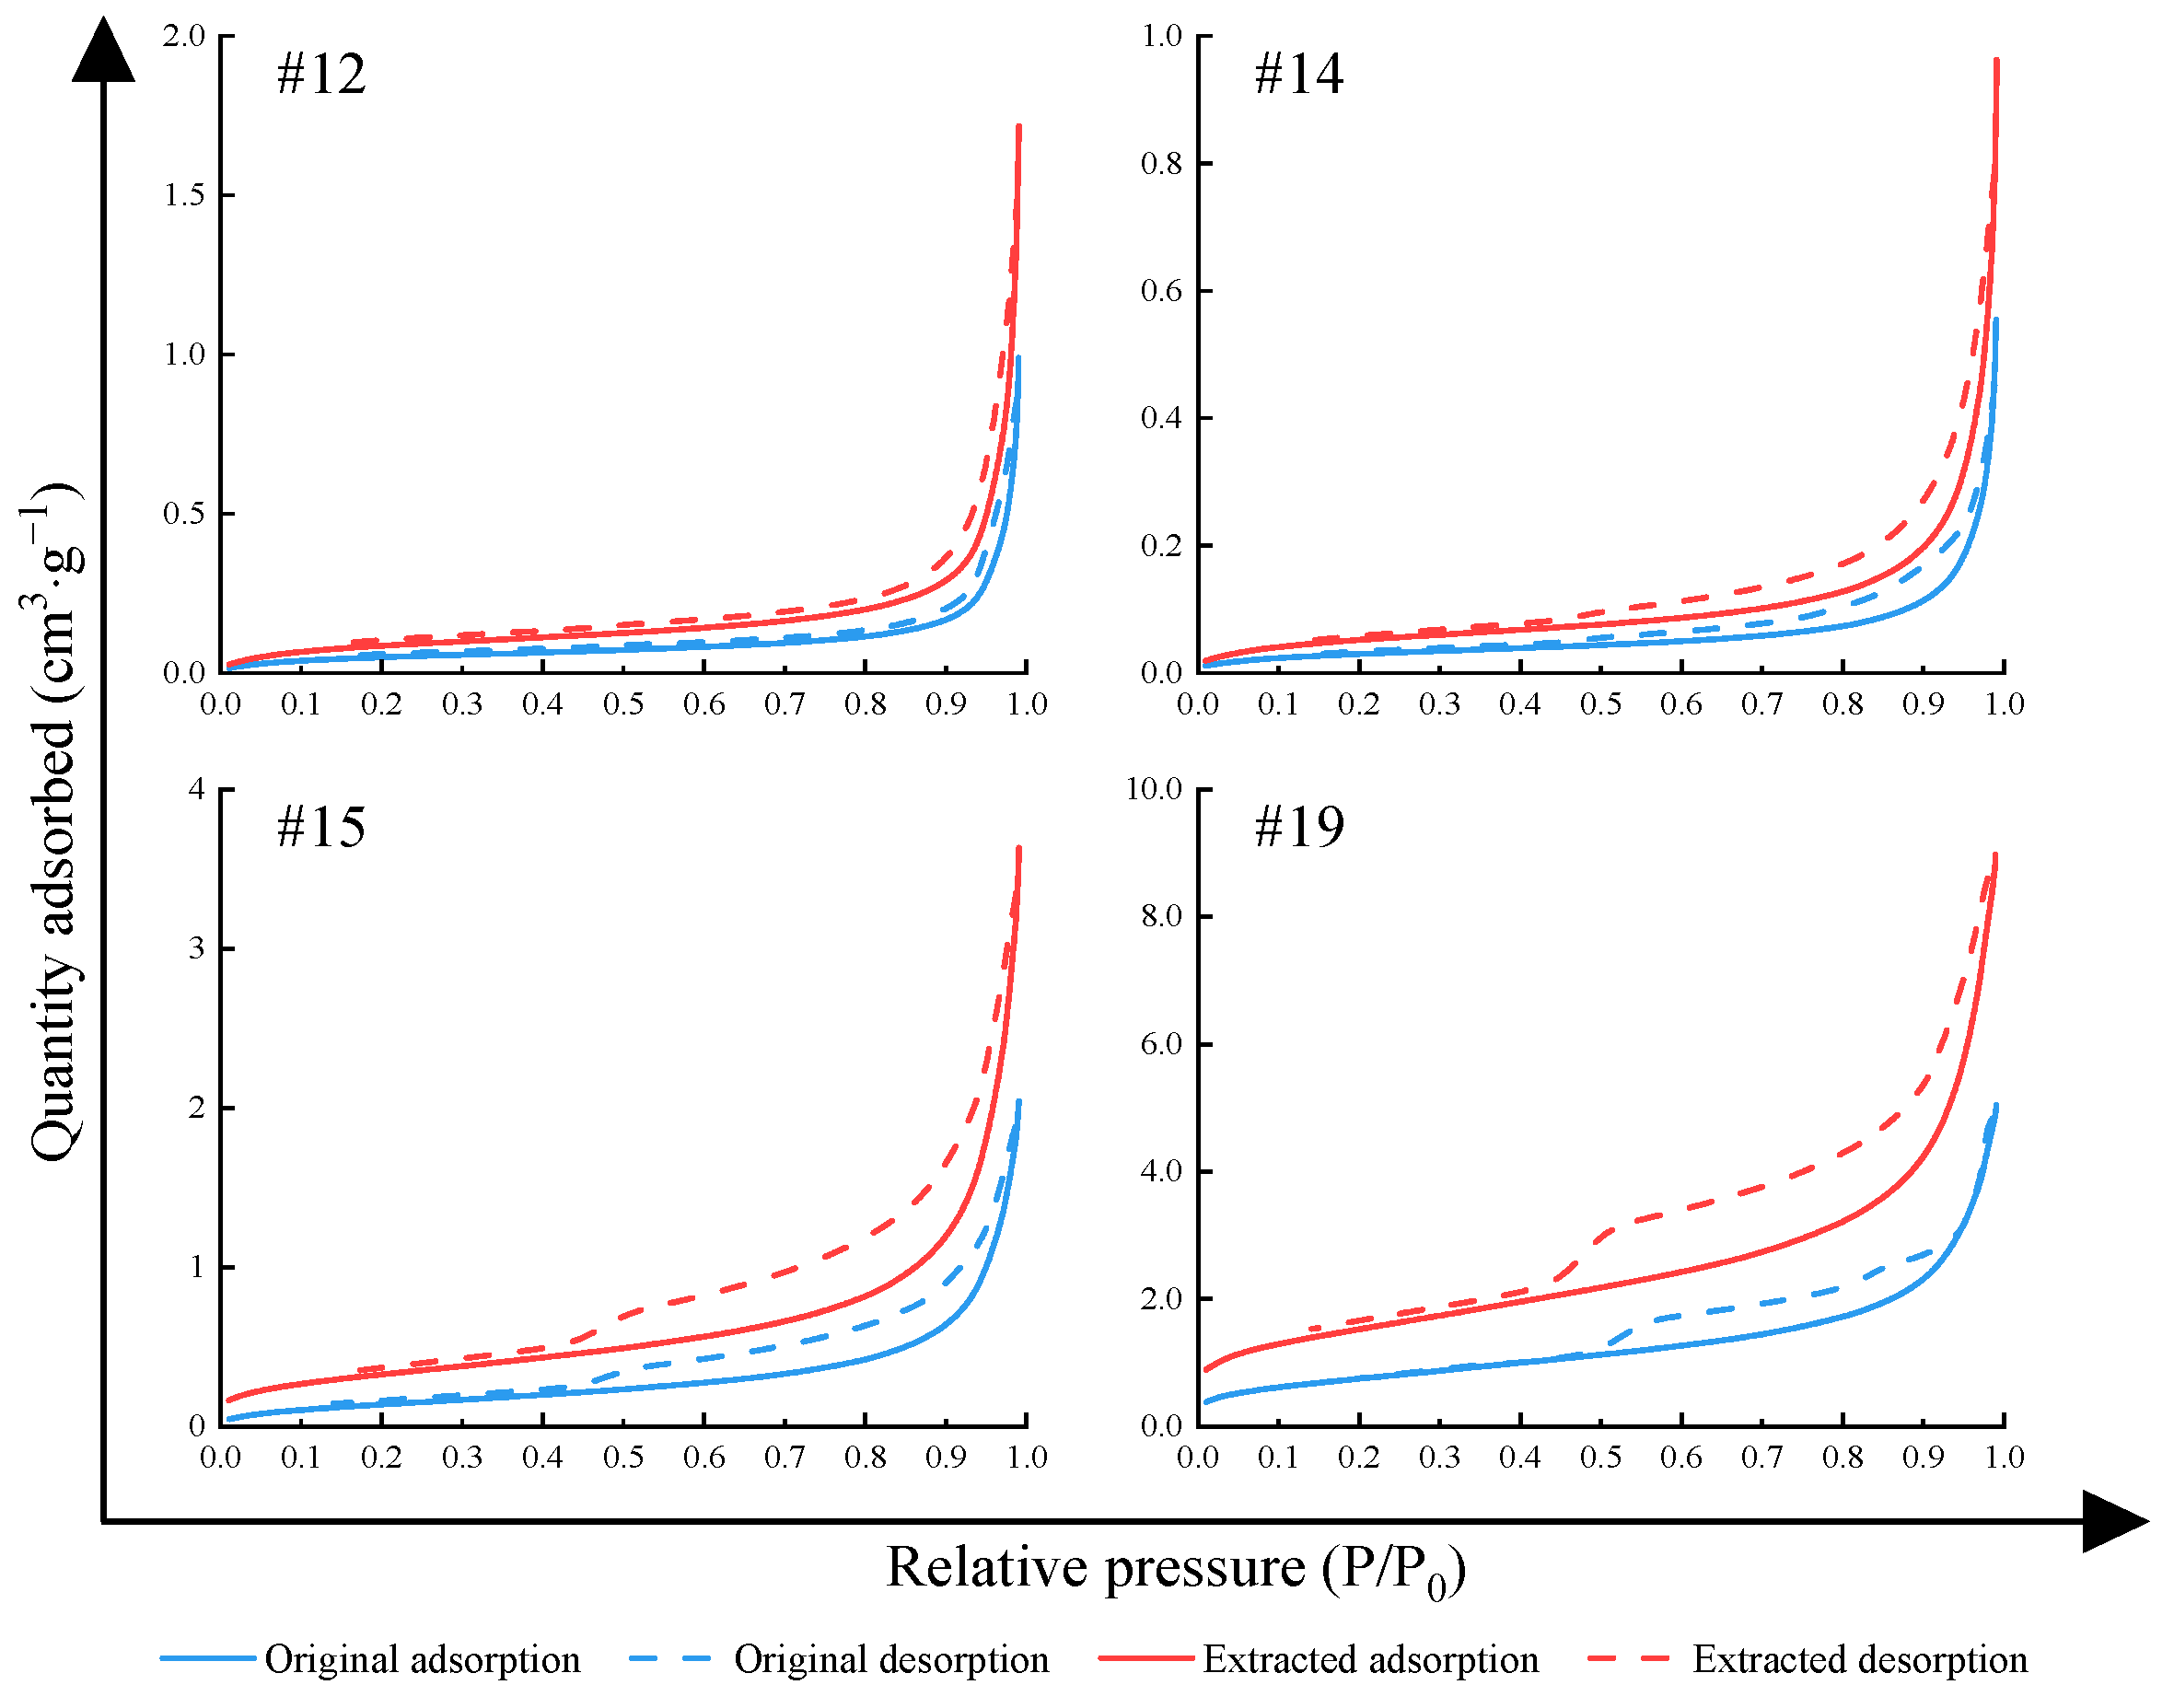
4.3. N2 Adsorption and Desorption Isotherms

The determination of pore shape is predicated upon the examination of morphological alterations and the types of low-temperature nitrogen isothermal adsorption–desorption curves (refer to Figure 4). The nitrogen adsorption–desorption isotherms of both pre- and post-extraction samples at 77.15 K are depicted in Figure 5. Notably, the adsorption capacity of all samples exhibited a significant increase post-extraction compared to their original state, accompanied by the emergence of hysteresis loops in the nitrogen adsorption isotherms of both pre- and post-extraction samples. Subsequently, the hysteresis loops of nitrogen adsorption before and after extraction will be categorized in accordance with the classification standards outlined by the International Union of Pure and Applied Chemistry (IUPAC), as illustrated in Figure 4 [56].
For the first type of sample (mainly carbonate minerals), the hysteresis loop types before and after extraction belonged to the H2–H3 type, with large hysteresis loops. The desorption curve exhibited a step-like rise at the relative pressure range of 0.4~0.5 (like sample #15), corresponding to the pore morphology—ink-bottle-shaped pores (narrow neck, wide body pores). After oil extraction, the adsorption volume of nitrogen gas significantly increased, and the step-like rise of the hysteresis loop became larger.
For the second type of samples, predominantly comprising felsic minerals, they were further categorized into three subcategories based on the alterations observed in hysteresis loops before and after extraction.
(1)
The hysteresis loop was classified as a H3 type, characterized by the adsorption curve closely paralleling the desorption curve. It was narrow and gradually emerged during the mid to high-pressure stages (P/P0 > 0.80), sharply rising as it approached the saturated vapor pressure (observed in sample #12). This signifies the presence of slit-shaped pores with parallel plates in the sample, with minimal changes observed in the hysteresis loop before and after extraction.
(2)
The hysteresis loop fell within the H3–H4 category, featuring a narrow loop emerging at a relative pressure of 0.4. Similar to the first subcategory, there was minimal change observed in the hysteresis loop before and after extraction (observed in sample #14), corresponding to the pore morphology characterized by slit-like pores that are open all around.
(3)
The hysteresis loop was identified as the H2–H3 type, exhibiting a large loop. Notably, both the adsorption and desorption curves manifested a step-like rise at the relative pressure of 0.4~0.5. Following oil extraction, the hysteresis loop expanded significantly, with a more pronounced increase observed (observed in sample #19), indicative of ink-bottle-shaped pores in the pore morphology.
Therefore, based on the hysteresis loops formed by nitrogen adsorption–desorption curves, it is inferred that ink-bottle-shaped pores were mainly developed in calcareous shale, and the pore structure was relatively simple. This is primarily due to the dissolution of carbonate minerals by organic acids, mainly calcite and dolomite. In siliceous shale, slit-like pores and ink-bottle-shaped pores and other types are developed, indicating a more complex pore structure. This complexity arises from the abundance of quartz in siliceous shale, which exhibited strong resistance to compaction, thereby preserving more intergranular pores and exerting a supporting influence on reservoir pores. Meanwhile, the dissolution of siliceous cement can lead to secondary enlargement of quartz and filling of pores, resulting in variable pore shapes. Feldspar serves as the main body of the dissolution, forming dissolution pores and then providing pore space [5,12,13].
The parameters of pore structure mainly include pore volume and specific surface area (SSA), which can be obtained from N2 adsorption, as shown in Figure 6. After extraction, all samples exhibit larger pore volume and specific surface area compared to before extraction. The pore structure parameters of Type I samples showed a small range of changes, while those of Type II samples showed a larger range of changes.
The difference in specific surface area of Type I samples (calcareous shale) before and after extraction ranged 0.28~4.20 m2/g, with an average value of 1.32 m2/g; the difference in pore volume ranged 0.001467~0.016789 cm3/g, with an average value of 0.005674 cm3/g; the difference in average pore diameter ranged from −4.33 nm to −2.38 nm, with an average value of −3.23 nm.
For Type II samples (siliceous shale), the variation in specific surface area before and after extraction ranged from 0.11 m2/g to 4.43 m2/g, with an average of 1.32 m2/g. Similarly, the disparity in pore volume spanned from 0.000621 cm3/g to 0.010796 cm3/g, with an average of 0.004271 cm3/g. Additionally, the difference in average pore diameter ranged from −7.41 nm to −1.37 nm, with an average of −3.07 nm.
Upon analyzing the extracted shale samples, a notable augmentation in both pore-specific surface area and volume was observed. This enhancement can be attributed to the accumulation of a substantial quantity of oil within the pores prior to oil washing, with some of the oil being adsorbed onto the surface of the pores and throats. Following oil washing, a portion of the movable oil was removed, consequently unveiling the pore space and throat channels that were initially occupied by the oil. Considering the alterations in specific surface area and pore volume for the two types of samples before and after oil washing, it is deduced that shale dominated by felsic minerals harbors a greater proportion of pore space occupied by oil and gas.
Furthermore, an unexpected trend was observed in which the average diameter of the pores exhibited a reduction after oil washing, contrary to our prior understanding. This phenomenon can be elucidated by considering the limitations inherent in nitrogen adsorption measurement techniques, as expounded by Clarkson et al. [15,57]. According to their research, the effective measurement range of pore diameter using nitrogen adsorption is limited to 100 nm, beyond which larger pores cannot be accurately quantified. Subsequent to oil washing, certain pores expanded, surpassing the measurement capability of the instrument, thereby rendering this segment of the pore inaccessible for precise measurement. Consequently, this instrumental constraint contributed to the observed diminishing trend in calculated average pore diameters. Moreover, the removal of oil by organic solvents results in the release of nanopores, further contributing to the reduction in average pore size [29].

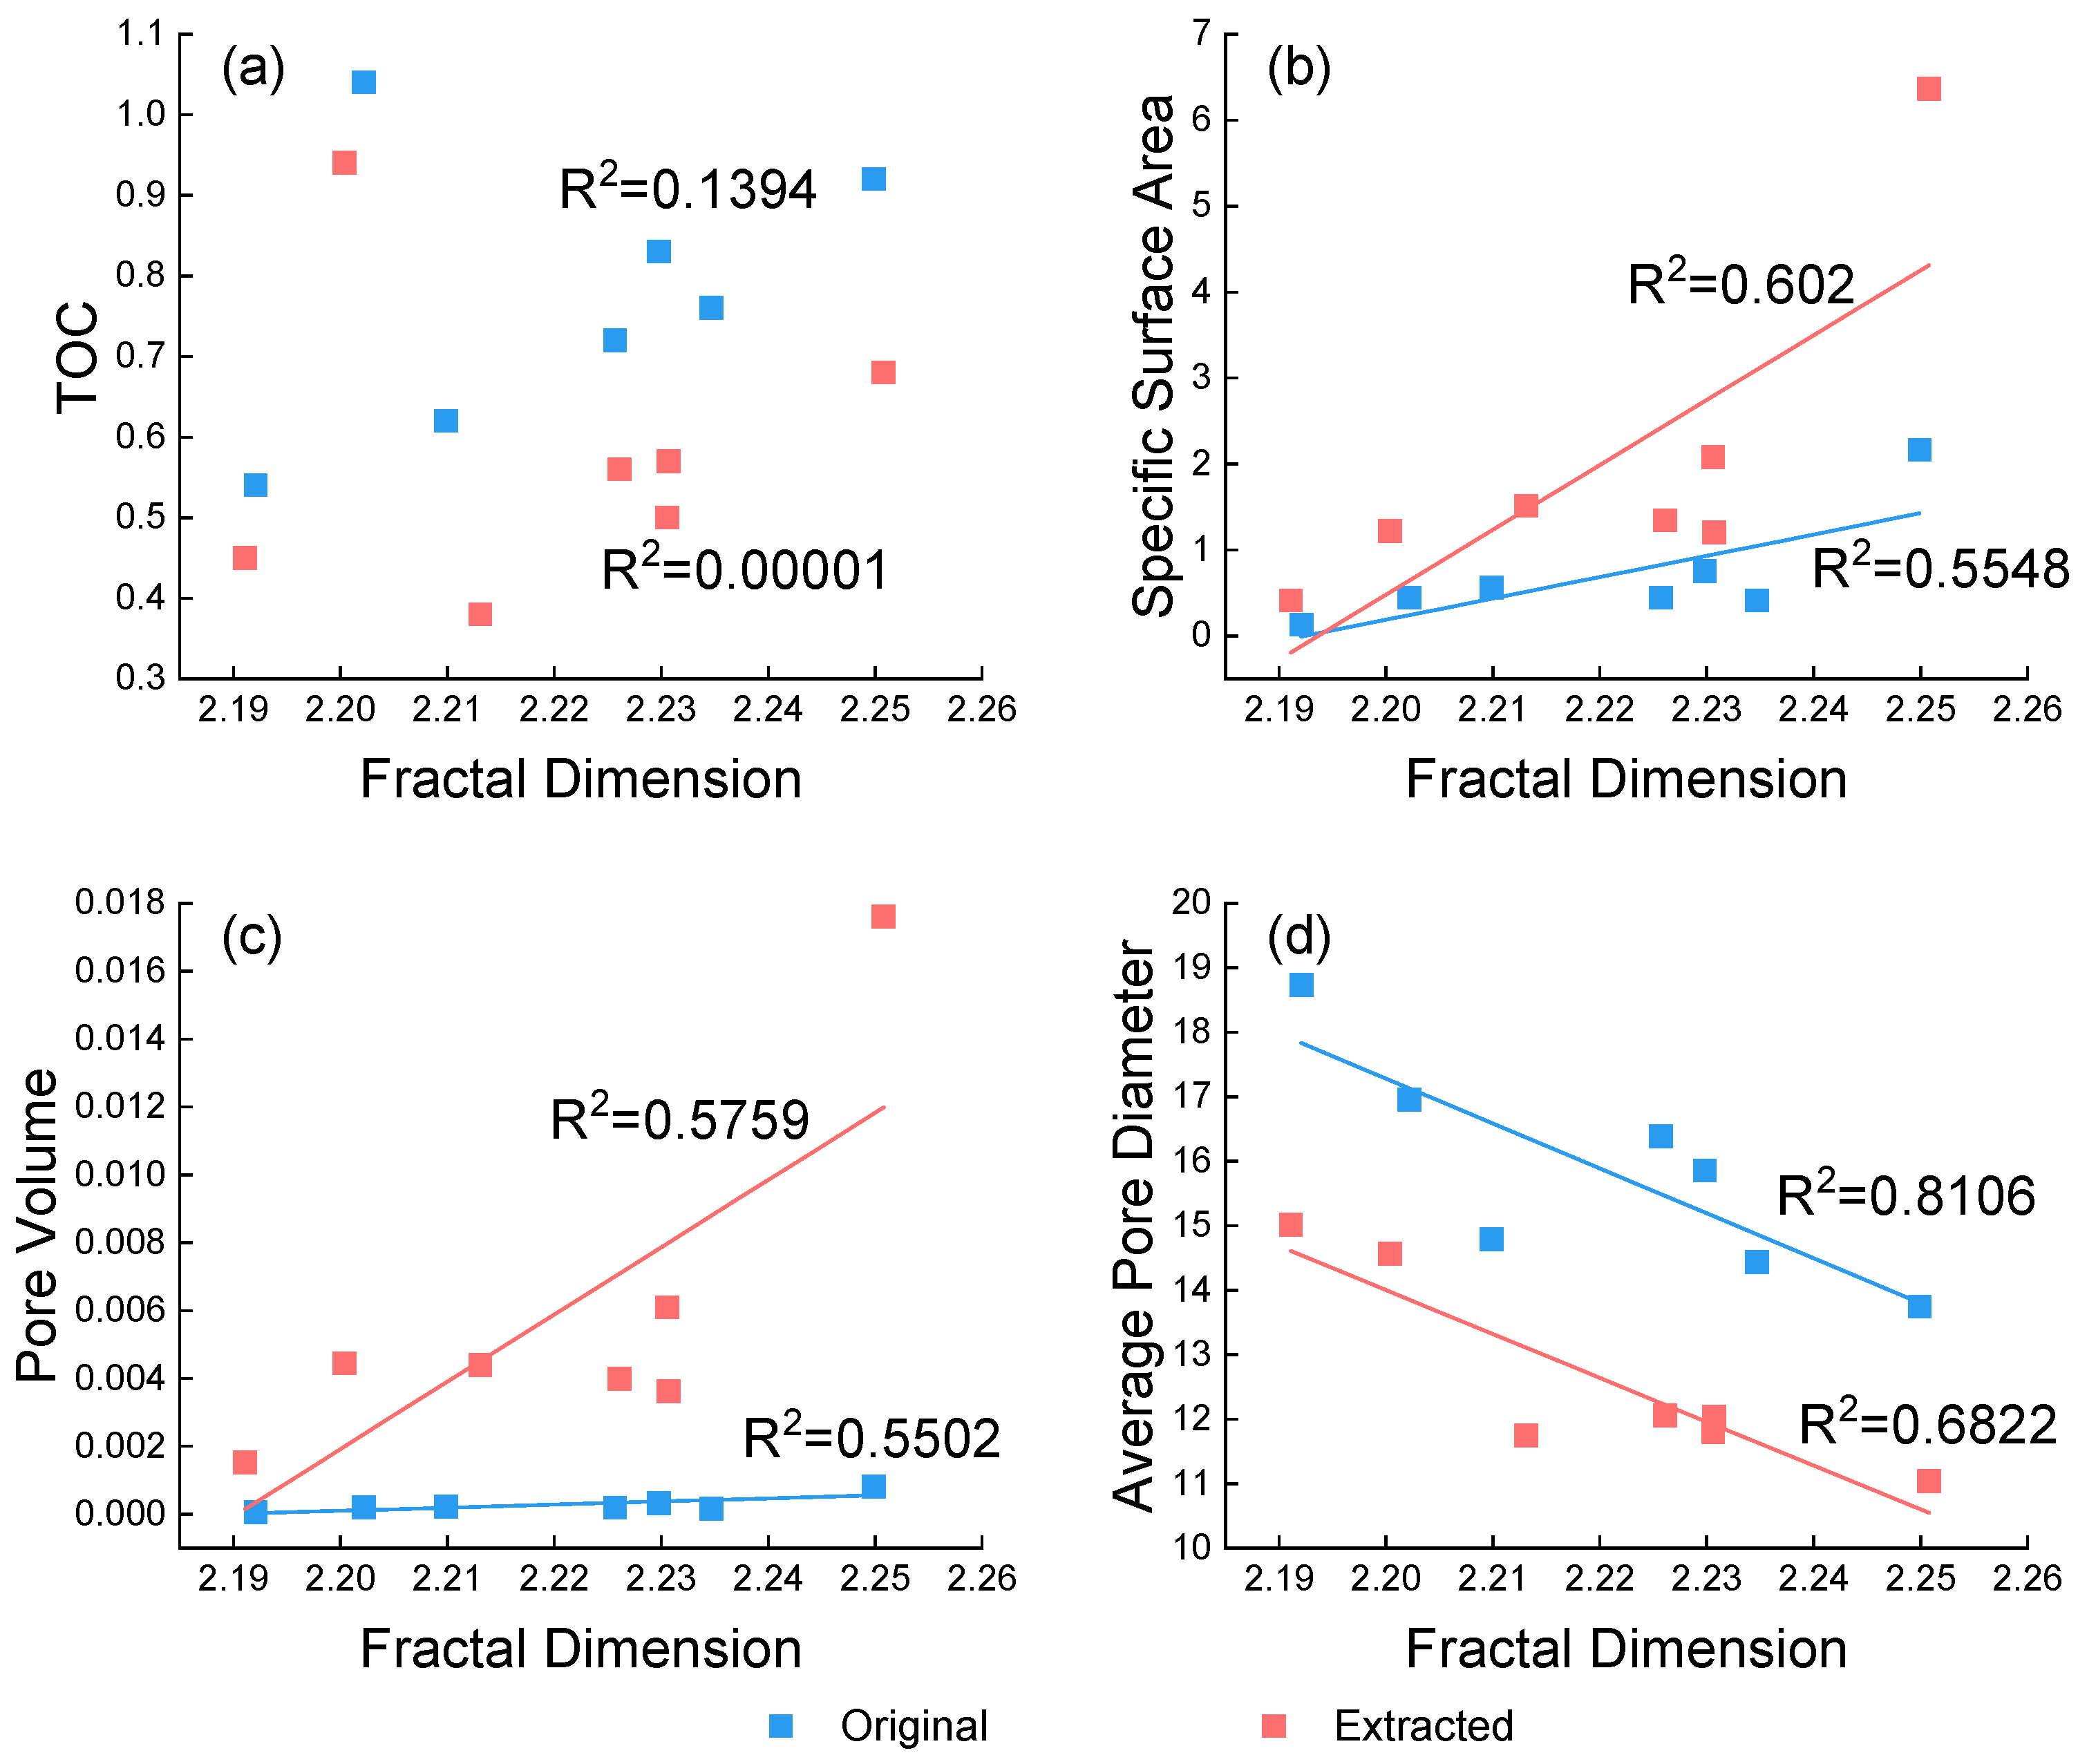
4.4. Fractal Analysis of Gas Adsorption

Previous research [58] has established the utility of fractal dimension in characterizing shale pore structures. Shales exhibiting higher fractal dimensions typically manifest more irregular pore surfaces or intricate pore structures, along with larger total pore volumes or specific surface areas [18]. In fractal dimension calculations, researchers commonly employ the Frenkel–Halsey–Hill (FHH) model, delineating the relative pressure at which hysteresis loops begin to appear (typically 0.5) as the dividing point, and subsequently computing D1 (P/P0 < 0.5) and D2 (P/P0 > 0.5) separately. Here, D1 signifies the surface fractal dimension, while D2 represents the pore structure fractal dimension [7,58]. However, as observed in Section 4.3, the relative pressure at which hysteresis loops emerge varied among different samples. Consequently, employing 0.45 as the dividing point to segment the adsorption curve for fractal analysis proved unsuitable for the samples in this study. Conversely, the Wang–Li model circumvents this issue; thus, in this paper, we chose the Wang–Li model to calculate the fractal dimension.
The Wang–Li fractal model was applied to the adsorption branch of the isotherm of all samples for fractal dimension analysis. Based on the Wang–Li model, A(X) and B(X) were calculated from experimental data of the adsorption volume and maximum adsorption volume at relative pressure P/P0 and absolute temperature T. The logarithms of A(X) and B(X) were plotted, with ln A(X) as the vertical coordinate and ln B(X) as the horizontal coordinate, and the slope of the resulting graph was the fractal dimension D, as shown in Table 2. Figure 7 illustrates the change in fractal dimension of sample #8 before and after oil extraction.
Based on the fractal dimension results presented in Table 3, it is evident that the fractal dimensions of Type I samples (calcareous shale) before oil extraction ranged from 2.1921 to 2.2499, with an average value of 2.2206. Following oil extraction, these samples exhibited fractal dimensions ranging from 2.1911 to 2.2508, with an average value of 2.2204. Conversely, for Type II samples (siliceous shale), the fractal dimensions before oil extraction varied from 2.1759 to 2.4024, with an average value of 2.2746, while after oil extraction, the fractal dimensions ranged from 2.1765 to 2.4054, with an average value of 2.2795. These findings suggest that for Type I samples, there is minor fluctuation in fractal dimensions before and after oil extraction, with overall similarity and minimal differences observed. In contrast, Type II samples exhibit overlapping fractal dimension ranges before and after oil extraction, albeit with a slightly higher average fractal dimension post-extraction.
Upon comparing the nitrogen adsorption fractal dimensions of the two types of samples before and after oil washing, it becomes apparent that the pore structure of shale dominated by felsic minerals is more complex, irrespective of pre- or post-oil washing conditions. Previous research findings [33,59] indicate that the material source of the Fengcheng Formation siliceous shale in the northern slope area of Mahu Sag primarily comprises continuously input terrestrial sediments, which underwent recrystallization at a later stage due to biological activity influences. Quartz, originating from terrigenous detrital sources, demonstrated robust resistance to compaction, thereby forming and preserving large pores during burial [5,60]. Concurrently, quartz may undergo secondary enlargement, reducing pore and throat space due to the dissolution of siliceous cement, thereby enhancing pore structure heterogeneity and resulting in a larger fractal dimension for Type II samples.
Moreover, it is evident from Table 3 that the fractal dimensions of the two types of shale samples before and after oil washing exhibit minimal differences. This suggests that the relationship between shale oil mobility and reservoir pore complexity is not particularly significant. This conclusion aligns with previous findings [25], indicating that while the mobility of shale oil in reservoirs correlates with pore structure, factors such as burial depth and organic matter abundance must also be taken into account. These research findings hold significant implications for estimating recoverable reserves and predicting the productivity of shale oil and gas reservoirs. However, they also underscore the importance of considering the comprehensive impact of various factors during the development process to achieve more efficient exploitation of shale oil and gas resources.
For exploring the influence of TOC and mineral composition content on the complexity of shale pore structure, a correlation analysis was conducted between these data and fractal dimension (Figure 8). Ideally, the variation in fractal dimension should be correlated with changes in TOC or pore structure to explain the differences in fractal dimension changes between different types of shale samples before and after oil washing.
However, the correlation analysis conducted in this study revealed that for samples predominantly composed of carbonate minerals (Type I), there was no significant correlation between the fractal dimension and TOC before and after oil washing (Figure 8a). Nonetheless, on a broader scale, the fractal dimension tended to increase with higher TOC levels, suggesting that changes in TOC might have some influence on the pore structure of the sample, thereby affecting the magnitude and direction of the fractal dimension. Specifically, the fractal dimension appeared to be predominantly influenced by the pore structure, including parameters such as pore-specific surface area, pore volume, and average pore diameter (Figure 8b–d). The overall fractal dimension of Type I shale samples shows a positive correlation with specific surface area and pore volume, while displaying a negative correlation with average pore diameter. This implies that larger specific surface areas and total pore volumes, coupled with smaller average pore diameters, contribute to more irregular inner surface structures of the pores and thus a more complex pore architecture.
For shale samples predominantly composed of quartz–feldspathic minerals (Type II), we found that the fractal dimension has no obvious correlation with TOC and pore structure, whether before or after oil washing. The changes in TOC and pore structure before and after oil washing could not be directly linked to the changes in fractal dimension (Figure 9). Therefore, for the changes in fractal dimension of siliceous shales before and after oil extraction, we believe that they are the result of the combined effects of TOC and pore structure, rather than being solely dominated by a single factor. Of the two factors, TOC may play a more important role.
The rationale behind this observation is as follows: organic matter harbors a multitude of pores, particularly micropores and fine mesopores, which contribute substantially to the pore space within shales [61]. These pores exhibit characteristics akin to fractal “branching”, thereby effectively influencing the fractal dimension. Moreover, the TOC content significantly impacts the pore structure of shale, encompassing aspects such as the genesis and distribution of organic matter, its interaction with inorganic minerals, and the stability of the pore structure. Consequently, alterations in the fractal dimension of siliceous shale stem from the combined interplay of numerous intricate factors.

5. Conclusions

In this study, we employed a multi-method approach to scrutinize the alterations in pore structure exhibited by distinct shale types before and after oil extraction. Subsequently, the following primary conclusions were derived:
(1)
The extraction of organic solvents led to a significant decrease in TOC content. The impact of oil washing on organic matter in siliceous shale was greater compared to calcareous shale, indicating a higher content of movable oil in siliceous shale than in calcareous shale.
(2)
For shale samples predominantly composed of carbonate minerals (Type I), the prevalent H2–H3 type hysteresis loop suggests a preponderance of ink-bottle-shaped pores, indicative of a relatively uniform pore structure within calcareous shale. Conversely, samples dominated by quartz-feldspathic minerals (Type II) exhibited diverse hysteresis loop types both before and after oil washing, underscoring the complex pore structure inherent to siliceous shale, characterized by the presence of multiple pore types.
(3)
After oil extraction, both Type I and Type II shale samples showed a significant increase in specific surface area and pore volume, indicating that the oil washing process released the pore space previously occupied by hydrocarbons, especially the shale dominated by quartz-feldspathic minerals containing more such of pores. Additionally, due to the limitations of nitrogen adsorption measurement technology, some large-diameter pores could not be effectively measured, leading to a trend of shrinking average pore diameter.
(4)
Before and after oil extraction, the fractal dimension of shale samples predominantly composed of carbonate minerals was primarily influenced by pore structure, exhibiting no discernible correlation with TOC. Conversely, the changes in fractal dimension observed in shale samples dominated by quartz-feldspathic minerals did not exhibit a clear correlation with either TOC or pore structure. This suggests that alterations in fractal dimension may result from the combined effects of TOC and pore structure, with TOC potentially playing a more significant role in this study.

Author Contributions

Conceptualization, H.Z. and K.L.; methodology, Z.Z.; validation, H.Z., K.L. and Y.W.; formal analysis, H.Z.; investigation, R.Y.; resources, Z.W., T.Z. and F.L.; data curation, H.Z.; writing—original draft preparation, H.Z.; writing—review and editing, K.L. and H.Z. is responsible for the data analysis and manuscript writing; K.L. is responsible for the paper’s organization and language improvements. All authors have read and agreed to the published version of the manuscript.

Funding

This research received no external funding.

Data Availability Statement

The data are available from the corresponding author upon request.

Acknowledgments

The authors appreciate the time and effort of the reviewers, who provided valuable comments and suggestions on how to improve the quality of this manuscript.

Conflicts of Interest

Authors Zhenlin Wang, Tao Zhu and Feifei Luo were employed by the Petro China Xinjiang Oilfield Company. The remaining authors declare that the research was conducted in the absence of any commercial or financial relationships that could be construed as a potential conflict of interest.

References

  1. Bai, G.; Qiu, H.; Deng, Z.; Wang, W.; Chen, J. Distribution and Main Controls for Shale Oil Resources in USA. Pet. Geol. Exp. 2020, 42, 524–532. [Google Scholar]
  2. Zhang, J.; Lin, L.; Li, Y.; Tang, X.; Zhu, L.; Xing, Y.; Jiang, S.; Jing, T.; Yang, S. Classification and evaluation of shale oil. Earth Sci. Front. 2012, 19, 322–331. [Google Scholar]
  3. Zou, C.; Tao, S.; Yang, Z.; Yuan, X.; Zhu, R.; Hou, L.; Jia, J.; Wang, L.; Wang, S.; Bai, B.; et al. New Advance in Unconventional Petroleum Exploration and Research in China. Bull. Mineral. Petrol. Geochem. 2012, 31, 312–322. [Google Scholar]
  4. Zou, C.; Yang, Z.; Cui, J.; Zhu, R.; Hou, L.; Tao, S.; Yuan, X.; Wu, S.; Lin, S.; Wang, L.; et al. Formation Mechanism, Geological Characteristics and Development Strategy of Nonmarine Shale Oil in China. Pet. Explor. Dev. 2013, 40, 15–27. [Google Scholar] [CrossRef]
  5. Loucks, R.G.; Reed, R.M.; Ruppel, S.C.; Hammes, U. Spectrum of Pore Types and Networks in Mudrocks and a Descriptive Classification for Matrix-Related Mudrock Pores. Bulletin 2012, 96, 1071–1098. [Google Scholar] [CrossRef]
  6. Li, J.; Zhou, S.; Li, Y.; Ma, Y.; Yang, Y.; Li, C. Effect of Organic Matter on Pore Structure of Mature Lacustrine Organic-Rich Shale: A Case Study of the Triassic Yanchang Shale, Ordos Basin, China. Fuel 2016, 185, 421–431. [Google Scholar] [CrossRef]
  7. Li, A.; Ding, W.; He, J.; Dai, P.; Yin, S.; Xie, F. Investigation of Pore Structure and Fractal Characteristics of Organic-Rich Shale Reservoirs: A Case Study of Lower Cambrian Qiongzhusi Formation in Malong Block of Eastern Yunnan Province, South China. Mar. Pet. Geol. 2016, 70, 46–57. [Google Scholar] [CrossRef]
  8. Xu, Y.; Lun, Z.; Pan, Z.; Wang, H.; Zhou, X.; Zhao, C.; Zhang, D. Occurrence Space and State of Shale Oil: A Review. J. Petrol. Sci. Eng. 2022, 211, 110183. [Google Scholar] [CrossRef]
  9. Qi, Y.; Ju, Y.; Cai, J.; Gao, Y.; Zhu, H.; Hunag, C.; Wu, J.; Meng, S.; Chen, W. The Effects of Solvent Extraction on Nanoporosity of Marine-Continental Coal and Mudstone. Fuel 2019, 235, 72–84. [Google Scholar] [CrossRef]
  10. Guo, H.; Jia, W.; Peng, P.; Lei, Y.; Luo, X.; Cheng, M.; Wang, X.; Zhang, L.; Jiang, C. The Composition and Its Impact on the Methane Sorption of Lacustrine Shales from the Upper Triassic Yanchang Formation, Ordos Basin, China. Mar. Pet. Geol. 2014, 57, 509–520. [Google Scholar] [CrossRef]
  11. Liu, Z.; Liu, D.; Cai, Y.; Yao, Y.; Pan, Z.; Zhou, Y. Application of Nuclear Magnetic Resonance (NMR) in Coalbed Methane and Shale Reservoirs: A Review. Int. J. Coal Geol. 2020, 218, 103261. [Google Scholar] [CrossRef]
  12. Xiao, L.; Li, Z.; Yang, Y.; Tang, L.; Wan, C.; Liang, Z.; Yu, H.; Hou, Y.; Wang, L. Pore Evolution Model and Influencing Factors of Continental Shale in Yanchang Formation, Ordos Basin. Sci. Technol. Eng. 2020, 20, 8122–8132. [Google Scholar]
  13. Yang, F.; Meng, X.; Yu, X.; Yu, P.; Shao, G.; Chen, H. Micro-Pore Characteristics and Influencing Factors of Fengcheng Formation Shale in Well Maye-1. Xinjiang Pet. Geol. 2022, 43, 1. [Google Scholar]
  14. Li, Z.; Shen, X.; Qi, Z.; Hu, R. Study on the Pore Structure and Fractal Characteristics of Marine and Continental Shale Based on Mercury Porosimetry, N2 Adsorption and NMR Methods. J. Nat. Gas Sci. Eng. 2018, 53, 12–21. [Google Scholar] [CrossRef]
  15. Clarkson, C.R.; Solano, N.; Bustin, R.M.; Bustin, A.M.M.; Chalmers, G.R.L.; He, L.; Melnichenko, Y.B.; Radliński, A.P.; Blach, T.P. Pore Structure Characterization of North American Shale Gas Reservoirs Using USANS/SANS, Gas Adsorption, and Mercury Intrusion. Fuel 2013, 103, 606–616. [Google Scholar] [CrossRef]
  16. Liu, K.; Ostadhassan, M.; Sun, L.; Zou, J.; Yuan, Y.; Gentzis, T.; Zhang, Y.; Carvajal-Ortiz, H.; Rezaee, R. A Comprehensive Pore Structure Study of the Bakken Shale with SANS, N2 Adsorption and Mercury Intrusion. Fuel 2019, 245, 274–285. [Google Scholar] [CrossRef]
  17. Yang, F.; Ning, Z.; Liu, H. Fractal Characteristics of Shales from a Shale Gas Reservoir in the Sichuan Basin, China. Fuel 2014, 115, 378–384. [Google Scholar] [CrossRef]
  18. Liu, X.; Xiong, J.; Liang, L. Investigation of Pore Structure and Fractal Characteristics of Organic-Rich Yanchang Formation Shale in Central China by Nitrogen Adsorption/Desorption Analysis. J. Nat. Gas Sci. Eng. 2015, 22, 62–72. [Google Scholar] [CrossRef]
  19. Liu, K.; Ostadhassan, M.; Jang, H.W.; Zakharova, N.V.; Shokouhimehr, M. Comparison of Fractal Dimensions from Nitrogen Adsorption Data in Shale via Different Models. RSC Adv. 2021, 11, 2298–2306. [Google Scholar] [CrossRef] [PubMed]
  20. Neimark, A. A New Approach to the Determination of the Surface Fractal Dimension of Porous Solids. Phys. A 1992, 191, 258–262. [Google Scholar] [CrossRef]
  21. Wang, F.; Li, S. Determination of the Surface Fractal Dimension for Porous Media by Capillary Condensation. Ind. Eng. Chem. Res. 1997, 36, 1598–1602. [Google Scholar] [CrossRef]
  22. Wu, Y.; Liu, C.; Jiang, F.; Hu, T.; Lv, J.; Zhang, C.; Guo, X.; Huang, L.; Hu, M.; Huang, R.; et al. Geological Characteristics and Shale Oil Potential of Alkaline Lacustrine Source Rock in Fengcheng Formation of the Mahu Sag, Junggar Basin, Western China. J. Petrol. Sci. Eng. 2022, 216, 110823. [Google Scholar] [CrossRef]
  23. Hu, T.; Pang, X.; Yu, S.; Wang, X.; Pang, H.; Guo, J.; Jiang, F.; Shen, W.; Wang, Q.; Xu, J. Hydrocarbon Generation and Expulsion Characteristics of Lower Permian P1f Source Rocks in the Fengcheng Area, Northwest Margin, Junggar Basin, NW China: Implications for Tight Oil Accumulation Potential Assessment. Geol. J. 2016, 51, 880–900. [Google Scholar] [CrossRef]
  24. Song, J. Factors Influencing Factors and Evaluation of Mobility of the Fengcheng Formation Shale Oil in the Maye 1 Well Block, Mahu Sag. Master’s Thesis, China University of Petroleum (Beijing), Beijing, China, 2023. [Google Scholar]
  25. Zhu, R.; Zhang, L.; Li, Z.; Wang, R.; Zhang, S.; Zhang, L. Evaluation of Shale Oil Resource Potential in Continental Rift Basin: A Case Study of Lower Es3 Member in Dongying Sag. Pet. Geol. Recovery Effic. 2019, 26, 129–136. [Google Scholar]
  26. Guan, Z.; Liu, W.; Chen, X.; Ma, W.; Guo, S.; Tang, X. Oil Mobility of Low-Mature Lacustrine Shale and Controlling Factors: A Case Study from the Upper Cretaceous Nenjiang Formation, Gulong Sag, in the Songliao Basin. Energy Fuels 2023, 37, 3605–3621. [Google Scholar] [CrossRef]
  27. Xiao, Y.; Ye, Z.; Wang, H.; Yang, H.; Mu, N.; Ji, X.; Zhao, H. Pore Structure Characteristics of Shale Oil Reservoirs with Different Lithofacies and Their Effects on Mobility of Movable Fluids: A Case Study of the Chang 7 Member in the Ordos Basin, China. Energies 2024, 17, 862. [Google Scholar] [CrossRef]
  28. Wang, Y.; Tang, D. Geological Characteristics of Typi- Cal Shale Profile in a Saline Lacustrine Rift Basin: A Case Study of Dongying Sag. Reserv. Eval. Dev. 2022, 12, 181–191. [Google Scholar]
  29. Wu, Y.; Liu, C.; Jiang, F.; Hu, T.; Awan, R.S.; Chen, Z.; Lv, J.; Zhang, C.; Hu, M.; Huang, R.; et al. Occurrence Space and State of Petroleum in Lacustrine Shale: Insights from Two-Step Pyrolysis and the N2 Adsorption Experiment. Energy Fuels 2022, 36, 10920–10933. [Google Scholar] [CrossRef]
  30. Gong, D.; Bai, L.; Gao, Z.; Qin, Z.; Wang, Z.; Wei, W.; Yang, A.; Wang, R. Occurrence Mechanisms of Laminated-Type and Sandwich-Type Shale Oil in the Fengcheng Formation of Mahu Sag, Junggar Basin. Energy Fuels 2023, 37, 13960–13975. [Google Scholar] [CrossRef]
  31. Jiang, F.; Hu, M.; Hu, T.; Lyu, J.; Huang, L.; Liu, C.; Jiang, Z.; Huang, R.; Zhang, C.; Wu, G.; et al. Controlling Factors and Models of Shale Oil Enrichment in Lower Permian Fengcheng Formation, Mahu Sag, Junggar Basin, NW China. Pet. Explor. Dev. 2023, 50, 812–825. [Google Scholar] [CrossRef]
  32. Zhi, D.; Tang, Y.; He, W.; Guo, X.; Zheng, M.; Huang, L. Orderly Coexistence and Accumulation Models of Conventional and Unconventional Hydrocarbons in Lower Permian Fengcheng Formation, Mahu Sag, Junggar Basin. Pet. Explor. Dev. 2021, 48, 43–59. [Google Scholar] [CrossRef]
  33. Zhang, Z.; Yuan, X.; Wang, M.; Zhou, C.; Tang, Y.; Chen, X.; Lin, M.; Cheng, D. Alkaline-Lacustrine Deposition and Paleoenvironmental Evolution in Permian Fengcheng Formation at the Mahu Sag, Junggar Basin, NW China. Pet. Explor. Dev. 2018, 45, 1036–1049. [Google Scholar] [CrossRef]
  34. Wang, Z.; Gao, Z.; He, W.; Yang, L.; Huang, L.; Jiang, Z.; Chang, J.; Zheng, G.; Wei, W.; Duan, L.; et al. Using Spontaneous Imbibition to Evaluate the Hydrocarbon Migration and Accumulation Potential of Shale Reservoirs: A Case Study of the Permian Fengcheng Formation in the Mahu Sag, Junggar Basin. Energy Fuels 2023, 37, 360–372. [Google Scholar] [CrossRef]
  35. Yu, K.; Cao, Y.; Qiu, L.; Sun, P. The Hydrocarbon Generation Potential and Migration in an Alkaline Evaporite Basin: The Early Permian Fengcheng Formation in the Junggar Basin, Northwestern China. Mar. Pet. Geol. 2018, 98, 12–32. [Google Scholar] [CrossRef]
  36. Song, Y.; Yang, Z.; He, W.; Gan, R.; Zhang, R.; Huang, L.; Xu, P.; Zhao, X.; Chen, Z. Exploration Progress of Alkaline Lake Type Shale Oil of the Permian Fengcheng Formation in Mahu Sag, Junggar Basin. China Pet. Explor. 2022, 27, 60. [Google Scholar]
  37. Yang, Z.; Tang, Y.; Guo, X.; Huang, L.; Wang, Z.; Zhao, X. Occurrence States and Potential Influencing Factors of Shale Oil in the Permian Fengcheng Formation of Mahu Sag, Junggar Basin. Pet. Geol. Exp. 2021, 43, 784–796. [Google Scholar]
  38. Qian, C.; Li, X.; Shen, W.; Zhang, Q.; Guo, W.; Hu, Y.; Cui, Y.; Jia, Y. Study on the Pore Structure and Fractal Characteristics of Different Lithofacies of Wufeng–Longmaxi Formation Shale in Southern Sichuan Basin, China. ACS Omega 2022, 7, 8724–8738. [Google Scholar] [CrossRef] [PubMed]
  39. Cao, J.; Zhang, Y.; Hu, W.; Yao, S.; Wang, X.; Zhang, Y.; Tang, Y. The Permian Hybrid Petroleum System in the Northwest Margin of the Junggar Basin, Northwest China. Mar. Pet. Geol. 2005, 22, 331–349. [Google Scholar] [CrossRef]
  40. Shifa, Z.; Xiaomin, Z.; Xin, L.; Dong, W.; Dongna, Z. Authigenic Minerals and Diagenetic Evolution in Altered Volcanic Materials and Their Impacts on Hydrocarbon Reservoirs: Evidence from the Lower Permian in the Northwestern Margin of Junggar Basin, China. Arab. J. Geosci. 2016, 9, 97. [Google Scholar] [CrossRef]
  41. Wang, M.; Zhang, Z.; Zhou, C.; Yuan, X.; Lin, M.; Liu, Y.; Cheng, D. Litholo-Gical Characteristics and Origin of Alkaline Lacustrine of the Lower Permian Fengcheng Formation in Mahu Sag, Junggar Basin. J. Palaeogeogr. 2018, 20, 147–162. [Google Scholar]
  42. Liu, B.; Bai, L.; Chi, Y.; Jia, R.; Fu, X.; Yang, L. Geochemical Characterization and Quantitative Evaluation of Shale Oil Reservoir by Two-Dimensional Nuclear Magnetic Resonance and Quantitative Grain Fluorescence on Extract: A Case Study from the Qingshankou Formation in Southern Songliao Basin, Northeast China. Mar. Pet. Geol. 2019, 109, 561–573. [Google Scholar] [CrossRef]
  43. SY/T 6210-1996; X-ray Diffraction Analysis Method of Clay Minerals and Common Non-Clay Minerals in Sedimentary Rocks. National Energy Administration: Beijing, China, 2010.
  44. GB/T 19145-2003; Determination of Total Organic Carbon in Sedimentary Rocks. General Administration of Quality Supervision. Inspection and Quarantine of the People’s Republic of China: Beijing, China, 2003.
  45. GB/T 18602-2012; Rock Pyrolysis Analysis. General Administration of Quality Supervision. Inspection and Quarantine of the People’s Republic of China: Beijing, China, 2012.
  46. SY/T 6154-1995; Static Nitrogen Adsorption Capacity Method for Determination of Rock Specific Surface and Pore Size Distribution. National Energy Administration: Beijing, China, 1995.
  47. Brunauer, S.; Emmett, P.H.; Teller, E. Adsorption of Gases in Multimolecular Layers. J. Am. Chem. Soc. 1938, 60, 309–319. [Google Scholar] [CrossRef]
  48. Barrett, E.P.; Joyner, L.G.; Halenda, P.P. The Determination of Pore Volume and Area Distributions in Porous Substances. I. Computations from Nitrogen Isotherms. J. Am. Chem. Soc. 1951, 73, 373–380. [Google Scholar] [CrossRef]
  49. Pfeifer, P.; Avnir, D. Chemistry in Noninteger Dimensions between Two and Three. I. Fractal Theory of Heterogeneous Surfaces. J. Chem. Phys. 1983, 79, 3558–3565. [Google Scholar] [CrossRef]
  50. Li, Y.; Wang, Z.; Pan, Z.; Niu, X.; Yu, Y.; Meng, S. Pore Structure and Its Fractal Dimensions of Transitional Shale: A Cross-Section from East Margin of the Ordos Basin, China. Fuel 2019, 241, 417–431. [Google Scholar] [CrossRef]
  51. Li, Z.; Song, M.; Li, Y.; Liu, H.; Xu, C.; Wang, D.; Kong, F.; Han, Q. Petrographic Classification of Lacustrine Fine-Grained Rocks Using a Two-Level Index Division Method and a Case Study of Its Application. Geoscience 2021, 35, 365. [Google Scholar]
  52. Tissot, B.P.; Welte, D.H. Petroleum Formation and Occurrence; Springer Science & Business Media: Berlin/Heidelberg, Germany, 2013. [Google Scholar]
  53. Zhi, D.; Cao, J.; Xiang, B.; Qin, Z.; Wang, T. Fengcheng Alkaline Lacustrine Source Rocks of Lower Permian in Mahu Sag in Junggar Basin: Hydrocarbon Generation Mechanism and Petroleum Resources Reestimation. Xinjiang Pet. Geol. 2016, 37, 1. [Google Scholar]
  54. Jiang, F.; Huang, R.; Hu, T.; Lv, J.; Huang, L.; Jiang, Z.; Hu, M.; Zhang, C.; Wu, G.; Wu, Y. Geological Characteristics and Classification Evaluation of Shale Oil in Fengcheng Formation in Mahu Sag, Junggar Basin. Acta Pet. Sin. 2022, 43, 899. [Google Scholar]
  55. Li, T.; Jiang, Z.; Xu, C.; Liu, B.; Liu, G.; Wang, P.; Li, X.; Chen, W.; Ning, C.; Wang, Z. Effect of Pore Structure on Shale Oil Accumulation in the Lower Third Member of the Shahejie Formation, Zhanhua Sag, Eastern China: Evidence from Gas Adsorption and Nuclear Magnetic Resonance. Mar. Pet. Geol. 2017, 88, 932–949. [Google Scholar] [CrossRef]
  56. Sing, K.S. Reporting Physisorption Data for Gas/Solid Systems with Special Reference to the Determination of Surface Area and Porosity (Recommendations 1984). Pure Appl. Chem. 1985, 57, 603–619. [Google Scholar] [CrossRef]
  57. Liu, S.; Cai, J.; Liu, H.; Li, X.; Li, Z.; Bao, Y. A New Classification Method of Shale Reservoirs Based on the Relationship between Pore Volume and Surface Area: Shahejie Formation, Jiyang Depression, and Bohai Bay Basin. Energy Fuels 2023, 37, 13785–13798. [Google Scholar] [CrossRef]
  58. Yao, Y.; Liu, D.; Tang, D.; Tang, S.; Huang, W. Fractal Characterization of Adsorption-Pores of Coals from North China: An Investigation on CH4 Adsorption Capacity of Coals. Int. J. Coal Geol. 2008, 73, 27–42. [Google Scholar] [CrossRef]
  59. Lei, H.; Qi, J.; Zhou, N.; Chen, J.; Meng, Y.; Zhang, X.; Chen, R. Genesis and Petroleum Significance of Silica-Rich Shale in Fengcheng Formation of Well Maye-1, Mahu Sag. Xinjiang Pet. Geol. 2022, 43, 724. [Google Scholar]
  60. Bai, L.-H.; Liu, B.; Du, Y.-J.; Wang, B.-Y.; Tian, S.-S.; Wang, L.; Xue, Z.-Q. Distribution Characteristics and Oil Mobility Thresholds in Lacustrine Shale Reservoir: Insights from N2 Adsorption Experiments on Samples Prior to and Following Hydrocarbon Extraction. Pet. Sci. 2022, 19, 486–497. [Google Scholar] [CrossRef]
  61. Kuila, U.; McCarty, D.K.; Derkowski, A.; Fischer, T.B.; Topór, T.; Prasad, M. Nano-Scale Texture and Porosity of Organic Matter and Clay Minerals in Organic-Rich Mudrocks. Fuel 2014, 135, 359–373. [Google Scholar] [CrossRef]
Figure 1. (a) Structural setting of the Mahu Sag, Junggar Basin and sampling location of Well X; (b) columnar graph of lithology of Well X (modified from [30,38]).
Fractalfract 08 00242 g001
Figure 2. Triangular plot of shale mineral composition (modified from [30]).
Fractalfract 08 00242 g002
Figure 3. Intersection diagram of organic matter-type classification (modified from [50]).
Fractalfract 08 00242 g003
Figure 4. Types of hysteresis loops from the IUPAC standard (modified from [56]).
Fractalfract 08 00242 g004
Figure 5. Isothermal adsorption–desorption curves of typical samples before and after extraction.
Fractalfract 08 00242 g005
Figure 6. Changes in pore structure of samples before and after oil extraction.
Fractalfract 08 00242 g006
Figure 7. The Wang–Li fractal analysis of sample #8 (adsorption branch).
Fractalfract 08 00242 g007
Figure 8. Relationships between fractal dimension and TOC (a), specific surface area (b), pore volume (c) and average pore diameter (d) of Type I samples.
Fractalfract 08 00242 g008
Figure 9. Relationships between fractal dimension and TOC (a), specific surface area (b), pore volume (c) and average pore diameter (d) of Type II samples.
Fractalfract 08 00242 g009
Table 1. Sample number, depth, lithology and mineralogical parameters obtained by XRD analysis.
Sample
Number
DepthLithologyQtz + FspTotal CarbTotal ClayPyriteType
(m)(wt.%)(wt.%)(wt.%)(wt.%)(wt.%)
14716.34Argillaceous silty dolomite29.762.54.23.6I
24738.73Dolomitic mudstone45.140.69.54.8III
34740.43Silty argillaceous dolomite50.939.26.43.5II
44744.9Silty dolomitic mudstone61.633.12.52.7II
54751.36Dolomitic mudstone3850.59.91.7I
64759.42Argillaceous dolomite41.552.54.41.5I
74766.56mudstone54.738.73.73.0II
84773.99Silty argillaceous fine sandstone66.622.63.27.6II
94790.94Dolomite argillaceous fine sandstone6625.62.94.4II
104799.67Dolomite silty mudstone39.9563.11.1I
114800.45Dolomitic mudstone46.749.82.31.2I
124800.98Silty mudstone5733.14.35.5II
134802.2Argillaceous dolomitic fine sandstone36.14413.73.8III
144804.95Dolomitic fine sandstone69.915.56.66.8II
154816.79Calcareous mudstone40.855.31.22.7I
164830.31Fine sandy dolomite56.432.65.73.8II
174835.28Silty dolomite37.950.47.44.3I
184850.43Silty argillaceous fine sandstone61.316.89.27.6II
194851.11Dolomitic silty mudstone61.616.397.2II
Note: Qtz = Quartz; Fsp = Feldspar; Total Crab = Total Carbonate (dolomite + calcite).
Table 2. TOC content, and Rock-Eval parameters obtained from quantitative phase analysis of samples.
TypeSample
Number
TOC-OriginalTOC-ExtractedS1S2TmaxHI
(wt.%)(wt.%)(mgHC/grock)(mgHC/grock)(°C)(mgHC/gTOC)
I10.830.50.881.09424.1131.71
50.920.680.421.93440.1209.23
60.620.380.270.87432.1140.42
100.720.560.752.19436.8302.86
110.540.450.351.47438.2273.12
150.760.574.292.55421.6335.47
171.040.940.120.87424.683.45
Average0.780.58////
II31.070.640.211.58431.1147.49
41.420.840.522.33437.1164.4
70.720.440.971.42432.3198.05
81.060.850.162.36440.1223.09
90.460.270.820.89420.7193.86
121.330.831.212.01431.3150.84
140.820.560.311.85433.6226.98
160.580.430.261.18436.8205.72
180.770.31.061.39425.7181.26
190.780.380.721.24429.7159.57
Average0.900.55////
Note: TOC = Total Organic Carbon; S1 = the Free Hydrocarbon; S2 = the Cracking Hydrocarbon; Tmax = the Thermal Maturity Parameter; HI = Hydrogen Index.
Table 3. Calculating the fractal dimension of shale samples using Wang–Li fractal theory.
Type IType II
SamplesDoriginalDextractedΔDSamplesDoriginalDextractedΔD
12.22982.23060.000832.24252.2406−0.0019
52.24992.25080.000942.31572.3093−0.0064
62.20992.21310.003272.2262.2256−0.0004
102.22572.22610.000482.27562.3210.0454
112.19212.1911−0.00192.22822.2340.0058
152.23472.2307−0.004122.40242.40540.003
172.20222.2004−0.0018142.23352.2329−0.0006
162.17592.17650.0006
182.30962.31240.0028
192.33672.33730.0006
Average2.22062.2204−0.0002Average2.27462.27950.0049
Note: Doriginal = fractal dimension of shale samples before oil extraction; Dextracted = fractal dimension of shale samples after oil extraction; ΔD = difference in fractal dimension before and after extraction, namely Dextracted minus Doriginal.
Disclaimer/Publisher’s Note: The statements, opinions and data contained in all publications are solely those of the individual author(s) and contributor(s) and not of MDPI and/or the editor(s). MDPI and/or the editor(s) disclaim responsibility for any injury to people or property resulting from any ideas, methods, instructions or products referred to in the content.

