
Impact of Plant-Based Amendments on Water-Soluble Nitrogen Release Dynamics in Cultivated Peatlands


1
Department of Environmental System Sciences, Institute of Agricultural Sciences, ETH Zürich, 8092 Zürich, Switzerland
2
Soil and Agri-Food Engineering Department, Laval University, Québec, QC G1V 0A6, Canada
*
Author to whom correspondence should be addressed.
Nitrogen 2022, 3(3), 426-443; https://doi.org/10.3390/nitrogen3030028
Submission received: 4 June 2022
/
Revised: 20 July 2022
/
Accepted: 21 July 2022
/
Published: 23 July 2022
(This article belongs to the Special Issue Soil Nitrogen Supply: Linking Plant Available N to Ecosystems Functions and Productivity II)
Abstract
:Drained cultivated peatlands have been an essential agricultural resource for many years. To slow and reduce the degradation of these soils, which increases with drainage, the use of plant-based amendments (straw, wood chips, and biochar) has been proposed. Literature on the effects of such amendments in cultivated peatlands is scarce, and questions have been raised regarding the impact of this practice on nutrient cycling, particularly nitrogen (N) dynamics. By means of a six-month incubation experiment, this study assessed the effects of four plant-based amendments (biochar, a forest mix, willow, and miscanthus) on the release kinetics of water-soluble N pools (mineral and organic) in two histosols of differing degrees of decomposition (Haplosaprist and Haplohemist). The amendment rate was set at 15 Mg ha−1 on a dry weight basis. The N release kinetics were significantly impacted by soil type and amendment. Miscanthus and willow were the amendments that most reduced the release of soluble organic N (SON) and mineral N (minN). The addition of plant-based amendments reduced the total amount of released N pools during the incubation (cumulative N pools) by 50.3 to 355.2 mg kg−1, depending on the soil type, the N pool, and the type of amendment. A significant relationship was found between microbial biomass N, urease activity, and the cumulative N at the end of the incubation. The results showed that the input of plant-based amendments in cultivated peatland decreases N release, which could have a beneficial impact by decreasing N leaching; however, it could also restrict crop growth. Further research is needed to fully assess the impact of such amendments used in cultivated peatlands on N and on C fluxes at the soil–plant and soil–atmosphere interfaces to determine if they constitute a long-term solution for more sustainable agriculture.
1. Introduction
Peatlands, which are classified as histosols [1], are an essential part of the terrestrial ecosystems and play an important role in climate regulation, as they have the capacity to store atmospheric carbon when in their natural state [2]. They also contribute to the ecosystem by retaining water and cycling nutrients, in addition to their use for food production [3]. When used for agricultural purposes, peatlands need to be drained to meet the oxygen requirements of plants [2,4]. This practice has been implemented in multiple regions in previous years: in the Everglades (FL, USA) [5,6]; in eastern Canada [7]; and in many European and Asian countries [3]. Although drained peatland seems to be an ideal substrate for intensive agriculture, principally for high-value crops, drainage has been found to initiate soil degradation processes. Subsidence, soil erosion, and soil organic matter mineralization in drained peatlands are estimated to causes losses of 1.0 to 7.9 cm of soil per year [5,8,9,10,11,12,13]. This degradation also has a significant impact on organic matter quality and nutrient cycling, as shown by Morris & Gilbert [14] and Snyder [15]. The mineralization rate of soil organic matter in cultivated peatland is dependent on many factors, including the depth and density of the drainage system, the hydraulic properties of the soil, the water regime, climate and land use, and the stage of peat decomposition [16,17,18]. More intensive drainage leads to more oxidizing conditions in the soil [16,19]. To reduce carbon dioxide (CO2) losses, different solutions have been proposed, ranging from paludiculture to wet extensive pasture, and to complete rewetting to a natural state [20]. Other conservation practices may also help reduce the negative environmental impacts of using peatlands for agricultural purposes, such as reducing tillage [21,22], cultivating cover crops [23], or raising the water table [24,25], which reduces the mineralization of organic matter [26,27,28].
Using plant-based amendments, such as miscanthus straw or willow chips, in cultivated peatlands could also extend their useful life for vegetable crop production [7]. However, the addition of amendments such as straw has produced mixed results for sequestration and C cycling [29]. Adding exogenous material has been shown to lead to a priming effect, which can either increase or decrease decomposition in cultivated peatlands (−14.8‰ to 14.9‰ of δ13C after the addition of fresh organic matter) [2]. Biochar, another plant-based amendment, has been studied extensively for mineral soil [30]. Research into the influence of this amendment on soil fertility suggests that biochar may contribute to N sequestration [31,32]. The mechanisms underlying this N sequestration include adsorption of NH3 or organic N onto the negatively charged sites of the biochar, and increased immobilization of N due to the labile C contained in the biochar [33]. N immobilization can be seen as positive, preventing N from leaching into the environment, or negative, if crops’ requirements are not met or if the N is immobilized for a long period of time.
While carbon cycling in natural and cultivated peatlands has been widely studied [34,35], nutrient cycles, particularly those of P and N, are less documented. Hanlon et al. [36] studied the mineralization of N in the Everglades under fully aerobic and partially flooded conditions and found that flooded soils leached less total N than drained soils (217 to 509 kg ha−1yr−1 for the drained soils vs. 168 to 345 kg ha−1yr−1 for the flooded soils), and that drained soils lost N predominantly in nitrate form (67%), while flooded soils lost only 3% of their N in nitrate form. Duguet [37] examined N mineralization in Quebec’s histosols and found that an average of 250 kg ha−1 of mineral N was released per year. Uncertainties remain about the impact of conservation practices such as the addition of plant-based amendments to peatlands for both short- and long-term cultivation because no extensive studies have been performed to quantify the effect of plant-based amendments on the N cycle. Beneficial (reduction in N loss), as well as the harmful consequences (impact on plant growth) of this conservation practice, need to be investigated.
The objective of this study was, therefore, to use a 6-month aerobic incubation to evaluate N release from two contrasting histosols amended with four distinct plant-based materials. We hypothesized that (1) the release of mineral N (minN) is more importantly reduced under the plant-based amendment compared to the soluble organic N (SON), (2) that the release reduction intensity will attenuate with time for both pools, and that (3) the woody plant-base amendments have the strongest impact on the N release pools.
2. Materials and Methods
2.1. Soils
Two histosols of different degrees of decomposition were used in this study. The first, classified as a well-decomposed Haplosaprist [1], was collected from a field in southwestern Quebec, Canada (45°10′04″ N, 73°40′34″ W) that has cultivated lettuce and onion in rotation for the past 50 years and is fertilized with approximately 18 kg ha−1 of phosphorus and 108 kg ha−1 of N per year. The second, classified as a moderately decomposed Haplohemist [1], was collected from another field in southwestern Quebec, Canada (45°08′12″ N, 73°29′22″ W). This soil was drained in 2010 and has been used as an experimental site since then. No fertilizer was applied to either site in the year before sampling.
The soils were sampled in October 2019 at a depth of 25 cm using a typical auger. The samples were dried at 60 °C for 24 h and were then hand crushed but not sieved. The initial composition of both soils is presented in Table 1.
The Haplosaprist was characterized by a higher bulk density, pH, EC and total Al, Fe contents. The Haplohemist was characterized by a higher C, C:N ratio and P content. The soils were initially characterized following standard procedures [38]. At the end of the incubation period, microbial biomass N was measured following the fumigation-extraction method of Voroney et al. [39]. Urease activity was measured following the method of Kandeler and Gerber [40]. The method comprises incubation of soil with a buffered urease solution, extraction of ammonium in KCl and HCl, followed by colorimetric ammonium determination via a modified indophenol reaction. More precisely, five grams of soil was placed in 100 mL Erlenmeyer flasks and wetted with 2.5 mL 0.72 M urea solution and 20 mL borate buffer at pH 10.0. Incubation, filtration, and colorimetric determinations were then carried out as described above, with 30 mL 1 MKC1 to 0.01 MHC1 added at the end of incubation. Urease is the enzyme that hydrolyzes urea and is considered to be a good proxy of N mineralization [41].
2.2. Amendments
Four plant-based amendments were used in this study: (1) Miscanthus (Miscanthus x giganteus); (2) willow (Salix myabeana); (3) a forest mix sampled on the edge of ditches next to the roads in farms collaborating in this project, with the predominant species being Acer negundo; and (4) BiocharFX from Airex Energy Inc., (Bécancour, Canada) which is the product of the pyrolysis at 350 °C of sawmill conifer residues. The miscanthus, willow and forest mix amendments were all chopped to obtain an approximate particle size of 5 to 10 cm (Figure 1).
Willow and miscanthus were chosen as amendments because of their potential for on-site biomass production, while the forest mix is a readily available material. Biochar, known for its multiple benefits [42], was chosen for comparative purposes.
The properties of the four amendments were characterized following standard procedures and are presented in Table 2.
Total C and N were measured by dry combustion, as described by Rutherford et al. [43] and Skjemstad and Baldock [44]. A LECO 828 instrument was used to combust the material gradually, and the resulting gas was transferred to a thermal conductivity cell to identify N and a non-dispersive infrared cell to detect C. The fiber composition (hemicellulose, cellulose and lignin) of the amendments was characterized with an Ankom 200/220 fiber analyzer (Ankom Technology Corp., Macedon, NY, USA) according to the AFNOR standard XPU44-162 (AFNOR, 2005) [45] and the extraction method of Robin [46].
2.3. Experimental Design
A total of 30 samples were analyzed: 2 soil types (Haplosaprist and Haplohemist) and 5 treatments (miscanthus, willow, forest mix, biochar, and control without amendment), repeated 3 times. The soil (80 g of air-dried soil) and amendments (1.92 g of dried amendment) were gently mixed together in Büchner funnel-like containers using a small spoon. The soil/amendment mixtures were maintained close to a water content of 0.60 kg kg−1 throughout the experiment. All samples were incubated in a room at 25 °C and 90% atmospheric humidity. The amendment rate chosen was 24 g kg−1 (eq. equivalent to 15 t ha−1) on a dry weight basis. This rate was chosen based on the results of Dessureault-Rompré et al. [7], who observed in an in situ decomposition experiment that this rate would be sufficient to compensate for annual carbon loss in a moderately degraded cultivated peatland. The experimental units were randomized.
2.4. Incubation, Leaching Procedure and Leachate Analyses
The samples were incubated for a total of 26 weeks. The leaching method was adapted from that of Stanford & Smith [47] by using Buchner funnels instead of leaching tubes. The soil samples were leached at time 0 (T0), and then every 2 weeks from week 2 (T2) to week 14 (T14), and every 4 weeks from week 14 to week 26 (T26). Two hundred mL of a solution of 0.01 M CaCl2 was used for the leaching procedure. The leachates were filtered through No. 42 Whatman filters, divided into two 50 mL flasks and frozen until analysis.
The leachates were analyzed for total dissolved organic carbon, total soluble nitrogen (TSN), mineral forms of nitrogen (NH4+ + NO3−), and total phosphorus and orthophosphate. This paper focuses on the mineral nitrogen and TSN data. The TSN pool includes a pool of mineral N (minN) and a pool of soluble organic N (SON); these pools have been found to be quantitatively comparable in mineral soils [48] and in cultivated peatlands [49]. The present study investigated both pools in order to gain insights into N cycling and investigate whether the plant-based amendment had a more pronounced impact on one or the other of these N pools. More details on carbon and phosphorus analysis are provided in Marmier [50]. NH4+ and NO3− concentrations were quantified with a Flow Injection Analysis System Quikchem 8500 Series 2 system (Lachat Instruments), using Quikchem methods 10-107-06-2-B and 12-107-04-1-F, respectively. NH4+ and NO3− were not considered separately; they were summed up and referred to as the mineral N pool. TSN in the leachates was measured using the same system with prior persulfate oxidation, according to the procedure described by Qualls [51]. Soluble organic N (SON) was calculated by subtracting NO3− and NH4+ from TSN. SON corresponds to particles smaller than 2.5 μm (pore diameter of No. 42 Whatman paper).
2.5. Data Analysis
All data analyses (regression, statistical analysis, data visualization) were performed using the RStudio ggplot and emmeans packages (RStudio Team, 2020) [52].
2.6. Kinetic Model
The amounts of minN (NH4+ + NO3−), TSN, and SON released into the solution with time were modeled with two equations, a first-order and a zero + first-order model, that were demonstrated to be effective in the work of Dessureault-Rompré et al. [53]. In the present study, the zero + first-order model was determined to be the best kinetic model, based on statistical criteria such as the root mean square error and the pseudo R2, and is as follows (Equation (1)):
where M(t) is the amount of N released at time t, M1 is a depleting first-order pool (labile N pool), k1 is the release rate constant of M1, and k2 is the rate constant of a non-depleting zero-order pool (stable N pool in which N is released at a constant rate).
2.7. Statistical Analysis—ANOVA
The tolerance level for statistical analysis was determined to be at p = 0.05. A two-way analysis of variance (ANOVA), with factors defined as soil type and amendment, was performed on the whole dataset on parameters extracted from the cumulative release kinetic curves. The normality of residues and the homogeneity of the variance were checked with a Shapiro–Wilk test and a Levene test. Outliers were identified by looking at the distribution of the residues and removed if judged to be inadequate in the data set. Statistical analysis was performed on the estimated means with Tukey adjustment. Tukey’s post hoc test was systematically conducted to assess the statistical differences between the different treatments and the control. In the result tables, stars were used to describe levels of significance: 1 star (*) when 0.01 < p < 0.05, 2 stars (**) when 0.001 < p < 0.01, and 3 stars (***) when p < 0.001. Statistics analyses were performed on the kinetic parameters and on the cumulative data at the end of the incubation (T26 for time 26 week).
3. Results
3.1. Release Curves and Kinetic Parameters
In both histosols and over the entire incubation period, the release of TSN and minN, was considerably impacted by the amendments applied (Figure 2). The cumulative curves were reduced under all amendments and the released quantities decreased over time for each treatment; this effect was observed with increasing strength in the following order: biochar < forest mix < willow = miscanthus (Figure 2).
The kinetic parameters (Table 3) were extracted from each of the cumulative release curves. For TSN, in both soils, M1, the labile N pool, decreased systematically from the control ≥ biochar > forest mix > willow ≥ miscanthus.
For the Haplosaprist (more decomposed histosol), the M1 parameter estimates differed from the control by −37% for biochar, −48% for the forest mix, −70% for willow, and −76% for miscanthus. The M1 mineralization rate, k1, was not affected by the amendments. The stable N pool, k2, was significantly lower in the forest mix, miscanthus, and willow treatments compared to the control, with the reduction in the pool size ranging from −50% to −55%. For the Haplohemist (less decomposed histosol), the differences in the M1 estimates observed in relation to the control were −19% for biochar, −41% for the forest mix, −82% for willow, and −80% for miscanthus. In this soil, k1 was significantly higher in the miscanthus- and willow-amended treatments, while k2 was not significantly influenced by the amendments (Table 3).
For minN, in the Haplosaprist (more decomposed histosol), the difference in the M1 parameter estimates between the control and the amended soils was not significant for biochar, but was −51% for the forest mix, −60% for willow, and −79% for miscanthus. As opposed to the findings for the k1 estimate for TSN, k1 for the minN data was significantly reduced in the amended treatments: −58% for biochar, −52% for the forest mix, −65% for miscanthus, and −80% for willow. Finally, k2 was significantly lower in all amended treatments: −39% for biochar, −64% for the forest mix, −68% for miscanthus, and −79% for willow (Table 3). In the Haplohemist (less decomposed histosol), the M1 parameter estimates also decreased in the amended treatments: −30% for the forest mix, −81% for miscanthus, and −79% for willow. The results obtained for k1 were significant only for the miscanthus-amended treatment, where k1 increased by 134% compared to the control treatment. Finally, for k2, the forest mix, miscanthus, and willow amendments decreased this estimated pool size by 64%, 61%, and 62%, respectively (Table 3).
3.2. Cumulative Data at the End of the Incubation
Cumulative data can be used to compare the N pools (measured TSN and minN and calculated SON) recovered in the leachates during the 26 weeks incubation (Table 4). In the Haplosaprist (more decomposed histosol), the reduction in the cumulative TSN released ranged from −13% to −65%, with miscanthus and willow having the greatest impact. Similarly, the reduction in cumulative MinN recovered in the leachates ranged from −25% to −73%, with the intensity of the release reduction increasing from biochar to the forest mix to willow to miscanthus. For SON, the reductions observed for the forest mix, miscanthus, and willow treatments were not significant. In the Haplohemist (less decomposed histosol), the reduction in the cumulative TSN released ranged from −18% to −72%, with miscanthus and willow having the greatest impact. Similarly, the reduction in the cumulative minN recovered in the leachates ranged from −17% to −74%, with the impact increasing from biochar to the forest mix to willow and miscanthus. Finally, cumulative SON was reduced by 54% in the miscanthus-amended treatment and by 65% in the willow-amended treatment.
3.3. Microbial Biomass N and Enzymatic Activity
Microbial biomass N and urease activity were measured in the soil samples at the end of the incubation period. Biochar amendment did not significantly influence either the microbial biomass N or the urease activity. The addition of amendments to the Haplosaprist increased microbial biomass N significantly compared to the control: forest mix +82%, willow +230%, and miscanthus +90% (Figure 3A). The addition of amendments to the Haplohemist also increased microbial biomass N significantly: forest mix +36% (p < 0.1), miscanthus +109%, and willow +180%. A similar trend was observed for urease activity (Figure 3B). For the Haplosaprist, the addition of plant-based amendments significantly increased urease activity compared to the control: forest mix +59%, willow +60%, and miscanthus +77%. For the Haplohemist, the addition of soil amendments did increase urease activity, but the increases were not significant: forest mix +41%, miscanthus +39%, and willow +60%. Overall, urease activity was lower in the Haplohemist (less decomposed soil) than in the Haplosaprist (more decomposed soil).
A significant linear relationship was observed between cumulative leached TSN, minN, SON, and the microbial biomass N content (Figure 4).
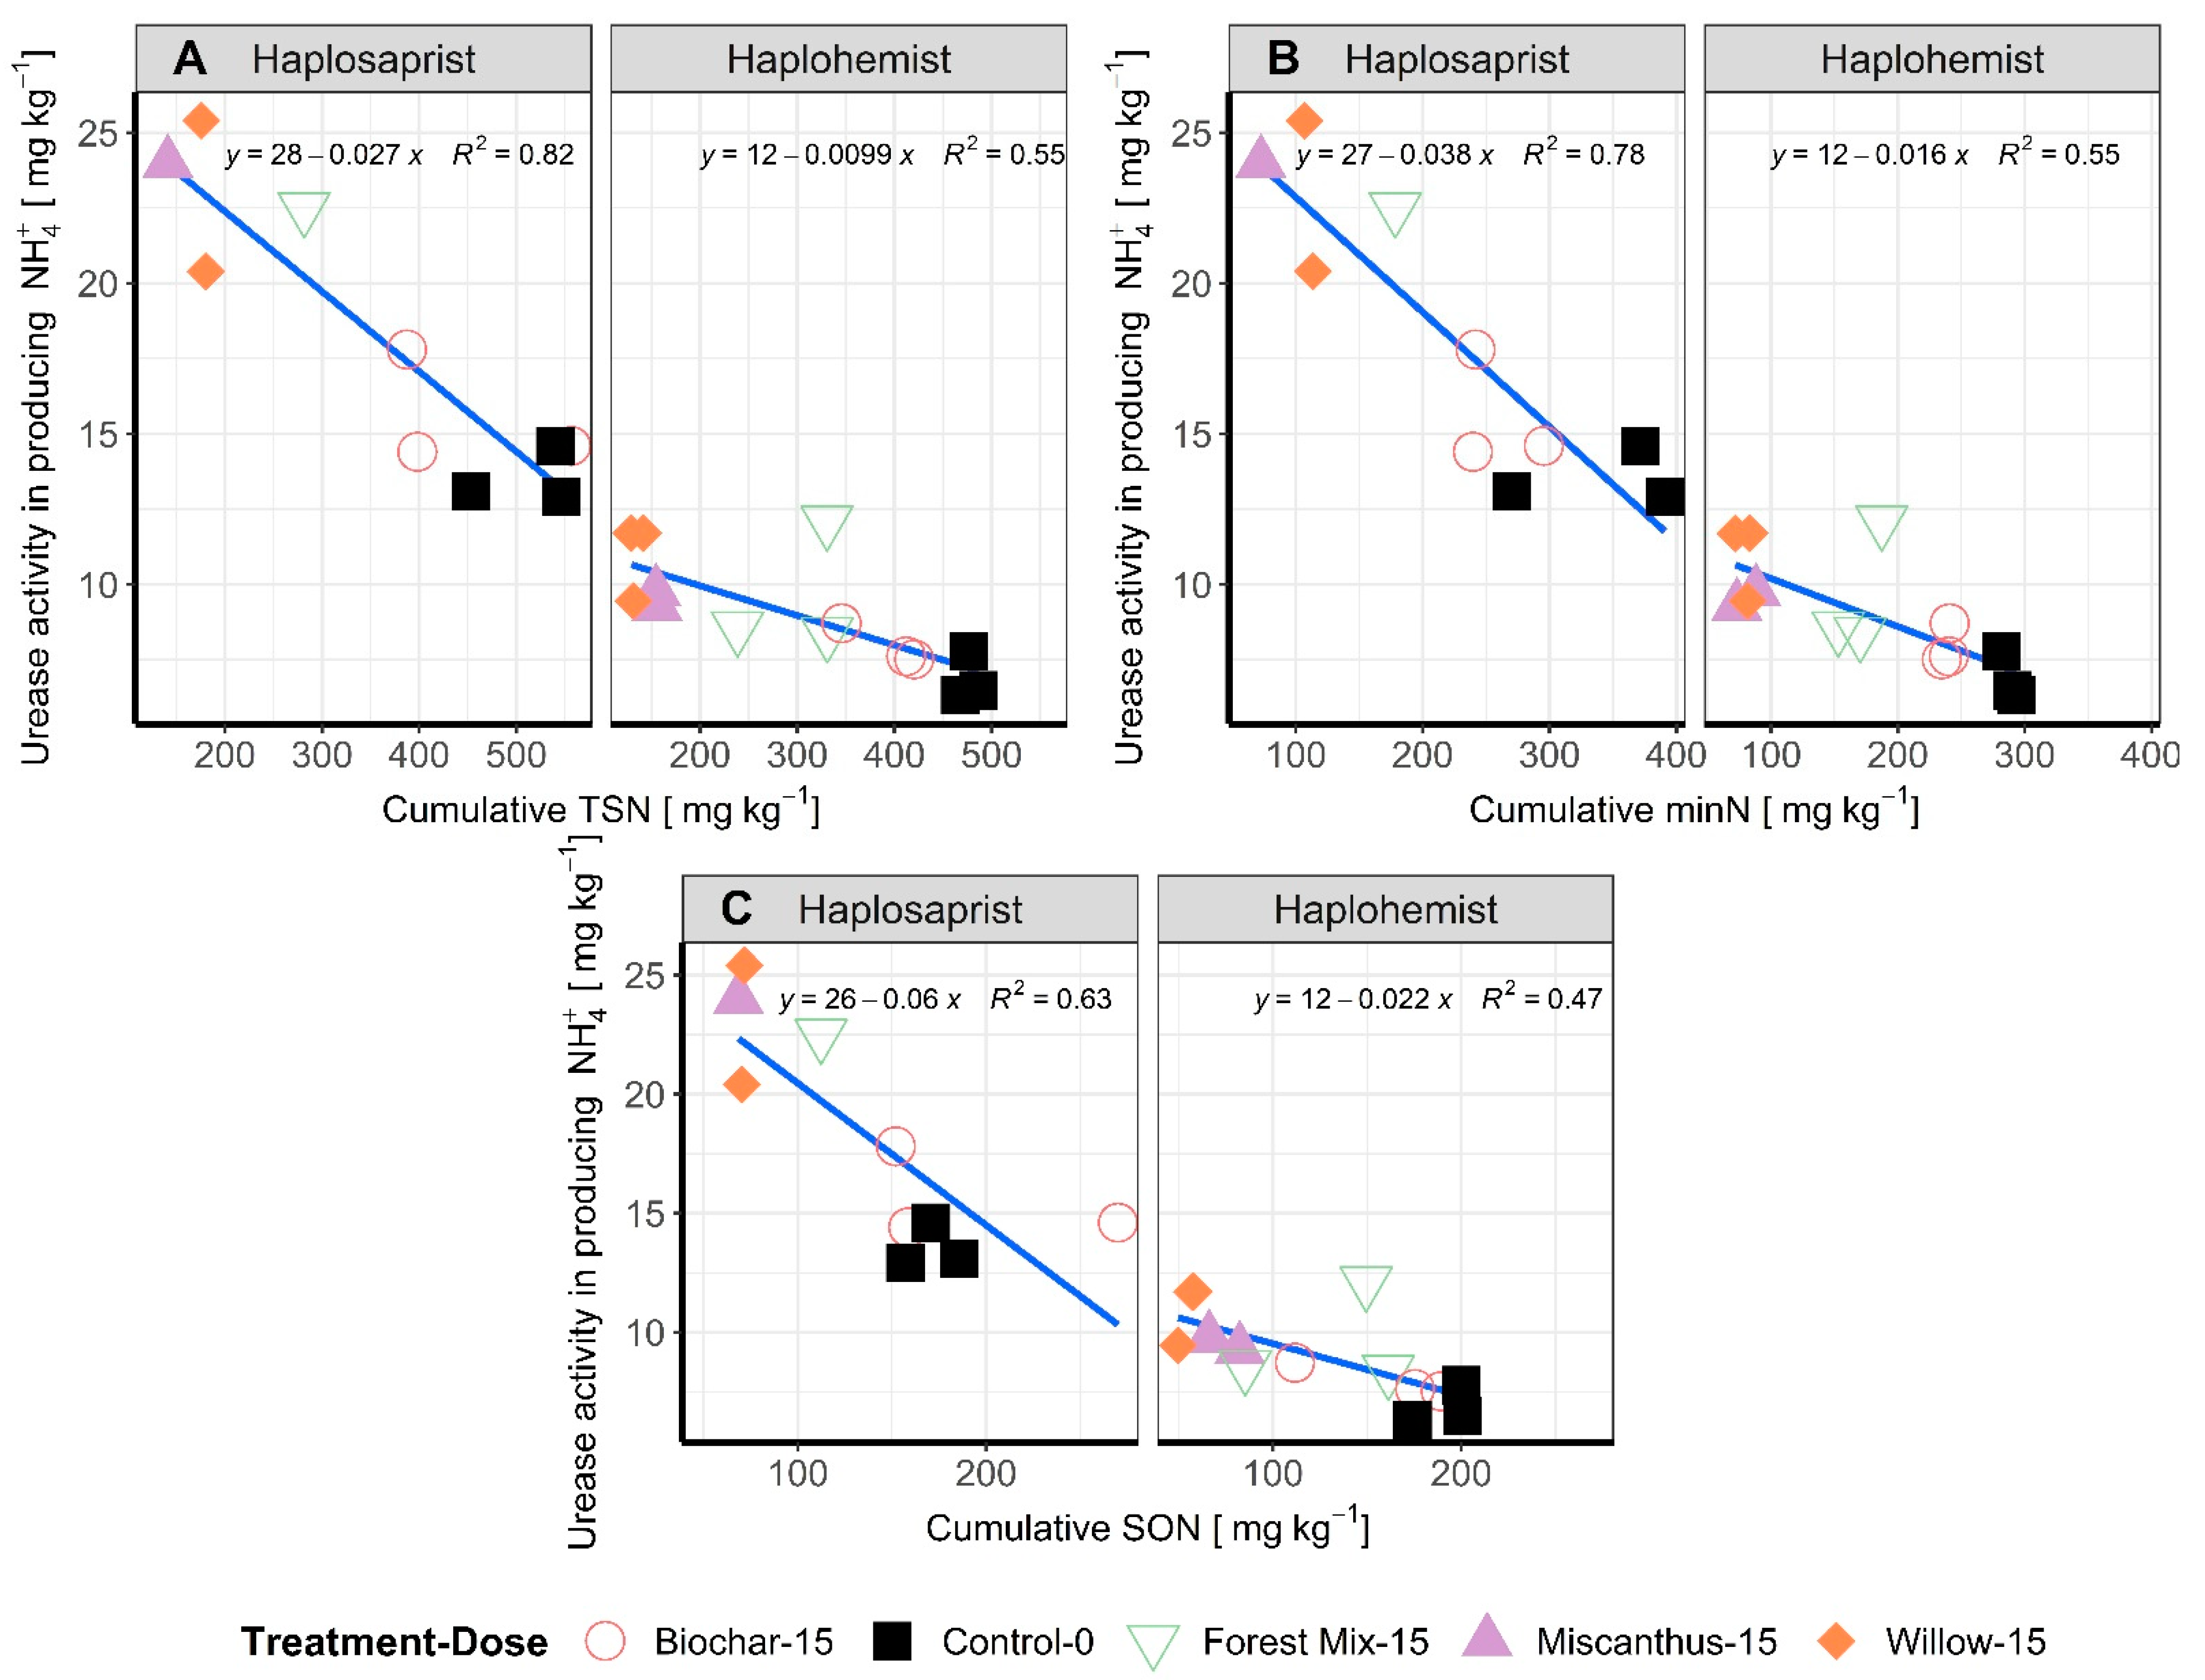
The variability observed in the measured and calculated N pools was explained by close to 50% by the microbial N content, which increased as the N pools released in the leachate decreased. The same behavior was observed with the urease activity (Figure 5) which shows an increase in activity with decreasing N pools recovery in the leachate. The urease activity was highly related to the cumulative amount of N pools, with R2 varying between 47% and 82% depending on N pool and soil type.
3.4. MinN:TSN Ratios as Influenced by Soil Type and Amendment
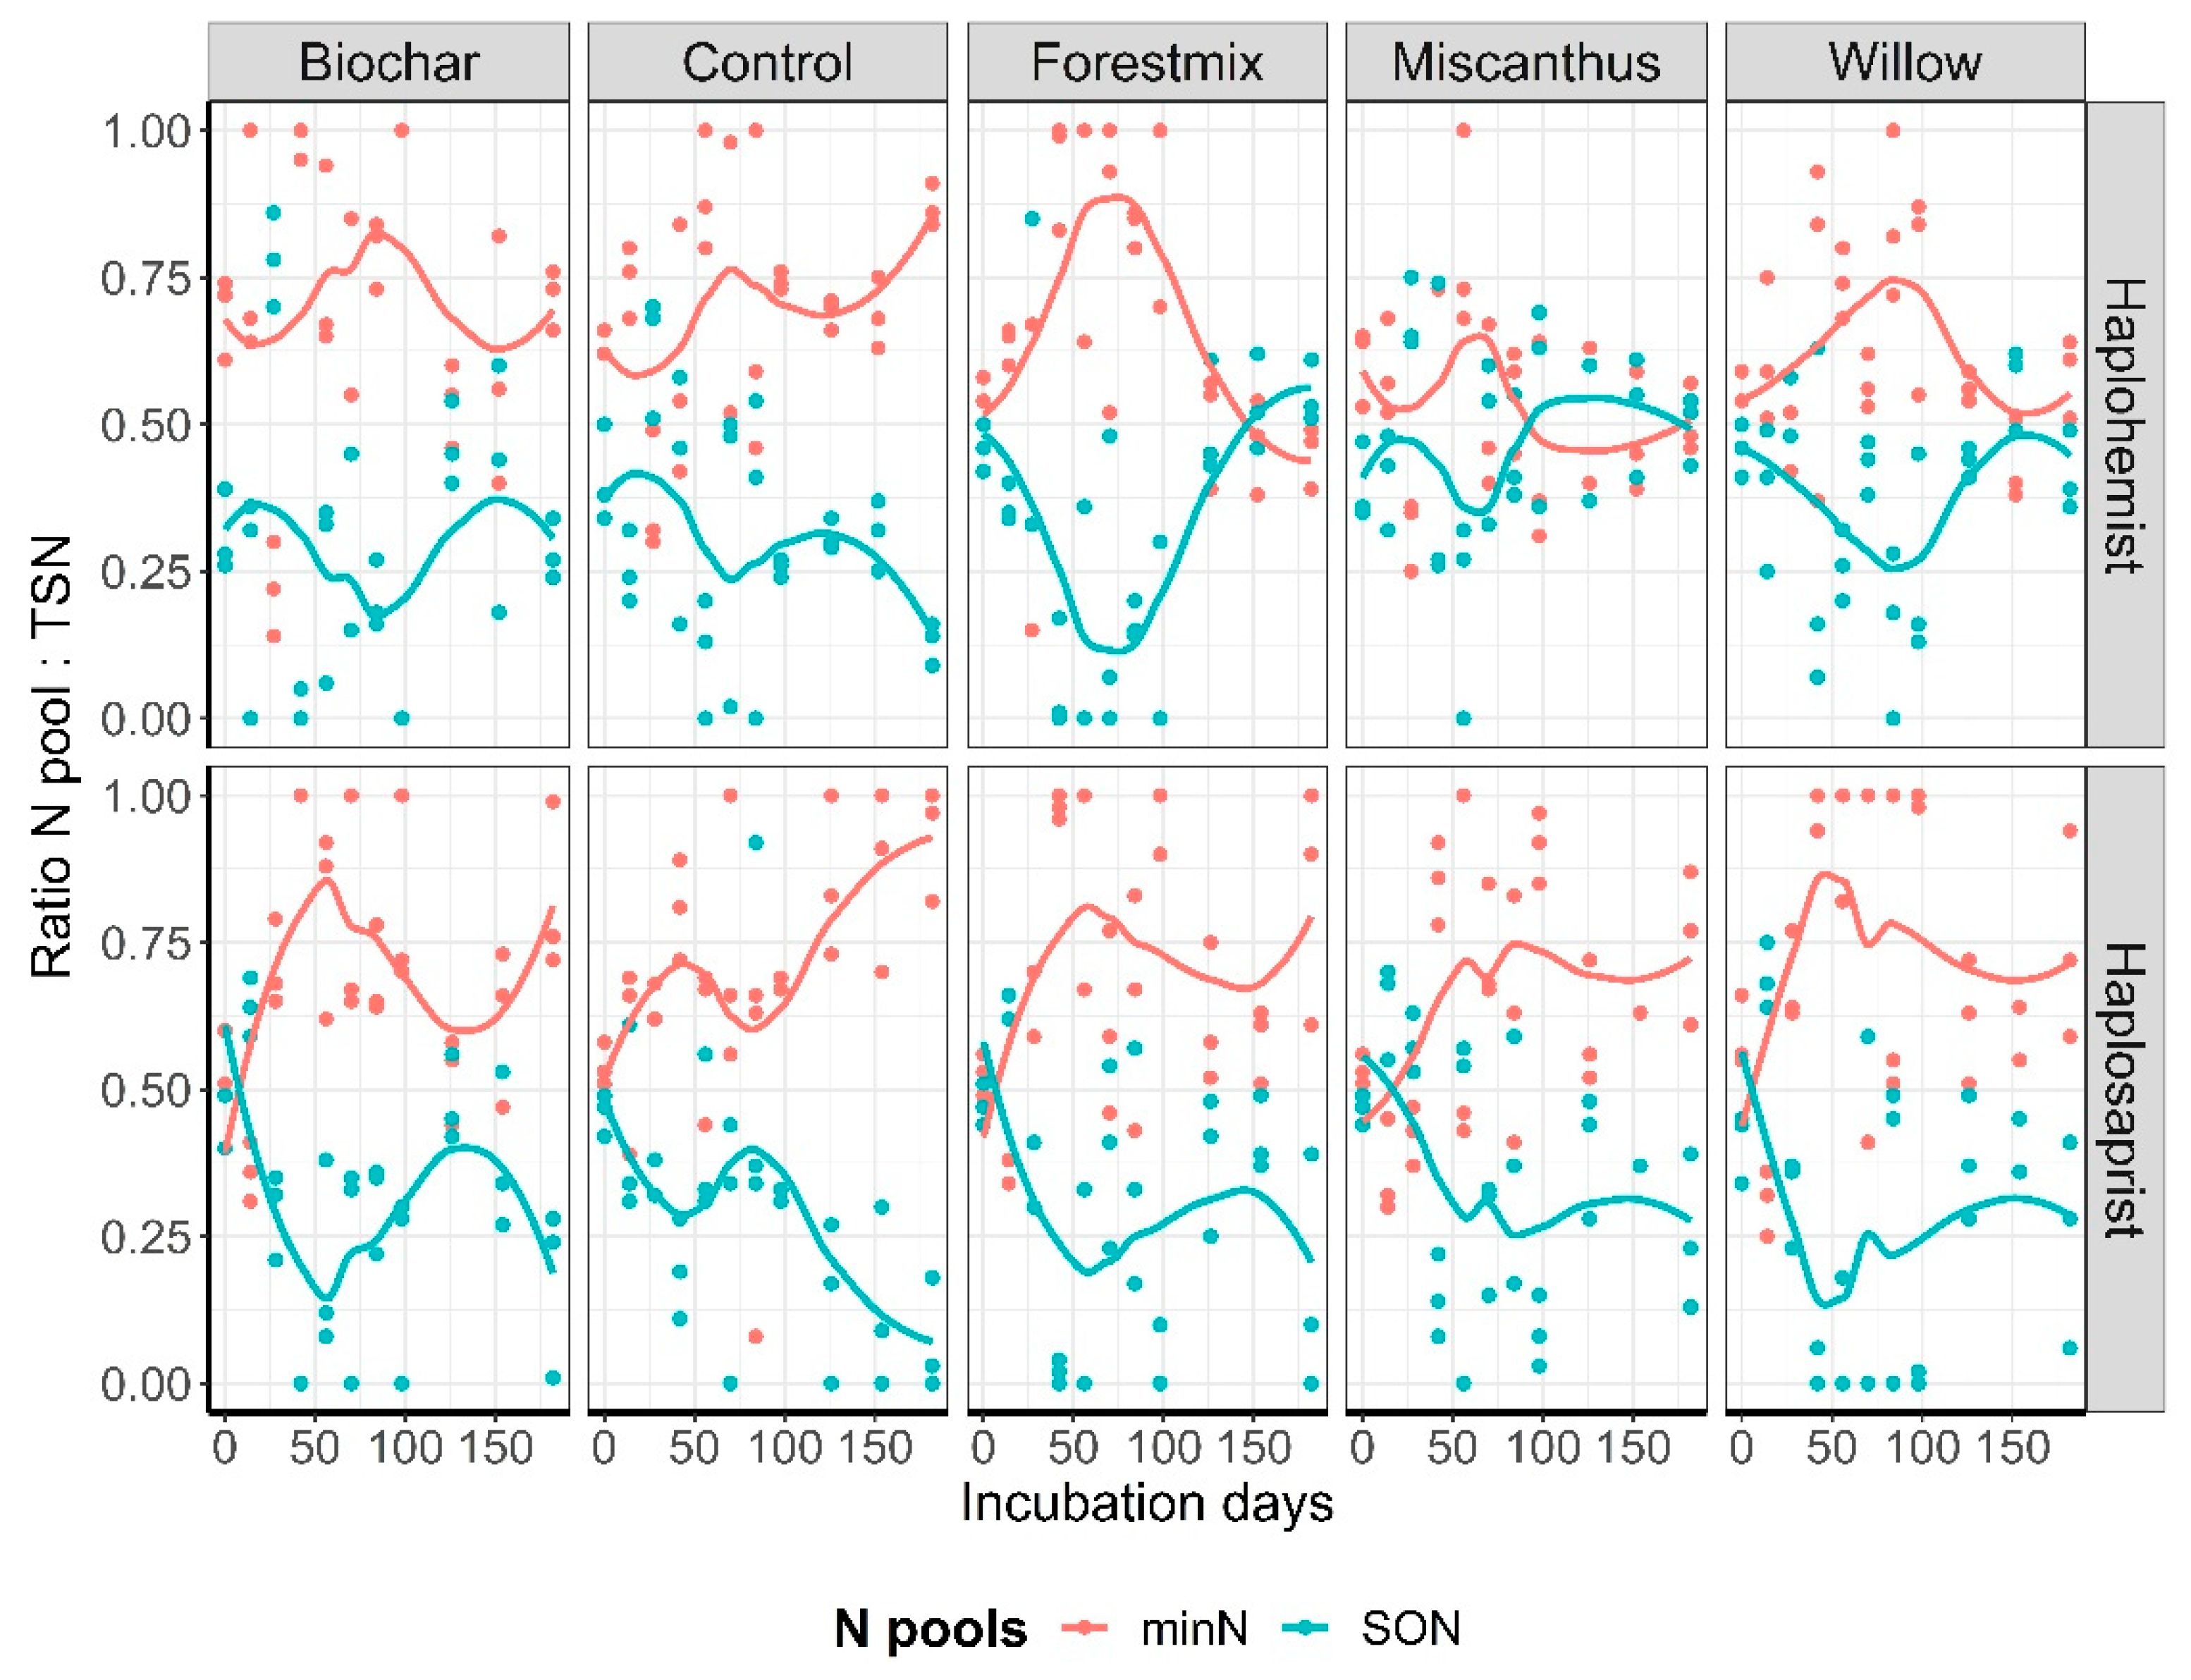
Overall, the average minN:TSN ratios for the Haplohemist and the Haplosaprist soils, respectively, were as follows: control, 69% and 70%; biochar, 70% and 70%; forest mix, 66% and 70%; miscanthus, 53% and 64%; and willow, 62% and 71%. However, neither the effect of treatment nor the soil type was significant (Figure 6), and the data showed temporal variability (Figure 7).
4. Discussion
4.1. Plant-Based Amendment Impact on N Pools Release
N pools (minN and SON) release was generally higher under the Haplosaprist (more decomposed histosol) compared to the Haplohemist (less decomposed histosol). The C:N ratio of the Haplosaprist was indeed lower than the C:N ratio of the Haplohemist, which might lead to a higher mineralization potential of this soil. Furthermore, polyphenols and tannins content of the peat soil could also be a controlling factor for N mineralization, as they have been shown to control microbial activity in peat soils [54]. Although not measured in the present study, it has been shown that the polyphenol and tannin content of highly decomposed peat can be up to eight to fifty times lower than in less decomposed peat soil [55].
In addition, the plant-based amendment influence on N release was similar among soil types; a clear response to the addition of plant-based amendments was observed in this study, and this response did not attenuate over time (hypothesis 2 refuted). For the majority of the measured parameters related to N dynamics, miscanthus and willow were the amendments that most reduced the amount of N recovered in the leachate. Although the impact of the forest mix amendment was often significant, it was weaker than that of the other plant-based amendments (hypothesis 3 refuted). The results for the biochar-amended histosols were generally very close to those of the control treatment. Although the chemical properties of the two woody amendments used in this study (forest mix and willow) were similar (Table 2), willow had a greater effect on the parameters studied. Overall, the effect of willow on the parameters studied more closely resembled that of miscanthus than that of the forest mix. Although the plant-based amendments used in this study were characterized, a more detailed analysis of the chemical composition of the organic matter in the forest mix might have provided a better understanding of the results obtained. Organic amendments consist of a continuum of molecules, which can be qualified as rapidly (e.g., easily soluble sugars, amino acids, and nucleic acids), moderately (e.g., hemicellulose and cellulose), and slowly (e.g., lignin) degradable organic pools [56], and the prominence of one or another pool or molecules could have better explained the difference observed between willow and forest mix. For example, a study by Cao et al. [57] showed that the response of microbial N immobilization to organic-C addition is better explained by the chemical quality of organic-C (e.g., soluble C compounds vs. tannins) than by the C:N ratio.
4.2. Soil N Sink and Microbial Immobilization under Plant-Based Amendement
The results of this study showed a significant inverse relationship between the cumulated amount of N pools recovered in the leachates after 26 week of incubation and the microbial biomass N measured at the end of the incubation period. This indicates that at least some N immobilization occurred in the microbial biomass in the amended soils. However, the observed decrease in the N pools recovered in the leachates was greater than the decrease in the microbial biomass N, indicating that other processes, such as abiotic N immobilization (for example, sorption of NH4+ on the negative charges of the soil) or atmospheric loss, were involved. Immobilization by the microbial biomass was greater in the miscanthus- and willow-amended soils, followed by the forest mix and, to a lesser extent, biochar. Reichel et al. [56] used wheat straw, spruce sawdust (comparable to the forest mix used in this study), and pure lignin as soil amendments. Their results showed that wheat straw immobilized more N than spruce sawdust and that the lignin amendment did not cause N immobilization. In the present study, biochar did not differ significantly from the control treatment in terms of N release kinetics, which is in line with the study of Xie et al. [58], who reported that biochar at 10 Mg ha−1 did not significantly change the mineralization of inorganic and organic N. According to Plante and Parton [59], microbial N immobilization can be expected to increase with increasing size and C:N ratio of the rapidly degradable fraction of organic matter, which is usually broken down by zymogenous microorganisms within a few days [60]. Then, C and N released by the dead but previously fast-growing microbial biomass serve as additional substrates for microbes that grow more slowly on more complex organic compounds, such as cellulose, hemicellulose, and lignin [61]. Finally, more specialized organisms, such as white-rot fungi, are needed to degrade lignified structures [62].
The reduced recovery of minN and SON in the leachates from the amended histosols in the present study could be attributable to abiotic processes. Although lesser known, these processes may play an important role in soil N immobilization [63,64,65] and are considered to represent a long-term N sink [66]. Crop residues with highly recalcitrant organic compounds have been found to facilitate the incorporation of inorganic N into soil organic matter through abiotic reactions [67]. For example, the condensation reaction of NH3 with activated phenol or quinone rings [68], the reaction between NO2 and phenolic compounds to form organically bound N [69], and the reduction of NO3 to NO2 and the subsequent reaction of the latter with dissolved organic matter to form dissolved organic N [70] are all possible mechanisms involved [71]. Biotic and abiotic processes of N immobilization thus play different roles in providing available N. In the present study, it is likely that both mechanisms occurred to some degree and that the dominance of one mechanism over the other may have varied temporally during the incubation period. Urease activity increased significantly in the amended histosols (forest mix ≤ willow < miscanthus) in the present study. Urease enzymes hydrolyze urea into NH3 and CO2 [72], which can increase soil pH and N loss to the atmosphere through NH3 volatilization or N immobilization through a condensation reaction. Increased urease activity has been observed with organic fertilizers such as compost, sewage sludge, and straw mulch [73,74,75], which corresponds to the findings of the present study. Another study, however, reported decreased urease activity in amended soils [76].
4.3. N Pools Distribution
The data set created in this study was used to determine which of the N pools (minN or SON) was predominant and if they were influenced by soil type, time, and treatment. Initially, it was thought that N immobilization, whether microbially driven or not, would reduce the recovery of minN in the leachates compared to SON. Interestingly, neither soil amendment nor soil type had a clear influence on the distribution between the two pools (hypothesis 1 refuted), except for a tendency towards a lower minN:TSN ratio for the miscanthus-amended Haplohemist. This specific interaction between the Haplohemist which was rich in carbon with a higher C:N ratio compared to the Haplosaprist and the miscanthus being characterized by the highest C:N ratio and highest hemicellulose content shifted the N pools:TSN ratio toward a higher SON: TSN ratio compared to all other soil X treatment interactions. It was also observed that for the Haplohemist under miscanthus amendment, the k1 parameters for TSN, minN and SON increased, while the k1 for the other treatments remained similar to the control. This does not explain why SON is higher, but it explains that this specific interaction between Haplohemist and miscanthus induced a unique response in the kinetics of N release and in the distribution of N pools. In a shorter-term experiment conducted in pots with a comparable Haplosaprist soil and using KCl soil extracts for N analysis, Bourdon et al. (2021) [49] observed that the distribution between the N pools (minN and SON) was similar across amendments (miscanthus, willow, sorghum, switchgrass, and birch), with 58% minN versus 42% SON. However, the control in that study was characterized by a ratio of 38% minN to 62% SON, the inverse of the ratio in the control used in the present study. This difference between the amended treatments and the control treatment was not observed in the present study, where a steady N pool distribution of one-third SON to two-thirds minN across soil types and treatments was recorded. The different experimental conditions could partly explain this discrepancy. The present study also revealed a temporal variability in the N pool distribution (Figure 7). It was postulated that over the course of the experiment, C- and N-cycling microorganisms worked in pulses in response to substrate availability, and that there was also an alternation between fast- and slow-growing microorganisms, which would explain the temporal changes observed.
4.4. Open Questions and Limitation of the Study
Further research is needed to determine how the present findings would apply to field conditions and how they would influence crop quality and yield. Field experiments using different fertilizer rates and different amendment application times (fall vs. spring) should be explored. The choice of amendment is critical and will ultimately be guided by cost and accessibility. Biochar, for example, is still very expensive to acquire and spread in the field, whereas miscanthus and willow can be grown locally. Further research should also explore how this amendment strategy would influence microbial diversity in the short and long term, and how it could benefit or hinder crop growth due to reduced N availability. Finally, we acknowledge the fact that the long-term leaching experiment used in the present study has its limitations. In some cases, the CaCl2 leaching experiment has shown underestimation of mineralized nitrogen. Mulvaney et al. [77] showed that in the case of one histosol and some other types of soils, the leaching might not allow the full recovery of nitrogen [77], Moreover, an isotopic technique is particularly recognized as the recommended method to obtain estimates of soil N dynamics [78]. Further experiments should therefore include such techniques in the case of plant-based amended histosols.
5. Conclusions
Amending cultivated peatlands with carbon-rich material shows promise as a strategy to promote sustainability, here meaning an increase in the lifetime for vegetable crop production. This study involved a detailed investigation of the N dynamics observed in two types of histosols with plant-based amendments. At the amendment rate used in this study, a substantial reduction in the N pools recovered in the leachates was noted, mainly for the willow and miscanthus amendments, and this was partly attributable to microbial immobilization. The long-term incubation also revealed temporal variations in the distribution of N between the mineral and organic pools, variations that could not be explained by either soil type or amendment. Cultivated peatlands are very fertile, and such immobilization could potentially be environmentally positive, retaining N in the soils and reducing N runoff to other reservoirs such as the aquatic environment, which is known to be especially vulnerable to nutrient loading [79]. However, it remains to be determined if the difference of magnitude between the N recovered in the leachates and the accumulation in the microbial biomass is attributable to N2O losses or if abiotic immobilization is involved to a significant extent.
This study showed that the N release kinetics were significantly impacted by different types of amendments. Among those, Miscanthus and willow-based amendments reduced the most the release kinetic and the cumulative SON and minN. Microbial biomass N and urease activity were significantly related to the N released at the end of the incubation. The results of this study showed that the inputs of plant-based amendments in cultivated peatland decrease the N release in the soil, which could have beneficial impact on N losses to the environment (denitrification, runoff, and leaching) but may be deleterious to crop growth. Amendment timing as well as fertilization strategies should be further studied before generating field recommendations.
Author Contributions
Conceptualization, J.D.-R.; methodology, J.D.-R. and V.M.; data curation, V.M.; writing—original draft preparation, V.M. and J.D.-R.; writing—review and editing, V.M., J.D.-R., E.F. and J.C.; visualization, V.M. and J.D.-R.; supervision J.D.-R. and E.F.; project administration, J.D.-R.; funding acquisition, J.C. All authors have read and agreed to the published version of the manuscript.
Funding
We would like to acknowledge the financial support of the Natural Sciences and Engineering Research Council of Canada (NSERC) through a Collaborative Research and Development Grant (IRCPJ 411630-17) in partnership with Productions Horticoles Van Winden Inc., Les Fermes Hotte et Van Winden Inc., Maraîchers J.P. & L. Guérin et Fils Inc., Delfland Inc., Vert Nature Inc., Isabelle Inc., La Production Barry Inc., Le Potager Montréalais ltée., Les Jardins A. Guérin et fils Inc., Les Fermes du Soleil Inc., Les Fermes R.R. et fils Inc., Productions Maraîchères Breizh Inc., and R. Pinsonneault et fils ltée.
Data Availability Statement
Not Available.
Acknowledgments
We thank Diane Bulot for help and support in the laboratory.
Conflicts of Interest
The authors declare no conflict of interest.
References
- Baillie, I. Soil Survey Staff 1999, Soil Taxonomy: A Basic System of Soil Classification for Making and Interpreting Soil Surveys, Agricultural Handbook 436; Wiley Online Library, Ed.; USDA Natural Resources Conservation Service: Washington, DC, USA, 2001; p. 869.
- Bader, C.; Müller, M.; Szidat, S.; Schulin, R.; Leifeld, J. Response of peat decomposition to corn straw addition in managed organic soils. Geoderma 2018, 309, 75–83. [Google Scholar] [CrossRef]
- Bonn, A.; Allott, T.; Evans, M.; Joosten, H.; Stoneman, R. Peatland restoration and ecosystem services: An introduction. In Peatland Restoration and Ecosystem Services: Science, Policyand Practice; Cambridge University Press: Cambridge, UK, 2016; pp. 1–16. [Google Scholar]
- Bader, C.; Müller, M.; Schulin, R.; Leifeld, J. Amount and stability of recent and aged plant residues in degrading peatland soils. Soil Biol. Biochem. 2017, 109, 167–175. [Google Scholar] [CrossRef]
- Shih, S.; Glaz, B.; Barnes, R., Jr. Subsidence of organic soils in the Everglades Agricultural Area during the past 19 years. Proceedings 1998, 57, 20–29. [Google Scholar]
- Stevens, J.; Johnson, L. Subsidence of organic soils in the upper Everglades region of Florida. Soil Sci. Soc. Fla. Proc. 1951, 11, 191–237. [Google Scholar]
- Dessureault-Rompré, J.; Libbrecht, C.; Caron, J. Biomass crops as a soil amendment in cultivated histosols: Can we reach carbon equilibrium? Soil Sci. Soc. Am. J. 2020, 84, 597–608. [Google Scholar] [CrossRef]
- Armentano, T.V.; Menges, E.S. Patterns of change in the carbon balance of organic soil-wetlands of the temperate zone. J. Ecol. 1986, 74, 755–774. [Google Scholar] [CrossRef]
- Castillo, M.S.; Wright, A.L. Soil phosphorus pools for Histosols under sugarcane and pasture in the Everglades, USA. Geoderma 2008, 145, 130–135. [Google Scholar] [CrossRef]
- Millette, J.; Vigier, B.; Broughton, R.S. An evaluation of the drainage and subsidence of some organic soils in Quebec. Can. Agric. Eng. 1982, 24, 5–10. [Google Scholar]
- Parent, L.; Millette, J.; Mehuys, G. Subsidence and erosion of a Histosol. Soil Sci. Soc. Am. J. 1982, 46, 404–408. [Google Scholar] [CrossRef]
- Richardson, S.; Smith, J. Peat wastage in the East Anglian fens. J. Soil Sci. 1977, 28, 485–489. [Google Scholar] [CrossRef]
- Tate, R.L. Microbial oxidation of organic matter of Histosols. In Advances in Microbial Ecology; Springer: New York, NY, USA, 1980; pp. 169–201. [Google Scholar]
- Morris, D.R.; Gilbert, R.A. Inventory, crop use and soil subsidence of Histosols in Florida. Int. J. Food Agric. Environ. 2005, 3, 190–193. [Google Scholar]
- Snyder, G.; Davidson, J. Everglades agriculture: Past, present, and future. In Everglades: The Ecosystem and Its Restoration; CRC Press: Boca Raton, FL, USA, 1994; pp. 85–115. [Google Scholar]
- Höper, H.; Augustin, J.; Cagampan, J.; Drösler, M.; Lundin, L.; Moors, E.; Vasander, H.; Waddington, J.; Wilson, D. Restoration of peatlands and greenhouse gas balances. In Peatlands and Climate Change; International Peat Society: Jyvaskyla, Finland, 2008; pp. 182–210. [Google Scholar]
- Kasimir-Klemedtsson, A.; Klemedtsson, L.; Berglund, K.; Martikainen, P.; Silvola, J.; Oenema, O. Greenhouse gas emissions from farmed organic soils: A review. Soil Use Manag. 1997, 13, 245–250. [Google Scholar] [CrossRef]
- Reiche, M.; Gleixner, G.; Küsel, K. Effect of peat quality on microbial greenhouse gas formation in an acidic fen. Biogeosciences 2010, 7, 187–198. [Google Scholar] [CrossRef]
- Byrne, K.A.; Chojnicki, B.; Christensen, T.R.; Drosler, M.; Frolking, S.; Lindroth, A.; Mailhammer, J.; Malmer, N.; Selin, P.; Turunen, J.; et al. EU peatlands: Current carbon stocks and trace gas fluxes. In CarboEurope-GHG Concerted Action—Synthesis of the European Greenhouse Gas Budget, Report 4/2004, Specific Study, Tipo-Lito Recchioni, Viterbo, October 2004; Geosphere-Biosphere Center: Lund, Sweden, 2004. [Google Scholar]
- Buschmann, C.; Röder, N.; Berglund, K.; Berglund, Ö.; Lærke, P.E.; Maddison, M.; Mander, Ü.; Myllys, M.; Osterburg, B.; van den Akker, J.J. Perspectives on agriculturally used drained peat soils: Comparison of the socioeconomic and ecological business environments of six European regions. Land Use Policy 2020, 90, 104181. [Google Scholar] [CrossRef]
- Buragienė, S.; Šarauskis, E.; Romaneckas, K.; Adamavičienė, A.; Kriaučiūnienė, Z.; Avižienytė, D.; Marozas, V.; Naujokienė, V. Relationship between CO2 emissions and soil properties of differently tilled soils. Sci. Total Environ. 2019, 662, 786–795. [Google Scholar] [CrossRef]
- Rutkowska, B.; Szulc, W.; Sosulski, T.; Skowrońska, M.; Szczepaniak, J. Impact of reduced tillage on CO2 emission from soil under maize cultivation. Soil Tillage Res. 2018, 180, 21–28. [Google Scholar] [CrossRef]
- Plaza-Bonilla, D.; Nogue-Serra, I.; Raffaillac, D.; Cantero-Martínez, C.; Justes, E. Carbon footprint of cropping systems with grain legumes and cover crops: A case-study in SW France. Agric. Syst. 2018, 167, 92–102. [Google Scholar] [CrossRef]
- Ferré, M.; Muller, A.; Leifeld, J.; Bader, C.; Müller, M.; Engel, S.; Wichmann, S. Sustainable management of cultivated peatlands in Switzerland: Insights, challenges, and opportunities. Land Use Policy 2019, 87, 104019. [Google Scholar] [CrossRef]
- Joosten, H.; Tapio-Biström, M.-L.; Tol, S. Peatlands: Guidance for Climate Change Mitigation through Conservation, Rehabilitation and Sustainable Use; Food and Agriculture Organization of the United Nations: Roma, Italy, 2012. [Google Scholar]
- Berglund, Ö.; Berglund, K. Influence of water table level and soil properties on emissions of greenhouse gases from cultivated peat soil. Soil Biol. Biochem. 2011, 43, 923–931. [Google Scholar] [CrossRef]
- Regina, K.; Sheehy, J.; Myllys, M. Mitigating greenhouse gas fluxes from cultivated organic soils with raised water table. Mitig. Adapt. Strateg. Glob. Chang. 2015, 20, 1529–1544. [Google Scholar] [CrossRef]
- Taft, H.E.; Cross, P.A.; Jones, D.L. Efficacy of mitigation measures for reducing greenhouse gas emissions from intensively cultivated peatlands. Soil Biol. Biochem. 2018, 127, 10–21. [Google Scholar] [CrossRef]
- Kuzyakov, Y.; Friedel, J.; Stahr, K. Review of mechanisms and quantification of priming effects. Soil Biol. Biochem. 2000, 32, 1485–1498. [Google Scholar] [CrossRef]
- Sohi, S.P.; Krull, E.; Lopez-Capel, E.; Bol, R. A review of biochar and its use and function in soil. Adv. Agron. 2010, 105, 47–82. [Google Scholar]
- Wang, Y.; Chen, X.; Whalen, J.K.; Cao, Y.; Quan, Z.; Lu, C.; Shi, Y. Kinetics of inorganic and organic phosphorus release influenced by low molecular weight organic acids in calcareous, neutral and acidic soils. J. Plant Nutr. Soil Sci. 2015, 178, 555–566. [Google Scholar] [CrossRef]
- Zimmerman, A.R.; Gao, B.; Ahn, M.-Y. Positive and negative carbon mineralization priming effects among a variety of biochar-amended soils. Soil Biol. Biochem. 2011, 43, 1169–1179. [Google Scholar] [CrossRef]
- Clough, T.J.; Condron, L.M.; Kammann, C.; Müller, C. A review of biochar and soil nitrogen dynamics. Agronomy 2013, 3, 275–293. [Google Scholar] [CrossRef]
- Qiu, C.; Ciais, P.; Zhu, D.; Guenet, B.; Peng, S.; Petrescu, A.M.R.; Lauerwald, R.; Makowski, D.; Gallego-Sala, A.V.; Charman, D.J. Large historical carbon emissions from cultivated northern peatlands. Sci. Adv. 2021, 7, eabf1332. [Google Scholar] [CrossRef]
- Yu, Z. Northern peatland carbon stocks and dynamics: A review. Biogeosciences 2012, 9, 4071–4085. [Google Scholar] [CrossRef]
- Hanlon, E.; Anderson, D.; Diaz, O. Nitrogen mineralization in histosols of the Everglades Agricultural Area. Commun. Soil Sci. Plant Anal. 1997, 28, 73–87. [Google Scholar] [CrossRef]
- Duguet, F. Minéralisation de l’azote et du phosphore dans les sols organiques cultivés du sud-ouest du Québec. Master’s Thesis, Laval University, Québec, QC, Canada, 2005. [Google Scholar]
- Carter, M.R.; Gregorich, E.G. Soil Sampling and Methods of Analysis; CRC Press: Boca Raton, FL, USA, 2007. [Google Scholar]
- Voroney, R.; Brookes, P.; Beyaert, R. Soil microbial biomass C, N, P, and S. Soil Sampl. Methods Anal. 2008, 2, 637–652. [Google Scholar]
- Kandeler, E.; Gerber, H. Short-term assay of soil urease activity using colorimetric determination of ammonium. Biol. Fertil. Soils 1988, 6, 68–72. [Google Scholar] [CrossRef]
- Cordero, I.; Snell, H.; Bardgett, R.D. High throughput method for measuring urease activity in soil. Soil Biol. Biochem. 2019, 134, 72–77. [Google Scholar] [CrossRef] [PubMed]
- Spokas, K.A.; Cantrell, K.B.; Novak, J.M.; Archer, D.W.; Ippolito, J.A.; Collins, H.P.; Boateng, A.A.; Lima, I.M.; Lamb, M.C.; McAloon, A.J. Biochar: A synthesis of its agronomic impact beyond carbon sequestration. J. Environ. Qual. 2012, 41, 973–989. [Google Scholar] [CrossRef]
- Rutherford, P.; McGill, W.; Arocena, J.; Figueiredo, C. Total nitrogen. In Soil Sampling and Methods of Analysis; Carter, M.R., Gregorich, E.G., Eds.; CRC Press: Boca Raton, FL, USA, 2008. [Google Scholar]
- Skjemstad, J.; Baldock, J.A. Total and organic carbon. In Soil Sampling and Methods of Analysis, 2nd ed.; Carter, M.E., Gregorich, E.G., Eds.; Soil Science Society of Canada: Boca Raton, FL, USA, 2007; pp. 225–238. [Google Scholar]
- Norme XP U 44-162; Fractionnement biochimique et estimation de la stabilité biologique Association Française de Normalisation. French standardization Association: Paris, France, 2005.
- Robin, D. Intérêt de la caractérisation biochimique pour l’évaluation de la proportion de matière organique stable après décomposition dans le sol et la classification des produits organominéraux. Agronomie 1997, 17, 157–171. [Google Scholar] [CrossRef]
- Stanford, G.; Smith, S. Nitrogen mineralization potentials of soils. Soil Sci. Soc. Am. J. 1972, 36, 465–472. [Google Scholar] [CrossRef]
- Dessureault-Rompré, J.; Burton, D.L.; Zebarth, B. Soluble organic nitrogen in potentially mineralizable N assays: Are we missing an important component? Can. J. Soil Sci. 2018, 98, 570–573. [Google Scholar] [CrossRef]
- Bourdon, K.; Fortin, J.; Dessureault-Rompré, J.; Caron, J. Agricultural peatlands conservation: How does the addition of plant biomass and copper affect soil fertility? Soil Sci. Soc. Am. J. 2021, 85, 1242–1255. [Google Scholar] [CrossRef]
- Marmier, V. Mineralization of Nitrogen and Release of Dissolved Phosphorus and Carbon in Plant-Amended Organic Soils. In Department of Environmental Sciences; ETH Zürich: Zurich, Switzerland, 2021. [Google Scholar]
- Qualls, R. Determination of Total Nitrogen and Phosphorus in Water Using Persulfate Oxidation: A Modification for Small Sample Volumes Using the Method of Koroleff (1983). The Biogeochemical Properties of the Retention of Nitrogen, Phosphorus, and Carbon. Ph.D. Thesis, University of Georgia Institute of Ecology, Athens, GA, USA, 1989. [Google Scholar]
- Team, R. RStudio: Integrated Development Environment for R; RStudio, PBC: Boston, MA, USA, 2020. [Google Scholar]
- Dessureault-Rompré, J.; Zebarth, B.J.; Burton, D.L.; Gregorich, E.G.; Goyer, C.; Georgallas, A.; Grant, C.A. Are soil mineralizable nitrogen pools replenished during the growing season in agricultural soils? Soil Sci. Soc. Am. J. 2013, 77, 512–524. [Google Scholar] [CrossRef]
- Freeman, C.; Ostle, N.; Kang, H. An enzymic’latch’on a global carbon store. Nature 2001, 409, 149. [Google Scholar] [CrossRef]
- Zak, D.; Roth, C.; Unger, V.; Goldhammer, T.; Fenner, N.; Freeman, C.; Jurasinski, G. Unraveling the importance of polyphenols for microbial carbon mineralization in rewetted riparian peatlands. Front. Environ. Sci. 2019, 7, 147. [Google Scholar] [CrossRef]
- Reichel, R.; Wei, J.; Islam, M.S.; Schmid, C.; Wissel, H.; Schröder, P.; Schloter, M.; Brüggemann, N. Potential of wheat straw, spruce sawdust, and lignin as high organic carbon soil amendments to improve agricultural nitrogen retention capacity: An incubation study. Front. Plant Sci. 2018, 9, 900. [Google Scholar] [CrossRef] [PubMed]
- Cao, Y.; Sun, H.; Zhang, J.; Chen, G.; Zhu, H.; Zhou, S.; Xiao, H. Effects of wheat straw addition on dynamics and fate of nitrogen applied to paddy soils. Soil Tillage Res. 2018, 178, 92–98. [Google Scholar] [CrossRef]
- Xie, Y.; Yang, C.; Ma, E.; Tan, H.; Zhu, T.; Müller, C. Biochar stimulates NH4+ turnover while decreasing NO3− production and N2O emissions in soils under long-term vegetable cultivation. Sci. Total Environ. 2020, 737, 140266. [Google Scholar] [CrossRef]
- Plante, A.F.; Parton, W.J. The dynamics of soil organic matter and nutrient cycling. In Soil Microbiology, Ecology and Biochemistry; Elsevier: Amsterdam, The Netherlands, 2007; pp. 433–467. [Google Scholar]
- Kuzyakov, Y.; Blagodatskaya, E. Microbial hotspots and hot moments in soil: Concept & review. Soil Biol. Biochem. 2015, 83, 184–199. [Google Scholar]
- Fontaine, S.; Bardoux, G.; Abbadie, L.; Mariotti, A. Carbon input to soil may decrease soil carbon content. Ecol. Lett. 2004, 7, 314–320. [Google Scholar] [CrossRef]
- van Kuijk, S.J.; Sonnenberg, A.S.; Baars, J.J.; Hendriks, W.H.; José, C.; Rencoret, J.; Gutiérrez, A.; de Ruijter, N.C.; Cone, J.W. Chemical changes and increased degradability of wheat straw and oak wood chips treated with the white rot fungi Ceriporiopsis subvermispora and Lentinula edodes. Biomass Bioenergy 2017, 105, 381–391. [Google Scholar] [CrossRef]
- Fitzhugh, R.D.; Lovett, G.M.; Venterea, R.T. Biotic and abiotic immobilization of ammonium, nitrite, and nitrate in soils developed under different tree species in the Catskill Mountains, New York, USA. Glob. Chang. Biol. 2003, 9, 1591–1601. [Google Scholar] [CrossRef]
- Fricks, B.; Kaye, J.; Seidel, R. Abiotic nitrate retention in agroecosystems and a forest soil. Soil Sci. Soc. Am. J. 2009, 73, 1137–1141. [Google Scholar] [CrossRef]
- Lewis, D.B.; Kaye, J.P. Inorganic nitrogen immobilization in live and sterile soil of old-growth conifer and hardwood forests: Implications for ecosystem nitrogen retention. Biogeochemistry 2012, 111, 169–186. [Google Scholar] [CrossRef]
- Barrett, J.; Burke, I. Potential nitrogen immobilization in grassland soils across a soil organic matter gradient. Soil Biol. Biochem. 2000, 32, 1707–1716. [Google Scholar] [CrossRef]
- Chen, B.; Liu, E.; Tian, Q.; Yan, C.; Zhang, Y. Soil nitrogen dynamics and crop residues. A review. Agron. Sustain. Dev. 2014, 34, 429–442. [Google Scholar] [CrossRef]
- Johnson, D.; Cheng, W.; Burke, I. Biotic and abiotic nitrogen retention in a variety of forest soils. Soil Sci. Soc. Am. J. 2000, 64, 1503–1514. [Google Scholar] [CrossRef]
- Dail, D.B.; Davidson, E.A.; Chorover, J. Rapid abiotic transformation of nitrate in an acid forest soil. Biogeochemistry 2001, 54, 131–146. [Google Scholar] [CrossRef]
- Davidson, E.A.; Chorover, J.; Dail, D.B. A mechanism of abiotic immobilization of nitrate in forest ecosystems: The ferrous wheel hypothesis. Glob. Chang. Biol. 2003, 9, 228–236. [Google Scholar] [CrossRef]
- Yansheng, C.; Fengliang, Z.; Zhongyi, Z.; Tongbin, Z.; Huayun, X. Biotic and abiotic nitrogen immobilization in soil incorporated with crop residue. Soil Tillage Res. 2020, 202, 104664. [Google Scholar] [CrossRef]
- Adetunji, A.T.; Lewu, F.B.; Mulidzi, R.; Ncube, B. The biological activities of β-glucosidase, phosphatase and urease as soil quality indicators: A review. J. Soil Sci. Plant Nutr. 2017, 17, 794–807. [Google Scholar] [CrossRef]
- Crecchio, C.; Curci, M.; Pizzigallo, M.D.; Ricciuti, P.; Ruggiero, P. Effects of municipal solid waste compost amendments on soil enzyme activities and bacterial genetic diversity. Soil Biol. Biochem. 2004, 36, 1595–1605. [Google Scholar] [CrossRef]
- Kızılkaya, R.; Bayraklı, B. Effects of N-enriched sewage sludge on soil enzyme activities. Appl. Soil Ecol. 2005, 30, 192–202. [Google Scholar] [CrossRef]
- Meyer, A.H.; Wooldridge, J.; Dames, J.F. Variation in urease and β-glucosidase activities with soil depth and root density in a ‘Cripp’s Pink’/M7 apple orchard under conventional and organic management. South Afr. J. Plant Soil 2015, 32, 227–234. [Google Scholar] [CrossRef]
- Li, Z.; Schneider, R.L.; Morreale, S.J.; Xie, Y.; Li, C.; Li, J. Woody organic amendments for retaining soil water, improving soil properties and enhancing plant growth in desertified soils of Ningxia, China. Geoderma 2018, 310, 143–152. [Google Scholar] [CrossRef]
- Mulvaney, R.L.; Otto, R.; Griesheim, K.L.; Su, K.; Trivelin, P.C.O. Leaching methods can underestimate mineralization potential of soils. Commun. Soil Sci. Plant Anal. 2016, 47, 1701–1708. [Google Scholar] [CrossRef]
- Murphy, D.; Recous, S.; Stockdale, E.; Fillery, I.; Jensen, L.; Hatch, D.; Goulding, K. Gross nitrogen fluxes in soil: Theory, measurement and application of^ 1^ 5n pool dilution techniques. Adv. Agron. 2003, 79, e118. [Google Scholar]
- Hashemi, F.; Olesen, J.E.; Dalgaard, T.; Børgesen, C.D. Review of scenario analyses to reduce agricultural nitrogen and phosphorus loading to the aquatic environment. Sci. Total Environ. 2016, 573, 608–626. [Google Scholar] [CrossRef] [PubMed]
Figure 1.
Chopped materials used as soil amendments in this study (from left): (A) forest mix; (B) willow; and (C) miscanthus.
Figure 1.
Chopped materials used as soil amendments in this study (from left): (A) forest mix; (B) willow; and (C) miscanthus.

Figure 2.
Cumulative TSN and minN and their fitting curves. The curves were computed only on measured values (TSN and minN). (A) TSN for the Haplosaprist; (B) TSN for the Haplohemist; (C) MinN for the Haplosaprist; (D) MinN for the Haplohemist; (E) SON for the Haplosaprist; (F) SON for the Haplohemist.
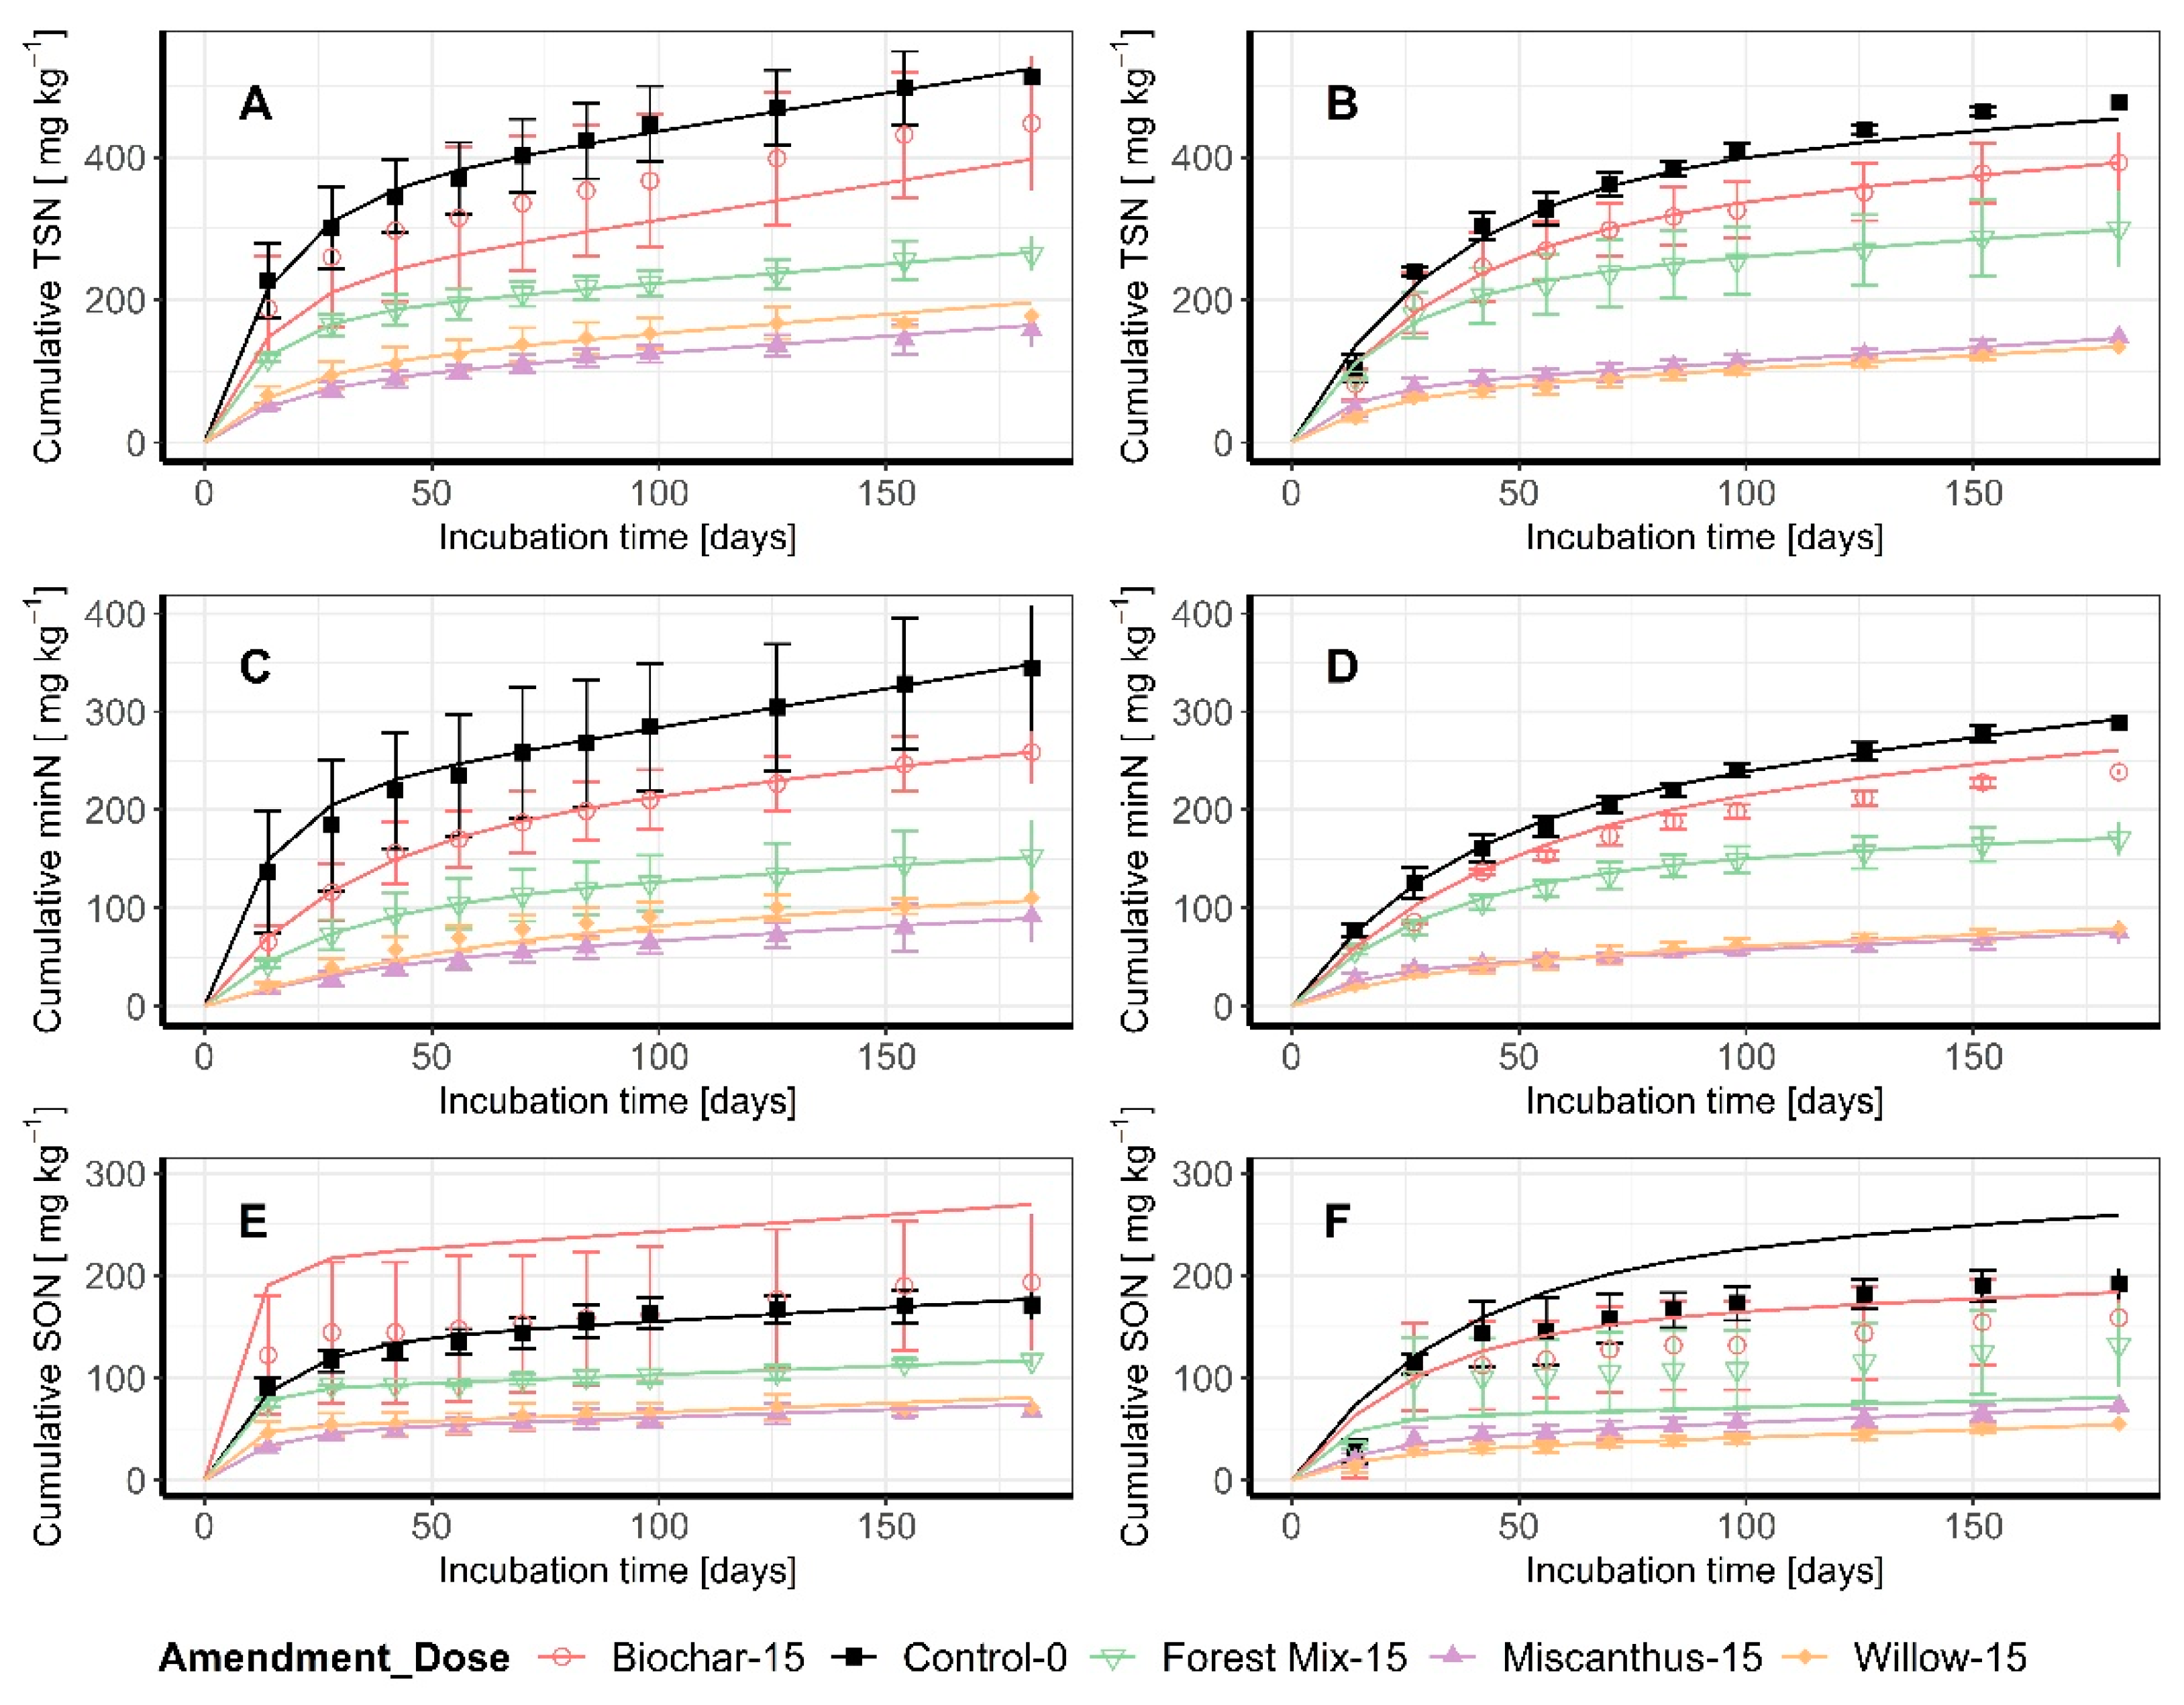
Figure 3.
(A) Microbial biomass N; (B) Urease activity as a function of soil type and amendment.
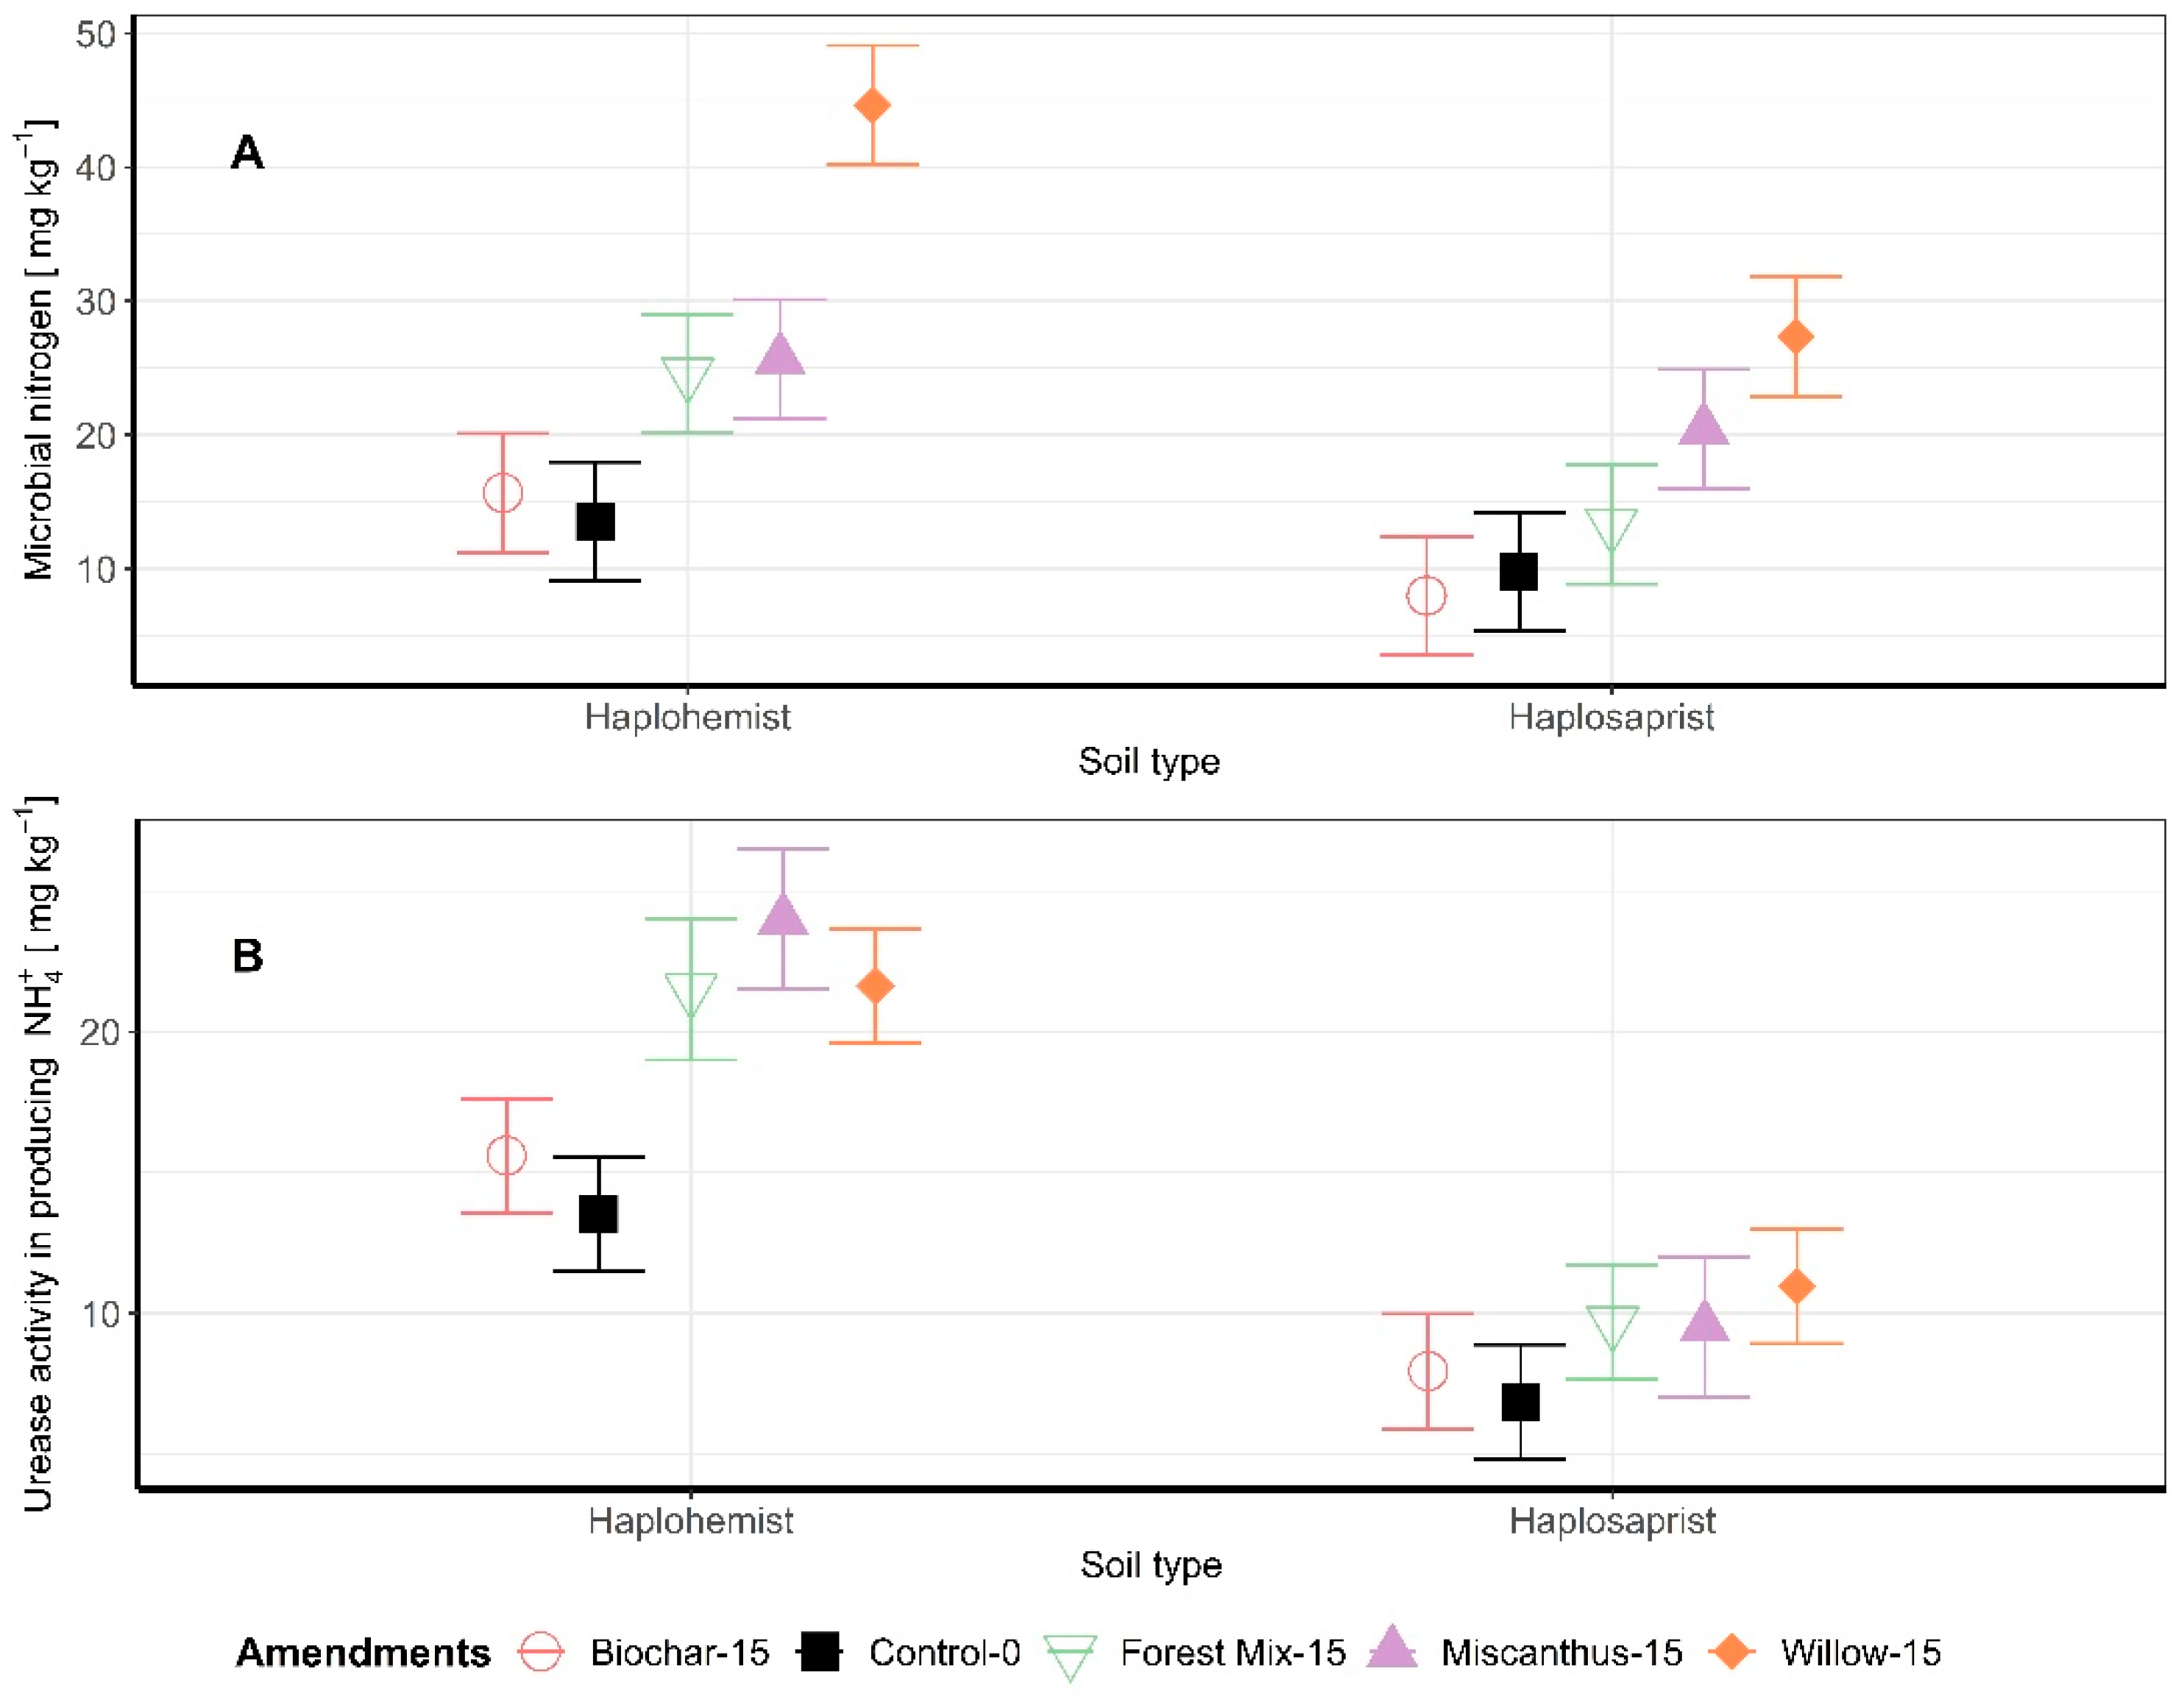
Figure 4.
Cumulative measured TSN (A), minN (B), and calculated SON (C) after 26 weeks of incubation, in relation to microbial N content in the biomass at the end of the incubation for the two soil types. The data obtained on both soil types are combined. Amendments are represented by different colors and forms. The linear relationship is drawn, and the equation is presented at the top of the graph.

Figure 5.
Cumulative measured TSN (A), minN (B), and SON (C) after 26 weeks of incubation, in relation to urease activity at the end of the incubation period for the two soil types. Amendments are represented by different colors and forms. The linear relationship is drawn, and the equation is presented at the top of the graph.

Figure 6.
Distribution of the MinN:TSN ratios and SON:TSN pools as a function of soil type and treatment. (B = biochar, M = miscanthus, FM = forest mix, W = willow, C = control).
Figure 6.
Distribution of the MinN:TSN ratios and SON:TSN pools as a function of soil type and treatment. (B = biochar, M = miscanthus, FM = forest mix, W = willow, C = control).
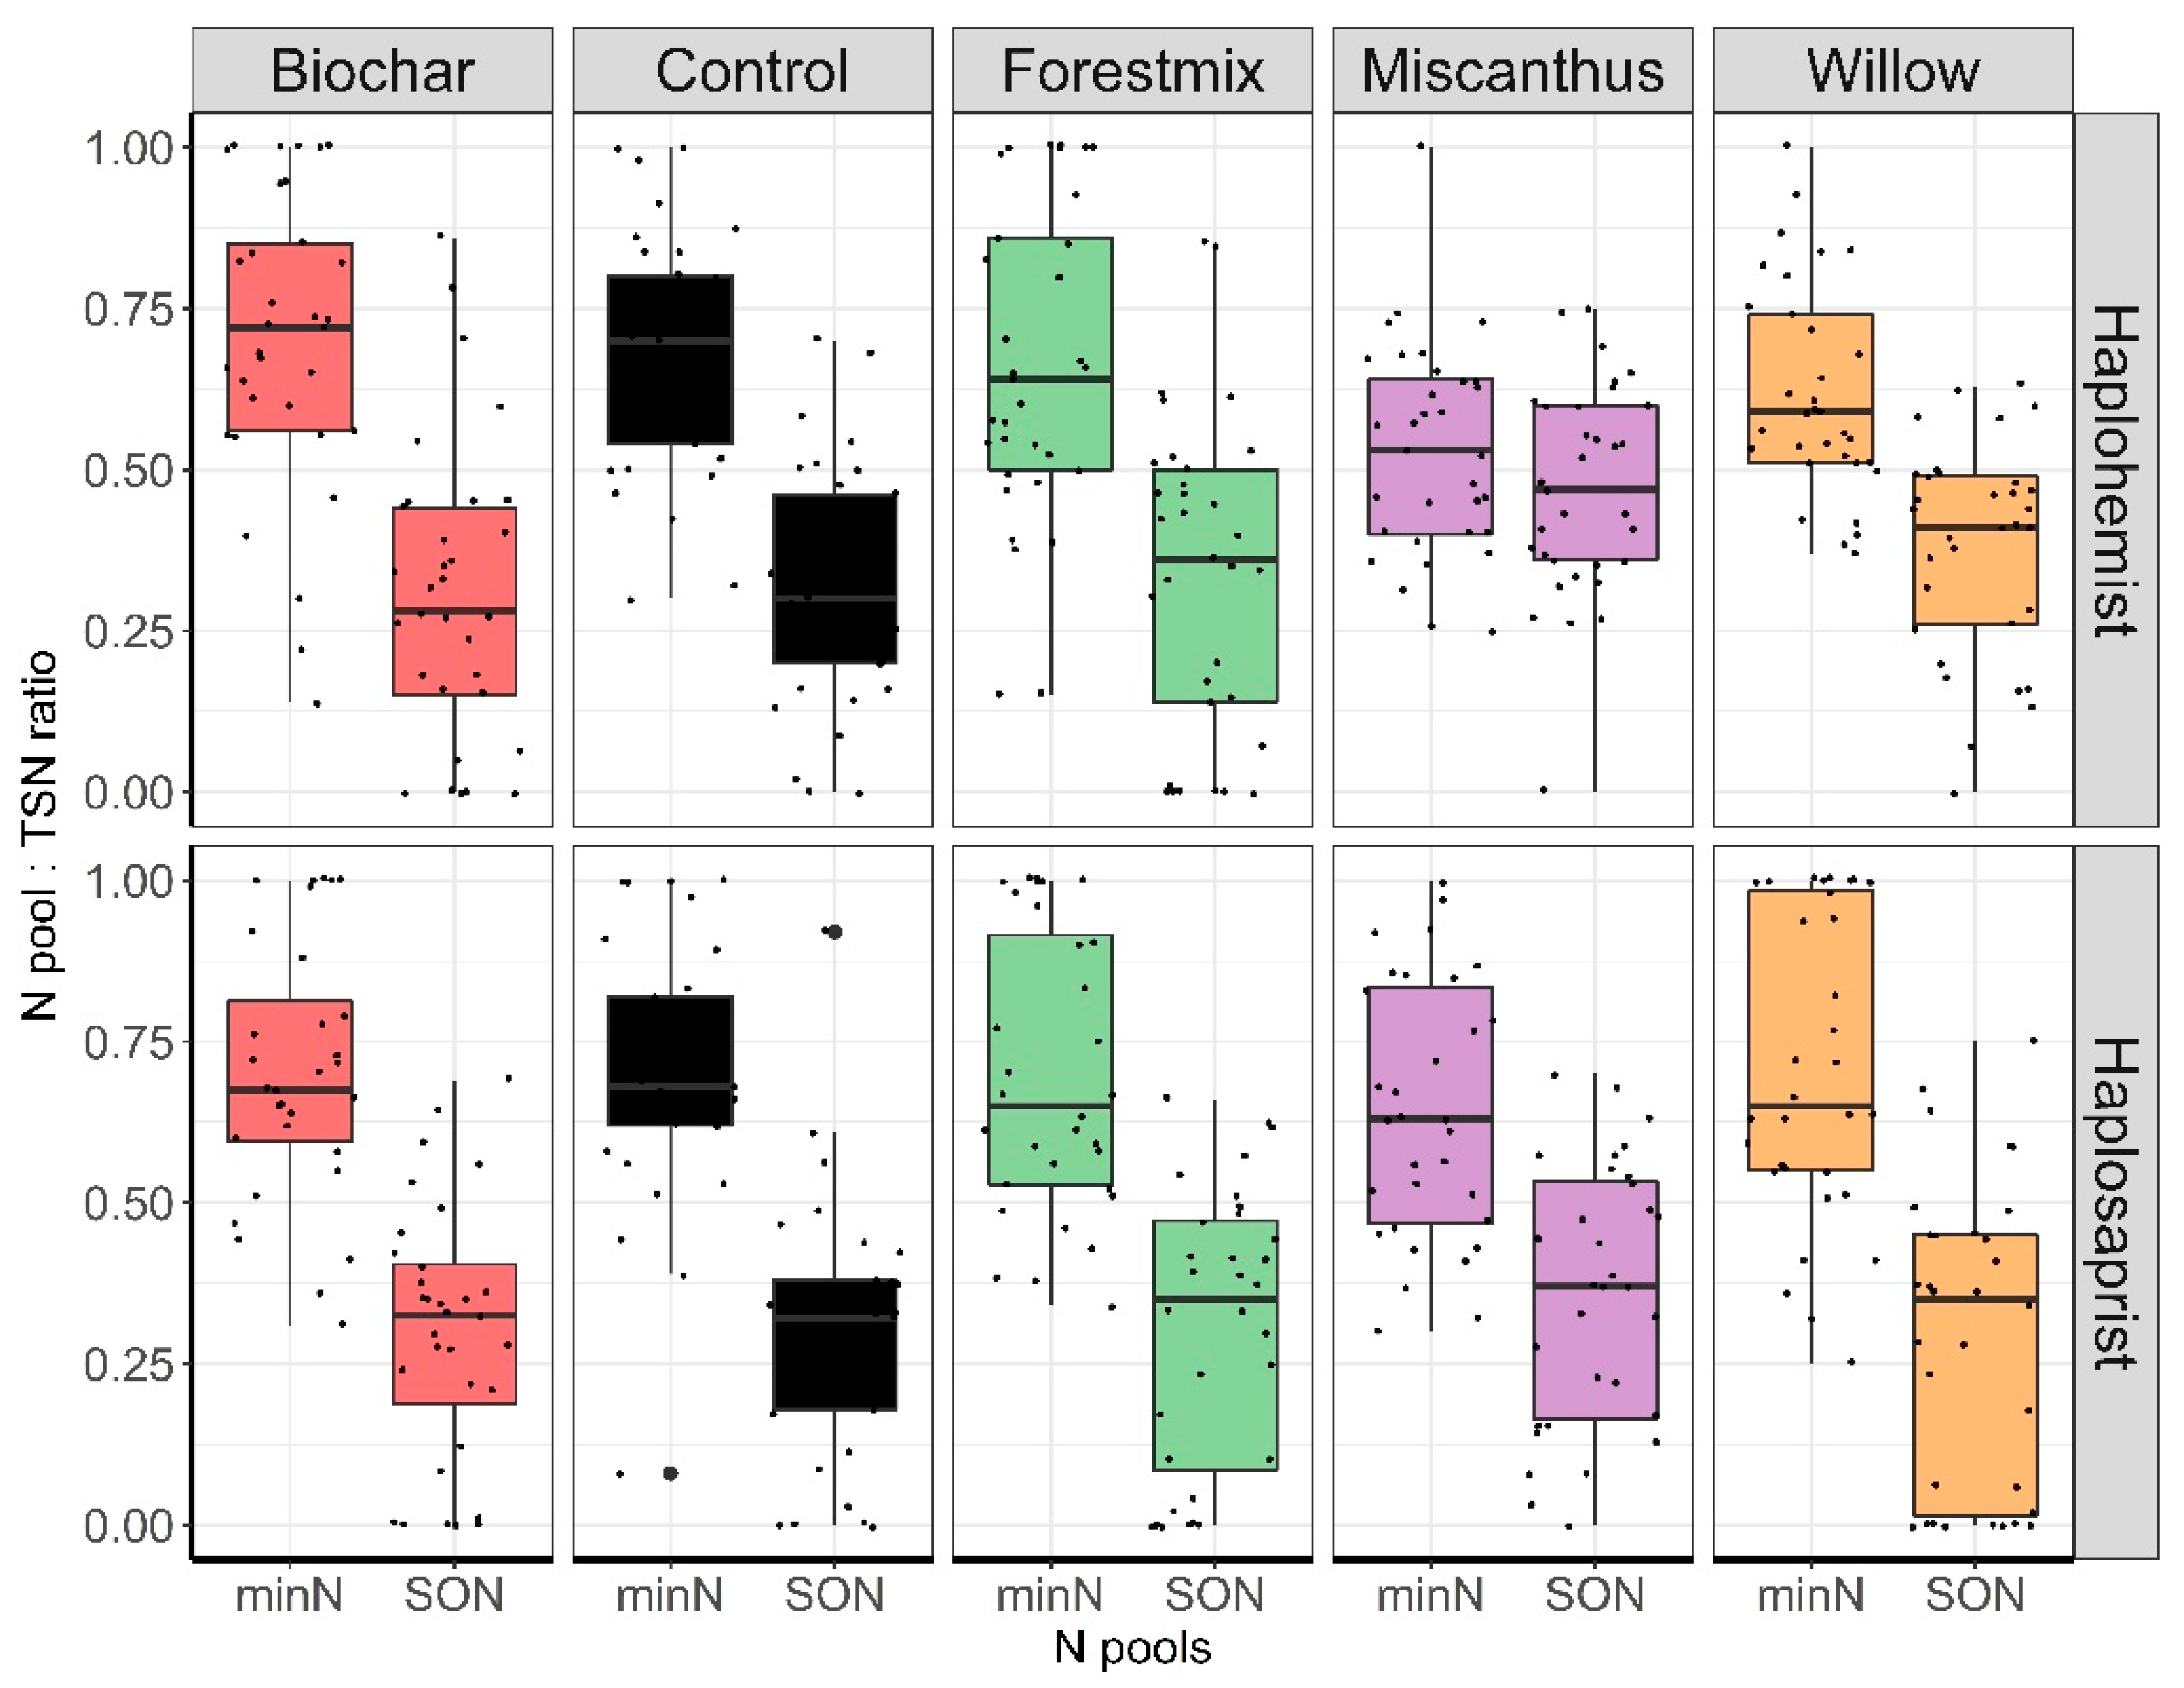
Figure 7.
Temporal evolution of the MinN:TSN and SON:TSN ratios as a function of soil type and amendment. Note that SON is calculated as the difference between TSN and MinN, which explains the inverse relationship observed between the two N pools.
Figure 7.
Temporal evolution of the MinN:TSN and SON:TSN ratios as a function of soil type and amendment. Note that SON is calculated as the difference between TSN and MinN, which explains the inverse relationship observed between the two N pools.

Table 1.
Initial soil properties (dry weight basis).
| Haplosaprist | Haplohemist | |
|---|---|---|
| Bulk density [g cm3] | 0.68 | 0.24 |
| pH | 7.1 | 6.5 |
| Ctotal [g kg−1] | 2.4 | 3.9 |
| Ntotal [g kg−1] | 0.16 | 0.17 |
| C:N ratio | 15 | 24 |
| Ptotal [g kg−1] | 2.25 | 5.49 |
| Altotal [mg kg−1] | 6.60 | 1.64 |
| Fetotal [mg kg−1] | 11.29 | 2.23 |
| EC (µS cm−1) | 1140 | 432 |
Table 2.
Amendment properties (dry weight basis).
| Miscanthus | Willow | Forest Mix | Biochar † | |
|---|---|---|---|---|
| C [%] | 45.3 | 46.4 | 47.5 | 72 |
| N [%] | 0.20 | 0.34 | 0.31 | 0.68 |
| C:N ratio | 226 | 136 | 153 | 106 |
| Hemicellulose [%] | 29.8 | 10.9 | 15.1 | NA |
| Cellulose [%] | 23.0 | 32.3 | 30.9 | NA |
| Lignin [%] | 34.8 | 35.5 | 38.7 | NA |
| Lignin:N ratio | 174 | 104 | 125 | NA |
N/A = Not applicable. † For biochar pH value was 8, particle size was >2 mm: 6%, 0.5 to 2 mm: 54% and <1 mm: 40% and electrical conductivity was 850 µS cm−1.
Table 3.
Zero + first-order kinetic model parameters as affected by soil type and amendment for TSN and minN. Data are presented only for the two measured parameters (TSN and minN).
Table 3.
Zero + first-order kinetic model parameters as affected by soil type and amendment for TSN and minN. Data are presented only for the two measured parameters (TSN and minN).
| Type | Amendment | M1 † [mg kg−1] ± SE | % Diff | k1‡ [mg (kg day)−1] | % Diff | k2 †† [mg (kg day)−1] | % Diff | |
|---|---|---|---|---|---|---|---|---|
| TSN | Haplosaprist | Biochar | 208.9 ± 22.5 b | −37% *** | 0.072 ± 0.005 ab | 8% | 1.03 ± 0.06 a | −3% |
| Control | 330.1 ± 18.4 a | 0% | 0.067 ± 0.005 ab | 0% | 1.07 ± 0.06 a | 0% | ||
| Forest Mix | 170.8 ± 22.5 b | −48% *** | 0.078 ± 0.006 a | 16% | 0.53 ± 0.08 b | −50% *** | ||
| Miscanthus | 77.9 ± 18.4 bc | −76% *** | 0.058 ± 0.005 b | −13% | 0.48 ± 0.06 b | −55% *** | ||
| Willow | 100.7 bc | −70% *** | 0.057 ± 0.005 ab | −15% | 0.53 ± 0.06 b | −51% *** | ||
| Haplohemist | Biochar | 300.8 ± 18.4 ab | −19% | 0.030 ± 0.005 b | −1% | 0.51 ± 0.06 a | 8% | |
| Control | 370.0 ± 18.4 a | 0% | 0.031 ± 0.005 b | 0% | 0.47 ± 0.08 a | 0% | ||
| Forest Mix | 217.5 ± 18.4 b | −41% *** | 0.047 ± 0.005 b | 54% | 0.45 ± 0.06 a | −5% | ||
| Miscanthus | 72.6 ± 18.4 c | −80% *** | 0.083 ± 0.006 a | 172% *** | 0.40 ± 0.06 a | −14% | ||
| Willow | 65.2 ± 18.4 c | −82% *** | 0.054 ± 0.005 a | 78% ** | 0.38 ± 0.06 a | −19% | ||
| minN | Haplosaprist | Biochar | 171.6 ± 14.0 a | −16% | 0.033 ± 0.005 b | −58% *** | 0.48 ± 0.04 b | −39% *** |
| Control | 205.0 ± 14.0 a | 0% | 0.080 ± 0.007 a | 0% | 0.79 ± 0.04 a | 0% | ||
| Forest Mix | 100.4 ± 17.1 b | −51% *** | 0.038 ± 0.007 b | −52% *** | 0.28 ± 0.05 bc | −64% *** | ||
| Miscanthus | 44.0 ± 14.0 b | −79% *** | 0.028 ± 0.005 b | −65% *** | 0.25 ± 0.04 c | −68% *** | ||
| Willow | 82.3 ± 17.1 b | −60% *** | 0.016 ± 0.005 b | −80% *** | 0.16 ± 0.05 c | −79% *** | ||
| Haplohemist | Biochar | 198.1 ± 14.0 a | 3% | 0.023 ± 0.005 b | −25% | 0.36 ± 0.05 ab | −35% | |
| Control | 192.8 ± 14.0 a | 0% | 0.031 ± 0.005 b | 0% | 0.55 ± 0.04 a | 0% | ||
| Forest Mix | 135.3 ± 14.0 a | −30% | 0.033 ± 0.005 b | 7% | 0.20 ± 0.04 b | −64% *** | ||
| Miscanthus | 35.9 ± 14.0 b | −81% *** | 0.073 ± 0.007 a | 134% *** | 0.21 ± 0.04 b | −61% *** | ||
| Willow | 41.4 ± 14.0 b | −79% *** | 0.034 ± 0.007 b | 9% | 0.21 ± 0.04 b | −62% *** |
SE is the standard error after ANOVA; significance of the difference between the amendments and the control is shown using stars (*** p < 0.001, ** 0.001 < p < 0.01). The color variation inside the % diff cell is always relative to the control of each group. Different letters for cumulative measured N pools indicates significant different at p < 0.05 using Tukey’s Honest Significant Difference. † M1 is a depleting first-order pool (labile N pool), ‡ k1 is the release rate constant of M1, †† k2 is the rate constant of a non-depleting zero-order pool (stable N pool in which N is released at a constant rate).
Table 4.
Cumulative (after 26 weeks of incubation) measured TSN, minN and calculated SON in mg kg−1 with the standard deviation to the mean calculated with three replicates.
Table 4.
Cumulative (after 26 weeks of incubation) measured TSN, minN and calculated SON in mg kg−1 with the standard deviation to the mean calculated with three replicates.
| Variable | Soil Type | Amendment | Cumulative T26 [mg kg−1] | % Diff |
|---|---|---|---|---|
| TSN | Haplosaprist | Biochar | 447.4 ± 94.7 a | −13% |
| Control | 513.3 ± 51.9 ab | 0% | ||
| Forest Mix | 264.2 ± 51.9 bc | −41% ** | ||
| Miscanthus | 158.1 ± 24 c | −65% ** | ||
| Willow | 178 ± 3.2 c | −60% ** | ||
| Haplohemist | Biochar | 392.7 ± 41.1 b | −18% * | |
| Control | 477 ± 9.8 a | 0% | ||
| Forest Mix | 299.9 ± 53.2 c | −37% *** | ||
| Miscanthus | 147.6 ± 12.9 d | −69% *** | ||
| Willow | 133.9 ± 6.4 d | −72% *** | ||
| minN | Haplosaprist | Biochar | 259 ± 31.7 ab | −25% |
| Control | 344.4 ± 64.5 a | 0% | ||
| Forest Mix | 152.5 ± 36.6 bc | −56% ** | ||
| Miscanthus | 91.3 ± 26.5 c | −73% ** | ||
| Willow | 110.3 ± 4.8 c | −68% ** | ||
| Haplohemist | Biochar | 238.6 ± 3.4 b | −17% *** | |
| Control | 288.3 ± 6.2 a | 0% | ||
| Forest Mix | 170.3 ± 17.1 c | −41% *** | ||
| Miscanthus | 75.1 ± 12.4 d | −74% *** | ||
| Willow | 78.9 ± 6.1 d | −73% *** | ||
| SON | Haplosaprist | Biochar | 193.6 ± 14.3 a | 13% |
| Control | 171.2 ± 66.2 a | 0% | ||
| Forest Mix | 116.7 ± 0.9 a | −32% | ||
| Miscanthus | 67.9 ± 0.8 a | −60% | ||
| Willow | 71.1 ± 6.1 a | −58% | ||
| Haplohemist | Biochar | 192.7 ± 41.3 a | 21% | |
| Control | 158.8 ± 15.1 a | 0% | ||
| Forest Mix | 132.0 ± 40.9 ab | −17% | ||
| Miscanthus | 72.7 ± 8.6 bc | −54% ** | ||
| Willow | 55.0 ± 4.6 c | −65% *** |
The % diff is in comparison with the control (negative number is a decrease compared to the mean), and Sign is the significance of the difference between the amendments and the control (*** p < 0.001, ** 0.001 < p < 0.01, * 0.01 < p < 0.05). Different letters for cumulative measured N pools indicates significant different at p < 0.05 using Tukey’s Honest Significant Difference.
Publisher’s Note: MDPI stays neutral with regard to jurisdictional claims in published maps and institutional affiliations. |
© 2022 by the authors. Licensee MDPI, Basel, Switzerland. This article is an open access article distributed under the terms and conditions of the Creative Commons Attribution (CC BY) license (https://creativecommons.org/licenses/by/4.0/).
Share and Cite
MDPI and ACS Style
Marmier, V.; Dessureault-Rompré, J.; Frossard, E.; Caron, J. Impact of Plant-Based Amendments on Water-Soluble Nitrogen Release Dynamics in Cultivated Peatlands. Nitrogen 2022, 3, 426-443. https://doi.org/10.3390/nitrogen3030028
AMA Style
Marmier V, Dessureault-Rompré J, Frossard E, Caron J. Impact of Plant-Based Amendments on Water-Soluble Nitrogen Release Dynamics in Cultivated Peatlands. Nitrogen. 2022; 3(3):426-443. https://doi.org/10.3390/nitrogen3030028
Chicago/Turabian StyleMarmier, Vincent, Jacynthe Dessureault-Rompré, Emmanuel Frossard, and Jean Caron. 2022. "Impact of Plant-Based Amendments on Water-Soluble Nitrogen Release Dynamics in Cultivated Peatlands" Nitrogen 3, no. 3: 426-443. https://doi.org/10.3390/nitrogen3030028